© Edexcel Limited 2009 1 1 a Define the term ‘alternating path’ (2) Six health and safety inspectors, A, B, C, D, E and F must visit six places of work, 1, 2, 3, 4, 5, and 6. The table shows the possible allocations of inspectors to places of work. b Draw a bipartite graph to model this situation (1) Initially A is assigned to 4, B is assigned to 2, C is assigned to 3 and D is assigned to 6. c Draw a bipartite graph to illustrate this initial matching. (1) d Starting from this initial matching, find an alternating path, starting from E, to form an improved matching. List your improved matching. (3) e Starting from your improved matching apply the maximum matching algorithm once again to find a complete matching. (3) 2 Hettie, Leo, Ramin, Amro, Tom, Jing, Yonnie, Sue, Mark a Use a bubble sort to produce a list of names in alphabetical order. You must give the state of the list after each pass. (5) b Use the binary search algorithm to locate the name Ramin. (4) 3 8 14 5 11 10 3 6 12 The numbers in the list represent the lengths, in metres, of eight lengths of cable. The lengths are to be cut from rolls which each hold 20 m of cable. a Obtain a lower bound for the number of rolls needed to supply the eight lengths of cable. (2) b Use the first-fit bin packing algorithm to determine which lengths should be cut from each roll. (3) Inspector Places of work A 3 or 4 B 1, 2 or 5 C 2 or 3 D 1 or 6 E 4 F 6 Examination Style Paper

Welcome message from author
This document is posted to help you gain knowledge. Please leave a comment to let me know what you think about it! Share it to your friends and learn new things together.
Transcript

© Edexcel Limited 2009 1
1 a Define the term ‘alternating path’ (2)
Six health and safety inspectors, A, B, C, D, E and F must visit six places of work, 1, 2, 3, 4, 5, and 6. The table shows the possible allocations of inspectors to places of work.
b Draw a bipartite graph to model this situation (1)
Initially A is assigned to 4, B is assigned to 2, C is assigned to 3 and D is assigned to 6.
c Draw a bipartite graph to illustrate this initial matching. (1)
d Starting from this initial matching, find an alternating path, starting from E, to form an improved matching. List your improved matching. (3)
e Starting from your improved matching apply the maximum matching algorithm once again to find a complete matching. (3)
2 Hettie, Leo, Ramin, Amro, Tom, Jing, Yonnie, Sue, Mark
a Use a bubble sort to produce a list of names in alphabetical order. You must give the state of the list after each pass. (5)
b Use the binary search algorithm to locate the name Ramin. (4)
3 8 14 5 11 10 3 6 12
The numbers in the list represent the lengths, in metres, of eight lengths of cable.The lengths are to be cut from rolls which each hold 20 m of cable.
a Obtain a lower bound for the number of rolls needed to supply the eight lengthsof cable. (2)
b Use the first-fit bin packing algorithm to determine which lengths should be cut from each roll. (3)
Inspector Places of workA 3 or 4B 1, 2 or 5C 2 or 3D 1 or 6E 4F 6
Examination Style Paper

© Edexcel Limited 2009 2
c Use the first-fit decreasing bin packing algorithm to determine which lengths should be cut from each roll. (3)
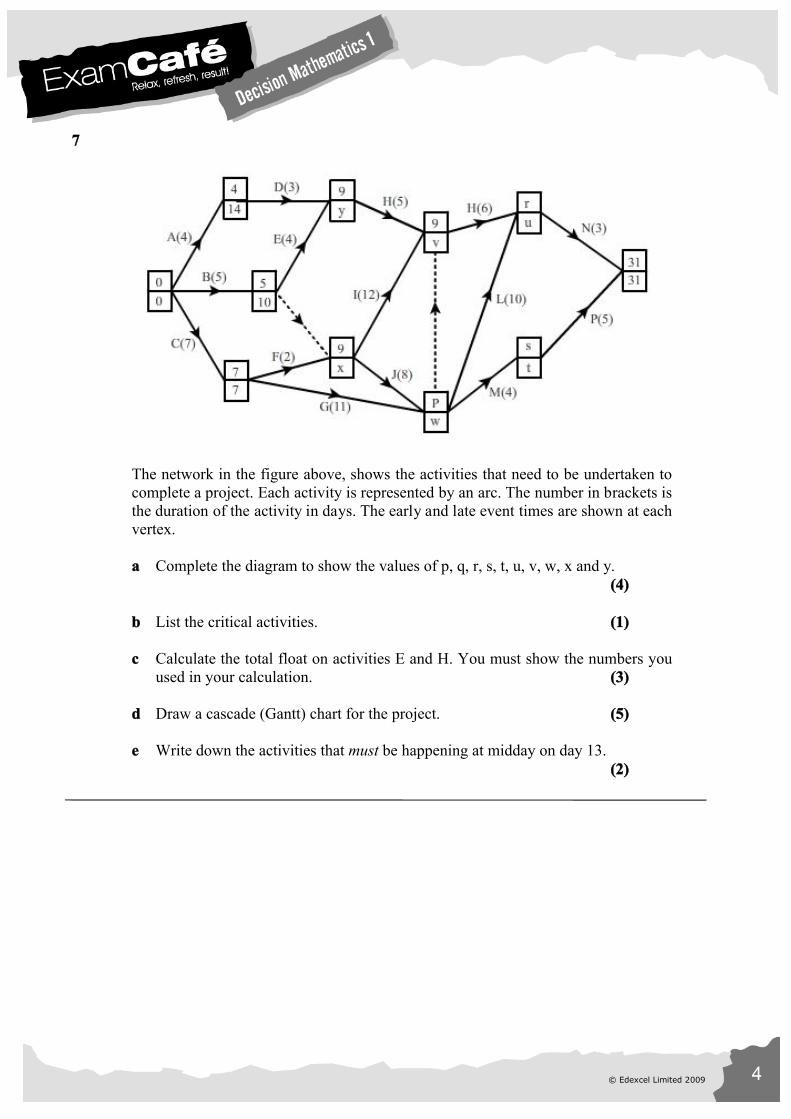
4
A B C D E F
A – 54 22 40 36 36
B 54 – 30 26 16 22
C 22 30 – 20 14 14
D 40 26 20 – 18 24
E 36 16 14 18 – 6
F 36 22 14 24 6 –
The table shows the costs, in pounds, of travelling between six towns, A, B, C, D, E and F.
a Use Prim’s algorithm, starting at A, to find a minimum spanning tree for this table of costs. You must list the arcs that form your tree in the order that they are selected. (3)
b Draw your tree and state its weight. (2)
5
Figure 1 above, shows a network of roads. The number on each arc represents the length of that road in km.
a Use Dijkstra’s algorithm to find the shortest path from A to G. Complete the boxes on your answer sheet to show your working. State your shortest path and its length. (6)

© Edexcel Limited 2009 3
b Explain how you determined the shortest route from your labelled diagram.(2)
c Find a shortest route from A to G that avoids E, and state its length. (3)
6
[The total weight of the network is 157]
The figure above shows a network of pipes. The number on each arc represents the length of that pipe in metres.
The network must be inspected for leaks.
The inspection route must start and finish at A and the length of the route must beminimised.
Each pipe must be traversed at least once.
a Use an appropriate algorithm to find the length of the shortest inspection route.You should make your method and working clear. (5)
The inspector lives close to B and decides to start the inspection from there. He may finish at any vertex.
b State the vertex at which his route should finish in order to minimise the length of his route. Justify your answer. (3)
© Edexcel Limited 2009 4
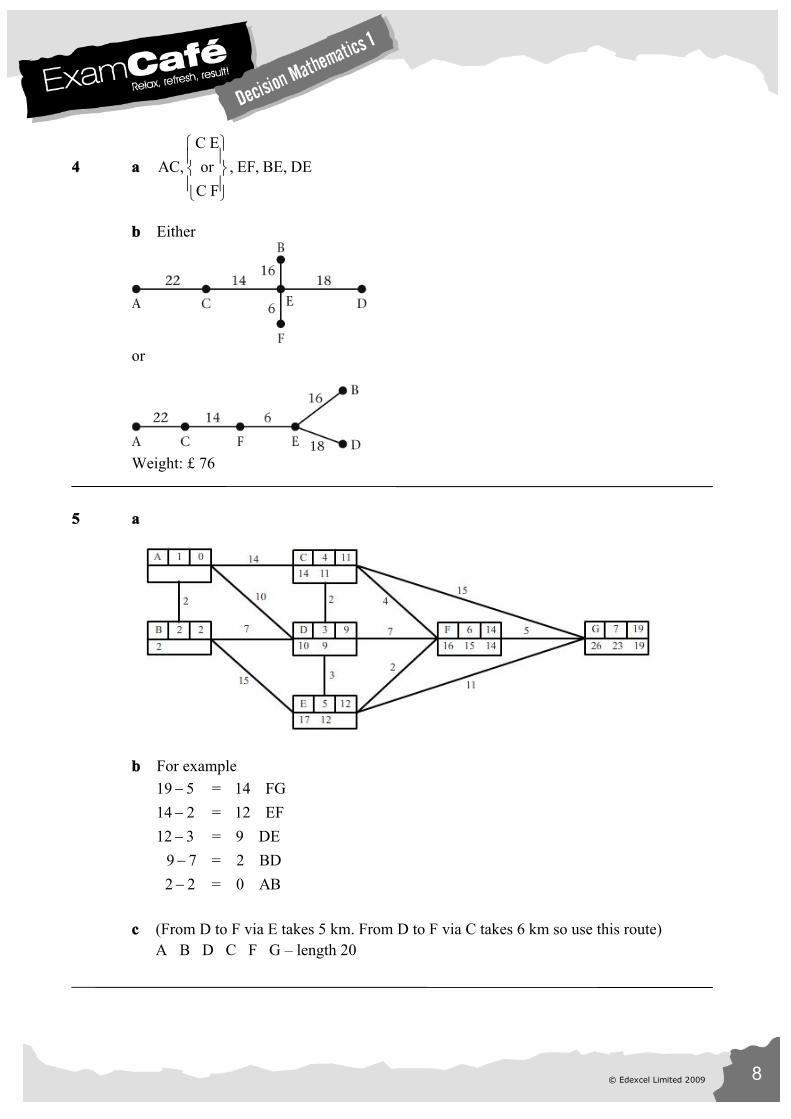
7
The network in the figure above, shows the activities that need to be undertaken to complete a project. Each activity is represented by an arc. The number in brackets is the duration of the activity in days. The early and late event times are shown at each vertex.
a Complete the diagram to show the values of p, q, r, s, t, u, v, w, x and y.(4)
b List the critical activities. (1)
c Calculate the total float on activities E and H. You must show the numbers you used in your calculation. (3)
d Draw a cascade (Gantt) chart for the project. (5)
e Write down the activities that must be happening at midday on day 13.(2)

© Edexcel Limited 2009 5
8 The figure below shows the constraints in a linear programming problem.
a Add two lines and shading to the copy of the figure to represent these inequalities. (3)
b Hence determine and label the feasible region, R. (1)
For this linear programming problem the objective function is maximise F = 3y x .
c Add an objective line to your graph and use it to determine the optimal number of variables x and y. (4)
d State the optimal value of the objective. (1)

© Edexcel Limited 2009 6
1 a An alternating path starts and finishes at unmatched nodes and selects arcs that are alternately “not in” and “ in” the initial matching
b
c
d E 4 = A 3 = C 2 = B 1 break through change statusE = 4 – A = 3 – C = 2 – B = 1Improved matching: A = 3 C = 2 E = 4
B = 1 D = 6 F unmatched
e F 6 = D 1 = B 5 Change statusF = 6 D = 1 B = 5 Complete matching A = 3 C = 2 E = 4
B = 5 D = 1 F = 6
Worked Solutions

© Edexcel Limited 2009 7
2 a For example (Bubbling left to right)
H L R A T J Y S MH L A R J T S M YH A L J R S M T YA H L J R M S T YA H J L M R S T Y
Sorted – no more exchanges
b
4th pivot 6 Ramin: name found
3 a 69
Lower bound = = 3.4520
so 4 bins needed
b Bin 1: 8, 5, 3 Bin 3: 11 Bin 5: 12 Bin 2: 14, 6 Bin 4: 10
c Reordering list: 14, 12, 11, 10, 8, 6, 5, 3Bin 1: 14, 6 Bin 3: 11, 5, 3Bin 2: 12, 8 Bin 4: 10
© Edexcel Limited 2009 8
4 a
C E
AC, or , EF, BE, DE
C F
b Either
or
Weight: £ 76
5 a
b For example
19 5 = 14 FG
14 2 = 12 EF
12 3 = 9 DE
9 7 = 2 BD
2 2 = 0 AB
c (From D to F via E takes 5 km. From D to F via C takes 6 km so use this route)A B D C F G – length 20

© Edexcel Limited 2009 9
6 a
BC GH = 14 13 = 27
BG CH = 14 12 = 26
BH CG = 10 21 = 31
Repeat BG and CHRoute length: 157 26 = 183 m
b We are seeking a semi-Eulerian route. We need to repeat just one path between two odd vertices, not including the start of B.
The options are GH – 13 CH – 12
CG – 21
We chose to repeat CH so our finishing vertex is G.
© Edexcel Limited 2009 10
7
a p = 18 r = 28 t = 26 v = 22 x = 10
q = 21 s = 22 u = 28 w = 18 y = 17
b Critical activities: C, G, L, N
c Total float on E = 17 5 4 = 8 Total float on H = 22 9 5 = 8
d
e On day 1
213 activities G, I and J must be happening

© Edexcel Limited 2009 11
8 a

© Edexcel Limited 2009 12
b

© Edexcel Limited 2009 13
c
Optimal value of intersection of 8 3 = 360y x and 4 = 140y xOptimal point (80, 15)
d F = 3(15) (80) = 125
Related Documents