Smarter Travel Areas Ex-Post Evaluation of Executive Summary | 2018

Welcome message from author
This document is posted to help you gain knowledge. Please leave a comment to let me know what you think about it! Share it to your friends and learn new things together.
Transcript

1
E x - P o s t E v a l u a t i o n o f s m a r t E r t r a v E l a r E a s
Smarter Travel Areas
Ex-Post Evaluation of
Executive Summary | 2018

1
E x - P o s t E v a l u a t i o n o f s m a r t E r t r a v E l a r E a s / E x E C u t i v E s u m m a r Y
Quality Information Prepared for Prepared by
Prepared by:
Elaine Brick
Regional Director
Catherine Swift
Consultant
Checked by:
Richard Redfern
Regional Director
Approved by:
Derval Cummins
Director
Department for Transport Tourism
and Sport (DTTAS)
© 2016 AECOM Professional Services Ireland. All Rights Reserved. This document has been prepared by AECOM Professional Services Ireland (“AECOM”) for sole use of our client (the “Client”) in accord-ance with generally accepted consultancy principles, the budget for fees and the terms of reference agreed between AECOM and the Cli-ent. Any information provided by third parties and referred to herein has not been checked or verified by AECOM, unless otherwise expressly stated in the document. No third party may rely upon this document without the prior and express written agreement of AECOM.
AECOM Professional Services
Ireland
4th Floor
Adelphi Plaza
Georges Street Upper
Co. Dublin
Ireland
T: +353 1 238 3100
aecom.com
Smarter Travel Areas
Ex-Post Evaluation of
Executive Summary | 2018

2
E x - P o s t E v a l u a t i o n o f s m a r t E r t r a v E l a r E a s / E x E C u t i v E s u m m a r Y
Table of Contents
ExEcutivE Summary 3
1. introduction1.1 Overview of the STA programme 26
2. Evaluation approach2.1 Overview 282.2 Key Evaluation Questions 282.3 Evaluation Approach 292.4 Data Collection/Collation 30 3. programmE lEvEl outcomES 2012 – 20163.1 Overview 323.2 All Trips 323.3 Employment Trips 35 3.4 Education Trips 36 3.5 Non-Commuting Trips 383.6 Summary 39
4. dungarvanSummary of Smarter Travel Delivery and Impacts in Dungarvan 414.1 Overview 434.2 Programme Inputs 444.3 Programme Outputs 464.4 Programme Outcomes 544.5 Conclusion: Impact of Smarter Travel in Dungarvan 83
5. limErickSummary of Smarter Travel Delivery in Limerick 855.1 Overview 885.2 Programme Inputs 905.3 Programme Outputs 915.4 Programme Outcomes 975.5 Conclusions: Impact of Smarter Travel in Limerick 128
6. WEStport Summary of Smarter Travel Delivery in Westport 1316.1 Overview 1336.2 Programme Inputs 1346.3 Programme Outputs 1356.4 Programme Outcomes 1416.5 Conclusion: Impact of Smarter Travel in Westport 164
7. programmE impactS 7.1 Introduction 1677.2 Programme Outcome Overview 1677.3 Benchmarking 1697.4 Quality of Life 1717.5 Health & Physical Activity 1737.6 Safety 1767.7 Environment 1777.8 Economy 1787.9 Economic Appraisal 1797.10 Summary 180
8. lESSonS for thE futurE 182
9 concluding Summary 189

3
E x - P o s t E v a l u a t i o n o f s m a r t E r t r a v E l a r E a s
ExecutiveSummary

4
E x - P O S T E v A L U A T I O N O F S M A R T E R T R A v E L A R E A S / E x E C U T I v E S U M M A R Y
€26.47minvested in Smarter Travel Areas 2012-2016
invested in behavioural change measures
invested ininfrastructure
17km of new/upgraded Greenway routes
55 Junction upgrades and crossing facilities -12.1pp
47%
54%1.5%/+0.3pp
5%/+1.5pp1.3
All Smart Travel Areas / All Trips
Change in Mode Share
6 Public realm enhancement projects
Walking Mode Share
CyclingMode Share
Cycling mode share 2016 by gender/change 2012–2016
Car Mode Share
45 participating Smarter Travel Schools
13 Limerick Smarter Travel Workplace and Campus Partners
100+ Challenges, events and campaigns as well as local and social media coverage
14km of other cycle facilities
Car mode share decreased from 71% in 2012 to 67% in 2016 – despite an increase in employment in all STAs and a change of -0.8% in the control area
Decrease in car mode share within Socio Economic Group E
of survey respondents who cycle say they are cycling more in 2016 than the previous year
Walking mode share increased from 20% in 2012 to 25% in 2016 compared to an increase of 0.2pp in the control area
Cycling mode share increased from 2% in 2012 to 3% in 2016 compared to an increase of just 0.1% in the control area
of the total quantified project benefits are health related
Benefit / cost ratio of 1.3
2012
2012
2012
Male Female
2016
2016
2016
85% 15%
71% 67%
20% 25%
2% 3%
€4.01m
€22.46m
5
E x - P O S T E v A L U A T I O N O F S M A R T E R T R A v E L A R E A S / E x E C U T I v E S U M M A R Y
Introduction
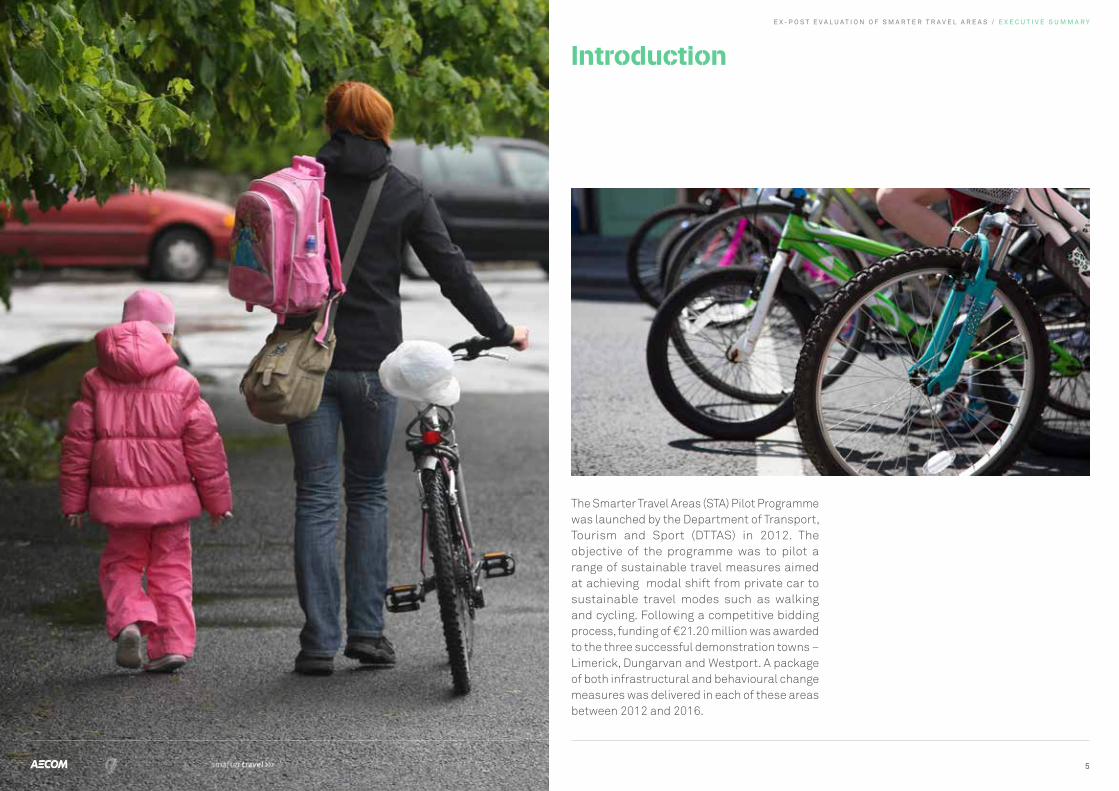
The Smarter Travel Areas (STA) Pilot Programme was launched by the Department of Transport, Tourism and Sport (DTTAS) in 2012. The objective of the programme was to pilot a range of sustainable travel measures aimed at achieving modal shift from private car to sustainable travel modes such as walking and cycling. Following a competitive bidding process, funding of €21.20 million was awarded to the three successful demonstration towns – Limerick, Dungarvan and Westport. A package of both infrastructural and behavioural change measures was delivered in each of these areas between 2012 and 2016.

6
E x - P O S T E v A L U A T I O N O F S M A R T E R T R A v E L A R E A S / E x E C U T I v E S U M M A R Y
Purpose of the Evaluation
Given the demonstration town status of each of the three STAs, monitoring and evaluation was a fundamental component of the pilot to ensure a clear understanding of how investment impacted on travel behaviour. As such, a robust evaluation programme was developed by DTTAS and has been implemented across the five year delivery programme. The evaluation was led by AECOM, with support from each of the STAs, and was the largest of its kind undertaken in Ireland involving comprehensive data collection, monitoring and analysis.
Programme evaluation was ongoing over the lifetime of the STA programme, with monitoring reports prepared every six months, and an Interim Report prepared at the half-way point of the programme in 2015. This Final Report provides a comprehensive review of programme delivery and investment impacts over the entire lifetime of the project, from 2012 until the end of 2016.

7
E x - P o s t E v a l u a t i o n o f s m a r t E r t r a v E l a r E a s / E x E C u t i v E s u m m a r Y
Evaluation Methodology
A bespoke evaluation approach was established which combined the development of a Theory of Change for the programme by each STA, alongside the selection of a suitable control and supporting datasets. The development of a Theory of Change supported the systematic testing of the assumed connections (i.e. the theory) between an STA intervention and its anticipated impacts. The focus of the approach was therefore not only on understanding whether an intervention had worked but also on why and under what conditions change had been observed.
The most important quantitative data source used in the evaluation was a Household Travel Survey (HTS). The HTS was first conducted in October 2012 in advance of the STA programme investment taking place. A follow-up survey was conducted in October 2014 and a final survey was undertaken in October 2016. The HTS was conducted among a random, representative sample of people within each of the STAs (with an overall sample size of over 5,500 respondents). It was comprised of three sections: a 24 hour travel diary which collected information about journey purposes, travel modes, time of travel and distance travelled; an attitudes and awareness survey which collected information about the attitudes of respondents towards local travel and sustainable transport; and a socio-demographic survey.
AECOM used comparative datasets to further understand the STA programme outcomes and impacts. First, the findings of the HTS were compared against a national level comparator dataset (the National Travel Survey), to provide context to the observed outcomes. This provided an indication of what might have happened within the STAs if the programme of investment hadn’t been made i.e. the counterfactual scenario. Secondly, a telephone administered survey was undertaken with an independent sample of residents across Ireland, for comparison with the attitudinal element of the HTS. Thirdly, comparison areas adjacent to the three STAs have been used to assess changes in business and economic indicators, particularly footfall and business closures.
Additional quantitative data examined as part of the evaluation included:
• Vehicle, pedestrian and cyclist movement counts on key routes;
• Car and cycle parking occupancy rates;
• Road safety statistics; and
• Economic activity data including footfall counts, business occupancy rates, town centre intercept surveys and business sentiment surveys.

8
E x - P o s t E v a l u a t i o n o f s m a r t E r t r a v E l a r E a s / E x E C u t i v E s u m m a r Y
A qualitative research programme was also developed with the aim further analysing the reasons for modal shift, barriers to modal shift, additional measures that might be required to encourage modal shift and the issues and opportunities experienced in implementing sustainable travel measures. The programme included:
• Focus groups to understand the behaviours and perceptions of key target groups – commuters, parents of school children, students, and ‘challenge’ participants, as well as people involved in local businesses;
• In-depth interviews with the STA delivery teams and key target organisations – schools, businesses and the University of Limerick;
• Route intercept surveys of users of the greenways to enhance understanding of how these facilities are used and perceived;
• Attendance at a number of Smarter Travel events to understand the profile of attendees and the impact of events in influencing travel behaviour through informal observation/conversation and intercept surveys;
• Independent audits of cycling infrastructure were undertaken in all STAs, with consideration of the National Transport Authority’s Cycle Manual;
• Community cycling audits, whereby members of the public were escorted by bike around STA cycle networks to further understand perceived safety issues, with accompanying travel pattern and attitude surveys;
• Bespoke on-line surveys to provide insight into the views of specific target groups; and
• Media monitoring to gauge how Smarter Travel is being portrayed in the media and how it may influence community views of the programme as well as modal shift.

9
E x - P O S T E v A L U A T I O N O F S M A R T E R T R A v E L A R E A S / E x E C U T I v E S U M M A R Y
Programme Delivery 2012—2016
DTTAS allocated €21.20m across three participating STAs and an additional €5.27m was invested in the programme by a range of stakeholders, resulting in a total programme investment of €26.47m. Approximately 85% was invested in infrastructure improvements and the remaining 15% in behavioural change measures, including staff and operational costs.
Among all three STAs, infrastructure spend was focused heavily on the provision of off-road cycle facilities, greenways in particular. Overall, approximately 17km of greenways and
14km of other cycling facilities (incl. shared footpaths, cycle tracks and on-road cycle lanes) were delivered, as well as a range of traffic calming projects, junction improvements and bike parking. The behavioural change measures implemented were focused on trip-end locations, such as workplaces, schools and campuses. The extent of behavioural change measures delivered varied between the STAs.
A summary of the programmes delivered in each area is presented in the following sections.

10
E x - P o s t E v a l u a t i o n o f s m a r t E r t r a v E l a r E a s / E x E C u t i v E s u m m a r Y
delivering improved pedestrian access to adjacent streets, reducing street clutter and creating additional public space.
Another high profile project in Dungarvan was the redevelopment of the ‘The Track’ (an old route along a disused railway line) to form a 4km high quality greenway. The greenway links the edge of the town centre with residential areas to the east of Dungarvan and also formed the first section of the Waterford Greenway.
The majority (75%) of the Dungarvan behavioural change budget was expended on staff and other operational costs. School travel planning was the main focus of the behavioural change programme with all primary and secondary schools in the town involved.
Dungarvan
‘Go Dungarvan’ received €7.20m of DTTAS Smarter Travel funding. Over three quarters of this (€5.81m) was invested in infrastructure, with the remainder (€1.39m) on behavioural change measures. In addition, €3.20m was invested by Waterford County Council and other stakeholders bringing the total spend to €10.40m.
A significant amount of new infrastructure was delivered in Dungarvan, including new cycling and pedestrian facilities (4.8km of greenways and 9km of other on/off road facilities), traffic calming, public realm improvements and new ‘trip end’ facilities.
The largest project, in financial terms, was the redevelopment of Grattan Square within Dungarvan town centre. The Square was redesigned to follow a shared space concept, improving the visual appearance of the space,

11
E x - P o s t E v a l u a t i o n o f s m a r t E r t r a v E l a r E a s / E x E C u t i v E s u m m a r Y
1
9
2
11
12
10
3
7
1413
4
8
5
6
PRIMARY SCHOOL
SECONDARY SCHOOL
TRAvEL CENTRE
PRE-ExISTING INFRASTRUCTURE
STA PROGRAMME INFRASTRUCTURE
MONANG ROAD
COOLAGH ROAD
DUCKSPOOL
BALLINROAD LINK
GOLD COAST ROAD
TRACK
MURPHY PLACE TRAFFIC CALMING/HOME
zONE / PEDESTRIAN CROSSINGS
DAvITT’S QUAY BIKE PARKING, THE QUAYS TRAFFIC CALMING
YOUGHAL ROAD
FR TWOMEYS ROAD
N25 RING ROAD
CAPPOQUIN ROAD
GRATTAN SQ
EMMET ST JUNCTION IMPROvEMENTS
1
5
9
2
6
10
11
12
13
14
3
7
4
8
Go Dungarvan Infrastructure Measures and participating Smarter Travel Schools

12
E x - P o s t E v a l u a t i o n o f s m a r t E r t r a v E l a r E a s / E x E C u t i v E s u m m a r Y
Limerick
Limerick Smarter Travel received €9m of DTTAS Smarter Travel funding. In addition, €1.30m was invested by Limerick City and County Council and other stakeholders bringing the total spend to €10.30m.
Over three quarters of the funding was invested in infrastructure projects and the remaining on behavioural change measures and resource costs.
A significant amount of new infrastructure was delivered in Limerick, including over 9km of greenways, cycle lanes and tracks, as well as traffic calming, junction improvements and new crossings. Good quality bike parking was provided, particularly in the city centre and at the University of Limerick (UL). A large proportion of investment was concentrated on greenways linking the City Centre and UL, and on walking and cycling facilities in the Castletroy area.
The largest infrastructure project, in financial terms, was the delivery of ‘Route 2’; a high-profile 5.1km greenway along the southern banks of the River Shannon.
Limerick invested more, proportionately, on behavioural change measures than Dungarvan and Westport. A comprehensive programme of measures was delivered encompassing schools, workplaces, campuses and the wider community. The Schools Programme targeted 30 schools across the STA, while seven organisations with a combined ~8,000 employees signed up as Workplace Programme partners. The Campus Programme achieved buy-in from three third-level institutions and two further education campuses. Events were the most significant aspect of the Community Programme and the largest events each year were held during National Bike Week, which was branded locally as ‘BeSpoke – Limerick’s Cycling Festival’.

13
E x - P o s t E v a l u a t i o n o f s m a r t E r t r a v E l a r E a s / E x E C u t i v E s u m m a r Y
Limerick Smarter Travel Infrastructure Measures
a ROUTE 2 / SHANNON FIELDS (LINK 1 PHASE 1)
B ROUTE 2 / SHANNON FIELDS (LINK 1 PHASE 2)
c ROUTE 2 / GUINNESS BRIDGE TO UL BOAT CLUB
d UNIvERSITY OF LIMERICK SMARTER TRAvEL INFRASTRUCTURE
E ROUTE 4 CASTLETROY / NEWTOWN
f ROUTE 2 LEILA ST TO GUINNESS BRIDGE
g RHEBOGUE NEIGHBOURHOOD GREENWAY
h ROUTE 3 CITY CENTRE TO UNIvERSITY OF LIMERICK
i ROUTE 2 PARK BRIDGE
J ROUTE 4 L1171 OLD TIPPERARY ROAD PART 8
LST SCHOOLS
BIKE PARKING
UI BIKE PARKING
UL COMPLETED ROUTES
UL ExISITNG D ROUTES
PART 8 GRANTED
COMPLETED ROUTESa
Bc
d
E
J
f
g h
i
14
E x - P o s t E v a l u a t i o n o f s m a r t E r t r a v E l a r E a s / E x E C u t i v E s u m m a r Y
Westport
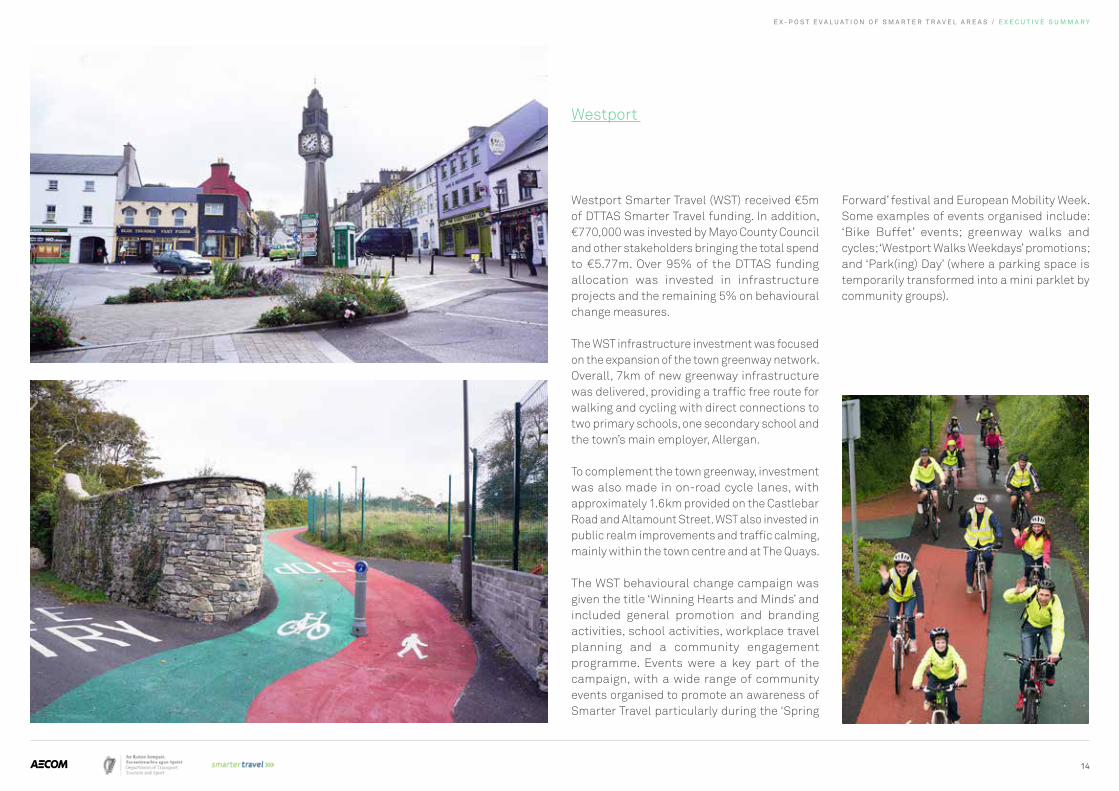
Westport Smarter Travel (WST) received €5m of DTTAS Smarter Travel funding. In addition, €770,000 was invested by Mayo County Council and other stakeholders bringing the total spend to €5.77m. Over 95% of the DTTAS funding allocation was invested in infrastructure projects and the remaining 5% on behavioural change measures.
The WST infrastructure investment was focused on the expansion of the town greenway network. Overall, 7km of new greenway infrastructure was delivered, providing a traffic free route for walking and cycling with direct connections to two primary schools, one secondary school and the town’s main employer, Allergan.
To complement the town greenway, investment was also made in on-road cycle lanes, with approximately 1.6km provided on the Castlebar Road and Altamount Street. WST also invested in public realm improvements and traffic calming, mainly within the town centre and at The Quays.
The WST behavioural change campaign was given the title ‘Winning Hearts and Minds’ and included general promotion and branding activities, school activities, workplace travel planning and a community engagement programme. Events were a key part of the campaign, with a wide range of community events organised to promote an awareness of Smarter Travel particularly during the ‘Spring
Forward’ festival and European Mobility Week. Some examples of events organised include: ‘Bike Buffet’ events; greenway walks and cycles; ‘Westport Walks Weekdays’ promotions; and ‘Park(ing) Day’ (where a parking space is temporarily transformed into a mini parklet by community groups).

15
E x - P o s t E v a l u a t i o n o f s m a r t E r t r a v E l a r E a s / E x E C u t i v E s u m m a r Y
6
11
The Quays
12
3
4
5
7
8
9
10
TownCentre
Westport Smarter Travel Infrastructure Measures
PRE-ExISTING INFRASTRUCTURE
STA INFRASTRUCTURE PROJECT
SMARTER TRAvEL PRIMARY SCHOOL
SMARTER TRAvEL SECONDARY SCHOOL
OLD SCOIL PHADRAIG
NEW SCHOOL PHADRAIG
1 WESTPORT HOUSE GREENWAY ExTENSION
2 NORTHERN GREENWAY
3 TOWN CENTRE BIKE PARKING, PUBLIC REALM IMPROvEMENTS & TRAFFIC CALMING
4 CASTLEBAR ST. CYCLE LANES
5 HORKAN’S GREENWAY
6 WESTPORT GREENWAY ExTENSION TO KNOCKRANNY
7 ALLYMOUNT ST. CYCLE TRACK
8 MILL STREET IMPROvED BUS FACILITIES
(SCHOOL DROP-OFFS)
9 WESTPORT TOWN GREENWAY
10 ExTENSION OF GDW GREENWAY TO IDA BUSINESS PARK
11 ALLERGEN ROAD CYCLE LANES

16
E x - P o s t E v a l u a t i o n o f s m a r t E r t r a v E l a r E a s / E x E C u t i v E s u m m a r Y
Key Evaluation Findings
Modal shift from 2012-2016 was higher in the Smarter Travel Areas than in the national control sample
A key objective of the STA programme was to achieve modal shift from private car travel to sustainable transport. The impact of STA investment in this regard was primarily monitored through the travel diary component of the HTS undertaken in each of the STAs. Results from the National Travel Survey (NTS) were used as a national control.
Results of the HTS for ‘all trips’ within the STA show that between 2012 and 2016:
• Car mode share in the STAs decreased by 4.0pp to 66.8%. By comparison, at a national level, the car mode share for ‘all trips’ taken from the 2016 National Travel Survey (excluding Dublin) reduced by 0.8pp over the same period.
• Walking mode share increased by 4.4pp to 24.8%. This increase is notably higher than the 0.2pp increase observed nationally.
• Cycling mode share increased by 0.8pp to 3.1%. The increase observed in the STAs was, again, higher than the 0.1pp increase observed nationally.
The HTS results were also assessed by trip type. With regards employment trips, results of the HTS showed that:
• Between 2012 and 2016, the private car mode share decreased by 4.3pp to 76.1%.
• Walking mode share increased by 2.9pp to 14.9%.
• Cycling mode share increased marginally by 0.8pp to 3.0%.
A direct comparison of mode share for commuting journeys only with the NTS is not possible as the journey purpose of ‘work’ in that survey includes both commuting and business travel. As such, the HTS results have been recategorised to include commuting and business trips. The results indicate that the reduction in private car mode share nationally for ‘work’ trips was -0.2pp, substantially lower than the reduction in car mode share in the STAs of -1.7pp. The combined increase in walking and cycling mode share observed across the STA programme for these trips (+4.4pp) also contrasts with the national control where a decrease of -0.4pp in combined walking and cycling mode share was observed.

17
E x - P o s t E v a l u a t i o n o f s m a r t E r t r a v E l a r E a s / E x E C u t i v E s u m m a r Y
n
2012 1394
2014 1297
2016 1490
2012
2014
2016
100%
80%
60%
40%
20%
0%
Private Car Walk Cycle Bus/Rail Other
80.4%
76.1%
12.0%
2.2%1.0%
4.4%
14.9%
3.0% 2.2%3.8%
STA Programme Level Modal Shift, Employment Trips, 2012-2016
STA Programme Level Modal Shift, All Trips, 2012-2016
n
2012 13098
2014 12214
2016 13084
2012
2014
2016
80%
70%
60%
50%
40%
30%
20%
10%
0%
70.8%
66.8%
20.4%
2.3% 3.0% 3.5%
24.8%
3.1% 2.9% 2.3%
Private Car Walk Cycle Bus/Rail Other

18
E x - P o s t E v a l u a t i o n o f s m a r t E r t r a v E l a r E a s / E x E C u t i v E s u m m a r Y
As the HTS could not be undertaken by persons under 18 years of age, the survey only captures ‘escorted education trips’ which are those taken by persons over 18 to accompany others to education. For these trips, results of the HTS show that:
• Car mode share decreased by -3.9pp from 87.6% in 2012 to 83.7% in 2016.
• The largest decrease occurred between 2012 and 2014 when car mode share decreased to 81.9%.
A national control for this data is not available.
Finally, the HTS results provide evidence of modal shift for non-commuting trips as follows:
• Car mode share in the STAs decreased by 3.0pp to 64.4%. By comparison, at a national level, the car mode share reduced by 0.1pp to 79.7% over the same period.
• Walking and cycling trips increased by 6.2pp to 30.7%. This increase is notably higher than the 0.1pp increase observed nationally.
n
2012 778
2014 655
2016 655
2012
2014
2016
87.6%83.7%
10.7%
0.2%0.9%
0.5%
15.2%
0.4% 0.1% 0.6%
100%
80%
60%
40%
20%
0%
Private Car Walk Cycle Bus/Rail Other
STA Programme Level Modal Shift, Escorted Education Trips, 2012-2016

19
E x - P o s t E v a l u a t i o n o f s m a r t E r t r a v E l a r E a s / E x E C u t i v E s u m m a r Y
Sta ntS (excl. dublin)
ntS (incl. dublin)
2016 pp change from 2012 2016 pp change from 2012 2016 pp change from 2012
Private Car 75.5% -1.7 81.5% -0.2 73.1% -1.5
Walk / Cycle 16.8% 4.4 6.6% -0.4 11.8% 1.8
All Other 7.7% -2.7 11.9% 0.6 15.1% -0.4
Sta ntS (excl. dublin)
ntS (incl. dublin)
2016 pp change from 2012 2016 pp change from 2012 2016 pp change from 2012
Private Car 64.4 -3.1 79.7% 0.1 72.8% -1.6
Walk / Cycle 30.7% 6.2 15.5% 0.1 19.7% 1.3
All Other 5% -3.1 4.9% -0.2 7.5% 0.3
STA Programme Level Modal Shift, Non-Commuting Trips, 2012-2016
STA Programme Level Modal Shift, Employment Trips, 2012-2016

20
E x - P o s t E v a l u a t i o n o f s m a r t E r t r a v E l a r E a s / E x E C u t i v E s u m m a r Y
The STA Pilot Programme has had a very positive impact on the quality of life of participating communities. The attitudes and awareness component of the HTS indicates that the STAs are now considered to be more accessible by non-motorised modes, more pleasant to walk and cycle in and, importantly, safer for pedestrians and cyclists. This indicates that key barriers to the use of sustainable transport modes have in part been overcome by the STA programme investment.
The reported changes in residents’ attitudes and perceptions of their local environment has contributed to increased levels of walking and cycling which in turn has generated significant health benefits from increased levels of physical activity. The reported additional physical activity across the STAs was calculated as an economic benefit of €1.4m in nominal terms in 2016.
The observed shift from car to more sustainable modes has also contributed to environmental benefits within the STAs. Although the number of car-based commuter journeys remained relatively constant between 2012 and 2016, there was a reduction in car use for other trip purposes. The reduction in car journeys (465 fewer private car trips were taken in 2016 compared to 2012 levels (in absolute terms), resulted in non-fuel vehicle operating costs avoided of €0.14m per annum and total fuel costs avoided of €0.16m per annum in nominal terms In addition, emissions savings for CO2, NOx and PM resulted in estimated savings of €0.01m nominally in 2016.
A potentially negative impact of the programme identified during the planning stage was a reduction in economic activity resulting from the anticipated modal shift. However, evidence from footfall surveys, on-street surveys and interviews with local businesses shows that there was little or no negative impact on the local economies.
When considering the quantified economic benefits of the programme for the STAs, a Benefit/Cost Ratio of 1.31 was calculated.
Smarter Travel investment has had a very positive impact on the participating towns

21
E x - P o s t E v a l u a t i o n o f s m a r t E r t r a v E l a r E a s / E x E C u t i v E s u m m a r Y
Each of the three STA programmes comprised a mixture of both infrastructure and behavioural change measures. The evidence suggests that this is a reasonable approach to take in other areas, especially on the basis of the need to address existing low levels of infrastructure provision, particularly for cyclists and the demonstrated positive impact and cost effectiveness of behavioural change measures. Naturally, the scale of impact will depend on the quality of both the infrastructure and behavioural change measures delivered.
An integrated package of both infrastructure and behavioural change measures is most likely to achieve modal shift
Poor perception of safety is the biggest barrier to increasing cycling mode share
Safety concerns were a consistent theme throughout the evaluation, to the extent that it is the most significant barrier to increasing cycling. The perception of cycling safety varies significantly depending on the infrastructure provided with segregated infrastructure offering the highest perceived level of safety. However, on the basis that completely segregated infrastructure cannot reasonably be provided across a full urban network, it is recommended that the provision of cycle training is expanded in schools and workplaces.
other key barriers to modal shift:
• Low levels of cycling confidence.
• Attitude to car use.
• Inertia.
• Practical barriers such as trip chaining and the need to carry heavy equipment.
• Weather.

22
E x - P o s t E v a l u a t i o n o f s m a r t E r t r a v E l a r E a s / E x E C u t i v E s u m m a r Y
On-road cycling infrastructure has not encouraged modal shift
On-road cycling infrastructure delivered across the STAs has not demonstrated an impact on modal shift. Automatic traffic counters close to the delivered facilities do not demonstrate a positive change in cyclist numbers and qualitative feedback suggests that this type of infrastructure results in poor perceptions of safety, with many participants suggesting that investment in on-road cycling facilities is counter intuitive to increasing cycling. The evidence suggests that, where possible, segregated cycling infrastructure should be provided.
Walking has increased more than cycling in response to investment
Throughout delivery of the STA programme there was a bias towards delivery of both infrastructure and behavioural change measures targeting cycling. Despite this, in all areas, walking experienced the highest level of shift at a programme level. This experience suggests that more focused investment on increasing walking for short trips may be an easier quick win in reducing car mode share. In parallel, investment in appropriate infrastructure and behavioural change measures to encourage cycling could be made, which is possibly a longer term objective.
Greenways have had a very positive impact on the STAs but have not encouraged modal shift for commuting trips
Despite the positive feedback received on the facilities, greenways have not been successful in achieving the overarching aim of encouraging modal shift for commuting trips. Across each of the STAs, the peak volume of both cyclists and pedestrians using the facilities was either at midday or in the evening after the main commuting period.
It is recommended that while opportunistic, the limitations of utilising pre-existing infrastructure to deliver greenways needs to be acknowledged. If the overarching objective for delivery of a scheme is to encourage commuting, then this needs to be embedded within overall planning and design from the early stages of delivery. It is easier to construct greenways along pre-existing facilities such as railway corridors; however, if this route does not reflect commuting desire lines then the facility is unlikely to have an impact on commuting trips. In addition, it is imperative that the facilities delivered are marketed to target communities on the basis for which they were intended, be it for commuting or tourism.
Behavioural change measures have a positive impact but need to be delivered in a more focused way
Behavioural change measures formed a key component of each STA programme and there is evidence that they had a cost effective and positive impact on the observed change, especially within schools, workplaces and campuses. Despite positive feedback on many aspects of behavioural change outcomes, there is evidence from all STAs that this element of the programme sometimes lacked the focus and experience needed to maximise impact.
The evidence points to the need for more targeted and focused delivery of behavioural change programmes and greater training and guidance for those delivering behavioural change programmes. None of the STAs developed a segmented approach to delivering behavioural change measures. The funding was invested across the community equally without recognition of the willingness or ability of various sectors within it to change. This resulted in some research participants concluding that Smarter Travel was sometimes ‘preaching to the converted’ instead of focusing on other cohorts of the community that might demonstrate a willingness to change but haven’t engaged with the programme.

23
E x - P o s t E v a l u a t i o n o f s m a r t E r t r a v E l a r E a s / E x E C u t i v E s u m m a r Y
Programme and project management has a direct impact on programme outcomes
While the evaluation was commissioned to focus specifically on programme outcomes and impact, a number of important observations were made which provide important lessons learnt for future management of similar programmes. These include the need to:
• Incorporate legacy within delivery programmes.
• Ensure continuity of delivery teams, to maintain strong relationships with key stakeholders.
• Gain strong commitment to deliver measures that may inconvenience drivers but benefit pedestrians, cyclists and the wider community.
• Gain strong commitment for the delivery of behavioural change measures with supporting staff training if necessary.
• Ensure that innovative measures are well scoped out to ensure that there is a clear understanding of their potential benefits prior to implementation.
Achieving greater modal shift for school trips will require a cross government response
Across all STAs, the feedback received on behavioural change interventions delivered in schools has been overwhelmingly positive, particularly with regards to the cycle training and challenges delivered. There is evidence that this programme improves awareness and confidence among participating students and that it has influenced the mind-set of parents who, despite safety concerns, have increased leisure walking and cycling at least. However, success of the School Travel Programme would be enhanced by more cross-Government support in a number of areas such as reducing the need for multiple and heavy school books, reducing travel distances for school trips and health promotion.

E x - P O S T E v A L U A T I O N O F S M A R T E R T R A v E L A R E A S / E x E C U T I v E S U M M A R Y
Conclusion
The two key objectives of the Smarter Travel Programme were to ‘transform areas through modal shift’ and ‘improve quality of life’. In terms of modal shift, although the level of change was reasonably low, it is still higher than changes within the national control. Furthermore, quality of life within in the STAs has improved, mainly as a result of the improved amenity presented by infrastructure investment.
It is difficult to attribute the modal shift identified to specific measures as the observed change is most likely a response to the package of measures which has been delivered. Investment in infrastructure has resulted in improved perceptions of the environment for walking and cycling and there are indications through both the HTS and qualitative research that improvements in infrastructure have influenced increased walking and cycling. Similarly, there is evidence that behavioural change measures have had an impact on influencing modal shift, especially within schools and through campaigns and organised challenges.
Naturally, the scale of impact will vary depending on the receiving environment. Where a reasonable level of cycling infrastructure is already provided it is recommended that behavioural change measures are implemented such as cycle training and active travel campaigns. However, in areas where infrastructure is deficient and badly perceived by the community, making improvements in this area should be a first priority with behavioural change measures delivered in parallel
Delivery of similar programmes elsewhere should present similar benefits, indeed it is likely that programmes in other areas could achieve a more positive impact, assuming that the lessons learnt from this pilot programme are taken into account.
Greater impact may also be achieved through a greater commitment to smarter travel interventions at a local level. Across all three STAs, committed schemes which were perceived as inconveniencing drivers, such as reallocation of road space, removal of parking spaces and reduction of speed limits were not delivered as part of the programme. With strong local authority commitment, future programmes may have more conviction to implement measures which may prove unpopular with drivers, but which will benefit users of sustainable modes.
24

25
E x - P o s t E v a l u a t i o n o f s m a r t E r t r a v E l a r E a s / E x E C u t i v E s u m m a r Y
Smarter Travel Areas
Related Documents


