Ecological Indicators 45 (2014) 110–122 Contents lists available at ScienceDirect Ecological Indicators jo ur nal ho me page: www.elsevier.com/locate/ ecolind Ex ante assessment of crop rotations focusing on energy crops using a multi-attribute decision-making method Andrea Werner a,∗ , Andreas Werner b , Ralf Wieland c , Kurt-Christian Kersebaum c , Wilfried Mirschel c , Hans-Peter Ende d , Hubert Wiggering d,e a Faculty of Agricultural and Environmental Sciences, Landscape Ecology and Site Evaluation, University of Rostock, 18051 Rostock, Germany b Department for Construction Planning and Co-ordination, Central University Administration, University of Rostock, 18051 Rostock, Germany c Institute of Landscape Systems Analysis, Leibniz Centre for Agricultural Landscape Research (ZALF), Eberswalder Str. 84, 15374 Müncheberg, Germany d Leibniz Centre for Agricultural Landscape Research (ZALF), Eberswalder Str. 84, 15374 Müncheberg, Germany e Institute of Earth and Environmental Science, University of Potsdam, Karl-Liebknecht-Straße 24/25, 14476 Potsdam, Germany a r t i c l e i n f o Article history: Received 11 March 2012 Received in revised form 14 March 2014 Accepted 17 March 2014 Keywords: Agricultural management Ex ante assessment Multi-attribute decision-making AHP Crop rotation Energy crops Regional objectives Indicators a b s t r a c t The cultivation of plants for use as energy resources is an agricultural and industrial sector with poten- tially synergistic benefits related to protecting the environment and generating income. Against the background of increasing land-use changes and new agricultural approaches to the production of energy crops, we present a method for identifying future-oriented crop rotations that supports both the economic and environmental components of decision-making strategies with respect to agriculture-related pol- icy decisions (regional mission statements). The conflicting aspects of these objectives can be addressed with the analytic hierarchy process (AHP), a multi-attribute decision-making method that was integrated here. Three models are used to generate simulations of the defined objectives over a planning period of 30 years under the current climate scenario and provide input data for the multi-attribute assessment of several crop rotations. Based on the entire evaluation process, dimensionless global priority vectors are used to indicate how well the crop rotations meet the requirements of the defined mission statement. The method is tested in a municipality in NE Germany. © 2014 Elsevier Ltd. All rights reserved. 1. Introduction The environmental effects of biomass feedstocks are becom- ing an increasingly common subject of social discussion, political making and scientific research. The increasing use of biomass for energy production is expected to expand and intensify biomass production in the decades ahead (McBride et al., 2011), and the intensification of land use and land use changes could greatly affect the sustainability of agricultural systems. Therefore, some scien- tists have advocated biomass production, whereas others believe that the production of biomass feedstocks exacerbates a number of environmental problems, such as the depletion of nutrients in soil, soil erosion and biodiversity loss (Jordan et al., 2007; Williams et al., 2009). This debate coincides with an expected increase in bioenergy use and political regulations requiring that bioenergy and biomass not be produced at the expense of the environment (Fritsche et al., ∗ Corresponding author. Tel.: +49 0381 498 3445/+49 0381 255 6737. E-mail address: [email protected] (A. Werner). 2010); therefore, knowledge of the environmental effects of energy cultivation systems must be made available. Assessing the effects of cultivation systems is a key issue for the implementation of management practices intended to achieve goal-oriented, sustainable forms of land use (Sulser et al., 2001; Pacini et al., 2003). However, for such assessments to be realistic and effective, they must be capable of handling complex effects while also considering personal and subjective views of the rel- ative importance of priorities (Park and Seaton, 1996; Andreoli and Tellarini, 2000). The assessment of cultivation systems is a typical decision-making problem that requires the use of deci- sion aid methods, and most approaches are based on multi-criteria decision-making methods (MCDM). The goal of MCDM is to develop decision-making support meth- ods, particularly for selecting, ranking or sorting options (i.e., alternatives, solutions, courses of action) in the presence of multi- ple and often conflicting criteria (Zanakis et al., 1998; Figueira et al., 2005; Sadok et al., 2008). Multi-attribute decision-making meth- ods (MADM) are a methodological subgroup of MCDM (Hwang and Yoon, 1981) and are used in cases of discrete and limited numbers of alternatives that are characterized by multiple and conflicting http://dx.doi.org/10.1016/j.ecolind.2014.03.013 1470-160X/© 2014 Elsevier Ltd. All rights reserved.

Welcome message from author
This document is posted to help you gain knowledge. Please leave a comment to let me know what you think about it! Share it to your friends and learn new things together.
Transcript
Em
AWa
b
c
d
e
a
ARRA
KAEMACERI
1
imepitttes2un
h1
Ecological Indicators 45 (2014) 110–122
Contents lists available at ScienceDirect
Ecological Indicators
jo ur nal ho me page: www.elsev ier .com/ locate / ecol ind
x ante assessment of crop rotations focusing on energy crops using aulti-attribute decision-making method
ndrea Wernera,∗, Andreas Wernerb, Ralf Wielandc, Kurt-Christian Kersebaumc,ilfried Mirschelc, Hans-Peter Ended, Hubert Wiggeringd,e
Faculty of Agricultural and Environmental Sciences, Landscape Ecology and Site Evaluation, University of Rostock, 18051 Rostock, GermanyDepartment for Construction Planning and Co-ordination, Central University Administration, University of Rostock, 18051 Rostock, GermanyInstitute of Landscape Systems Analysis, Leibniz Centre for Agricultural Landscape Research (ZALF), Eberswalder Str. 84, 15374 Müncheberg, GermanyLeibniz Centre for Agricultural Landscape Research (ZALF), Eberswalder Str. 84, 15374 Müncheberg, GermanyInstitute of Earth and Environmental Science, University of Potsdam, Karl-Liebknecht-Straße 24/25, 14476 Potsdam, Germany
r t i c l e i n f o
rticle history:eceived 11 March 2012eceived in revised form 14 March 2014ccepted 17 March 2014
eywords:gricultural managementx ante assessment
a b s t r a c t
The cultivation of plants for use as energy resources is an agricultural and industrial sector with poten-tially synergistic benefits related to protecting the environment and generating income. Against thebackground of increasing land-use changes and new agricultural approaches to the production of energycrops, we present a method for identifying future-oriented crop rotations that supports both the economicand environmental components of decision-making strategies with respect to agriculture-related pol-icy decisions (regional mission statements). The conflicting aspects of these objectives can be addressedwith the analytic hierarchy process (AHP), a multi-attribute decision-making method that was integrated
ulti-attribute decision-makingHProp rotationnergy cropsegional objectives
ndicators
here. Three models are used to generate simulations of the defined objectives over a planning period of30 years under the current climate scenario and provide input data for the multi-attribute assessment ofseveral crop rotations. Based on the entire evaluation process, dimensionless global priority vectors areused to indicate how well the crop rotations meet the requirements of the defined mission statement.The method is tested in a municipality in NE Germany.
© 2014 Elsevier Ltd. All rights reserved.
. Introduction
The environmental effects of biomass feedstocks are becom-ng an increasingly common subject of social discussion, political
aking and scientific research. The increasing use of biomass fornergy production is expected to expand and intensify biomassroduction in the decades ahead (McBride et al., 2011), and the
ntensification of land use and land use changes could greatly affecthe sustainability of agricultural systems. Therefore, some scien-ists have advocated biomass production, whereas others believehat the production of biomass feedstocks exacerbates a number ofnvironmental problems, such as the depletion of nutrients in soil,oil erosion and biodiversity loss (Jordan et al., 2007; Williams et al.,009). This debate coincides with an expected increase in bioenergy
se and political regulations requiring that bioenergy and biomassot be produced at the expense of the environment (Fritsche et al.,∗ Corresponding author. Tel.: +49 0381 498 3445/+49 0381 255 6737.E-mail address: [email protected] (A. Werner).
ttp://dx.doi.org/10.1016/j.ecolind.2014.03.013470-160X/© 2014 Elsevier Ltd. All rights reserved.
2010); therefore, knowledge of the environmental effects of energycultivation systems must be made available.
Assessing the effects of cultivation systems is a key issue forthe implementation of management practices intended to achievegoal-oriented, sustainable forms of land use (Sulser et al., 2001;Pacini et al., 2003). However, for such assessments to be realisticand effective, they must be capable of handling complex effectswhile also considering personal and subjective views of the rel-ative importance of priorities (Park and Seaton, 1996; Andreoliand Tellarini, 2000). The assessment of cultivation systems is atypical decision-making problem that requires the use of deci-sion aid methods, and most approaches are based on multi-criteriadecision-making methods (MCDM).
The goal of MCDM is to develop decision-making support meth-ods, particularly for selecting, ranking or sorting options (i.e.,alternatives, solutions, courses of action) in the presence of multi-ple and often conflicting criteria (Zanakis et al., 1998; Figueira et al.,
2005; Sadok et al., 2008). Multi-attribute decision-making meth-ods (MADM) are a methodological subgroup of MCDM (Hwang andYoon, 1981) and are used in cases of discrete and limited numbersof alternatives that are characterized by multiple and conflicting
l Indic
ciiGrtdTtOHtat(2a
ro1(mk
trbosobSlstatd
tAt
-
-
--
-
--
(cabAha
A. Werner et al. / Ecologica
riteria. MADM methodologies have been used successfully in var-ous assessments on different scales to address problems thatnvolve a range of alternatives. At the farm scale, Arondel andirardin (2000) used the ELECTRE (Elimination et choix traduisant la
éalité; Roy, 1968) method to sort cropping systems on the basis ofheir impact on groundwater quality. Mazzetto and Bonera (2003)eveloped a multi-criteria software package derived from the ELEC-RE method (MEACROS) to identify alternative cropping systemshat meet a set of technical, economic and environmental criteria.ther authors have applied the analytic hierarchy process (AHP;arker and Vargas, 1987; Saaty, 1980) method for selecting crops
o determine the optimal allocation of resources (Alphonce, 1997);ssess the environmental, economic and social factors relating tohe adoption of silvopasture techniques in south-central FloridaShrestha et al., 2004); evaluate soil productivity (Zhang et al.,004); and rank alternatives for preserving natural resources, suchs forestry management practices (Schmoldt et al., 2001).
The typical multi-dimensional characteristics of crop rotationsequire the consideration of heterogeneous measurement levelsf relevant quantitative and/or qualitative criteria (Munda et al.,995). To allow an effective ex ante evaluation, Sadok et al.2008) suggested selecting criteria that take into account specific
ethodological characteristics of the chosen MADM method. Thenowledge and expertise of decision-makers are crucial elements.
A decision-support method is required to assess the long-erm effects of energy crop cultivation while also consideringegional development objectives. Such a method must be capa-le of linking indicator-based models with regional developmentbjectives based on the region’s mission statement. The missiontatement is based on the economic and environmental aspectsf agriculture-related policy decisions. A multitude of indicator-ased models can be applied at the regional level (e.g., MODAM –attler et al., 2010, Seamless – Van Ittersum et al., 2008). Neverthe-ess, no existing model is capable of being integrated in a missiontatement-oriented regional development process, and most lackhe decisive step of weighting the pros and cons of possible impactst the local or small-scale level. However, this step is requiredo effectively assist local decision-makers in enacting appropriateecisions (Malkina-Pykh, 2002).
The aim of this paper is to present a method that is suitable forhe ex ante assessment of crop rotation in energy crop cultivation.
suitable methodological approach must be developed that meetshe following requirements:
Includes a regionally defined mission statement as a prerequisitefor the assessment.
Compares, rates and assesses a large number of crop rotations fortheir development over a simulation period.
Evaluates conventional market fruit and energy crops. Addresses the ecological consequences and economic efficiencyof crop sequences.
Merges existing and future applicable simulation models in themethodological approach.
Considers quantitative and qualitative criteria in the evaluation. Includes assessment unit on a small scale to consider local spatialconditions at an adequate scale.
The method was applied to the municipality of ZiethenBrandenburg). Because of its small-scale climatic and geologi-al variability, this region offers a variety of potential land usesnd landscape functions. In addition, the municipality has long
enefited from vigorous cooperation with the Leibniz Centre forgricultural Landscape Research in Müncheberg. This cooperationas resulted in a vast array of basic spatial data, monitoring datand research results (Lutze et al., 2006a).ators 45 (2014) 110–122 111
Weighting of the pros and cons of the possible impacts ofapplying various crop rotations was conducted using an MADMmethod. Based on the selection criteria determined by Sadok et al.(2008), the AHP was identified as a suitable weighting method.The AHP is particularly suitable for linking a region’s missionstatement-oriented planning process with the possibilities offeredby indicator-based model simulations. A decision hierarchy wascreated to structure the aims of the project and generate suitablecriteria. The highest hierarchy level contains the region’s mis-sion statement, which was subdivided hierarchically into criteria(objectives and indicators). With the objective of optimally achiev-ing the mission statement, the AHP was used by experts to weightthe defined objectives and indicators. In addition, the crop rotationswere simulated over a period of several years using process-basedecosystem models. The results were also weighted using the AHP.At the end of the assessment process, the impacts of each crop rota-tion were presented using a dimensionless preference value (globalpriority vector) by aggregating individual weighting values. It wasthen possible to rank the investigated crop rotations according tothe mission statement. This ranking provides information aboutthe crop rotations that are best suited for achieving the missionstatement.
Based on methodological test runs over a simulation period of30 years, the ability of the method to provide credible informa-tion was tested to determine whether it could be used in the nextproject phase for deriving specific regional cultivation recommen-dations. To this end, the simulation results were randomly tested toverify whether they are comparable to regional conditions; how-ever, the objective was not to verify the calculations of the appliedmodels, and the actual models were not evaluated in this way. Theindividual models have been previously published and discussed anumber of times, and for the purpose of this study, their validity wasassumed. Random sampling checks were conducted to verify thecalculations of global priority vectors of single grid cells. The resultsfor a selected mission statement are presented and discussed in thispaper.
2. Materials and methods
2.1. The study area
The municipality of Ziethen is located at 52◦58′0′′ N and13◦55′0′′ E in NE Germany (Fig. 1). The total area of the municipalityis 24.33 km2, 80% of which is used for agricultural crop productionand permanent grassland. The remaining 20% is covered by for-est, water and residential areas. The municipality is characterizedby a highly heterogeneous landscape, and its land use patterns aretypical of a morainal landscape in the NE German Lowlands (seeexplanations in Werner et al., 2008). The variable geomorphologicconditions justify variable soil parameters and soil types, and sandysoils are predominant (Lutze et al., 2006b). With regard to climate,the region is characterized by subcontinental conditions. With a rel-atively low annual precipitation rate below 540 mm a−1, it is oneof the driest landscapes in Germany (Mirschel et al., 2006a). Theannual mean temperature in the region is 8.6 ◦C. Two gradientsin the average rainfall (from west to east) and mean temperature(from north to south) prevail in the area and reflect the influenceof spatial variations of geomorphologic conditions (Mirschel et al.,2006a).
The influence of agricultural policy and economic frameworksis reflected very clearly in the region, particularly after the German
Renewable Energy Sources Act (EEG) was introduced in 2000. Agrowing trend can be seen in the increased cultivation of profitablecrops, such as winter wheat, oleiferous crops (rape) and maize. Inthe future, the economic pressure of the market will require the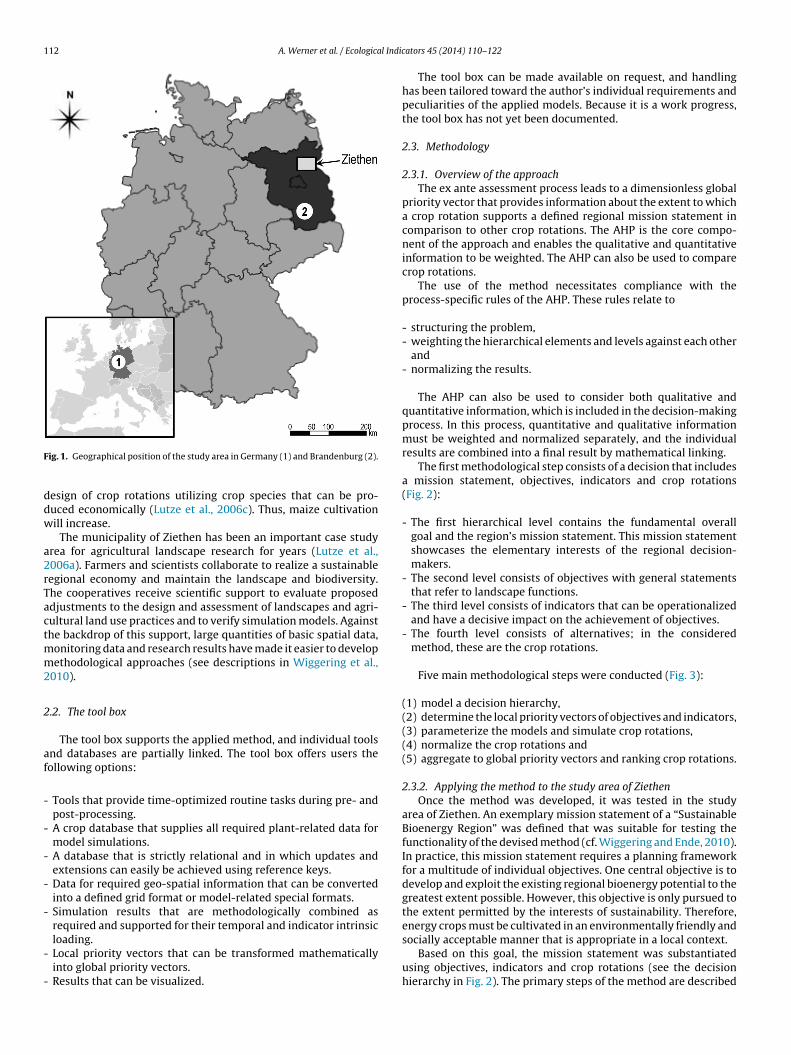
112 A. Werner et al. / Ecological Indic
F
ddw
a2rTactmm2
2
af
-
-
-
-
-
-
-
socially acceptable manner that is appropriate in a local context.
ig. 1. Geographical position of the study area in Germany (1) and Brandenburg (2).
esign of crop rotations utilizing crop species that can be pro-uced economically (Lutze et al., 2006c). Thus, maize cultivationill increase.
The municipality of Ziethen has been an important case studyrea for agricultural landscape research for years (Lutze et al.,006a). Farmers and scientists collaborate to realize a sustainableegional economy and maintain the landscape and biodiversity.he cooperatives receive scientific support to evaluate proposeddjustments to the design and assessment of landscapes and agri-ultural land use practices and to verify simulation models. Againsthe backdrop of this support, large quantities of basic spatial data,
onitoring data and research results have made it easier to developethodological approaches (see descriptions in Wiggering et al.,
010).
.2. The tool box
The tool box supports the applied method, and individual toolsnd databases are partially linked. The tool box offers users theollowing options:
Tools that provide time-optimized routine tasks during pre- andpost-processing.
A crop database that supplies all required plant-related data formodel simulations.
A database that is strictly relational and in which updates andextensions can easily be achieved using reference keys.
Data for required geo-spatial information that can be convertedinto a defined grid format or model-related special formats.
Simulation results that are methodologically combined asrequired and supported for their temporal and indicator intrinsicloading.
Local priority vectors that can be transformed mathematicallyinto global priority vectors.
Results that can be visualized.
ators 45 (2014) 110–122
The tool box can be made available on request, and handlinghas been tailored toward the author’s individual requirements andpeculiarities of the applied models. Because it is a work progress,the tool box has not yet been documented.
2.3. Methodology
2.3.1. Overview of the approachThe ex ante assessment process leads to a dimensionless global
priority vector that provides information about the extent to whicha crop rotation supports a defined regional mission statement incomparison to other crop rotations. The AHP is the core compo-nent of the approach and enables the qualitative and quantitativeinformation to be weighted. The AHP can also be used to comparecrop rotations.
The use of the method necessitates compliance with theprocess-specific rules of the AHP. These rules relate to
- structuring the problem,- weighting the hierarchical elements and levels against each other
and- normalizing the results.
The AHP can also be used to consider both qualitative andquantitative information, which is included in the decision-makingprocess. In this process, quantitative and qualitative informationmust be weighted and normalized separately, and the individualresults are combined into a final result by mathematical linking.
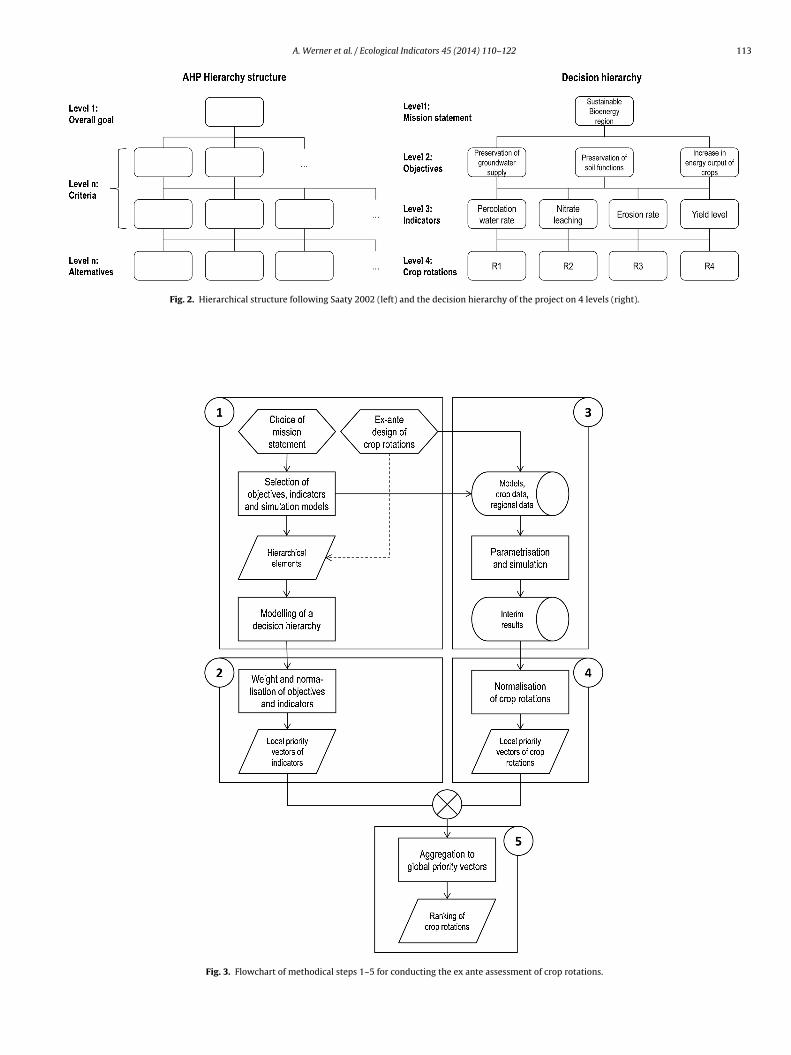
The first methodological step consists of a decision that includesa mission statement, objectives, indicators and crop rotations(Fig. 2):
- The first hierarchical level contains the fundamental overallgoal and the region’s mission statement. This mission statementshowcases the elementary interests of the regional decision-makers.
- The second level consists of objectives with general statementsthat refer to landscape functions.
- The third level consists of indicators that can be operationalizedand have a decisive impact on the achievement of objectives.
- The fourth level consists of alternatives; in the consideredmethod, these are the crop rotations.
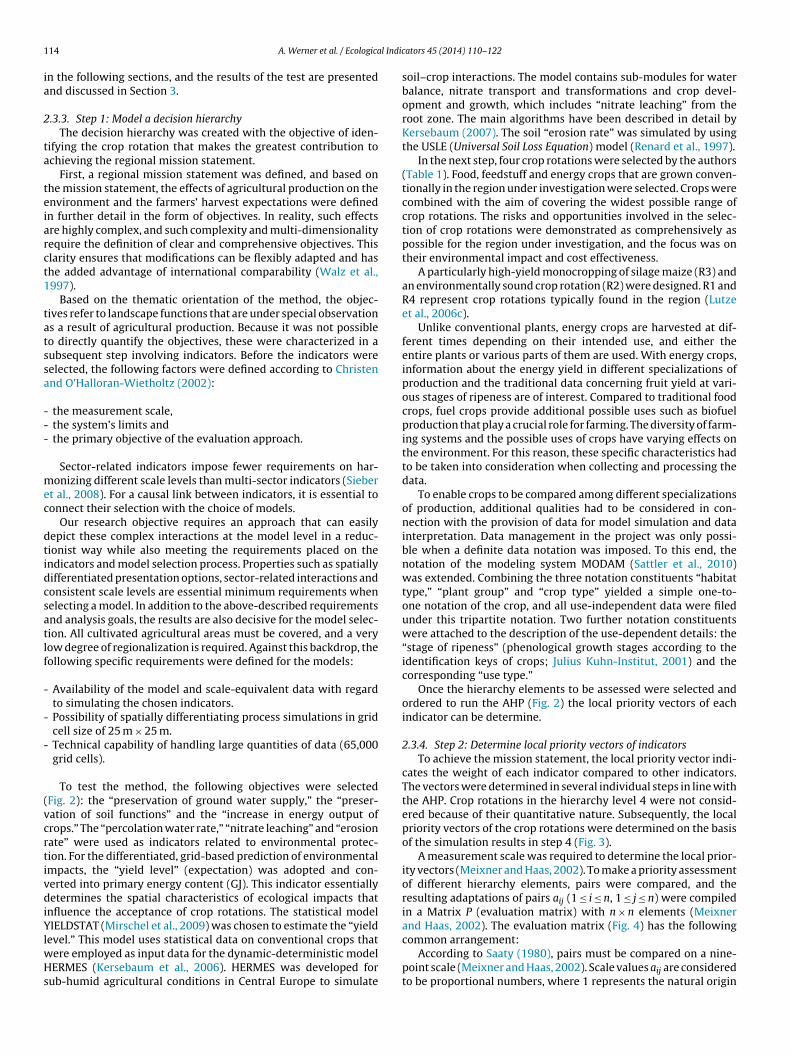
Five main methodological steps were conducted (Fig. 3):
(1) model a decision hierarchy,(2) determine the local priority vectors of objectives and indicators,(3) parameterize the models and simulate crop rotations,(4) normalize the crop rotations and(5) aggregate to global priority vectors and ranking crop rotations.
2.3.2. Applying the method to the study area of ZiethenOnce the method was developed, it was tested in the study
area of Ziethen. An exemplary mission statement of a “SustainableBioenergy Region” was defined that was suitable for testing thefunctionality of the devised method (cf. Wiggering and Ende, 2010).In practice, this mission statement requires a planning frameworkfor a multitude of individual objectives. One central objective is todevelop and exploit the existing regional bioenergy potential to thegreatest extent possible. However, this objective is only pursued tothe extent permitted by the interests of sustainability. Therefore,energy crops must be cultivated in an environmentally friendly and
Based on this goal, the mission statement was substantiatedusing objectives, indicators and crop rotations (see the decisionhierarchy in Fig. 2). The primary steps of the method are described
A. Werner et al. / Ecological Indicators 45 (2014) 110–122 113
Fig. 2. Hierarchical structure following Saaty 2002 (left) and the decision hierarchy of the project on 4 levels (right).
Fig. 3. Flowchart of methodical steps 1–5 for conducting the ex ante assessment of crop rotations.
1 l Indic
ia
2
ta
teiarct1
tatssa
---
mec
dtidcsatlf
-
-
-
(vcrtivdiYlwHs
14 A. Werner et al. / Ecologica
n the following sections, and the results of the test are presentednd discussed in Section 3.
.3.3. Step 1: Model a decision hierarchyThe decision hierarchy was created with the objective of iden-
ifying the crop rotation that makes the greatest contribution tochieving the regional mission statement.
First, a regional mission statement was defined, and based onhe mission statement, the effects of agricultural production on thenvironment and the farmers’ harvest expectations were definedn further detail in the form of objectives. In reality, such effectsre highly complex, and such complexity and multi-dimensionalityequire the definition of clear and comprehensive objectives. Thislarity ensures that modifications can be flexibly adapted and hashe added advantage of international comparability (Walz et al.,997).
Based on the thematic orientation of the method, the objec-ives refer to landscape functions that are under special observations a result of agricultural production. Because it was not possibleo directly quantify the objectives, these were characterized in aubsequent step involving indicators. Before the indicators wereelected, the following factors were defined according to Christennd O’Halloran-Wietholtz (2002):
the measurement scale, the system’s limits and the primary objective of the evaluation approach.
Sector-related indicators impose fewer requirements on har-onizing different scale levels than multi-sector indicators (Sieber
t al., 2008). For a causal link between indicators, it is essential toonnect their selection with the choice of models.
Our research objective requires an approach that can easilyepict these complex interactions at the model level in a reduc-ionist way while also meeting the requirements placed on thendicators and model selection process. Properties such as spatiallyifferentiated presentation options, sector-related interactions andonsistent scale levels are essential minimum requirements whenelecting a model. In addition to the above-described requirementsnd analysis goals, the results are also decisive for the model selec-ion. All cultivated agricultural areas must be covered, and a veryow degree of regionalization is required. Against this backdrop, theollowing specific requirements were defined for the models:
Availability of the model and scale-equivalent data with regardto simulating the chosen indicators.
Possibility of spatially differentiating process simulations in gridcell size of 25 m × 25 m.
Technical capability of handling large quantities of data (65,000grid cells).
To test the method, the following objectives were selectedFig. 2): the “preservation of ground water supply,” the “preser-ation of soil functions” and the “increase in energy output ofrops.” The “percolation water rate,” “nitrate leaching” and “erosionate” were used as indicators related to environmental protec-ion. For the differentiated, grid-based prediction of environmentalmpacts, the “yield level” (expectation) was adopted and con-erted into primary energy content (GJ). This indicator essentiallyetermines the spatial characteristics of ecological impacts that
nfluence the acceptance of crop rotations. The statistical modelIELDSTAT (Mirschel et al., 2009) was chosen to estimate the “yield
evel.” This model uses statistical data on conventional crops thatere employed as input data for the dynamic-deterministic modelERMES (Kersebaum et al., 2006). HERMES was developed for
ub-humid agricultural conditions in Central Europe to simulate
ators 45 (2014) 110–122
soil–crop interactions. The model contains sub-modules for waterbalance, nitrate transport and transformations and crop devel-opment and growth, which includes “nitrate leaching” from theroot zone. The main algorithms have been described in detail byKersebaum (2007). The soil “erosion rate” was simulated by usingthe USLE (Universal Soil Loss Equation) model (Renard et al., 1997).
In the next step, four crop rotations were selected by the authors(Table 1). Food, feedstuff and energy crops that are grown conven-tionally in the region under investigation were selected. Crops werecombined with the aim of covering the widest possible range ofcrop rotations. The risks and opportunities involved in the selec-tion of crop rotations were demonstrated as comprehensively aspossible for the region under investigation, and the focus was ontheir environmental impact and cost effectiveness.
A particularly high-yield monocropping of silage maize (R3) andan environmentally sound crop rotation (R2) were designed. R1 andR4 represent crop rotations typically found in the region (Lutzeet al., 2006c).
Unlike conventional plants, energy crops are harvested at dif-ferent times depending on their intended use, and either theentire plants or various parts of them are used. With energy crops,information about the energy yield in different specializations ofproduction and the traditional data concerning fruit yield at vari-ous stages of ripeness are of interest. Compared to traditional foodcrops, fuel crops provide additional possible uses such as biofuelproduction that play a crucial role for farming. The diversity of farm-ing systems and the possible uses of crops have varying effects onthe environment. For this reason, these specific characteristics hadto be taken into consideration when collecting and processing thedata.
To enable crops to be compared among different specializationsof production, additional qualities had to be considered in con-nection with the provision of data for model simulation and datainterpretation. Data management in the project was only possi-ble when a definite data notation was imposed. To this end, thenotation of the modeling system MODAM (Sattler et al., 2010)was extended. Combining the three notation constituents “habitattype,” “plant group” and “crop type” yielded a simple one-to-one notation of the crop, and all use-independent data were filedunder this tripartite notation. Two further notation constituentswere attached to the description of the use-dependent details: the“stage of ripeness” (phenological growth stages according to theidentification keys of crops; Julius Kuhn-Institut, 2001) and thecorresponding “use type.”
Once the hierarchy elements to be assessed were selected andordered to run the AHP (Fig. 2) the local priority vectors of eachindicator can be determine.
2.3.4. Step 2: Determine local priority vectors of indicatorsTo achieve the mission statement, the local priority vector indi-
cates the weight of each indicator compared to other indicators.The vectors were determined in several individual steps in line withthe AHP. Crop rotations in the hierarchy level 4 were not consid-ered because of their quantitative nature. Subsequently, the localpriority vectors of the crop rotations were determined on the basisof the simulation results in step 4 (Fig. 3).
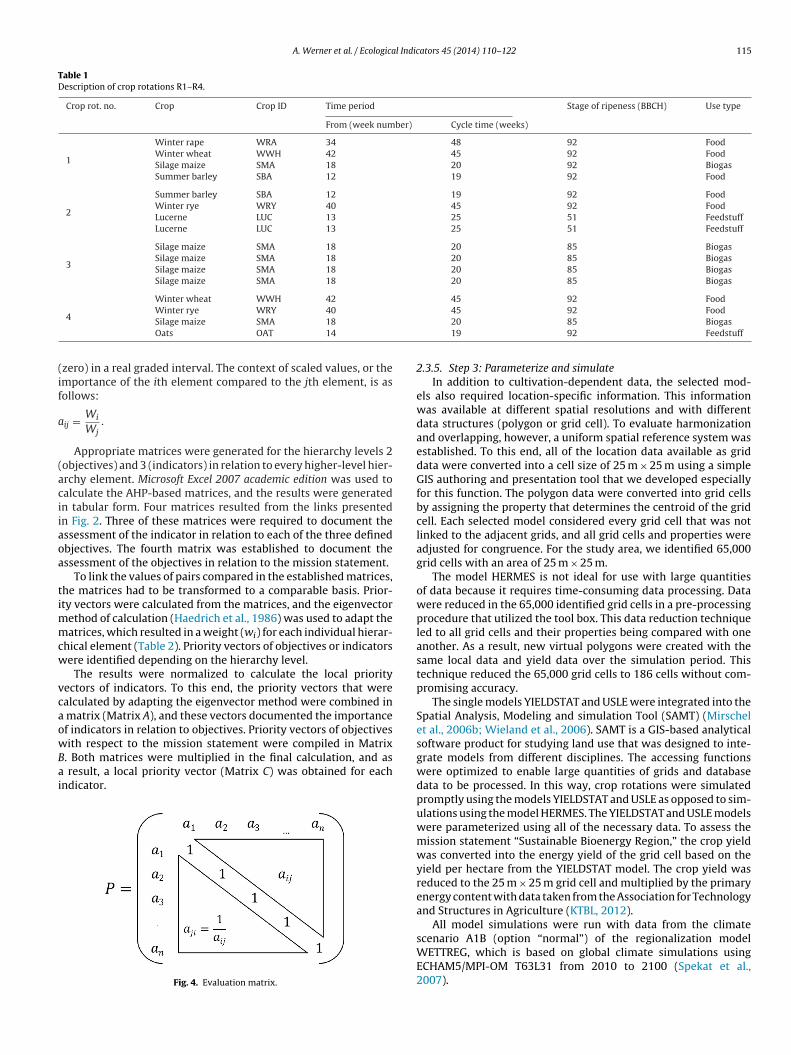
A measurement scale was required to determine the local prior-ity vectors (Meixner and Haas, 2002). To make a priority assessmentof different hierarchy elements, pairs were compared, and theresulting adaptations of pairs aij (1 ≤ i ≤ n, 1 ≤ j ≤ n) were compiledin a Matrix P (evaluation matrix) with n × n elements (Meixnerand Haas, 2002). The evaluation matrix (Fig. 4) has the following
common arrangement:According to Saaty (1980), pairs must be compared on a nine-point scale (Meixner and Haas, 2002). Scale values aij are consideredto be proportional numbers, where 1 represents the natural origin
A. Werner et al. / Ecological Indicators 45 (2014) 110–122 115
Table 1Description of crop rotations R1–R4.
Crop rot. no. Crop Crop ID Time period Stage of ripeness (BBCH) Use type
From (week number) Cycle time (weeks)
1
Winter rape WRA 34 48 92 FoodWinter wheat WWH 42 45 92 FoodSilage maize SMA 18 20 92 BiogasSummer barley SBA 12 19 92 Food
2
Summer barley SBA 12 19 92 FoodWinter rye WRY 40 45 92 FoodLucerne LUC 13 25 51 FeedstuffLucerne LUC 13 25 51 Feedstuff
3
Silage maize SMA 18 20 85 BiogasSilage maize SMA 18 20 85 BiogasSilage maize SMA 18 20 85 BiogasSilage maize SMA 18 20 85 Biogas
Winter wheat WWH 42 45 92 Food
(if
a
(aciiaoa
timmcw
vcaowBai
4Winter rye WRY 40
Silage maize SMA 18
Oats OAT 14
zero) in a real graded interval. The context of scaled values, or themportance of the ith element compared to the jth element, is asollows:
ij = Wi
Wj.
Appropriate matrices were generated for the hierarchy levels 2objectives) and 3 (indicators) in relation to every higher-level hier-rchy element. Microsoft Excel 2007 academic edition was used toalculate the AHP-based matrices, and the results were generatedn tabular form. Four matrices resulted from the links presentedn Fig. 2. Three of these matrices were required to document thessessment of the indicator in relation to each of the three definedbjectives. The fourth matrix was established to document thessessment of the objectives in relation to the mission statement.
To link the values of pairs compared in the established matrices,he matrices had to be transformed to a comparable basis. Prior-ty vectors were calculated from the matrices, and the eigenvector
ethod of calculation (Haedrich et al., 1986) was used to adapt theatrices, which resulted in a weight (wi) for each individual hierar-
hical element (Table 2). Priority vectors of objectives or indicatorsere identified depending on the hierarchy level.
The results were normalized to calculate the local priorityectors of indicators. To this end, the priority vectors that werealculated by adapting the eigenvector method were combined in
matrix (Matrix A), and these vectors documented the importancef indicators in relation to objectives. Priority vectors of objectives
ith respect to the mission statement were compiled in Matrix. Both matrices were multiplied in the final calculation, and as result, a local priority vector (Matrix C) was obtained for eachndicator.
Fig. 4. Evaluation matrix.
45 92 Food20 85 Biogas19 92 Feedstuff
2.3.5. Step 3: Parameterize and simulateIn addition to cultivation-dependent data, the selected mod-
els also required location-specific information. This informationwas available at different spatial resolutions and with differentdata structures (polygon or grid cell). To evaluate harmonizationand overlapping, however, a uniform spatial reference system wasestablished. To this end, all of the location data available as griddata were converted into a cell size of 25 m × 25 m using a simpleGIS authoring and presentation tool that we developed especiallyfor this function. The polygon data were converted into grid cellsby assigning the property that determines the centroid of the gridcell. Each selected model considered every grid cell that was notlinked to the adjacent grids, and all grid cells and properties wereadjusted for congruence. For the study area, we identified 65,000grid cells with an area of 25 m × 25 m.
The model HERMES is not ideal for use with large quantitiesof data because it requires time-consuming data processing. Datawere reduced in the 65,000 identified grid cells in a pre-processingprocedure that utilized the tool box. This data reduction techniqueled to all grid cells and their properties being compared with oneanother. As a result, new virtual polygons were created with thesame local data and yield data over the simulation period. Thistechnique reduced the 65,000 grid cells to 186 cells without com-promising accuracy.
The single models YIELDSTAT and USLE were integrated into theSpatial Analysis, Modeling and simulation Tool (SAMT) (Mirschelet al., 2006b; Wieland et al., 2006). SAMT is a GIS-based analyticalsoftware product for studying land use that was designed to inte-grate models from different disciplines. The accessing functionswere optimized to enable large quantities of grids and databasedata to be processed. In this way, crop rotations were simulatedpromptly using the models YIELDSTAT and USLE as opposed to sim-ulations using the model HERMES. The YIELDSTAT and USLE modelswere parameterized using all of the necessary data. To assess themission statement “Sustainable Bioenergy Region,” the crop yieldwas converted into the energy yield of the grid cell based on theyield per hectare from the YIELDSTAT model. The crop yield wasreduced to the 25 m × 25 m grid cell and multiplied by the primaryenergy content with data taken from the Association for Technologyand Structures in Agriculture (KTBL, 2012).
All model simulations were run with data from the climate
scenario A1B (option “normal”) of the regionalization modelWETTREG, which is based on global climate simulations usingECHAM5/MPI-OM T63L31 from 2010 to 2100 (Spekat et al.,2007).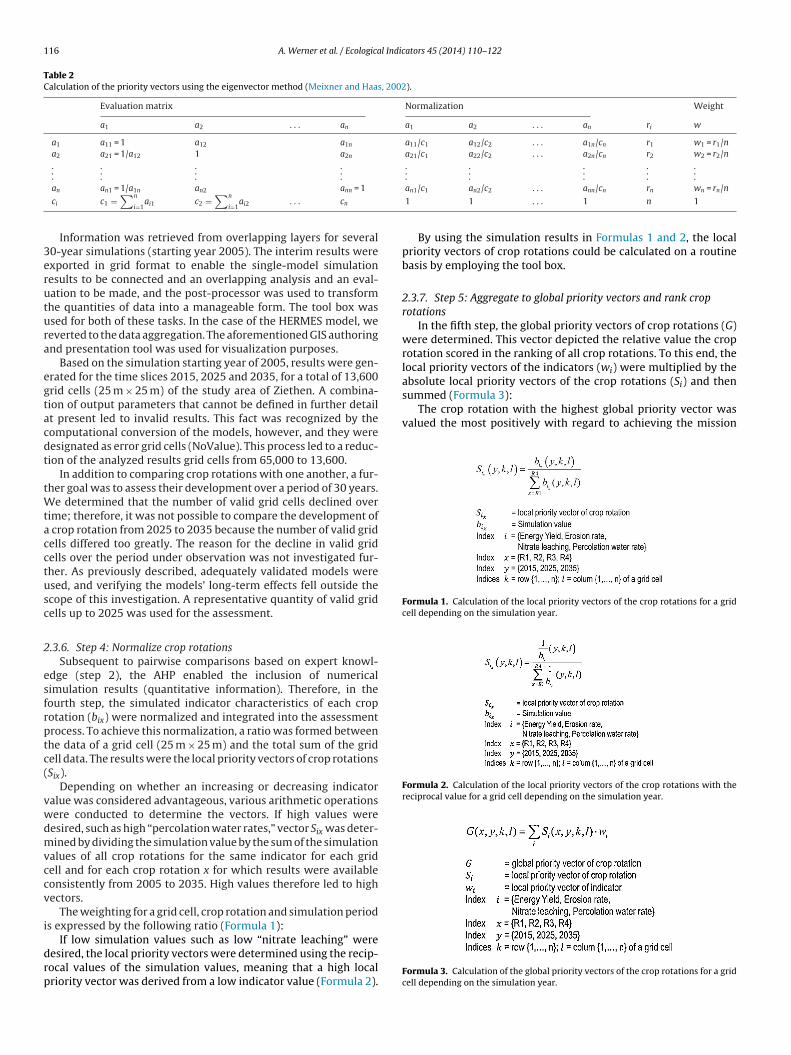
116 A. Werner et al. / Ecological Indicators 45 (2014) 110–122
Table 2Calculation of the priority vectors using the eigenvector method (Meixner and Haas, 2002).
Evaluation matrix Normalization Weight
a1 a2 . . . an a1 a2 . . . an ri w
a1 a11 = 1 a12 a1n a11/c1 a12/c2 . . . a1n/cn r1 w1 = r1/na2 a21 = 1/a12 1 a2n a21/c1 a22/c2 . . . a2n/cn r2 w2 = r2/n...
.
.
....
.
.
....
.
.
....
.
.
....
3erutura
egtacdt
tWtacctusc
2
esfrptc(
vwdmvccv
i
drp
summed (Formula 3):The crop rotation with the highest global priority vector was
valued the most positively with regard to achieving the mission
Formula 1. Calculation of the local priority vectors of the crop rotations for a gridcell depending on the simulation year.
Formula 2. Calculation of the local priority vectors of the crop rotations with thereciprocal value for a grid cell depending on the simulation year.
an an1 = 1/a1n an2 ann = 1
ci c1 =∑n
i=1ai1 c2 =
∑n
i=1ai2 . . . cn
Information was retrieved from overlapping layers for several0-year simulations (starting year 2005). The interim results werexported in grid format to enable the single-model simulationesults to be connected and an overlapping analysis and an eval-ation to be made, and the post-processor was used to transformhe quantities of data into a manageable form. The tool box wassed for both of these tasks. In the case of the HERMES model, weeverted to the data aggregation. The aforementioned GIS authoringnd presentation tool was used for visualization purposes.
Based on the simulation starting year of 2005, results were gen-rated for the time slices 2015, 2025 and 2035, for a total of 13,600rid cells (25 m × 25 m) of the study area of Ziethen. A combina-ion of output parameters that cannot be defined in further detailt present led to invalid results. This fact was recognized by theomputational conversion of the models, however, and they wereesignated as error grid cells (NoValue). This process led to a reduc-ion of the analyzed results grid cells from 65,000 to 13,600.
In addition to comparing crop rotations with one another, a fur-her goal was to assess their development over a period of 30 years.
e determined that the number of valid grid cells declined overime; therefore, it was not possible to compare the development of
crop rotation from 2025 to 2035 because the number of valid gridells differed too greatly. The reason for the decline in valid gridells over the period under observation was not investigated fur-her. As previously described, adequately validated models weresed, and verifying the models’ long-term effects fell outside thecope of this investigation. A representative quantity of valid gridells up to 2025 was used for the assessment.
.3.6. Step 4: Normalize crop rotationsSubsequent to pairwise comparisons based on expert knowl-
dge (step 2), the AHP enabled the inclusion of numericalimulation results (quantitative information). Therefore, in theourth step, the simulated indicator characteristics of each cropotation (bix) were normalized and integrated into the assessmentrocess. To achieve this normalization, a ratio was formed betweenhe data of a grid cell (25 m × 25 m) and the total sum of the gridell data. The results were the local priority vectors of crop rotationsSix).
Depending on whether an increasing or decreasing indicatoralue was considered advantageous, various arithmetic operationsere conducted to determine the vectors. If high values wereesired, such as high “percolation water rates,” vector Six was deter-ined by dividing the simulation value by the sum of the simulation
alues of all crop rotations for the same indicator for each gridell and for each crop rotation x for which results were availableonsistently from 2005 to 2035. High values therefore led to highectors.
The weighting for a grid cell, crop rotation and simulation periods expressed by the following ratio (Formula 1):
If low simulation values such as low “nitrate leaching” wereesired, the local priority vectors were determined using the recip-ocal values of the simulation values, meaning that a high localriority vector was derived from a low indicator value (Formula 2).
an1/c1 an2/c2 . . . ann/cn rn wn = rn/n
1 1 . . . 1 n 1
By using the simulation results in Formulas 1 and 2, the localpriority vectors of crop rotations could be calculated on a routinebasis by employing the tool box.
2.3.7. Step 5: Aggregate to global priority vectors and rank croprotations
In the fifth step, the global priority vectors of crop rotations (G)were determined. This vector depicted the relative value the croprotation scored in the ranking of all crop rotations. To this end, thelocal priority vectors of the indicators (wi) were multiplied by theabsolute local priority vectors of the crop rotations (Si) and then
Formula 3. Calculation of the global priority vectors of the crop rotations for a gridcell depending on the simulation year.
l Indic
sw
3
3
do
TatAl
ams“mme“hi“iwmi
oYa4aygcaasretcRhfir2
fi1
tFdsra
A. Werner et al. / Ecologica
tatement and was ranked in first place. The other crop rotationsere ordered accordingly.
. Results and discussion
.1. Results presentation and discussion
Results of step 1: In the first step, a decision hierarchy waseveloped that substantiated the mission statement in the formf objectives and ecological and economic indicators (see Fig. 2).
Results of step 2: The results of step 2 are documented inables 3 and 4 in the form of the evaluation matrices MS, ME, ME
nd MM. Following their normalization, priority vectors of indica-ors (wSi, wWi, wEi) and objectives (wMi) were compiled in Matrices
and B and multiplied to Matrix C (Table 5). Matrix C shows theocal priority vectors (wi) of the indicators applied.
The results of the second working step documented the rankingnd relative significance of each indicator in relation to the achieve-ent of the mission statement. The larger the vector, the more
ignificant the indicator. With a local priority vector of 0.3882, theyield level” indicator was of greatest significance for achieving theission statement. High crop yields supported the mission state-ent by supplying substantial amounts of the required regional
nergy. A local priority vector of 0.2556 was calculated for theerosion rate” indicator, which ranked it in second place. Becauseigh soil erosion over time jeopardizes profitable cultivation, this
ndicator was of particular importance. Next in the ranking werepercolation water rate,” with a vector of 0.1826, and “nitrate leach-ng,” with a vector of 0.1736. The significance of these indicators
as considered to be almost equal for achieving the mission state-ent. Compared to the “yield level,” however, they were of minor
mportance.Results of step 3: The impact and cultivation of crop rotations
ver a period of 30 years were simulated using the models USLE,IELDSTAT and HERMES, and the results of periods 2015, 2025nd 2035 were assessed. A total of 652,800 individual results for
indicators were created for 13,600 grid cells, 4 crop rotationsnd 3 periods. Table 6 shows the simulation results (bix,y) for theear 2025 in tabular form as an example of one of the 13,600rid cells. The comparison of results for the “energy yield” indi-ator emphasized the great significance of crop rotation R3. Withpproximately 295 GJ h−1 a−1, this rotation provided three timess much energy as the other three crop rotations. However, R3cored poorly in the comparison of results in terms of “erosionate.” With approximately 2 t ha−1 a−1, a higher erosion rate wasxpected compared to the cultivation of the other three crop rota-ions. The results of the “nitrate leaching” indicator demonstratedonsiderable differences among crop rotations. Whereas R2, R3 and4 exhibited tolerable N quantities of <80 kg N ha−1 a−1, a muchigher N loss of approximately 160 kg N ha−1 a−1 can be expected
or crop rotation R1. The results of the “percolation water rate”ndicator demonstrated no considerable differences among cropotations. The results for each of the rotations were approximately00 mm ha−1 a−1.
Results of step 4: Local priority vectors of crop rotations (Six,y)or individual grid cells were derived on a yearly basis from thentermediate results. Table 6 provides an example of one of the3,600 grid cells simulated for 2025.
Results of step 5: The results of steps 3 and 4 were aggregatedo form global priority vectors of crop rotations (G) by employingormula 3. As a result, a time-related ranking of crop rotations was
rawn up for each of the 13,600 grid cells with regard to the mis-ion statement. Table 6 depicts the global priority vectors of cropotation and the resulting ranking for one of the 13,600 grid cellsnalyzed for 2025.ators 45 (2014) 110–122 117
Although a ranking could have been created, no crop rotationwas distinctive in this example; therefore, no recommendationswere derived. Approximately equal global priority vectors weredetermined for crop rotations R2 (G = 0.2733), R3 (G = 0.2640) andR4 (G = 0.2854), with crop rotation R1 differing from the otherswith G = 0.1773 (4th position). It can therefore be concluded thatcrop rotations R2, R3 and R4 are similarly suitable for meeting theobjectives defined in the mission statement “Sustainable BioenergyRegion.”
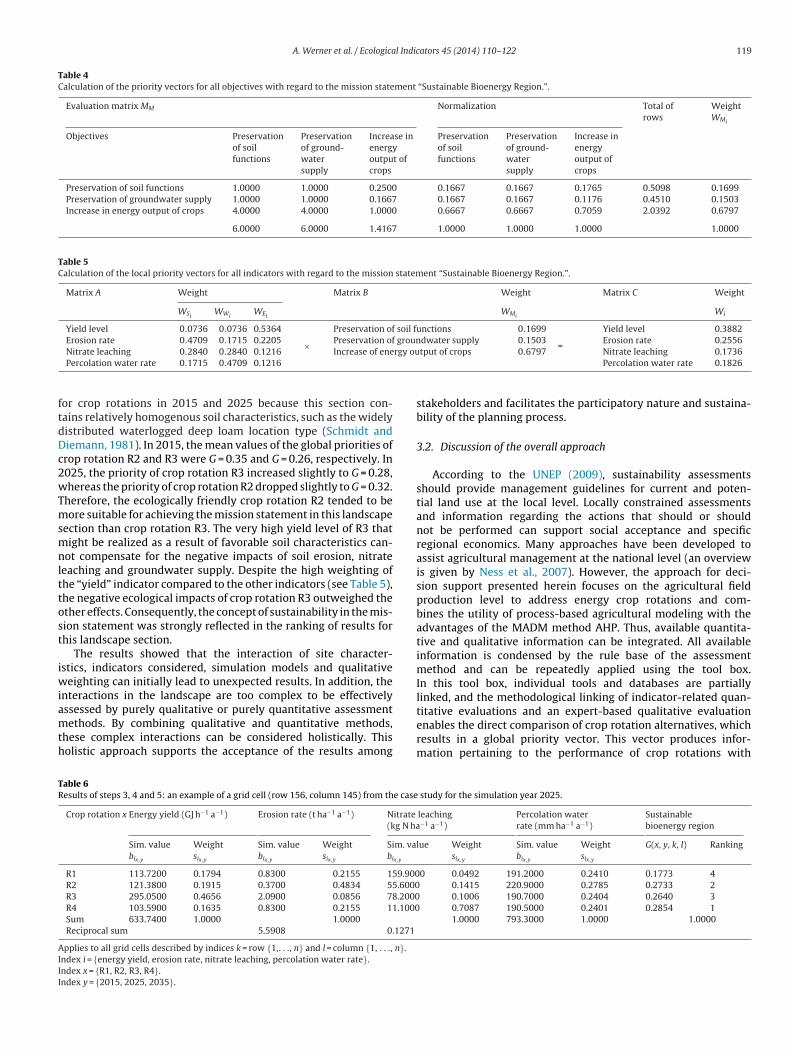
Grid-specific analyses in both tabular and graphical form arefeasible for presenting the results of the entire region under inves-tigation. In Fig. 5, the results of all crop rotations for periods 2015and 2025 are statistically assessed and compared and the croprotation-specific global priority vectors and their absolute areasrelated to the farmable area of the region under investigation areshown (13,600 grid cells with 25 m × 25 m). In addition to show-ing the ranking result (Table 6), the diagrams provide informationabout the statistical distribution of the global priority vectors. Onlythe visualization of results can reveal whether large areas are equiv-alent to large contiguous areas. For a direct temporal comparison ofthe area-related distribution of global priority vectors, the resultsfor 2015 and 2025 were superposed.
The first striking aspect of the graphical reprocessing of theresults was that crop rotation R1 exhibited a considerably lowerdistribution of areas across the global priority vector scale from0.18 to 0.41 compared to the other three crop rotations. With 440 hain 2015 and 580 ha in 2025, a majority of the examined grid cellsachieved a global priority vector of 0.19 in R1, with no significantincrease or decrease over time. This average global priority vectorvalue was far lower than that found for the other crop rotations.
Crop rotation R2 had a completely different effect, and its areaswere spread across the global priority vector scale. Clear focal areaswere observed in both 2015 and 2025, but over the course of thesimulation period, the average vector value indicated the potentialeffectiveness of R2. Averaged over all of the investigated grid cells,the global priority vector of R2 was 0.29 and 0.30 in 2015 and 2025,respectively.
Crop rotation R3 yielded a similar result (global priority vectorof 0.28 and 0.29 in 2015 and 2025, respectively). Three key areasemerged in which the majority of the examined grid cells exhibitedthe same global priority vector. Unlike crop rotation R2, however,the key areas exhibited relatively high global priority vectors.
The statistical analysis of crop rotation R4 revealed the emer-gence of a key area over time. With an area of 580 ha, a clearmajority of the grid cells examined achieved a global priority vec-tor of 0.25 in 2025. A large area exhibited average suitability forachieving the mission statement.
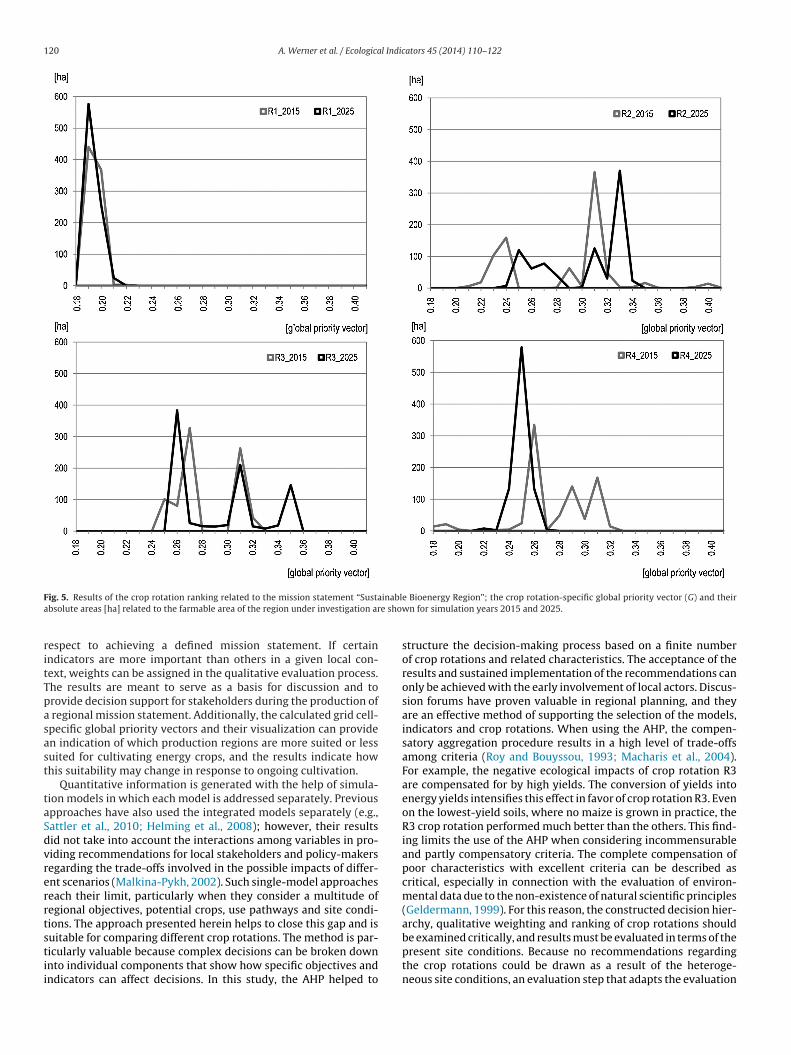
In Fig. 6, the final results for crop rotations R2 and R3 generatedusing Quantum GIS 1.6.0® are compiled for the years 2015 and 2025.Global priority vectors were produced for each crop rotation andeach of the 13,600 grid cells. The color scale in the interval [0.0; 0.5]indicates the suitability of crop rotations R2 and R3 for achieving themission statement “Sustainable Bioenergy Region.” Building on thestatistical analysis, the visualization of the results provided insightsinto their spatial distribution. Finally, larger contiguous productionregions became discernible.
Figs. 5 and 6 reveal a heterogeneous picture. Initially, no clearrecommendation could be made for any of the crop rotationsin the region under investigation. In addition, the grid-specificglobal priority vectors changed during the periods because ofthe heterogeneous site conditions of the region. For this reason,specific cultivation recommendations could only be derived by
analyzing the landscape sections, which revealed a comparativelyhomogenous pattern of results. The landscape section (dotted line)delineated in Fig. 6 was analyzed as an example. In this case,a comparatively homogenous pattern of results was discernible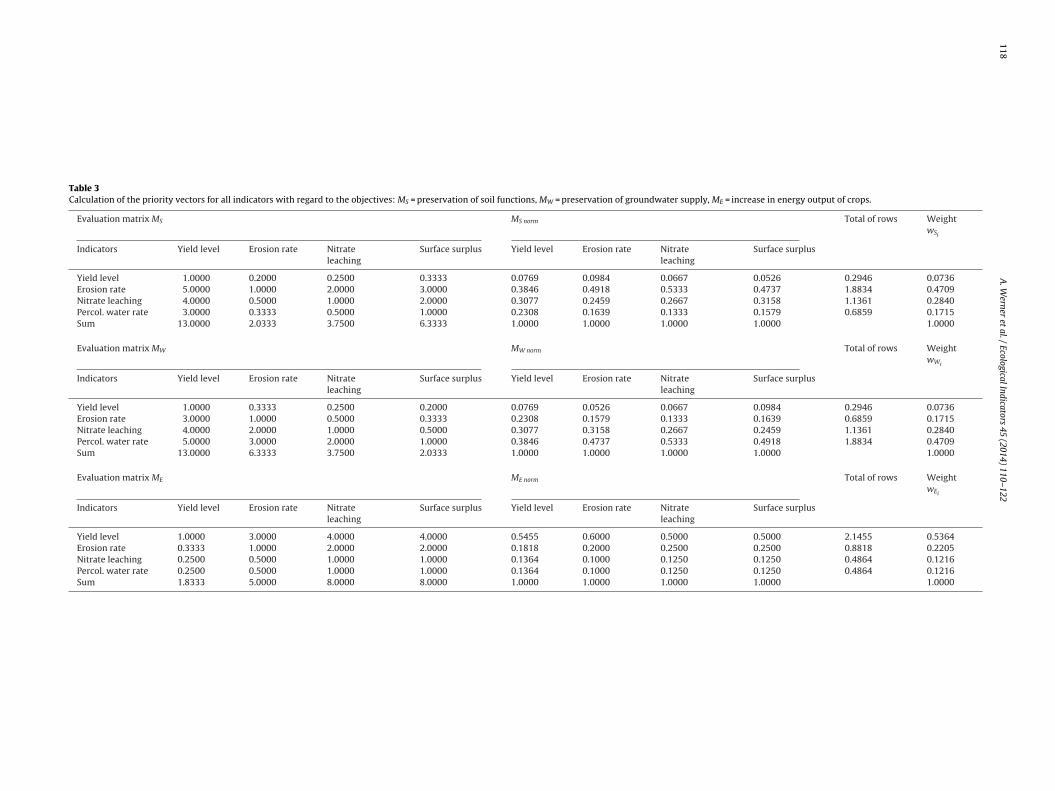
118
A.
Werner
et al.
/ Ecological
Indicators 45
(2014) 110–122
Table 3Calculation of the priority vectors for all indicators with regard to the objectives: MS = preservation of soil functions, MW = preservation of groundwater supply, ME = increase in energy output of crops.
Evaluation matrix MS MS norm Total of rows WeightwSi
Indicators Yield level Erosion rate Nitrateleaching
Surface surplus Yield level Erosion rate Nitrateleaching
Surface surplus
Yield level 1.0000 0.2000 0.2500 0.3333 0.0769 0.0984 0.0667 0.0526 0.2946 0.0736Erosion rate 5.0000 1.0000 2.0000 3.0000 0.3846 0.4918 0.5333 0.4737 1.8834 0.4709Nitrate leaching 4.0000 0.5000 1.0000 2.0000 0.3077 0.2459 0.2667 0.3158 1.1361 0.2840Percol. water rate 3.0000 0.3333 0.5000 1.0000 0.2308 0.1639 0.1333 0.1579 0.6859 0.1715Sum 13.0000 2.0333 3.7500 6.3333 1.0000 1.0000 1.0000 1.0000 1.0000
Evaluation matrix MW MW norm Total of rows WeightwWi
Indicators Yield level Erosion rate Nitrateleaching
Surface surplus Yield level Erosion rate Nitrateleaching
Surface surplus
Yield level 1.0000 0.3333 0.2500 0.2000 0.0769 0.0526 0.0667 0.0984 0.2946 0.0736Erosion rate 3.0000 1.0000 0.5000 0.3333 0.2308 0.1579 0.1333 0.1639 0.6859 0.1715Nitrate leaching 4.0000 2.0000 1.0000 0.5000 0.3077 0.3158 0.2667 0.2459 1.1361 0.2840Percol. water rate 5.0000 3.0000 2.0000 1.0000 0.3846 0.4737 0.5333 0.4918 1.8834 0.4709Sum 13.0000 6.3333 3.7500 2.0333 1.0000 1.0000 1.0000 1.0000 1.0000
Evaluation matrix ME ME norm Total of rows WeightwEi
Indicators Yield level Erosion rate Nitrateleaching
Surface surplus Yield level Erosion rate Nitrateleaching
Surface surplus
Yield level 1.0000 3.0000 4.0000 4.0000 0.5455 0.6000 0.5000 0.5000 2.1455 0.5364Erosion rate 0.3333 1.0000 2.0000 2.0000 0.1818 0.2000 0.2500 0.2500 0.8818 0.2205Nitrate leaching 0.2500 0.5000 1.0000 1.0000 0.1364 0.1000 0.1250 0.1250 0.4864 0.1216Percol. water rate 0.2500 0.5000 1.0000 1.0000 0.1364 0.1000 0.1250 0.1250 0.4864 0.1216Sum 1.8333 5.0000 8.0000 8.0000 1.0000 1.0000 1.0000 1.0000 1.0000
A. Werner et al. / Ecological Indicators 45 (2014) 110–122 119
Table 4Calculation of the priority vectors for all objectives with regard to the mission statement “Sustainable Bioenergy Region.”.
Evaluation matrix MM Normalization Total ofrows
WeightWMi
Objectives Preservationof soilfunctions
Preservationof ground-watersupply
Increase inenergyoutput ofcrops
Preservationof soilfunctions
Preservationof ground-watersupply
Increase inenergyoutput ofcrops
Preservation of soil functions 1.0000 1.0000 0.2500 0.1667 0.1667 0.1765 0.5098 0.1699Preservation of groundwater supply 1.0000 1.0000 0.1667 0.1667 0.1667 0.1176 0.4510 0.1503Increase in energy output of crops 4.0000 4.0000 1.0000 0.6667 0.6667 0.7059 2.0392 0.6797
6.0000 6.0000 1.4167 1.0000 1.0000 1.0000 1.0000
Table 5Calculation of the local priority vectors for all indicators with regard to the mission statement “Sustainable Bioenergy Region.”.
Matrix A Weight Matrix B Weight Matrix C Weight
WSiWWi
WEiWMi
Wi
Yield level 0.0736 0.0736 0.5364 Preservation of soil functions 0.1699 Yield level 0.3882Erosion rate 0.4709 0.1715 0.2205 Preservation of groundwater supply 0.1503 Erosion rate 0.2556
rgy ou
ftdDc2wTmsmnlttost
iwiamth
TR
AIII
×Nitrate leaching 0.2840 0.2840 0.1216 Increase of enePercolation water rate 0.1715 0.4709 0.1216
or crop rotations in 2015 and 2025 because this section con-ains relatively homogenous soil characteristics, such as the widelyistributed waterlogged deep loam location type (Schmidt andiemann, 1981). In 2015, the mean values of the global priorities ofrop rotation R2 and R3 were G = 0.35 and G = 0.26, respectively. In025, the priority of crop rotation R3 increased slightly to G = 0.28,hereas the priority of crop rotation R2 dropped slightly to G = 0.32.
herefore, the ecologically friendly crop rotation R2 tended to beore suitable for achieving the mission statement in this landscape
ection than crop rotation R3. The very high yield level of R3 thatight be realized as a result of favorable soil characteristics can-
ot compensate for the negative impacts of soil erosion, nitrateeaching and groundwater supply. Despite the high weighting ofhe “yield” indicator compared to the other indicators (see Table 5),he negative ecological impacts of crop rotation R3 outweighed thether effects. Consequently, the concept of sustainability in the mis-ion statement was strongly reflected in the ranking of results forhis landscape section.
The results showed that the interaction of site character-stics, indicators considered, simulation models and qualitative
eighting can initially lead to unexpected results. In addition, thenteractions in the landscape are too complex to be effectively
ssessed by purely qualitative or purely quantitative assessmentethods. By combining qualitative and quantitative methods,hese complex interactions can be considered holistically. Thisolistic approach supports the acceptance of the results among
able 6esults of steps 3, 4 and 5: an example of a grid cell (row 156, column 145) from the case
Crop rotation x Energy yield (GJ h−1 a−1) Erosion rate (t ha−1 a−1) Nitrate
(kg N ha
Sim. valuebix,y
Weightsix,y
Sim. valuebix,y
Weightsix,y
Sim. valbix,y
R1 113.7200 0.1794 0.8300 0.2155 159.900R2 121.3800 0.1915 0.3700 0.4834 55.6000R3 295.0500 0.4656 2.0900 0.0856 78.2000R4 103.5900 0.1635 0.8300 0.2155 11.1000Sum 633.7400 1.0000 1.0000
Reciprocal sum 5.5908 0.1271
pplies to all grid cells described by indices k = row {1,. . ., n} and l = column {1, . . ., n}.ndex i = {energy yield, erosion rate, nitrate leaching, percolation water rate}.ndex x = {R1, R2, R3, R4}.ndex y = {2015, 2025, 2035}.
=tput of crops 0.6797 Nitrate leaching 0.1736
Percolation water rate 0.1826
stakeholders and facilitates the participatory nature and sustaina-bility of the planning process.
3.2. Discussion of the overall approach
According to the UNEP (2009), sustainability assessmentsshould provide management guidelines for current and poten-tial land use at the local level. Locally constrained assessmentsand information regarding the actions that should or shouldnot be performed can support social acceptance and specificregional economics. Many approaches have been developed toassist agricultural management at the national level (an overviewis given by Ness et al., 2007). However, the approach for deci-sion support presented herein focuses on the agricultural fieldproduction level to address energy crop rotations and com-bines the utility of process-based agricultural modeling with theadvantages of the MADM method AHP. Thus, available quantita-tive and qualitative information can be integrated. All availableinformation is condensed by the rule base of the assessmentmethod and can be repeatedly applied using the tool box.In this tool box, individual tools and databases are partiallylinked, and the methodological linking of indicator-related quan-
titative evaluations and an expert-based qualitative evaluationenables the direct comparison of crop rotation alternatives, whichresults in a global priority vector. This vector produces infor-mation pertaining to the performance of crop rotations withstudy for the simulation year 2025.
leaching−1 a−1)
Percolation waterrate (mm ha−1 a−1)
Sustainablebioenergy region
ue Weightsix,y
Sim. valuebix,y
Weightsix,y
G(x, y, k, l) Ranking
0 0.0492 191.2000 0.2410 0.1773 4 0.1415 220.9000 0.2785 0.2733 2 0.1006 190.7000 0.2404 0.2640 3 0.7087 190.5000 0.2401 0.2854 1
1.0000 793.3000 1.0000 1.0000
120 A. Werner et al. / Ecological Indicators 45 (2014) 110–122
F inabla e sho
ritTpasast
taSdvrerrtstii
ig. 5. Results of the crop rotation ranking related to the mission statement “Sustabsolute areas [ha] related to the farmable area of the region under investigation ar
espect to achieving a defined mission statement. If certainndicators are more important than others in a given local con-ext, weights can be assigned in the qualitative evaluation process.he results are meant to serve as a basis for discussion and torovide decision support for stakeholders during the production of
regional mission statement. Additionally, the calculated grid cell-pecific global priority vectors and their visualization can providen indication of which production regions are more suited or lessuited for cultivating energy crops, and the results indicate howhis suitability may change in response to ongoing cultivation.
Quantitative information is generated with the help of simula-ion models in which each model is addressed separately. Previouspproaches have also used the integrated models separately (e.g.,attler et al., 2010; Helming et al., 2008); however, their resultsid not take into account the interactions among variables in pro-iding recommendations for local stakeholders and policy-makersegarding the trade-offs involved in the possible impacts of differ-nt scenarios (Malkina-Pykh, 2002). Such single-model approacheseach their limit, particularly when they consider a multitude ofegional objectives, potential crops, use pathways and site condi-ions. The approach presented herein helps to close this gap and is
uitable for comparing different crop rotations. The method is par-icularly valuable because complex decisions can be broken downnto individual components that show how specific objectives andndicators can affect decisions. In this study, the AHP helped toe Bioenergy Region”; the crop rotation-specific global priority vector (G) and theirwn for simulation years 2015 and 2025.
structure the decision-making process based on a finite numberof crop rotations and related characteristics. The acceptance of theresults and sustained implementation of the recommendations canonly be achieved with the early involvement of local actors. Discus-sion forums have proven valuable in regional planning, and theyare an effective method of supporting the selection of the models,indicators and crop rotations. When using the AHP, the compen-satory aggregation procedure results in a high level of trade-offsamong criteria (Roy and Bouyssou, 1993; Macharis et al., 2004).For example, the negative ecological impacts of crop rotation R3are compensated for by high yields. The conversion of yields intoenergy yields intensifies this effect in favor of crop rotation R3. Evenon the lowest-yield soils, where no maize is grown in practice, theR3 crop rotation performed much better than the others. This find-ing limits the use of the AHP when considering incommensurableand partly compensatory criteria. The complete compensation ofpoor characteristics with excellent criteria can be described ascritical, especially in connection with the evaluation of environ-mental data due to the non-existence of natural scientific principles(Geldermann, 1999). For this reason, the constructed decision hier-archy, qualitative weighting and ranking of crop rotations should
be examined critically, and results must be evaluated in terms of thepresent site conditions. Because no recommendations regardingthe crop rotations could be drawn as a result of the heteroge-neous site conditions, an evaluation step that adapts the evaluation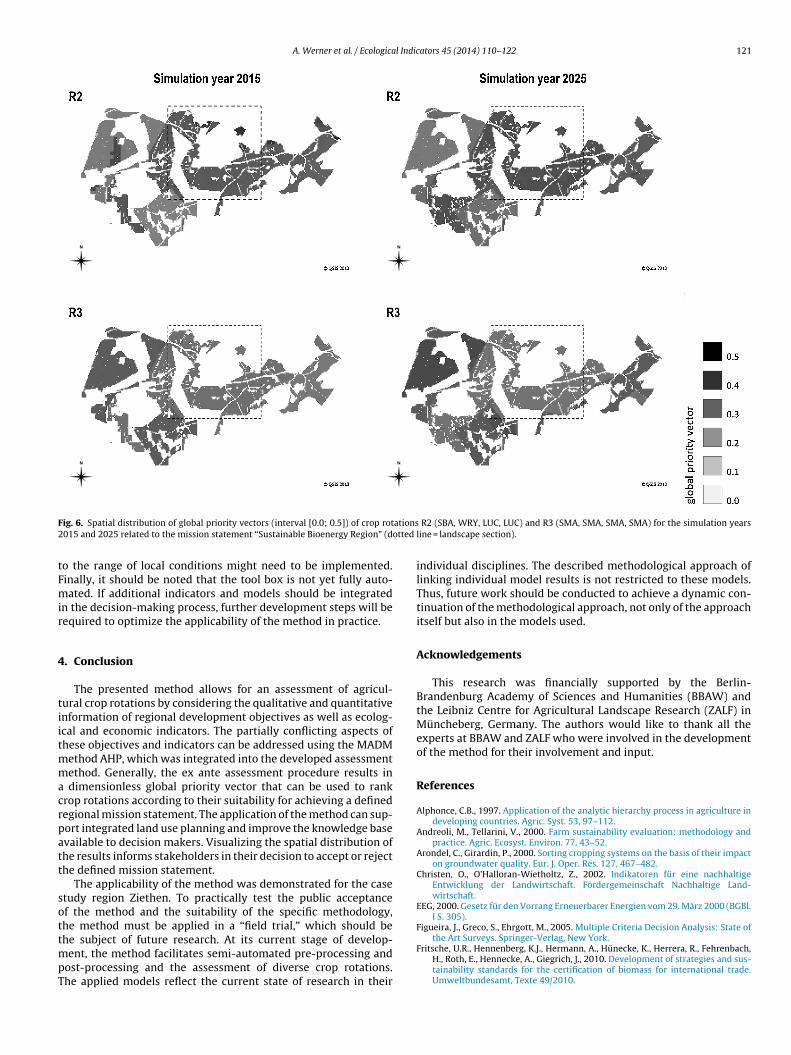
A. Werner et al. / Ecological Indicators 45 (2014) 110–122 121
F ations2 otted
tFmir
4
tiitmmacrpatt
sottmpT
ig. 6. Spatial distribution of global priority vectors (interval [0.0; 0.5]) of crop rot015 and 2025 related to the mission statement “Sustainable Bioenergy Region” (d
o the range of local conditions might need to be implemented.inally, it should be noted that the tool box is not yet fully auto-ated. If additional indicators and models should be integrated
n the decision-making process, further development steps will beequired to optimize the applicability of the method in practice.
. Conclusion
The presented method allows for an assessment of agricul-ural crop rotations by considering the qualitative and quantitativenformation of regional development objectives as well as ecolog-cal and economic indicators. The partially conflicting aspects ofhese objectives and indicators can be addressed using the MADM
ethod AHP, which was integrated into the developed assessmentethod. Generally, the ex ante assessment procedure results in
dimensionless global priority vector that can be used to rankrop rotations according to their suitability for achieving a definedegional mission statement. The application of the method can sup-ort integrated land use planning and improve the knowledge basevailable to decision makers. Visualizing the spatial distribution ofhe results informs stakeholders in their decision to accept or rejecthe defined mission statement.
The applicability of the method was demonstrated for the casetudy region Ziethen. To practically test the public acceptancef the method and the suitability of the specific methodology,he method must be applied in a “field trial,” which should be
he subject of future research. At its current stage of develop-ent, the method facilitates semi-automated pre-processing andost-processing and the assessment of diverse crop rotations.he applied models reflect the current state of research in their
R2 (SBA, WRY, LUC, LUC) and R3 (SMA, SMA, SMA, SMA) for the simulation yearsline = landscape section).
individual disciplines. The described methodological approach oflinking individual model results is not restricted to these models.Thus, future work should be conducted to achieve a dynamic con-tinuation of the methodological approach, not only of the approachitself but also in the models used.
Acknowledgements
This research was financially supported by the Berlin-Brandenburg Academy of Sciences and Humanities (BBAW) andthe Leibniz Centre for Agricultural Landscape Research (ZALF) inMüncheberg, Germany. The authors would like to thank all theexperts at BBAW and ZALF who were involved in the developmentof the method for their involvement and input.
References
Alphonce, C.B., 1997. Application of the analytic hierarchy process in agriculture indeveloping countries. Agric. Syst. 53, 97–112.
Andreoli, M., Tellarini, V., 2000. Farm sustainability evaluation: methodology andpractice. Agric. Ecosyst. Environ. 77, 43–52.
Arondel, C., Girardin, P., 2000. Sorting cropping systems on the basis of their impacton groundwater quality. Eur. J. Oper. Res. 127, 467–482.
Christen, O., O’Halloran-Wietholtz, Z., 2002. Indikatoren für eine nachhaltigeEntwicklung der Landwirtschaft. Fördergemeinschaft Nachhaltige Land-wirtschaft.
EEG, 2000. Gesetz für den Vorrang Erneuerbarer Energien vom 29. März 2000 (BGBl.I S. 305).
Figueira, J., Greco, S., Ehrgott, M., 2005. Multiple Criteria Decision Analysis: State of
the Art Surveys. Springer-Verlag, New York.Fritsche, U.R., Hennenberg, K.J., Hermann, A., Hünecke, K., Herrera, R., Fehrenbach,H., Roth, E., Hennecke, A., Giegrich, J., 2010. Development of strategies and sus-tainability standards for the certification of biomass for international trade.Umweltbundesamt, Texte 49/2010.
1 l Indic
G
H
H
H
H
J
JK
K
K
L
L
L
M
M
M
M
M
M
M
M
M
N
P
P
22 A. Werner et al. / Ecologica
eldermann, J., 1999. Entwicklung eines multikriteriellen Entscheidungsunter-stützungssystems zur integrierten Technikbewertung. Fortschritt-Berichte VDIReihe 16, Bd. 105, VDI Verlag, Düsseldorf.
aedrich, G., Kuß, A., Kreilkamp, E., 1986. Der Analytic Hierarchy Process.Wirtschaftswissenschaftliches Studium 3 (1986), 120–126.
arker, P.T., Vargas, L.G., 1987. The theory of ratio scale estimation: Saaty’s analytichierarchy process. Manage. Sci. 33 (11), 1383–1403.
wang, C.L., Yoon, K.L., 1981. Multiple Attribute Decision Making: Methods andApplication. Springer-Verlag, New York.
elming, K., Pérez-Sorba, M., Tabbush, P., 2008. Sustainable Impact Assessment ofLand Use Changes. Springer-Verlag, Berlin, Heidelberg, New York.
ordan, N., Boody, G., Broussard, W., Glover, J.D., Keeney, D., McCown, B.H., McIsaac,G., Muller, M., Murray, H., Neal, J., Pansing, C., Turner, R.E., Warner, K., Wyse, D.,2007. Environment: sustainable development of the agricultural bio-economy.Science 316, 1570–1571.
ulius Kühn-Institut, 2001. http://pub.jki.bund.de/index.php/BBCH/issue/view/161ersebaum, K.C., 2007. Modelling nitrogen dynamics in soil–crop systems with HER-
MES. Nutr. Cycl. Agroecosyst. 77, 39–52.ersebaum, K.C., Matzdorf, B., Kiesel, J., Piorr, A., Steidl, J., 2006. Model-based eval-
uation of agro-environmental measures in the federal state of Brandenburg(Germany) concerning N pollution of groundwater and surface water. J. PlantNutr. Soil Sci. 169, 352–359.
TBL, 2012. Energiepflanzen – Daten für die Planung im Energiepflanzenanbau.Kuratorium für Technik und Bauwesen in der Landwirtschaft, Darmstadt, 2.Auflage.
utze, G., Schultz, A., Wenkel, K.O., 2006a. Landschaften beobachten, nutzenund schützen. Landschaftsökologische Langzeit-Studie in der AgrarlandschaftChorin 1992–2006. Leibniz-Zentrum für Agrarlandschaftsforschung (ZALF) e.V.,B.G. Teubner Verlag, Wiesbaden.
utze, G., Schultz, A., Luzi, K., 2006b. Dynamik des Bodenzustandes und desNährstoffstatus in der Ziethener Moränenlandschaft. In: Lutze, G., Schultz, A.,Wenkel, K.O. (Eds.), Landschaften beobachten, nutzen und schützen. Teubner,Wiesbaden, pp. 89–105.
utze, G., Luzi, K., Haberstock, W., Wenkel, K.-O., 2006c. Wandel der land-wirtschaftlichen Anbaustruktur unter dem Einfluss sich ändernderagrarökonomischer und gesellschaftlicher Verhältnisse. In: Lutze, G., Schultz, A.,Wenkel, K.O. (Eds.), Landschaften beobachten, nutzen und schützen. Teubner,Wiesbaden, pp. 117–130.
acharis, C., Springael, J., De Brucker, K., Verbeke, A., 2004. PROMETHEE and AHP:the design of operational synergies in multicriteria analysis. StrengtheningPROMETHEE with ideas of AHP. Eur. J. Oper. Res. 153, 307–317.
alkina-Pykh, I.G., 2002. Integrated assessment models and response function mod-els: pros and cons for sustainable development indices design. Ecol. Indic. 2(1–2), 93–108.
azzetto, F., Bonera, R., 2003. MEACROS: a tool for multi-criteria evaluation ofalternative cropping systems. Eur. J. Agron. 18, 379–387.
cBride, A.C., Dale, V.H., Baskaran, L.M., Downing, M.E., Eaton, L.M., Efroymson, R.A.,Garten Jr., C.T., Kline, K.L., Jager, H.I., Mulholland, P.J., Parish, E.S., Schweizer, P.E.,Storey, J.M., 2011. Indicators to support environmental sustainability of energysystems. Ecol. Indic. 11, 1277–1289.
eixner, O., Haas, R., 2002. Computergestütze Entscheidungsfindung. Expert Choiceund AHP – innovative Werkzeuge zur Lösung komplexer Probleme. Frank-furt/Wien 2002.
irschel, W., Wenkel, K.-O., Wieland, R., Albert, E., Köstner, B., 2009. YIELDSTAT - einModell zur regionalen Ertragsschätzung. In: Kage, H., Kersebaum, K.-C., Müller,T. (Eds.), Modellierung des Systems Nutzpflanze-Boden - Herausforderungendes 21. Jahrhunderts: Kurzfassungen der Beiträge zum Workshop am 26. und27. Februar 2009 in Kiel: 43-47; Göttingen (Gesellschaft für Pflanzenbauwis-senschaften).
irschel, W., Lutze, G., Schultz, A., Luzi, K., 2006a. Klima und Wetter in der Agrar-landschaft Chorin - gestern, heute, morgen. In: Lutze, G., Schultz, A., Wenkel,K.O. (Eds.), Landschaften beobachten, nutzen und schützen. Teubner Verlag,Wiesbaden, pp. 49–59.
irschel, W., Wieland, R., Voss, M., Ajibefun, I., Deumlich, D., 2006b. Spatial Analysisand Modeling Tool (SAMT): 2. Applications. Ecol. Inform. 1, 77–85.
unda, G., Nijkamp, P., Rietveld, P., 1995. Qualitative multicriteria methods for fuzzyevaluation problems: an illustration of economic-ecological evaluation. Eur. J.Oper. Res. 82, 79–97.
ess, B., Urbelpiirsalu, E., Anderberg, S., Olsson, L., 2007. Categorising tools for sus-tainability assessment. Ecol. Econ. 60 (3), 498–508.
acini, C., Wossink, A., Giesen, G., Vazzana, C., Huirne, R., 2003. Evaluation of sus-tainability of organic, integrated and conventional farming systems: a farm andfield-scale analysis. Agric. Ecosyst. Environ. 95, 273–288.
ark, J., Seaton, R.A.F., 1996. Integrative research and sustainable agriculture. Agric.Syst. 50, 81–100.
ators 45 (2014) 110–122
Van Ittersum, M.K., Ewert, F., Heckelei, T., Wery, J., Alkan Olsson, J., Andersen, E.,Bezlepkina, I., Brouwer, F., Donatelli, M., Flichman, G., Olsson, L., Rizzoli, A.,van der Wal, T., Wien, J.-E., Wolf, J., 2008. Integrated assessment of agriculturalsystems- a component based framework for the European Union (SEAMLESS).Agric. Syst. 96, 150–165.
Renard, K.G., Foster, G.R., Weesies, G.A., McCool, D.K., Yoder, D.C., 1997. Predict-ing Soil Erosion by Water: A Guide to Conservation Planning with the RevisedUniversal Soil Loss Equation (RUSLE), vol. 703. United States Department ofAgriculture (USDA), Washington, DC.
Roy, B., 1968. Classement et choix en présence de points de vue multiples (la méth-ode Électre). Rev. Fr. Informatique Recherche Opérationnelle 8, 57–75.
Roy, B., Bouyssou, D., 1993. Aide multicritère à la décision: Méthodes et cas. Eco-nomica, Paris.
Saaty, T.L., 1980. The analytic hierarchy process. McGraw-Hill, New York.Sadok, W., Angevin, F., Bergez, J.-É., Bockstaller, C., Colomb, B., Guichard, L., Reau, R.,
Dor′e, T., 2008. Ex ante assessment of the sustainability of alternative croppingsystems: implications for using multi-criteria decision-aid methods. A review,Agron. Sustain. Dev. 28, 163–174.
Sattler, C., Nagel, U.J., Werner, A., Zander, P., 2010. Integrated assessment of agricul-tural production practices to enhance sustainable development in agriculturallandscapes. Ecol. Indic. 10, 49–61.
Schmidt, R., Diemann, M., 1981. Erläuterungen zur Mittelmaßstäbigen Land-wirtschaftlichen Standortkartierung (MMK). Landwirtschaftsverlag, Leipzig.
Schmoldt, D.L., Kangas, J., Mendoza, G.A. (Eds.), 2001. The Analytic Hierarchy Pro-cess in Natural Resource and Environmental Decision Making. Kluwer AcademicPublishers, London.
Shrestha, R.K., Alavalapati, J.R.R., Kalmbacher, R.S., 2004. Exploring the potentialfor silvopasture adoption in South-central Florida: an application of SWOT-AHPmethod. Agric. Syst. 81, 185–199.
Sieber, S., Müller, K., Helming, K., Tscherning, K., 2008. In: Wüstemann, H., Mann,S., Müller, K. (Eds.), Nachhaltigkeitsabschätzung mittels des Metamodells SIAT.Multifunktionalität–Von der Wohlfahrtsökonomie zu neuen Ufern. ökom Ver-lag, Munich, pp. 109–150.
Spekat, A., Enke, W., Kreienkamp, F., 2007. Neuentwicklung von regionalhoch aufgelösten Wetterlagen für Deutschland und Bereitstellung regionalerKlimaszenarios auf der Basis von globalen Klimasimulationen mit dem Region-alisierungsmodell WETTREG auf der Basis von globalen Klimasimulationen mitECHAM5/MPI-OM T63L31 2010 bis 2100 für die SRES-Szenarios B1, A1B und A2.Umweltbundesamt, Endbericht, Dessau.
Sulser, T.B., Duryea, M.L., Frolich, L.M., 2001. A field practical approach for assessingbiophysical sustainability of alternative agricultural systems. Agric. Syst. 68,113–135.
UNEP, 2009. Towards sustainable production and use of resources: assessingbiofuels. International Panel for Sustainable Resource Management.United Nations Environment Programme. Division of Technology Indus-try and Economics 15 rue de Milan, 75441 Paris Cedex 09, Francehttp://www.unep.fr/scp/rpanel/pdf/assessing biofuels full report.pdf
Walz, R., Block, N., Eichhammer, W., Hiessl, H., Nathani, C., Ostertag, K., Schön,M., Herrchen, M., Keller, D., Köwener, D., Rennings, K., Rosemann, M., 1997.Grundlagen für ein nationales Umweltindikatorensystem: Weiterentwicklungvon Indikatorensystemen für die Umweltberichterstattung. Forschungsbericht101 05 016. UBA-Texte 37/97. Berlin.
Werner, A., Ende, H.-P., Wiggering, H., 2008. Strukturen, Strukturwandel undEntwicklungsdynamiken im Nordosten Deutschlands. Kapitel 1. In: Hüttl, R.F.,Bens, O., Plieninger, T. (Eds.), Zur Zukunft ländlicher Räume - Entwicklungen undInnovationen in peripheren Regionen Nordostdeutschlands. Akademie Verlag,Berlin, pp. 15–24.
Wieland, R., Voss, M., Holtmann, X., Mirschel, W., Ajibefun, I., 2006. Spatial Analy-sis and Modeling Tool (SAMT): 1. Structure and possibilities. Ecol. Inform. (1),67–76.
Williams, P.R.D., Inman, D., Aden, A., Heath, G.A., 2009. Environmental and sustaina-bility factors associated with next-generation biofuels in the U.S.: what do wereally know? Environ. Sci. Technol. 43, 4763–4775.
Wiggering, H., Ende, H.-P., Knierim, A., Pintar, M., 2010. Editorial. In: Innovations inEuropean Rural Landscapes. Springer-Verlag, Berlin Heidelberg, pp. 1–10.
Wiggering, H., Ende, H.-P., 2010. Zero emissions region north-easternBrandenburg–between climate adaptation and challenges for innovativeland use. In: Innovations in European Rural Landscapes. Springer-Verlag, BerlinHeidelberg, pp. 115–135.
Zanakis, S.H., Solomon, A., Wishart, N., Dublish, S., 1998. Multi-attribute decision
making: a simulation comparison of selection methods, Eur. J. Oper. Res. 107,507–529.Zhang, B., Zhang, Y., Chen, D., White, R.E., Li, Y., 2004. A quantitative evaluationsystem of soil productivity for intensive agriculture in China. Geoderma 123,319–331.
Related Documents