Evolving east Asian river systems reconstructed by trace element and Pb and Nd isotope variations in modern and ancient Red River-Song Hong sediments Peter D. Clift School of Geosciences, University of Aberdeen, Meston Building, Aberdeen AB24 3UE, United Kingdom ([email protected]) DFG-Research Centre Ocean Margins (RCOM) and Geowissenschaften (FB5), Universita ¨t Bremen, Klagenfurter Strasse, D-28359 Bremen, Germany Hoang Van Long School of Geosciences, University of Aberdeen, Meston Building, Aberdeen AB24 3UE, United Kingdom Richard Hinton Edinburgh Ion Microprobe Facility (EIMF), Department of Geology and Geophysics, University of Edinburgh, West Mains Road, Edinburgh EH9 3JW, United Kingdom Robert M. Ellam Scottish Universities Environmental Research Centre, Rankine Avenue, Glasgow G75 0QF, United Kingdom Robyn Hannigan Department of Chemistry and Physics, Arkansas State University, P.O. Box 1847, State University, Arkansas 72467, USA Mai Thanh Tan Hanoi University of Mining and Geology, Dong Ngac, Tu Liem, Hanoi, Vietnam Jerzy Blusztajn Department of Geology and Geophysics, Woods Hole Oceanographic Institution, Woods Hole, Massachusetts 02543, USA Nguyen Anh Duc Vietnam Petroleum Institute, Yen Hoa, Cau Giay, Hanoi, Vietnam [1] Rivers in east Asia have been recognized as having unusual geometries, suggestive of drainage reorganization linked to Tibetan Plateau surface uplift. In this study we applied a series of major and trace element proxies, together with bulk Nd and single K-feldspar grain Pb isotope ion probe isotope analyses, to understand the sediment budget of the modern Red River. We also investigate how this may have evolved during the Cenozoic. We show that while most of the modern sediment is generated by physical erosion in the upper reaches in Yunnan there is significant additional flux from the Song Lo, draining Cathaysia and the SW Yangtze Block. Nd isotope data suggest that 40% of the modern delta sediment comes from the Song Lo. Carbonates in the Song Lo basin make this a major control on the Red River Sr budget. Erosion is not a simple function of monsoon precipitation. Active rock uplift is also required to drive strong erosion. Single grain Pb data show a connection in the Eocene between the middle Yangtze and the Red River, and probably with rivers draining the Songpan Garze terrane. However, the isotope data G 3 G 3 Geochemistry Geophysics Geosystems Published by AGU and the Geochemical Society AN ELECTRONIC JOURNAL OF THE EARTH SCIENCES Geochemistry Geophysics Geosystems Research Letter Volume 9, Number 4 30 April 2008 Q04039, doi:10.1029/2007GC001867 ISSN: 1525-2027 Click Here for Full Articl e Copyright 2008 by the American Geophysical Union 1 of 29

Welcome message from author
This document is posted to help you gain knowledge. Please leave a comment to let me know what you think about it! Share it to your friends and learn new things together.
Transcript
Evolving east Asian river systems reconstructed by traceelement and Pb and Nd isotope variations in modern andancient Red River-Song Hong sediments
Peter D. CliftSchool of Geosciences, University of Aberdeen, Meston Building, Aberdeen AB24 3UE, United Kingdom([email protected])
DFG-Research Centre Ocean Margins (RCOM) and Geowissenschaften (FB5), Universitat Bremen, KlagenfurterStrasse, D-28359 Bremen, Germany
Hoang Van LongSchool of Geosciences, University of Aberdeen, Meston Building, Aberdeen AB24 3UE, United Kingdom
Richard HintonEdinburgh Ion Microprobe Facility (EIMF), Department of Geology and Geophysics, University of Edinburgh, WestMains Road, Edinburgh EH9 3JW, United Kingdom
Robert M. EllamScottish Universities Environmental Research Centre, Rankine Avenue, Glasgow G75 0QF, United Kingdom
Robyn HanniganDepartment of Chemistry and Physics, Arkansas State University, P.O. Box 1847, State University, Arkansas 72467,USA
Mai Thanh TanHanoi University of Mining and Geology, Dong Ngac, Tu Liem, Hanoi, Vietnam
Jerzy BlusztajnDepartment of Geology and Geophysics, Woods Hole Oceanographic Institution, Woods Hole, Massachusetts 02543, USA
Nguyen Anh DucVietnam Petroleum Institute, Yen Hoa, Cau Giay, Hanoi, Vietnam
[1] Rivers in east Asia have been recognized as having unusual geometries, suggestive of drainagereorganization linked to Tibetan Plateau surface uplift. In this study we applied a series of major and traceelement proxies, together with bulk Nd and single K-feldspar grain Pb isotope ion probe isotope analyses,to understand the sediment budget of the modern Red River. We also investigate how this may haveevolved during the Cenozoic. We show that while most of the modern sediment is generated by physicalerosion in the upper reaches in Yunnan there is significant additional flux from the Song Lo, drainingCathaysia and the SW Yangtze Block. Nd isotope data suggest that 40% of the modern delta sedimentcomes from the Song Lo. Carbonates in the Song Lo basin make this a major control on the Red River Srbudget. Erosion is not a simple function of monsoon precipitation. Active rock uplift is also required todrive strong erosion. Single grain Pb data show a connection in the Eocene between the middle Yangtzeand the Red River, and probably with rivers draining the Songpan Garze terrane. However, the isotope data
G3G3GeochemistryGeophysics
Geosystems
Published by AGU and the Geochemical Society
AN ELECTRONIC JOURNAL OF THE EARTH SCIENCES
GeochemistryGeophysics
Geosystems
Research Letter
Volume 9, Number 4
30 April 2008
Q04039, doi:10.1029/2007GC001867
ISSN: 1525-2027
ClickHere
for
FullArticle
Copyright 2008 by the American Geophysical Union 1 of 29
do not support a former connection with the upper Yangtze, Mekong, or Salween rivers. Drainage captureappears to have occurred throughout the Cenozoic, consistent with surface uplift propagating gradually tothe southeast. The middle Yangtze was lost from the Red River prior to 24 Ma, while the connection to theSongpan Garze was cut prior to 12 Ma. The Song Lo joined the Red River after 9 Ma. Bulk sample Pbanalyses have limited provenance use compared to single grain data, and detailed provenance is onlypossible with a matrix of different proxies.
Components: 17,230 words, 16 figures, 5 tables.
Keywords: erosion; isotopes; provenance; rivers.
Index Terms: 1051 Geochemistry: Sedimentary geochemistry; 1039 Geochemistry: Alteration and weathering processes
(3617); 9320 Geographic Location: Asia.
Received 24 October 2007; Revised 15 February 2008; Accepted 18 February 2008; Published 30 April 2008.
Clift, P. D., H. V. Long, R. Hinton, R. M. Ellam, R. Hannigan, M. T. Tan, J. Blusztajn, and N. A. Duc (2008), Evolving east
Asian river systems reconstructed by trace element and Pb and Nd isotope variations in modern and ancient Red River-Song
Hong sediments, Geochem. Geophys. Geosyst., 9, Q04039, doi:10.1029/2007GC001867.
1. Introduction
[2] Although links between changes in the Earth’sclimate and the tectonic evolution of the litho-sphere have been suggested demonstration andquantification of these interactions has yet to beachieved. The uplift of the Tibetan Plateau andintensification of the Asian monsoon system is oneof the most dramatic examples of such interactionsacting on a continental scale [Molnar et al., 1993;Prell and Kutzbach, 1992]. If such models are to betested then independent records of uplift and cli-mate change need to be reconstructed and com-pared. Constraining the paleoaltitude of Tibet ishowever difficult. Some progress has been madeusing improved paleobotanical methods [Spicer etal., 2003], and in analyzing the oxygen isotopecomposition of soil carbonate and rainwater[Garzione et al., 2000] in order to derive morequantitative estimates of limited areas of the plateau.Measuring widespread surface uplift is harder.
[3] However, regional surface uplift changes conti-nental topographic gradients, which in turn influ-ence the evolution of river systems in east Asia. Inparticular, it has been proposed that the Red River(Song Hong) was once the dominant river system ineast Asia, and that much of its headwater drainagehas been lost as a result of Cenozoic drainagereorganization driven by surface uplift in easternTibet [Brookfield, 1998; Clark et al., 2004]. Such aprocess must affect the volume and compositions ofsediments reaching the deltas in east Asia. Thus intheory we might use the sediment record from thesedeltas to date the timing of widespread uplift.
[4] In this paper we present a series of bulksediment and single grain geochemical analysesfrom the modern Red River and from boreholesamples from the Red River delta region (HanoiBasin) in order to assess the degree of sourceheterogeneity in the modern river basin to pin-point the source of the modern river sediment, andto see whether major changes in the drainage haveoccurred in the past. We attempt to resolve thedifferent end-member sources that have supplied,and continue to supply sediment to the Red River.We build on the earlier bulk sediment work of Liuet al. [2007] by sampling the main trunk streamand both minor and major tributaries in order toassess their contributions to the total sediment flux.Each of the samples was analyzed for a series ofmajor and trace elements, and for Sr and Ndisotopes where these data did not already exist. Asubsection of the modern and ancient samples werethen analyzed for Pb isotopes using both bulksediment ICP-MS and by ion microprobe on singleK-feldspar grains. These methods were chosenbecause of their proven effectiveness as prove-nance indicators in numerous modern and ancientcatchments worldwide.
[5] Clift et al. [2006b] used thermochronologicalmeasurements from sand in the Red River delta tosuggest that the bulk of the sand being carried bythe modern river is eroded from those regions inthe upper catchment, mostly in China now experi-encing active rock uplift. This result is consistentwith a mineralogical study of fine-grained sedi-ments from along the course of the main Red River[Liu et al., 2007]. These methods and our analyses
GeochemistryGeophysicsGeosystems G3G3
clift et al.: evolution of east asian river systems 10.1029/2007GC001867
2 of 29
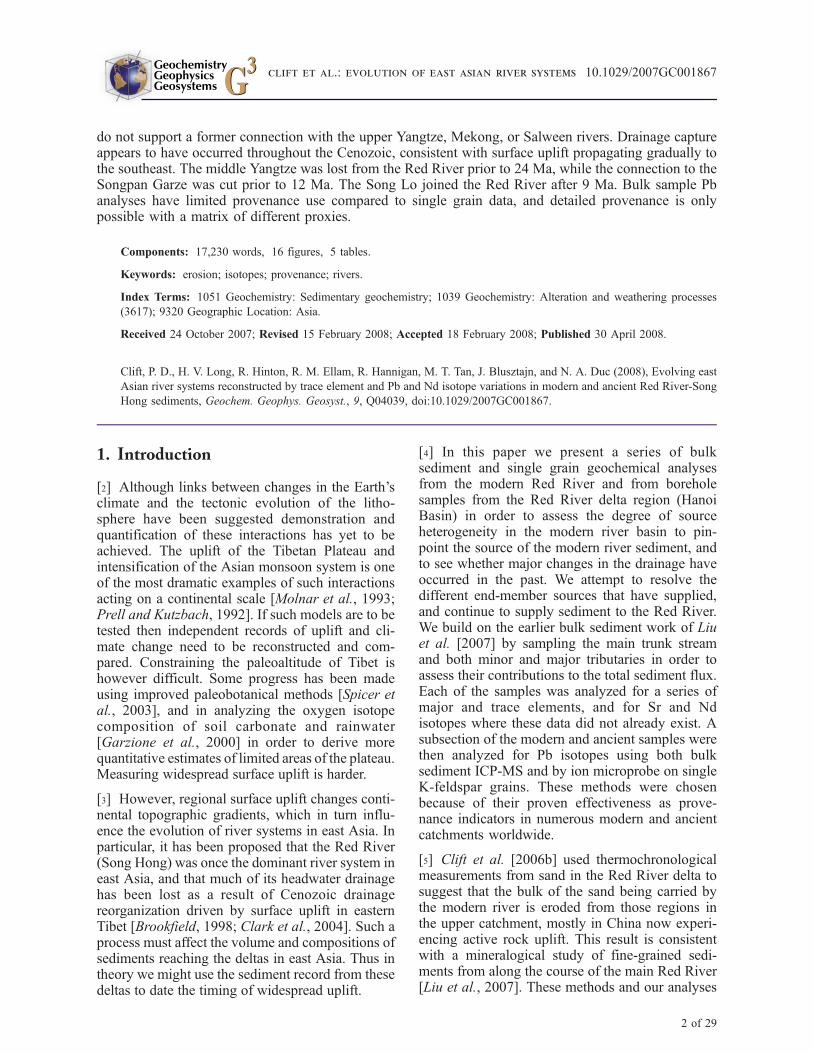
are based on the contrasting bedrock geology of SEAsia and eastern Tibet. Although much of theregion was deformed during the Triassic Indosinianorogeny [Carter et al., 2001; Lepvrier et al., 2004]the region is composed of a series of continentalblocks (Figure 1) whose chemical composition, aswell as timing and intensity of metamorphism ormagmatism differ. These differences are partiallytransferred to the river sediments, allowing theprovenance of the sediment to be reconstructed ifthe appropriate tool is employed.
2. Drainage Capture from the Red River
[6] Evidence exists that the Red River has sufferedmajor loss of headwater drainage. Clark et al.[2004] analyzed the nonsteady state drainage pat-terns in SE Asia to propose a major shift ofheadwater drainage away from the Red River. Cliftet al. [2006a] estimated the volume of sediment inthe Song Hong-Yinggehai Basins, located betweenVietnam and Hainan Island in the South China Sea.These basins are fed by the Red River, but theirvolume is far in excess of what has been erodedonshore in the modern Red River drainage. These
authors also used the Nd isotope system as a prov-enance tool to see how the river sediments changedthrough time. Bulk sediment compositions changedradically up-section throughout the Cenozoic, andachieved Nd isotope compositions close to that ofthe modern river by the Early Miocene, �24 Ma.
[7] While this might suggest that headwater cap-ture principally occurred during the Oligocene,there is evidence for continued capture in the formof significant Nd isotope variation since that timeand a continued mismatch between eroded anddeposited volumes of sediment. Although the di-rection of Nd isotope change is suggestive of lossof the middle Yangtze from the paleo-Red Riverduring the Oligocene [Clift et al., 2006a], thisresult is hard to verify because bulk sedimentanalysis necessarily results in an averaged prove-nance determination and does not allow the influ-ence of minority sources to be constrained.
3. Analytical Strategy
[8] Both coarse and fine-grained lithologies weresampled at a series of river bed sites, mostly in
Figure 1. Simplified tectonic terrane map of east and Southeast Asia showing the major blocks discussed in thispaper [Metcalfe, 1996] and the courses of the rivers colored in blue.
GeochemistryGeophysicsGeosystems G3G3
clift et al.: evolution of east asian river systems 10.1029/2007GC001867clift et al.: evolution of east asian river systems 10.1029/2007GC001867
3 of 29
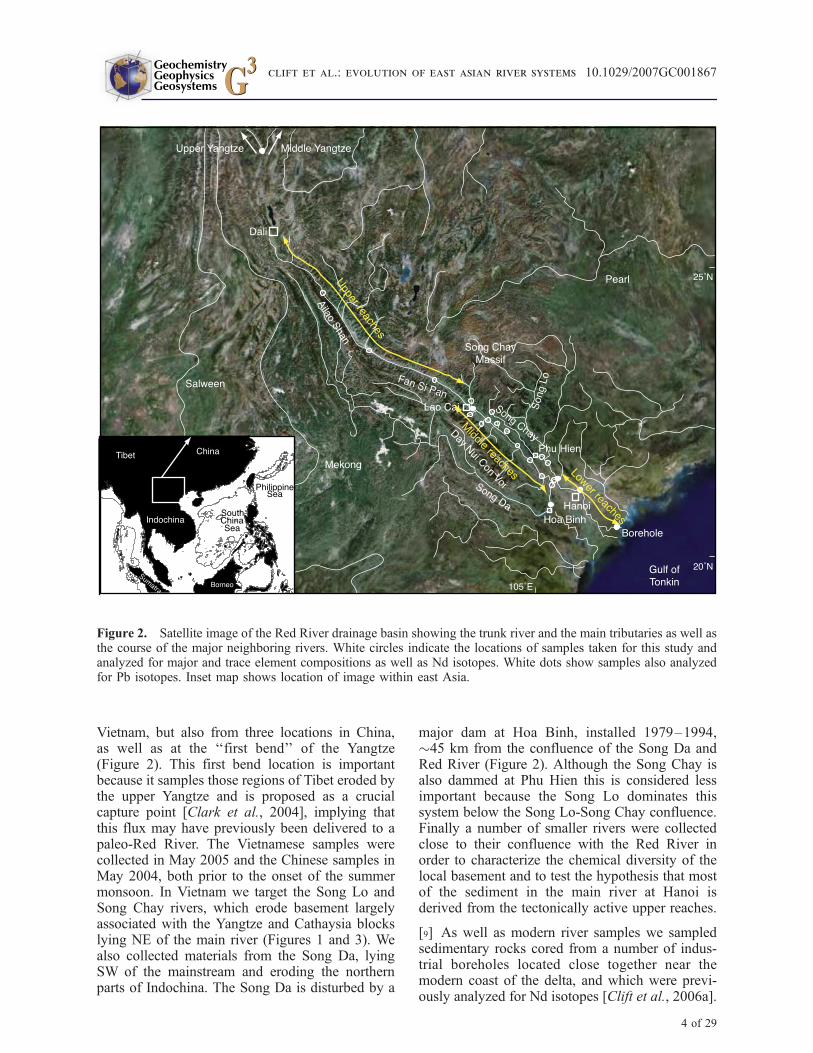
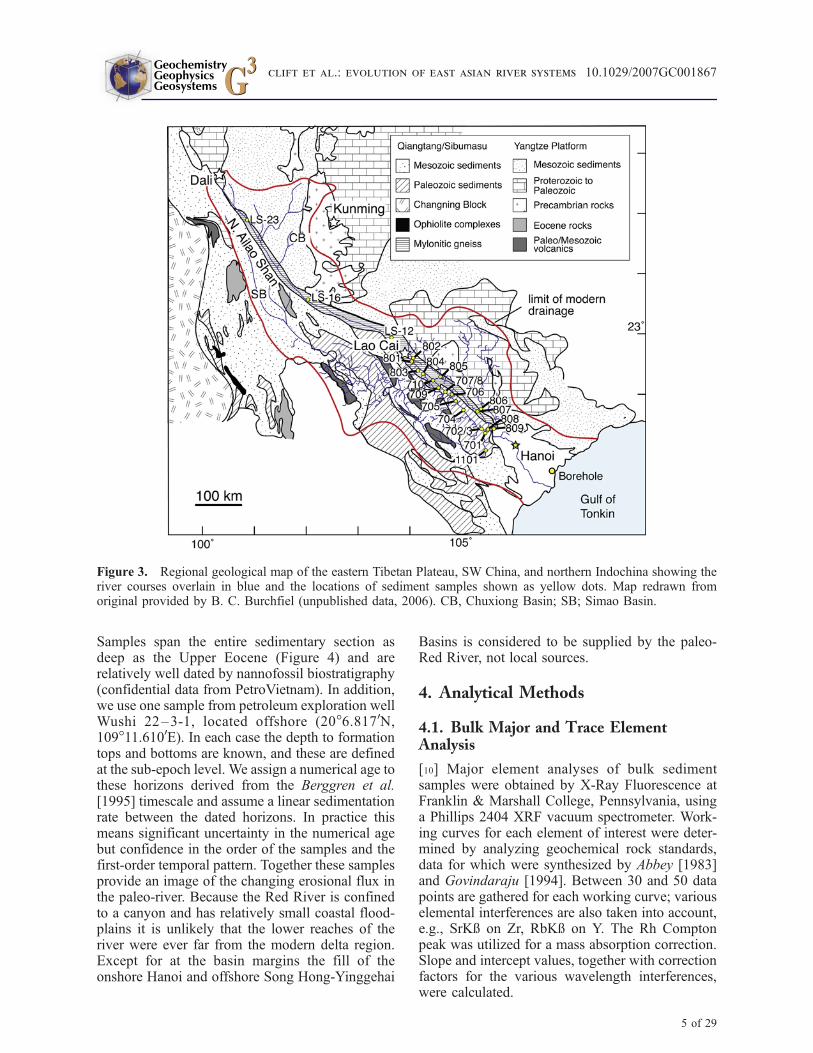
Vietnam, but also from three locations in China,as well as at the ‘‘first bend’’ of the Yangtze(Figure 2). This first bend location is importantbecause it samples those regions of Tibet eroded bythe upper Yangtze and is proposed as a crucialcapture point [Clark et al., 2004], implying thatthis flux may have previously been delivered to apaleo-Red River. The Vietnamese samples werecollected in May 2005 and the Chinese samples inMay 2004, both prior to the onset of the summermonsoon. In Vietnam we target the Song Lo andSong Chay rivers, which erode basement largelyassociated with the Yangtze and Cathaysia blockslying NE of the main river (Figures 1 and 3). Wealso collected materials from the Song Da, lyingSW of the mainstream and eroding the northernparts of Indochina. The Song Da is disturbed by a
major dam at Hoa Binh, installed 1979–1994,�45 km from the confluence of the Song Da andRed River (Figure 2). Although the Song Chay isalso dammed at Phu Hien this is considered lessimportant because the Song Lo dominates thissystem below the Song Lo-Song Chay confluence.Finally a number of smaller rivers were collectedclose to their confluence with the Red River inorder to characterize the chemical diversity of thelocal basement and to test the hypothesis that mostof the sediment in the main river at Hanoi isderived from the tectonically active upper reaches.
[9] As well as modern river samples we sampledsedimentary rocks cored from a number of indus-trial boreholes located close together near themodern coast of the delta, and which were previ-ously analyzed for Nd isotopes [Clift et al., 2006a].
Figure 2. Satellite image of the Red River drainage basin showing the trunk river and the main tributaries as well asthe course of the major neighboring rivers. White circles indicate the locations of samples taken for this study andanalyzed for major and trace element compositions as well as Nd isotopes. White dots show samples also analyzedfor Pb isotopes. Inset map shows location of image within east Asia.
GeochemistryGeophysicsGeosystems G3G3
clift et al.: evolution of east asian river systems 10.1029/2007GC001867
4 of 29
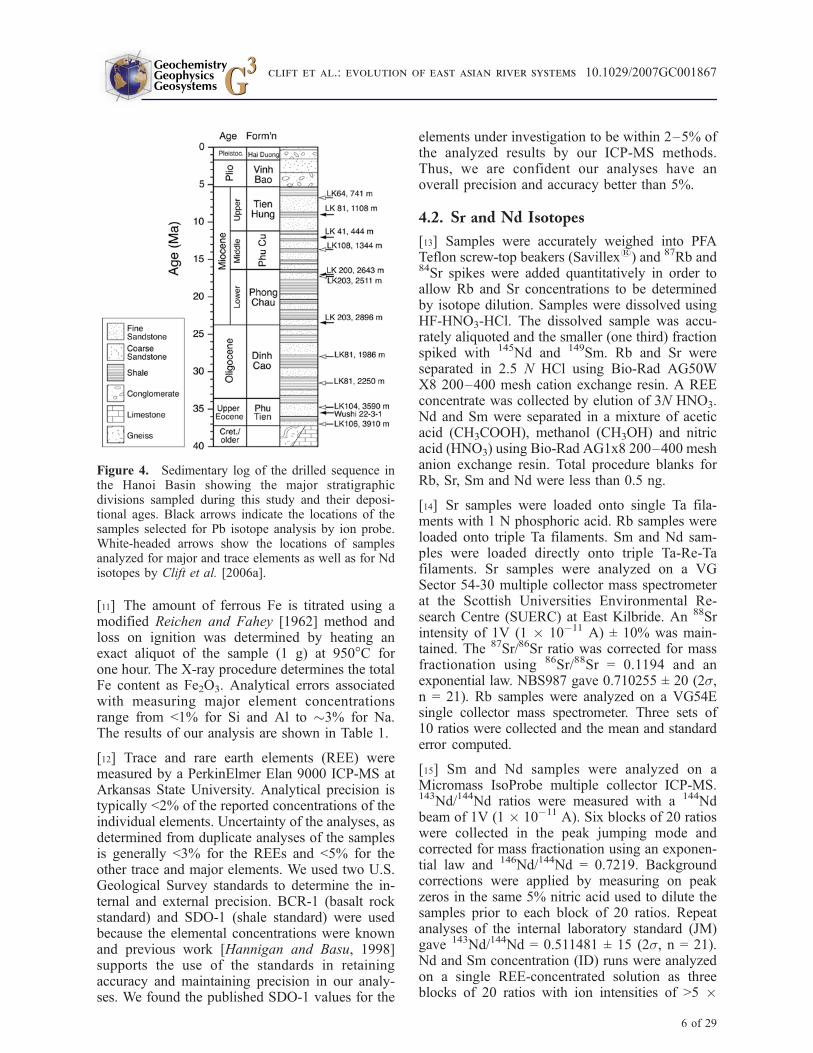
Samples span the entire sedimentary section asdeep as the Upper Eocene (Figure 4) and arerelatively well dated by nannofossil biostratigraphy(confidential data from PetroVietnam). In addition,we use one sample from petroleum exploration wellWushi 22–3-1, located offshore (20�6.8170N,109�11.6100E). In each case the depth to formationtops and bottoms are known, and these are definedat the sub-epoch level. We assign a numerical age tothese horizons derived from the Berggren et al.[1995] timescale and assume a linear sedimentationrate between the dated horizons. In practice thismeans significant uncertainty in the numerical agebut confidence in the order of the samples and thefirst-order temporal pattern. Together these samplesprovide an image of the changing erosional flux inthe paleo-river. Because the Red River is confinedto a canyon and has relatively small coastal flood-plains it is unlikely that the lower reaches of theriver were ever far from the modern delta region.Except for at the basin margins the fill of theonshore Hanoi and offshore Song Hong-Yinggehai
Basins is considered to be supplied by the paleo-Red River, not local sources.
4. Analytical Methods
4.1. Bulk Major and Trace ElementAnalysis
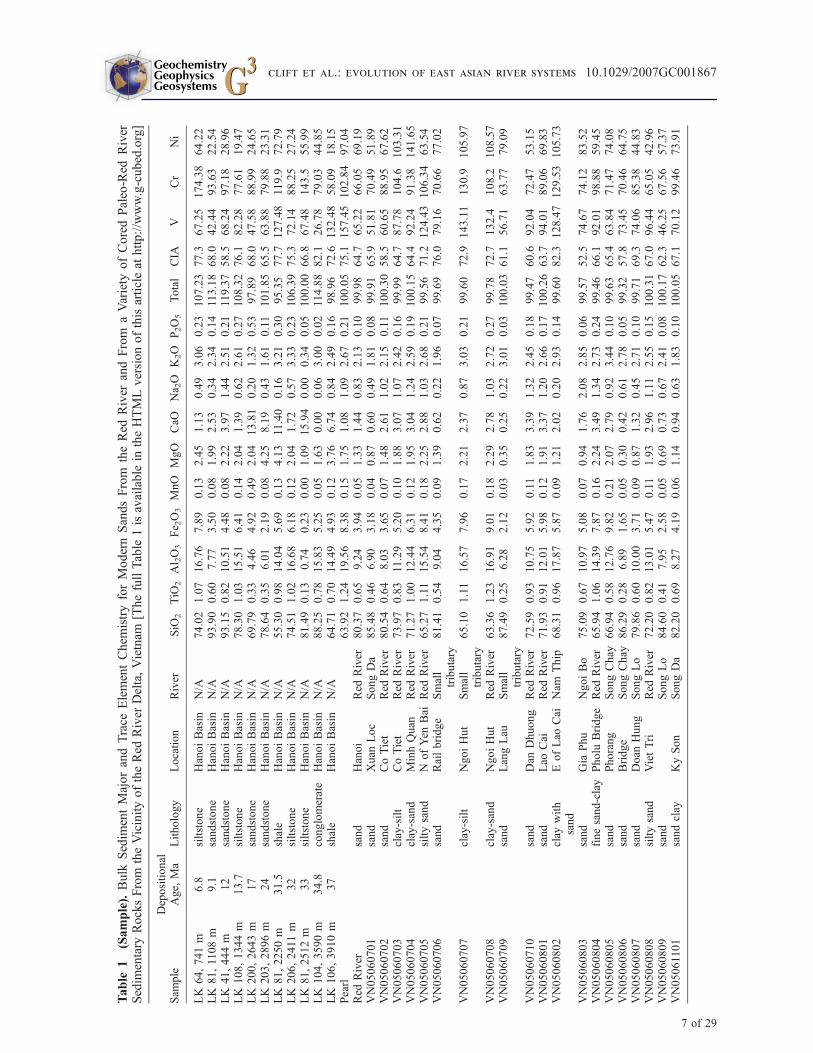
[10] Major element analyses of bulk sedimentsamples were obtained by X-Ray Fluorescence atFranklin & Marshall College, Pennsylvania, usinga Phillips 2404 XRF vacuum spectrometer. Work-ing curves for each element of interest were deter-mined by analyzing geochemical rock standards,data for which were synthesized by Abbey [1983]and Govindaraju [1994]. Between 30 and 50 datapoints are gathered for each working curve; variouselemental interferences are also taken into account,e.g., SrKß on Zr, RbKß on Y. The Rh Comptonpeak was utilized for a mass absorption correction.Slope and intercept values, together with correctionfactors for the various wavelength interferences,were calculated.
Figure 3. Regional geological map of the eastern Tibetan Plateau, SW China, and northern Indochina showing theriver courses overlain in blue and the locations of sediment samples shown as yellow dots. Map redrawn fromoriginal provided by B. C. Burchfiel (unpublished data, 2006). CB, Chuxiong Basin; SB; Simao Basin.
GeochemistryGeophysicsGeosystems G3G3
clift et al.: evolution of east asian river systems 10.1029/2007GC001867
5 of 29
[11] The amount of ferrous Fe is titrated using amodified Reichen and Fahey [1962] method andloss on ignition was determined by heating anexact aliquot of the sample (1 g) at 950�C forone hour. The X-ray procedure determines the totalFe content as Fe2O3. Analytical errors associatedwith measuring major element concentrationsrange from <1% for Si and Al to �3% for Na.The results of our analysis are shown in Table 1.
[12] Trace and rare earth elements (REE) weremeasured by a PerkinElmer Elan 9000 ICP-MS atArkansas State University. Analytical precision istypically <2% of the reported concentrations of theindividual elements. Uncertainty of the analyses, asdetermined from duplicate analyses of the samplesis generally <3% for the REEs and <5% for theother trace and major elements. We used two U.S.Geological Survey standards to determine the in-ternal and external precision. BCR-1 (basalt rockstandard) and SDO-1 (shale standard) were usedbecause the elemental concentrations were knownand previous work [Hannigan and Basu, 1998]supports the use of the standards in retainingaccuracy and maintaining precision in our analy-ses. We found the published SDO-1 values for the
elements under investigation to be within 2–5% ofthe analyzed results by our ICP-MS methods.Thus, we are confident our analyses have anoverall precision and accuracy better than 5%.
4.2. Sr and Nd Isotopes
[13] Samples were accurately weighed into PFATeflon screw-top beakers (Savillex1) and 87Rb and84Sr spikes were added quantitatively in order toallow Rb and Sr concentrations to be determinedby isotope dilution. Samples were dissolved usingHF-HNO3-HCl. The dissolved sample was accu-rately aliquoted and the smaller (one third) fractionspiked with 145Nd and 149Sm. Rb and Sr wereseparated in 2.5 N HCl using Bio-Rad AG50WX8 200–400 mesh cation exchange resin. A REEconcentrate was collected by elution of 3N HNO3.Nd and Sm were separated in a mixture of aceticacid (CH3COOH), methanol (CH3OH) and nitricacid (HNO3) using Bio-Rad AG1x8 200–400 meshanion exchange resin. Total procedure blanks forRb, Sr, Sm and Nd were less than 0.5 ng.
[14] Sr samples were loaded onto single Ta fila-ments with 1 N phosphoric acid. Rb samples wereloaded onto triple Ta filaments. Sm and Nd sam-ples were loaded directly onto triple Ta-Re-Tafilaments. Sr samples were analyzed on a VGSector 54-30 multiple collector mass spectrometerat the Scottish Universities Environmental Re-search Centre (SUERC) at East Kilbride. An 88Srintensity of 1V (1 � 10�11 A) ± 10% was main-tained. The 87Sr/86Sr ratio was corrected for massfractionation using 86Sr/88Sr = 0.1194 and anexponential law. NBS987 gave 0.710255 ± 20 (2s,n = 21). Rb samples were analyzed on a VG54Esingle collector mass spectrometer. Three sets of10 ratios were collected and the mean and standarderror computed.
[15] Sm and Nd samples were analyzed on aMicromass IsoProbe multiple collector ICP-MS.143Nd/144Nd ratios were measured with a 144Ndbeam of 1V (1 � 10�11 A). Six blocks of 20 ratioswere collected in the peak jumping mode andcorrected for mass fractionation using an exponen-tial law and 146Nd/144Nd = 0.7219. Backgroundcorrections were applied by measuring on peakzeros in the same 5% nitric acid used to dilute thesamples prior to each block of 20 ratios. Repeatanalyses of the internal laboratory standard (JM)gave 143Nd/144Nd = 0.511481 ± 15 (2s, n = 21).Nd and Sm concentration (ID) runs were analyzedon a single REE-concentrated solution as threeblocks of 20 ratios with ion intensities of >5 �
Figure 4. Sedimentary log of the drilled sequence inthe Hanoi Basin showing the major stratigraphicdivisions sampled during this study and their deposi-tional ages. Black arrows indicate the locations of thesamples selected for Pb isotope analysis by ion probe.White-headed arrows show the locations of samplesanalyzed for major and trace elements as well as for Ndisotopes by Clift et al. [2006a].
GeochemistryGeophysicsGeosystems G3G3
clift et al.: evolution of east asian river systems 10.1029/2007GC001867
6 of 29
Table
1(Sample).Bulk
Sedim
entMajorandTrace
ElementChem
istryforModernSandsFrom
theRed
River
andFrom
aVariety
ofCoredPaleo-Red
River
Sedim
entary
RocksFrom
theVicinityoftheRed
River
Delta,Vietnam
[ThefullTable
1isavailable
intheHTMLversionofthisarticleat
http://www.g-cubed.org]
Sam
ple
Depositional
Age,
Ma
Lithology
Location
River
SiO
2TiO
2Al 2O3Fe 2O3MnO
MgO
CaO
Na 2O
K2O
P2O5
Total
CIA
VCr
Ni
LK
64,741m
6.8
siltstone
HanoiBasin
N/A
74.02
1.07
16.76
7.89
0.13
2.45
1.13
0.49
3.06
0.23
107.23
77.3
67.25
174.38
64.22
LK
81,1108m
9.1
sandstone
HanoiBasin
N/A
93.90
0.60
7.77
3.50
0.08
1.99
2.53
0.34
2.34
0.14
113.18
68.0
42.44
93.63
22.54
LK
41,444m
12
sandstone
HanoiBasin
N/A
93.15
0.82
10.51
4.48
0.08
2.22
3.97
1.44
2.51
0.21
119.37
58.5
68.24
97.18
28.96
LK
108,1344m
13.7
siltstone
HanoiBasin
N/A
78.30
1.03
15.51
6.41
0.14
2.04
1.39
0.62
2.61
0.27
108.32
76.1
82.28
77.61
19.47
LK
200,2643m
17
sandstone
HanoiBasin
N/A
69.79
0.33
4.46
4.92
0.49
2.04
13.81
0.20
1.32
0.53
97.89
68.0
47.58
88.99
24.65
LK
203,2896m
24
sandstone
HanoiBasin
N/A
78.64
0.35
6.01
2.19
0.08
4.25
8.19
0.43
1.61
0.11
101.85
65.5
63.88
79.88
23.31
LK
81,2250m
31.5
shale
HanoiBasin
N/A
55.30
0.98
14.04
5.69
0.13
4.13
11.40
0.16
3.21
0.30
95.35
77.7
127.48
119.9
72.79
LK
206,2411m
32
siltstone
HanoiBasin
N/A
74.51
1.02
16.68
6.18
0.12
2.04
1.72
0.57
3.33
0.23
106.39
75.3
72.14
88.25
27.24
LK
81,2512m
33
siltstone
HanoiBasin
N/A
81.49
0.13
0.74
0.23
0.00
1.09
15.94
0.00
0.34
0.05
100.00
66.8
67.48
143.5
55.99
LK
104,3590m
34.8
conglomerate
HanoiBasin
N/A
88.25
0.78
15.83
5.25
0.05
1.63
0.00
0.06
3.00
0.02
114.88
82.1
26.78
79.03
44.85
LK
106,3910m
37
shale
HanoiBasin
N/A
64.71
0.70
14.49
4.93
0.12
3.76
6.74
0.84
2.49
0.16
98.96
72.6
132.48
58.09
18.15
Pearl
63.92
1.24
19.56
8.38
0.15
1.75
1.08
1.09
2.67
0.21
100.05
75.1
157.45
102.84
97.04
Red
River
sand
Hanoi
Red
River
80.37
0.65
9.24
3.94
0.05
1.33
1.44
0.83
2.13
0.10
99.98
64.7
65.22
66.05
69.19
VN05060701
sand
Xuan
Loc
SongDa
85.48
0.46
6.90
3.18
0.04
0.87
0.60
0.49
1.81
0.08
99.91
65.9
51.81
70.49
51.89
VN05060702
sand
CoTiet
Red
River
80.54
0.64
8.03
3.65
0.07
1.48
2.61
1.02
2.15
0.11
100.30
58.5
60.65
88.95
67.62
VN05060703
clay-silt
CoTiet
Red
River
73.97
0.83
11.29
5.20
0.10
1.88
3.07
1.07
2.42
0.16
99.99
64.7
87.78
104.6
103.31
VN05060704
clay-sand
MinhQuan
Red
River
71.27
1.00
12.44
6.31
0.12
1.95
3.04
1.24
2.59
0.19
100.15
64.4
92.24
91.38
141.65
VN05060705
siltysand
NofYen
Bai
Red
River
65.27
1.11
15.54
8.41
0.18
2.25
2.88
1.03
2.68
0.21
99.56
71.2
124.43
106.34
63.54
VN05060706
sand
Railbridge
Small
tributary
81.41
0.54
9.04
4.35
0.09
1.39
0.62
0.22
1.96
0.07
99.69
76.0
79.16
70.66
77.02
VN05060707
clay-silt
NgoiHut
Small
tributary
65.10
1.11
16.57
7.96
0.17
2.21
2.37
0.87
3.03
0.21
99.60
72.9
143.11
130.9
105.97
VN05060708
clay-sand
NgoiHut
Red
River
63.36
1.23
16.91
9.01
0.18
2.29
2.78
1.03
2.72
0.27
99.78
72.7
132.4
108.2
108.57
VN05060709
sand
LangLau
Small
tributary
87.49
0.25
6.28
2.12
0.03
0.35
0.25
0.22
3.01
0.03
100.03
61.1
56.71
63.77
79.09
VN05060710
sand
Dan
Dhuong
Red
River
72.59
0.93
10.75
5.92
0.11
1.83
3.39
1.32
2.45
0.18
99.47
60.6
92.04
72.47
53.15
VN05060801
sand
Lao
Cai
Red
River
71.93
0.91
12.01
5.98
0.12
1.91
3.37
1.20
2.66
0.17
100.26
63.7
94.01
89.06
69.83
VN05060802
clay
with
sand
EofLao
Cai
Nam
Thip
68.31
0.96
17.87
5.87
0.09
1.21
2.02
0.20
2.93
0.14
99.60
82.3
128.47
129.53
105.73
VN05060803
sand
Gia
Phu
NgoiBo
75.09
0.67
10.97
5.08
0.07
0.94
1.76
2.08
2.85
0.06
99.57
52.5
74.67
74.12
83.52
VN05060804
finesand-clay
Pholu
Bridge
Red
River
65.94
1.06
14.39
7.87
0.16
2.24
3.49
1.34
2.73
0.24
99.46
66.1
92.01
98.88
59.45
VN05060805
sand
Phorang
SongChay
66.94
0.58
12.76
9.82
0.21
2.07
2.79
0.92
3.44
0.10
99.63
65.4
63.84
71.47
74.08
VN05060806
sand
Bridge
SongChay
86.29
0.28
6.89
1.65
0.05
0.30
0.42
0.61
2.78
0.05
99.32
57.8
73.45
70.46
64.75
VN05060807
sand
Doan
Hung
SongLo
79.86
0.60
10.00
3.71
0.09
0.87
1.32
0.45
2.71
0.10
99.71
69.3
74.06
85.38
44.83
VN05060808
siltysand
VietTri
Red
River
72.20
0.82
13.01
5.47
0.11
1.93
2.96
1.11
2.55
0.15
100.31
67.0
96.44
65.05
42.96
VN05060809
sand
SongLo
84.60
0.41
7.95
2.58
0.05
0.69
0.73
0.67
2.41
0.08
100.17
62.3
46.25
67.56
57.37
VN05061101
sandclay
KySon
SongDa
82.20
0.69
8.27
4.19
0.06
1.14
0.94
0.63
1.83
0.10
100.05
67.1
70.12
99.46
73.91
GeochemistryGeophysicsGeosystems G3G3
clift et al.: evolution of east asian river systems 10.1029/2007GC001867
7 of 29
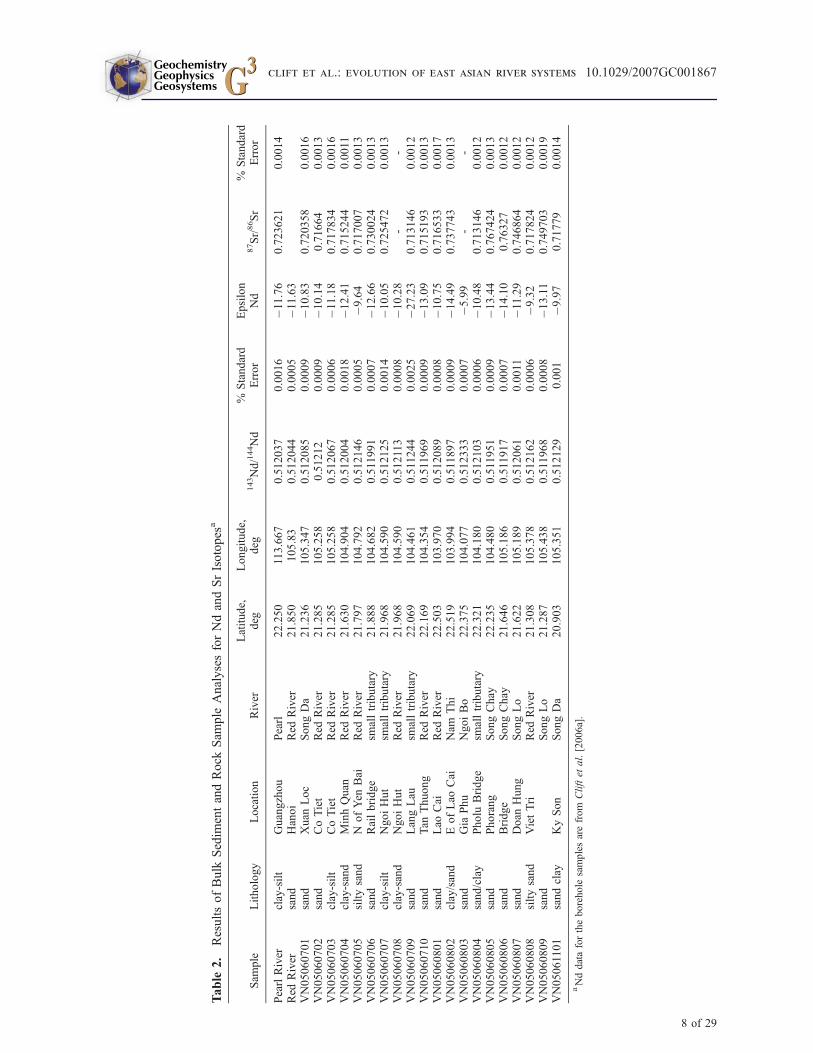
Table
2.
ResultsofBulk
Sedim
entandRock
Sam
ple
AnalysesforNdandSrIsotopes
a
Sam
ple
Lithology
Location
River
Latitude,
deg
Longitude,
deg
143Nd/144Nd
%Standard
Error
Epsilon
Nd
87Sr/86Sr
%Standard
Error
PearlRiver
clay-silt
Guangzhou
Pearl
22.250
113.667
0.512037
0.0016
�11.76
0.723621
0.0014
Red
River
sand
Hanoi
Red
River
21.850
105.83
0.512044
0.0005
�11.63
VN05060701
sand
Xuan
Loc
SongDa
21.236
105.347
0.512085
0.0009
�10.83
0.720358
0.0016
VN05060702
sand
CoTiet
Red
River
21.285
105.258
0.51212
0.0009
�10.14
0.71664
0.0013
VN05060703
clay-silt
CoTiet
Red
River
21.285
105.258
0.512067
0.0006
�11.18
0.717834
0.0016
VN05060704
clay-sand
MinhQuan
Red
River
21.630
104.904
0.512004
0.0018
�12.41
0.715244
0.0011
VN05060705
siltysand
NofYen
Bai
Red
River
21.797
104.792
0.512146
0.0005
�9.64
0.717007
0.0013
VN05060706
sand
Railbridge
smalltributary
21.888
104.682
0.511991
0.0007
�12.66
0.730024
0.0013
VN05060707
clay-silt
NgoiHut
smalltributary
21.968
104.590
0.512125
0.0014
�10.05
0.725472
0.0013
VN05060708
clay-sand
NgoiHut
Red
River
21.968
104.590
0.512113
0.0008
�10.28
--
VN05060709
sand
LangLau
smalltributary
22.069
104.461
0.511244
0.0025
�27.23
0.713146
0.0012
VN05060710
sand
Tan
Thuong
Red
River
22.169
104.354
0.511969
0.0009
�13.09
0.715193
0.0013
VN05060801
sand
Lao
Cai
Red
River
22.503
103.970
0.512089
0.0008
�10.75
0.716533
0.0017
VN05060802
clay/sand
EofLao
Cai
Nam
Thi
22.519
103.994
0.511897
0.0009
�14.49
0.737743
0.0013
VN05060803
sand
Gia
Phu
NgoiBo
22.375
104.077
0.512333
0.0007
�5.99
--
VN05060804
sand/clay
Pholu
Bridge
smalltributary
22.321
104.180
0.512103
0.0006
�10.48
0.713146
0.0012
VN05060805
sand
Phorang
SongChay
22.235
104.480
0.511951
0.0009
�13.44
0.767424
0.0013
VN05060806
sand
Bridge
SongChay
21.646
105.186
0.511917
0.0007
�14.10
0.76327
0.0012
VN05060807
sand
Doan
Hung
SongLo
21.622
105.189
0.512061
0.0011
�11.29
0.746864
0.0012
VN05060808
siltysand
VietTri
Red
River
21.308
105.378
0.512162
0.0006
�9.32
0.717824
0.0012
VN05060809
sand
SongLo
21.287
105.438
0.511968
0.0008
�13.11
0.749703
0.0019
VN05061101
sandclay
KySon
SongDa
20.903
105.351
0.512129
0.001
�9.97
0.71779
0.0014
aNddatafortheborehole
samplesarefrom
Cliftet
al.[2006a].
GeochemistryGeophysicsGeosystems G3G3
clift et al.: evolution of east asian river systems 10.1029/2007GC001867
8 of 29
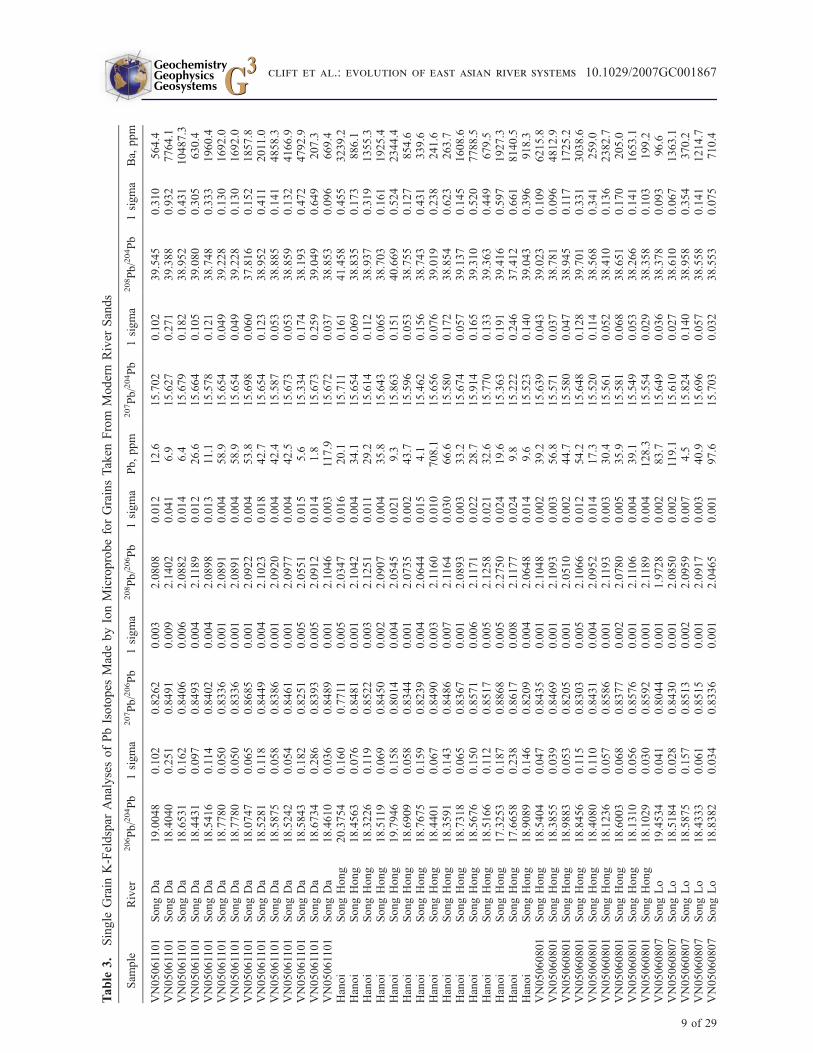
Table
3.
Single
Grain
K-Feldspar
AnalysesofPbIsotopes
MadebyIonMicroprobeforGrainsTaken
From
ModernRiver
Sands
Sam
ple
River
206Pb/204Pb
1sigma
207Pb/206Pb
1sigma
208Pb/206Pb
1sigma
Pb,ppm
207Pb/204Pb
1sigma
208Pb/204Pb
1sigma
Ba,
ppm
VN05061101
SongDa
19.0048
0.102
0.8262
0.003
2.0808
0.012
12.6
15.702
0.102
39.545
0.310
564.4
VN05061101
SongDa
18.4040
0.251
0.8491
0.009
2.1402
0.041
6.9
15.627
0.271
39.388
0.932
7764.1
VN05061101
SongDa
18.6531
0.162
0.8406
0.006
2.0882
0.014
6.4
15.679
0.182
38.952
0.431
10487.3
VN05061101
SongDa
18.4431
0.097
0.8493
0.004
2.1189
0.012
26.6
15.664
0.105
39.080
0.305
630.4
VN05061101
SongDa
18.5416
0.114
0.8402
0.004
2.0898
0.013
11.1
15.578
0.121
38.748
0.333
1960.4
VN05061101
SongDa
18.7780
0.050
0.8336
0.001
2.0891
0.004
58.9
15.654
0.049
39.228
0.130
1692.0
VN05061101
SongDa
18.7780
0.050
0.8336
0.001
2.0891
0.004
58.9
15.654
0.049
39.228
0.130
1692.0
VN05061101
SongDa
18.0747
0.065
0.8685
0.001
2.0922
0.004
53.8
15.698
0.060
37.816
0.152
1857.8
VN05061101
SongDa
18.5281
0.118
0.8449
0.004
2.1023
0.018
42.7
15.654
0.123
38.952
0.411
2011.0
VN05061101
SongDa
18.5875
0.058
0.8386
0.001
2.0920
0.004
42.4
15.587
0.053
38.885
0.141
4858.3
VN05061101
SongDa
18.5242
0.054
0.8461
0.001
2.0977
0.004
42.5
15.673
0.053
38.859
0.132
4166.9
VN05061101
SongDa
18.5843
0.182
0.8251
0.005
2.0551
0.015
5.6
15.334
0.174
38.193
0.472
4792.9
VN05061101
SongDa
18.6734
0.286
0.8393
0.005
2.0912
0.014
1.8
15.673
0.259
39.049
0.649
207.3
VN05061101
SongDa
18.4610
0.036
0.8489
0.001
2.1046
0.003
117.9
15.672
0.037
38.853
0.096
669.4
Hanoi
SongHong
20.3754
0.160
0.7711
0.005
2.0347
0.016
20.1
15.711
0.161
41.458
0.455
3239.2
Hanoi
SongHong
18.4563
0.076
0.8481
0.001
2.1042
0.004
34.1
15.654
0.069
38.835
0.173
886.1
Hanoi
SongHong
18.3226
0.119
0.8522
0.003
2.1251
0.011
29.2
15.614
0.112
38.937
0.319
1355.3
Hanoi
SongHong
18.5119
0.069
0.8450
0.002
2.0907
0.004
35.8
15.643
0.065
38.703
0.161
1925.4
Hanoi
SongHong
19.7946
0.158
0.8014
0.004
2.0545
0.021
9.3
15.863
0.151
40.669
0.524
2344.4
Hanoi
SongHong
18.6909
0.058
0.8344
0.001
2.0735
0.002
43.7
15.596
0.053
38.755
0.127
854.6
Hanoi
SongHong
18.7675
0.159
0.8239
0.004
2.0644
0.015
4.1
15.462
0.156
38.743
0.431
339.6
Hanoi
SongHong
18.4401
0.067
0.8490
0.003
2.1160
0.010
708.1
15.656
0.076
39.019
0.238
241.6
Hanoi
SongHong
18.3591
0.143
0.8486
0.007
2.1164
0.030
66.6
15.580
0.172
38.854
0.623
263.7
Hanoi
SongHong
18.7318
0.065
0.8367
0.001
2.0893
0.003
33.2
15.674
0.057
39.137
0.145
1608.6
Hanoi
SongHong
18.5676
0.150
0.8571
0.006
2.1171
0.022
28.7
15.914
0.165
39.310
0.520
7788.5
Hanoi
SongHong
18.5166
0.112
0.8517
0.005
2.1258
0.021
32.6
15.770
0.133
39.363
0.449
679.5
Hanoi
SongHong
17.3253
0.187
0.8868
0.005
2.2750
0.024
19.6
15.363
0.191
39.416
0.597
1927.3
Hanoi
SongHong
17.6658
0.238
0.8617
0.008
2.1177
0.024
9.8
15.222
0.246
37.412
0.661
8140.5
Hanoi
SongHong
18.9089
0.146
0.8209
0.004
2.0648
0.014
9.6
15.523
0.140
39.043
0.396
918.3
VN05060801
SongHong
18.5404
0.047
0.8435
0.001
2.1048
0.002
39.2
15.639
0.043
39.023
0.109
6215.8
VN05060801
SongHong
18.3855
0.039
0.8469
0.001
2.1093
0.003
56.8
15.571
0.037
38.781
0.096
4812.9
VN05060801
SongHong
18.9883
0.053
0.8205
0.001
2.0510
0.002
44.7
15.580
0.047
38.945
0.117
1725.2
VN05060801
SongHong
18.8456
0.115
0.8303
0.005
2.1066
0.012
54.2
15.648
0.128
39.701
0.331
3038.6
VN05060801
SongHong
18.4080
0.110
0.8431
0.004
2.0952
0.014
17.3
15.520
0.114
38.568
0.341
259.0
VN05060801
SongHong
18.1236
0.057
0.8586
0.001
2.1193
0.003
30.4
15.561
0.052
38.410
0.136
2382.7
VN05060801
SongHong
18.6003
0.068
0.8377
0.002
2.0780
0.005
35.9
15.581
0.068
38.651
0.170
205.0
VN05060801
SongHong
18.1310
0.056
0.8576
0.001
2.1106
0.004
39.1
15.549
0.053
38.266
0.141
1653.1
VN05060801
SongHong
18.1029
0.030
0.8592
0.001
2.1189
0.004
128.3
15.554
0.029
38.358
0.103
199.2
VN05060807
SongLo
19.4534
0.041
0.8044
0.001
1.9728
0.002
83.7
15.649
0.036
38.378
0.093
96.6
VN05060807
SongLo
18.5184
0.028
0.8430
0.001
2.0850
0.002
119.1
15.610
0.027
38.610
0.067
1363.1
VN05060807
SongLo
18.5875
0.157
0.8513
0.002
2.0959
0.007
4.5
15.824
0.140
38.958
0.354
370.2
VN05060807
SongLo
18.4333
0.061
0.8515
0.001
2.0917
0.003
40.9
15.696
0.057
38.558
0.141
1214.7
VN05060807
SongLo
18.8382
0.034
0.8336
0.001
2.0465
0.001
97.6
15.703
0.032
38.553
0.075
710.4
GeochemistryGeophysicsGeosystems G3G3
clift et al.: evolution of east asian river systems 10.1029/2007GC001867
9 of 29
Table
3.(continued)
Sam
ple
River
206Pb/204Pb
1sigma
207Pb/206Pb
1sigma
208Pb/206Pb
1sigma
Pb,ppm
207Pb/204Pb
1sigma
208Pb/204Pb
1sigma
Ba,
ppm
VN05060807
SongLo
18.3109
0.031
0.8581
0.001
2.1209
0.002
142.2
15.712
0.030
38.835
0.079
2510.5
VN05060807
SongLo
18.7479
0.069
0.8381
0.002
2.0951
0.003
17.7
15.713
0.065
39.279
0.159
5061.7
VN05060807
SongLo
18.1486
0.040
0.8602
0.001
2.1247
0.006
86.4
15.611
0.041
38.560
0.133
1447.6
VN05060807
SongLo
17.3171
0.047
0.8917
0.002
2.1535
0.010
33.7
15.441
0.055
37.292
0.199
2943.7
VN05060807
SongLo
18.3853
0.038
0.8544
0.001
2.1072
0.002
97.2
15.708
0.034
38.742
0.086
1759.1
VN05060807
SongLo
18.5913
0.094
0.8421
0.003
2.0949
0.007
8.3
15.656
0.101
38.946
0.240
878.3
VN05060807
SongLo
18.7290
0.046
0.8379
0.001
2.0515
0.003
50.5
15.693
0.043
38.423
0.108
222.6
VN05060807
SongLo
19.4658
0.039
0.8088
0.001
1.9810
0.003
72.7
15.743
0.035
38.561
0.092
85.6
VN05060807
SongLo
18.5842
0.038
0.8451
0.001
2.0891
0.003
87.8
15.706
0.036
38.825
0.096
1247.0
VN05060807
SongLo
18.2890
0.044
0.8617
0.001
2.1233
0.004
72.7
15.760
0.043
38.833
0.121
1238.8
VN05060807
SongLo
18.2116
0.045
0.8622
0.001
2.1227
0.004
65.4
15.701
0.045
38.659
0.117
1485.0
MC-01-75
Yangtze
18.5182
0.079
0.8387
0.003
2.0755
0.012
22.0
15.530
0.087
38.434
0.271
11377.7
MC-01-75
Yangtze
18.4463
0.047
0.8459
0.001
2.0917
0.004
22.9
15.604
0.047
38.584
0.118
5952.1
MC-01-75
Yangtze
18.8502
0.196
0.8289
0.007
2.0805
0.023
4.6
15.626
0.213
39.218
0.599
2072.3
MC-01-75
Yangtze
18.5614
0.150
0.8433
0.003
2.0787
0.009
4.2
15.652
0.140
38.583
0.357
3403.9
MC-01-75
Yangtze
18.9324
0.166
0.8281
0.005
2.0676
0.016
4.4
15.678
0.170
39.145
0.462
566.6
MC-01-75
Yangtze
18.6100
0.055
0.8340
0.002
2.0731
0.007
17.9
15.521
0.057
38.580
0.172
2318.4
MC-01-75
Yangtze
18.4678
0.194
0.8442
0.003
2.0903
0.009
2.8
15.591
0.171
38.603
0.437
790.3
MC-01-75
Yangtze
18.7473
0.061
0.8348
0.002
2.0761
0.008
68.7
15.650
0.063
38.922
0.196
998.3
MC-01-75
Yangtze
18.2486
0.048
0.8475
0.001
2.0893
0.002
50.9
15.465
0.043
38.126
0.105
15248.2
MC-01-75
Yangtze
18.6010
0.173
0.8267
0.007
2.0789
0.022
47.0
15.378
0.189
38.669
0.543
7439.9
MC-01-75
Yangtze
18.4004
0.041
0.8453
0.001
2.0966
0.003
63.4
15.554
0.040
38.578
0.100
1264.8
MC-01-75
Yangtze
18.5454
0.067
0.8351
0.003
2.0665
0.005
35.0
15.488
0.074
38.323
0.167
547.9
MC-01-75
Yangtze
18.5658
0.205
0.8479
0.009
2.1300
0.032
46.3
15.742
0.236
39.545
0.735
1070.5
MC-01-75
Yangtze
18.4626
0.050
0.8475
0.001
2.0904
0.002
51.5
15.648
0.044
38.594
0.110
697.1
MC-01-75
Yangtze
18.2415
0.106
0.8528
0.003
2.1139
0.008
70.1
15.557
0.106
38.561
0.267
3970.0
MC-01-75
Yangtze
18.9471
0.144
0.8210
0.005
2.0430
0.018
48.5
15.556
0.150
38.708
0.447
336.2
MC-01-75
Yangtze
18.4011
0.211
0.8397
0.004
2.0842
0.009
1.7
15.451
0.191
38.352
0.470
201.5
MC-01-75
Yangtze
18.4631
0.092
0.8433
0.003
2.0679
0.012
48.8
15.570
0.092
38.180
0.293
1623.4
MC-01-75
Yangtze
18.4065
0.040
0.8405
0.001
2.0780
0.004
53.0
15.471
0.041
38.250
0.109
1479.1
MC-01-75
Yangtze
18.4976
0.216
0.8532
0.007
2.0947
0.028
42.5
15.782
0.230
38.746
0.687
4161.1
MC-01-75
Yangtze
18.2651
0.044
0.8513
0.001
2.1142
0.004
60.5
15.549
0.043
38.616
0.116
1309.3
MC-01-75
Yangtze
18.4155
0.120
0.8503
0.004
2.1161
0.011
16.7
15.659
0.131
38.968
0.328
964.2
MC-01-75
Yangtze
18.4330
0.040
0.8439
0.002
2.1201
0.005
94.3
15.555
0.044
39.080
0.123
620.3
MC-01-75
Yangtze
18.2034
0.025
0.8557
0.001
2.0915
0.004
119.8
15.576
0.031
38.072
0.083
2402.7
MC-01-75
Yangtze
18.8205
0.162
0.8371
0.005
2.0860
0.023
105.8
15.754
0.160
39.259
0.555
1193.9
MC-01-75
Yangtze
18.2719
0.085
0.8518
0.004
2.1084
0.015
31.9
15.564
0.097
38.524
0.326
2635.3
MC-01-75
Yangtze
18.7728
0.111
0.8407
0.005
2.0750
0.017
21.0
15.782
0.129
38.953
0.396
1907.9
MC-01-75
Yangtze
18.3200
0.451
0.8265
0.015
2.0252
0.058
22.9
15.141
0.461
37.102
1.397
7160.9
MC-01-75
Yangtze
18.5246
0.064
0.8414
0.002
2.0619
0.004
37.6
15.587
0.062
38.195
0.151
1491.2
MC-01-75
Yangtze
18.3825
0.102
0.8456
0.004
2.1032
0.015
30.5
15.544
0.113
38.662
0.354
2383.3
GeochemistryGeophysicsGeosystems G3G3
clift et al.: evolution of east asian river systems 10.1029/2007GC001867
10 of 29
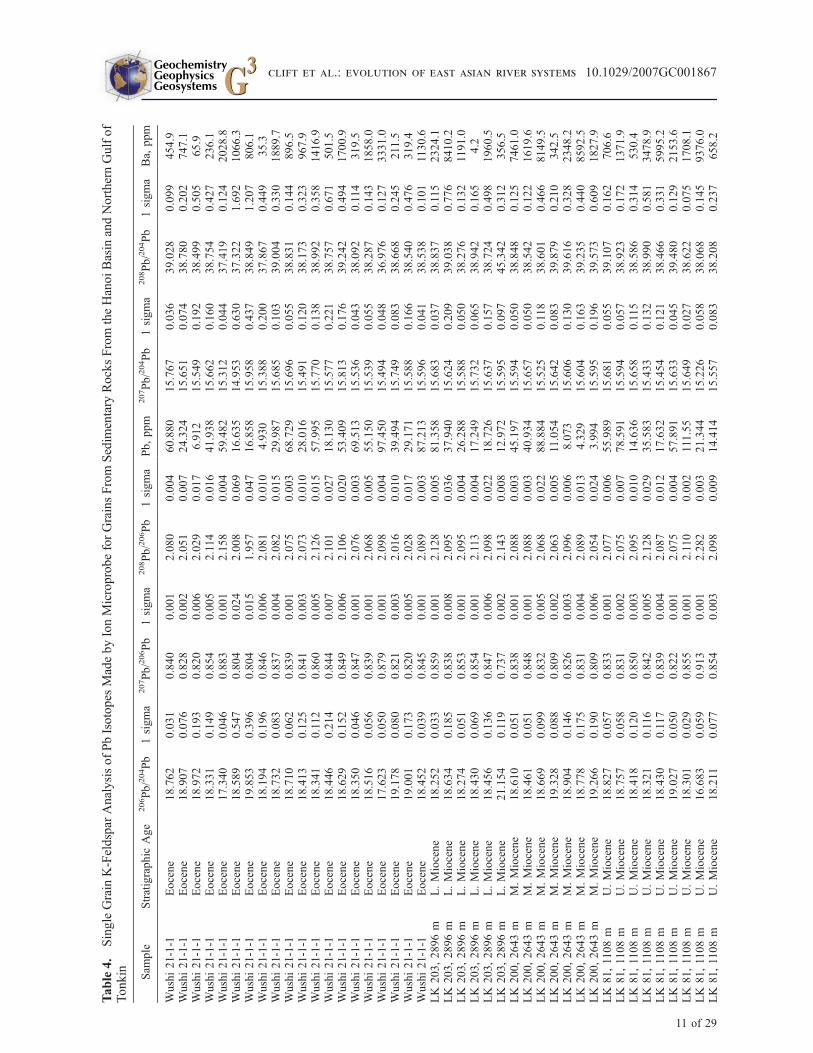
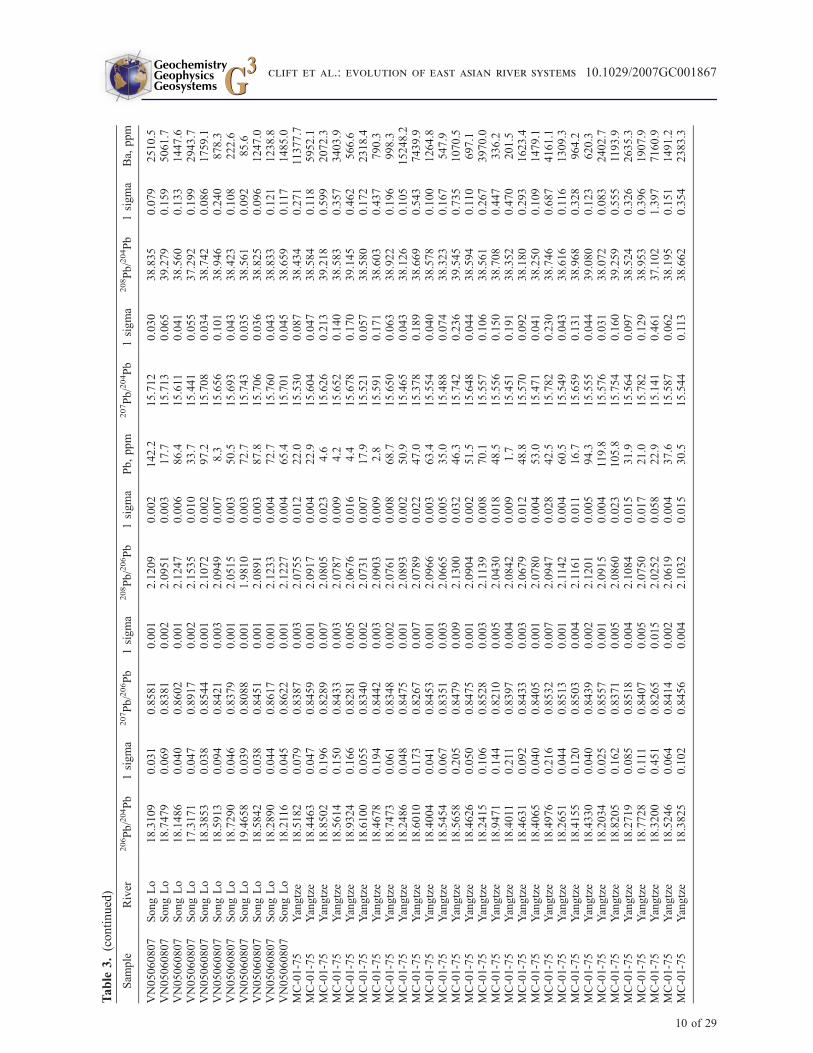
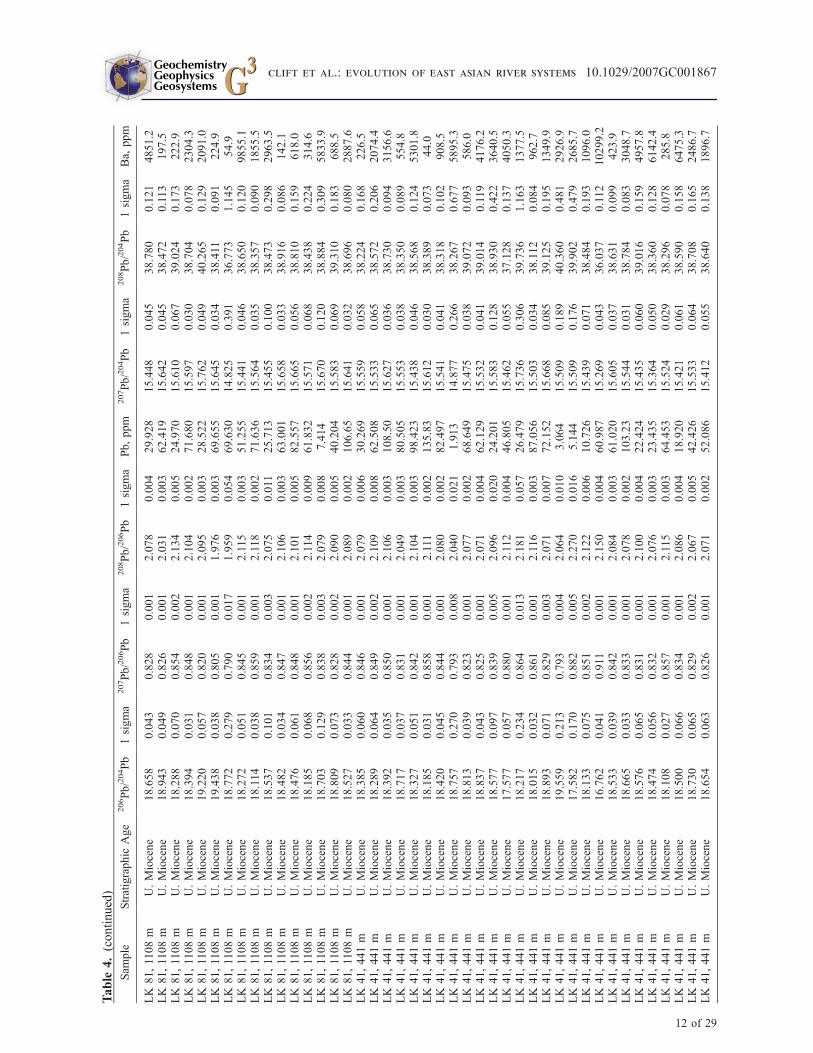
Table4.
SingleGrain
K-Feldspar
AnalysisofPbIsotopes
MadebyIonMicroprobeforGrainsFrom
Sedim
entary
RocksFrom
theHanoiBasin
andNorthernGulfof
Tonkin Sam
ple
Stratigraphic
Age
206Pb/204Pb
1sigma
207Pb/206Pb
1sigma
208Pb/206Pb
1sigma
Pb,ppm
207Pb/204Pb
1sigma
208Pb/204Pb
1sigma
Ba,
ppm
Wushi21-1-1
Eocene
18.762
0.031
0.840
0.001
2.080
0.004
60.880
15.767
0.036
39.028
0.099
454.9
Wushi21-1-1
Eocene
18.907
0.076
0.828
0.002
2.051
0.007
24.324
15.651
0.074
38.780
0.202
747.1
Wushi21-1-1
Eocene
18.972
0.193
0.820
0.006
2.029
0.017
6.912
15.549
0.192
38.499
0.505
65.9
Wushi21-1-1
Eocene
18.331
0.149
0.854
0.005
2.114
0.016
41.938
15.662
0.160
38.754
0.427
236.1
Wushi21-1-1
Eocene
17.340
0.046
0.883
0.001
2.158
0.004
59.482
15.312
0.044
37.419
0.124
2028.8
Wushi21-1-1
Eocene
18.589
0.547
0.804
0.024
2.008
0.069
16.635
14.953
0.630
37.322
1.692
1066.3
Wushi21-1-1
Eocene
19.853
0.396
0.804
0.015
1.957
0.047
16.858
15.958
0.437
38.849
1.207
806.1
Wushi21-1-1
Eocene
18.194
0.196
0.846
0.006
2.081
0.010
4.930
15.388
0.200
37.867
0.449
35.3
Wushi21-1-1
Eocene
18.732
0.083
0.837
0.004
2.082
0.015
29.987
15.685
0.103
39.004
0.330
1889.7
Wushi21-1-1
Eocene
18.710
0.062
0.839
0.001
2.075
0.003
68.729
15.696
0.055
38.831
0.144
896.5
Wushi21-1-1
Eocene
18.413
0.125
0.841
0.003
2.073
0.010
28.016
15.491
0.120
38.173
0.323
967.9
Wushi21-1-1
Eocene
18.341
0.112
0.860
0.005
2.126
0.015
57.995
15.770
0.138
38.992
0.358
1416.9
Wushi21-1-1
Eocene
18.446
0.214
0.844
0.007
2.101
0.027
18.130
15.577
0.221
38.757
0.671
501.5
Wushi21-1-1
Eocene
18.629
0.152
0.849
0.006
2.106
0.020
53.409
15.813
0.176
39.242
0.494
1700.9
Wushi21-1-1
Eocene
18.350
0.046
0.847
0.001
2.076
0.003
69.513
15.536
0.043
38.092
0.114
319.5
Wushi21-1-1
Eocene
18.516
0.056
0.839
0.001
2.068
0.005
55.150
15.539
0.055
38.287
0.143
1858.0
Wushi21-1-1
Eocene
17.623
0.050
0.879
0.001
2.098
0.004
97.450
15.494
0.048
36.976
0.127
3331.0
Wushi21-1-1
Eocene
19.178
0.080
0.821
0.003
2.016
0.010
39.494
15.749
0.083
38.668
0.245
211.5
Wushi21-1-1
Eocene
19.001
0.173
0.820
0.005
2.028
0.017
29.171
15.588
0.166
38.540
0.476
319.4
Wushi21-1-1
Eocene
18.452
0.039
0.845
0.001
2.089
0.003
87.213
15.596
0.041
38.538
0.101
1130.6
LK
203,2896m
L.Miocene
18.252
0.033
0.859
0.001
2.128
0.005
81.358
15.683
0.037
38.837
0.115
2324.1
LK
203,2896m
L.Miocene
18.634
0.185
0.838
0.008
2.095
0.036
37.940
15.624
0.209
39.038
0.776
8410.2
LK
203,2896m
L.Miocene
18.274
0.051
0.853
0.001
2.095
0.004
26.288
15.588
0.050
38.276
0.132
1191.0
LK
203,2896m
L.Miocene
18.430
0.069
0.854
0.001
2.113
0.004
17.249
15.732
0.065
38.942
0.165
4.2
LK
203,2896m
L.Miocene
18.456
0.136
0.847
0.006
2.098
0.022
18.726
15.637
0.157
38.724
0.498
1960.5
LK
203,2896m
L.Miocene
21.154
0.119
0.737
0.002
2.143
0.008
12.972
15.595
0.097
45.342
0.312
356.5
LK
200,2643m
M.Miocene
18.610
0.051
0.838
0.001
2.088
0.003
45.197
15.594
0.050
38.848
0.125
7461.0
LK
200,2643m
M.Miocene
18.461
0.051
0.848
0.001
2.088
0.003
40.934
15.657
0.050
38.542
0.122
1619.6
LK
200,2643m
M.Miocene
18.669
0.099
0.832
0.005
2.068
0.022
88.884
15.525
0.118
38.601
0.466
8149.5
LK
200,2643m
M.Miocene
19.328
0.088
0.809
0.002
2.063
0.005
11.054
15.642
0.083
39.879
0.210
342.5
LK
200,2643m
M.Miocene
18.904
0.146
0.826
0.003
2.096
0.006
8.073
15.606
0.130
39.616
0.328
2348.2
LK
200,2643m
M.Miocene
18.778
0.175
0.831
0.004
2.089
0.013
4.329
15.604
0.163
39.235
0.440
8592.5
LK
200,2643m
M.Miocene
19.266
0.190
0.809
0.006
2.054
0.024
3.994
15.595
0.196
39.573
0.609
1827.9
LK
81,1108m
U.Miocene
18.827
0.057
0.833
0.001
2.077
0.006
55.989
15.681
0.055
39.107
0.162
706.6
LK
81,1108m
U.Miocene
18.757
0.058
0.831
0.002
2.075
0.007
78.591
15.594
0.057
38.923
0.172
1371.9
LK
81,1108m
U.Miocene
18.418
0.120
0.850
0.003
2.095
0.010
14.636
15.658
0.115
38.586
0.314
530.4
LK
81,1108m
U.Miocene
18.321
0.116
0.842
0.005
2.128
0.029
35.583
15.433
0.132
38.990
0.581
3478.9
LK
81,1108m
U.Miocene
18.430
0.117
0.839
0.004
2.087
0.012
17.632
15.454
0.121
38.466
0.331
5995.2
LK
81,1108m
U.Miocene
19.027
0.050
0.822
0.001
2.075
0.004
57.891
15.633
0.045
39.480
0.129
2153.6
LK
81,1108m
U.Miocene
18.301
0.029
0.855
0.001
2.110
0.002
111.55
15.649
0.027
38.622
0.075
1708.1
LK
81,1108m
U.Miocene
16.683
0.059
0.913
0.001
2.282
0.003
21.344
15.226
0.058
38.068
0.145
9376.0
LK
81,1108m
U.Miocene
18.211
0.077
0.854
0.003
2.098
0.009
14.414
15.557
0.083
38.208
0.237
658.2
GeochemistryGeophysicsGeosystems G3G3
clift et al.: evolution of east asian river systems 10.1029/2007GC001867
11 of 29
Table
4.(continued)
Sam
ple
Stratigraphic
Age
206Pb/204Pb
1sigma
207Pb/206Pb
1sigma
208Pb/206Pb
1sigma
Pb,ppm
207Pb/204Pb
1sigma
208Pb/204Pb
1sigma
Ba,
ppm
LK
81,1108m
U.Miocene
18.658
0.043
0.828
0.001
2.078
0.004
29.928
15.448
0.045
38.780
0.121
4851.2
LK
81,1108m
U.Miocene
18.943
0.049
0.826
0.001
2.031
0.003
62.419
15.642
0.045
38.472
0.113
197.5
LK
81,1108m
U.Miocene
18.288
0.070
0.854
0.002
2.134
0.005
24.970
15.610
0.067
39.024
0.173
222.9
LK
81,1108m
U.Miocene
18.394
0.031
0.848
0.001
2.104
0.002
71.680
15.597
0.030
38.704
0.078
2304.3
LK
81,1108m
U.Miocene
19.220
0.057
0.820
0.001
2.095
0.003
28.522
15.762
0.049
40.265
0.129
2091.0
LK
81,1108m
U.Miocene
19.438
0.038
0.805
0.001
1.976
0.003
69.655
15.645
0.034
38.411
0.091
224.9
LK
81,1108m
U.Miocene
18.772
0.279
0.790
0.017
1.959
0.054
69.630
14.825
0.391
36.773
1.145
54.9
LK
81,1108m
U.Miocene
18.272
0.051
0.845
0.001
2.115
0.003
51.255
15.441
0.046
38.650
0.120
9855.1
LK
81,1108m
U.Miocene
18.114
0.038
0.859
0.001
2.118
0.002
71.636
15.564
0.035
38.357
0.090
1855.5
LK
81,1108m
U.Miocene
18.537
0.101
0.834
0.003
2.075
0.011
25.713
15.455
0.100
38.473
0.298
2963.5
LK
81,1108m
U.Miocene
18.482
0.034
0.847
0.001
2.106
0.003
63.001
15.658
0.033
38.916
0.086
142.1
LK
81,1108m
U.Miocene
18.476
0.061
0.848
0.001
2.101
0.005
82.557
15.665
0.056
38.810
0.159
618.0
LK
81,1108m
U.Miocene
18.185
0.068
0.856
0.002
2.114
0.009
61.832
15.571
0.068
38.438
0.224
314.6
LK
81,1108m
U.Miocene
18.703
0.129
0.838
0.003
2.079
0.008
7.414
15.670
0.120
38.884
0.309
5833.9
LK
81,1108m
U.Miocene
18.809
0.073
0.828
0.002
2.090
0.005
40.204
15.583
0.069
39.310
0.183
688.5
LK
81,1108m
U.Miocene
18.527
0.033
0.844
0.001
2.089
0.002
106.65
15.641
0.032
38.696
0.080
2887.6
LK
41,441m
U.Miocene
18.385
0.060
0.846
0.001
2.079
0.006
30.269
15.559
0.058
38.224
0.168
226.5
LK
41,441m
U.Miocene
18.289
0.064
0.849
0.002
2.109
0.008
62.508
15.533
0.065
38.572
0.206
2074.4
LK
41,441m
U.Miocene
18.392
0.035
0.850
0.001
2.106
0.003
108.50
15.627
0.036
38.730
0.094
3156.6
LK
41,441m
U.Miocene
18.717
0.037
0.831
0.001
2.049
0.003
80.505
15.553
0.038
38.350
0.089
554.8
LK
41,441m
U.Miocene
18.327
0.051
0.842
0.001
2.104
0.003
98.423
15.438
0.046
38.568
0.124
5301.8
LK
41,441m
U.Miocene
18.185
0.031
0.858
0.001
2.111
0.002
135.83
15.612
0.030
38.389
0.073
44.0
LK
41,441m
U.Miocene
18.420
0.045
0.844
0.001
2.080
0.002
82.497
15.541
0.041
38.318
0.102
908.5
LK
41,441m
U.Miocene
18.757
0.270
0.793
0.008
2.040
0.021
1.913
14.877
0.266
38.267
0.677
5895.3
LK
41,441m
U.Miocene
18.813
0.039
0.823
0.001
2.077
0.002
68.649
15.475
0.038
39.072
0.093
586.0
LK
41,441m
U.Miocene
18.837
0.043
0.825
0.001
2.071
0.004
62.129
15.532
0.041
39.014
0.119
4176.2
LK
41,441m
U.Miocene
18.577
0.097
0.839
0.005
2.096
0.020
24.201
15.583
0.128
38.930
0.422
3640.5
LK
41,441m
U.Miocene
17.577
0.057
0.880
0.001
2.112
0.004
46.805
15.462
0.055
37.128
0.137
4050.3
LK
41,441m
U.Miocene
18.217
0.234
0.864
0.013
2.181
0.057
26.479
15.736
0.306
39.736
1.163
1377.5
LK
41,441m
U.Miocene
18.015
0.032
0.861
0.001
2.116
0.003
87.056
15.503
0.034
38.112
0.084
962.7
LK
41,441m
U.Miocene
18.893
0.071
0.829
0.003
2.071
0.007
72.152
15.668
0.085
39.125
0.195
1349.9
LK
41,441m
U.Miocene
19.559
0.213
0.793
0.004
2.064
0.010
3.064
15.509
0.189
40.360
0.481
2926.9
LK
41,441m
U.Miocene
17.582
0.170
0.882
0.005
2.270
0.016
5.144
15.509
0.176
39.902
0.479
2685.7
LK
41,441m
U.Miocene
18.133
0.075
0.851
0.002
2.122
0.006
10.726
15.439
0.071
38.484
0.193
1096.0
LK
41,441m
U.Miocene
16.762
0.041
0.911
0.001
2.150
0.004
60.987
15.269
0.043
36.037
0.112
10299.2
LK
41,441m
U.Miocene
18.533
0.039
0.842
0.001
2.084
0.003
61.020
15.605
0.037
38.631
0.099
423.9
LK
41,441m
U.Miocene
18.665
0.033
0.833
0.001
2.078
0.002
103.23
15.544
0.031
38.784
0.083
3048.7
LK
41,441m
U.Miocene
18.576
0.065
0.831
0.001
2.100
0.004
22.424
15.435
0.060
39.016
0.159
4957.8
LK
41,441m
U.Miocene
18.474
0.056
0.832
0.001
2.076
0.003
23.435
15.364
0.050
38.360
0.128
6142.4
LK
41,441m
U.Miocene
18.108
0.027
0.857
0.001
2.115
0.003
64.453
15.524
0.029
38.296
0.078
285.8
LK
41,441m
U.Miocene
18.500
0.066
0.834
0.001
2.086
0.004
18.920
15.421
0.061
38.590
0.158
6475.3
LK
41,441m
U.Miocene
18.730
0.065
0.829
0.002
2.067
0.005
42.426
15.533
0.064
38.708
0.165
2486.7
LK
41,441m
U.Miocene
18.654
0.063
0.826
0.001
2.071
0.002
52.086
15.412
0.055
38.640
0.138
1896.7
GeochemistryGeophysicsGeosystems G3G3
clift et al.: evolution of east asian river systems 10.1029/2007GC001867
12 of 29
10�13A for 143Nd and 149Sm, respectively. Externalprecision on 145Nd/143Nd and 149Sm/147Sm isbetter than 0.01% (2s, n = 11) based on analysesof a mixed Nd and Sm solution used as an internalstandard. Rb, Sr, Nd and Sm isotope ratios areadjusted for mass fractionation/bias and spikecontribution. Results of the analysis are shown inTable 2. For data analysis we calculate the parameter
eNd [DePaolo and Wasserburg, 1976] using a143Nd/144Nd value of 0.512638 for the ChondriticUniform Reservoir [Hamilton et al., 1983].
4.3 Pb Isotopes of Detrital Feldspars
[16] In order to understand better the provenanceevolution of the Red River we employ the tech-nique of measuring Pb in situ [Layne and Shimizu,1998] in single K-feldspar sand grains using ahigh-resolution Cameca 1270 ion microprobe atthe University of Edinburgh. Although producinganalytical uncertainties much greater than the con-ventional thermal ionization mass spectrometer(TIMS) method, the ion microprobe approachallows isotopic determinations on individual sandand silt-sized particles, which are below the sizepossible with TIMS. In order to exploit the poten-tial of this method to characterize heterogeneousfeldspar populations several analyses were runfrom each sample in order to define the range ofisotopic ratios in a single sample, and to identifysmall populations of grains with distinct isotopiccharacters (Table 3).
[17] Sand and disaggregated sandstones weresieved, after which the 1 mm to 100 mm sizefractions was mounted in epoxy and polished usingaluminum oxide abrasives. The K-feldspar grainswere then identified by area mapping of Al2O3 andK2O using the JEOL Superprobe electron micro-probe at the Massachusetts Institute of Technology.This allowed the K-feldspars to be identified forisotopic analysis. After gold coating the grainswere analyzed using a beam of negatively chargedoxygen ions (O-) focused to a spot as small as 15–20 mm. The analyses were calibrated using analy-ses of glass from standards SRM610 and DR4-2. Inaddition, 22 repeat measurements were made on a
Shap granite feldspar previously characterized byTyrrell et al. [2006]. Analytical uncertainties areprincipally a reflection of the counting statistics,typically averaging 2s � 1%. The analytical resultsare shown in Tables 3 and 4.
[18] In order to minimize the risk of secondary Pbcontamination from sources outside the feldspar,analyses were made in the center of each grain,away from cracks, inclusions or alteration zones.Because we only analyze unaltered material sedi-ment eroded from strongly weathered sources willbe underrepresented. Feldspar is susceptible tochemical weathering and breakdown compared tomore stable minerals, such as quartz or zircon, sothat our method introduces a bias that favorssources experiencing rapid physical weathering.The ion beam was trained on the spot to beanalyzed for five minutes before analysis began,so that any surface Pb contamination that mighthave occurred during preparation of the grainsmount was removed. Through probing grain cen-ters and allowing the beam to remove surfacecoating of the sectioned grains we avoid analysisof excess secondary Pb that is normally removedby leaching procedures prior to conventional massspectrometry [Gariepy et al., 1985].
4.4. Bulk Sediment Pb Isotopes
[19] Three samples were selected for bulk sedimentanalysis of Pb isotopes. Approximately 0.3 g ofpowdered sample were dissolved in a mixture of3:1 HF and HNO3, dried down with concentratedHNO3, 6.2NHCl and concentrated HBr before beingtransferred to vials for column separation. Pb wasseparated by anion exchange using the HNO3-HBrprocedure of Galer [1986] and Abouchami et al.[1999]. Pb analyses were performed on theNEPTUNE multicollector ICP-MS at Woods HoleOceanographic Institution (WHOI) using thallium tocorrect for instrumental mass discrimination. Pbanalyses carry internal precisions on 206Pb/204Pb,207Pb/204Pb and 208Pb/204Pb ratios of 15–30 ppm;
and external reproducibility (including full chemis-
try) ranges from 17 ppm (2s) for 207Pb/206Pb, to
117 ppm (2s) for 208Pb/204Pb. Pb ratios wereadjusted to the SRM981 values of Todt et al.[1996]. Results from this work are shown in Table 5.
5. Results
5.1. Weathering Proxies
[20] The strength of chemical weathering in theRed River basin can be assessed by consideration
Table 5. Pb Isotope Analyses of Bulk Sediments Fromthe Hanoi Basin, Measured by ICP-MS
Sample 206Pb/204Pb 207Pb/204Pb 208Pb/204Pb
LK 41, 444 m 18.89466 15.70745 39.46809LK 81, 1108 m 18.83811 15.72161 39.28490LK 200, 2643 m 18.79203 15.71457 39.21047
GeochemistryGeophysicsGeosystems G3G3
clift et al.: evolution of east asian river systems 10.1029/2007GC001867
13 of 29
of the Chemical Index of Alteration (CIA) a proxydeveloped by Nesbitt and Young [1982], which isbased on the relative mobility of Na, K and Ca inaqueous fluids, compared to immobile Al, whichtends to be concentrated in the residues of weath-ered rocks. CIA is calculated as follows:
CIA ¼ Al2O3
Al2O3 þ CaO*þ Na2Oþ K2Oð Þ � 100
[21] CIA is derived from the molecular weights ofthe oxides. The CaO* value used is only thecalcium content from the silicate fraction of thesediment and correction must be made for thecarbonate and phosphate contents. No attemptwas made to dissolve carbonate before analysis.In this study we follow the method of Singh et al.[2005] in using P2O5 to correct for phosphate.Subsequently, a correction is made for carbonatebased on assuming a reasonable Ca/Na ratio forsilicate continental material. If the remaining num-ber of moles after the phosphate correction is stillmore than the number of Na2O moles then thislatter value is used as a proxy for CaO* value.Uncertainties in the CIA values are in excess of the3% uncertainty in the XRF analytical data and can
be used only as general proxies for weatheringintensity.
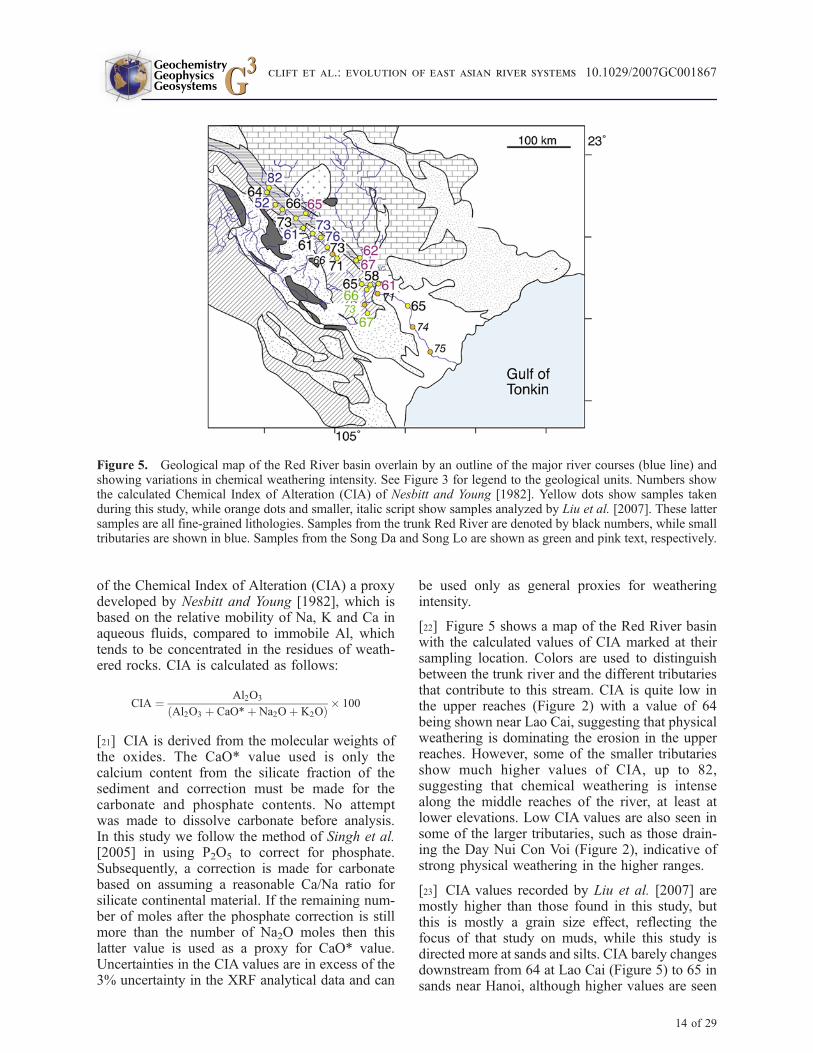
[22] Figure 5 shows a map of the Red River basinwith the calculated values of CIA marked at theirsampling location. Colors are used to distinguishbetween the trunk river and the different tributariesthat contribute to this stream. CIA is quite low inthe upper reaches (Figure 2) with a value of 64being shown near Lao Cai, suggesting that physicalweathering is dominating the erosion in the upperreaches. However, some of the smaller tributariesshow much higher values of CIA, up to 82,suggesting that chemical weathering is intensealong the middle reaches of the river, at least atlower elevations. Low CIA values are also seen insome of the larger tributaries, such as those drain-ing the Day Nui Con Voi (Figure 2), indicative ofstrong physical weathering in the higher ranges.
[23] CIA values recorded by Liu et al. [2007] aremostly higher than those found in this study, butthis is mostly a grain size effect, reflecting thefocus of that study on muds, while this study isdirected more at sands and silts. CIA barely changesdownstream from 64 at Lao Cai (Figure 5) to 65 insands near Hanoi, although higher values are seen
Figure 5. Geological map of the Red River basin overlain by an outline of the major river courses (blue line) andshowing variations in chemical weathering intensity. See Figure 3 for legend to the geological units. Numbers showthe calculated Chemical Index of Alteration (CIA) of Nesbitt and Young [1982]. Yellow dots show samples takenduring this study, while orange dots and smaller, italic script show samples analyzed by Liu et al. [2007]. These lattersamples are all fine-grained lithologies. Samples from the trunk Red River are denoted by black numbers, while smalltributaries are shown in blue. Samples from the Song Da and Song Lo are shown as green and pink text, respectively.
GeochemistryGeophysicsGeosystems G3G3
clift et al.: evolution of east asian river systems 10.1029/2007GC001867
14 of 29
locally in the river between these points. HigherCIA values associated with stronger chemicalweathering are seen in small tributaries and inthe Song Da (66), neither of which appear todominate the flux in the trunk river. The variabilityin CIA in each drainage system makes theirinfluence on the bulk flow to the ocean impossibleto quantify accurately.
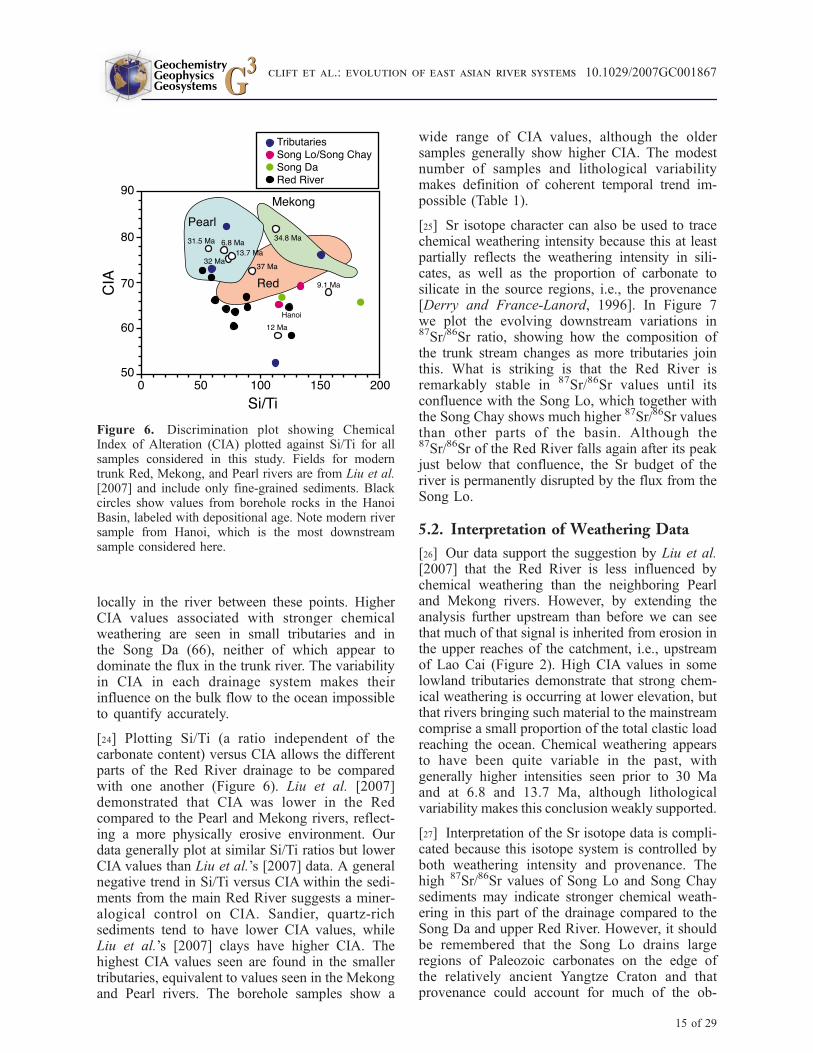
[24] Plotting Si/Ti (a ratio independent of thecarbonate content) versus CIA allows the differentparts of the Red River drainage to be comparedwith one another (Figure 6). Liu et al. [2007]demonstrated that CIA was lower in the Redcompared to the Pearl and Mekong rivers, reflect-ing a more physically erosive environment. Ourdata generally plot at similar Si/Ti ratios but lowerCIA values than Liu et al.’s [2007] data. A generalnegative trend in Si/Ti versus CIA within the sedi-ments from the main Red River suggests a miner-alogical control on CIA. Sandier, quartz-richsediments tend to have lower CIA values, whileLiu et al.’s [2007] clays have higher CIA. Thehighest CIA values seen are found in the smallertributaries, equivalent to values seen in the Mekongand Pearl rivers. The borehole samples show a
wide range of CIA values, although the oldersamples generally show higher CIA. The modestnumber of samples and lithological variabilitymakes definition of coherent temporal trend im-possible (Table 1).
[25] Sr isotope character can also be used to tracechemical weathering intensity because this at leastpartially reflects the weathering intensity in sili-cates, as well as the proportion of carbonate tosilicate in the source regions, i.e., the provenance[Derry and France-Lanord, 1996]. In Figure 7we plot the evolving downstream variations in87Sr/86Sr ratio, showing how the composition ofthe trunk stream changes as more tributaries jointhis. What is striking is that the Red River isremarkably stable in 87Sr/86Sr values until itsconfluence with the Song Lo, which together withthe Song Chay shows much higher 87Sr/86Sr valuesthan other parts of the basin. Although the87Sr/86Sr of the Red River falls again after its peakjust below that confluence, the Sr budget of theriver is permanently disrupted by the flux from theSong Lo.
5.2. Interpretation of Weathering Data
[26] Our data support the suggestion by Liu et al.[2007] that the Red River is less influenced bychemical weathering than the neighboring Pearland Mekong rivers. However, by extending theanalysis further upstream than before we can seethat much of that signal is inherited from erosion inthe upper reaches of the catchment, i.e., upstreamof Lao Cai (Figure 2). High CIA values in somelowland tributaries demonstrate that strong chem-ical weathering is occurring at lower elevation, butthat rivers bringing such material to the mainstreamcomprise a small proportion of the total clastic loadreaching the ocean. Chemical weathering appearsto have been quite variable in the past, withgenerally higher intensities seen prior to 30 Maand at 6.8 and 13.7 Ma, although lithologicalvariability makes this conclusion weakly supported.
[27] Interpretation of the Sr isotope data is compli-cated because this isotope system is controlled byboth weathering intensity and provenance. Thehigh 87Sr/86Sr values of Song Lo and Song Chaysediments may indicate stronger chemical weath-ering in this part of the drainage compared to theSong Da and upper Red River. However, it shouldbe remembered that the Song Lo drains largeregions of Paleozoic carbonates on the edge ofthe relatively ancient Yangtze Craton and thatprovenance could account for much of the ob-
Figure 6. Discrimination plot showing ChemicalIndex of Alteration (CIA) plotted against Si/Ti for allsamples considered in this study. Fields for moderntrunk Red, Mekong, and Pearl rivers are from Liu et al.[2007] and include only fine-grained sediments. Blackcircles show values from borehole rocks in the HanoiBasin, labeled with depositional age. Note modern riversample from Hanoi, which is the most downstreamsample considered here.
GeochemistryGeophysicsGeosystems G3G3
clift et al.: evolution of east asian river systems 10.1029/2007GC001867
15 of 29
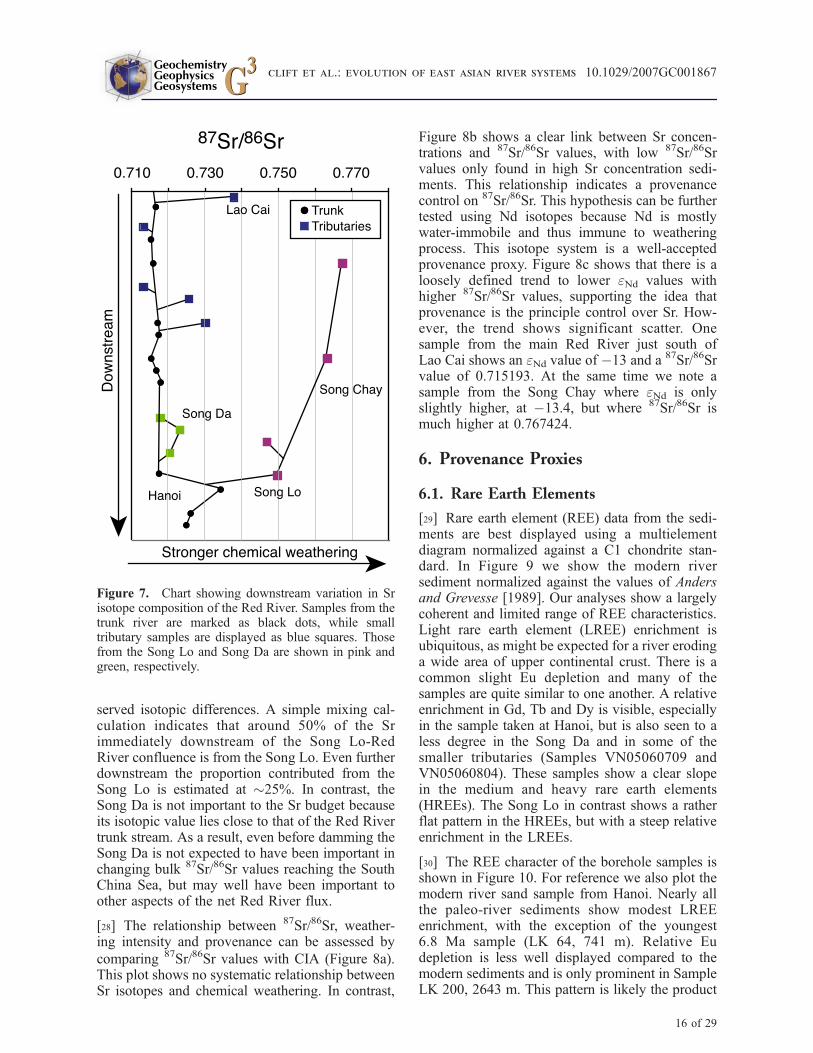
served isotopic differences. A simple mixing cal-culation indicates that around 50% of the Srimmediately downstream of the Song Lo-RedRiver confluence is from the Song Lo. Even furtherdownstream the proportion contributed from theSong Lo is estimated at �25%. In contrast, theSong Da is not important to the Sr budget becauseits isotopic value lies close to that of the Red Rivertrunk stream. As a result, even before damming theSong Da is not expected to have been important inchanging bulk 87Sr/86Sr values reaching the SouthChina Sea, but may well have been important toother aspects of the net Red River flux.
[28] The relationship between 87Sr/86Sr, weather-ing intensity and provenance can be assessed by
comparing 87Sr/86Sr values with CIA (Figure 8a).This plot shows no systematic relationship betweenSr isotopes and chemical weathering. In contrast,
Figure 8b shows a clear link between Sr concen-trations and 87Sr/86Sr values, with low 87Sr/86Srvalues only found in high Sr concentration sedi-ments. This relationship indicates a provenancecontrol on 87Sr/86Sr. This hypothesis can be furthertested using Nd isotopes because Nd is mostlywater-immobile and thus immune to weatheringprocess. This isotope system is a well-acceptedprovenance proxy. Figure 8c shows that there is aloosely defined trend to lower eNd values withhigher 87Sr/86Sr values, supporting the idea thatprovenance is the principle control over Sr. How-ever, the trend shows significant scatter. Onesample from the main Red River just south ofLao Cai shows an eNd value of �13 and a 87Sr/86Srvalue of 0.715193. At the same time we note asample from the Song Chay where eNd is onlyslightly higher, at �13.4, but where 87Sr/86Sr ismuch higher at 0.767424.
6. Provenance Proxies
6.1. Rare Earth Elements
[29] Rare earth element (REE) data from the sedi-ments are best displayed using a multielementdiagram normalized against a C1 chondrite stan-dard. In Figure 9 we show the modern riversediment normalized against the values of Andersand Grevesse [1989]. Our analyses show a largelycoherent and limited range of REE characteristics.Light rare earth element (LREE) enrichment isubiquitous, as might be expected for a river erodinga wide area of upper continental crust. There is acommon slight Eu depletion and many of thesamples are quite similar to one another. A relativeenrichment in Gd, Tb and Dy is visible, especiallyin the sample taken at Hanoi, but is also seen to aless degree in the Song Da and in some of thesmaller tributaries (Samples VN05060709 andVN05060804). These samples show a clear slopein the medium and heavy rare earth elements(HREEs). The Song Lo in contrast shows a ratherflat pattern in the HREEs, but with a steep relativeenrichment in the LREEs.
[30] The REE character of the borehole samples isshown in Figure 10. For reference we also plot themodern river sand sample from Hanoi. Nearly allthe paleo-river sediments show modest LREEenrichment, with the exception of the youngest6.8 Ma sample (LK 64, 741 m). Relative Eudepletion is less well displayed compared to themodern sediments and is only prominent in SampleLK 200, 2643 m. This pattern is likely the product
Figure 7. Chart showing downstream variation in Srisotope composition of the Red River. Samples from thetrunk river are marked as black dots, while smalltributary samples are displayed as blue squares. Thosefrom the Song Lo and Song Da are shown in pink andgreen, respectively.
GeochemistryGeophysicsGeosystems G3G3
clift et al.: evolution of east asian river systems 10.1029/2007GC001867
16 of 29
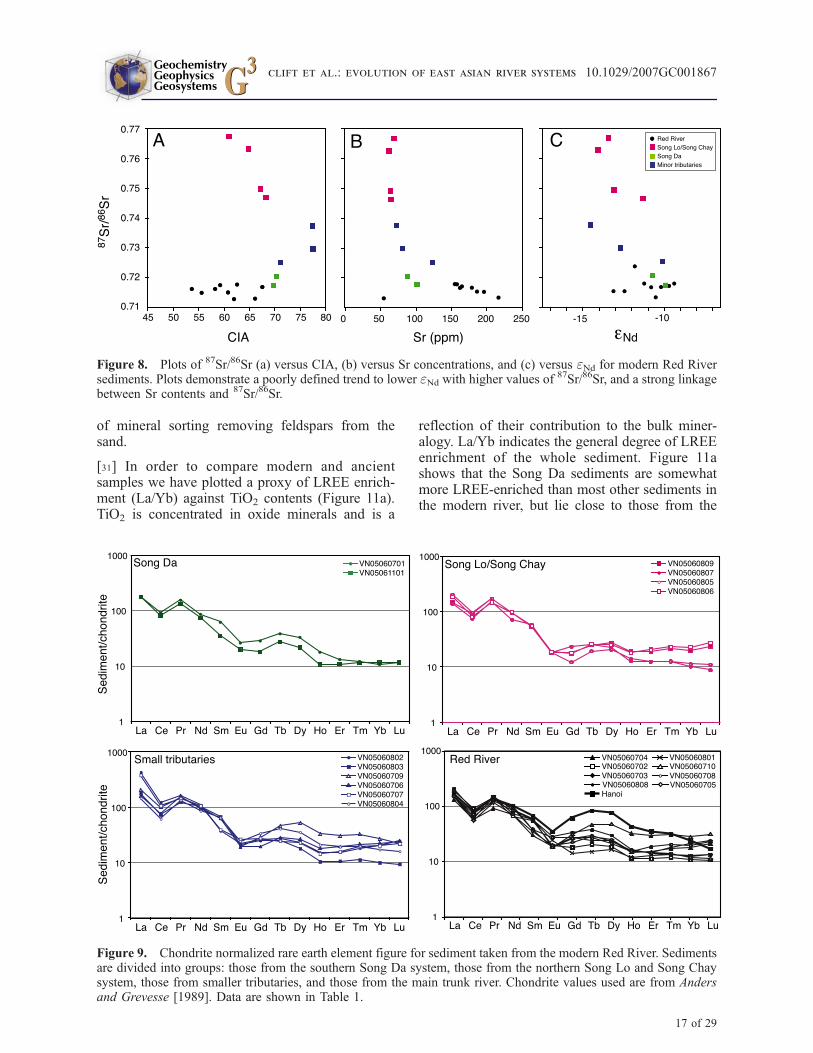
of mineral sorting removing feldspars from thesand.
[31] In order to compare modern and ancientsamples we have plotted a proxy of LREE enrich-ment (La/Yb) against TiO2 contents (Figure 11a).TiO2 is concentrated in oxide minerals and is a
reflection of their contribution to the bulk miner-alogy. La/Yb indicates the general degree of LREEenrichment of the whole sediment. Figure 11ashows that the Song Da sediments are somewhatmore LREE-enriched than most other sediments inthe modern river, but lie close to those from the
Figure 8. Plots of 87Sr/86Sr (a) versus CIA, (b) versus Sr concentrations, and (c) versus eNd for modern Red Riversediments. Plots demonstrate a poorly defined trend to lower eNd with higher values of 87Sr/86Sr, and a strong linkagebetween Sr contents and 87Sr/86Sr.
Figure 9. Chondrite normalized rare earth element figure for sediment taken from the modern Red River. Sedimentsare divided into groups: those from the southern Song Da system, those from the northern Song Lo and Song Chaysystem, those from smaller tributaries, and those from the main trunk river. Chondrite values used are from Andersand Grevesse [1989]. Data are shown in Table 1.
GeochemistryGeophysicsGeosystems G3G3
clift et al.: evolution of east asian river systems 10.1029/2007GC001867
17 of 29
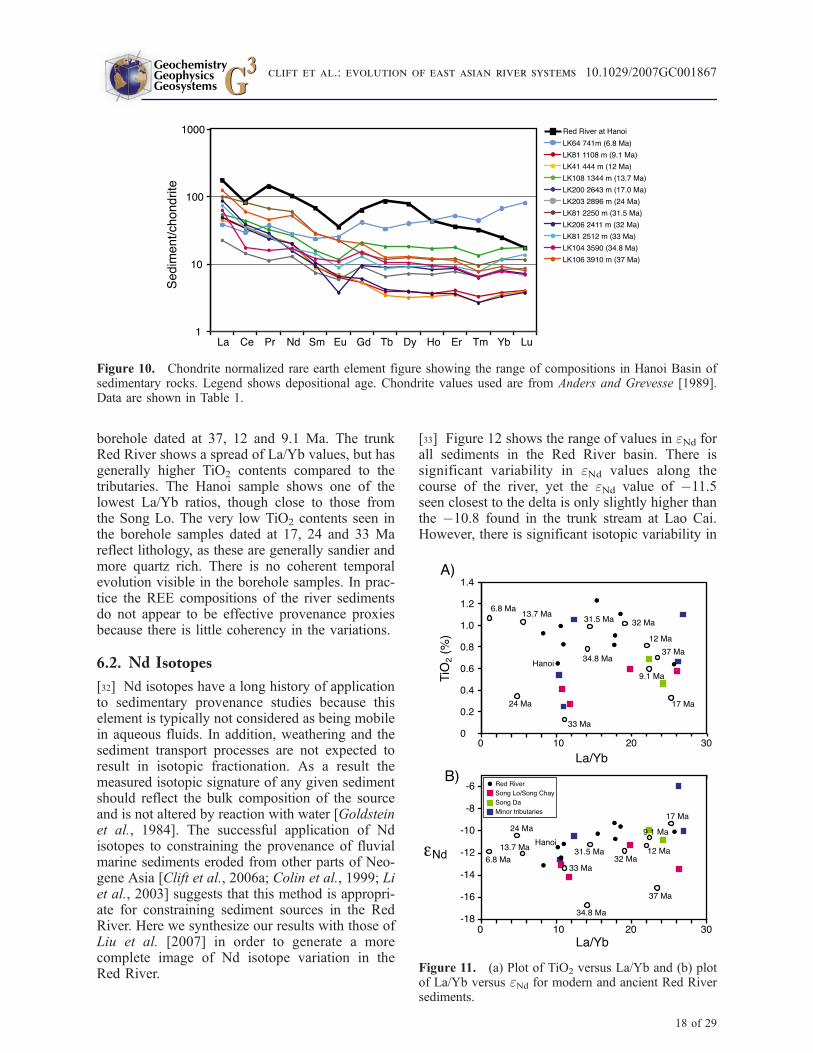
borehole dated at 37, 12 and 9.1 Ma. The trunkRed River shows a spread of La/Yb values, but hasgenerally higher TiO2 contents compared to thetributaries. The Hanoi sample shows one of thelowest La/Yb ratios, though close to those fromthe Song Lo. The very low TiO2 contents seen inthe borehole samples dated at 17, 24 and 33 Mareflect lithology, as these are generally sandier andmore quartz rich. There is no coherent temporalevolution visible in the borehole samples. In prac-tice the REE compositions of the river sedimentsdo not appear to be effective provenance proxiesbecause there is little coherency in the variations.
6.2. Nd Isotopes
[32] Nd isotopes have a long history of applicationto sedimentary provenance studies because thiselement is typically not considered as being mobilein aqueous fluids. In addition, weathering and thesediment transport processes are not expected toresult in isotopic fractionation. As a result themeasured isotopic signature of any given sedimentshould reflect the bulk composition of the sourceand is not altered by reaction with water [Goldsteinet al., 1984]. The successful application of Ndisotopes to constraining the provenance of fluvialmarine sediments eroded from other parts of Neo-gene Asia [Clift et al., 2006a; Colin et al., 1999; Liet al., 2003] suggests that this method is appropri-ate for constraining sediment sources in the RedRiver. Here we synthesize our results with those ofLiu et al. [2007] in order to generate a morecomplete image of Nd isotope variation in theRed River.
[33] Figure 12 shows the range of values in eNd forall sediments in the Red River basin. There issignificant variability in eNd values along thecourse of the river, yet the eNd value of �11.5seen closest to the delta is only slightly higher thanthe �10.8 found in the trunk stream at Lao Cai.However, there is significant isotopic variability in
Figure 10. Chondrite normalized rare earth element figure showing the range of compositions in Hanoi Basin ofsedimentary rocks. Legend shows depositional age. Chondrite values used are from Anders and Grevesse [1989].Data are shown in Table 1.
Figure 11. (a) Plot of TiO2 versus La/Yb and (b) plotof La/Yb versus eNd for modern and ancient Red Riversediments.
GeochemistryGeophysicsGeosystems G3G3
clift et al.: evolution of east asian river systems 10.1029/2007GC001867
18 of 29
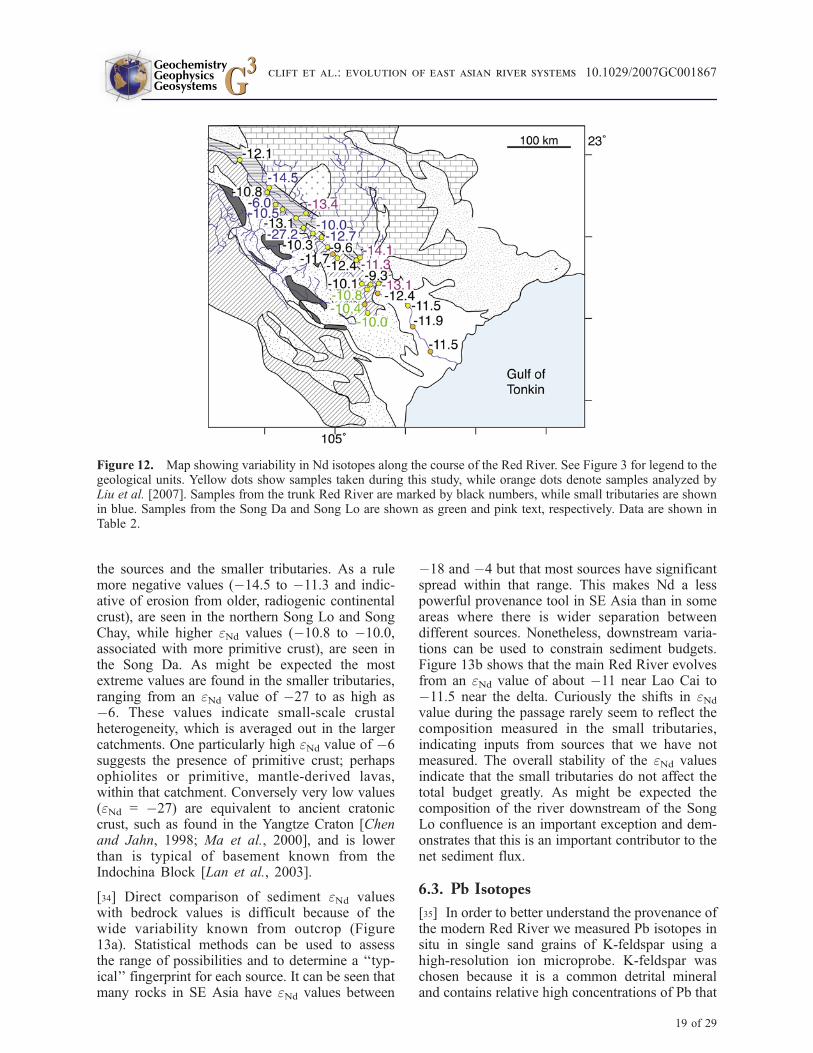
the sources and the smaller tributaries. As a rulemore negative values (�14.5 to �11.3 and indic-ative of erosion from older, radiogenic continentalcrust), are seen in the northern Song Lo and SongChay, while higher eNd values (�10.8 to �10.0,associated with more primitive crust), are seen inthe Song Da. As might be expected the mostextreme values are found in the smaller tributaries,ranging from an eNd value of �27 to as high as�6. These values indicate small-scale crustalheterogeneity, which is averaged out in the largercatchments. One particularly high eNd value of �6suggests the presence of primitive crust; perhapsophiolites or primitive, mantle-derived lavas,within that catchment. Conversely very low values(eNd = �27) are equivalent to ancient cratoniccrust, such as found in the Yangtze Craton [Chenand Jahn, 1998; Ma et al., 2000], and is lowerthan is typical of basement known from theIndochina Block [Lan et al., 2003].
[34] Direct comparison of sediment eNd valueswith bedrock values is difficult because of thewide variability known from outcrop (Figure13a). Statistical methods can be used to assessthe range of possibilities and to determine a ‘‘typ-ical’’ fingerprint for each source. It can be seen thatmany rocks in SE Asia have eNd values between
�18 and �4 but that most sources have significantspread within that range. This makes Nd a lesspowerful provenance tool in SE Asia than in someareas where there is wider separation betweendifferent sources. Nonetheless, downstream varia-tions can be used to constrain sediment budgets.Figure 13b shows that the main Red River evolvesfrom an eNd value of about �11 near Lao Cai to�11.5 near the delta. Curiously the shifts in eNdvalue during the passage rarely seem to reflect thecomposition measured in the small tributaries,indicating inputs from sources that we have notmeasured. The overall stability of the eNd valuesindicate that the small tributaries do not affect thetotal budget greatly. As might be expected thecomposition of the river downstream of the SongLo confluence is an important exception and dem-onstrates that this is an important contributor to thenet sediment flux.
6.3. Pb Isotopes
[35] In order to better understand the provenance ofthe modern Red River we measured Pb isotopes insitu in single sand grains of K-feldspar using ahigh-resolution ion microprobe. K-feldspar waschosen because it is a common detrital mineraland contains relative high concentrations of Pb that
Figure 12. Map showing variability in Nd isotopes along the course of the Red River. See Figure 3 for legend to thegeological units. Yellow dots show samples taken during this study, while orange dots denote samples analyzed byLiu et al. [2007]. Samples from the trunk Red River are marked by black numbers, while small tributaries are shownin blue. Samples from the Song Da and Song Lo are shown as green and pink text, respectively. Data are shown inTable 2.
GeochemistryGeophysicsGeosystems G3G3
clift et al.: evolution of east asian river systems 10.1029/2007GC001867
19 of 29
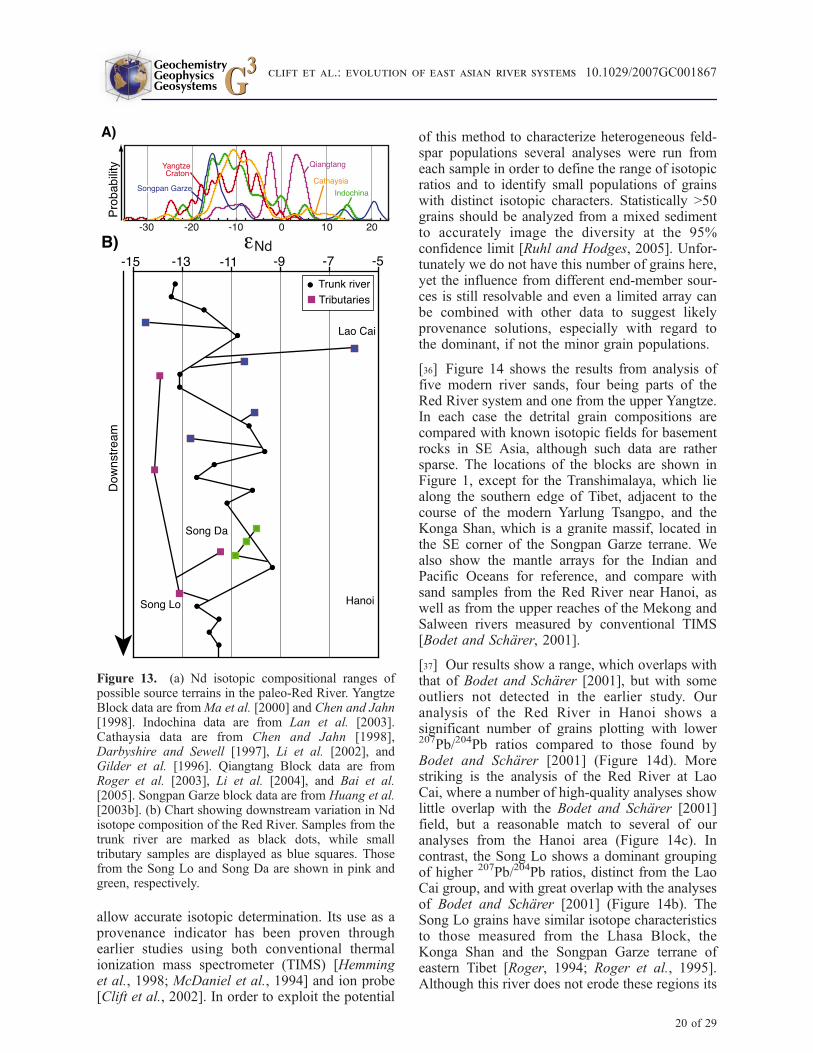
allow accurate isotopic determination. Its use as aprovenance indicator has been proven throughearlier studies using both conventional thermalionization mass spectrometer (TIMS) [Hemminget al., 1998; McDaniel et al., 1994] and ion probe[Clift et al., 2002]. In order to exploit the potential
of this method to characterize heterogeneous feld-spar populations several analyses were run fromeach sample in order to define the range of isotopicratios and to identify small populations of grainswith distinct isotopic characters. Statistically >50grains should be analyzed from a mixed sedimentto accurately image the diversity at the 95%confidence limit [Ruhl and Hodges, 2005]. Unfor-tunately we do not have this number of grains here,yet the influence from different end-member sour-ces is still resolvable and even a limited array canbe combined with other data to suggest likelyprovenance solutions, especially with regard tothe dominant, if not the minor grain populations.
[36] Figure 14 shows the results from analysis offive modern river sands, four being parts of theRed River system and one from the upper Yangtze.In each case the detrital grain compositions arecompared with known isotopic fields for basementrocks in SE Asia, although such data are rathersparse. The locations of the blocks are shown inFigure 1, except for the Transhimalaya, which liealong the southern edge of Tibet, adjacent to thecourse of the modern Yarlung Tsangpo, and theKonga Shan, which is a granite massif, located inthe SE corner of the Songpan Garze terrane. Wealso show the mantle arrays for the Indian andPacific Oceans for reference, and compare withsand samples from the Red River near Hanoi, aswell as from the upper reaches of the Mekong andSalween rivers measured by conventional TIMS[Bodet and Scharer, 2001].
[37] Our results show a range, which overlaps withthat of Bodet and Scharer [2001], but with someoutliers not detected in the earlier study. Ouranalysis of the Red River in Hanoi shows asignificant number of grains plotting with lower207Pb/204Pb ratios compared to those found byBodet and Scharer [2001] (Figure 14d). Morestriking is the analysis of the Red River at LaoCai, where a number of high-quality analyses showlittle overlap with the Bodet and Scharer [2001]field, but a reasonable match to several of ouranalyses from the Hanoi area (Figure 14c). Incontrast, the Song Lo shows a dominant groupingof higher 207Pb/204Pb ratios, distinct from the LaoCai group, and with great overlap with the analysesof Bodet and Scharer [2001] (Figure 14b). TheSong Lo grains have similar isotope characteristicsto those measured from the Lhasa Block, theKonga Shan and the Songpan Garze terrane ofeastern Tibet [Roger, 1994; Roger et al., 1995].Although this river does not erode these regions its
Figure 13. (a) Nd isotopic compositional ranges ofpossible source terrains in the paleo-Red River. YangtzeBlock data are fromMa et al. [2000] and Chen and Jahn[1998]. Indochina data are from Lan et al. [2003].Cathaysia data are from Chen and Jahn [1998],Darbyshire and Sewell [1997], Li et al. [2002], andGilder et al. [1996]. Qiangtang Block data are fromRoger et al. [2003], Li et al. [2004], and Bai et al.[2005]. Songpan Garze block data are from Huang et al.[2003b]. (b) Chart showing downstream variation in Ndisotope composition of the Red River. Samples from thetrunk river are marked as black dots, while smalltributary samples are displayed as blue squares. Thosefrom the Song Lo and Song Da are shown in pink andgreen, respectively.
GeochemistryGeophysicsGeosystems G3G3
clift et al.: evolution of east asian river systems 10.1029/2007GC001867
20 of 29
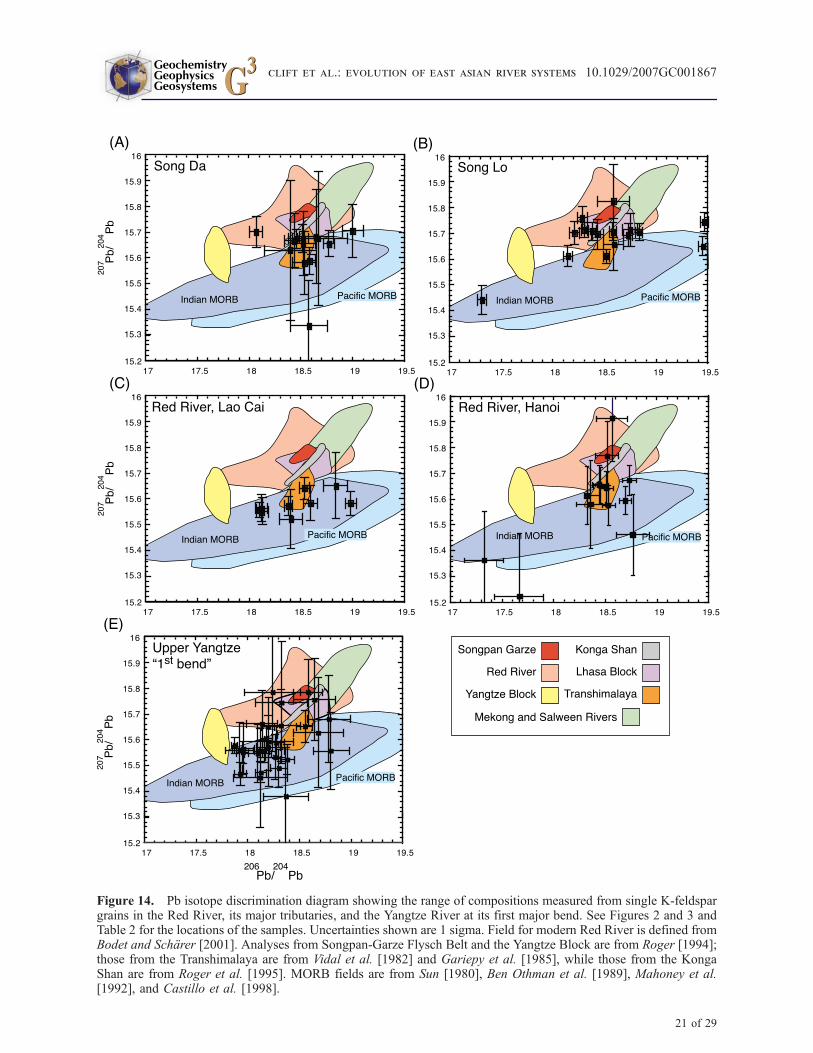
Figure 14. Pb isotope discrimination diagram showing the range of compositions measured from single K-feldspargrains in the Red River, its major tributaries, and the Yangtze River at its first major bend. See Figures 2 and 3 andTable 2 for the locations of the samples. Uncertainties shown are 1 sigma. Field for modern Red River is defined fromBodet and Scharer [2001]. Analyses from Songpan-Garze Flysch Belt and the Yangtze Block are from Roger [1994];those from the Transhimalaya are from Vidal et al. [1982] and Gariepy et al. [1985], while those from the KongaShan are from Roger et al. [1995]. MORB fields are from Sun [1980], Ben Othman et al. [1989], Mahoney et al.[1992], and Castillo et al. [1998].
GeochemistryGeophysicsGeosystems G3G3
clift et al.: evolution of east asian river systems 10.1029/2007GC001867
21 of 29
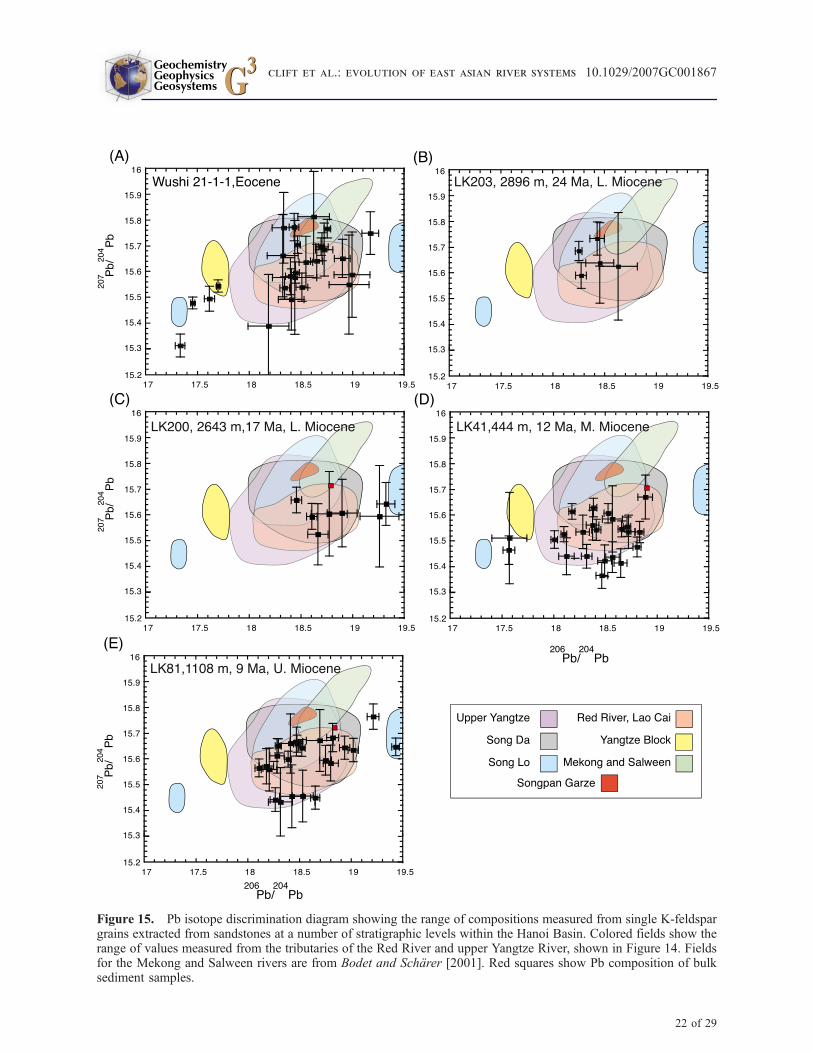
Figure 15. Pb isotope discrimination diagram showing the range of compositions measured from single K-feldspargrains extracted from sandstones at a number of stratigraphic levels within the Hanoi Basin. Colored fields show therange of values measured from the tributaries of the Red River and upper Yangtze River, shown in Figure 14. Fieldsfor the Mekong and Salween rivers are from Bodet and Scharer [2001]. Red squares show Pb composition of bulksediment samples.
GeochemistryGeophysicsGeosystems G3G3
clift et al.: evolution of east asian river systems 10.1029/2007GC001867
22 of 29
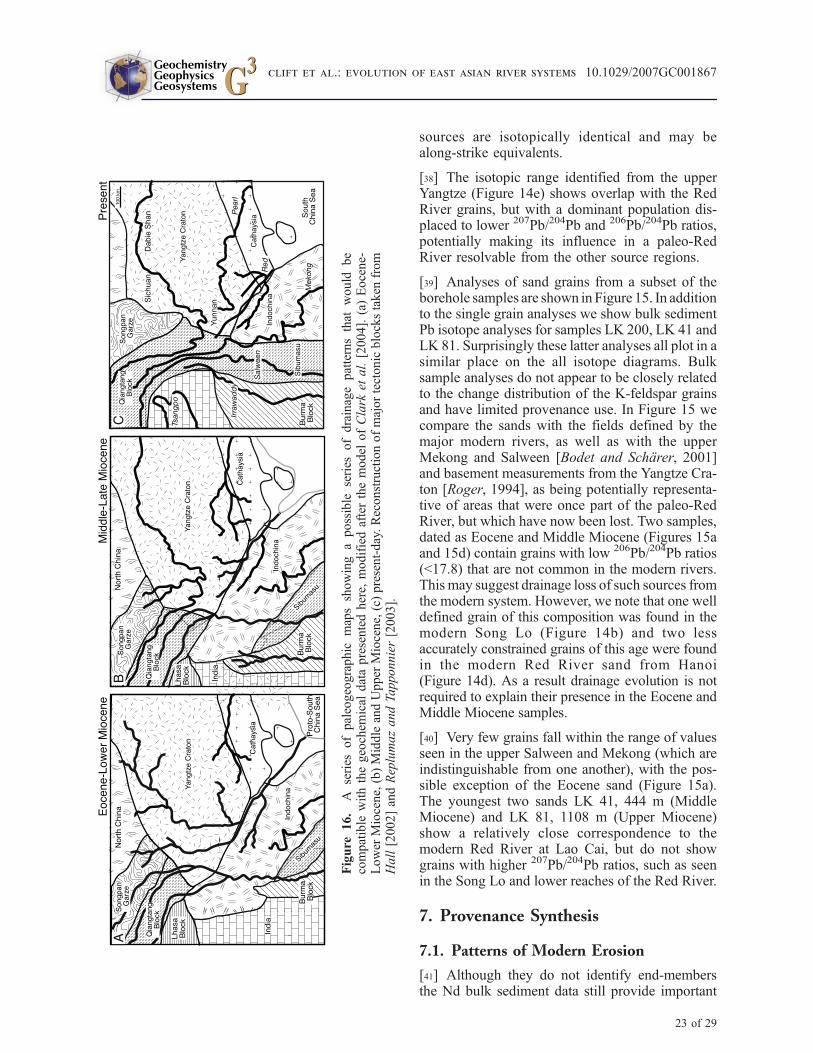
sources are isotopically identical and may bealong-strike equivalents.
[38] The isotopic range identified from the upperYangtze (Figure 14e) shows overlap with the RedRiver grains, but with a dominant population dis-placed to lower 207Pb/204Pb and 206Pb/204Pb ratios,potentially making its influence in a paleo-RedRiver resolvable from the other source regions.
[39] Analyses of sand grains from a subset of theborehole samples are shown in Figure 15. In additionto the single grain analyses we show bulk sedimentPb isotope analyses for samples LK 200, LK 41 andLK 81. Surprisingly these latter analyses all plot in asimilar place on the all isotope diagrams. Bulksample analyses do not appear to be closely relatedto the change distribution of the K-feldspar grainsand have limited provenance use. In Figure 15 wecompare the sands with the fields defined by themajor modern rivers, as well as with the upperMekong and Salween [Bodet and Scharer, 2001]and basement measurements from the Yangtze Cra-ton [Roger, 1994], as being potentially representa-tive of areas that were once part of the paleo-RedRiver, but which have now been lost. Two samples,dated as Eocene and Middle Miocene (Figures 15aand 15d) contain grains with low 206Pb/204Pb ratios(<17.8) that are not common in the modern rivers.This may suggest drainage loss of such sources fromthe modern system. However, we note that one welldefined grain of this composition was found in themodern Song Lo (Figure 14b) and two lessaccurately constrained grains of this age were foundin the modern Red River sand from Hanoi(Figure 14d). As a result drainage evolution is notrequired to explain their presence in the Eocene andMiddle Miocene samples.
[40] Very few grains fall within the range of valuesseen in the upper Salween and Mekong (which areindistinguishable from one another), with the pos-sible exception of the Eocene sand (Figure 15a).The youngest two sands LK 41, 444 m (MiddleMiocene) and LK 81, 1108 m (Upper Miocene)show a relatively close correspondence to themodern Red River at Lao Cai, but do not showgrains with higher 207Pb/204Pb ratios, such as seenin the Song Lo and lower reaches of the Red River.
7. Provenance Synthesis
7.1. Patterns of Modern Erosion
[41] Although they do not identify end-membersthe Nd bulk sediment data still provide important
Figure
16.
Aseries
ofpaleogeographic
mapsshowing
apossible
series
ofdrainagepatternsthat
would
be
compatible
withthegeochem
ical
datapresentedhere,
modifiedafterthemodel
ofClark
etal.[2004].(a)Eocene-
Lower
Miocene,(b)MiddleandUpper
Miocene,(c)present-day.Reconstructionofmajortectonicblockstaken
from
Hall[2002]andReplumazandTapponnier[2003].
GeochemistryGeophysicsGeosystems G3G3
clift et al.: evolution of east asian river systems 10.1029/2007GC001867
23 of 29
controls on where the sediment in the modernRed River is being eroded. In this respect theyare more useful than the more random REE data.The drop in eNd values in the Red River down-stream of the Song Lo confluence shows that thistributary is a major supplier of sediment to thetrunk stream. A simple mixing calculation usingsamples up and downstream of the confluencewould indicate that �80% of the Nd budget comesfrom the Song Lo. However, the Red River stabil-izes at slightly higher eNd values downstream. If the
eNd value of�11.5 is taken asmore representative ofthe lower Red River then this implies that �40% ofthe modern clastic load is derived from the Song Lo.It should be noted that because our study focuses onthe bed load sediments the budget for the suspendedsediments could potentially be quite different.
[42] The influence of the Song Da is harder toassess because of the Hoa Binh dam and becausethe eNd value of the Red River downstream ofthe Song Da confluence is even less negativethan the highest sediment eNd value seen in theSong Da meaning that its value cannot beexplained by simple mixing of the sedimentsmeasured upstream of the confluence. Nonethe-less, the strong shift to higher eNd values in theRed River downstream of the Song Da conflu-ence does suggest that this is an importantcontributor of material and must have been moreso prior to damming. In contrast, the smallertributaries between Hanoi and Lao Cai, erodingthe Day Nui Con Voi, do not appear to disturbthe Nd budget to a measurable degree. Similarlythey make no perceptible impression on the Srbudget. Such a result is in accord with thesuggestion by Clift et al. [2006b] that the upperreaches of the Red River in China are the mostimportant sources of sediment to the delta. Mon-soon precipitation is heavy in the Day Nui ConVoi, yet this alone is insufficient to drive rapiderosion. Instead active rock uplift is required aswell. Rapid neotectonic deformation is noted inthe upper reaches of the Red River in Yunnanand northern Vietnam, associated with the RedRiver and Song Chay Faults [Chen et al., 1999;Wang and Ye, 2006]. In addition, there is recentuplift of the Song Chay metamorphic domelinked with reversal of motion on the Red RiverFault Zone [Replumaz et al., 2001] and whichmay be responsible for the faster erosion seen inthe Song Chay-Song Lo system [Maluski et al.,2001].
7.2. Evolving Drainage Patterns
[43] The Pb isotope data from the boreholes arestrongly indicative of drainage capture affecting theRed River since the Eocene. Our new data confirmthe suggestion by Clift et al. [2004] that the Eocenecontains a minority population of grains with low206Pb/204Pb ratios, which are most consistent witherosion from the Yangtze Craton. This wouldrequire reverse flow from the middle Yangtze intothe Red River [Clark et al., 2004]. However, ourwork shows that such grains can also be found inthe modern Song Lo, though still presumablyeroded from the Yangtze Craton. It is the associa-tion with low eNd values in the Eocene and themismatch in eroded and sedimented volumes [Cliftet al., 2006a] that makes the case for majordrainage reorganization and suggests the middleYangtze as the source of these grains, rather thanthe Song Lo. Two low 206Pb/204Pb grains are alsofound in the 12 Ma Middle Miocene sample(Figure 13d), but are not seen in the 9 Ma UpperMiocene sample. There are insufficient grainsanalyzed from the 24 and 17 Ma samples to besure that this grain population is not present atthose times. The disappearance of low 206Pb/204Pbgrains suggests additional drainage capture be-tween 12 and 9 Ma. Assuming the middle Yangtzewas lost prior to the Early Miocene [Clift et al.,2006a] then the reorganization between 12 and 9Ma must involve another tributary draining fromthe NE into the Red River. It is noteworthy thatneither of the 12 or 9 Ma sands contains grainswith high 207Pb/204Pb ratios, as typify the modernSong Lo. This suggests that the Song Lo has onlybeen captured into the Red River after 9 Ma(Figure 16).
[44] Very few grains from the Hanoi Basin thatpredate Sample LK 41, 444 m (deposited at 12 Ma)plot with Pb isotope compositions typical of theupper Yangtze. Although too few grains wereanalyzed from Samples LK 200, 2643 m and LK203, 2896 m (dated at 24 and 17 Ma) for them tobe good representatives of the clastic flux theEocene sample Wushi 22-3-1 yielded 22 analyses,which suggests that there was no connection tothose areas now eroded by the upper Yangtze Riverat that time. Because of the degree of isotopicoverlap between the different possible sources wecannot exclude the influence of the upper Yangzteto the Red River before 12 Ma. However, thereare regions of isotope space, especially around207Pb/204Pb values of 15.5 and 207Pb/204Pb of18.0, that are uniquely and quite commonly found
GeochemistryGeophysicsGeosystems G3G3
clift et al.: evolution of east asian river systems 10.1029/2007GC001867
24 of 29
in the modern upper Yangtze. Because we do notfind grains with that composition in the pre-12 Masamples there is no compelling case for linking theupper Yangzte to the paleo-Red River at that time.Nonetheless, the isotopic overlap prevents us fromexcluding the possibility of a connection. We canonly conclude that it is not the most likely paleo-drainage pattern.
[45] This preferred model is at odds with thatproposed Clark et al. [2004], which predicted boththe middle and upper Yangtze as having drainedinto the Red River at this time. Few Eocene grainseven plot in the defined range of the upper Salweenand Mekong [Bodet and Scharer, 2001]. If theupper Yangtze did not connect with the Red Riverthen presumably it must have found an alternativeroute to the ocean via SE Asia. In turn this preventsa connection between the Yarlung, Salween orMekong with the paleo-Red River, since they couldnot cross the Yangtze. Within the constraints of ourdata there is no compelling evidence of erosionfrom eastern Tibet in these Eocene sandstones,although a connection with the middle Yangtzeseems clearer. The data do allow a connectionbetween the Red River and the Upper Yangtzeduring the Middle and Upper Miocene (Figure 15d),but this is not required because rocks of thiscomposition are known from the modern upperRed River.
[46] Our new Nd and Pb data can help interpret theCenozoic Nd evolution seen in the Hanoi Basin[Clift et al., 2006a]. A rise in eNd values from �17to �12 between 37 Ma and 24 Ma was interpretedas reflecting loss of the middle Yangtze from thepaleo-Red River. Our data show that none of themajor rivers in the modern Red River is capable ofsupplying eNd of �17. This requires significantflux from a region of low eNd, such as the YangtzeCraton, to account for the average composition.The rather positive eNd values seen in the Qiang-tang and Cathaysia Blocks means that erosionalflux from these regions cannot have been high inthe Oligocene. However, average eNd values ofaround �15 for the Songpan Garze terrane allowsthis source to have been important as a sedimentsource to the Red River during the Eo-Oligocene.Pb isotope data broadly support this paleo-drainagepattern (Figure 16), as Eocene grains with high207Pb/204Pb values (Figure 15a) fall within theknown Songpan Garze range [Huang et al.,2003a], but are gone before 12 Ma and maybemuch earlier. There is little Pb evidence of sedi-
ment flux from the Songpan Garze after the EarlyMiocene.
[47] Our probe data from the Hanoi Basin sectionindicate at least four phases of erosion. (1)Eocene, (2) Middle Miocene (12 Ma), with no207Pb/204Pb ratios > 15.7, but including grainswith 206Pb/204Pb ratios < 17.7, (3) Upper Mio-cene (9 Ma) when the low 206Pb/204Pb grainshave disappeared, and (4) modern river in whichgrains with 207Pb/204Pb > 15.7 are seen in bothTIMS and SIMS analyses. In the modern riverthe high 207Pb/204Pb grains are provided by theSong Lo, which must be captured after 9 Mainto the Red River (Figure 16). The paleo-SongLo presumably formed an independent riverflowing to the South China Sea, or was part ofthe Pearl River.
[48] The combined isotope data indicate thatdrainage capture has continued through the Ce-nozoic. Although Clift et al. [2006a] emphasizedmajor capture prior to 24 Ma we show thatsediment composition continued to change afterthat time, even since 9 Ma. This is consistentwith the continued mismatch between eroded anddeposited volumes of sediment that require thepaleo-Red River basin to have been much largerin the past [Clift et al., 2006a]. Although initialtopographic uplift of the paleo-Red River basinmust have initiated in the Oligocene, as easternAsia reversed its regional tilt from westward toeastward [Wang, 2004], the uplift continues tothe present day. There is a general trend ofsurface uplift becoming younger to the southeast.While gorge cutting in Sichuan has been used todate major uplift there starting at 13–9 Ma[Clark et al., 2005], uplift in the region of themodern Red River is Pliocene and younger[Schoenbohm et al., 2006]. Thus continued drain-age capture is a logical outcome of the contin-uously changing topography in SE Asia duringthe Cenozoic.
8. Crustal Heterogeneity
[49] Our data provide additional constraints on thenature of crustal heterogeneity in SE Asia. Ndisotopes show a wide variation at small scales butsimilar averages over wider regions. eNd values ofthe Mekong and Red River deltas are �10.1 and�11.5 [Clift et al., 2006a], while the Pearl andYangtze yield values of �10.4 and �12.3, respec-tively [Liu et al., 2007; Yang et al., 2007]. If onlythe upper Yangtze is considered then the eNd value
GeochemistryGeophysicsGeosystems G3G3
clift et al.: evolution of east asian river systems 10.1029/2007GC001867
25 of 29
is around �10.5 [Clift et al., 2004; Yang et al.,2007]. This is a very tight range compared to riversin south Asia and suggests that with the importantexception of the Yangtze Craton much of easternAsia has similar Nd isotope characteristics. Al-though the different blocks are separated fromone another by Cenozoic and Mesozoic suturezones the Nd isotopes indicate similar timing andprocesses of crustal generation.
[50] The Nd analysis of Red River tributariesreveals crustal heterogeneity on a variety of scales.Small-scale crustal blocks are revealed within theDay Nui Con Voi, close to the Red River FaultZone and site of an earlier Triassic suture zone[Metcalfe, 1996]. The presence of very low eNdvalues (down to �27) SW of the Red River FaultZone suggests the presence of fragments of ancientcrust, likely Yangtze Craton, in that region. TheSong Lo and Song Chay show contrasting Nd, Srand Pb isotope characteristics compared to themain Red River, especially in its upper reaches,and with the Song Da to the SW. This patterndemonstrates the geochemical separation of Indo-china from China and the differences between theYangtze Craton and most of Tibet. K-feldspar grainsfrom the Song Lo have similar Pb isotope character-istics to those measured from the Lhasa Block, theKonga Shan and the Songpan Garze terrane ofeastern Tibet [Roger, 1994; Roger et al., 1995]. Thismay reflect their similar origins as Gondwana crustalblocks accreted to Asia and forming an activemargin prior to India-Asia collision.
[51] The Songpan Garze moderately differs inisotope character from the surrounding blocks,reflecting its mixed erosional origin as an accre-tionary complex sandwiched between north Chinaand the Yangtze Craton [Weislogel et al., 2006;Zhou and Graham, 1996]. It is also noteworthythat the Pb isotope characteristics of K-feldspargrains from the upper Yangtze are quite differentfrom those measured in the upper Mekong andSalween River. While Bodet and Scharer [2001]demonstrated an isotopic overlap of these latterrivers, the upper Yangtze has lower 207Pb/204Pband 206Pb/204Pb ratios compared to those drain-ages. We conclude that the northern QiangtangBlock has a unique petrological and tectonic his-tory compared to the central and southern regionsdrained by the Mekong and Salween. Field studieshave shown that the north comprises accretedoceanic arc units (e.g., Yidun arc [Reid et al.,
2005]) and accretionary complexes [Kapp et al.,2000; Li and Zheng, 1993].
9. Conclusions
[52] The data presented here reveal a more detailedunderstanding of erosion processes in the RedRiver basin than previously possible. REE datado not appear to be effective provenance poxies.CIA values show no coherent evolution down-stream from Lao Cai to Hanoi. This and otherproxies for weathering shows that little sediment isadded to the trunk river from small streams drain-ing the Day Nui Con Voi in the middle reaches.Chemical weathering measured by CIA appears tobe stronger in the Song Da and Song Lo basins.The Song Lo and Song Chay have an especiallydramatic effect on the Sr budget of the river. Thispartially reflects stronger chemical weathering, butis largely a provenance effect, linked to the abun-dance of Paleozoic carbonates in that region. Wecalculate that 25% of the Sr reaching the ocean isderived from the Song Lo.
[53] The new Nd and Pb data support the sugges-tion that most of the erosion in the modern RedRiver occurs in its upper reaches [Clift et al.,2006b; Liu et al., 2007]. However, our work nowhighlights the importance of the Song Lo, whichsupplies 40% of the Nd budget to the delta. Pbisotopes too show how the composition of thetrunk river changes downstream of the SongLo confluence, most notably a shift to higher207Pb/204Pb ratios. The strongest erosion is notlocated where monsoon rains are heaviest, but onlywhere these are also associated with active rockuplift.
[54] Analysis of Pb isotopes in sedimentary rocksfrom the Hanoi Basin demonstrates that drainagecapture affected the Red River basin during theNeogene, as well as in the Oligocene, as earlierdemonstrated by Nd isotopes [Clift et al., 2006a].Bulk sample Pb analyses do not appear to beclosely related to the range found in K-feldspargrains and thus have limited provenance use.Grains with low 207Pb/204Pb and 206Pb/204Pb ratiosare indicative of erosion from the Yangtze Cratonand links between the middle Yangtze and RedRiver during the Eocene and possibly as late as12 Ma. There is no geochemical evidence tosupport a connection with the upper Yangtze orwith the upper Mekong and Salween, but a linkwith erosion of the Songpan Garze is consistent
GeochemistryGeophysicsGeosystems G3G3
clift et al.: evolution of east asian river systems 10.1029/2007GC001867
26 of 29
with both Pb and Nd data. Pb compositions typicalof grains in the modern Song Lo are not seen untilafter 9 Ma. Capture of the Song Lo into the RedRiver may have postdated 6.8 Ma. Prior to thistime the Song Lo must have been independent ordrained into the Pearl River.
[55] We conclude that combined trace element andisotopic studies can be effective at constrainingerosion patterns in modern river systems, but thatsingle isotope systems alone are less powerful. Ineast Asia Nd is less useful than in south Asiabecause so many of the sources have similar isotopecharacters, with the exception of the YangtzeCraton and Cathaysia block.
Acknowledgments
[56] We thank the Natural Environment Research Council
(NERC) for supplying analytical time on the Edinburgh ion
probe facility. We thank Anne Kelly and Vincent Gallagher for
their help in the Sr and Nd analysis. National Science
Foundation (NSF) provided travel funding for Clift to visit
Vietnam and collect samples. Clift thanks the Alexander Von
Humboldt Foundation for their support of his time at the
University of Bremen to complete the writing of this paper.
The paper was improved thanks to comments by Christophe
Colin and two anonymous reviewers.
References
Abbey, S. (1983), Studies in ‘‘Standard Samples’’ of silicaterocks minerals 1969–1982, Geol. Surv. Can. Pap.83-15, 1–114, Ottawa.
Abouchami, W., S. J. G. Galer, and A. Koschinsky (1999), Pband Nd isotopes in NE Atlantic Fe-Mn crusts: Proxies fortrace metal paleosources and paleocean circulation, Geo-chim. Cosmochim. Acta, 63, 1489–1505, doi:10.1016/S0016-7037(99)00068-X.
Anders, E., and N. Grevesse (1989), Abundances of the ele-ments: Meteoric and solar, Geochim. Cosmochim. Acta, 53,197–214, doi:10.1016/0016-7037(89)90286-X.
Bai, Y., L. I. Li, Z. Niu, and J. Cui (2005), Characteristics andtectonic setting of Eerlongba Formation volcanic rocks inGeladandong area of Central Qiangtang, Acta Geosci. Sin.,26, 113–120.
Ben Othman, D., W. M. White, and J. Patchett (1989), Thegeochemistry of marine sediments, island arc magma gen-esis, and crust-mantle recycling, Earth Planet, Sci. Lett., 94,1–21, doi:10.1016/0012-821X(89)90079-4.
Berggren, W. A., D. V. Kent, C. C. Swisher, M. P. Aubry(1995), Revised Cenozoic geochronology and chronostrati-graphy, in Geochronology, Time Scales and Global Strati-graphic Correlation, edited by W. A. Berggren et al., Spec.Publ. SEPM Soc. Sediment. Geol., 54, 129-212.
Bodet, F., and U. Scharer (2001), Pb isotope systematics andtime-integrated Th/U of SE-Asian continental crust recordedby single K-feldspar grains in large rivers, Chem. Geol., 177,265–285, doi:10.1016/S0009-2541(00)00413-7.
Brookfield, M. E. (1998), The evolution of the great riversystems of southern Asia during the Cenozoic India-Asia
collision: Rivers draining southwards, Geomorphology, 22,285–312, doi:10.1016/S0169-555X(97)00082-2.
Carter, A., D. Roques, C. Bristow, and P. D. Kinny (2001),Understanding Mesozoic accretion in southeast Asia: Signif-icance of Triassic thermotectonism (Indosinian orogeny) inVietnam, Geology, 29, 211 – 214, doi:10.1130/0091-7613(2001)029<0211:UMAISA>2.0.CO;2.
Castillo, P. R., J. H. Natland, Y. Niu, and P. F. Lonsdale (1998),Sr, Nd and Pb isotopic variation along the Pacific-Antarcticrisecrest, 53–57�S: Implications for the composition and dy-namics of the South Pacific upper mantle, Earth Planet, Sci.Lett., 154, 109–125, doi:10.1016/S0012-821X(97)00172-6.
Chen, J., and B.-M. Jahn (1998), Crustal evolution of south-eastern China: Nd and Sr isotopic evidence, Tectonophysics,284, 101–133, doi:10.1016/S0040-1951(97)00186-8.
Chen, Z., et al. (1999), GPS monitoring of the crustal motionin southwestern China, Chin. Sci. Bull., 44, 1804–1807.
Clark, M. K., L.M. Schoenbohm, L. H. Royden, K. X.Whipple,B. C. Burchfiel, X. Zhang, W. Tang, E. Wang, and L. Chen(2004), Surface uplift, tectonics, and erosion of eastern Tibetfrom large-scale drainage patterns, Tectonics, 23, TC1006,doi.10.1029/2002TC001402.
Clark, M. K., et al. (2005), Late Cenozoic uplift of southeast-ern Tibet, Geology, 33, 525–528, doi:10.1130/G21265.1.
Clift, P. D., et al. (2002), Nd and Pb isotope variability in theIndus River system: Implications for sediment provenanceand crustal heterogeneity in the western Himalaya, EarthPlanet. Sci. Lett., 200, 91 –106, doi:10.1016/S0012-821X(02)00620-9.
Clift, P. D., G. D. Layne, and J. Blusztajn (2004), Marinesedimentary evidence for monsoon strengthening, Tibetanuplift and drainage evolution in east Asia, in Continent-Ocean Interactions in the East Asian Marginal Seas,Geophys. Monogr. Ser, vol. 149, edited by P. Clift et al.,pp. 255–282, AGU, Washington, D. C.
Clift, P. D., J. Blusztajn, and A. D. Nguyen (2006a), Large-scale drainage capture and surface uplift in eastern Tibet–SW China before 24 Ma inferred from sediments of theHanoi Basin, Vietnam, Geophys. Res. Lett., 33, L19403,doi:10.1029/2006GL027772.
Clift, P. D., A. Carter, I. H. Campbell, M. S. Pringle, N. VanLap, C. M. Allen, K. V. Hodges, and M. T. Tan (2006b),Thermochronology of mineral grains in the Red and MekongRivers, Vietnam: Provenance and exhumation implicationsfor Southeast Asia, Geochem. Geophys. Geosyst., 7,Q10005, doi:10.1029/2006GC001336.
Colin, C., L. Turpin, J. Bertaux, A. Desprairies, and C. Kissel(1999), Erosional history of the Himalayan and Burmanranges during the last two glacial-interglacial cycles, EarthPlanet, Sci. Lett., 171, 647–660, doi:10.1016/S0012-821X(99)00184-3.
Darbyshire, D. P. F., and R. J. Sewell (1997), Nd and Sr iso-tope geochemistry of plutonic rocks from Hong Kong: Im-plications for granite petrogenesis, regional structure andcrustal evolution, Chem. Geol., 143, 81–93, doi:10.1016/S0009-2541(97)00101-0.
DePaolo, D. J., and G. J. Wasserburg (1976), Nd isotopicvariations and petrogenetic models, Geophys. Res. Lett., 3,249–252, doi:10.1029/GL003i005p00249.
Derry, L. A., and C. France-Lanord (1996), Neogene Himala-yan weathering history and river 87Sr/86Sr: Impact on themarine Sr record, Earth Planet. Sci. Lett., 142, 59–74,doi:10.1016/0012-821X(96)00091-X.
Galer, S. J. H. (1986), Chemical and Isotopic Studies of Crust-Mantle Differentiation and the Generation of Mantle Hetero-geneity, 278 pp., Univ. of Cambridge, Cambridge, U. K.
GeochemistryGeophysicsGeosystems G3G3
clift et al.: evolution of east asian river systems 10.1029/2007GC001867
27 of 29
Gariepy, C., C. J. Allegre, and R. H. Xu (1985), The Pb-isotopegeochemistry of granitoids from the Himalaya-Tibet collisionzone: Implications for crustal evolution, Earth Planet. Sci.Lett., 74, 220–234, doi:10.1016/0012-821X(85)90023-8.
Garzione, C. N., J. Quade, P. G. DeCelles, and N. B. English(2000), Predicting paleoelevation of Tibet and the Himalayafrom d18O vs. altitude gradients in meteoric water across theNepal Himalaya, Earth Planet. Sci. Lett., 183, 215–229,doi:10.1016/S0012-821X(00)00252-1.
Gilder, S. A., et al. (1996), Isotopic and paleomagnetic constraintson theMesozoic tectonic evolution of south China, J. Geophys.Res., 101, 16,137–16,155, doi:10.1029/96JB00662.
Goldstein, S. L., and P. J. Hamilton (1984), A Sm-Nd isotopicstudy of atmospheric dusts and particulates from major riversystemsEarth Planet. Sci. Lett., 70, 221–236, doi:10.1016/0012-821X(84)90007-4.
Govindaraju, K. (1994), Compilation of working values andsample description for 383 geostandards, Geostand. Newsl.,18, 1–158.
Hall, R. (2002), Cenozoic geological and plate tectonic evolu-tion of SE Asia and the SW Pacific: Computer-based recon-structions and animations, J, Asian Earth Sci., 20, 353–434,doi:10.1016/S1367-9120(01)00069-4.
Hamilton, P. J., R. K. Onions, D. Bridgwater, and A. Nutman(1983), Sm-Nd studies of Archean metasediments and meta-volcanics from west Greenland and their implications for theEarth’s early history, Earth Planet. Sci. Lett., 62, 263–272,doi:10.1016/0012-821X(83)90089-4.
Hannigan, R. E., and A. R. Basu (1998), Late diagenetic traceelement remobilization in organic-rich black shales of theTaconic foreland basin of Quebec, Ontario and New York,in Shales and Mudstones II, edited by J. Schieber et al.,pp. 209–234, Schweizerbart’sche, Zurich.
Hemming, S. R., et al. (1998), Provenance of Heinrich layersin Core V28-82, northeastern Atlantic: 40Ar/39Ar ages of ice-rafted hornblende, Pb isotopes in feldspar grains, and Nd-Sr-Pb isotopes in the fine sediment fraction, Earth Planet. Sci.Lett., 164, 317–333, doi:10.1016/S0012-821X(98)00224-6.
Huang, M., R. Maas, I. S. Buick, and I. S. Williams (2003a),Crustal response to continental collisions between the Tibet,Indian, South China and North China blocks: Geochronolo-gical constraints from the Songpan-Garze orogenic belt, wes-tern China, J. Metamorph. Geol., 21, 223–240.
Huang, M. H., I. S. Buick, and L. W. Hou (2003b), Tectono-metamorphic evolution of the eastern Tibet Plateau: Evi-dence from the central Songpan-Garze orogenic belt,western China, J. Petrol., 44, 255–278, doi:10.1093/petrology/44.2.255.
Kapp, P., et al. (2000), Blueschist-bearing metamorphic corecomplexes in the Qiangtang Block reveal deep crustal struc-ture of northern Tibet, Geology, 28, 19–22, doi:10.1130/0091-7613(2000)28<19:BMCCIT>2.0.CO;2.
Lan, C.-Y., et al. (2003), Geochemical and Sr-Nd isotopicconstraints from the Kontum massif, central Vietnam onthe crustal evolution of the Indochina block, PrecambrianRes., 122, 7–27, doi:10.1016/S0301-9268(02)00205-X.
Layne, G. D., and N. Shimizu (1998), Measurement of leadisotope ratios in common silicate and sulfide phases usingthe Cameca 1270 Ion Microprobe, in Secondary Ion MassSpectrometry SIMS XI, edited by G. Gillen, pp. 63–65, JohnWiley, New York.
Lepvrier, C., et al. (2004), The Early Triassic Indosinian oro-geny in Vietnam (Truong Son Belt and Kontum Massif):Implications for the geodynamic evolution of Indochina,Tectonophysics, 393, 87–118, doi:10.1016/j.tecto.2004.07.030.
Li, C., and A. Zheng (1993), Paleozoic stratigraphy in theQiangtang region of Tibet: Relations of the Gondwana andYangtze continents and ocean closure near the end of theCarboniferous, Int. Geol. Rev., 35, 797–804.
Li, Z.-X., X. Li, H. Zhou, and P. D. Kinny (2002), Grenvilliancontinental collision in South China: New SHRIMP U-Pbzircon results and implications for the configuration ofRodinia, Geology, 30, 163 – 166, doi:10.1130/0091-7613(2002)030<3C0163:3AGCCISC>2.0.CO;2.
Li, X., et al. (2003), Geochemical and Nd isotopic variations insediments of the South China Sea: A response to Cenozoictectonism in SE Asia, Earth Planet, Sci. Lett., 211, 207–220,doi:10.1016/S0012-821X(03)00229-2.
Li, C., Z.-H. He, and Z.-M. Lui (2004), U-Pb and Sm-Nddating of mafic dike swarms in southern Qiangtang, Qin-ghai-Tibet Plateau and its tectonic significance, Geol. China,31, 384–389.
Liu, Z., C. Colin, W. Huang, K. P. Le, S. Tong, Z. Chen, andA. Trentesaux (2007), Climatic and tectonic controls onweathering in south China and Indochina Peninsula: Claymineralogical and geochemical investigations from the Pearl,Red, and Mekong drainage basins, Geochem. Geophys. Geo-syst., 8, Q05005, doi:10.1029/2006GC001490.
Ma, C., C. Ehlers, C. Xu, Z. Li, and K. Yang (2000), The rootsof the Dabieshan ultrahigh-pressure metamorphic terrane;constraints from geochemistry and Nd-Sr isotope systema-tics, Precambrian Res., 102, 279–301, doi:10.1016/S0301-9268(00)00069-3.
Mahoney, J., A. P. le Roex, Z. Peng, R. L. Fisher, and J. H.Natland (1992), Southwestern limits of Indian Ocean ridgemantle and the origin of low 206Pb/204Pb mid-ocean ridgebasalt: Isotope systematics of the central Southwest IndianRidge (17�–50�E), J. Geophys. Res., 97, 19,771–19,790,doi:10.1029/92JB01424.
Maluski, H., et al. (2001), Ar-Ar and fission-track ages in theSong Chay Massif: Early Triassic and Cenozoic tectonics innorthern Vietnam, J. Asian Earth Sci., 19, 233–248,doi:10.1016/S1367-9120(00)00038-9.
McDaniel, D. K., S. R. Hemming, S. M. McLennan, and G. N.Hanson (1994), Petrographic, geochemical, and isotopic con-straints on the provenance of the early Proterozoic Chelms-ford Formation, Sudbury Basin, Ontario, J. Sediment. Res.Sect. A, 64, 362–372.
Metcalfe, I. (1996), Pre-Cretaceous evolution of SE Asianterranes, in Tectonic Evolution of SE Asia, edited by R. Halland D. J. Blundell, Geol. Soc. Spec. Publ., 106, 97-122.
Molnar, P., P. England, and J. Martinod (1993), Mantle dy-namics, uplift of the Tibetan Plateau, and the IndianMonsoon, Rev. Geophys., 31, 357–396, doi:10.1029/93RG02030.
Nesbitt, H. W., and G. M. Young (1982), Early Proterozoicclimates and plate motions inferred from major elementchemistry of lutites, Nature, 299, 715–717, doi:10.1038/299715a0.
Prell, W. L., and J. E. Kutzbach (1992), Sensitivity of theIndian Monsoon to forcing parameters and implications forits evolution, Nature, 360, 647–652, doi:10.1038/360647a0.
Reichen, L. E., and J. J. Fahey (1962), An improved methodfor the determination of FeO in rocks and minerals includinggarnet, U.S. Geol. Surv. Bull., 1144B, 1–5.
Reid, A. J., C. J. L. Wilson, D. Phillips, and S. Liu (2005),Mesozoic cooling across the Yidun Arc, central-easternTibetan Plateau: A reconnaissance 40Ar/39Ar study, Tecto-nophysics, 398, 45–66, doi:10.1016/j.tecto.2005.01.002.
Replumaz, A., and P. Tapponnier (2003), Reconstruction of thedeformed collision zone Between India and Asia by back-
GeochemistryGeophysicsGeosystems G3G3
clift et al.: evolution of east asian river systems 10.1029/2007GC001867
28 of 29
ward motion of lithospheric blocks, J. Geophys. Res.,108(B6), 2285, doi:10.1029/2001JB000661.
Replumaz, A., R. Lacassin, P. Tapponnier, and P. H. Leloup(2001), Large river offsets and Plio-Quaternary dextral sliprate on the Red River fault (Yunnan, China), J. Geophys.Res., 106, 819–836, doi:10.1029/2000JB900135.
Roger, F. (1994), Datation et tracage des granitodes associes ala chaine de Songpan-Garze (W. Sichuan, Chine) par lesmethods: U-Pb, Rb-Sr et Sm-Nd, Ph.D. thesis, 214 pp., Univ.Montpellier II, Montpellier, France.
Roger, F., et al. (1995), Miocene emplacement and deforma-tion of the Konga Shan granite (Xianshui He fault zone,West Sichuan, China): Geodynamic implications, EarthPlanet. Sci. Lett., 130, 201–216, doi:10.1016/0012-821X(94)00252-T.
Roger, F., N. Arnaud, S. Gilder, P. Tapponnier, M. Jolivet,M. Brunel, J. Malavieille, Z. Xu, and J. Yang (2003), Geo-chronological and geochemical constraints on Mesozoicsuturing in east central Tibet, Tectonics, 22(4), 1037,doi:10.1029/2002TC001466.
Ruhl, K. W., and K. V. Hodges (2005), The use of detritalmineral cooling ages to evaluate steady state assumptionsin active orogens: An example from the central NepaleseHimalaya, Tectonics , 24 , TC4015, doi:10.1029/2004TC001712.
Schoenbohm, L. M., B. C. Burchfiel, and L. Chen (2006),Propagation of surface uplift, lower crustal flow, and Ceno-zoic tectonics of the southeast margin of the Tibetan Plateau,Geology, 34, 813–816, doi:10.1130/G22679.1.
Singh, M., M. Sharma, and H. J. Tobschall (2005), Weatheringof the Ganga alluvial plain, northern India: Implications fromfluvial geochemistry of the Gomati River, Appl. Geochem.,20, 1–21, doi:10.1016/j.apgeochem.2004.07.005.
Spicer, R. A., et al. (2003), Constant elevation of southernTibet over the past 15 million years, Nature, 421, 622–624, doi:10.1038/nature01356.
Sun, S. S. (1980), Lead isotopic study of young volcanic rocksfrom mid-ocean ridges, ocean islands and island arcs, Philos.Trans. R. Soc. London, Ser. A, 297, 409–445.
Todt, W., R. A. Cliff, A. Hanser, and A. W. Hofmann (1996),Evaluation of a 202Pb-205Pb double spike for high-precisionlead isotope analysis, in Earth Processes: Reading the Iso-topic Code, Geophys. Monogr. Ser, vol. 95, edited by A. Basuand S. R. Hart, pp. 429–437, AGU, Washington, D. C.
Tyrrell, S., P. D. W. Haughton, J. S. Daly, T. F. Kokfelt, andD. Gagnevin (2006), The use of the common Pb isotopecomposition of detrital K-feldspar grains as a provenance tooland its application to Upper Carboniferous paleodrainage,northern England, J. Sediment. Res., 76, 324 –345,doi:10.2110/jsr.2006.023.
Vidal, P., A. Cocherie, and P. Le Fort (1982), Geochemicalinvestigations of the origin of the Manaslu leucogranite(Himalaya, Nepal), Geochim. Cosmochim. Acta, 46, 2279–2292, doi:10.1016/0016-7037(82)90201-0.
Wang, P. (2004), Cenozoic deformation and the history of sea-land interactions in Asia, in Continent-Ocean Interactions inthe East Asian Marginal Seas, Geophys. Monogr. Ser.,vol. 149, edited by P. Clift et al., pp. 1–22, AGU,Washington, D. C.
Wang, J., and Z. Ye (2006), Dynamic modeling for crustaldeformation in China: Comparisons between the theoreticalprediction and the recent GPS data, Phys Earth Planet Inter,155, 201–207, doi:10.1016/j.pepi.2005.11.003.
Weislogel, A. L., et al. (2006), Detrital zircon provenance ofthe Late Triassic Songpan-Ganzi complex: Sedimentary re-cord of collision of the North and South China blocks, Geol-ogy, 34, 97–100, doi:10.1130/G21929.1.
Yang, S., S. Y. Jiang, H. F. Ling, X. P. Xia, M. Sun, and D. J.Wang (2007), Sr-Nd isotopic compositions of the Chang-jiang sediments: Implications for tracing sediment sources,Sci. China, Ser. D, 50, 1556–1565.
Zhou, D., and S. A. Graham (1996), Songpan-Ganzi Triassicflysch complex of the West Qinling Shan as a remnant oceanbasin, in The Tectonic Evolution of Asia, edited by A. Yinand M. Harrison, pp. 281–299, Cambridge Univ. Press,Cambridge, U. K.
GeochemistryGeophysicsGeosystems G3G3
clift et al.: evolution of east asian river systems 10.1029/2007GC001867
29 of 29
Related Documents