Evolutionary Learning of Link Allocation Algorithms for 5G Heterogeneous Wireless Communications Networks David Lynch Natural Computing Research and Applications Group School of Business University College Dublin [email protected] Takfarinas Saber Natural Computing Research and Applications Group School of Computer Science University College Dublin [email protected] Stepan Kucera Nokia Bell Labs Blanchardstown Business and Technology Park Dublin [email protected] Holger Claussen Nokia Bell Labs Blanchardstown Business and Technology Park Dublin [email protected] Michael O’Neill Natural Computing Research and Applications Group School of Business University College Dublin [email protected] ABSTRACT Wireless communications networks are operating at breaking point during an era of relentless trac growth. Network operators must utilize scarce and expensive wireless spectrum eciently in order to satisfy demand. Spectrum on the links between cells and user equipments (‘users’: smartphones, tablets, etc.) frequently becomes congested. Capacity can be increased by transmiing data packets via multiple links. Packets can be routed through multiple Long Term Evolution (LTE) links in existing fourth generation (4G) net- works. In future 5G deployments, users will be equipped to receive packets over LTE, WiFi, and millimetre wave links simultaneously. How can we allocate spectrum on links, so that all customers experience an acceptable quality of service? Building eective schedulers for link allocation requires considerable human exper- tise. We automate the design process through the novel application of evolutionary algorithms. Evolved schedulers boost downlink rates by over 150% for the worst-performing users, relative to a single-link baseline. e proposed techniques signicantly outper- form a benchmark algorithm from the literature. e experiments illustrate the promise of evolutionary algorithms as a paradigm for managing 5G soware-dened wireless communications networks. KEYWORDS Link Allocation, Genetic Programming, Scheduling, 5G ACM Reference format: David Lynch, Takfarinas Saber, Stepan Kucera, Holger Claussen, and Michael O’Neill. 2019. Evolutionary Learning of Link Allocation Algorithms for 5G Heterogeneous Wireless Communications Networks. In Proceedings of Permission to make digital or hard copies of all or part of this work for personal or classroom use is granted without fee provided that copies are not made or distributed for prot or commercial advantage and that copies bear this notice and the full citation on the rst page. Copyrights for components of this work owned by others than ACM must be honored. Abstracting with credit is permied. To copy otherwise, or republish, to post on servers or to redistribute to lists, requires prior specic permission and/or a fee. Request permissions from [email protected]. GECCO ’19, Prague, Czech Republic © 2019 ACM. 978-1-4503-6111-8/19/07. . . $15.00 DOI: 10.1145/3321707.3321853 the Genetic and Evolutionary Computation Conference 2019, Prague, Czech Republic, July 13–17, 2019 (GECCO ’19), 8 pages. DOI: 10.1145/3321707.3321853 1 INTRODUCTION Wireless trac has been exploding in recent years due to the emer- gence of data-hungry smart devices. Operators such as AT&T Inc. must increase the capacity of their deployments in order to satisfy demand. One approach is to purchase additional wireless spectrum (i.e. radio bandwidth). However, spectrum is a scarce and expen- sive resource. A more cost-eective tactic is to utilize the available spectrum more eciently. e steadily increasing sophistication of wireless technology has been driven by unrelenting trac growth. In the rst generation (1G) analog systems, a single elevated antenna provided blanket coverage across an entire metropolitan region. Researchers at Bell Laboratories invented the cellular concept in the 1950s [11]. Here, multiple antennas form distinct cells in which the same spectrum can be reused. Increasingly innovating strategies for managing spectrum were developed in the digital 2G and 3G systems [13]. e idea of simultaneously routing packets through multiple LTE links was incorporated into the 4G standard [17]. Future 5G deployments will have a heterogeneous architecture whereby LTE, WiFi, and millimeter wave cells will coexist [3]. Schedulers for allocating spectrum on LTE and WiFi links have been presented in previous work [9, 15]. However, a unied framework for automatically constructing schedulers has not yet been proposed in the literature. Evolutionary algorithms lend themselves well to the 5G context for two main reasons. Firstly, they have been successfully employed to optimize 4G networks [7, 10]. Secondly, simulated evolution produces robust solutions in dynamic and uncertain environments [2, 14]. e main contributions of this paper are as follows: (1) A novel data-driven framework for synthesizing 5G net- work controllers is presented. Building network controllers is a complex task that requires signicant human eort [6]. Automation through evolution dispenses with the need for costly manual design. 1258

Welcome message from author
This document is posted to help you gain knowledge. Please leave a comment to let me know what you think about it! Share it to your friends and learn new things together.
Transcript
Evolutionary Learning of Link Allocation Algorithms for 5GHeterogeneous Wireless Communications Networks
David Lynch
Natural Computing Research and
Applications Group
School of Business
University College Dublin
Takfarinas Saber
Natural Computing Research and
Applications Group
School of Computer Science
University College Dublin
Stepan Kucera
Nokia Bell Labs
Blanchardstown Business and
Technology Park
Dublin
Holger Claussen
Nokia Bell Labs
Blanchardstown Business and
Technology Park
Dublin
Michael O’Neill
Natural Computing Research and
Applications Group
School of Business
University College Dublin
ABSTRACTWireless communications networks are operating at breaking point
during an era of relentless tra�c growth. Network operators must
utilize scarce and expensive wireless spectrum e�ciently in order
to satisfy demand. Spectrum on the links between cells and user
equipments (‘users’: smartphones, tablets, etc.) frequently becomes
congested. Capacity can be increased by transmi�ing data packets
via multiple links. Packets can be routed through multiple Long
Term Evolution (LTE) links in existing fourth generation (4G) net-
works. In future 5G deployments, users will be equipped to receive
packets over LTE, WiFi, and millimetre wave links simultaneously.
How can we allocate spectrum on links, so that all customers
experience an acceptable quality of service? Building e�ective
schedulers for link allocation requires considerable human exper-
tise. We automate the design process through the novel application
of evolutionary algorithms. Evolved schedulers boost downlink
rates by over 150% for the worst-performing users, relative to a
single-link baseline. �e proposed techniques signi�cantly outper-
form a benchmark algorithm from the literature. �e experiments
illustrate the promise of evolutionary algorithms as a paradigm for
managing 5G so�ware-de�ned wireless communications networks.
KEYWORDSLink Allocation, Genetic Programming, Scheduling, 5G
ACM Reference format:David Lynch, Takfarinas Saber, Stepan Kucera, Holger Claussen, and Michael
O’Neill. 2019. Evolutionary Learning of Link Allocation Algorithms for
5G Heterogeneous Wireless Communications Networks. In Proceedings of
Permission to make digital or hard copies of all or part of this work for personal or
classroom use is granted without fee provided that copies are not made or distributed
for pro�t or commercial advantage and that copies bear this notice and the full citation
on the �rst page. Copyrights for components of this work owned by others than ACM
must be honored. Abstracting with credit is permi�ed. To copy otherwise, or republish,
to post on servers or to redistribute to lists, requires prior speci�c permission and/or a
fee. Request permissions from [email protected].
GECCO ’19, Prague, Czech Republic© 2019 ACM. 978-1-4503-6111-8/19/07. . .$15.00
DOI: 10.1145/3321707.3321853
the Genetic and Evolutionary Computation Conference 2019, Prague, CzechRepublic, July 13–17, 2019 (GECCO ’19), 8 pages.
DOI: 10.1145/3321707.3321853
1 INTRODUCTIONWireless tra�c has been exploding in recent years due to the emer-
gence of data-hungry smart devices. Operators such as AT&T Inc.
must increase the capacity of their deployments in order to satisfy
demand. One approach is to purchase additional wireless spectrum
(i.e. radio bandwidth). However, spectrum is a scarce and expen-
sive resource. A more cost-e�ective tactic is to utilize the available
spectrum more e�ciently.
�e steadily increasing sophistication of wireless technology has
been driven by unrelenting tra�c growth. In the �rst generation
(1G) analog systems, a single elevated antenna provided blanket
coverage across an entire metropolitan region. Researchers at Bell
Laboratories invented the cellular concept in the 1950s [11]. Here,
multiple antennas form distinct cells in which the same spectrum
can be reused. Increasingly innovating strategies for managing
spectrum were developed in the digital 2G and 3G systems [13]. �e
idea of simultaneously routing packets through multiple LTE links
was incorporated into the 4G standard [17]. Future 5G deployments
will have a heterogeneous architecture whereby LTE, WiFi, and
millimeter wave cells will coexist [3]. Schedulers for allocating
spectrum on LTE and WiFi links have been presented in previous
work [9, 15]. However, a uni�ed framework for automatically
constructing schedulers has not yet been proposed in the literature.
Evolutionary algorithms lend themselves well to the 5G context
for two main reasons. Firstly, they have been successfully employed
to optimize 4G networks [7, 10]. Secondly, simulated evolution
produces robust solutions in dynamic and uncertain environments
[2, 14]. �e main contributions of this paper are as follows:
(1) A novel data-driven framework for synthesizing 5G net-
work controllers is presented. Building network controllers
is a complex task that requires signi�cant human e�ort [6].
Automation through evolution dispenses with the need for
costly manual design.
1258

GECCO ’19, July 13–17, 2019, Prague, Czech Republic D. Lynch, T. Saber, S. Kucera, H. Claussen, and M. O’Neill
(2) Evolution learns tailored strategies by leveraging training
data collected from within a deployment scenario. In�exi-
ble manually designed controllers are highly suboptimal
one-size-�ts-all solutions.
(3) Extensive simulations reveal that signi�cant performance
gains are achieved versus benchmark techniques.
(4) An analysis of the evolved strategies for allocating spec-
trum is presented.
We de�ne the optimization problem in the next section. �e
evolutionary techniques and benchmark algorithm are presented
in Section 3. �e simulation environment and experiments are
described in Section 4. A discussion of the results follows in Section
5. Finally, the paper concludes with a discussion of the contributions
and limitations of the research, and directions for future work.
2 PROBLEM DEFINITION�e bene�ts of exploiting multiple links are assessed in this section.
In single-link (SL) mode, users receive packets over just one link
(i.e. from only one cell). By contrast in multiple-link (ML) mode,
packets are routed via multiple links simultaneously. Sample cal-
culations show that users can experience an improved quality of
service in ML mode. Hence, the optimization problem addressed
by this paper is motivated.
2.1 Downlink RatesConsider the toy heterogeneous network (HetNet) containing two
LTE cells c1, c2 ∈ L and one WiFi cell c3 ∈ W that is depicted in
Figure 1. �ree users u1,u2,u3 ∈ Ut are active during some time
slot t . A time slot is a brief interval lasting several milliseconds
during which cells assimilate measurement data from users and
render optimization decisions. �e signal strength experienced
by a user from any cell depends on two factors: the transmi�ing
power of the cell, and how strongly the signal is a�enuated before
reaching the user. More formally, the signal received by useru from
cell c is given by
signalc,u = powerc + gainc,u , (1)
where powerc is the power of cell c in decibel-milliwa�s [dBm], and
gainc,u is the signal gain on the link from c to u in decibels [dB].
LTE and WiFi cells typically transmit at powers of 35 [dBm] and
20 [dBm] respectively. Link gains depend on weather conditions
and the distribution of buildings etc, since these factors a�ect how
radio waves propagate.
c1 c2
c3
u3u2
u1
Figure 1: Toy HetNet with WiFi and LTE cells.
u1 u2 u3
c1 −182 −173 −180
c2 −180 −179 −170
c3 −160 −165 −150
(a) gainc,u [dB]
u1 u2 u3
c1 −147 −138 −145
c2 −145 −144 −135
c3 −140 −145 −130
(b) signalc,u [dBm]
Table 1: �e signal gains on links between cells c and usersuin decibels (LHS) in the toy HetNet, and the signal strengthsin decibel-milliwatts (RHS) are displayed.
�e link gains in the toy HetNet, and the signal strengths pro-
vided by each link are displayed in Table 1. For instance, the signal
strength experienced by user u1 from cell c1 is given by
signalc1,u1
= powerc1
+ gainc1,u1
= 35 [dBm] − 182 [dB]
= −147 [dBm].
Now, cells that transmit across the same radio band will mutually
interfere. For example, a user that receives data from an LTE cell
is subject to interference from other nearby LTE cells. �e signal
to interference and noise ratio for a user u served by an LTE cell
c ∈ L is given by
SINRc,u =dBm w
(signalc,u
)dBm w (noise) +
∑c ′∈L\c
dBm w(signalc ′,u
) , (2)
where dBm w (·) is a function that converts the signal strength in
decibel-milliwa�s to wa�s, and noise = −124 [dBm] is background
electromagnetic noise. Set L in the denominator is replaced by set
W if c is a WiFi cell. Finally, it is convenient to de�ne the quality
of the link between c and u:
qualityc,u = log2
(1 + SINRc,u
). (3)
�e downlink rate quanti�es how much data is transferred over
a wireless link per unit time. Let ratec,u denote the downlink rate
on the link between c and u. �e value of ratec,u depends on three
factors: the link quality
(qualityc,u
), the spectrum over which c can
transmit
(spectrumc
), and the proportion of spectrum allocated tou
by c(schedulec,u
). Hence, Shannon’s formula yields the downlink
link rate as follows:
ratec,u = qualityc,u × spectrumc × schedulec,u . (4)
�e values schedulec,u ∈ [0, 1] specify how much spectrum c allo-
cates to each user u in the HetNet. LTE and WiFi cells typically
utilize spectral bandwidths of 20 [MHz] and 22 [MHz] respectively.
Our goal is to optimize the schedules for each cell in the HetNet.
Updated schedules must be computed on a millisecond timescale.
2.2 �ality of Service and Fairness�e sample calculations in Table 2 illustrate how downlink rates are
computed for users in the toy HetNet. Downlink rates are compared
in the SL and ML modes. Recall that each user connects to their
best-serving cell only in SL mode. �at is, a user receives packets
1259

Evolutionary Learning of Link Allocation Algorithms for 5G HetNets GECCO ’19, July 13–17, 2019, Prague, Czech Republic
over whatever link o�ers the highest signal quality. On the other
hand, a user can receive packets via multiple cells in ML mode.
u1 u2 u3
c1 0.01 0.06 0.01
c2 0.01 0.01 0.11
c3 0.04 0.01 0.32
(a) qualityc,u
u1 u2 u3
c1 0.00 1.00 0.00
c2 0.00 0.00 0.00
c3 0.50 0.00 0.50
(b) scheduleSLc,u
u1 u2 u3
c1 0.26 0.74 0.00
c2 0.68 0.25 0.07
c3 0.87 0.01 0.12
(c) scheduleMLc,u
c1 c2 c3
c1 20.0 20.0 22.0
(d) spectrumc [MHz]
u1 u2 u3
c1 0.00 1.20 0.00
c2 0.00 0.00 0.00
c3 0.44 0.00 3.52
(e) rateSLc,u [Mbps]
u1 u2 u3
c1 0.05 0.89 0.00
c2 0.14 0.05 0.15
c3 0.77 0.00 0.84
(f) rateMLc,u [Mbps]
Table 2: Downlink rates are computed for users in the toyHetNet. �e SL schedules in panel (b) and the ML schedulesin panel (c) are compared. A user receives spectrum on a sin-gle link in SL mode, but multiple links in ML mode. Shan-non’s formula yields the downlink rates displayed in panels(e) and (f).
�e link qualities between cells and users in the toy HetNet are
displayed in Table 2a. Table 2d indicates that LTE cells c1, c2 ∈ L
transmit over a 20 [MHz] band, whereas the WiFi cell c3 ∈ W
utilizes a distinct 22 [MHz] band. �e SL schedule in Table 2b can
be interpreted as follows. Usersu1 andu3 connect to cell c3 because
it o�ers them the best signal quality; both receive an equal 50% share
of the WiFi spectrum. Similarly, u2 connects to its best-serving cell
c1. All of the LTE spectrum is allocated to u2 on the link to c1, since
no other users connect to c1. A feasible ML schedule is displayed
in Table 2c. Each cell allocates a tunable proportion of its spectrum
to users u1,u2, and u3. For instance, c1 allocates 26% of the LTE
spectrum on the link to u1, the remaining 74% of the LTE spectrum
on the link to u2, and 0% of the LTE spectrum on the link to u3.
Shannon’s formula yields the downlink rates on each link. For
instance, the downlink rate on the link between c1 and u1 under
the ML schedule is given by
rateMLc1,u1
= qualityc1,u1
× spectrumc1
× scheduleMLc1,u1
= 0.01 × 20.0 [MHz] × 0.26
= 0.05 [Mbps].
�e aggregate downlink rate for u1 over all available links is:
rateMLu1
= rateMLc1,u1
+ rateMLc2,u1
+ rateMLc3,u1
= 0.05 [Mbps] + 0.14 [Mbps] + 0.77 [Mbps]
= 0.96 [Mbps].
Figure 2 visualizes the downlink rates that are received when
the SL (red bars) and ML (blue bars) schedules from Table 2 are
implemented. Intensive applications like video streaming require
some minimal downlink rate to function properly. Let the threshold
rate to support such an application be 0.75 [Mbps] (as indicated by
the dashed green line in Figure 2). �e SL schedule results in a high
downlink rate for u2 and u3, but at the expense of an unacceptably
low rate for u1. By contrast, the ML schedule allocates spectrum
more fairly, so that all three users receive a downlink rate that
exceeds the threshold.
u1 u2 u30
1
2
3
4
rateu[Mbps]
Single-Link (SL)Multi-Link (ML)
Figure 2: Aggregate downlink rates received by users in thetoy HetNet are plotted. �e dashed green line indicates athreshold downlink rate of 0.75 [Mbps] needed to run data-hungry applications. User u1 will experience service disrup-tion if cells execute the SL schedules. However, all users ex-perience an acceptable quality of service in ML mode.
2.3 De�ning the Optimization TaskIn summary, operators strive to allocate resources fairly, so that all
users experience an acceptable quality of service. �e traditional
approach, whereby data is transferred over a single communications
link, exhibits poor fairness. Improved fairness can be achieved
when data is routed via multiple links. However, schedulers for
intelligently allocating spectrum on the available links are needed.
Our goal is to evolve schedulers using evolutionary algorithms.
Evolved schedulers must map link quality reports from users to
optimized schedules in real time.
3 METHODIn this section, an algorithm for generating schedules in every
time slot is presented. �e algorithm �rst computes statistical
features extracted from link quality measurement reports. Hence, a
scheduler maps the features to an optimized schedule for each cell.
Two di�erent model classes are proposed. Firstly, Grammar-based
Genetic Programming [1, 12] is employed to explore the space of
symbolic expressions de�ned by a grammar. Secondly, the weights
of a �xed topology multilayer perceptron are optimized using a
Genetic Algorithm [5].
3.1 Generating SchedulesWe assume that the users u ∈ Ut active in time slot t send link
quality reports to cells a�er t . Cells assimilated these data in order
to intelligently allocate links in the subsequent time slot. Table 3
de�nes fourteen statistical features that are relevant for deciding
how much spectrum cell c should allocate to user u. For instance,
it may be sensible for c to grant u less spectrum if the link quality(F1c,u
)is large, relative to the average link quality from c to all
other users
(F5c,u
). �e average, min, and max statistical moments
have their usual interpretation. �e function rank(x ,X) returns
the relative magnitude of variable x in the set X. For example,
rank(20, {30, 20, 10, 0}) = 2 because 20 is the second largest value
in the set {30, 20, 10, 0}. �e rightmost column displays the values
a�ained by each feature for the link between c1 and u1 in the toy
HetNet (see Table 2a for the values of Qc,u ).
1260

GECCO ’19, July 13–17, 2019, Prague, Czech Republic D. Lynch, T. Saber, S. Kucera, H. Claussen, and M. O’Neill
�e features de�ned in Table 3 re�ect human intuition about
what information is relevant when computing a schedule. However,
they were chosen in a largely arbitrary manner. Our goal is to
automatically learn useful higher-order representations through
the mechanism of simulated evolution.
Feature De�nition Fc1,u1
F1c,u Qc,u 0.01
F2c,u average{Qc′,u |c′ ∈ L ∪ W} 0.02
F3c,u min{Qc′,u |c′ ∈ L ∪ W} 0.01
F4c,u max{Qc′,u |c′ ∈ L ∪ W} 0.04
F5c,u average{Qc,u′ |u′ ∈ Ut } 0.03
F6c,u min{Qc,u′ |u′ ∈ Ut } 0.01
F7c,u max{Qc,u′ |u′ ∈ Ut } 0.06
F8c,u average{Qc′,u |c′ ∈ L} if c ∈ L, else 0.01
average{Qc′,u |c′ ∈ W} if c ∈ WF9c,u min{Qc′,u |c′ ∈ L} if c ∈ L, else 0.01
min{Qc′,u |c′ ∈ W} if c ∈ WF10c,u max{Qc′,u |c′ ∈ L} if c ∈ L, else 0.01
max{Qc′,u |c′ ∈ W} if c ∈ WF11c,u rank
(Qc,u, {Qc′,u |c′ ∈ L ∪ W}
)3
F12c,u rank
(Qc,u, {Qc,u′ |u′ ∈ Ut }
)3
F13c,u rank
(Qc,u, {Qc′,u |c′ ∈ L}
)if c ∈ L, else 2
rank
(Qc,u, {Qc′,u |c′ ∈ W}
)if c ∈ W
F14c,u 0 if c ∈ L, else 1 if c ∈ W 0
Table 3: Statistical features are extracted from link qualityreports. Features are thenmapped to the proportion of spec-trum cell c allocates to user u.
Algorithm 1 Generating a schedule using an arbitrary scheduler.
1: procedure Generate Schedule(Qc,u )
2: for c ∈ L ∪ W do #for each LTE and WiFi cell
3: for u ∈ Ut do #for each active user in time slot t4: Compute the features F1c,u, F2c,u, . . . , F14c,u ;
5: Arrange features into a vector
−→F c,u ;
6: for c ∈ L ∪ W do #cells use exactly 100% of the spectrum
7: for u ∈ Ut do
8: schedulec,u =exp
(schedulerc,u
(−→F c,u
))∑
u∈Utexp
(schedulerc,u
(−→F c,u
)) ;
Algorithm 1 describes how the features are transformed into a
schedule for each cell. Feature vectors are �rst computed for all
links in the HetNet (lines 2–5). Hence, the scheduler transforms the
feature vectors into a feasible schedule (lines 6–8). A cell cannot use
more than the available spectrum, and should it not under-utilize
spectrum. �us, the scaling operation on line 8 ensures that exactly
100% of the spectrum is allocated by each cell. �e form of the
scheduler has not been speci�ed in Algorithm 1.
3.2 Evaluating SchedulesSchedulers are evaluated based on their ability to increase cell
edge throughput. As outlined in Section 2, this can be achieved by
allocating spectrum fairly on links between cells and users. �e
abstract concept of fairness is given a precise interpretation here.
Consider a time slot t during which usersu ∈ Ut are active in the
HetNet. Let the schedules for all cells be generated using Algorithm
1. Hence, obtain the received downlink rates with Equation 4. �e
�tness of the scheduler that is utilized in Algorithm 1 is given by
�tness(t) =|Ut |∑u′=1
(loge
(−−→rateu′
))× e
γ ×u′
|Ut | , (5)
where−−→rate is an ordered array storing the downlink rates ∀u ∈
Ut , such that−−→rate1 ≥
−−→rate2 ≥ . . . ≥−−→rate |Ut | . �e logarithm
makes Equation 5 sensitive to changes in the lowest downlink
rates. �e exponential term further increases sensitivity to cell edge
throughput. Pilot experiments indicated that fairness is maximized
when the hyperparameter γ ∈ R is set to the value γ = 10.
3.3 Genetic ProgrammingGrammar-based Genetic Programming (GP) is a powerful technique
for automatically constructing schedulers given only minimal do-
main knowledge. �e Backus-Naur form grammar that is displayed
in Figure 3a de�nes a search space of symbolic expressions. GP ex-
plores this space using the mechanisms of evolutionary search. �e
grammar contains arithmetic and non-linear functions, numerical
constants, and the statistical features that were de�ned in Table 3.
�e non-linear functions are de�ned in Figure 3b.
ÈeÍ ::= ÈrÍ | ÈrÍ | ÈrÍ | ÈTÍÈrÍ ::= ÈA1Í(ÈeÍ) | (ÈeÍÈA2ÍÈeÍ)ÈA1Í ::= plog | sine | psqrtÈA2Í ::= + | ≠ | ◊ | %ÈTÍ ::= T1u,f | T2u,f | , . . . , | T13u,f | ÈnÍ | ÈnÍÈnÍ ::= ≠1.0 | ≠0.9 | , . . . , | 0.9 | 1.0
T12u,f
sign|
F2 c,uF1 c,u F14 c,u
F
F
(a) Backus-Naur Form Grammar.
plog(x) = loge(1 + |x|)sine(x) = sine(x)
psqrt(x) =√
|x|
x%y =x√
1 + y2
sign(x) =
{1, if x ≥ 0
−1, if x < 0
(b) Protected Functions.
T4u,f T1u,fT4u,fT10u,f
ÈeÍ
ÈrÍ
(ÈeÍÈA2ÍÈeÍ)
T10u,f T4u,f
ÈeÍ
ÈrÍ
(ÈeÍÈA2ÍÈeÍ)
T10u,f T4u,f
ÈeÍ
ÈrÍ
(ÈeÍÈA2ÍÈeÍ)
T10u,f T4u,f
ÈeÍ
ÈrÍ
(ÈeÍÈA2ÍÈeÍ)
T10u,f T4u,f
ÈeÍ
ÈrÍ
(ÈeÍÈA2ÍÈeÍ)
T10u,f T4u,f% hTi hTihTihTi �
%
ÈeÍ
ÈrÍ
(ÈeÍÈA2ÍÈeÍ)
T10u,f T4u,f
ÈeÍ
ÈrÍ
(ÈeÍÈA2ÍÈeÍ)
T10u,f T4u,f
T4u,f T1u,fT4u,fT10u,f
ÈeÍ
ÈrÍ
(ÈeÍÈA2ÍÈeÍ)
T10u,f T4u,f
ÈeÍ
ÈrÍ
(ÈeÍÈA2ÍÈeÍ)
T10u,f T4u,f
ÈeÍ
ÈrÍ
(ÈeÍÈA2ÍÈeÍ)
T10u,f T4u,f
ÈeÍ
ÈrÍ
(ÈeÍÈA2ÍÈeÍ)
T10u,f T4u,f
ÈeÍ
ÈrÍ
(ÈeÍÈA2ÍÈeÍ)
T10u,f T4u,f% hTi hTihTihTi �
%
ÈeÍ
ÈrÍ
(ÈeÍÈA2ÍÈeÍ)
T10u,f T4u,f
ÈeÍ
ÈrÍ
(ÈeÍÈA2ÍÈeÍ)
T10u,f T4u,fF F
F10 c,u F4 c,u F1 c,uF4 c,uT4u,f T1u,fT4u,fT10u,f
ÈeÍ
ÈrÍ
(ÈeÍÈA2ÍÈeÍ)
T10u,f T4u,f
ÈeÍ
ÈrÍ
(ÈeÍÈA2ÍÈeÍ)
T10u,f T4u,f
ÈeÍ
ÈrÍ
(ÈeÍÈA2ÍÈeÍ)
T10u,f T4u,f
ÈeÍ
ÈrÍ
(ÈeÍÈA2ÍÈeÍ)
T10u,f T4u,f
ÈeÍ
ÈrÍ
(ÈeÍÈA2ÍÈeÍ)
T10u,f T4u,f% hTi hTihTihTi �
%
ÈeÍ
ÈrÍ
(ÈeÍÈA2ÍÈeÍ)
T10u,f T4u,f
ÈeÍ
ÈrÍ
(ÈeÍÈA2ÍÈeÍ)
T10u,f T4u,f
F1 c,uF4 c,u
FF F F
(c) Derivation Tree.
Figure 3: Grammar de�nition (a), mathematical functions(b), and a randomly generated derivation tree (c).
An example of a randomly generated derivation tree is displayed
in Figure 3c. �e non-terminal symbol 〈e〉 is expanded using the
production rules of the grammar. Derivations continue until all
non-terminal symbols have been replaced by terminal symbols. �e
executable scheduler is given by concatenating leaf nodes:
schedulerGPu,c(−→F c,u
)=
(F10c,u%F4c,u
)%
(F4c,u − F1c,u
).
1261

Evolutionary Learning of Link Allocation Algorithms for 5G HetNets GECCO ’19, July 13–17, 2019, Prague, Czech Republic
A single GP run proceeds as follows:
(1) A population of 1000 randomly generated derivation trees
(individuals) is initialized using the ramped half and half
method [16]. �e maximum initial derivation tree depth is
set to 20.
(2) Individuals are evaluated in simulation. �e training and
validation sets contain link quality reports from 30 and
10 time slots respectively. Schedules are �rst generated
by executing Algorithm 1, and hence Shannon’s formula
(Equation 4) yields the received downlink rates. �e �tness
is given by computing the average of Equation 5 over all
time slots.
(3) Parents are selected from the current population using
tournament selection with tournament size 5. Individuals
are selected based on their training �tness.
(4) With a probability of 0.7, each pair of selected parents
undergoes subtree crossover. Subtrees rooted at randomly
selected non-terminals in both parents are exchanged.
(5) All of the resulting children are mutated using subtree mu-
tation. A randomly selected non-terminal in the derivation
tree is replaced by a new random subtree.
(6) �e worst 990 individuals in the current population are
replaced with the children from subtree crossover and mu-
tation. �e remaining 10 ‘elites’ enter the next generation
unchanged.
(7) �e individual with highest �tness on the validation set is
returned a�er 500 generations. Performing model selection
on the validation set helps to prevent over��ing.
�e implementation of GP that was developed by the authors in
[8] was instrumented to evolve schedulers.
3.4 Multilayer PerceptronGP searches a space of variable-sized tree structures. By contrast,
the multilayer perceptron (MLP) neural network that is de�ned by
Equations 6–8 has a �xed topology. �e MLP consists of an input
layer i with 14 units (one for each feature), two hidden layers h1
and h2 with 25 units, and an output layer o with one unit. �e
tanh(·) non-linearity is the hyperbolic tangent. Constraining the
topology may simplify the optimization task. Now evolution can
focus on optimizing the network parameters, without also having
to search for an optimal topology.
ah1= tanh
(Wh1,i ·
−→F c,u + bh1
)(6)
ah2= tanh
(Wh2,h1
· ah1+ bh2
)(7)
schedulerMLPc,u
(−→F c,u
)=Wo,h2
· ah2+ bo (8)
�e 1051 weightsW and biases b are optimized using a Genetic
Algorithm (GA). �e GA and GP search loops are identical except
for the initialization, crossover, and mutation steps. An individual
is initialized as a vector of 1051 elements. Each element is sampled
from the normal distributionN(0, 1). An individual is parsed during
�tness evaluation to yield the weights and biases of the MLP. All
pairs of selected parents undergo uniform crossover: elements
are exchanged between both parents with a probability of 0.5 per
element. Finally, all of the resulting children undergo mutation. A
random variable sampled from the normal distribution N(0, 0.01)
is added to elements, with a probability of 0.01 per element.
We benchmark GP against a MLP because deep learning has
been recognized as a promising paradigm for network optimization
[18]. Unlike many alternative machine learning techniques, both
GP and deep learning infer suitable feature representations from
data.
3.5 Benchmark�e benchmark was proposed by Hartung and Buddhikot in [9].
�e authors note that link allocation is an NP-complete problem.
�ey present a greedy hill climbing heuristic. Initially, all links
between cells and users are assumed to be active. A single iteration
of hill climbing involves the following steps. All of the links are
visited in a random order. A link is either added or removed if
doing so increases �tness (the �tness of a solution is computed
using Equation 5). Cells transmit data to users on whatever links
remain active a�er a set number of iterations. A cell allocates an
equal share of the spectrum to all connected users.
Updated schedules are required every few milliseconds in a real
network. �erefore, it is only feasible to execute one iteration of
hill climbing in online operation. In o�ine mode, the steps are
iterated until no further improvements are possible.
4 EXPERIMENTAL DESIGN�e research questions posed in Section 1 were addressed using an
experimental methodology based on simulation. �e simulation
environment and experiments are described in this section.
(a) LTE cells. (b) WiFi cells.
Figure 4: LTE and WiFi cells transmit data to users (whitedots) in an enterprise environment. Black lines indicate theexterior walls of buildings. Signal qualities are lowest at celledges.
4.1 Simulation EnvironmentFigure 4 visualizes the distribution of 12 LTE and 8 WiFi cells that
were simulated in an enterprise environment spanning 500
[m
2].
LTE cells were located in between buildings, and one WiFi cell was
placed inside each building. �e LTE and WiFi cells transmi�ed at
�xed powers of 35 [dBm] and 20 [dBm] respectively. �e colorbar
in Figure 4 shows how the signal quality drops sharply at cell edges.
1262

GECCO ’19, July 13–17, 2019, Prague, Czech Republic D. Lynch, T. Saber, S. Kucera, H. Claussen, and M. O’Neill
Brief time slots of activity lasting several milliseconds were sim-
ulated. In each time slot, between 100 and 300 users (white dots)
were distributed onto the map. A user was either placed into one
of 20 hotspots, or else at a randomly chosen location. Hotspots
materialize in regions of high tra�c density such as transport hubs.
Users were not permi�ed within 10 [m] of the boundary, where
interference is arti�cially lower due to the �nite region that is
simulated.
Training, validation, and test sets were formed in two steps.
Firstly, link gains
(gainc,u
)were computed using the path loss
model described in [4]. Secondly, the link qualities
(qualityc,u
)were determined.
Step 1: �e gain on the link from cell c to user u was modelled
as the sum of four separate terms (gains are summed in ratio not
decibel scale):
gainc,u = gainantennaec + gainbuildingc,u + gaindistancec,u + gainfadingc,u .
Each term models the losses that a signal from c undergoes before
it reaches u:
(1) gainantennaec – is the signal loss incurred by focusing the
beam at c .
(2) gainbuildingc,u – signals are a�enuated by 20 [dB] if they pass
through buildings on their path to u (black lines in Figure
4).
(3) gaindistancec,u – the loss increases with the distance between
c and u.
(4) gainfadingc,u – shadow fading occurs when re�ected copies
of the same signal destructively interfere at u’s location.
Step 2: �e link qualities
(qualityc,u
)were computed using Equa-
tion 1 (received signals), Equation 2 (signal to interference and
noise ratios), and Equation 3 (link qualities). Schedulers map the
reported link qualities to an optimized schedule for each cell. �e
link quality data were arranged into matrices (see for example Table
2a). A total of 70 such matrices were saved by redistributing users
in 70 di�erent time slots. Each link quality matrix had dimensions
#cells × |Ut |, whereUt denotes the set of users active in time slot
t . A training set was formed with 30 of these matrices, another
10 were reserved as a validation set for model selection, and the
remaining 30 constituted a test set for model evaluation.
4.2 ExperimentsDownlink rates are lower at cell edges due to increased interference
from neighbouring cells. �irty runs of the GP algorithm from
Section 3.3 were carried out. MLPs were trained by executing
thirty runs of the GA, as outlined in Section 3.4. �e best evolved
schedulers were compared on unseen test cases. In addition, the
evolved schedulers were compared with a baseline and benchmark
heuristic. �e baseline permi�ed each user to receive data over
whatever link o�ered the best signal quality. �e benchmark hill
climbing heuristic was described in Section 3.5.
It is hypothesized that GP constructs tailored schedulers. �is
hypothesis was tested by simulating two di�erent deployment sce-
narios. A di�erent scheduler was evolved for each scenario. �e
�rst scenario was described in Section 4.1. Cells and buildings
were placed at di�erent locations in the second scenario. Table 4
summarizes how the simulation parameters di�ered.
Scenario 1 Scenario 2
Number of LTE Cells 12 8
Number of WiFi Cells 8 12
LTE spectrum 20 [MHz] 15 [MHz]
WiFi spectrum 22 [MHz] 22 [MHz]
LTE power 35 [dBm] 35 [dBm]
WiFi power 20 [dBm] 14 [dBm]
Tra�c Density / Time Slot 100 − 300 users 300 − 500 users
Table 4: Two di�erent deployment scenarios are simulated.A di�erent scheduler is evolved for each scenario using GP.
5 RESULTS AND DISCUSSION�e training performance of both evolutionary techniques is ana-
lyzed in this section. Generalization performance on unseen test
cases is then assessed. Grammar-based Genetic Programming (GP)
and the multi-layer perceptrons (MLPs) are compared to a baseline
and benchmark algorithm on test data. Several properties of GP are
explored including its ability to design tailored schedulers, balance
fairness tradeo�s, and discover sensible strategies for allocating
spectrum.
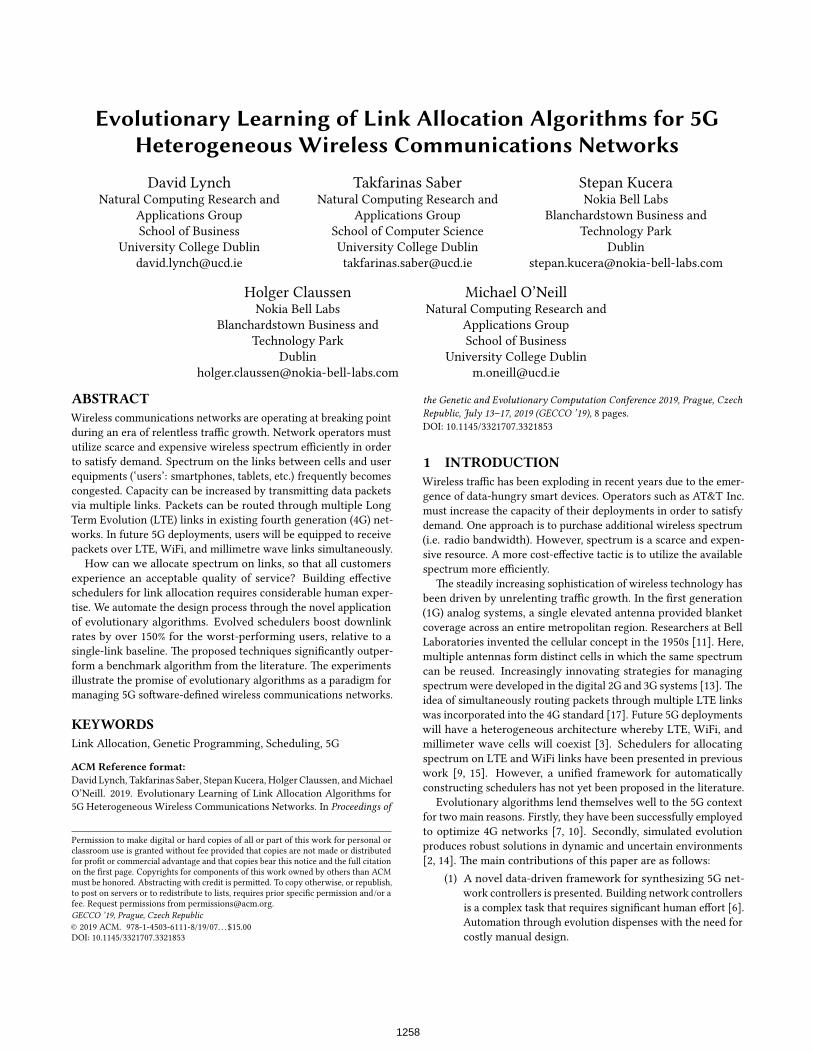
0 100 200 300 400 500Generation
60000
70000
80000
90000
100000
110000
120000
130000
Trai
ning
Fitn
ess
Training Performance of GP and MLPs
GP (Training)MLP (Training)
GP (Validation)MLP (Validation)
60000
70000
80000
90000
100000
110000
120000
130000
140000
Val
idat
ion
Fitn
ess
Figure 5: �e average training and validation �tness for the30 GP and MLP runs is plotted over generations. Shaded95% con�dence intervals enclose the average �tness. Verti-cal strikes indicate when the best scheduler is discovered.
6 TRAININGSchedulers were evolved for deployment scenario 1 (see Figure 4
and Table 4) using the evolutionary techniques described in Section
3. �e convergence of GP, and the Genetic Algorithm (GA) for train-
ing MLPs, is visualized in Figure 5. �e average best-of-generation
�tness is plo�ed over 500 generations. Training (solid lines) and
validation (dashed lines) �tness is given by the average of Equation
5 computed over the 30 training cases and 10 validation cases re-
spectively. A single case is a matrix of link quality reports like that
displayed in Table 2a. �e best-of-run scheduler is selected based
on validation �tness. Performing model selection on the validation
set helps ensure that schedulers generalize well to unseen test cases.
1263

Evolutionary Learning of Link Allocation Algorithms for 5G HetNets GECCO ’19, July 13–17, 2019, Prague, Czech Republic
MLPs converge to a slightly higher average training �tness. How-
ever, both approaches have identical performance on the validation
set (the 95% con�dence intervals overlap). �ere is no evidence of
over��ing because the validation �tness is monotonically increas-
ing. GP discovers high-performance schedulers in fewer genera-
tions than the GA. However, the GA catches up to GP at around
generation 300. Vertical strikes reveal that the best scheduler is
discovered towards the end of each run.
7 TESTING�e performance of various link allocation techniques on test data
is summarized in Table 5. �e baseline allows each user to receive
data on whatever link provides the highest signal quality. �e
benchmark (BM) is implemented in online and o�ine mode as
described in Section 3.5. �e benchmark is compared with the best
scheduler from all 30 GP runs, and the best MLP. Finally, the GA
for training MLPs is co-opted to directly optimize schedules o�ine.
A GA is much too slow for online optimization, but it provides an
upper bound on the performance that can be expected from online
algorithms.
Fitness 5th
Percentile [Mbps]
GA (o�ine) 138607 ± 28430 7.51 ± 2.61
GP 125639 ± 26974 5.24 ± 1.77
MLP 125123 ± 26677 5.32 ± 1.78
BM (o�ine) 124387 ± 25195 5.22 ± 1.77
BM (online) 110631 ± 21163 4.00 ± 1.38
Baseline 97534 ± 18134 2.80 ± 0.94
Table 5: Performance on test data. �e average of Equation5 over 30 test cases is tabulated in the �rst column. �e av-erage 5
th percentile of downlink rates in [Mbps] is indicatedin the second column.
�e �rst column of Table 5 displays the average �tness (Equation
5) over 30 test cases. Paired t-tests imply that the best GP and MLP
schedulers achieve a statistically signi�cantly higher �tness than
the benchmark in online mode. �e di�erences between GP and
the MLP are signi�cant at a con�dence level of α = 0.05. All of
the schemes that exploit multiple links are signi�cantly be�er than
the baseline at α = 0.05, but they are signi�cantly worse than the
highly optimized schedules produced by the GA.
Operators typically strive to increase the downlink rates for
poorly performing users at cell edges. A commonly quoted indicator
of cell edge throughput is the 5th
percentile of downlink rates. �e
second column of Table 5 displays the average 5th
percentile rates
over 30 test cases. All of the techniques for intelligently allocating
spectrum on multiple links achieve higher cell edge throughput
than the single-link baseline.
�e cumulative distribution function (CDF) plots in Figure 6
compare the distributions of downlink rates for all users in the
test set. �e percentage change versus baseline is plo�ed for each
percentile. For instance, the CDF for GP is generated as follows.
Downlink rates are computed for all users in the test set. Let−−→rateGP
and−−→ratebaseline denote vectors of the received downlink rates under
optimized schedules (GP) and the baseline. Furthermore, let Pp(−→x )
return the pthpercentile of all the elements in vector
−→x . �e CDF
0 10 20 30 40 50 60 70 80 90 100Percettile BP DBwtlitk isteR [%]
−100
−50
0
50
100
150
200
250
300
350
400
]hstgeVSBsRelite[ %]
DLstrLbutLRn Rf DRwnlLnk 5DtesGA (RfflLne)G30L3B0 (RfflLne)B0 (RnlLne)BDselLne
Edge Throughput
Peak Throughput
Figure 6: �e distribution of downlink rates under variousschemes for link allocation are compared relative to a single-link baseline technique. �e goal is to increase cell edgethroughput versus the baseline. An inherent tradeo� be-tween cell edge and peak throughput is evident.
plot for GP is given by evaluating the following expression for all
percentiles p ∈ [0, 100]:
CDFGPp =Pp
(−−→rateGP
)− Pp
(−−→ratebaseline
)Pp
(−−→ratebaseline
) × 100%. (9)
Equation 9 gives the percentage change in the pthpercentile of
downlink rates achieved by GP versus the baseline.
�e le� hand side region of Figure 6 corresponds to ‘cell edge’
users with the lowest downlink rates. �e evolutionary techniques
(blue and black lines) boost far cell edge throughput by over 150%
compared to baseline (dashed red line). By contrast, the benchmark
(dashed green line) realizes lower cell edge gains. Gains of up to
380% are achieved when a GA is used to compute idealized schedule
o�ine. However, the GA is too slow for online optimization in real
time. �e gap between the GA and GP reveals scope for achieving
be�er results in future work. �e gap between the GA and o�ine
BM suggests that link allocation is a non-trivial problem, for which
greedy search is highly suboptimal.
8 EVOLVING TAILORED SCHEDULERSA manually designed scheduler may become obsolete due to the
deployment of additional cells or a new technology in the network.
�e main advantage of GP is that updated schedulers can be evolved
when required. GP leverages training data to infer a specialized
strategy. �e degree to which GP generates tailored schedulers was
assessed by simulating two di�erent deployment scenarios D1 and
D2. Two schedulers were then obtained as follows.
(1) A scheduler S1 was evolved using training data generated
in D1.
(2) A di�erent scheduler S2 was evolved using training data
from D2.
�e CDF plot in Figure 7a con�rms that S1 works best in D1 (the
scenario for which it was evolved). Similarly, Figure 7b con�rms
1264

GECCO ’19, July 13–17, 2019, Prague, Czech Republic D. Lynch, T. Saber, S. Kucera, H. Claussen, and M. O’Neill
that S2 works best in D2. As before, the goal is to maximize cell
edge throughput.
0 10 20 30 40 50 60 70 80 90 100Percentile [%]
−60−40−20020406080100120140160180200220240
ChangeVSBaseline[ %]
D1S1S2Baseline
(a)
0 10 20 30 40 50 60 70 80 90 100Percentile [%]
D2S2S1Baseline
(b)
Figure 7: GP generates specialized schedulers that areadapted to their deployment context. Downlink rates arecomputed for users in 30 time slots.
9 BEHAVIOURAL ANALYSISFigure 8 reveals the basic strategy that is discovered by GP for
allocating spectrum. Users were split into ten groups based on their
aggregate link quality. Cell edge users with the lowest aggregate
link quality were placed in group 1. �e scheduler tends to award
more overall spectrum (red line) to these cell edges users. �e users
in group 10 have the highest aggregate link quality because they
are located close to cell centres. Fairness is achieved by allocating
this group much less spectrum on the available links.
Most of the users in groups 1–7 are located outside buildings,
where they have more direct access to LTE cells. �e scheduler
allocates this group the majority of the LTE spectrum. By contrast,
those users in groups 8–10 are primarily inside buildings. Hence,
they receive most of the WiFi spectrum, since WiFi cells are placed
inside the buildings (see Figure 4b).
1 2 3 4 5 6 7 8 9 10Group
0
5
10
15
20
25
30
35
Spec
trum
Allo
cate
d [M
Hz]
Average Channel QualityAverage Total SpectrumAverage LTE SpectrumAverage WiFi Spectrum
0
1
2
3
4
5
6
Link
Qua
lity
Figure 8: Fairness is achieved by allocating more spectrumto the users with lower aggregate link quality. Users ingroups 8, 9, and 10 are allocated more WiFi spectrum be-cause they are primarily inside buildings.
10 CONCLUSIONS�e capacity of a wireless network is signi�cantly increased by
transmi�ing data over multiple links. Schedulers for intelligently
allocating spectrum on the available links can be automatically con-
structed using evolutionary algorithms. Two di�erent techniques
were compared in this paper. GP learns a functional mapping from
statistical features to optimized schedules by exploring a space of
tree structures. A �xed-topology MLP achieves comparable perfor-
mance to GP, when its weights are optimized using a GA. �e best
evolved schedulers outperform a greedy hill climbing benchmark,
and a baseline which utilizes only one link per user.
�e purpose of this paper was to assess the suitability of evo-
lutionary algorithms as a tool for network control. As such, a
simpli�ed model of a real wireless network was simulated. In fu-
ture work, schedulers could be evolved using measurement data
from a real network. �e task of minimizing latency could be also
addressed in future work. Reduced latency will be critical in 5G
deployments because it will enable technologies like self-driving
cars and virtual reality.
REFERENCES[1] Anthony Brabazon, Michael O’Neill, and Sean McGarraghy. 2015. Natural com-
puting algorithms. Springer.
[2] Jurgen Branke and Hartmut Schmeck. 2003. Designing Evolutionary Algorithms
for Dynamic Optimization Problems. In Advances in evolutionary computing.
Springer, 239–262.
[3] Woon Hau Chin, Zhong Fan, and Russell Haines. 2014. Emerging technologies
and research challenges for 5G wireless networks. IEEEWireless Communications21, 2 (2014), 106–112.
[4] Holger Claussen and Lester Ho. 2012. Multi-carrier cell structures with angular
o�set. In Personal Indoor and Mobile Radio Communications (PIMRC), 2012 IEEE23rd International Symposium on. IEEE, 1179–1184.
[5] Goldberg David. 1989. Genetic Algorithms in Search Optimization and Machine
Learning. Addison Wesley Longman, Inc.
[6] Supratim Deb, Pantelis Monogioudis, Jerzy Miernik, and James P Seymour. 2014.
Algorithms for enhanced inter-cell interference coordination (eICIC) in LTE
HetNets. IEEE/ACM Transactions on Networking 22, 1 (2014), 137–150.
[7] Michael Fenton, David Lynch, Stepan Kucera, Holger Claussen, and Michael
O�Neill. 2017. Multilayer optimization of heterogeneous networks using gram-
matical genetic programming. IEEE transactions on cybernetics 47, 9 (2017),
2938–2950.
[8] Michael Fenton, James McDermo�, David Fagan, Stefan Forstenlechner, Erik
Hemberg, and Michael O’Neill. 2017. PonyGE2: Grammatical evolution in
python. In Proceedings of the Genetic and Evolutionary Computation ConferenceCompanion. ACM, 1194–1201.
[9] Lance Hartung and M Milind. 2015. Policy Driven Multi-band Spectrum Ag-
gregation for Ultra-broadband Wireless Networks. In Dynamic Spectrum AccessNetworks (DySPAN), 2015 IEEE International Symposium on. IEEE, 82–93.
[10] David Lynch, Michael Fenton, David Fagan, Stepan Kucera, Holger Claussen, and
Michael O’Neill. 2019. Automated Self-Optimization in Heterogeneous Wireless
Communications Networks. IEEE Transactions in Network, in press.
[11] Verne H Mac Donald. 1979. Advanced mobile phone service: The cellular concept.
�e bell system technical Journal 58, 1 (1979), 15–41.
[12] Robert I Mckay, Nguyen Xuan Hoai, Peter Alexander Whigham, Yin Shan, and
Michael O�neill. 2010. Grammar-based genetic programming: a survey. GeneticProgramming and Evolvable Machines 11, 3-4 (2010), 365–396.
[13] Andreas F Molisch. 2012. Wireless communications. Vol. 34. John Wiley & Sons.
[14] Ronald Walter Morrison. 2002. Designing Evolutionary Algorithms for DynamicEnvironments. George Mason University.
[15] Bahar Partov and Douglas J Leith. 2017. Utility fair rate allocation in LTE/802.11
networks. IEEE/ACM Transactions on Networking 25, 2 (2017), 1076–1088.
[16] Riccardo Poli, William B Langdon, Nicholas F McPhee, and John R Koza. 2008. A�eld guide to genetic programming. Lulu. com.
[17] Soheil Rostami, Kamran Arshad, and Predrag Rapajic. 2015. A joint resource
allocation and link adaptation algorithm with carrier aggregation for 5G LTE-
Advanced network. In Telecommunications (ICT), 2015 22nd International Confer-ence on. IEEE, 102–106.
[18] Chaoyun Zhang, Paul Patras, and Hamed Haddadi. 2019. Deep learning in mobile
and wireless networking: A survey. IEEE Communications Surveys & Tutorials(2019).
1265
Related Documents