J. evol. Biol. 5: 121-148 (1992) lOlO-061X~92/01121 28 $ 1.50+0.20/O g 1992 Birkhluser Verlag, Base1 Evolutionary divergence in Dolichopoda cave crickets: A comparison of single copy DNA hybridization data with allozymes and morphometric distances Giuliana Allcgrucci, Adalgisa Caccone, Donatella Cesaroni and Valerio Sbordoni Dipartimento di Biologia, Unirersith di Roma “Tor Vergata”, Via Orazio Raimondo, 00173 Roma, Ital) Key ulords: Allozymes; scDNA-DNA hybridization; morphometrics; molecular evolutionary rates; Mantel test; cave crickets; Orthoptera. Abstract In this paper we attempt to investigate relationships between the amount of genetic divergence in nuclear genes and the degree of morphological differentiation for different sets of characters in Dolichopoda cave crickets. Six populations representing five Dolichopoda species from Central and South- ern Italy have been studied. The overall genetic divergence at nuclear genes was estimated both by single copy DNA-DNA hybridization and allozyme frequencies at 26 loci. Euclidean distances for two multivariate sets of morphometric vari- ables: one describing body and appendage morphology, the other male epiphallus shape. Results showed a close agreement between the branching patterns of ATm values from DNA hybridization and Nei’s allozyme distance values. On the other hand, patterns of morphological divergence revealed independent trends, although the branching pattern based on epiphallus morphology matched to some extent the phylogenies inferred from molecular data. The relative value of molecular and morphological characters as reliable phylogenetic tracers was evaluated in relation to their dependence on evolutionary factors. Implications of these findings on the calibration of molecular clocks are also discussed. The absolute rate of molecular change based on scDNA was estimated to be at least 0.98% divergence/my/lineage. This result is in agreement with calibrations attempted on other insects. Estimates of time of divergence based on allozymes (Nei’s D) were highly consistent with the estimate from geological data. 121

Welcome message from author
This document is posted to help you gain knowledge. Please leave a comment to let me know what you think about it! Share it to your friends and learn new things together.
Transcript

J. evol. Biol. 5: 121-148 (1992) lOlO-061X~92/01121 28 $ 1.50+0.20/O g 1992 Birkhluser Verlag, Base1
Evolutionary divergence in Dolichopoda cave crickets: A comparison of single copy DNA hybridization data with allozymes and morphometric distances
Giuliana Allcgrucci, Adalgisa Caccone, Donatella Cesaroni and Valerio Sbordoni
Dipartimento di Biologia, Unirersith di Roma “Tor Vergata”, Via Orazio Raimondo, 00173 Roma, Ital)
Key ulords: Allozymes; scDNA-DNA hybridization; morphometrics; molecular evolutionary rates; Mantel test; cave crickets; Orthoptera.
Abstract
In this paper we attempt to investigate relationships between the amount of genetic divergence in nuclear genes and the degree of morphological differentiation for different sets of characters in Dolichopoda cave crickets.
Six populations representing five Dolichopoda species from Central and South- ern Italy have been studied. The overall genetic divergence at nuclear genes was estimated both by single copy DNA-DNA hybridization and allozyme frequencies at 26 loci. Euclidean distances for two multivariate sets of morphometric vari- ables: one describing body and appendage morphology, the other male epiphallus shape. Results showed a close agreement between the branching patterns of ATm values from DNA hybridization and Nei’s allozyme distance values. On the other hand, patterns of morphological divergence revealed independent trends, although the branching pattern based on epiphallus morphology matched to some extent the phylogenies inferred from molecular data. The relative value of molecular and morphological characters as reliable phylogenetic tracers was evaluated in relation to their dependence on evolutionary factors.
Implications of these findings on the calibration of molecular clocks are also discussed. The absolute rate of molecular change based on scDNA was estimated to be at least 0.98% divergence/my/lineage. This result is in agreement with calibrations attempted on other insects. Estimates of time of divergence based on allozymes (Nei’s D) were highly consistent with the estimate from geological data.
121

122
Introduction
Allegrucci et al.
A central aim of evolutionary biology is to understand the relationship between organisms and the mechanisms by which they come about. Until recently the study of historical processes and evolutionary mechanisms have proceeded quite independently from each other. Several authors (see papers in Patterson, 1987) have highlighted the pitfalls of these one-sided approaches and call for evolution- ary studies which integrate the two aspects: history and mechanisms. These two aspects of understanding evolution are connected and interdependent. To correctly identify lineages of descent one has to take into consideration intraspecific varia- tion, and to understand evolutionary processes one has to have a clear idea of the relationships among the taxa studied.
Perhaps the main reason evolutionists neglected history was the pervasive skep- ticism of the ability to reconstruct phylogenies accurately. Recently, fundamental advances in both theory and data collection have increased the hope of many workers that in fact phylogeny can be inferred with a reasonable degree of confidence. The use of molecular data in elucidating phylogenetic history has certainly been instrumental in such resurgence of interest (Hillis and Moritz, 1990). However, the sudden rise of biochemical systematics has also fueled contro- versies on the relative importance of the molecular and morphological approaches. This tension seems to have been lessened in recent years. with many systematists calling for multidisciplinary studies, using different types of data for resolving phylogenetic questions at different hierarchical levels (Hillis. 1987; Patterson, 1987).
Surprisingly, few attempts have been made to examine the degree of consensus between different data sets, where the same group of taxa is examined using the same type of analytical methods for both molecules and morphology (e.g., Gould et al., 1974; Miyamoto, 1981, 1983; Hillis et al., 1983; Ruth, 1984; Best et al.. 1986; Zink and Avise, 1990). In this paper we attempt such comparison by investigating the relationship among five species of Ddidzopoda cave crickets. We compare two types of molecular data, allozymes and single-copy DNA (scDNA) divergence, with each other and with two different morphological data sets.
The overall genetic divergence at nuclear genes was estimated by scDNA hy- bridization, Jsozyme electrophoresis was carried out to test divergence at protein coding loci. Two sets of morphological characters were studied by morphometric techniques: (1) epiphallus shape and (2) body and appendage morphology. The shape of the epiphallus was chosen because this structure is one of the major diagnostic characters on which taxonomic relationships among Dolirhopod~ species have been traditionally based. Its importance as a taxonomically informa- tive character relics on the relatively safe assumption that its evolution is not as influenced by environmental factors as other morphological traits. On the other hand, morphometric measures based on body and appendage shape and size reflect phenotypic plasticity and/or short term adaptation to local environ- ments more than historical relationships (Allegrucci et al., 1987; Cesaroni et al., 1989).
Evolutionary divergence in cave crickets 123
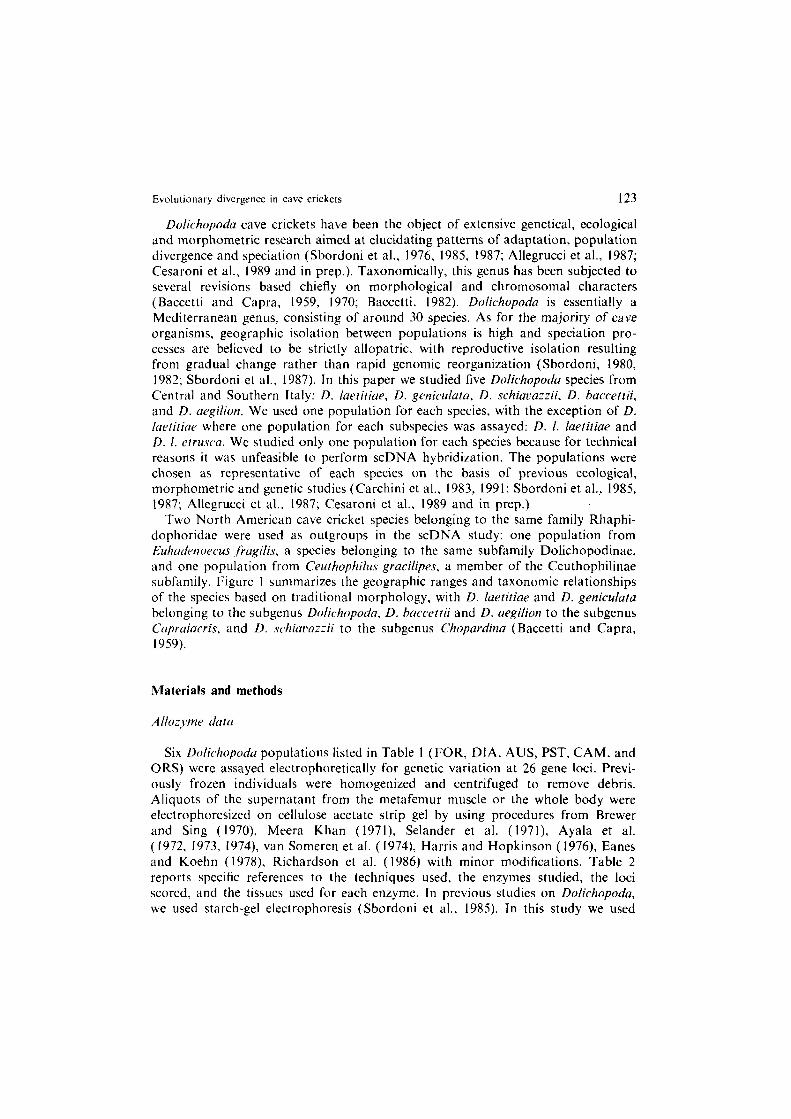
Dofichopoda cave crickets have been the object of extensive genetical, ecological and morphometric research aimed at elucidating patterns of adaptation, population divergence and speciation (Sbordoni et al., 1976, 1985, 1987; Allegrucci et al., 1987; Cesaroni et al., 1989 and in prep.). Taxonomically, this genus has been subjected to several revisions based chiefly on morphological and chromosomal characters (Baccetti and Capra, 1959, 1970; Baccetti, 1982). Dofichopoda is essentially a Mediterranean genus, consisting of around 30 species. As for the majority of cave organisms, geographic isolation between populations is high and speciation pro- cesses are believed to be strictly allopatric, with reproductive isolation resulting from gradual change rather than rapid genomic reorganization (Sbordoni, 1980, 1982; Sbordoni et al., 1987). In this paper we studied five Dofichopoda species from Central and Southern Italy: D. laetiriae, D. genicufuta, D. schial>azzii, D. harcettii, and D. aegilion. We used one population for each species, with the exception of D. luetitim where one population for each subspecies was assayed: D. 1. faetitiae and D. 1. ctrmra. We studied only one population for each species because for technical reasons it was unfeasible to perform scDNA hybridization. The populations were chosen as representative of each species on the basis of previous ecological, morphometric and genetic studies (Carchini et al., 1983, 1991; Sbordoni et al.. 1985, 1987; Allegrucci et al., 1987; Cesaroni et al., 1989 and in prep.)
Two North American cave cricket species belonging to the same family Rhaphi- dophoridae were used as outgroups in the scDNA study: one population from Euhudenoecus fragifis, a species belonging to the same subfamily Dolichopodinae, and one population from Ceuthophifm gracilipes, a member of the Ceuthophilinae subfamily. Figure I summarizes the geographic ranges and taxonomic relationships of the species based on traditional morphology, with D. Iuetitiae and D. geniculata belonging to the subgenus Dolichopodn, D. baccettii and D. aegifion to the subgenus Cqraiacris, and D. schiauxzii to the subgenus Chopardina (Baccetti and Capra, 1959).
Materials and methods
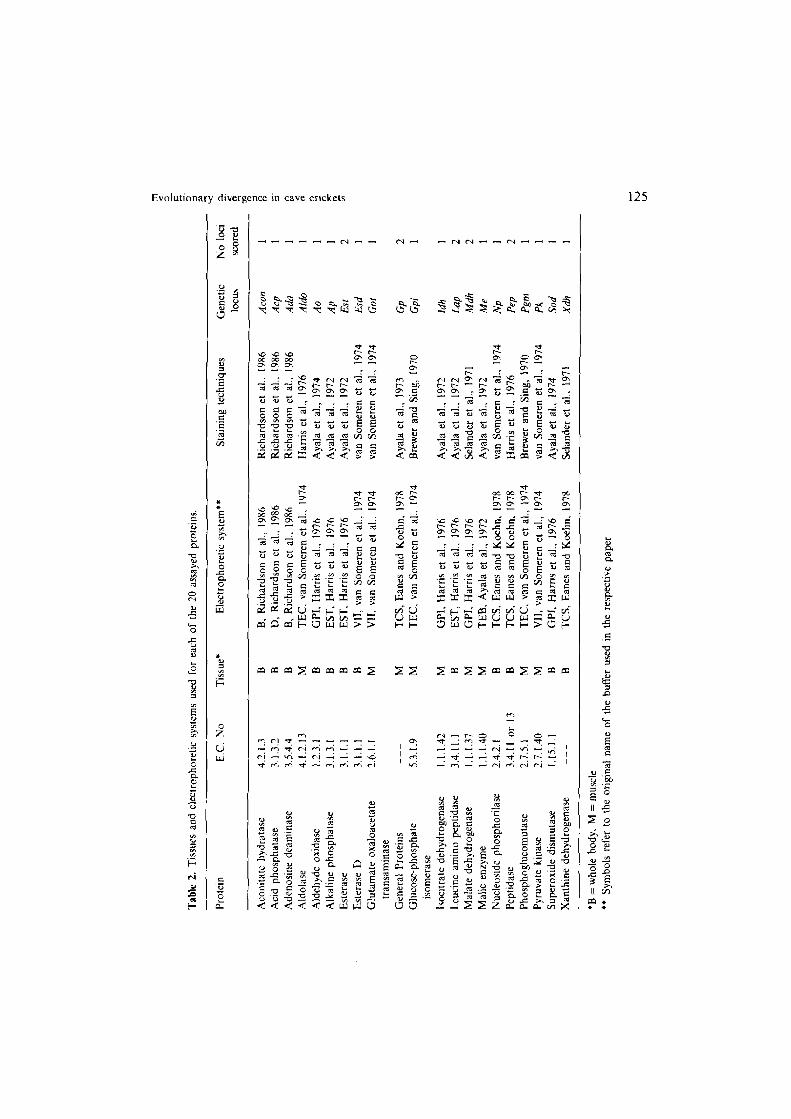
Six Dofichopoda populations listed in Table 1 (FOR, DIA, AUS, PST, CAM, and ORS) were assayed electrophoretically for genetic variation at 26 gene loci. Previ- ously frozen individuals were homogenized and centrifuged to remove debris. Aliquots of the supernatant from the metafemur muscle or the whole body were electrophoresized on cellulose acetate strip gel by using procedures from Brewer and Sing (1970). Meera Khan (1971) Selander et al. (1971) Ayala et al. ( 1972, 1973, 1974), van Someren et al. (1974), Harris and Hopkinson ( 1976) Eanes and Koehn ( 1978) Richardson et al. (1986) with minor modifications. Table 2 reports specific references to the techniques used, the enzymes studied, the loci scored, and the tissues used for each enzyme. In previous studies on Dofichopodo, we used starch-gel electrophoresis (Sbordoni et al., 1985). In this study we used
124 Allegrucci et al
Fig. I. Distribution ranges of the five Dolichopodu species studied. The schematic tree represents a hypothetical phylogeny based on traditional taxonomy.
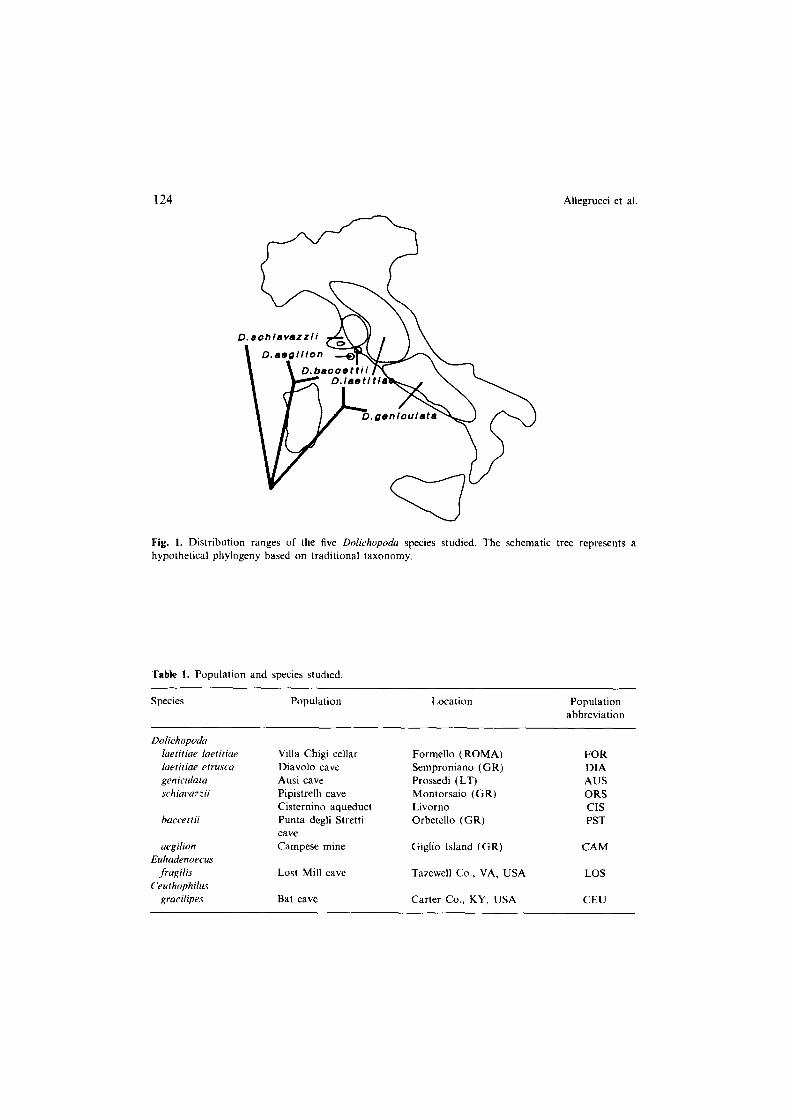
Table 1. Population and species studied.
Species Population Location Population abbreviation
Dolichopoda heritiae laetitiue lueriliae etrusca geniculatu schiacazzii
haccerlii
aegilion Euhadenoecus
fragilis Ceuthvphilus
gracilipes
Villa Chigi cellar Diavolo cave Ausi cave
Pipistrelli cave Cisternino aqueduct Punta degli Stretti cave
Campese mine
Lost Mill cave
Bat cave
Formello (ROMA) Semproniano (GR)
Prossedi (LT) Montorsaio (GR) Livorno
Orbetcllo (CR)
Giglio Island (GR)
Tazewell Co., VA, USA
Carter Co., KY, USA
FOR DIA AUS ORS
CIS PST
CAM
LOS
CEU
P 0, c
Tabl
e 2.
Ti
ssue
s an
d el
ectro
phor
etic
syst
ems
used
fo
r ea
ch
of
the
20
assa
yed
prot
eins
.
Prot
ein
E.C.
No
Ti
ssue
* El
ectro
phor
etic
syst
em**
g 2 G St
aini
ng
tech
niqu
es
Gen
etic
No
loci
P
hJcu
s sc
ored
d 2
Acon
itate
hy
drat
ase
Acid
ph
osph
atas
e
Aden
osin
e de
amin
ase
Aldo
lase
Al
dehy
de
oxid
ase
Alka
line
phos
phat
ase
Este
rase
Este
rase
D
Glut
amat
e ox
aloa
ceta
te
trans
amin
ase
Gen
eral
Prot
eins
Glu
cose
-pho
spha
te
isom
eras
e
lsocit
rate
de
hydr
ogen
ase
Leuc
ine
amin
o pe
ptid
ase
Mala
te
dehy
drog
enas
e M
alic
enzy
me
Nucle
osid
e ph
osph
orila
se
Pept
idas
e Ph
osph
oglu
com
utas
e Py
ruva
te
kinas
e
Supe
roxid
e di
smut
ase
Xant
hine
de
hydr
ogen
ase
421.
3
3.1.
3.2
3.5.
4.4
4.1.
2.13
1.2.
3.1
3.1.
3.1
3.1.
1.1
3.1.
1.1
2.6.
1.1
5.3.
1.9
1.1.
1.42
3.4.
11.1
1.
1.1.
37
1.1.
1.40
2.
4.2.
1
3.4.
1 I
or
13
2.7.
5.
I
2.7.
1.40
1.
15.1
.1
B B B M B B B B M M M M B M M B B M M B B
B,
Rich
ards
on
et
al.,
1986
Ri
char
dson
et
al
., 19
86
Acon
D,
Ri
char
dson
et
al
.. 19
86
Rich
ards
on
et
al.,
1986
AC
P B,
Ri
char
dson
et
al
., 19
86
Rich
ards
on
et
al..
1986
Ad
a TE
C.
van
Som
eren
et
al
.. 19
74
Harri
s et
al
., 19
76
Aldo
G
PI.
Harri
s et
al
.. 19
76
Ayal
a et
al
.. 19
74
Ao
EST,
Ha
rris
et
al..
1976
Ay
ala
et
al..
1972
AP
ES
T.
Harri
s et
al
., 19
76
Ayal
a et
al
., 19
72
ES1
VII,
van
Som
eren
et
al
.. 19
74
van
Som
eren
et
al
., 19
74
Esd
VII,
van
SOm
eren
et
al
.. 19
74
van
Som
eren
et
al
.. 19
74
GO
1
TCS.
Ea
nes
and
Koeh
n,
1978
Ay
ala
et
al.,
1973
GP
2
TEC,
va
n So
mer
en
et
al..
1974
Br
ewer
an
d Si
ng,
1970
G
pi 1
GPI
, Ha
rris
et
al.,
1976
Ay
ala
et
al.,
1972
Id
h 1
EST,
Ha
rris
et
al..
1976
Ay
ala
et
al.,
1972
LJ
P 2
GPI
, Ha
rris
et
al.,
1976
Se
land
er
et
al.,
1971
M
dh
2 TE
B,
Ayal
a et
al
., 19
72
Ayal
a et
al
., 19
72
Me
1 TC
S,
Eane
s an
d Ko
ehn.
19
78
van
Som
eren
et
al
., 19
74
Np
I TC
S,
Eane
s an
d Ko
ehn,
19
78
Harri
s et
al
., 19
76
Pep
2 TE
C,
van
Som
eren
et
al
., 19
74
Brew
er
and
Sing
, 19
70
h-m
1
VII,
van
Som
eren
et
al
., 19
74
van
Som
eren
et
al
.. 19
74
Pk
1 G
PI,
Harri
s et
al
., 19
76
Ayal
a et
al
., 19
74
Sod
I TC
S,
Eane
s an
d Ko
ehn,
19
78
Sela
nder
et
al
., 19
71
Xdh
1
*B
= wh
ole
body
, M
= m
uscle
**
Sy
mbo
ls re
fer
to
the
orig
inal
na
me
of
the
buffe
r us
ed
in
the
resp
ectiv
e pa
per
126 Allegrucci et al.
cellulose acetate as support medium, because of its higher resolution than starch gel in our hands.
DNA -DNA hybridization data
Total DNA extraction were carried out from lo- 15 frozen or fresh individuals belonging to all populations listed on Table 1 with the exception of CIS. The method of DNA preparation is based on proteinase K digestion followed by phenol/chloro- form extractions (see Caccone et al., 1987 for details). We used the TEACL method of DNA-DNA hybridization (Britten et al., 1978; Hall et al., 1980; Hunt et al., 1981) with minor modifications. This method is detailed elsewhere (Powell and Caccone 1990, 1991; Caccone and Powell, 1991) and will not be repeated here. However, a few points are worth emphasizing.
First, all experiments were done using single-copy DNA (scDNA). We removed excess copies of repetitive sequences by two rounds of absorption to hydroxyapatite, after incubation to a Cot of 500 M set/liter. Second, the reassociations were carried out in 1M TEACL, at 45” C, that requires a base pair (bp) match of about 75% or greater to form stable hybrids. Reassociation reactions were incubated to equilibrium (Cot 12000). Percent reassociation (%R) was determined by the fraction of the reaction which remains Sl nuclease resistant. The Normalized Percent Reassociation (NPR) is then calculated as the %R of the heteroduplex divided by the %R of the homoduplex. Third, determinations of the median melting temperature (tm) were done in a solution of 2.4 M TEACL, which allows DNA melting independently of base composition (Hutton and Wetmur, 1973; Orosz and Wetmur, 1977). Fourth, we corrected for the dependance of melting on the size of the duplex (Hall et al., 1980; Hunt et al., 1981). Each duplex length was measured by alkaline agarose electrophoresis. Thus, our table in Appendix 2 presents tracer length measurements (TL), its temperature correction (tcorr), uncorrected (tm) and corrected (Tm) median melting temperature. Fifth, the median difference in thermal stability between the Tm’s of the homo and heteroduplex molecules (Arm) was calculated for each comparison. ATm measures the sequence divergence between the two taxa compared. There is a theoretical and empirical relation between ATm and percent base pair mismatch (Britten et al., 1974; Kohne, 1970). Estimates of the conversion of a change of 1’ C in ATm to % bp mismatch range from 1: I to 1: 1.7 (Britten et al., 1974; Caccone et al., 1988b). For our purposes we will use an intermediate value; we will assume 1’ ATm indicates 1.3% base pair mismatch. We carried out 31 pairwise comparisons. Not all pairwise comparisons were performed but all Dolirhopoda populations were used as tracers or drivers in multiple comparisons. DNA’s from five populations (FOR, DIA, PST, CAM, ORS) were made single-copy and used as tracers. Outgroup comparisons with Euhadenoecus (LOS) and Cruthophilus (CEU) were carried out only with the tracer from FOR. Replicate experiments were carried out for each tm determination. This allows to place standard errors on tm’s. Reciprocal comparisons were carried out for most of the experiments (both taxa were used as tracer and driver in separate experiments).
Evolutionary divergence in cave crickets
Morphometric data
127
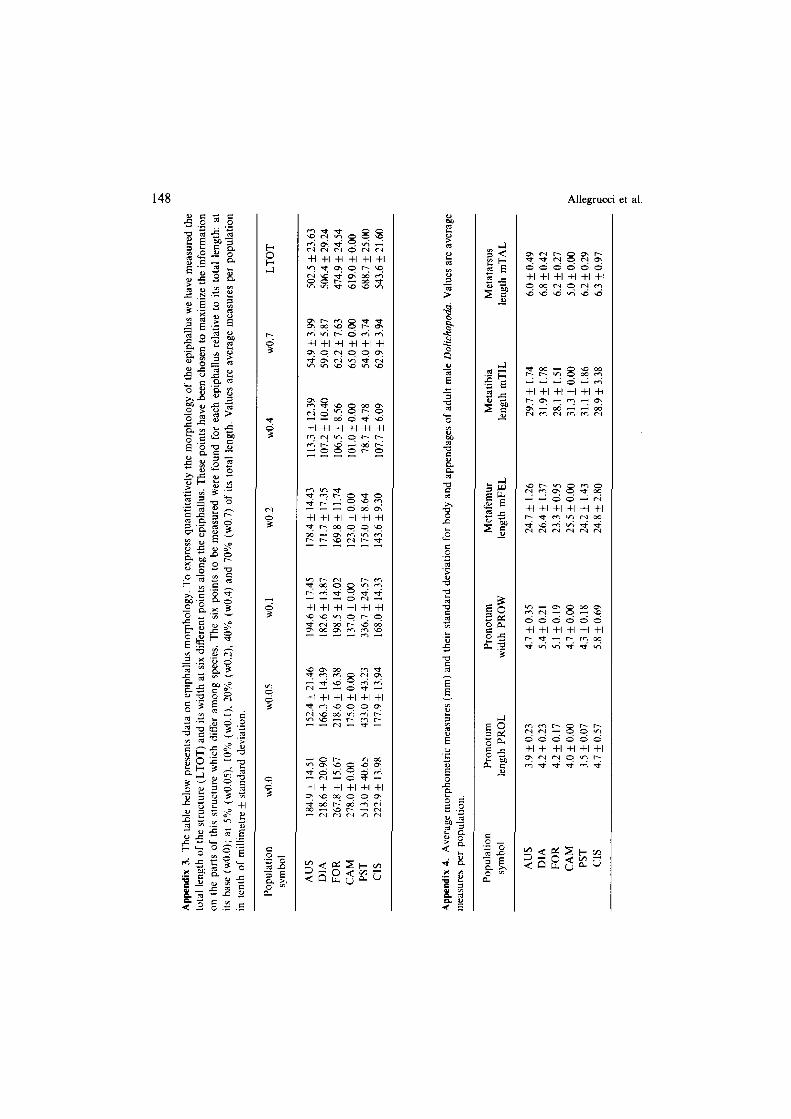
Morphometric techniques were used to study two sets of morphological charac- ters: epiphallus morphology (EP) and body and appendage morphology (BA). Epiphallus shapes have been quantitatively described by using, for each individual, seven measurements: six describe the width of the structure, and one deals with its length. Body and appendage morphology were quantified by measuring for each individual five morphometric characters: pronotum length and width, metafemur, metatibia and metatarsus length. Appendix 3 reports the average measurements for all the populations studied. Only adult males were considered in both sets of morphological characters, since males showed statistically significant differences from females in most morphometric variables. The populations studied are FOR, DIA, AUS, PST, CIS and CAM. In this case D. schiazazzii is represented by CIS population (Table I).
These data have been selected from an extensive study carried out on a total of 56 populations belonging to the D. laetitiue-genicufata complex and to the other species here considered (Cesaroni et al., 1989 and in prep.).
Data analysis
Allozymic data were transformed in genetic distances by using Nei’s ( 1978) and Rogers’ (1972) algorithms in the BIOSYS-1 program package (Swofford and Selander, 198 1). Morphometric measurements were standardized and pairwise Euclidean distances were calculated directly from these data. DNA hybridization data were already in the form of distances and did not need any further transforma- tion.
The distance matrices from the four sets of data (allozymic, scDNA, and two morphometric) were subjected to various clustering algorithms: UPGMA (Sokal and Michener, 1958) distance Wagner procedure (Farris, 1972), least-square meth- ods (Cavalli-Sforza and Edwards, 1967; Fitch-Margoliash, 1967), and the neighbor- joining method (Saitou and Nei, 1987). The PHYLIP computer package (version 3.2; J. Felsenstein, Dept. of Genetics, Univ. of Washington, Seattle) was used for most of the cluster analyses. Standard errors of the branching points on the tree based on allozyme Nei’s distances were calculated following Nei et al., (1985). Statistical significance of the nodes on the ATm trees were evaluated by the non parametric Mann-Whitney U-test. For each UPGMA tree, a matrix of ultrametric distance values has been computed in order to test the goodness of fit of the cluster analyses to the data (Rohlf and Sokal, 1981) by means of the cophenetic correla- tion coefficient (rcoph).
The four distance data sets were statistically compared by means of the Mantel test (Mantel, 1967). This test is a very general test with considerable appeal because of its simplicity. It is carried out by an element-by-element multiplication between two matrices. This is a non parametric procedure, based on randomization, which generates statistical signilicance levels for correlational measures of similarity
128 Allegrucci et al.
between distance matrices. All possible pairwise comparisons between the genetic and morphometric distance matrices have carried out by using the Mantel procedure included in the NTSYS-pc (ver.l.40) package developed by Rohlf (1988). We selected this technique because of its flexibility and direct dependence on original distance data rather than on distributional assumptions or clustering algorithms.
Results
Allozymic data
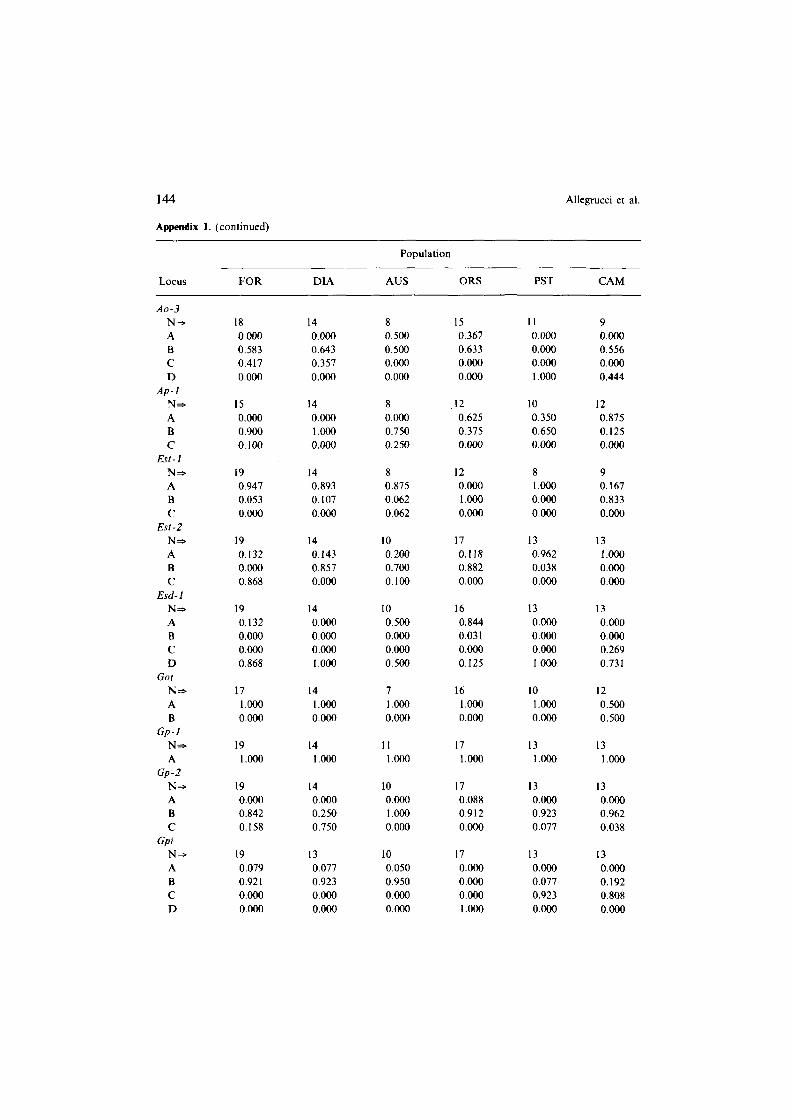
Appendix I shows allele frequencies per population per locus (with respective allele designation) for the six Dolichopoda populations. Of the 26 gene loci stud- ied, three (A/do, Gp-f, and Sod) were identically monomorphic. Diagnostic alleles were found to exist between species or species groups. D. 1. etrusca (DIA) has fixed alternative alleles at the Acp locus, D. geniculata (AUS) at the Mdh-I and Xdh loci, D. schiarazzii (ORS) at the Idh and Gpi loci, D. haccetfii (PST) with D. aegilion (CAM) at the Ada, Ao-3 and Mdh-2 loci. Alternative alleles or alleles with widely different frequencies allowed identification of three groupings, D. laetitiae-geniculatu, D. schiavazzii and D. haccettii-aegilion at the Gpi and Idh loci. Also Xdh and Mdh-I identified three groups, but different from the previous ones: D. laetitiae, D. geniculata, D. schiavazzii-baccettii-aegilion. Pgm distinguished two groups with marked allele frequencies differences: D. laetitiae-geniculata and D. haccettii-aegilion-schiavazzii.
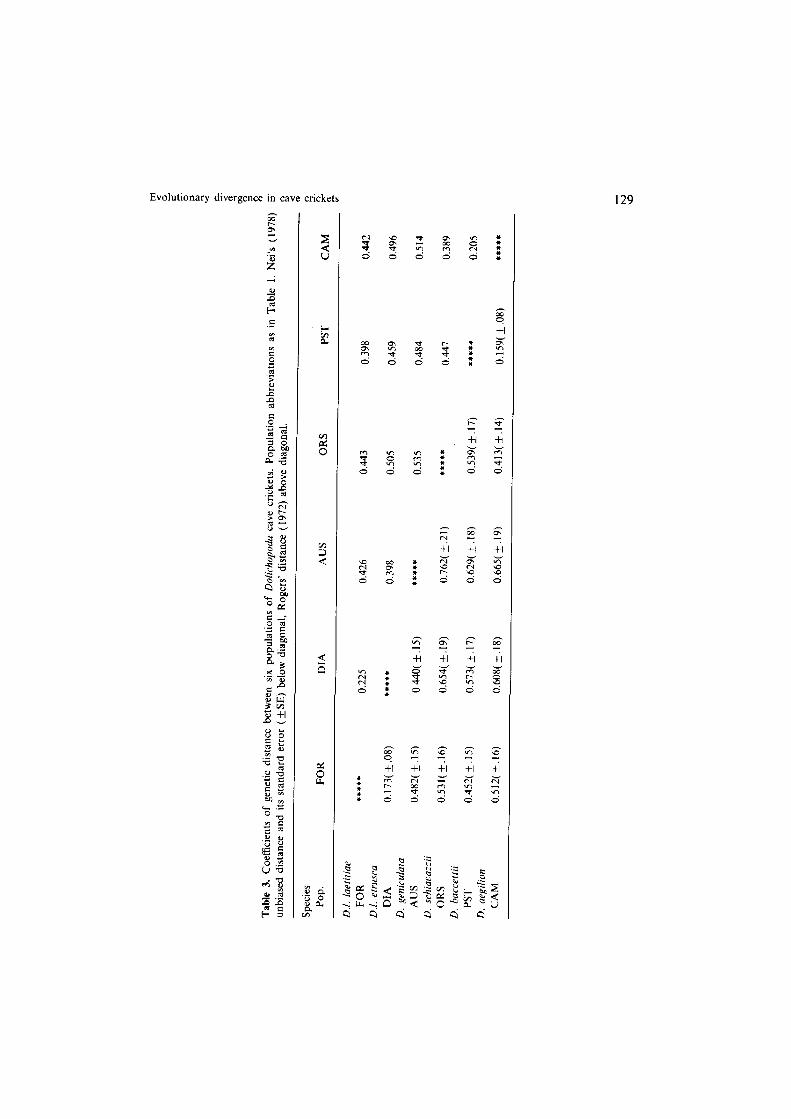
Table 3 reports the genetic distance coefficients (Nei’s and Rogers’) for pairwise comparisons for the six populations studied. The lowest distance values are between D. baccettii and D. aegilion (PST-CAM, Nei’s D = 0.159) and between the two D. luetitiae subspecies (FOR-DIA, Nei’s D = 0.173). Other interspecific distance values range from 0.413 to 0.762. These values are generally higher than in previous studies (Sbordoni et al., 1985). This is likely to depend upon the higher resolution of the cellogel electrophoresis technique. In particular, we were able to increase from 15 to 26 the number of storable loci by using this technique instead of the standard starch-gel media.
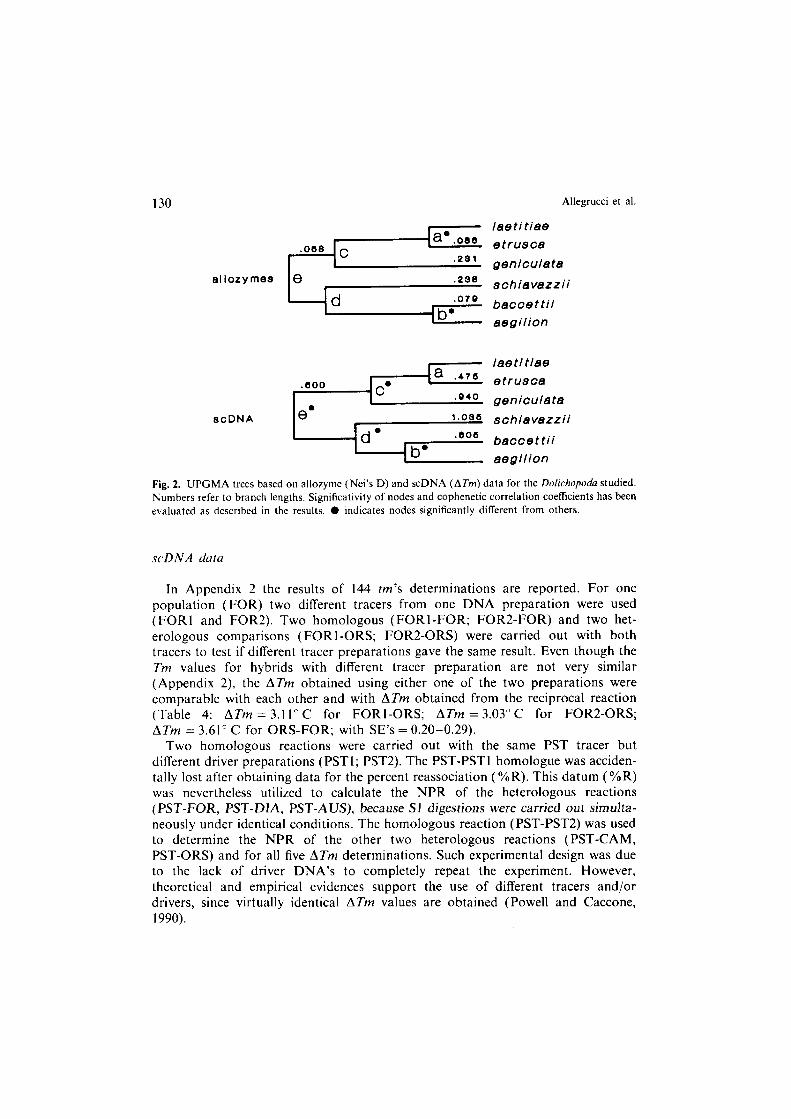
Figure 2 shows the UPGMA dendrogram constructed on Nei’s unbiased genetic distance ( rcoph = 0.89). Other clustering methods (distance Wagner procedure, least-square and neighbor-joining methods) produced similar branching pattern. Allozyme data separate two clusters: D. laetitiae-geniculata and D. schiavazzii- huccettii-aegilion. However, the SE values of the branching points (Nei et al., 1985) indicate that nodes (a) and (c), and (b) and (d) are statistically significantly different from one another, while node (c) and (d) are not statistically different from node (e). This suggests that allozymic data are not helpful in separating the two clusters. But, they clearly indicate the species relationships within each cluster.
Evolutionary divergence in cave crickets 129
130 Allegrucci et al.
Fig. 2. UPGMA trees based on allozyme (Nei’s D) and scDNA (ATm) data for the Dolichopoda studied. Numbers refer to branch lengths. Significativity of nodes and cophenetic correlation coefficients has been
evaluated as described in the results. 0 indicates nodes significantly different from others.
scDNA duta
In Appendix 2 the results of 144 tm’s determinations are reported. For one population (FOR) two different tracers from one DNA preparation were used (FOR1 and FOR2). Two homologous (FORl-FOR; FOR2-FOR) and two het- erologous comparisons (FORl-ORS; FOR2-ORS) were carried out with both tracers to test if different tracer preparations gave the same result. Even though the Tm values for hybrids with different tracer preparation are not very similar (Appendix 2), the ATm obtained using either one of the two preparations were comparable with each other and with ATm obtained from the reciprocal reaction (Table 4: ATm = 3.1 I“ C for FORl-ORS; ATm = 3.03” C for FOR2-ORS; ATm = 3.61’ C for ORS-FOR; with SE’s = 0.20-0.29).
Two homologous reactions were carried out with the same PST tracer but different driver preparations (PSTl; PST2). The PST-PST1 homologue was acciden- tally lost after obtaining data for the percent reassociation (%R). This datum (%R) was nevertheless utilized to calculate the NPR of the heterologous reactions (PST-FOR, PST-DIA, PST-AUS), because Sl digestions were carried out simulta- neously under identical conditions. The homologous reaction (PST-PST2) was used to determine the NPR of the other two heterologous reactions (PST-CAM, PST-ORS) and for all five ATm determinations. Such experimental design was due to the lack of driver DNA’s to completely repeat the experiment. However, theoretical and empirical evidences support the use of different tracers and/or drivers, since virtually identical ATm values are obtained (Powell and Caccone, 1990).
Evolutionary divergence in cave crickets 131
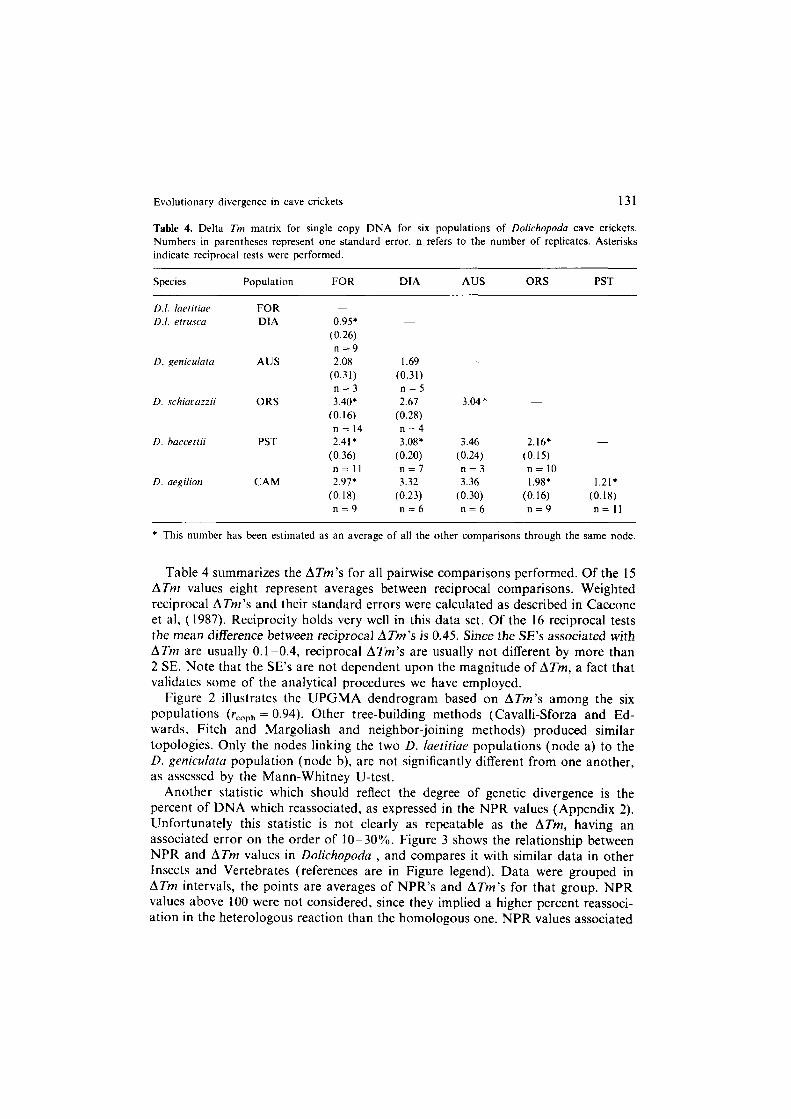
Table 4. Delta Tm matrix for single copy DNA for six populations of Dolichopodu cave crickets.
Numbers in parentheses represent one standard error. n refers to the number of replicates. Asterisks indicate reciprocal tests were performed.
Species Population FOR DIA AUS ORS PST
D.I. laetitiae FOR -
D.I. cfrusca DIA 0.95* (0.26) n=9
D. geniculata AUS 2.08 1.69 -
(0.31) (0.31)
n=3 n=5 D. schiarazzii ORS 3.4Of 2.67 3.04^
(0.16) (0.28)
n = 14 n=4
I). haccerlii PST 2.41, 3.08’ 3.46 2.16* -
(0.36) (0.20) (0.24) (0.15)
n= 11 n=l n=3 n= 10
D aegilion CAM 2.97* 3.32 3.36 1.98’ 1.21*
(0.18) (0.23) (0.30) (0.16) (0.18)
n=9 n=6 n=6 n=9 n= I1
* This number has been estimated as an average of all the other comparisons through the same node.
Table 4 summarizes the ATm’s for all pairwise comparisons performed. Of the 15 ATm values eight represent averages between reciprocal comparisons. Weighted reciprocal ATm’s and their standard errors were calculated as described in Caccone et al, (1987). Reciprocity holds very well in this data set. Of the 16 reciprocal tests the mean difference between reciprocal ATm’s is 0.45. Since the SE’s associated with ATm are usually 0.1-0.4, reciprocal ATm’s are usually not different by more than 2 SE. Note that the SE’s are not dependent upon the magnitude of ATm, a fact that validates some of the analytical procedures we have employed.
Figure 2 illustrates the UPGMA dendrogram based on ATm’s among the six populations (rcoph = 0.94). Other tree-building methods (Cavalli-Sforza and Ed- wards, Fitch and Margoliash and neighbor-joining methods) produced similar topologies. Only the nodes linking the two D. Iuetitiae populations (node a) to the D. geniculuta population (node b), are not significantly different from one another, as assessed by the Mann-Whitney U-test.
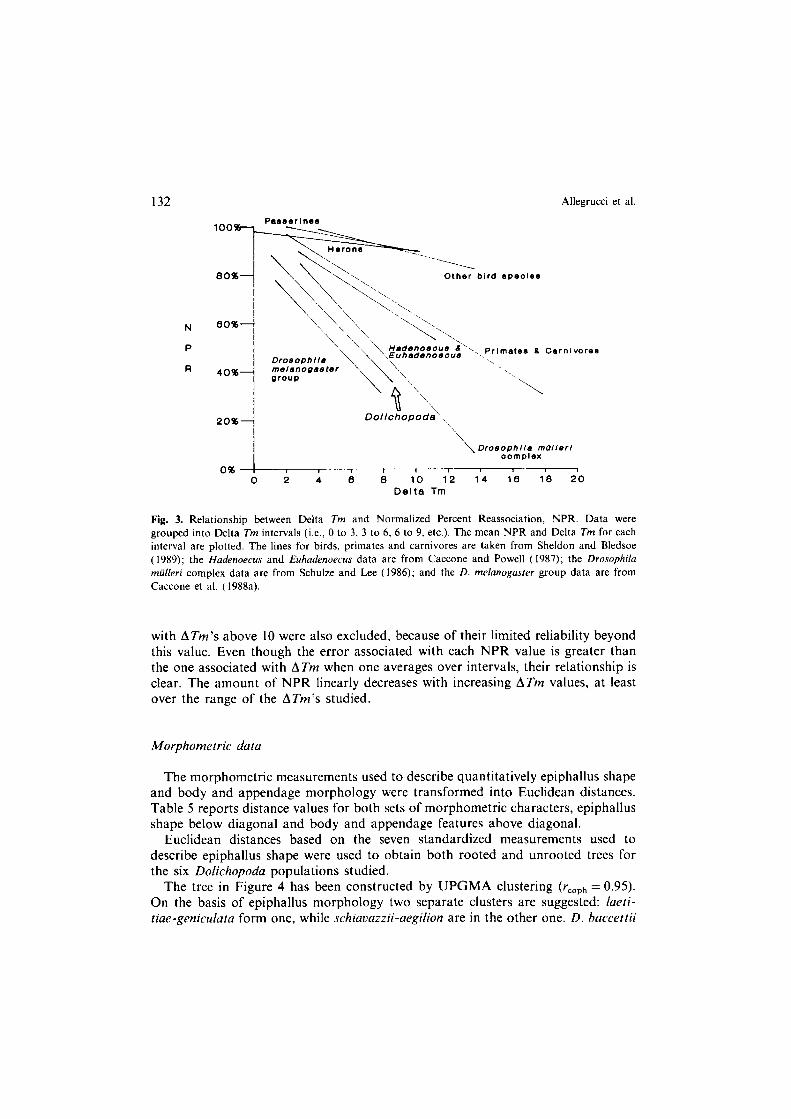
Another statistic which should reflect the degree of genetic divergence is the percent of DNA which reassociated, as expressed in the NPR values (Appendix 2). Unfortunately this statistic is not clearly as repeatable as the ATm, having an associated error on the order of lo-30%. Figure 3 shows the relationship between NPR and ATm values in Dolichopoda , and compares it with similar data in other Insects and Vertebrates (references are in Figure legend). Data were grouped in ATm intervals, the points are averages of NPR’s and ATm’s for that group. NPR values above 100 were not considered, since they implied a higher percent reassoci- ation in the heterologous reaction than the homologous one. NPR values associated
132 Allegrucci et al.
Fig. 3. Relationship between Delta Tm and Normalized Percent Reassociation, NPR. Data were
grouped into Delta Tm intervals (i.e., Cl to 3, 3 to 6, 6 to 9. etc.). The mean NPR and Delta Tm for each interval are plotted. The lines for birds. primates and carnivores are taken from Sheldon and Bledsoe ( 1989); the Hadenoecus and Euhadenoecus data are from Caccone and Powell (1987); the Drosophilu miilieri complex data are from Schulze and L.ee (1986); and the D. me/anoKasrer group data are from Caccone et al. (1988a).
with ATm’s above 10 were also excluded, because of their limited reliability beyond this value. Even though the error associated with each NPR value is greater than the one associated with ATm when one averages over intervals, their relationship is clear. The amount of NPR linearly decreases with increasing ATm values, at least over the range of the ATm’s studied.
Morphometric data
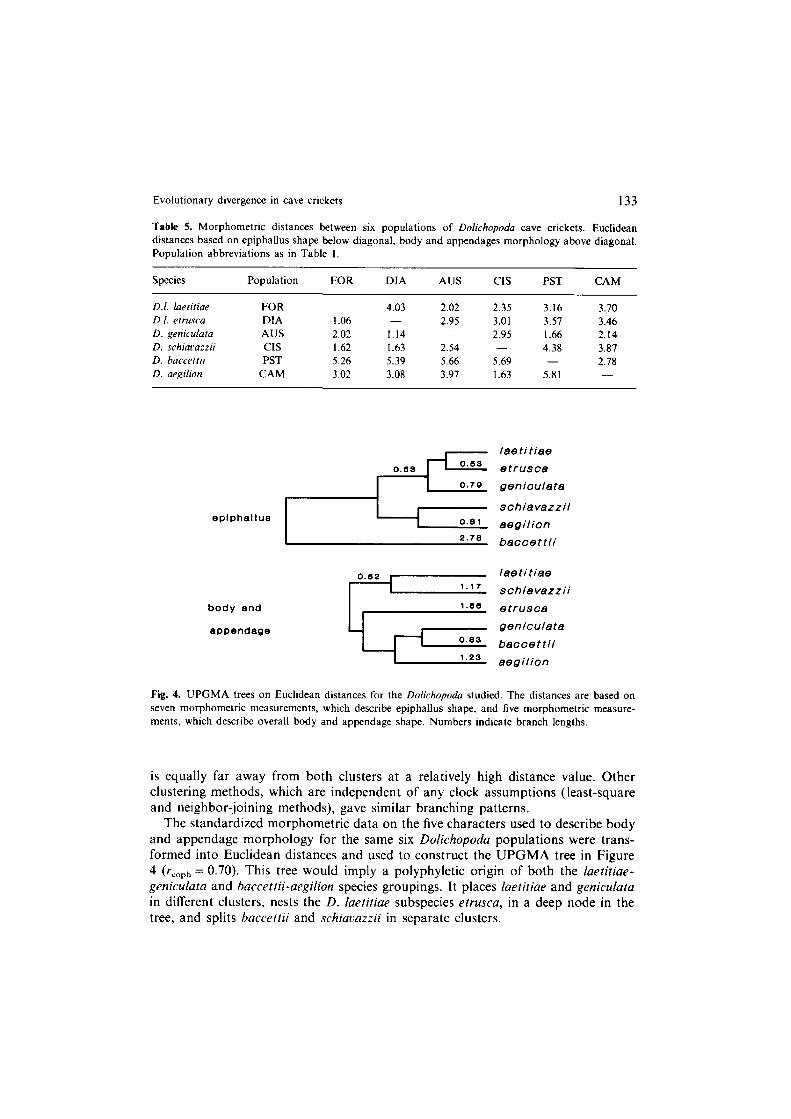
The morphometric measurements used to describe quantitatively epiphallus shape and body and appendage morphology were transformed into Euclidean distances. Table 5 reports distance values for both sets of morphometric characters, epiphallus shape below diagonal and body and appendage features above diagonal.
Euclidean distances based on the seven standardized measurements used to describe epiphallus shape were used to obtain both rooted and unrooted trees for the six Dolichopoda populations studied.
The tree in Figure 4 has been constructed by UPGMA clustering (rcoph = 0.95). On the basis of epiphallus morphology two separate clusters are suggested: laeti- tiae-geniculata form one, while schiavazzii-aegilion are in the other one. D. haccettii
Evolutionary divergence in cave crickets 133
Table 5. Morphometric distances between six populations of Dolichopodu cave crickets. Euclidean distances based on epiphallus shape below diagonal, body and appendages morphology above diagonal, Population abbreviations as in Table I.
Species Population FOR DIA AUS CIS PST CAM
D.1. laefifiae FOR 4.03 2.02 2.35 3.16 3.70
D.I. etrusca DIA 1.06 2.95 3.01 3.57 3.46
D. geniculato AUS 2.02 1.14 2.95 1.66 2.14
D. schiarazzii as 1.62 1.63 2.54 - 4.38 3.87
D. baccettii PST 5.26 5.39 5.66 5.69 - 2.78
D. aegilion CAM 3.02 3.08 3.97 I .63 5.81 -
Fig. 4. UPGMA trees on Euclidean distances for the Dolichopodu studied. The distances are based on
seven morphometric measurements, which describe epiphallus shape, and five morphometric measure- ments, which describe overall body and appendage shape. Numbers indicate branch lengths.
is equally far away from both clusters at a relatively high distance value. Other clustering methods, which are independent of any clock assumptions (least-square and neighbor-joining methods), gave similar branching patterns.
The standardized morphometric data on the five characters used to describe body and appendage morphology for the same six Dolichopoda populations were trans- formed into Euclidean distances and used to construct the UPGMA tree in Figure
4 G-Coph = 0.70). This tree would imply a polyphyletic origin of both the faetitiae- geniculata and haccettii-aegilion species groupings. It places laetitiae and geniculata in different clusters, nests the D. laetitiae subspecies etrusca, in a deep node in the tree, and splits baccettii and schiavazzii in separate clusters.
134 Allegrucci et al.
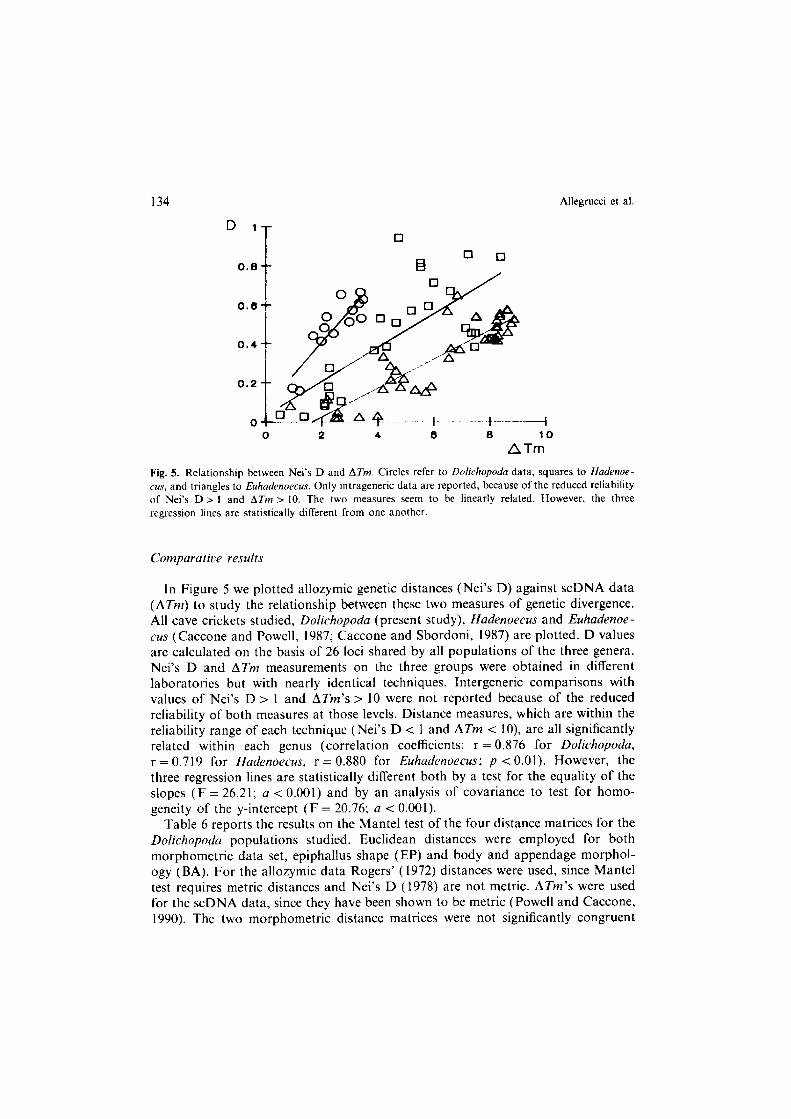
Fig. 5. Relationship between Nei’s D and ATm. Circles refer to Doiichopoda data, squares to Hadenoe- CM, and triangles to Euhadenoecus. Only intrageneric data are reported, because of the reduced reliability of Nei’s D > I and ATm > 10. The two measures seem to be linearly related. However. the three
regression lines are statistically different from one another.
Comparatise results
In Figure 5 we plotted allozymic genetic distances (Nei’s D) against scDNA data (ATm) to study the relationship between these two measures of genetic divergence. All cave crickets studied, Doiichopoda (present study), Hadenoecus and Euhadenoe- L’US (Caccone and Powell, 1987; Caccone and Sbordoni, 1987) are plotted. D values are calculated on the basis of 26 loci shared by all populations of the three genera. Nei’s D and ATm measurements on the three groups were obtained in different laboratories but with nearly identical techniques. Intergeneric comparisons with values of Nei’s D > I and ATm’s > 10 were not reported because of the reduced reliability of both measures at those levels. Distance measures, which are within the reliability range of each technique (Nei’s D < 1 and ATm < lo), are all significantly related within each genus (correlation coefficients: r = 0.876 for Doliehopodu, r = 0.719 for Hadenoecus, r = 0.880 for Euhadenoecus; p < 0.01). However, the three regression lines are statistically different both by a test for the equality of the slopes (F = 26.21; a < 0.001) and by an analysis of covariance to test for homo- geneity of the y-intercept (F = 20.76; a < 0.001).
Table 6 reports the results on the Mantel test of the four distance matrices for the Dolichopodu populations studied. Euclidean distances were employed for both morphometric data set, epiphallus shape (EP) and body and appendage morphol- ogy (BA). For the allozymic data Rogers’ (1972) distances were used, since Mantel test requires metric distances and Nei’s D (1978) are not metric. ATm’s were used for the scDNA data, since they have been shown to be metric (Powell and Caccone, 1990). The two morphometric distance matrices were not significantly congruent

Evolutionary divergence in cave crickets 135
Table 6. Results of the Mantel test (1967) on scDNA, allozymes and morphometric distance matrices.
Delta Tm values were employed for scDNA data, Rogers’ (1972) distances for allozymes, Euclidean distances for morphometric data on body and appendages (BA) and epiphallus shape (EP). r(matrix correlation) = normalized Mantel statistic Z; t = approximate Mantel t-test; p = one tail probability of Irandom ZI 2 lobs.ZI out of IO.000 random permutations.
Distance matrices compared r t P
scDNA ~ allozymes 0.858 3.10 0.001
scDNA BA morphometrics -0.380 - 1.58 0.061
scDNA EP morphometrics 0.189 1.24 a.115
allozymes ~ BA morphometrics - 0.256 -0.98 0.178
allozymes - EP morphometrics 0.006 0.02 0.417
BA morphometrics - EP morphometrics -0.053 -0.17 0.310
with one another or with any of the two molecular matrices. On the other hand, the two molecular matrices (scDNA-allozymes) were very highly congruent.
Discussion
IsozJwws wrsus single-copy DNA
Delta Tm values provides a measure of divergence of the entire single-copy genome. Nei’s D provides information on the divergence of a small sample of single-copy genes, i.e. a subset of the genes coding for soluble enzymatic proteins. These two measures should be related and indeed they are. Figure 5 shows the relationships between D and ATm for all cave cricket studied, Dofichopoda, Hadenoecus, and Euhadenoecus. The steepness of the line is quite different from genus to genus, making it difficult to arrive at any generalization on the absolute numerical relation between Nei’s D and ATm values. In particular, an increase of l- C in ATm gives an increase in D respectively of 0.165 for Dolichopoda, 0.87 for Hadenoecus, and 0.074 for Euhadenoecus. That is the increase of D in Dolichopoda with respect to ATm is twofold greater than in Hadenoecini. These conclusions, i.e. linearity between Nei’s D and ATm but calibrations between the two measures varying from taxon to taxon, are supported also from data on other organisms. In particular data are available for comparisons in several Dolichopoda species groups (Hawaiian species: Sene and Carson, 1977; Hunt et al., 1981; D. melanogaster group: Eisses et al., 1979; Tsacas and Tsacas, 1984; Cariou, 1987; Caccone et al., 1988a; n. ohscura group: Lakovaara et al., 1972; Pinsker and Buruga, 1982; Cabrera et al., 1983; Loukas et al., 1984; Goddard et al., 1990) in rodents (Nevo and Cleve, 1978; Catzeflis et al., 1989; She et al., 1990), in birds (Avise et al., 1980; Bledsoe, 1988) in primates (Bruce and Ayala, 1979; Caccone and Powell, 1989) and in carnivores (O’Brien et al., 1985). In all these cases Nei’s D and ATm show a fairly linear relation for values within the limits of each technique. However,

136 Allegrucci et al.
different absolute calibrations between Nei’s D and ATm were obtained when different taxa were compared (or data came from different experimental conditions or laboratories). This should caution against the tempting lure of making general- izations on relative rates of molecular divergence, since differences in rates not only between parts of the genome, but between different organisms may underlie most of the observed differences (Britten, 1986).
The Nei’s D and ATm data produced highly congruent distance matrices (Table 6). The clustering analyses produced trees which have similar topologies but different branch lengths (Fig. 2). In both cases the five Dolichopoda species are separated into two distinct clusters with D. laetiriae and D. geniculara belonging to one clade, and D. baccettii, D. schiavazzii and D. aegilion grouped in another clade. Within each group, both data sets arrive at similar relationships; the two D. Zaetitiae subspecies are closer to each other than to D. geniculata, whereas D. baccettii and D. aegilion are closer to one another than to D. schiatlazzii. However, the branch lengths are quite different and the statistical confidence that all nodes are significantly different from one another varies between the two trees. Isozyme electrophoresis allowed us to distinguish species and/or populations within each cluster. DNA-DNA hybridiza- tion statistically separates the two clusters, but is less efficient than isozyme electrophoresis at the intracluster level (i.e., it does not separate the two D. laetitiae populations). By using both techniques on the same taxa, we can ascertain with more confidence the genetic relatedness of different levels of divergence than we could have done using only one technique. The rationale behind this approach is straightfor- ward; each technique is most sensitive and reliable to different degrees of divergence. By using a combination of molecular techniques one can arrive at a consensus tree, which uses the most reliable data at each hierarchical level.
Calibrating molecular clocks at molecular genes
The relationship between allozymic genetic distance and time since divergence between two populations has been widely examined and discussed by several authors both from a theoretical and an empirical standpoint (for a review see Nei, 1987). In several organisms, the clock does not seem to track time since divergence accurately. This could be due to lineage specific differences in rates, and/or to strong differences in evolutionary rates of different coding regions which make up the pool of electrophoretic variants studied. Another possible source of bias could be the poorly assessed historical vicariant relationship between sister taxa to be studied. Notwithstanding these objective limitations of electrophoretic variant to study molecular rates of evolution, in cave organisms genetic distances based on allozymic surveys provide times of divergence that are in remarkable agreement with times of divergence based on biogeographical data (Sbordoni et al., 1990).
Vicariant histories of cavernicoles such as Dolichopoda are more reliable than for most non cave dwelling organisms. Speciation events are inferred to be strictly allopatric and mostly determined by isolation of different populations in isolated cave systems (Sbordoni, 1982; Barr and Holsinger, 1985). These events are usually
Evolutionary divergence in cave crickets 137
dated back to climatic shifts and marine transgressions during Pliocene-Pleistocene time, which forced cave crickets to use caves as refugia, and therefore started the speciation process. This relatively wide time window does not allow any calibration attempt. However, in one case we have a much more accurate time estimate. The divergence of the insular species D. aegilion from its continental sister taxon D. baccertii can be dated back at least to the time when the Giglio Island separated from the continent, following an earlier connection. This occurred during a marine transgression in the Giinz-Mindel interglacial, 700,000 to 1,000,OOO years ago (Kotsakis, pers. corn.; Lipparini, 1976; Mazzanti, 1983). By using Nei’s (1975) relationship t = kD with k = 5.106, we obtain an estimate oft = 795,000 f 405,000, which is consistent with the estimate from geological data.
One question of great interest is whether ATm values behave in a clock-like manner. Unfortunately, appropriate statistical tests are not yet available to formally test this hypothesis. The only conclusion we can draw from the data presented here is that ATm’s appear to behave in a clock-like manner. The previously discussed correlations between allozyme distance and both absolute time of divergence and scDNA are good hints of this. Moreover, trees built by using algorithms (Cavalli- Sforza and Edwards, 1967; Fitch and Margoliash, 1967), which do not require contemporaneous branch tips (i.e. molecular clock) and rooted by using as out- groups the North American cave crickets, have terminal branches ending quite synchronously. This result is similar to the ones obtained for other organisms (Caccone and Powell, 1987; Caccone et al., 1988a; Goddard et al., 1990). This should not be surprising considering the fact that ATm’s reflect divergence across the all single-copy genome, and differences in rates between different parts of the genome are likely to be averaged out (Caccone and Powell, 1989). If we accept the molecular clock for the present data, we might attempt to calibrate the clock with respect to absolute time.
If we translate the ATm value between D. aegilion and D. bacrettii in % bp mismatch (1 ATm = 1.3% bp mismatch), we obtain a value of 1.573% divergence. If the species split dates back to ~800,000 years, we arrive at a figure of 0.98% divergence per million years per lineage. This result is in agreement with the calibration attempted on other insects, mainly Drosophila, which indicate about I % divergence/my/lineage (Caccone and Powell, 1990). Insect DNA appears to evolve 5 IO faster than in some mammals (Primates and Carnivores) and birds. Admit- tedly, such calibrations are weak if considered singly; however the consistency over a large number of studies, including sequencing (Moriyama, 1987; Sharp and Li, 1989) indicate insects and perhaps all invertebrates evolve at this relatively fast rate compared to Primates, Carnivores and birds.
Molecular data sersus morphological data
The Euclidean distances based on morphometric data (Table 5) produced ma- trices, which are not congruent with each other or with any of the two molecular data matrices (Mantel tests, Table 6).
138 Allegrucci et al.
On the basis of epiphallus shape (EP) D. haccettii is the outgroup of two species groups; D. laetitiar and D. geniculata, and D. schiacazzii and D. aegilion (Fig. 4). This result is in contrast with both molecular trees, where D. baccettii clusters with D. schiarwzzii and D. aegilion. Epiphallus shapes were used in this study for two reasons. This structure is one of the major diagnostic characters used for taxonomy in Dolichopoda. A parallel study (Cesaroni et al., 1989, and in prep.) on the geographic variation of this character suggested that it is less prone to environmen- tally induced variation than other morphological traits. The epiphallus shape revealed significant differences between species, and a discontinuous trend in geographic variation. Multidimensional analyses on epiphallus morphometrics showed a weak relationship between these variables and environmental factors. This finding could justify the use of this feature as diagnostic tool for species recognition. However, being a species-specific trait with insignificant environmen- tally effected variation, does not necessarily make epiphallus shape as useful a phylogenetic trait as it is a diagnostic trait.
On the other hand, the lack of congruence between the EP tree and the molecular trees could be interpreted not as a character-linked problem, but as a species-linked problem. In effect, the EP tree differs from the molecular trees only by the position of D. baccettii (Figs 2, 4). Such highly divergent position could be viewed as the outcome of genetic drift acting on a small isolated population. D. baccettii is endemic of a small peninsula, only recently connected to the continent. If we assume that the epiphallus shape is controlled by relatively few loci, then one can easily envision a scenario where stochastic effects could act on this character accelerating its evolutionary rate.
If body and appendage morphometrics (BA) are considered, the two D. laeritiae subspecies are separated into two different clusters. D. 1. faetitiae is grouped with D. schiavazzii, while D. I. etrusca becomes the outgroup of all the other species, with D. hacrettii being closer to D. geniculata than to D. aegilion (Fig. 4). It is not surprising that the BA tree (Fig. 4) is at odds with traditional taxonomy based on a few chromosomal and morphological traits (Baccetti and Capra, 1959, 1970; Baccetti, 1982) and biogeography, and with the molecular data. The species similarities obtained from the BA morphometrics are more likely to reflect pheno- typic plasticity and/or short term adaptation to local environmental conditions than actual phylogenetic relationships. Previous studies, where correlation analyses be- tween these morphometric variables and mean annual cave temperature were carried out, suggest that bioclimatic factors may be the major determinants of the BA morphometric pattern observed (Allegrucci et al., 1987; Sbordoni et al., 1987; Cesaroni et al., 1989 and in prep.).
Direct comparisons of geographic patterns of morphometric variation of body parts and appendages with patterns of allozymic variation was carried out for several populations of D. geniculata and D. laetitiae. Allozymic data disclosed the existence of a laetitiae-genicula~a population complex, with a group of central populations genetically quite homogeneous surrounded by genetically isolated populations. Morphometrically the same populations did not cluster according to this scheme. Populations occurring in caves located at the same altitude or having

Evolutionary divergence in cave crickets 139
similar mean temperatures cluster together regardless of their genetic or geographic distances. This suggested that bioclimatic factors seemed to be the major variable responsible for the patterns observed (Allegrucci et al., 1987).
To further analyze the relation between genes and morphology, one should have data on the heritability of these morphometric characters. Such information is essential to ascertain if morphological traits might be subjected to substantial non-genetic variation and thus show local adaptation to environmental conditions. Morphometric measures provide divergence estimate on a series of genes, which may be responding differently to micro- and macro-environmental influences, allowing for plasticity in physical form, but confusing historical patterns of descent (Endler, 1982; Lewontin, 1984; Zink and Avise, 1990).
This does not necessarily imply that morphometric techniques are not useful in retrieving historical information. Rather, we argue that a careful character sifting should be performed prior to any decision on the usefulness of each character as a phylogenetic tracer for the time scale considered. Only by comparing compatible data sets could one optimize phylogenetic inference. In this context, we believe studies on the geographic variation of a particular morphometric character set could be a powerful way of character sifting, since it provides a mean to evaluate the impact of environmental factors on the evolution of characters (Sbordoni et al., 1991).
Acknowledgements
We are grateful to P. Matarazzo for this help in providing the data on morphological character sets.
Thanks are due also to J. R. Powell for useful comments on the manuscript. These studies have been supported by grants from Italian National Research Council (CNR) and Ministry of University and Scientific and Technologic Research (MURST).
References
Allegrucci, G., D. Cesaroni and V. Sbordoni. 1987. Adaptation and speciation of Dolirhopodu cave crickets (Orthoptera, Rhaphidophoridae): geographic variation of morphometric indices and
allozyme frequencies. Biol. J. Linn. Sot. 31: 151~ 160. Avise, J. C., J. C. Patton and C. F. Aquadro. 1980. Evolutionary genetics of birds. II. Conservative
protein evolution in North American sparrows and relative. Syst. Zool. 29: 323-334.
Ayala, F. J., J. R. Powell, M. L. Tracey, C. A. Mourao and S. Perez-Salas. 1972. Enzyme variability in the Drosophila willistoni group. IV. Genetic variation in natural populations of Drosophila wi[/isfoni. Genetics 70: 113- 130.
Ayala. F. J., D. Hedgecock. G. S. Zumwalt and J. W. Valentine, 1973. Genetic Variation in Triolacno maxima. an ecological analog of some unsuccessful evolutionary lineages. Evolution 27: I77- 191.
Ayala, F. J., M. L. Tracey, L. G. Barr and J. G. Ehrenfeld. 1974. Genetic and reproductive differentiation of the subspecies Drosophila equinoxiulis caribbensis. Evolution 28: 24 41.
Baccetti, B. 1982. Ortotteri cavernicoli italiani (Notulae orthopterologicae XXXVI). Lavori della Societa’ ltaliana di Biogeografia, Verona 1978 7: 1955200.
Baccetti, B. and F. Capra. 1959. Not&e orthopterologicae. XII. Revisione delle specie italiane de1 genere Dolichopodu Bol. (Orthoptera. Rhaphidophoridae). Redia 44: 165 2 17.
140 Allegrucci et al.
Baccetti, B. and F. Capra. 1970. Notulae orthopterologicae. XXVII. Nuove osservazioni sistematiche su
alcune Dolichopodu italiane esaminate anche al microscopio elettronico a scansione. Mem. Sot. Entomol. Ital. 48: 351-367.
Barr. T. C. Jr. and J. R. Holsinger. 1985. Speciation in cave faunas, Ann. Rev. Ecol. Syst. 16: 3133337. Best, R. L., R. M. Sullivan, J. A. Cook and T. L. Yates. 1986. Chromosomal genie and morphological
variation in the agile kangaroo rat, Dipodomys &is (Rodentia: Heteromydae). Syst. Zool. 35:
311 324. Bledsoe, A. H. 1988. Nuclear DNA evolution and phylogeny of the new world nine-primaried oscines.
Auk 105: 504515. Brewer, G. J. and C. F. Sing. 1970. An introduction to isozyme techniques. Academic Press, New York.
USA. Britten, R. J. 1986. Rates of DNA sequence evolution differ between taxonomic groups. Science 231:
1393-1398.
Britten. R. J., D. E. Graham and B. R. Neufeld. 1974. Analysis of repeating DNA sequences by reassociation, pp. 363 -418. In L. Grossman and K. Moldave (eds.), Methods in Enzymology, Vol. 29e. Academic Press, N.Y. USA.
Britten, R. J., A. Cetta and E. H. Davidson. 1978. The single-copy DNA sequence polymorphism of the sea urchin Strongylocenrrorus purpuratus. Cell 15: 1175 1186.
Bruce, E. J. and F. J. Ayala. 1979. Phylogenetic relationships between man and the apes: electrophoretic
evidence. Evolution 33: 1040 1056. Buth, D. G. 1984. The application of electrophoretic data in systematic studies. Ann. Rev. Ecol. Syst.
15: 501~ 522. Cabrera, V. M., A. M. Gonzales, J. M. Larruga and A. Gullon. 1983. Genetic distances and
evolutionary relationships in the Drosophila ohscuru group. Evolution 37: 675 -689. Caccone, A., G. D. Amato and J. R. Powell. 1987. Intraspecific DNA divergence in Drosophilu: a study
on parthenogenetic D. merratorum. J. Mol. Biol. Evol. 4: 343-350. Caccone, A., G. D. Amato and J. R. Powell. 1988a. Rates and patterns of scnDNA and mtDNA
divergence within the Drosophila mekznogaster subgroup. Genetics I 18: 671~ 683.
Caccone, A., R. DeSalle and J. R. Powell. 1988b. Calibration of the change in thermal stability of DNA duplexes and degree of base pair mismatch. J. Mol. Evol. 27: 212-216.
Caccone, A. and J. R. Powell. 1987. Molecular evolutionary divergence among North American cave
crickets. II. DNA-DNA hybridization. Evolution 41: 1215- 1238. Caccone, A. and J. R. Powell. 1989. DNA divergence among hominoids. Evolution 43: 9255942.
Caccone, A. and J. R. Powell. 1990. Extreme rates and heterogeneity in insect DNA evolution. J. Mol. Evol. 27: 212-216.
Caccone, A. and J. R. Powell. 1991. A protocol for the TEACL method of DNA-DNA hybridization.
In G. Hewitt (ed.) Molecular techniques in taxonomy, NATO Asi Series Vol. H 57. Springer Verlag, Berlin, Heidelberg, New York.
Caccone, A. and V. Sbordoni. 1987. Molecular evolutionary divergence among North American cave
crickets. I. Allozyme variation. Evolution 41: I I98 1214. Carchini, G., M. Rampini, C. Severini and V. Sbordoni. 1983. Population size estimates of four species
of Dolichopodu in natural and artificial caves of Central Italy (Orthoptera: Rhapidophoridae). Mem. Biospeol. IO: 341-347.
Carchini, G., C. Di Russo and V. Sbordoni. 1991. Contrasting age structures in cave cricket populations:
patterns and significance. Ecol. Entom. (in press). Cariou, M. L. 1987. Biochemical phylogeny of the eight species in the Drosophihz mekmogaster
subgroup, including D. sechellia and D. orena. Genet. Res. 50: 181-185. Cavalli-Sforza, L. and A. W. Edwards. 1967. Phylogenetic analysis: Models and estimation procedure.
Evolution 21: 550-570.
Catzeths, F. M.. E. Nevo, J. E. Ahlquist and C. G. Sibley. 1989. Relationships of the chromosomal species in the Eurasian Mole Rats of the Spalax ehrenhergi group as determined by DNA-DNA
hybridization and an estimate of the Spalacid-Murid divergence time. J. Mol. Evol. 29: 2233232.
Evolutionary divergence in cave crickets 141
Cesaroni, D., P. Matarazzo, G. Allegrucci, M. Scardi, E. Fresi and V. Sbordoni. 1989. Multivariate morphometrics and geographic variation of Dolichopodu cave cricket populations. 2nd Congr.
Europ. Sot. Evol. Biol., Roma 25529 Sept 1989, Abstracts, p 17. Eanes, W. F. and R. K. Koehn. 1978. An analysis of genetic structure in the monarch butterfly, Danaus
ph.uippus. Evolution 32: 784797. Eisses. K. T., H. Van Dijk and W. Van DeDelden. 1979. Genetic differentiation within the mclunogasfer
species group of the genus Drosophila (Sophophora). Evolution 33: 1063- 1068.
Endler, J. A. 1982. Problems in distinguishing historical from ecological factors in biogeography. Am. Zool. 22: 441-452.
Farris. J. S. 1972. Estimating phylogenetic trees from distance matrices. Am. Nat. 106: 645-668. Fitch, W. M. and E. Margoliash. 1967. Construction of phylogenetic trees. Science 155: 2799284. Goddard, K., A. Caccone and J. R. Powell. 1990. Evolutionary implications of DNA divergence in the
Drosophila obscura group. Evolution 44: I656 1670. Gould, S. J., D. S. Woodruff and J. P. Martin. 1974. Genetics and morphometrics of Cerion at Pongo
Carpet: A new systematic approach to this enigmatic land snail. Syst. Zool. 23: 5188535. Hall, T. J., J. W. Grula, E. H. Davidson and R. J. Britten. 1980. Evolution of sea urchin non-repetitive
DNA. J. Mol. Evol. 19: 955110. Harris, H. and D. A. Hopkinson. 1976. Handbook of enzyme electrophoresis in human genetics. North
Holland Pub]. Camp., Amsterdam, Netherlands. Hill%, D. M. 1987. Molecular versus morphological approaches to systematics. Ann. Rev. Ecol. Syst. 18:
23 42. Hillis. D. M., J. S. Frost and D. A. Wright. 1983. Phylogeny and biogeography of the Rono pipiens
complex: A biochemical evaluation. Syst. Zool. 32: l32- 143. Hillis, D. M. and C. Moritz. 1990. Molecular systematics. Sinauer, Sunderland. Mass, USA.
Hunt, J. A., T. J. Hall and R. J. Britten. 1981. Evolutionary distance in Hawaiian Drosophila as measured by DNA reassociation. J. Mol. Evol. 17: 361-367.
Hutton, J. R. and J. G. Wetmur. 1973. Effect of chemical modification on the rate of renaturation of deoxyribonucleic acid. Biochemistry 12: 5588563.
Kohne, D. E. 1970. Evolution of higher organism DNA. Q. Rev. Biophys. 33: 327-375. Lakovaara, S. A., A. Saura and C. T. Falk. 1972. Genetic distance and evolutionary relationships in the
Drosophila obscura group. Evolution 26: l77- 184.
Lewontin, R. C. 1984. Detecting population differentiation in quantitative characters as opposed to gene frequencies. Am. Nat. 123: 155-164.
Lipparini, T. 1976. Per la storia del popolamento delle isole dell’Arcipelago Toscano. Lav. Sot. It. Biogeografia 5: 13-25.
Loukas, M., C. B. Krimbas and Y. Vergini. 1984. Evolution of the obscura group Drosophila species II. Phylogeny of ten species based on electrophoretic data. Heredity 53: 483-493.
Mantel, N. 1967. The detection of disease clustering and a generalized regression approach. Cancer. Res.
27: 2099220. Mazzanti, R. 1983. II punto sul quaternario della fascia costiera e dell’arcipelago di Toscana. Boll. Sot.
Geol. ltaliana 52: 419 -556. Meera Khan, P. 1971. Enzyme electrophoresis on cellulose acetate gel: zymogram patterns in man-mouse
and man-Chinese hamster somatic cell hybrids. Arch. Biochem. Biophys. 145: 470-483.
Miyamoto, M. M. 1981. Congruence among character sets in phylogenetic studies of the frog genus Lepodactylus. Syst. Zool. 30: 281 --290.
Miyamoto, M. M. 1983. Frogs of the Eluetherodacfylus rugulosus group. A cladistic study of allozyme, morphological and karyological data. Syst. Zoo]. 32: 109-124.
Moriyama, E. N. 1987. Higher rates of nucleotide substitution in Drosophilu than in mammals. Jpn. J. Genet. 62: 1399147.
Nei, M. 1975. Molecular population genetics and evolution. North Holland Publ. Comp. Amsterdam, Netherlands.
Nei, M. 1978. Estimation of average heterozygosity and genetic distance from a small number of individuals. Genetics 89: 583 590.
142 Allegrucci et al.
Nei, M. 1987. Molecular evolutionary genetics. Columbia University Press. New York, USA.
Nei, M., J. C. Stephens and N. Saitou. 1985. Methods for computing the standard errors of branching points in an evolutionary tree and their application to molecular data from humans and apes. Mol. Biol. Evol. 2: 66-85.
Nevo. E. and H. Cleve. 1978. Genetic differentiation during speciation. Nature 274: 125-126. O’Brien, S. J., W. G. Nash, D. E. Wildt. M. E. Bush and R. E. Benveniste. 1985. A molecular solution
to the riddle of the giant panda’s phylogeny. Nature 317: 140- 144. Orosz, J. M. and J. G. Wetmur. 1977. DNA melting temperatures and renaturation rates in concentrated
alkylammonium salt solutions. Riopolymers 16: 1183-l 199. Patterson, C. (ed.). 1987. Molecular and morphology in evolution: conflict or compromise’! Cambridge
University Press. Pinsker, W. and J. Buruga. 1982. Comparative study of allozyme variation in six species of the
Drosophila obucura group. Z. Zoo]. Syst. Evolutionsforsch 20: 53 63. Powell, J. R. and A. Caccone. 1990. The TEACL method of DNA-DNA hybridization: technical
considerations. J. Mol. Evol. 30: 267 -272.
Powell, J. R. and A. Caccone. 1991. DNA-DNA hybridization: principles and results. In G. Hewitt (ed.) Molecular techniques in taxonomy, NATO Asi Series Vol. H 57. Springer Verlag, Berlin,
Heidelberg, New York. Richardson, B. J.. P. R. Baverstock and M. Adams. 1986. Allozyme electrophoresis. A handbook for
animal systematics and population studies. Academic Press, New York. USA. Rohlf, F. J. 198X. NTSYS-pc, Numerical taxonomy and multivariate analysis system for (he IBM PC
microcomputer (and compatibles), version 1.40. Exeter Publ. Ltd., New York. Rohlf, F. J. and R. R. Sokal. 1981. Comparing numerical taxonomic studies. Syst. Zool. 30: 459-490.
Rogers, J. S. 1972. Measures of genetic similarity and genetic distance. Studies in genetics VII. Univ. Texas Publ. 7213: 145 153.
Saitou, M. and M. Nei. 1987. The neighbor-joining method: a new method for reconstructing phylogenetic trees. Mol. Biol. Evol. 4: 406-425.
Sbordoni, V. 1980. Strategie adattative negli animali cavernicoli: uno studio di genetica cd ecologia di popolazione. Accademia Nazionale dei Lincei. Contributi del Centro Interdisciplinare. Scienze
Matematiche e loro applicazioni 51: 61-100. Sbordoni, V. 1982. Advances in speciation of cave animals, pp. 219-240. In C. Barigozzi (ed.)
Mechanisms of speciation. Alan Liss, New York. USA. Sbordoni, V., G. Allegrucci, D. Cesaroni, M. Cobolli Sbordoni and E. De Matthaeis. 1985. Genetic
structure of population and species of Dolichoporia cave crickets: evidence of peripatric divergence, pp. 95% 114. In V. Sbordoni (ed.) Genetics and ecology in contact zones of populations. Boll. Zool.
52. Erredici. Padova, Italy. Sbordoni, V., G. Allegrucci, A. Caccone, G. Carchini and D. Cesaroni. 1987. Microevolutionary studies
in Dolichopodinae cave crickets, pp. 514-540. In B. Baccetti (ed.) Evolutionary Biology of Orthopteroid insects. Horwood Ltd., Chichester. England.
Sbordoni, V., G. Allegrucci and D. Cesaroni. 1991. A multidimensional approach to the evolution and systematics of Dolichopodu cave crickets. p. I71 199. In G. Hewitt (ed.) Molecular techniques in
taxonomy, NATO Asi Series Vol. H 57. Springer Verlag, Berlin, Heidelberg, New York. Sbordoni, V., A. Caccone, G. Allegrucci and D. Cesaroni. 1990. Molecular island biogeography. p.
55-83. In A. Azzaroli (ed.) Biogeographical aspects of insularity. Atti dei Convegni Lincei. Vol. 85. Accademia Nazionale dei Lincei, Roma. Italy.
Sbordoni, V., E. De Matthaeis and M. Cobolli Sbordoni. 1976. Phosphoglucomutase polymorphism and natural selection in populations of the cave cricket Dolichopodu genirulata. Z. Zool. Syst. Evolutionforsch 14: 292 - 299.
Schulze, D. H. and C. S. Lee. 1986. DNA sequence comparison among closely related Drosophila species in the mulleri complex. Genetics 113: 287-303.
Selander, R. K., M. H. Smith, S. Y. Yang, W. E. Johnson and J. B. Gentry. 1971. Biochemical polymorphism and systematics in the genus Prromysrus. I. Variation in the old field mouse Peromyscus polionorus. Studies in genetics. VI Univ. Texas Publ. 7103: 49-90.

Evolutionary divergence in cave crickets 143
Sene, F. M. and H. L. Carson. 1977. Genetic variation in Hawaiian Drosophila IV allozymic similarity between D. sih~eslris and D. hereroneura from the island of Hawaii. Genetics 86: 187- 189.
Sharp, P. M. and W-13. Li. 1989. On the rate of DNA sequence evolution in Drosophila. J. Mol. Evol. 28: 398 -402.
She, J. X., F. Bonhomme. P. Boursot, L. Thaler and F. M. Catzetlis. 1990. Molecular phylogenies in the genus Mus: comparative analysis of electrophoretic. scnDNA hybridization and mtDNA rflp data. Biol. J. Linn. Sot. 41: 83-103.
Sheldon, F. H. and A. H. Bledsoe. 1989. Indexes to the reassociation and stability of solution DNA hybrids. J. Mol. Evol. 29: 328 343.
Sokal, R. R. and C. D. Michener. 1958. A statistical method for evaluating systematic relationships. Univ. Kansas Sci. Bull. 38: 140991438.
Swofford. D. L. and R. B. Selander. 1981. BIOSYS-I. A computer program for the analysis of allelic variation in genetics. Univ. Illinois, Urbana.
Tsacas, S. C. and L. Tsacas. 1984. A phenetic tree of eighteen species of the melanogaster group of Drosophila using allozyme data as compared with classification based on other criteria. Genetica
64: 141-144. van Someren, H., H. Beijersbergen van Henegouwen, W. Los, E. Wurzer-Figurelli. B. Doppert, M.
Vervloet and P. Meera Khan. 1974. Enzyme electrophoresis on cellulose acetate gel. Humangenetik 25: 189-201.
Zink. R. M. and J. C. Avise. 1990. Patterns of mitochondrial DNA and allozyme evolution in the avian
genus Ammodramus. Syst. Zool. 39: 148&161.
Received 7 January 1991; accepted 9 March 1991.
Corresponding Editor: F. Bonhomme
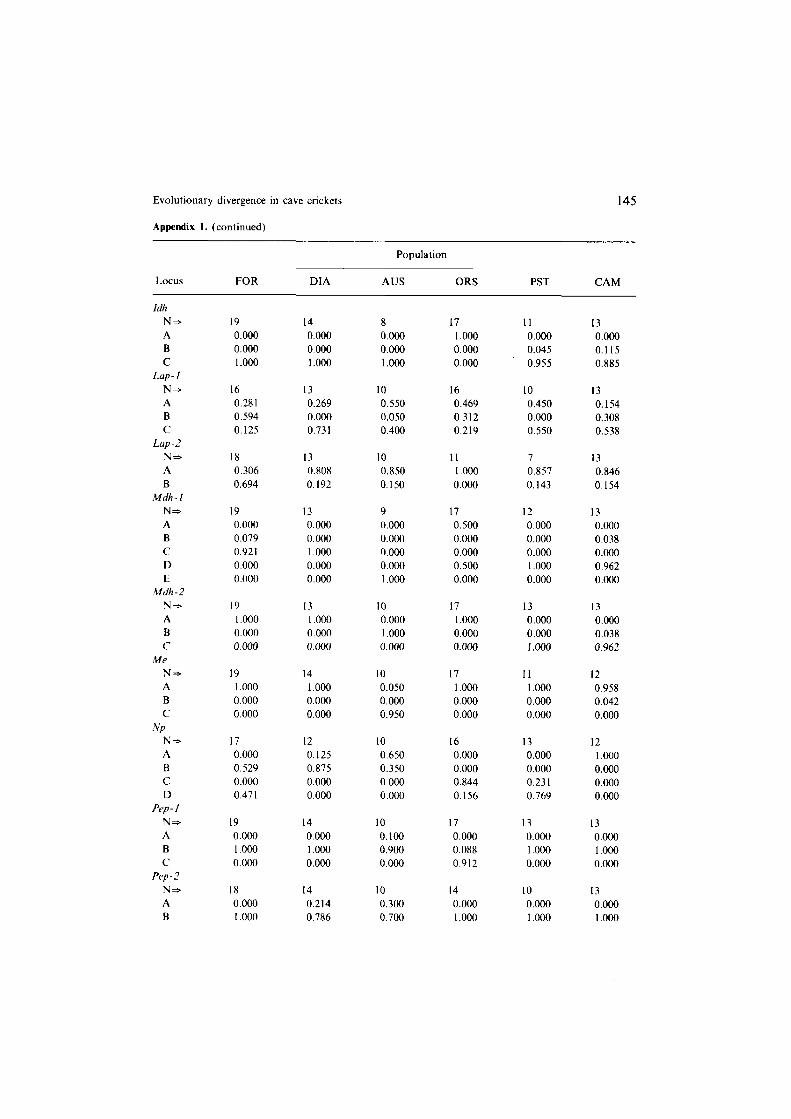
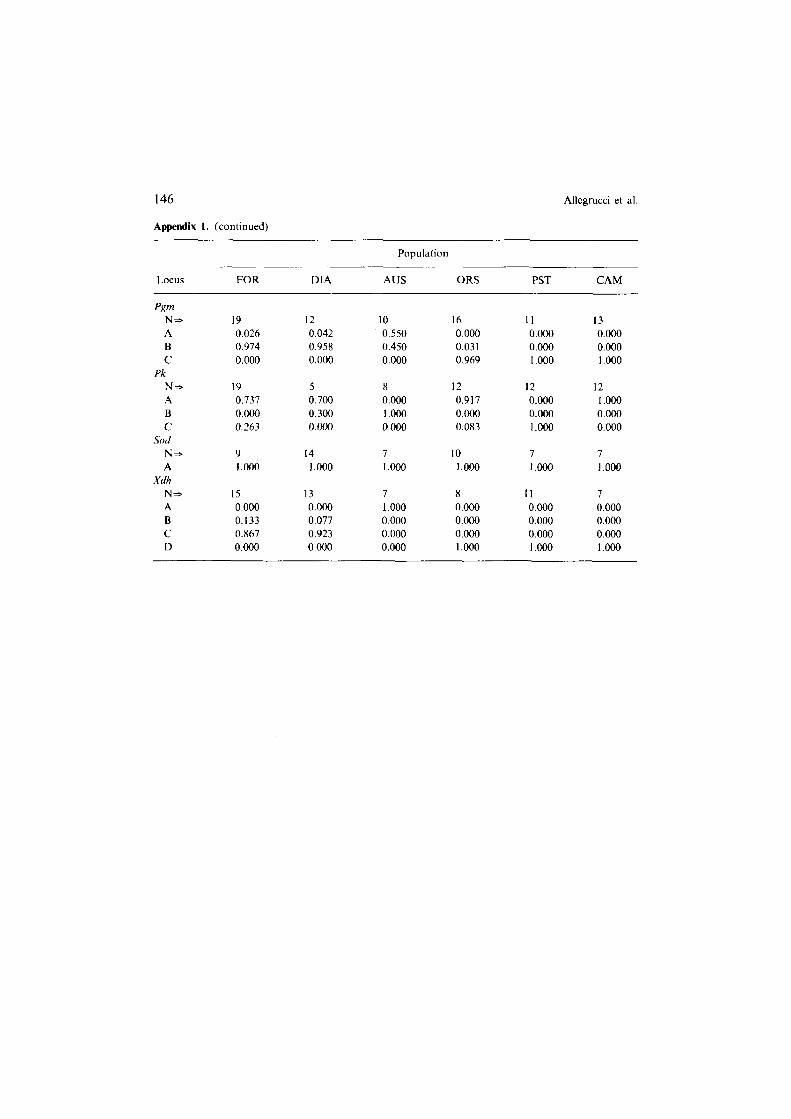
Appendix 1. Allele frequencies at 26 gene loci coding for enzymes and general proteins in 6 populations of Dolichopoda cave crickets. Population abbreviations are in Table 1. N is the number of individuals analyzed. Letters (A, B, C. D, E) refer to different alleles.
Population
Locus FOR DIA AUS ORS PST CAM
Aeon-2
NS- A B
C
ACP N* A B
Adu NS A B
c Aldo
N=
A
12 0.000 0.000
1 .ooo
14
1.000 0.000
I2 12
0.083 0.833 0.917 0.167 0.000 0.000
19
1.000
8 0.000 0.125
0.875
13
O.OQO 1.000
14
I.000
IO 8 0.900 0.000 0.100 0.312
0.000 0.687
11
1.000 0.000
IO 0.950
0.050 0.000
10
1.000
13
1.000 0.000
9 0.000
1.000 0.000
17
l.ooo
10 6 0.000 0.000 0.000 0.000 1 .a00 1.000
12 l.oQo 0.000
12 0.000 0.000
l.ooo
II 1.000
12 1.000 0.000
10 0.000 0.050
0.950
13
1.000
144 Allegrucci et al.
Appendix 1. (continued)
Population
Locus FOR DIA AUS ORS PST CAM
Ao-3
N=Z-
A B
C
D
Ap-I N*
A B
C
Est- I N=a
A
B
c Est-2
N=C- A
B
C Esd- I
N*
A B
C
D Got
N=
A
B Gp-I
N*
A
Gp-2
N* A
B
C Gpi
N=P A
B
C
D
18 14 8 15 II 9
0.000 0.000 0.500 0.367 0.000 0.000
0.583 0.643 0.500 0.633 0.000 0.556
0.417 0.357 0.000 0.000 0.040 0.000
0.000 0.000 0.000 0.000 1.000 0.444
I5 14 8 12 10 I2
0.000 0.000 0.000 0.625 0.350 0.875 0.900 1.000 0.750 0.375 0.650 0.125
0.100 0.000 0.250 0.000 0.000 0.000
19 14 8 I2 8 9
0.947 0.893 0.875 0.000 1.000 0.167
0.053 0.107 0.062 1.000 0.000 0.833
0.000 0.000 0.062 0.000 0.000 0.000
19 14 IO 17 13 I3 0.132 0.143 0.200 0.118 0.962 l.ooo 0.000 0.857 0.700 0.882 0.038 0.000
0.868 0.000 0.100 0.000 0.004 0.000
19 I4 10 16 13 13
0.132 0.000 0.500 0.844 0.000 0.000 0.000 0.000 0.000 0.031 0.000 0.000
0.000 0.000 0.000 0.000 0.000 0.269 0.868 1.000 0.500 0.125 1.000 0.731
17 1.000
0.000
14 l.ooo
0.000
7 16
l.ooo I .Ooo
0.000 0.000
IO 1.000
0.000
I2
0.500
0.500
I9 1.000
14
1 .ooo
13
1.000 13
1.000
19 14 0.000 0.000
0.842 0.250 0.158 0.750
I3 I3 0.000 0.000
0.923 0.962 0.077 0.038
19 13
0.079 0.077
0.921 0.923
0.000 0.000 0.000 0.000
II 17
1.om 1.000
10 17
0.000 0.088
l.ooO 0.912
0.000 0.000
10 I7 0.050 0.000 0.950 0.000
0.000 0.040
0.000 1.000
13 13
0.004 0.000 0.077 0.192
0.923 0.808
0.000 0.000
Evolutionary divergence in cave crickets
Appendix 1. (continued)
145
Population
Locus FOR DIA AUS ORS PST CAM
Idh N- A
B C
Lap-l NS
A B c
Lap-2 N= A
B Mdh - I
N=
A B
c D
E Mdh -2
N*
A B
c Me
N-
A B C
.VP NS
A B
C D
Pep-l N* A
B c
Pep - 2
N- A
B
19
0.000 0.000
I .ooo
I4
0.000 0.000
1.000
8
O.OQO 0.000
l.ooo
17
1.000 0.000
0.000
11
0.000 0.045 0.955
13
0.000 0.115 0.885
16 I3 10 16 10 13
0.281 0.269 0.550 0.469 0.450 0.154 0.594 0.000 0.050 0.312 0.000 0.308 0.125 0.731 0.400 0.219 0.550 0.538
18 13 10 II 7 13
0.306 0.808 0.850 1.000 0.857 0.846
0.694 0.192 0.150 0.000 0.143 0.154
19 13 9 I7 12 I3
0.000 0.000 0.000 0.500 0.000 0.000
0.079 0.000 O.ooO 0.000 0.000 0.038
0.921 1 .ooo O.OOQ 0.000 0.000 0.000
0.000 0.000 0.000 0.500 1.000 0.962
0.000 0.000 1.000 0.000 0.000 0.000
19 I3 10 I7 I3 13
1.000 l.oQo 0.000 I .ooo 0.000 0.000 0.000 0.000 1.000 0.000 0.000 0.038
0.000 0.000 0.000 0.000 f.ooo 0.962
19 I4 IO 17 II 12
1.000 1.000 0.050 1.000 1.000 0.958 0.000 0.000 0.000 0.000 0.000 0.042
0.000 0.000 0.950 0.000 0.000 0.000
17 I2 IO 16 13
0.000 0.125 0.650 0.000 0.000
0.529 0.875 0.350 0.000 0.000
0.000 0.000 0.000 0.844 0.231 0.471 0.000 O.OOil 0.156 0.769
I9
0.000 I.000 O.OQO
I4
0.000 1.000 0.000
17 0.000
0.088 0.912
I8 I4
0.000 0.214 I .ooo 0.786
10 0.100
0.900 0.000
10 0.300
0.700
14 0.000
I .ooo
13 o.ooQ
I .oGQ 0.000
IO 0.000 1.000
I2
1.000 0.000
0.000 0.000
I3 O.OOil
I .oOQ O.OOQ
13 0.000 1.000
146
Appendix I. (continued)
Allegrucci et al.
Population
Locus FOR DIA AUS ORS PST CAM
PP N-
A
B C
Pk Na A
B C
Sod N* A
Xdh N- A
B C D
I9 12 0.026 0.042 0.974 0.958 0.000 0.000
19 0.737 0.000 0.263
9 1.000
I5 13 7 8 0.000 0.000 1.000 0.000 0.133 0.077 0.000 0.000 0.867 0.923 0.000 0.000 0.000 0.000 0.000 1.000
c
Lm 0.300 0.000
14 1.000
10 0.550
0.450 0.000
8
0.000
1.000
0.000
7 l.ooo
16
0.000
0.03 1 0.969
12
0.917 0.000 0.083
IO
1.000
I1 0.000 0.000 1.000
12 0.000 0.000 1.000
7 I.000
II
0.000
0.000
0.000
1.000
13 0.000 0.000 1.000
12 1.000 0.000
o.oQo
7
1.000
7 0.000 0.000 0.000 l.ooo

Evolutionary divergence in cave crickets 147
Appendix 2. The table below presents detailed data from DNA-DNA hybridization experiments. For each tracer preparation the results for the homoduplex are shown first (FORI-FOR), followed by the results for the heteroduplexes (FORI-DIA etc.). Abbreviations for the species are as in Table I; other
abhreviations: N = number of replicate tm determinations; tm = mean uncorrected median melting temperature; SE = standard error of fin (and rm); TL = tracer length; tcorr = temperature correction; Tm corrected median melting temperature; %R = percentage reassociation; NPR = normalized percent- age reassociation. Numbers after population symbols refer to different tracer and/or driver preparations.
Tracer Driver N tm SE TL tcorr Tt?l %R NPR
FOR1
FOR2
DIA
PST
PST
CAM
ORS
FOR 4 57.60
DIA 5 57.06
AUS 3 55.68 PST 5 55.94
CAM 5 55.43
ORS 5 54.71
FOR 3 58.02
ORS 4 54.22 LOS 3 48.44
CEU 4 40.42
DIA 6 57.41
FOR 4 56.14 AUS 5 55.50 PST 3 54.25
CAM 6 54.32 ORS 4 54.70 PSTI -*
FOR 6 52.51
DIA 4 52.32
AUS 3 53.16 PST2 8 55.86
CAM 5 56.46
ORS 6 53.73 CAM 6 58.22 FOR 4 54.80
AUS 6 54.68
PST 6 56.69 ORS 6 55.55 ORS 3 55.97 FOR 5 52.16
PST 4 54.01
CAM 3 54.25
0.25 122 4.10 61.70 0.26 134 3.73 60.79
0.19 127 3.94 59.62 0.30 141 3.54 59.48 0.17 145 3.45 58.88 0.15 129 3.88 58.59
0.12 214 2.33 60.35 0.16 I61 3.10 57.32 0.09 142 3.52 51.96 0.19 172 2.91 43.33 0.16 138 3.63 61.10
0.35 126 3.96 60.10 0.26 128 3.91 59.41 0.17 I28 3.90 58.15
0.17 144 3.46 57.78
0.22 134 3.73 58.43 -
0.20 0.40 0.13 0.20 0.12
0.31 0.16 0.16
0.25 0.22 0.16 0.1 I
0.16 0.13
0.20
80 6.23 58.80 80 6.29 58.61
90 5.55 58.71 79 6.31 62.17
109 4.67 61.13
78 6.41 60.14 207 2.41 60.63 179 2.78 57.58 193 2.59 57.27 202 2.47 59.17 170 2.93 58.48 85 5.91 61.88 82 6.11 58.27 88 5.61 59.68
86 5.83 60.08
63.0 100.0 55.6 88.3
35.9 57.0 73.4 116.5
79.8 126.7 69.9 110.9 68.7 100.0 44.3 64.5
38.7 56.3 56.8 82.6 94.4 100.0
59.0 62.5 56.7 60.1 79.9 84.6
55.3 58.6
67.6 71.6 69.5 100.0 69.2 99.6 53.7 77.3
56.2 80.9 46.7 100.0 43.7 93.7
30.8 66.0 79.8 100.0 50.4 63.1 55.8 69.9
77.8 97.4 69.6 87.2 12.2 100.0 26.7 219.3 16.4 134.8
17.2 141.4
* Sample accidently lost after Sl digestion, used only for NPR calculation
Appe
ndix
3.
The
tabl
e be
low
pres
ents
da
ta on
ep
ipha
llus
mor
pholo
gy.
To
expr
ess
quan
titativ
ely
the
mor
pholo
gy
of
the
epip
hallu
s we
ha
ve
mea
sure
d th
e
tota
l le
ngth
of
th
e st
ruct
ure
(LTO
T)
and
its
widt
h at
six
di
ffere
nt
poin
ts
alon
g th
e ep
ipha
llus.
Th
ese
poin
ts
have
be
en
chos
en
to
max
imize
th
e in
form
atio
n
on
the
parts
of
th
is
stru
ctur
e wh
ich
diffe
r am
ong
spec
ies.
Th
e six
po
ints
to
be
m
easu
red
were
fo
und
for
each
ep
ipha
llus
rela
tive
to
its
tota
l le
ngth
: at
its
ba
se
(~0.
0);
at
5%
(wO.
O5),
10%
(~
0.1)
. 20
%
(ti.2
) 40
%
(~0.
4)
and
70%
(~
0.7)
of
its
to
tal
leng
th.
Valu
es
are
aver
age
mea
sure
s pe
r po
pula
tion
in
tent
h of
m
illim
etre
f
stan
dard
de
viatio
n.
Popu
latio
n
sym
bol
wo.0
wo
.05
wo.l
wo.2
wo
.4
wo.7
LT
OT
AUS
184.
9 +
14.5
1 15
2.4
+ 21
.46
194.
6 k
17.4
5 17
8.4
f 14
.43
113.
3 +
12.3
9 54
.9
+ 3.
99
502.
5 k
23.6
3
DIA
218.
6 f
20.9
0 16
6.3
f 14
.39
182.
6 f
13.8
7 17
1.7
* 17
.35
107.
2 &
10.4
0 59
.0
_+ 5
.87
506.
4 &
29.2
4
FOR
267.
8 +
15.6
7 21
8.6
f 16
.38
198.
5 k
14.0
2 16
9.8
k 11
.74
106.
5 &
8.56
62
.2
f 7.
63
474.
9 f
24.5
4
CAM
27
8.0
f 0.
00
175.
0 f
0.00
13
7.0
f 0.
00
123.
0 k
0.00
10
1.0
f 0.
00
65.0
k
0.00
61
9.0
k 0.
00
PST
513.
0 +
40.6
5 43
3.0
+ 43
.23
336.
7 k
24.5
7 17
5.0
f 8.
64
78.7
f
4.78
54
.0
* 3.
74
688.
7 &
25.0
0
as
222.
9 +
13.9
8 17
7.9
* 13
.94
168.
0 k
14.3
3 14
3.6
f 9.
30
107.
7 +
6.09
62
.9
+ 3.
94
543.
6 &
21.6
0
Appe
ndix
4.
Aver
age
mor
phom
etric
m
easu
res
(mm
) an
d th
eir
stan
dard
de
viatio
n fo
r bo
dy
and
appe
ndag
es
of
adul
t m
ale
Dolich
opod
u. Va
lues
ar
e av
erag
e
mea
sure
s pe
r po
pula
tion,
Popu
latio
n Pr
onot
um
sym
bol
leng
th
PROL
Pron
otum
widt
h PR
OW
Met
afem
ur
leng
th
mFE
L M
etat
ibia
le
ngth
m
TIL
Met
atar
sus
leng
th
mTA
L
AUS
3.9
f 0.
23
4.7
+ 0.
35
24.7
k
1.26
29
.7
+ 1.
14
6.0
f 0.
49
DIA
4.2
k 0.
23
5.4
* 0.
21
26.4
+
1.37
31
.9
k 1.
78
6.8
f 0.
42
FOR
4.2
f 0.
17
5.1
f 0.
19
23.3
k
0.95
28
.1
+ 1.
51
6.2
k 0.
27
CAM
4.
0 f
0.00
4.
7 f
0.00
25
.5
k 0.
00
31.3
*
0.00
5.
0 &
0.00
PST
3.5
* 0.
07
4.3
+ 0.
18
24.2
&
1.43
31
.1
& 1.
86
6.2
f 0.
29
CIS
4.7
f 0.
57
5.8
f 0.
69
24.8
k
2.80
28
.9
f 3.
38
6.3
+ 0.
97
Related Documents