Evolutionary criteria outperform operational approaches in producing ecologically relevant fungal species inventories JEFF R. POWELL,* MICHAEL T. MONAGHAN,† MAARJA O ¨ PIK‡ and MATTHIAS C. RILLIG* *Institut fu ¨r Biologie, O ¨ kologie der Pflanzen, Freie, Universita ¨t Berlin, Altensteinstr. 6, 14195 Berlin, Germany, †Leibniz- Institute of Freshwater Ecology and Inland Fisheries, (IGB), Mu ¨ ggelseedamm 301, 12587 Berlin, Germany, ‡Department of Botany, Institute of Ecology and Earth, Sciences, University of Tartu, 40 Lai St., 51005 Tartu, Estonia Abstract Analyses of the structure and function of microbial communities are highly constrained by the diversity of organisms present within most environmental samples. A common approach is to rely almost entirely on DNA sequence data for estimates of microbial diversity, but to date there is no objective method of clustering sequences into groups that is grounded in evolutionary theory of what constitutes a biological lineage. The general mixed Yule-coalescent (GMYC) model uses a likelihood-based approach to distinguish population-level processes within lineages from processes associated with speciation and extinction, thus identifying a distinct point where extant lineages became independent. Using two independent surveys of DNA sequences associated with a group of ubiquitous plant-symbiotic fungi, we compared estimates of species richness derived using the GMYC model to those based on operational taxonomic units (OTUs) defined by fixed levels of sequence similarity. The model predicted lower species richness in these surveys than did traditional methods of sequence similarity. Here, we show for the first time that groups delineated by the GMYC model better explained variation in the distribution of fungi in relation to putative niche-based variables associated with host species identity, edaphic factors, and aspects of how the sampled ecosystems were managed. Our results suggest the coalescent-based GMYC model successfully groups environmental sequences of fungi into clusters that are ecologically more meaningful than more arbitrary approaches for estimating species richness. Keywords: arbuscular mycorrhizal fungi, biodiversity, coalescent, GMYC model, operational taxonomic unit Received 2 June 2010; revision received 23 September 2010; 8 November 2010; accepted 14 November 2010 Introduction Species form the systematic basis of biodiversity and delineating species remains a foundational issue in biol- ogy. The task is particularly challenging for microbial ecologists because of the enormous diversity present within most environmental samples, the difficulty in- readily assigning cryptic morphological characters to species-level differences, and the more fundamental lack of a widely applicable concept of microbial species. The vast majority of microbial biodiversity cannot be cultured in the laboratory (Liesack & Stackebrandt 1992), and a common approach to dealing with this problem is to rely almost entirely on DNA sequence data for biodiversity estimates, where variation at one or a few genetic loci is used to characterize whole microbial communities in culture and in the environ- ment. Analogs of species richness are estimated by assigning sequences to operational taxonomic units (OTUs) based on some level of sequence similarity, a methodology that arose from early empirical studies by bacterial taxonomists linking percentage sequence similarity to DNA–DNA hybridization percentages Correspondence: Jeff R. Powell, Fax: ++49 (0)30 838 53886; E-mail: [email protected] Ó 2010 Blackwell Publishing Ltd Molecular Ecology (2011) 20, 655–666 doi: 10.1111/j.1365-294X.2010.04964.x

Welcome message from author
This document is posted to help you gain knowledge. Please leave a comment to let me know what you think about it! Share it to your friends and learn new things together.
Transcript

Molecular Ecology (2011) 20, 655–666 doi: 10.1111/j.1365-294X.2010.04964.x
Evolutionary criteria outperform operational approachesin producing ecologically relevant fungal speciesinventories
JEFF R. POWELL,* MICHAEL T. MONAGHAN,† MAARJA OPIK‡ and MATTHIAS C. RILLIG*
*Institut fur Biologie, Okologie der Pflanzen, Freie, Universitat Berlin, Altensteinstr. 6, 14195 Berlin, Germany, †Leibniz-
Institute of Freshwater Ecology and Inland Fisheries, (IGB), Muggelseedamm 301, 12587 Berlin, Germany, ‡Department of
Botany, Institute of Ecology and Earth, Sciences, University of Tartu, 40 Lai St., 51005 Tartu, Estonia
Corresponde
E-mail: jeffpo
� 2010 Black
Abstract
Analyses of the structure and function of microbial communities are highly constrained
by the diversity of organisms present within most environmental samples. A common
approach is to rely almost entirely on DNA sequence data for estimates of microbial
diversity, but to date there is no objective method of clustering sequences into groups
that is grounded in evolutionary theory of what constitutes a biological lineage. The
general mixed Yule-coalescent (GMYC) model uses a likelihood-based approach to
distinguish population-level processes within lineages from processes associated with
speciation and extinction, thus identifying a distinct point where extant lineages became
independent. Using two independent surveys of DNA sequences associated with a group
of ubiquitous plant-symbiotic fungi, we compared estimates of species richness derived
using the GMYC model to those based on operational taxonomic units (OTUs) defined
by fixed levels of sequence similarity. The model predicted lower species richness in
these surveys than did traditional methods of sequence similarity. Here, we show for the
first time that groups delineated by the GMYC model better explained variation in the
distribution of fungi in relation to putative niche-based variables associated with host
species identity, edaphic factors, and aspects of how the sampled ecosystems were
managed. Our results suggest the coalescent-based GMYC model successfully groups
environmental sequences of fungi into clusters that are ecologically more meaningful
than more arbitrary approaches for estimating species richness.
Keywords: arbuscular mycorrhizal fungi, biodiversity, coalescent, GMYC model, operational
taxonomic unit
Received 2 June 2010; revision received 23 September 2010; 8 November 2010; accepted 14 November 2010
Introduction
Species form the systematic basis of biodiversity and
delineating species remains a foundational issue in biol-
ogy. The task is particularly challenging for microbial
ecologists because of the enormous diversity present
within most environmental samples, the difficulty in-
readily assigning cryptic morphological characters to
species-level differences, and the more fundamental
lack of a widely applicable concept of microbial species.
nce: Jeff R. Powell, Fax: ++49 (0)30 838 53886;
well Publishing Ltd
The vast majority of microbial biodiversity cannot be
cultured in the laboratory (Liesack & Stackebrandt
1992), and a common approach to dealing with this
problem is to rely almost entirely on DNA sequence
data for biodiversity estimates, where variation at one
or a few genetic loci is used to characterize whole
microbial communities in culture and in the environ-
ment. Analogs of species richness are estimated by
assigning sequences to operational taxonomic units
(OTUs) based on some level of sequence similarity, a
methodology that arose from early empirical studies by
bacterial taxonomists linking percentage sequence
similarity to DNA–DNA hybridization percentages

656 J . R . POWELL ET AL.
(Stackebrandt & Goebel 1994; Hanage et al. 2006) and
that was then extrapolated to other microbial taxa.
Criteria based on sequence similarity can have lim-
ited meaning where rates of sequence divergence are
nonuniform across clades and where inaccurate a priori
groups have been used to calibrate thresholds (e.g.
97%) of sequence divergence (Gevers et al. 2005;
Hanage et al. 2006; Vogler & Monaghan 2007; Koeppel
et al. 2008; Fraser et al. 2009). Taxonomists and evolu-
tionary biologists have recently begun to apply phylog-
enetics and population genetics theories to the
delineation of species boundaries using DNA
sequences, but the integration of these tools into envi-
ronmental surveys of microbial biodiversity has been
limited. Using data sets that combine both population-
and species-level genetic polymorphism, the general
mixed Yule-coalescent (GMYC) model (Pons et al. 2006;
Fontaneto et al. 2007) identifies evolutionarily indepen-
dent clusters of DNA sequences by differentiating
branches within clusters, associated with neutral coales-
cent (merging of lineages within a population) pro-
cesses (Kingman 1982), from branches between clusters,
associated with speciation events (Yule 1925). The point
of highest likelihood of this mixed model estimates the
switch from speciation to coalescent processes and can
thus be interpreted as the species boundary. A more
recent version of the GMYC model allows for multiple
lineages to each have their own transition threshold
within a single phylogenetic tree (Monaghan et al.
2009). The approach has been proposed as a means to
delineate species in a variety of metazoan (Pons et al.
2006; Ahrens et al. 2007; Fontaneto et al. 2007; Jousselin
et al. 2009; Monaghan et al. 2009; Papadopoulou et al.
2009; Bode et al. 2010), protozoan (Leliaert et al. 2009),
and bacterial (Barraclough et al. 2009; Jousselin et al.
2009) groups.
The GMYC method may be a more appropriate tool for
estimation of diversity from environmental DNA
sequence data due to its grounding in evolutionary the-
ory (Pons et al. 2006; Fontaneto et al. 2007). However, a
direct comparison of this and more arbitrary approaches
to predict biologically-relevant patterns is lacking. For
instance, the GMYC method may be expected to perform
better than more arbitrary approaches in its ability to pre-
dict biologically meaningful groups that differ in ecologi-
cal function or behaviour, especially involving traits that
are likely to have been derived recently (i.e. between clo-
sely related species). Such traits may include colonization
of divergent ecosystem types within a landscape (Koep-
pel et al. 2008) or interaction with an obligate symbiont
(Jousselin et al. 2009).
The arbuscular mycorrhizal (AM) fungi make up a
group of microorganisms for which an objective method
for clustering sequences into putative species is critical,
because no unambiguous method for quantifying diver-
sity from DNA sequence data has emerged. Obligate
symbionts of plants, the group associates with species in
70–90% of terrestrial plant families (Smith & Read 2008).
Their demonstrated importance for promoting plant
diversity and productivity in some systems (van der
Heijden et al. 1998; Klironomos et al. 2000) has triggered
several attempts to characterize AM fungal diversity in a
variety of natural and managed systems (Opik et al.
2006, 2010). Functional variation among AM fungi exists
at various taxonomic and phylogenetic levels (Hart &
Reader 2002; Koch et al. 2006; Maherali & Klironomos
2007; Powell et al. 2009; Sikes et al. 2009; Wehner et al.
2010), suggesting that evolutionary and ecological trade-
offs have contributed to the diversification of this group.
In addition, there is clear evidence that the structure and
function of AM fungal communities vary in response to
the chemical and biotic characteristics of their environ-
ment (Johnson et al. 2005; Johnson 2010).
Earlier surveys of AM fungal diversity in environ-
mental samples focused on extraction and identification
of spores from environmental samples (e.g. Johnson
et al. 1992). Given that species descriptions are based
primarily on spore morphology (Schenck & Smith
1982), this approach was well suited to utilize the exist-
ing AM fungal taxonomic framework. However, sur-
veys have increasingly relied on DNA sequence-based
approaches to estimate AM fungal diversity in environ-
mental root and soil samples, and there are several
issues that prevent the use of a strictly taxonomic
approach to estimate diversity. Most importantly, taxo-
nomic descriptions of AM fungi are likely biased
toward those species that produce abundant and/or
long-lived spores. Compounding this issue is the fact
that studied isolates of AM fungi are usually obtained
from environmental samples by culturing with one of
only a few host plant species, resulting in a significant
cultivation bias (Sykorova et al. 2007). In addition, there
have been clades of AM fungi detected in environmen-
tal surveys for which no comparable DNA sequence
from a described species exists, and many of these
fungi have not been and may never be observed (Hibb-
ett et al. 2009). As a result, AM fungal biodiversity sur-
veys from environmental DNA samples have largely
relied on methods based on phenetics (i.e. sequence
similarity) and are likely to benefit from more objective
and biologically meaningful clustering approaches.
In this study, we evaluated the ability of the GMYC
model to detect evolutionarily informed clusters (here-
after referred to as GMYC groups) from AM fungal 18S
rDNA sequence data collected during two regional
surveys: (i) northern boreal forest and dry meadow
plots in Estonia and (ii) neotropical primary forest and
plantation plots in Ecuador. We compared estimates of
� 2010 Blackwell Publishing Ltd

SPECIES DELINEATI ON IN FUNGAL INVENTORIES 657
species richness derived from these GMYC groups to
those derived by assigning sequences to OTUs based on
traditional limits in sequence similarity. Then, we com-
pared the ecological relevance of the approach by test-
ing whether groups could account for variation in
putative niche-based parameters associated with the
spatial distributions. Our analyses suggest that discrete
shifts in branching rates in single-locus phylogenetic
trees can be used to obtain evolutionarily and ecologi-
cally relevant estimates of fungal richness in environ-
mental surveys. In addition, they suggest that species
groups predicted by the GMYC model can have greater
ecological relevance than more arbitrary distance-based
approaches, which will help researchers addressing
pressing questions in fungal biodiversity studies. For
instance, our results provide insight into how host-plant
specialization and ecosystem management influence
AM fungal species distributions.
Materials and methods
Obtaining DNA sequences
To address whether the GMYC model could be used to
delineate lineages of AM fungi, we used 18S rRNA
gene sequences obtained from environmental surveys in
Estonia (Opik et al. 2003, 2008) and Ecuador (Haug
et al. 2010). These studies were chosen because they
had sufficient sampling intensity across the breadth of
much of the phylum, and they provided estimates of
environmental parameters at the sample level. Briefly,
DNA was extracted from roots of various host species
associated with the sampling locations. Seven sites in
Estonia were sampled. The sites encompassed three dif-
ferent ecosystem types (boreal forest, forest border, dry
meadow) and boreal forest sites were subjected to two
levels of management intensity. Selective harvesting in
low-intensity plots resembled mature, old-growth for-
est. High-intensity management was represented by
clear-cutting <30 years prior to sampling and replanting
with Norway spruce. The original authors used the
NS31/AM1 primer set (Helgason et al. 1998) to amplify
a 550-bp central fragment of the 18S rRNA gene with a
high level of specificity to AM fungal DNA. Samples
from Ecuador were taken from 15 neotropical primary
forest plots, three reforested pasture sites, and seven
nursery plants (Kottke et al. 2008; Haug et al. 2010).
The authors used a series of primer sets, each of which
amplifies 18S rDNA from a different AM fungal taxon
in a nested set of reactions (Glomus Group A: SSU128/
SSU1536IH then SSU300/GLOM1310rc; Glomus Group
B: SSU817/NS8 then SSU817/LETC1670rc; Acaulospora-
ceae: SSU817/NS8 then SSU817/ACAU1660rc; Archaeo-
sporales: SSU817/SSU1536IH then SSU817/ARCH
� 2010 Blackwell Publishing Ltd
1375rc). Amplicons are of variable length, but all con-
tain an overlapping region of approximately 530 bp at
the 5’-end of the 18S rRNA gene (based on the
sequences we analyzed). This amplicon lies down-
stream of the NS31/AM1 amplicon and does not
overlap with it. Further details on the isolation, amplifi-
cation, and sequencing of AM fungal DNA are
described in the original publications.
Species delineation by sequence clustering
For our analyses, sequences were aligned using MUSCLE
v.3.6 (Edgar 2004). Prior to phylogenetic reconstruction,
the most appropriate models of evolution were esti-
mated from the alignments using ModelTest 3.7
(Posada & Crandall 1998); a GTR nucleotide substitu-
tion model with gamma-distributed substitution rates
was selected in each case; we included an estimated
proportion of invariant sites for the Estonia data. Dupli-
cate haplotypes were removed using the ‘unique.seqs’
command in mothur (Schloss et al. 2009), after which
tree topology and branch lengths were estimated using
a Bayesian search and a strict molecular clock as imple-
mented in BEAST version 1.5.3 (Drummond & Rambaut
2007). In a study of five insect taxa, Monaghan et al.
(2009) observed little variation in the number of groups
predicted by the GMYC model when using a relaxed or
strict molecular clock and a coalescent prior; however,
the use of a Yule prior resulted in large differences
compared with a coalescent prior. A coalescent prior
was used in our search to allow comparision with the
GMYC null model in which all sequences are derived
from a single population coalescent. Demographic his-
tory is likely to vary among lineages, and we assumed
a constant population size as the most conservative esti-
mate across all lineages. Model parameters were esti-
mated from the data, and a UPGMA tree was used to
start the chain. We reconstructed phylogenetic trees
from all unique sequences obtained in each of the Esto-
nia (577 aligned bp) and Ecuador (532 aligned bp) sur-
veys separately. In addition, to compare our richness
estimate to that of Haug et al. (2010), which was only
estimated for Glomus group A, we reconstructed the
phylogeny of 134 unique Glomus A sequences (1113
aligned bp). The MCMC chain was run for 3 · 107 gen-
erations for the Estonia tree (395 unique sequences) and
for 1 · 107 generations for the Ecuador trees (137 and
134 unique sequences); chain length was chosen with
regard to the number of sequences in each data set.
Trees were sampled every 1000 generations from the
MCMC chains, and the final 10 000 (Estonia) or 9000
(Ecuador) trees of each chain (each burn-in was chosen
to ensure sufficient effective sample size for the esti-
mated parameters and to remove initial trees of low

658 J . R . POWELL ET AL.
likelihood from the chain) were analyzed with TREEAN-
NOTATOR (Drummond & Rambaut 2007), using a poster-
ior probability limit of 0.5 and targeting the maximum
clade credibility tree while retaining node heights.
The GMYC model was optimized to these clock-
constrained trees using the GMYC script, available as
a tool within the ‘SPLITS’ package (Ezard et al. 2009)
for R (R Development Core Team 2009). The proce-
dure uses functions from the ‘ape’ library (Paradis
et al. 2004). Briefly, the procedure examines the distri-
bution of waiting times between diversification events
using a likelihood-based approach. The model has two
components (the neutral coalescent model and the
Yule model) for estimating the likelihood of waiting
times (Pons et al. 2006; Fontaneto et al. 2007). Each
component has two parameters that are estimated
from the data (a branching parameter and a scaling
parameter); the fifth parameter indicates the threshold
transition point between the two-model components.
A modified version of the model permits the age of
the transition point to vary among lineages (multiple
thresholds; Monaghan et al. 2009). For the Ecuador
data, we performed the analysis without removing the
outgroup from the tree; we did this to improve the
power of the algorithm to estimate parameters associ-
ated with the Yule portion of the model, as the num-
ber of early branching events (i.e. divergences between
species and higher order taxa) was relatively low for
this tree. Likelihood ratio (LR) tests were used to eval-
uate the significance of the single-threshold model to
the null model, and the multiple-threshold model to
the single-threshold model.
To compare diversity estimated by the GMYC
approach to that estimated by OTU approaches, we used
the approaches for OTU delineation that were used in the
original analyses (Opik et al. 2003; Haug et al. 2010). For
the Estonia data, sequences were grouped into OTUs on
the basis of bootstrap support and sequence similarity of
‡97% based on a neighbor-joining tree. We used the
actual OTU definitions originally determined in Opik
et al. (2003) to facilitate comparison of the approaches.
For the Ecuador data, OTUs (‘sequence types’ in the ori-
ginal publication) were obtained by forming groups of
sequences based on 99% (as in the original publication)
or 97% similarity, using the furthest-neighbor method in
mothur (Schloss et al. 2009). Species accumulation curves
were derived from rarefaction using the ‘vegan’ package
(Oksanen et al. 2010) in R.
Explaining variation in environmental axes
We used redundancy analysis to estimate the amount
of variation in parameters associated with putative
niches that could be explained by the identity of
genetic clusters. This approach is analogous to the par-
titioning of variance between- and within-groups in
standard analysis of variance. Analyses were per-
formed using the ‘ade4’ (Dray & Dufour 2007) and
‘vegan’ packages in R. For the Estonia survey, a mix
of qualitative (host plant species and stand age cate-
gory) and quantitative variables (soil pH, N, P, organic
C) made up the columns of the table; further details
are available in Opik et al. (2008). Individuals (rows)
in the table were limited to 866 sequences obtained
from the study published in Opik et al. (2008), as the
relevant environmental data had been collected for the
samples from which these sequences were obtained.
We used a combination of normed principal compo-
nents analysis and multiple correspondence analysis
(MCA) in the AM fungal ordination (Hill & Smith
1976; Dray & Dufour 2007). For the Ecuador survey,
the 197 sequences were annotated with information on
the host species and ecosystem type (neotropical pri-
mary forest, plantation, nursery) from which they were
obtained. We used MCA to transform the ecosystem
type classes into quantitative variables prior to redun-
dancy analysis; we did not include the host data in
the analysis because of the small number of sequences
associated with each host species (median ¼ 3). For
each model, we calculated the Akaike information cri-
terion corrected for small sample size (AICc; McQuar-
rie & Tsai 1998) using a multivariate analogue of
residual sums of squares, calculated as the sum of all
eigenvalues minus the sum of the canonical eigen-
values of Y (the matrix of dependent variables) on X
(the matrix of explanatory variables), described by
Legendre & Anderson (1999).
Results
Detection of GMYC groups
In the gene trees from the Estonia and Ecuador surveys,
we observed evidence of a discrete threshold at which
the time between branching events changes (Fig. 1a,d),
identifying a possible species boundary. A single-
threshold GMYC model provided a better fit to the data
than a null model of uniform coalescent branching
across the entire tree in each case (Estonia: LR ¼ 24.2,
d.f. ¼ 3, P < 0.001; Ecuador: LR ¼ 7.3, d.f. ¼ 3,
P ¼ 0.06). Allowing the Yule-coalescent threshold to
vary among lineages (Monaghan et al. 2009) did not
significantly improve the fit of the model when com-
pared to the single-threshold fit (Estonia: v2 ¼ 10.8,
d.f. ¼ 12, P ¼ 0.54; Ecuador: v2 ¼ 6.8, d.f. ¼ 9, P ¼0.66), suggesting that the age of the species boundary
did not vary significantly among the lineages repre-
sented in these gene trees.
� 2010 Blackwell Publishing Ltd

12
51020
50100200
500
Num
ber
of li
neag
es
(a)
–0.7 –0.5 –0.3 –0.1
3560
3570
3580
3590
3600
3610
Time
Like
lihoo
d
(b)
Glomus Ab
Glomus Aa
Gigasporaceae Acaulosporaceae Diversisporaceae
(c)
1
2
5
10
20
50
100
Num
ber
of li
neag
es
(d)
–1.0 –0.6 –0.2
1126
1128
1130
1132
1134
1136
Time
Like
lihoo
d
(e)
Glomus B Gigasporaceae
Acaulosporaceae
Paraglomeraceae
Archaeosporales
Glomus A
(f)
Fig. 1 Lineage-through-time (LTT) plots (a,d) and likelihood profiles of the single-threshold general mixed Yule-coalescent (GMYC)
model (b,e) fit to the evolutionary reconstruction of arbuscular mycorrhizal fungi detected from field surveys in Estonia (c) and Ecua-
dor (f). The LTT plots indicate an increase in branching rate (¼ reduction in waiting times between branching events) near the tips.
The solid vertical line in each plot indicates the threshold time for the maximum likelihood GMYC model transition, which suggests
a shift from phylogenetic Yule processes to coalescent population processes. The dashed vertical lines indicated the confidence inter-
val for this estimate (within two log-likelihood units of the maximum). Time is scaled from )1 (divergence of the ingroup and
outgroup) to 0 (time of sampling).
SPECIES DELINEATI ON IN FUNGAL INVENTORIES 659
� 2010 Blackwell Publishing Ltd
660 J . R . POWELL ET AL.
When we limited the analysis in the Ecuador survey
to only the Glomus A clade, as was done in the original
study (Haug et al. 2010), the GMYC model was not a
significantly better fit to the data than the null model of
a single coalescent population (single-threshold: LR ¼0.6, d.f. ¼ 3, P ¼ 0.90; multiple-threshold: LR ¼ 5.8,
d.f. ¼ 15, P ¼ 0.57), even though the maximum likeli-
hood model predicted the same number of groups
within this clade (four) as did the GMYC model fit to
the entire gene tree.
Comparison of GMYC and OTU richness
The species accumulation curve suggests that the sam-
pled GMYC group richness approached the asymptotic
level of richness in both surveys (Fig. S1, Supporting
information).
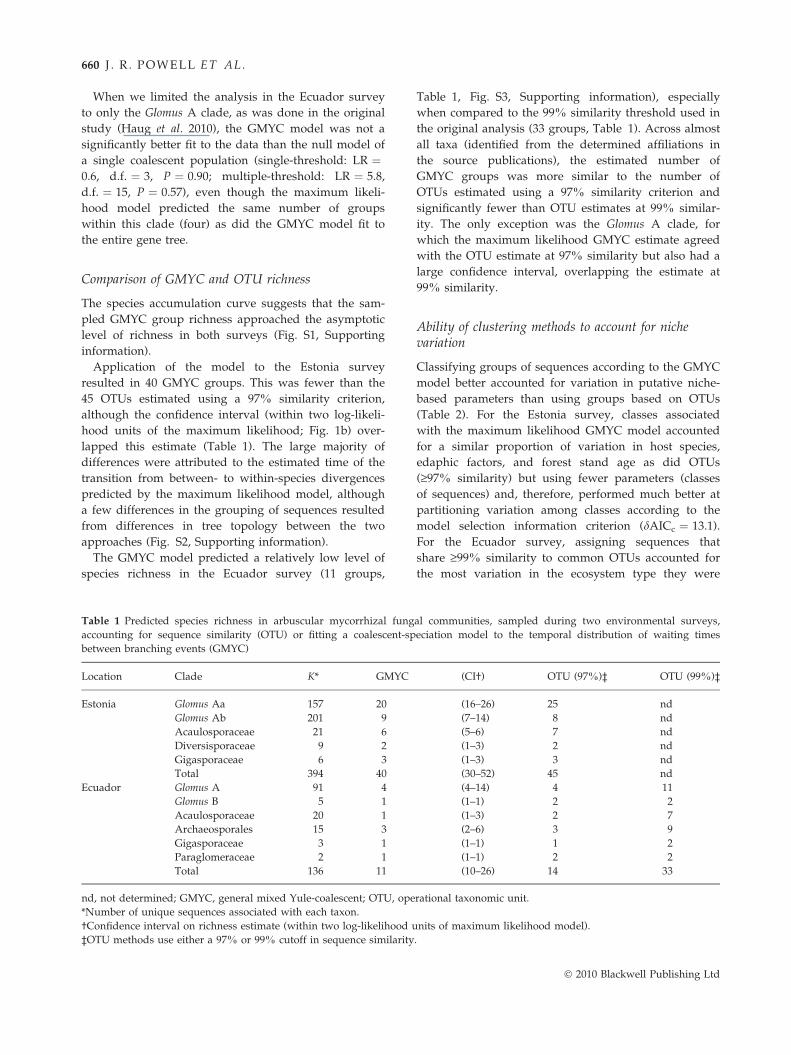
Application of the model to the Estonia survey
resulted in 40 GMYC groups. This was fewer than the
45 OTUs estimated using a 97% similarity criterion,
although the confidence interval (within two log-likeli-
hood units of the maximum likelihood; Fig. 1b) over-
lapped this estimate (Table 1). The large majority of
differences were attributed to the estimated time of the
transition from between- to within-species divergences
predicted by the maximum likelihood model, although
a few differences in the grouping of sequences resulted
from differences in tree topology between the two
approaches (Fig. S2, Supporting information).
The GMYC model predicted a relatively low level of
species richness in the Ecuador survey (11 groups,
Table 1 Predicted species richness in arbuscular mycorrhizal fung
accounting for sequence similarity (OTU) or fitting a coalescent-sp
between branching events (GMYC)
Location Clade K* GMYC
Estonia Glomus Aa 157 20
Glomus Ab 201 9
Acaulosporaceae 21 6
Diversisporaceae 9 2
Gigasporaceae 6 3
Total 394 40
Ecuador Glomus A 91 4
Glomus B 5 1
Acaulosporaceae 20 1
Archaeosporales 15 3
Gigasporaceae 3 1
Paraglomeraceae 2 1
Total 136 11
nd, not determined; GMYC, general mixed Yule-coalescent; OTU, ope
*Number of unique sequences associated with each taxon.
†Confidence interval on richness estimate (within two log-likelihood u
‡OTU methods use either a 97% or 99% cutoff in sequence similarity
Table 1, Fig. S3, Supporting information), especially
when compared to the 99% similarity threshold used in
the original analysis (33 groups, Table 1). Across almost
all taxa (identified from the determined affiliations in
the source publications), the estimated number of
GMYC groups was more similar to the number of
OTUs estimated using a 97% similarity criterion and
significantly fewer than OTU estimates at 99% similar-
ity. The only exception was the Glomus A clade, for
which the maximum likelihood GMYC estimate agreed
with the OTU estimate at 97% similarity but also had a
large confidence interval, overlapping the estimate at
99% similarity.
Ability of clustering methods to account for nichevariation
Classifying groups of sequences according to the GMYC
model better accounted for variation in putative niche-
based parameters than using groups based on OTUs
(Table 2). For the Estonia survey, classes associated
with the maximum likelihood GMYC model accounted
for a similar proportion of variation in host species,
edaphic factors, and forest stand age as did OTUs
(‡97% similarity) but using fewer parameters (classes
of sequences) and, therefore, performed much better at
partitioning variation among classes according to the
model selection information criterion (dAICc ¼ 13.1).
For the Ecuador survey, assigning sequences that
share ‡99% similarity to common OTUs accounted for
the most variation in the ecosystem type they were
al communities, sampled during two environmental surveys,
eciation model to the temporal distribution of waiting times
(CI†) OTU (97%)‡ OTU (99%)‡
(16–26) 25 nd
(7–14) 8 nd
(5–6) 7 nd
(1–3) 2 nd
(1–3) 3 nd
(30–52) 45 nd
(4–14) 4 11
(1–1) 2 2
(1–3) 2 7
(2–6) 3 9
(1–1) 1 2
(1–1) 2 2
(10–26) 14 33
rational taxonomic unit.
nits of maximum likelihood model).
.
� 2010 Blackwell Publishing Ltd

Table 2. Ability of species clustering approaches to account for variation in putative-niche variables in two environmental surveys
of arbuscular mycorrhizal fungi, expressed as a proportion of the total variation
Location Niche axes Model Number of entities Variance explained† AICc‡
Estonia Edaphic factors, host species, forest stand age GMYC 28 0.106** 3170.1
OTU (97%) 34 0.105** 3184.0
Ecuador Ecosystem type GMYC 11 0.141* 576.3
OTU (97%) 14 0.115ns 588.9
OTU (99%) 33 0.275ns 599.2
Significance of including classes as a predictor in the model (**P £ 0.01, *P £ 0.05, nsnot significant).
GMYC, general mixed Yule-coalescent; OTU, operational taxonomic unit.
†Calculated as the constrained inertia divided by the total inertia, a multivariate analog to the coefficient of determination (R2), with
no correction for the number of groups.
‡Akaike Information Criterion corrected for small sample size (McQuarrie & Tsai 1998); model with the lowest value (indicated in
bold) has the best fit to the data.
SPECIES DELINEATI ON IN FUNGAL INVENTORIES 661
sampled from, but at a high cost associated with the
large number of classes. Using classes associated with
the maximum likelihood GMYC model most efficiently
accounted for this variation (dAICc ¼ 12.6 against OTUs
at 97%; dAICc ¼ 22.9 against OTUs at 99%).
Discussion
These analyses for the first time highlight the potential
utility of the GMYC approach to provide ecologically,
in addition to evolutionarily, meaningful differentiation
between AM fungal sequence types in environmental
surveys. We demonstrated that classes identified using
the analysis of branching patterns isolated differences
in the ecological distributions of the groups better than
a priori thresholds of divergence traditionally used.
This was the case for estimates of the niche associated
with the symbiotic host, edaphic factors, and aspects of
how the ecosystems were managed.
Although the groups predicted by the GMYC model
provided the best fit to the environmental data associ-
ated with the samples, the variance explained by clus-
tering sequences into GMYC groups represented a
small proportion (<15%) of the total variance in both
surveys. While it is possible that the environmental fac-
tors that are ultimately responsible for defining niche
breadth in AM fungi were not measured in these stud-
ies, two additional hypotheses based on our knowledge
of AM fungal ecology may explain this observation.
First, at least some of the isolates we detected may
belong to generalist taxa with regard to their ecological
niches. For instance, individual GMYC groups con-
tained isolates that were associated with multiple plant
species; this was also the case for the other clustering
approaches (Opik et al. 2003,2008; Haug et al. 2010).
While the discussion of niche breadth in AM fungi usu-
ally focuses on the degree of functional host specificity
� 2010 Blackwell Publishing Ltd
in AM fungi (Hart et al. 2003; Opik et al. 2009), it has
also been addressed in relation to environmental vari-
ables driving AM fungal distributions and community
structure from local (Scheublin et al. 2004; Mummey
et al. 2005) to global (Rosendahl et al. 2009; Opik et al.
2010) scales. These studies have shown that at least
some AM fungal taxa have wide geographic distribu-
tions and exhibit broad environmental tolerances.
Second, studies of certain morphospecies have dem-
onstrated considerable intraspecific variation in toler-
ance to environmental factors and in symbiotic function
(as opposed to behaviours and tolerances that are
shared by many or all members of a generalist species).
Within three Glomus species, intraspecific variation in
AM fungal growth (extraradical hyphal production)
and symbiotic functioning (phosphorus uptake and host
plant growth parameters) was observed by Munkvold
et al. (2004). Functional variation in nutrient uptake and
response to heavy metal contamination was observed
among isolates of Glomus mosseae (Biro & Takacs 2007;
Biro et al. 2009). As these responses were evaluated in
‘common garden’ studies, differences among isolates
may have been attributable to the intrinsic fitness and
symbiotic capacity of each isolate and/or variable
responses to the environment in which they were
grown (in terms of the host plant or the abiotic condi-
tions). Both genetic and environmental contributions
were observed in a series of studies using isolates from
a single population of Glomus intraradices; investigators
observed variation among isolates in functional parame-
ters, including production of hyphae and spores, effects
on plant growth, responses to changing nutrient condi-
tions and host species, and observed frequency coloniz-
ing different host species in the field (Koch et al.
2004,2006; Croll et al. 2008; Ehinger et al. 2009). While
the isolates used in each of these studies are likely to
represent a biased sample (Sykorova et al. 2007), they

662 J . R . POWELL ET AL.
provide clear evidence for ecological differences within
certain lineages of AM fungi that contribute to niche
breadth observed at the species level.
There are some peculiar aspects of genetic systems in
the Glomeromycota that may contribute to this large
proportion of environmental variation that remains
unexplained, but that may also bias the GMYC method
(as well as similarity-based approaches using DNA for
species delineation). Most studies have found evidence
for clonal reproduction within populations of AM fungi
(e.g. Rosendahl & Taylor 1997), although recent studies
suggest that recombination may occur to a certain
extent (Croll et al. 2009; Croll & Sanders 2009). Transfer
of nuclei has been observed via hyphal anastomoses
between genetically distinct individuals of the same
species, but not different species and at reduced fre-
quencies relative to within-isolate transfers (Giovannetti
et al. 1999; Croll et al. 2009). This should facilitate the
formation of genetic clusters within species and, to a
certain extent, within populations. Irregardless, the
GMYC approach is not limited to sexually reproducing
clades; Fontaneto et al. (2007) used this approach to
identify genetic clusters within asexual rotifers. Another
matter to consider is that Jany & Pawlowska (2010)
observed nuclear dynamics in Glomus etunicatum in
which spores were populated by multiple nuclei
derived from the surrounding mycelium as opposed to
copies of a single founder nucleus. Markers may also
be polymorphic within individual nuclei (Pawlowska &
Taylor 2004). These processes contribute to polymorphic
rDNA within individual fungal isolates that could
result in an individual being classified into multiple
genetic clusters (Clapp et al. 1999, 2001) and overesti-
mation of species richness. How to deal with this intra-
individual polymorphism in taxonomic studies and
environmental surveys is an open question (Rodriguez
et al. 2004).
In any case, the relevant conclusion to draw from
these data is that the identity of groups to which the
isolated DNA belongs explained a statistically signifi-
cant proportion of the variation in their environmental
distributions (i.e. their niches) and that evolutionarily
informed clustering performed best among the
approaches tested here. We do not expect this to be the
case for all axes of the niche. For example, AM fungi
exhibit strong phylogenetic niche conservatism with
regard to colonization patterns within a host plant, with
less variation in colonization strategy among members
of the same family, and sometimes the same order
(Powell et al. 2009). Indeed, circularity will remain a
problem for any such comparison of methodological
‘accuracy’. More fine-scaled criteria can be employed in
systems where the specific drivers of species distribu-
tions and associations are better understood [e.g. host-
bacterial co-evolution in aphids (Jousselin et al. 2009)],
but the coalescent-speciation approach employed here
is more likely to be applied to broad-scale environmen-
tal studies and, in the absence of other data, provides a
more evolutionarily meaningful approach to clustering
sequences than similarity-based proxies.
Some preliminary information on the richness and
evenness of species within an ecosystem will be helpful
to design an appropriate sampling strategy. The GMYC
model requires a sample of sequences at both popula-
tion and phylogenetic levels of variation to detect speci-
ation-coalescent shifts in branching rates and, while the
necessary sample sizes for each level are difficult to
determine, our results provide some insight when
viewed in comparison with previous studies. As dis-
cussed elsewhere (Monaghan et al. 2009), 7–10 geno-
types appears to be an empirically and theoretically
appropriate sample size for capturing coalescent-level
variation, although the model performs consistently
well with smaller sample sizes (Pons et al. 2006; Ahrens
et al. 2007; Fontaneto et al. 2007; Barraclough et al.
2009; Jousselin et al. 2009; Leliaert et al. 2009; Mona-
ghan et al. 2009; Bode et al. 2010). At deeper nodes (i.e.
speciation branching), our results suggest that a mini-
mum number of coalescent groups may be needed in a
data set for the model to delineate groups that agree
with other criteria of independence. Limiting the analy-
sis of sequences from Ecuador to only the Glomus A
clade (the 1113-bp alignment), as was done in the origi-
nal study (Haug et al. 2010), the GMYC model pre-
dicted the same number of groups within this clade as
the larger analysis but was not a significantly better fit
to the data than the null model of a single coalescent
population, probably because of a lack of analytical
power. Limiting the sampling strategy to the Glomus A
clade was therefore not entirely suitable for GMYC
analysis, which could have important consequences for
study design and data interpretation. Further work,
including simulation studies, should lead to appropriate
sampling strategies.
This subsequent analysis did present an opportunity
to test whether the high similarity threshold used to
delimit OTUs in some studies was suitable for these
data. Adjusting the speciation-coalescent threshold (T)
to yield 43 GMYC groups (i.e. the number of Glomus A
OTUs using a ‡99% similarity threshold in this subse-
quent analysis; data not shown) decreased the model
likelihood by 2.2 log-likelihood units. This difference is
greater than the confidence interval and indicates a
poor fit to the observed branching pattern relative to
the best-fit model. Therefore, studies using such high
thresholds of sequence divergence to delineate OTUs
are likely overestimating AM fungal species richness.
On the other hand, our results suggest that a ‡97%
� 2010 Blackwell Publishing Ltd

SPECIES DELINEATI ON IN FUNGAL INVENTORIES 663
similarity threshold can provide a useful preliminary
assessment of AM fungal diversity based on 18S rRNA
gene sequences with which to plan further sampling
efforts using evolutionarily informed clustering.
We employed this evolutionarily informed approach
under circumstances where the species-level taxonomic
identities are largely unknown and the context of a
phylogenetic species is impractical; we envision this as
the primary use of this tool by microbial ecologists.
However, many environmental microbiologists are
interested in the detection of particular species from
environmental samples, such as agriculturally or medi-
cally important pathogens and related species that may
evolve to become important. Here, it is necessary to
establish a clear taxonomy in these environmental sam-
ples and approaches based on phenetics are not always
useful. Bacterial taxonomists rely primarily on DNA-
based approaches, such as DNA–DNA hybridization
and multilocus sequence analysis (Hanage et al. 2006),
to delineate species; this often involves but is not lim-
ited to phenetics-based approaches. Fungal taxonomists
rely to a greater extent on the identification of fixed dis-
tances in morphological, reproductive, and molecular
characters (e.g. Morton & Bentivenga 1994), and phenet-
ics-based approaches with fixed cutoffs are clearly not
suitable in this context (Seifert et al. 2007; Nilsson et al.
2008). The peculiarities of AM fungal genetics, as
described above, highlight the pitfalls of employing an
entirely DNA-based approach to resolving an AM fun-
gal taxonomy. However, there are many fungi that have
not been cultured from, or even observed in, their natu-
ral environment and DNA-based approaches are the
only methods available for classifying these individuals
into putative species (Hibbett et al. 2009). Therefore, it
is possible that the GMYC method, given its lack of reli-
ance on fixed and somewhat arbitrary cutoffs, may be
of value from a taxonomic perspective for those organ-
isms where the primary taxonomic method is based on
clustering of similar DNA sequences, especially when
the organisms themselves are not available for study.
Environmental scientists are frequently called upon to
evaluate the community-level responses of AM fungi
and other microorganisms to environmental change as
a proxy for ecosystem-level impacts. Advances in me-
tagenomics and bioinformatics ensure that DNA-based
approaches will continue to dominate surveys that eval-
uate environmental impacts on microbial communities.
The GMYC approach represents an objective method of
clustering sequences into evolutionarily independent
groups and estimating diversity in the presence of cryp-
tic species and intraspecific morphological variation.
Here, we have shown that this approach can also better
identify ecologically meaningful groups than using arbi-
trary levels of sequence similarity; this result in particu-
� 2010 Blackwell Publishing Ltd
lar lends support to its use within DNA-based
environmental surveys. To enhance its utility for
quantifying microbial diversity, especially using next-
generation sequencing, priority should be given to the
accurate estimation of branch lengths in large phylo-
genetic trees.
Acknowledgements
We thank Tancredi Caruso for statistical advice and Benjamin
Sikes, Stefan Hempel, Ingeborg Haug, Dirk Redecker, and
three anonymous reviewers for helpful comments on this
manuscript. This work was supported by funding from the
7th European Community Framework Programme (PIIF-GA-
2009-236798, PERG03-GA-2008-231034), the Alexander von
Humboldt Foundation, the Natural Sciences and Engineering
Research Council of Canada, the German Research Council
(DFG) through subproject Rillig of FOR 816, the Estonian Sci-
ence Foundation (grants 7738, SF0180098s08), and the Euro-
pean Regional Development Fund (Centre of Excellence
FIBIR).
References
Ahrens D, Monaghan MT, Vogler AP (2007) DNA-based
taxonomy for associating adults and larvae in multi-species
assemblages of chafers (Coleoptera: Scarabaeidae). Molecular
Phylogenetics and Evolution, 44, 436–449.
Barraclough TG, Hughes M, Ashford-Hodges N, Fujisawa T
(2009) Inferring evolutionarily significant units of bacterial
diversity from broad environmental surveys of single-locus
data. Biology Letters, 5, 425–428.
Biro I, Takacs T (2007) Effects of Glomus mosseae strains of
different origin on plant macro and micronutrient uptake in
Cd-polluted and unpolluted soils. Acta Agronomica
Hungarica, 55, 183–192.
Biro I, Nemetha T, Takacs T (2009) Changes of parameters of
infectivity and efficiency of different Glomus mosseae
arbuscular mycorrhizal fungi strains in cadmium-loaded soils.
Communications in Soil Science and Plant Analysis, 40, 227–239.
Bode S, Adolfsson S, Lamatsch D, et al. (2010) Exceptional
cryptic diversity and multiple origins of parthenogenesis in
a freshwater ostracod. Molecular Phylogenetics and Evolution,
54, 542–552.
Clapp JP, Fitter AH, Young JPW (1999) Ribosomal small
subunit sequence variation within 19 spores of an arbuscular
mycorrhizal fungus, Scutellospora sp. Molecular Ecology, 8,
915–921.
Clapp JP, Rodriguez A, Dodd JC (2001) Inter- and intra-isolate
rRNA large subunit variation in Glomus coronatum spores.
New Phytologist, 149, 539–554.
Croll D, Sanders, IR (2009) Recombination in Glomus
intraradices, a supposed ancient asexual arbuscular
mycorrhizal fungus. BMC Evolutionary Biology, 9, 13.
Croll D, Wille L, Gamper HA, et al. (2008). Genetic diversity
and host plant preferences revealed by simple sequence
repeat and mitochondrial markers in a population of the
arbuscular mycorrhizal fungus Glomus intraradices. New
Phytologist, 178, 672–687.

664 J . R . POWELL ET AL.
Croll D, Giovannetti M, Koch AM, et al. (2009) Nonself
vegetative fusion and genetic exchange in the arbuscular
mycorrhizal fungus Glomus intraradices. New Phytologist, 181,
924–937.
Dray S, Dufour AB (2007) The ade4 package: implementing the
duality diagram for ecologists. Journal of Statistical Software,
22, 1–22.
Drummond A, Rambaut A (2007) BEAST: Bayesian evolutionary
analysis by sampling trees. BMC Evolutionary Biology, 7, 214.
Edgar RC (2004) MUSCLE: multiple sequence alignment with
high accuracy and high through put. Nucleic Acids Research,
32, 1792–1797.
Ehinger M, Koch AM, Sanders IR (2009) Changes in arbuscular
mycorrhizal fungal phenotypes and genotypes in response to
plant species identity and phosphorus concentration. New
Phytologist, 184, 412–423.
Ezard T, Fujisawa T, Barraclough T (2009) splits: SPecies’ LImits
by Threshold Statistics. Rpackage version 1.0-11/r29.
Available from http://R-Forge.R-project.org/projects/splits/.
Fontaneto D, Herniou EA, Boschetti C, et al. (2007)
Independently evolving species in asexual bdelloid rotifers.
PLoS Biology, 5, e87.
Fraser C, Alm EJ, Polz MF, Spratt BG, Hanage WP (2009) The
bacterial species challenge: making sense of genetic and
ecological diversity. Science, 323, 741–746.
Gevers D, Cohan FM, Lawrence JG, et al. (2005) Opinion: re-
evaluating prokaryotic species. Nature Reviews Microbiology,
3, 733–739.
Giovannetti M, Azzolini D, Citernesi AS (1999) Anastomosis
formation and nuclear and proto plasmic exchange in
arbuscular mycorrhizal fungi. Applied and Environmental
Microbiology, 65, 5571–5575.
Hanage WP, Fraser C, Spratt BG (2006) Sequences, sequence
clusters and bacterial species. Philosophical Transactions of the
Royal Society B: Biological Sciences, 361, 1917–1927.
Hart MM, Reader RJ (2002) Taxonomic basis for variation in
the colonization strategy of arbuscular mycorrhizal fungi.
New Phytologist, 153, 335-344.
Hart M, Reader R, Klironomos J (2003) Plant coexistence
mediated by arbuscular mycorrhizal fungi. Trends in Ecology
& Evolution, 18, 418–423.
Haug I, Wubet T, Weiß M, et al. (2010) Species-rich but
distinct arbuscular mycorrhizal communities in reforestation
plots on degraded pastures and in neighboring pristine
tropical mountain rain forest. Tropical Ecology, 51, 125–148.
van der Heijden MGA, Klironomos JN, Ursic M, et al. (1998)
Mycorrhizal fungal diversity determines plant biodiversity,
ecosystem variability and productivity. Nature, 396, 69–72.
Helgason T, Daniell TJ, Husband R, Fitter AH, Young JPW
(1998) Ploughing up the wood-wide web? Nature, 394, 431.
Hibbett DS, Ohman A, Kirk PM (2009) Fungal ecology catches
fire. New Phytologist, 184, 279–282.
Hill MO, Smith AJE (1976) Principal component analysis of
taxonomic data with multi-state discrete characters. Taxon,
25, 249–255.
Jany J, Pawlowska TE (2010) Multinucleate spores contribute to
evolutionary longevity of asexual Glomeromycota. The
American Naturalist, 175, 424–435.
Johnson NC (2010) Resource stoichiometry elucidates the
structure and function of arbuscular mycorrhizas across
scales. New Phytologist, 185, 631–647.
Johnson NC, Tilman D, Wedin D (1992) Plant and soil controls
on mycorrhizal fungal communities. Ecology, 73, 2034–2042.
Johnson D, IJdo M, Genney DR, Anderson IC, Alexander IJ
(2005) How do plants regulate the function, community
structure, and diversity of mycorrhizal fungi? Journal of
Experimental Botany, 56, 1751–1760.
Jousselin E, Desdevises Y, Coeur d’acier A (2009) Fine-scale
cospeciation between Brachycaudus and Buchnera aphidicola:
bacterial genome helps define species and evolutionary
relationships in aphids. Proceedings of the Royal Society B:
Biological Sciences, 276, 187–196.
Kingman JFC (1982) On the genealogy of large populations.
Journal of Applied Probability, 19, 27–43.
Klironomos JN, McCune J, Hart M, Neville J (2000) The
influence of arbuscular mycorrhizae on the relationship
between plant diversity and productivity. Ecology Letters, 3,
137–141.
Koch AM, Kuhn G, Fontanillas P, Fumagalli L, Goudet J,
Sanders IR (2004) High genetic variability and low local
diversity in a population of arbuscular mycorrhizal fungi.
Proceedings of the National Academy of Sciences of the United
States of America, 101, 2369–2374.
Koch AM, Croll D, Sanders, IR (2006) Genetic variability in a
population of arbuscular mycorrhizal fungi causes variation
in plant growth. Ecology Letters, 9, 103–110.
Koeppel A, Perry EB, Sikorski J, et al. (2008) Identifying the
fundamental units of bacterial diversity: a paradigm shift to
incorporate ecology into bacterial systematics. Proceedings of
the National Academy of Sciences of the United States of America,
105, 2504–2509.
Kottke I, Haug I, Setaro S, et al. (2008) Guilds of mycorrhizal
fungi and their relation to trees, ericads, orchids and
liverworts in a neotropical mountain rain forest. Basic and
Applied Ecology, 9, 13–23.
Legendre P, Anderson MJ (1999) Distance-based redundancy
analysis: testing multispecies esponses in multifactorial
ecological experiments. Ecological Monographs, 69, 1–24.
Leliaert F, Verbruggen H, Wysor B, De Clerck O (2009) DNA
taxonomy in morphologically plastic taxa: algorithmic
species delimitation in the Boodlea complex (Chlorophyta:
Cladophorales). Molecular Phylogenetics and Evolution, 53,
122–133.
Liesack W, Stackebrandt E (1992) Unculturable microbes
detected by molecular sequences and probes. Biodiversity and
Conservation, 1, 250–262.
Maherali H, Klironomos JN (2007) Influence of phylogeny on
fungal community assembly and ecosystem functioning.
Science, 316, 1746–1748.
McQuarrie ADR, Tsai C (1998) Regression and Time Series Model
Selection. World Scientific, Singapore.
Monaghan MT, Wild R, Elliot M, et al. (2009) Accelerated
species inventory on madagascar using coalescent-based
models of species delineation. Systematic Biology, 58, 298–311.
Morton JB, Bentivenga SP (1994) Levels of diverstity in
endomycorrhizal fungi (Glomales, Zygomycetes) and their
role in defining taxonomic and non-taxonomic groups. Plant
and Soil, 159, 47–59.
Mummey DL, Rillig MC, Holben WE (2005) Neighboring plant
influences on arbuscular my corrhizal fungal community
composition as assessed by T-RFLP analysis. Plant and Soil,
271, 83–90.
� 2010 Blackwell Publishing Ltd

SPECIES DELINEATI ON IN FUNGAL INVENTORIES 665
Munkvold L, Kjøller R, Vestberg M, Rosendahl S, Jakobsen I
(2004) High functional diversity within species of arbuscular
mycorrhizal fungi. New Phytologist, 164, 357–364.
Nilsson RH, Kristiansson E, Ryberg M, Hallenberg N, Larsson
KH (2008) Intraspecific ITS variability in the Kingdom Fungi
as expressed in the international sequence databases and its
implications for molecular species identification. Evolutionary
Bioinformatics, 4, 193–201.
Oksanen J, Blanchet FG, Kindt R, et al. (2010) vegan:
Community Ecology Package. R package version 1.17-0.
Available from http://CRAN.R-project.org/package¼vegan.
Opik M, Moora M, Liira J, Koljalg U, Zobel M, Sen R (2003)
Divergent arbuscular mycorrhizal fungal communities
colonize roots of Pulsatilla spp. in boreal scots pine forest
and grassland soils. New Phytologist, 160, 581–593.
Opik M, Moora M, Liira J, Zobel M (2006) Composition of
root-colonizing arbuscular mycorrhizal fungal communities
in different ecosystems around the globe. Journal of Ecology,
94, 778–790.
Opik M, Moora M, Zobel M, et al. (2008) High diversity of
arbuscular mycorrhizal fungi in a boreal herb-rich coniferous
forest. New Phytologist, 179, 867–876.
Opik M, Metsis M, Daniell TJ, Zobel M, Moora M (2009)
Large-scale parallel 454 sequencing reveals host ecological
group specificity of arbuscular mycorrhizal fungi in a
boreonemoral forest. New Phytologist, 184, 424–437.
Opik M, Vanatoa A, Vanatoa E, et al. (2010) The online
database MaarjAM reveals global and ecosystemic
distribution patterns in arbuscular mycorrhizal fungi
(Glomeromycota). New Phytologist, 188, 223–241.
Papadopoulou A, Anastasiou I, Keskin B, Vogler AP (2009)
Comparative phylogeography of tenebrionid beetles in the
Aegean archipelago: the effect of dispersal ability and
habitat preference. Molecular Ecology, 18, 2503–2517.
Paradis E, Claude J, Strimmer K (2004) APE: analyses of
phylogenetics and evolution in R language. Bioinformatics, 20,
289–290.
Pawlowska TE, Taylor JW (2004) Organization of genetic
variation in individuals of arbuscular mycorrhizal fungi.
Nature, 427, 733–737.
Pons J, Barraclough TG, Gomez-Zurita J, et al. (2006) Sequence-
based species delimitation for the DNA taxonomy of
undescribed insects. Systematic Biology, 55, 595–609.
Posada D, Crandall K (1998) MODELTEST: testing the model
of DNA substitution. Bioinformatics, 14, 817–818.
Powell JR, Parrent JL, Hart MM, Klironomos JN, Rillig MC,
Maherali H (2009) Phylogenetic trait conservatism and the
evolution of functional trade-offs in arbuscular mycorrhizal
fungi. Proceedings of the Royal Society B: Biological Sciences,
276, 4237–4245.
R Development Core Team (2009) R: A Language and
Environment for Statistical Computing. R Foundation for
Statistical Computing, Vienna, Austria. Available from
http://www.R-project.org.
Rodriguez A, Clap, JP, Dodd JC (2004) Ribosomal RNA gene
sequence diversity in arbuscular mycorrhizal fungi
(Glomeromycota). Journal of Ecology, 92, 986–989.
Rosendahl S, Taylor JW (1997) Development of multiple
genetic markers for studies of genetic variation in
arbuscular mycorrhizal fungi using AFLP. Molecular
Ecology, 6, 821–829.
� 2010 Blackwell Publishing Ltd
Rosendahl S, McGee P, Morton JB (2009). Lack of global
population genetic differentiation in the arbuscular
mycorrhizal fungus Glomus mosseae suggests a recent range
expansion which may have coincided with the spread of
agriculture. Molecular Ecology, 18, 4316–4329.
Sykorova Z, Ineichen K, Wiemken A, Redecker D (2007) The
cultivation bias: different communities of arbuscular
mycorrhizal fungi detected in roots from the field, from bait
plants transplanted to the field, and from a greenhouse trap
experiment. Mycorrhiza, 18, 1–14.
Schenck NC, Smith GS (1982) Additional new and unreported
species of mycorrhizal fungi (Endogonaceae) from Florida.
Mycologia, 74, 77–92.
Scheublin TR, Ridgway KP, Young JPW, van der Heijden
MGA (2004) Nonlegumes, legumes, and root nodules harbor
different arbuscular mycorrhizal fungal communities. Applied
and Environmental Microbiology, 70, 6240–6246.
Schloss PD, Westcott SL, Ryabin T, et al. (2009) Introducing
mothur: open-source, platform independent, community-
supported software for describing and comparing microbial
communities. Applied and Environmental Microbiology, 75,
7537–7541.
Seifert KA, Samson RA, deWaard JR, et al. (2007) Prospects for
fungus identification using CO1 DNA barcodes, with
Penicillium as a test case. Proceedings of the National Academy
of Sciences of the United States of America, 104, 3901–3906.
Sikes BA, Cottenie K, Klironomos JN (2009) Plant and fungal
identity determines pathogen protection of plant roots by
arbuscular mycorrhizas. Journal of Ecology, 97, 1274–1280.
Smith SE, Read DJ (2008) Mycorrhizal Symbiosis, 3rd edn.
Academic Press, London.
Stackebrandt E, Goebel BM (1994) Taxonomic note: a place for
DNA–DNA reassociation and 16S rRNA sequence analysis
in the present species definition in bacteriology. International
Journal of Systematic and Evolutionary Bacteriology, 44, 846–
849.
Vogler AP, Monaghan MT (2007) Recent advances in DNA
taxonomy. Journal of Zoological Systematics and Evolutionary
Research, 45, 1–10.
Wehner J, Antunes PM, Powell JR, Mazukatow J, Rillig MC
(2010) Plant pathogen protection by arbuscular mycorrhizas:
a role for fungal diversity? Pedobiologia, 53, 197–201.
Yule GU (1925) A mathematical theory of evolution, based on
the conclusions of Dr. J. C. Willis, F.R.S. Philosophical
Transactions of the Royal Society of London. Series B, Containing
Papers of a Biological Character, 213, 21–87.
J.R.P. is interested in the development and use of tools for
describing the ecological structure of microbial communities
and in identifying the factors driving this structure. These
analyses were performed while he was a postdoctoral research
associate in the lab of M.C.R., who studies various aspects of
plant-fungal symbioses that are relevant for the functioning of
ecosystems. M.T.M. studies biodiversity using evolutionary
and phylogenetic methods, primarily in aquatic invertebrates
and microorganisms. M.O. studies the structure and dynamics
of arbuscular mycorrhizal fungi from local to global spatial
scales and curates a database of virtual AM fungal taxa (Maar-
jAM) for these purposes.

666 J . R . POWELL ET AL.
Supporting information
Additional supporting information may be found in the online
version of this article:
Fig. S1 Species accumulation curves indicating the relationship
between AM fungal species richness and sampling effort in the
two surveys.
Fig. S2 Relationship between AM fungal genetic clusters pre-
dicted by the GMYC model and OTUs predicted based on a
sequence similarity cutoff (97%) for AM fungal sequences
obtained from the Estonia survey.
Fig. S3 AM fungal genetic clusters from the Ecuador survey
predicted by the GMYC model.
Please note: Wiley-Blackwell are not responsible for the content
or functionality of any supporting information supplied by the
authors. Any queries (other than missing material) should be
directed to the corresponding author for the article.
� 2010 Blackwell Publishing Ltd
Related Documents