1 EVOLUTION OF THE SPOT TRADE SINCE FUKUSHIMA Simon Ellis LNG Analyst ICIS ABSTRACT The surge in demand in the wake of the 11 March 2011 Fukushima disaster has transformed the dynamics of the spot LNG trade. In East Asia, nuclear outages in Japan and increased urgency from regional competitors have prompted an unprecedented surge in short-term procurement. The change has been no less dramatic in Europe, with the region transformed from a sink for surplus volumes to an active re-export hub. The South American market has emerged as a possible counterpoint to East Asian in terms of spot demand. These shifts have in turn highlighted the need for transparent regional spot prices able to respond effectively to rapidly changing fundamentals. Challenges to a liquid global spot market remain. By the start of 2013, liquidity in east Asian markets has tightened significantly. The reallocation of volumes from the spot market into mid or long-term contracts has threatened to reduce flexibility. Coupled with the challenge to maintain production levels in the face of technical and geopolitical obstacles, this has prompted a sharp rise in prices. This paper will attempt to shed light on the trends driving price formation on the LNG spot market, with a focus on East Asian markets. The paper will summarise key LNG trade developments from 2008-2011 and conduct an in-depth analysis of pricing trends among the key markets in the two years to April 2013. It will attempt to quantify the breakdown between spot and mid-term contract sales into East Asia examine pricing differences between the two. It will conclude by evaluating the progress made in creating a liquid and transparent spot market since 2008, and examine the medium-term prospects for the market.

Welcome message from author
This document is posted to help you gain knowledge. Please leave a comment to let me know what you think about it! Share it to your friends and learn new things together.
Transcript

1
EVOLUTION OF THE SPOT TRADE SINCE FUKUSHIMA
Simon Ellis LNG Analyst
ICIS
ABSTRACT
The surge in demand in the wake of the 11 March 2011 Fukushima disaster has transformed the dynamics of the spot LNG trade.
In East Asia, nuclear outages in Japan and increased urgency from regional competitors have prompted an unprecedented surge in short-term procurement. The change has been no less dramatic in Europe, with the region transformed from a sink for surplus volumes to an active re-export hub. The South American market has emerged as a possible counterpoint to East Asian in terms of spot demand.
These shifts have in turn highlighted the need for transparent regional spot prices able to respond effectively to rapidly changing fundamentals.
Challenges to a liquid global spot market remain. By the start of 2013, liquidity in east Asian markets has tightened significantly. The reallocation of volumes from the spot market into mid or long-term contracts has threatened to reduce flexibility. Coupled with the challenge to maintain production levels in the face of technical and geopolitical obstacles, this has prompted a sharp rise in prices.
This paper will attempt to shed light on the trends driving price formation on the LNG spot market, with a focus on East Asian markets.
The paper will summarise key LNG trade developments from 2008-2011 and conduct an in-depth analysis of pricing trends among the key markets in the two years to April 2013. It will attempt to quantify the breakdown between spot and mid-term contract sales into East Asia examine pricing differences between the two.
It will conclude by evaluating the progress made in creating a liquid and transparent spot market since 2008, and examine the medium-term prospects for the market.
2
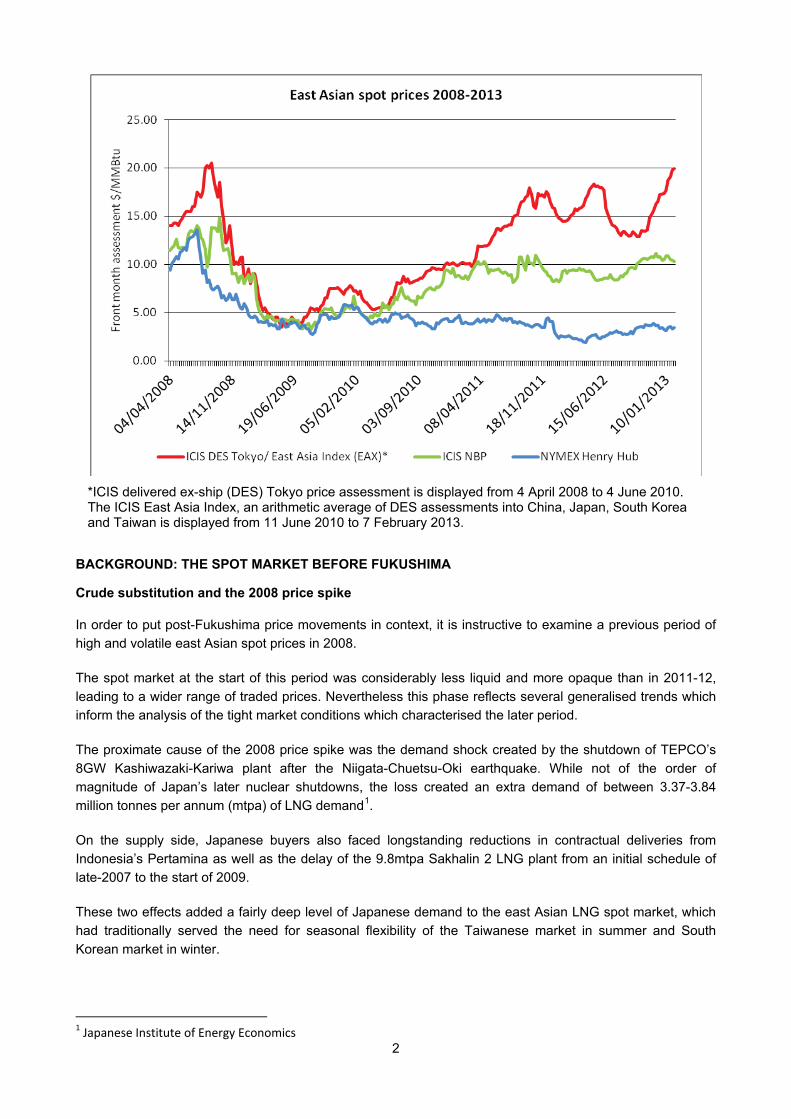
*ICIS delivered ex-ship (DES) Tokyo price assessment is displayed from 4 April 2008 to 4 June 2010. The ICIS East Asia Index, an arithmetic average of DES assessments into China, Japan, South Korea and Taiwan is displayed from 11 June 2010 to 7 February 2013.
BACKGROUND: THE SPOT MARKET BEFORE FUKUSHIMA
Crude substitution and the 2008 price spike
In order to put post-Fukushima price movements in context, it is instructive to examine a previous period of high and volatile east Asian spot prices in 2008.
The spot market at the start of this period was considerably less liquid and more opaque than in 2011-12, leading to a wider range of traded prices. Nevertheless this phase reflects several generalised trends which inform the analysis of the tight market conditions which characterised the later period.
The proximate cause of the 2008 price spike was the demand shock created by the shutdown of TEPCO’s 8GW Kashiwazaki-Kariwa plant after the Niigata-Chuetsu-Oki earthquake. While not of the order of magnitude of Japan’s later nuclear shutdowns, the loss created an extra demand of between 3.37-3.84 million tonnes per annum (mtpa) of LNG demand1.
On the supply side, Japanese buyers also faced longstanding reductions in contractual deliveries from Indonesia’s Pertamina as well as the delay of the 9.8mtpa Sakhalin 2 LNG plant from an initial schedule of late-2007 to the start of 2009.
These two effects added a fairly deep level of Japanese demand to the east Asian LNG spot market, which had traditionally served the need for seasonal flexibility of the Taiwanese market in summer and South Korean market in winter.
1 Japanese Institute of Energy Economics

3
The subsequent surge in prices over summer 2008 reflects several elements that would recur in future spot market price spikes. On the supply side these consisted of production issues at LNG plants, the high price of substitute fuels and competition from other regions. On the demand side, unseasonably high temperatures were the predominant driver.
A weak production performance in 2008, which saw LNG production grow by only 0.8% year-on-year, contributed to high and volatile prices2. In addition to the start-up delays, reduced feedgas at Nigeria LNG’s newly-commissioned train 6, a prolonged summer outage at Norway’s Snøhvit plant and a force majeure at Sonatrach’s Arzew plant in June, restricted supply.
The shift in focus from Europe to Asia increased the influence of crude prices over the LNG spot market. Early in 2008, Asian buyers had paid a premium over the higher of NBP or Henry Hub to divert cargoes away from the Atlantic Basin. The rise in crude prices through early 2008 prompted east Asian buyers to turn to spot LNG as an alternative to crude and oil products. This established a firm link with the rapidly rising cost of these substitutes and ensured spot LNG prices continued to rise after the fall in NBP and Henry Hub prices in July.
Competition from other regions was fierce through the summer of 2008, as buyers in the Indian market grappled with the rising price of naphtha as a substitute fuel. In early July, the shutdown of an offshore gas field drove Indian spot prices from a discount to the East Asian assessment to a premium of up to $1.00/MMBtu. Buyers in the Spanish market also continued to pay significant premiums to NBP to secure backfill volumes for Middle East contractual volumes diverted to Asia.
2 The LNG Industry in 2008 - GIIGNL
4
Japan experienced unseasonably high temperatures in July 2008, obliging Japan’s electricity utilities to respond aggressively to the price challenge from India. The failure of one utility to secure a key multi-cargo tender from the Middle East contributed to an environment in which Japanese buyers paid in excess of $20.00/MMBtu for late summer cargoes.
By early September, falling crude prices and an improved LNG production picture rapidly stemmed east spot LNG Asian demand. The crude oil price volatility through the financial market turmoil of September and October 2012 discouraged traders from linking deals to crude. Those east Asian buyers with any outstanding winter demand shifted their bids to around $2.00-3.00/MMBtu premium to NBP. By the end of 2008, even these premiums to NBP were eroded as residual demand for Atlantic Basin cargoes receded.
BACKGROUND 2009-2010: NBP UNDERPINS GLOBAL BUYERS’ MARKET
The precipitous collapse in East Asian demand that started in the second quarter of 2008 continued well into 2009.The start-up of production capacity dedicated to Asian markets, including Sakhalin 2 in March, suppressed any incremental demand that remained in the immediate aftermath of the global financial crisis.
Instead European and, initially, US buyers emerged as the buyers of last resort, absorbing the growing surplus of flexible volumes at discounts to the NBP and Henry Hub respectively.
By late May 2009, Asian demand reached its nadir when a cargo from Australia’s Northwest Shelf project was delivered to France’s Montoir terminal.
East Asian spot demand eventually re-emerged towards the end of summer 2009. The rebound in oil prices pressured East Asian buyers either to switch from oil-based fuels to spot LNG or to exercise downward quantity tolerance on JCC-indexed LNG contracts and backfill with cheaper spot cargoes.
Nuclear plant outages sporadically brought Japanese buyers back into the market, although they no longer enjoyed a dominant position in the Pacific Basin and increasingly had to compete with opportunistic demand from China, Taiwan and South Korea as well as India and Kuwait.
In order to compete cargoes away from the Atlantic Basin, Asian utility buyers structured bids at premiums of up to $3.00/MMBtu over the higher of NBP or Henry Hub, depending on demand.

5
Robust winter demand from South Korea and China’s newly-built Shanghai terminal ensured east Asian prices remained competitive over winter '09/’10 despite rebounding US and UK hub benchmarks.
As the role of the Henry Hub waned into 2010, NBP exercised a dominant influence over Asian spot pricing. When North Sea production problems and buoyant pipeline exports to the Continent pushed up NBP prices in June and July 2010, Asian prices maintained their strong correlation to the UK benchmark.
Over winter ‘10/’11, East Asian buyers continued to use NBP as a reference for bid levels, widening their premium over the UK hub in order to secure large-scale winter string deals. Even after 11 March 2011, some Asian utilities initially expressed a preference to procure on an NBP-indexed basis to avoid the perceived volatility of crude-indexed pricing.
POST-FUKUSHIMA DEMAND ANALYSIS: 2011-2013
Midstream costs and nuclear shutdowns drive initial response
East Asian spot market demand from March 2011 onwards was naturally dominated by Japan’s electricity utilities. These buyers had been finalising procurement plans for the 2011 business year when the 11 March Tohoku offshore earthquake hit, although this measured approach was soon rendered redundant amid uncertainty about the scale of additional LNG demand.
In the immediate aftermath of the natural disaster, contractual sellers and portfolio suppliers competed to commit volumes into the market on a mid-term basis at a discount to long-term supply. Most significantly, Qatargas committed an initial four million tonnes of additional LNG.
With supplies from within the Asia-Pacific region and the Middle East reallocated soon after the earthquake, the cost of sourcing cargoes from the Atlantic Basin became a decisive factor in setting regional prices.

6
Spot prices had initially taken direction from the $11.50/MMBtu to $12.00/MMBtu price of spot cargoes supplied by Qatargas in April. However, the requirement to carry out round trips of up to 60 days from Atlantic LNG plants to east Asia placed severe strains on the availability of a fleet ordered largely for intra-basin trade. charter rates rose in close correlation with prices, reaching $100,000/day by the start of July.
By early summer, the outlook for Japanese buyers deteriorated further. In June, Woodside announced a further six-month delay to delivery of its Pluto LNG plant. More significantly in July, the Kan administration announced its decision to gradually idle the entire nuclear fleet for stress tests, forcing utilities to substantially revise upwards their demand projections.
Despite these supply and demand side pressures, spot prices effectively peaked by October ahead of the region’s winter demand season. The weakening of prices was a function of the strength of the response from suppliers on both a spot and mid-term basis.
Japan’s importers were obliged to make up an estimated deficit of 14 million tonnes between demand and effective long-term contracted supply in calendar year 2011. In East Asia as a whole in 2011, demand outstripped the annual contractual quantities of long-terms by more than 30 million tonnes.
Between 12-13 million tonnes of these sales are estimated to have been conducted on a spot basis, defined here as a transaction under which all deliveries are completed within six months of the transaction date. In other words, trade at prices which broadly reflect the current supply and demand fundamentals of the market.
A further 14 million tonnes were sold under the basis of short or mid-term deals. These are defined of arrangements of up to five years, negotiated at a separate price to long-term contracts.

7
The balance of extra deliveries are estimated to have been met by the flexibility under flexible arrangements under long-term contracts, as well as by incremental sales by long-term suppliers under which a deviation from the long-term price could not be determined.
Not all of the sales outside long-term contracts were committed after the 11 March earthquake. Mid-term sales arranged into South Korea prior to 2011 played an important role in dampening spot market competition within the region.
Nevertheless, the sheer scale of short-term sales into East Asian markets reflected the unprecedented liquidity of global spot markets. Around 12.5 million tonnes in 2011 was sourced from the Atlantic Basin. Qatar’s LNG export consortia supplied 6.5 million tonnes of LNG to East Asian buyers above nameplate contract levels in 2011.
Spot sales continued to rise into the first half of 2012, although an increasing quantitieswere now reallocated under short-term (up to two years) and mid-term (two to five years) contracts.
The dominant pricing basis for short and mid-term contracts through 2011 and 2012 remained JCC and Brent-indexation at levels of 13% to 14%, or at higher slopes with a fixed negative constant. This allowed East Asian buyers to purchase mid-term supply at discounts to long-term contracts and bridge demand until the start-up of new Pacific liquefaction capacity from 2015.
Buyers seeking to reduce their exposure to volatile crude prices are understood to have been offered an alternative structure with a much higher fixed constant and lower slope of 8-9% of JCC.

8
Pricing analysis: a return to seasonality?
Over the course of 2011, bullish and volatile charter rates undermined NBP-premium pricing in Asia. As midstream costs fluctuated, attempts to establish a fixed premium to the UK benchmark became increasingly challenging.
Instead, the structure of East Asian pricing in 2012 and early 2013 superficially reflected the seasonal demand structure of the region. Thus, the strong summer peak in prices was prompted in part by demand to meet the air-conditioning load in Japan, southern China and Taiwan.
However, spot demand for South Korea and Japan’s peak winter period was initially sluggish until the second half of November, when lower forecast temperatures and a gas shortage in northern China rekindled demand. In 2013, robust demand for the traditional April shoulder month suggests the seasonality of East Asian demand is not the dominant force in determining prices.
9
High midstream costs also partly explain the rapid swings between the pronounced peaks and troughs experienced over the course of 2012. In the first two months of the year as well from July to October, Asian spot demand was largely met by Pacific Basin and Middle East supply. In March 2012 and again in late November 2012, the location of the marginal cargo swung to the Atlantic Basin, imposing shipping costs upwards of $5.00/MMBtu per cargo.
Substitute fuels have also played a role in determining LNG prices. The ability of Japanese electricity utilities, as well as other buyers in the region, to switch from LNG to crude and oil products appears to have established crude oil as a price ceiling on the LNG spot market. In both October 2011 and June 2012, falling crude prices helped to puncture spot market peaks.
An additional influence of crude prices over the spot price stems from the ability of buyers to nominate up deliveries under long-term contracts which are generally indexed on a lagged basis at a discount to Japanese customs-cleared (JCC) crude.
Overall, persistently high crude oil prices through the second half of 2012 gave buyers little alternative to securing spot LNG, leading to sharp price rises when demand emerged. In January 2013, the role of oil prices as a spot market ceiling has been challenged by a steep rise in spot LNG prices to parity with crude oil on a calorific value basis.
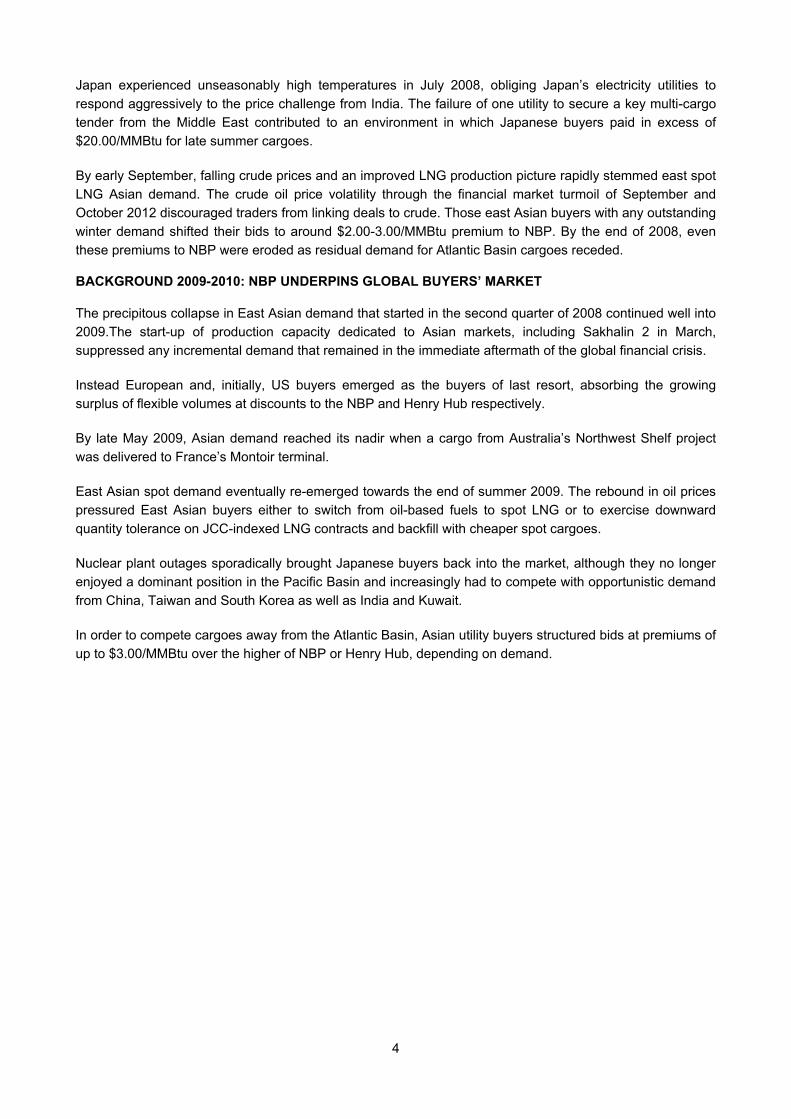
In order to provide transparency to this dynamic market, price reporting agencies have quoted a range of different price assessments for East Asian markets since March 2008. In turn, these assessments have been aided by the unprecedented liquidity observed in East Asian markets through 2011 and 2012.
*Spot trades shown reflect author’s estimate of all trades delivered within six months of the transaction date. These trades do not necessarily conform to the assessment windows of the ICIS East Asia Index and are marked as prompt when sold after the front-month window has closed.

10
As a consequence of the improved market information, spot LNG has, for the most part, traded in a much tighter range in 2011-12 than it did in 2008.
Despite the increasing use of Asian spot price assessments for individual deals, their uptake as the pricing basis for multi-cargo contracts is understood to have been limited. Many of the larger producers continue maintain a willingness to conduct deals on an oil-indexed basis, as well at premiums to the “liquid” hub prices of the NBP on Henry Hub, but have eschewed spot Asian LNG hubs.
In order to assuage concerns about the liquidity and risk management of spot assessments, a series of swaps have been launched based on Asian spot assessments. The first financially settled over-the-counter swap based on Asian LNG index was settled in January 2011. The first cleared LNG swap based on an East Asian spot index traded on 16 July, 2012.
PRODUCTION PROBLEMS ADD TO PRICE PRESSURE
Just as in 2008, a relatively weak LNG production performance contributed to periods of high and volatile prices through 2011 to 2013.
In 2011, global LNG imports rose 9.4% to 240.8 million tonnes3, reflecting the ramping up of Qatari mega trains to nameplate capacity. In the first half of 2012, around 120.5 million tonnes of LNG was imported4. Given a higher proportion imports were themselves re-exported than in 2011, production appears to have been, at best, static in H1 2012.
Many plants continued to be affected by geopolitical factors outside the control of their operators. The Yemen LNG plant was affected by eight separate sabotage attacks on its gas supply pipelines over the course of the year. Egypt’s Damietta plant produced well below nameplate capacity as feedgas was redirected to the domestic market and was eventually taken offline from December 2012.
3 The LNG Industry in 2011 - GIIGNL 4 Official customs figures, ICIS estimates

11
The graph above shows reported plant outages in 2012. Outages marked as “partial” reflect unplanned production problems which caused a reduction in production from the prevailing level, rather than a full shutdown.
It is not always possible to distinguish an immediate response in spot market prices to an unplanned outage, although the effects are understandably clearer in periods of tight availability.
A cluster of production problems were cited by traders as applying upward pressure on prices from March 2012 to May 2012. The cancellation of a three-cargo tender at Nigeria LNG in early May, on the back of a single train outage, prompted an immediate $0.30/MMBtu rise in prices.
Even when the response is not explicit, unplanned outages have a cumulative effect on availability as flexible volumes are rescheduled to make up contractual demand.
GLOBAL COMPETITION — SOUTH AMERICA UNDAUNTED BY PRICES
As was the case in previous years, stern competition from outside the region has contributed to east Asian market price spikes in 2012 and early 2013. On this occasion, the focus of the recent competition has been a broad-based demand spike in South America.
In April 2012, the Argentine government’s decision to privatise Repsol’s stake in oil company YPF saw the Spanish oil company cancel delivery obligations in the South American country. Argentine buyer ENARSA bid aggressively to secure replacement volumes, adding to the market tightness through spring 2011.
From October 2012, a serious drought in Brazil obliged state oil company Petrobras to compete for marginal Atlantic Basin cargoes on a spot basis. Strong fourth quarter procurement saw the company quadruple the level of its 2012 LNG imports year-on-year to 2.2 million tonnes, all secured outside of long-term contracts.
The continuation of Brazil’s aggressive spot buying into early 2013 has brought it into competition with Argentina, which released a series of tenders for 2013 deliveries in December and January. The ability of both buyers to compete for Atlantic Basin cargoes has challenged East Asia’s position as the spot market’s sole centre of gravity, if only on a temporary basis.

12
*The ICIS South America Index is an arithmetic average of assessments into Argentina, Brazil and Chile
Outside the east Asian and South American markets, the desire to compete for 2013 volumes at the prices has been limited. In January 2013, a Mediterranean buyer is also understood to have procured at least one cargo at close to $17.00/MMBtu, representing a netback to East Asian spot market prices. This trend would appear unlikely to be sustainable except in cases of distressed demand in markets with gas-on-gas competition.
OUTLOOK: BRIDGING THE SUPPLY GAP
Looking ahead into 2013-14, the outlook for the spot trade is challenging.
An obvious constraint to liquidity is the sheer amount of previously flexible LNG that has now been reallocated under mid and long-term contracts. It is estimated that diversions of more than 17 million tonnes (at nameplate quantities) of flexible LNG have been finalised with a start-date of either 2012 or 2013.

13
While many diversions to East Asia merely formalise existing post-Fukushima arrangements and some renew existing contracts, this will still remove flexibility from the market into 2013.
Despite the limited clarity over nuclear restarts, Japanese utility buyers have purchased nearly one-third of these volumes. Some buyers have sought to mitigate this uncertainty by incorporating flexibility into their contracts. Japanese electricity utility Chubu Electric recently announced the signing of a tripartite deal with Eni alongside South Korea’s KOGAS, that would allow either buyer to take delivery of volumes.
The most significant demand-side factor in 2013 will be the outcome of the nuclear safety review by Japan’s Nuclear Regulation Agency (NRA), and any subsequent Japanese government decision on restarts.
The macroeconomic pressure to restore some nuclear generation will be significant. Japan imported more than 20 million tonnes of LNG outside long-term contracts from July 2011 to June 2012 at an estimated cost of $17-18bn. These costs contributed significantly to the country’s trade deficit, which ran at $57.36bn over the equivalent 12-month period.
As the new Japanese government pursues a policy of supporting exports through monetary easing, the burden of maintaining high levels of LNG and crude imports will become even more severe in yen terms.5
On the supply side, the 5.2mtpa Angola LNG project is expected to be the only new-build LNG which will substantially affect the global LNG balance in 2013. Given the difficulties experienced in 2012, the production performance of existing plants will be at least of equal importance in determining spot liquidity.
East Asian and South American buyers together already accounted for nearly three-quarters of the 31.6 million tonnes global LNG delivered on a spot, short or mid -term basis in H1 2012. It is unclear how much potential for further diversions from this portion of the market remains.
One potential source is European terminals, which reloaded 2.63m tonnes of LNG in 2012 with just under 60% delivered to East Asia or South America. The outlook for this will depend on contractual suppliers maintaining sufficient deliveries to permit reloading.
5 ICIS analysis: Japan’s nuclear-free roadmap fails to resolve short-term uncertainty, October 2012

14
SUMMARY — THE VALUE OF FLEXIBILITY
Superficially, the global LNG trade at the start of 2013 resembles that of 2008. Prices in East Asian and competing markets have surged as the market struggles to meet demand while production issues restrict supply.
The comparison belies a number of changes in the global LNG market, which has developed in terms of liquidity and transparency since 2007-8.
The number of participants which have actively traded LNG over the past three years has reached triple figures – a far cry from the small pool of participants at the start of 2008. The demand-side infrastructure is in place to expand this group further.
In addition, transparent market-based pricing has gained traction, improving the market efficiency and narrowing disparities between the prices paid by participants.
The most significant difference is that the LNG market of 2011 was able to respond to fundamental rebalancing of the global spot demand in a way which would have overwhelmed the LNG spot trade five years earlier.
This, in turn, highlights the importance of flexible surplus capacity. Traditional long-term contractual structures, with limited flexibility, continue to underpin the funding of new LNG plants. However, these contracts proved too rigid to respond to substantial demand shocks such as that experienced by Japan in 2011.
The producers which were able to respond to the Japanese demand surge were those which had invested in liquefaction to supply a supposedly burgeoning US market. This raises the question of who will fund this surplus capacity in the absence of attractive gas-hub indexed target markets.
A potential solution is the development of US liquefaction. The relatively low costs of building on brownfield LNG sites has already proved highly attractive to LNG trading firms willing to take a risk on arbitrage price differentials. The reintroduction of a strong Henry Hub influence into the LNG market would important a crucial counterweight to crude oil prices
A further cautionary lesson from the LNG trade from 2008-2013 is assuming the continuation of current trends in intrinsically cyclical markets. The balance of the LNG market swung full circle from one of European reloads to Asia and back, via a period when Asian demand collapsed to the extent that Pacific Basin cargoes had to be exported to Europe.
The growth of East Asian LNG demand over the coming decade is a given. But more than 70mtpa has been already committed from new-build plants to East Asian buyers from 2014 to 2017, with the deal flow expected to continue.
What remains unclear is which East Asian market, if any, would emerge as the region’s buyer of last resort after the new contractual equilibrium is established.
Singapore has staked a claim to this role by offering re-exports from its new Jurong LNG terminal. However, the terminal will need to substantially expand LNG storage capacity in order to meet both domestic demand and serve as an effective storage and reload hub for Asia. An alternative proposal exists for a Shanghai-based hub, although doubts persist about the responsiveness of a price set by a government-mandated formula.
Until this question is resolved, it is far from certain a unipolar spot market, dominated solely by East Asian demand, will be the model that persists until the end of the decade.
Related Documents