Evolution of storage management: Transforming raw data into information S. Gopisetty S. Agarwala E. Butler D. Jadav S. Jaquet M. Korupolu R. Routray P. Sarkar A. Singh M. Sivan-Zimet C.-H. Tan S. Uttamchandani D. Merbach S. Padbidri A. Dieberger E. M. Haber E. Kandogan C. A. Kieliszewski D. Agrawal M. Devarakonda K.-W. Lee K. Magoutis D. C. Verma N. G. Vogl Exponential growth in storage requirements and an increasing number of heterogeneous devices and application policies are making enterprise storage management a nightmare for administrators. Back-of-the-envelope calculations, rules of thumb, and manual correlation of individual device data are too error prone for the day-to-day administrative tasks of resource provisioning, problem determination, performance management, and impact analysis. Storage management tools have evolved over the past several years from standardizing the data reported by storage subsystems to providing intelligent planners. In this paper, we describe that evolution in the context of the IBM TotalStoraget Productivity Center (TPC)—a suite of tools to assist administrators in the day-to-day tasks of monitoring, configuring, provisioning, managing change, analyzing configuration, managing performance, and determining problems. We describe our ongoing research to develop ways to simplify and automate these tasks by applying advanced analytics on the performance statistics and raw configuration and event data collected by TPC using the popular Storage Management Initiative-Specification (SMI-S). In addition, we provide details of SMART (storage management analytics and reasoning technology) as a library that provides a collection of data-aggregation functions and optimization algorithms. Introduction Managing storage systems within an enterprise has always been a complex task requiring skilled administrators to ensure zero downtime and high performance for business-critical applications. Over the years, the management of storage area networks (SANs) has become increasingly complex with petabyte-scale enterprises, complex application requirements, and heterogeneous hardware and protocols. Increased sensitivity to the operational costs of information technology is driving the efforts to optimally use resources; just-in-time provisioning is replacing just-in- case over-provisioning. To cope with the complexity, administrators create diagrams of SAN device connectivity, which provide only an out-of-date point in time end-to-end view; they manage individual devices— hosts, fabric switches, and storage controllers—that use proprietary interfaces provided by individual vendors. Each interface is different and reports data in nonstandard formats. The administrators have developed simple programs and collections of scripts to manage these devices. In order to deal with the complexity and because of the steep learning curve, administrators have begun to specialize in specific areas based on function or category. As a result of these conditions, administrators of enterprise SANs no longer manage their SAN as a whole; instead, they manage individual devices and use manual correlation, specialization, and various forms of bookkeeping to keep track of the parts. In response, storage management tools have evolved to assist administrators in managing increasingly complex SANs. Several storage vendors, including IBM, have recognized and responded to the need to simplify the discovery, monitoring, and reporting of storage subsystems and storage networks. Although devices such as storage controllers and switches from various vendors differ slightly in functionality, each device requires a specific application programming interface (API) to ÓCopyright 2008 by International Business Machines Corporation. Copying in printed form for private use is permitted without payment of royalty provided that (1) each reproduction is done without alteration and (2) the Journal reference and IBM copyright notice are included on the first page. The title and abstract, but no other portions, of this paper may be copied by any means or distributed royalty free without further permission by computer-based and other information-service systems. Permission to republish any other portion of this paper must be obtained from the Editor. IBM J. RES. & DEV. VOL. 52 NO. 4/5 JULY/SEPTEMBER 2008 S. GOPISETTY ET AL. 341 0018-8646/08/$5.00 ª 2008 IBM

Welcome message from author
This document is posted to help you gain knowledge. Please leave a comment to let me know what you think about it! Share it to your friends and learn new things together.
Transcript
Evolution of storagemanagement: Transformingraw data into information
S. GopisettyS. Agarwala
E. ButlerD. Jadav
S. JaquetM. Korupolu
R. RoutrayP. SarkarA. Singh
M. Sivan-ZimetC.-H. Tan
S. UttamchandaniD. MerbachS. Padbidri
A. DiebergerE. M. Haber
E. KandoganC. A. Kieliszewski
D. AgrawalM. Devarakonda
K.-W. LeeK. MagoutisD. C. Verma
N. G. Vogl
Exponential growth in storage requirements and an increasingnumber of heterogeneous devices and application policies aremaking enterprise storage management a nightmare foradministrators. Back-of-the-envelope calculations, rules of thumb,and manual correlation of individual device data are too errorprone for the day-to-day administrative tasks of resourceprovisioning, problem determination, performance management,and impact analysis. Storage management tools have evolved overthe past several years from standardizing the data reported bystorage subsystems to providing intelligent planners. In this paper,we describe that evolution in the context of the IBM TotalStoragetProductivity Center (TPC)—a suite of tools to assistadministrators in the day-to-day tasks of monitoring, configuring,provisioning, managing change, analyzing configuration, managingperformance, and determining problems. We describe our ongoingresearch to develop ways to simplify and automate these tasks byapplying advanced analytics on the performance statistics and rawconfiguration and event data collected by TPC using the popularStorage Management Initiative-Specification (SMI-S). Inaddition, we provide details of SMART (storage managementanalytics and reasoning technology) as a library that provides acollection of data-aggregation functions and optimizationalgorithms.
IntroductionManaging storage systems within an enterprise has
always been a complex task requiring skilled
administrators to ensure zero downtime and high
performance for business-critical applications. Over the
years, the management of storage area networks (SANs)
has become increasingly complex with petabyte-scale
enterprises, complex application requirements, and
heterogeneous hardware and protocols. Increased
sensitivity to the operational costs of information
technology is driving the efforts to optimally use
resources; just-in-time provisioning is replacing just-in-
case over-provisioning. To cope with the complexity,
administrators create diagrams of SAN device
connectivity, which provide only an out-of-date point in
time end-to-end view; they manage individual devices—
hosts, fabric switches, and storage controllers—that use
proprietary interfaces provided by individual vendors.
Each interface is different and reports data in
nonstandard formats. The administrators have developed
simple programs and collections of scripts to manage
these devices. In order to deal with the complexity and
because of the steep learning curve, administrators have
begun to specialize in specific areas based on function or
category. As a result of these conditions, administrators
of enterprise SANs no longer manage their SAN as a
whole; instead, they manage individual devices and use
manual correlation, specialization, and various forms of
bookkeeping to keep track of the parts.
In response, storage management tools have evolved to
assist administrators in managing increasingly complex
SANs. Several storage vendors, including IBM, have
recognized and responded to the need to simplify the
discovery, monitoring, and reporting of storage
subsystems and storage networks. Although devices such
as storage controllers and switches from various vendors
differ slightly in functionality, each device requires a
specific application programming interface (API) to
�Copyright 2008 by International Business Machines Corporation. Copying in printed form for private use is permitted without payment of royalty provided that (1) eachreproduction is done without alteration and (2) the Journal reference and IBM copyright notice are included on the first page. The title and abstract, but no other portions, of thispaper may be copied by any means or distributed royalty free without further permission by computer-based and other information-service systems. Permission to republish any other
portion of this paper must be obtained from the Editor.
IBM J. RES. & DEV. VOL. 52 NO. 4/5 JULY/SEPTEMBER 2008 S. GOPISETTY ET AL.
341
0018-8646/08/$5.00 ª 2008 IBM

retrieve configuration and performance information.
Thus, gathering performance data is done either by
means of vendor-provided APIs or via standard
interfaces, such as CIM (Common Information Model)
[1], SNMP (Simple Network Management Protocol) [2],
or SMI-S (Storage Management Initiative-Specification)
[3]. When communicating with devices using these
standard interfaces, connection is made either directly to
the device or indirectly through a secondary facilitator,
called a device agent, for example, a proxy CIM object
manager [4]. In addition to performance data and device
configuration, component failure and other events are
usually collected from devices using these same interfaces.
Collecting events and recording data from multiple
vendor devices was the starting point for tools such as the
IBM TotalStorage* Productivity Center (TPC) [5], the
EMC ControlCenter** [6], and the HP Systems Insight
Manager** [7]. These tools are generically referred to as
storage resource managers (SRMs). After retrieving data
from the device or device agents and computing deltas for
the device performance counters, SRMs place persistent
data in a database. From a single console, SRM
applications provide administrators with the ability to
monitor multiple devices, analyze device performance
thresholds, and track usage.
This is a significant step forward but falls short of what
administrators really need. For example, they need the
ability to configure devices and provision storage using a
common interface across multiple devices from different
manufacturers. SRM applications, however, use
proprietary API and CIM interfaces to perform
configuration changes and to provision tasks on the SAN
switches and storage subsystems. As a result, although
SRM device management interfaces are now used to
verify settings, rarely can an administrator use them to
perform device-specific changes. Thus, while these
generalized interfaces are powerful, they provide only the
capability to perform the most common tasks.
Aggregating end-to-end system data enables an
administrator to drastically improve the understanding of
how various devices within the data center are allocated
and to assess their current and historical utilization
values, but administrators still need additional help with
the decision-making required to perform administrative
tasks, especially in large environments. Consider a typical
data center scenario of a large SAN that consists of more
than 2 TB of storage from ten heterogeneous storage
controllers supplied by one or more vendors. On the host
side, there are more than 1,600 servers connected via four
Fibre Channel fabrics with multiple SAN switches. In
such an environment, administrators are typically
responsible for provisioning servers and storage when
new applications are added or the demand for an existing
application increases. Provisioning the storage and
adjusting the SAN zoning to create multiple paths to each
newly provisioned volume can take several days to a
week when done manually. The administrator needs to
identify which storage subsystems have available storage
and which of the newly provisioned servers are able to
meet the performance requirements and can access that
storage by means of at least two fabrics (to reduce the
likelihood of a single point of failure). Once the storage
controllers are identified, volumes are created (using the
storage controller management tool) and zoning is
performed (using the switch fabric management tool).
After performing several steps with different tools, the
final configuration may not be ideal and may cause
unintended problems with other systems attached to the
SAN. Thus, there is a need for higher-level tools that
assist the administrator with tasks such as provisioning
in order to prevent unintended side effects and to allow
changes to be made in hours instead of days.
Data center environments are constantly evolving.
After the initial plan deployment, administrators are
typically required to continuously monitor application
performance to ensure that it is not degrading. Solving a
performance degradation problem is nontrivial in large
environments and can take several hours of investigation
to pinpoint a saturated server, switch, storage subsystem,
or Fibre Channel port. After pinpointing the saturated
device, the administrator has to then investigate the cause
of saturation. For example, a Fibre Channel port at
the storage controller can become saturated as a result of
re-zoning such that most of the storage traffic from the
fabric to the controller flows through a single port instead
of being load-balanced across the multiple storage-
controller ports. This underscores the need
administrators have for validating configuration changes
so they can prevent misconfiguration problems from
occurring. Further, there is a need to track changes in the
configuration over an extended period of time such that a
configuration snapshot for different time periods is
available. Finally, when the problem does occur,
administrators need help short-listing the devices and
configuration changes for deeper analysis.
Advanced analytic tools in SRMs can assist in change
management, configuration analysis, provisioning,
performance management, problem determination,
resiliency planning, root-cause analysis, and impact
analysis. These tools use the raw data aggregated by the
SRM and analyze it to generate insights and
configuration options for such tasks as provisioning and
problem resolution. In this paper, we describe such tools
in the context of the IBM TPC. These tools help with four
key administrative performance-management tasks:
change management, configuration analysis, provisioning
and capacity planning, and performance management
and problem determination, each discussed in the
S. GOPISETTY ET AL. IBM J. RES. & DEV. VOL. 52 NO. 4/5 JULY/SEPTEMBER 2008
342
subsequent sections. To further enhance the ability of
these modules to extract information from the raw data,
we are developing SMART (storage management
analytics and reasoning technology) [8], a library of data-
aggregation functions for device modeling. SMART uses
regression functions, workload trending using time-series
analysis, end-to-end dependency functions, and data-
clustering techniques to detect abnormalities in workload
and device characteristics. For more detailed information
about SMART and its functions, please refer to our
related papers [9–13].
Change managementAdministrators often update the system configuration, for
example, create and delete storage volumes, configure
zones within the Fibre Channel switches, change the
logical unit number masking of hosts and storage
volumes, and add new devices, hosts, and switches.
Configuration changes do not always take into account
potential second-order effects on other applications that
share the same SAN. For example, re-zoning a switch
may cause traffic to be redirected to other switches, which
can create a potential bottleneck for other applications.
Also, it is well documented that a high percentage of
storage downtime is caused by incorrect configuration
changes [14, 15]. Traditionally, administrators
maintained change logs that were manually updated with
the details of the configuration changes. These logs are
used for problem diagnosis, often at a much later point in
time and by a person other than the one who made the
change. In enterprise environments in which tens of daily
configuration changes can be affected by multiple
administrators, there is a need for a systems management
tool with the ability to track configuration history at a
fine granularity so that an administrator can accurately
reconstruct the precise state of the infrastructure at a
given point in time and use this information for problem
determination, change management, or auditing
purposes. The change rover component in TPC is
designed to satisfy this requirement.
The change rover provides temporal browsing
capability by making old data versions nameable and
accessible, thus allowing the user to reconstruct
configuration changes over a specified duration of time.
Administrators have two mechanisms for generating the
configuration history: on-demand and scheduled. With
the on-demand method, an administrator can take an
asynchronous snapshot of the system configuration at
will. Additionally, each snapshot can be associated with
an optional text tag. This tag can facilitate subsequent
collaborative debugging by a team of administrators and
it provides a means for auditing configuration change
actions. The scheduled method of generating a
configuration history lets users specify how frequently
snapshots of the system configuration are taken. The
history generation scheduler wakes up at the assigned
time and does its work unobtrusively in the background
without requiring intervention. This method automates
the cumbersome task of collecting periodic snapshots of
the system configuration state. However, any product
that stores historical data results in increased
consumption of storage space. Thus, the change rover
uses innovative technology to populate the database
repository that records only the configuration deltas (as
opposed to global snapshots) to minimize storage space
consumption for history data. As in a log-structured file
system, there is still the overhead created by the need
to replay the history to reconstruct the configuration
at some point in time; however, this runtime overhead is
minimized by intelligent use of database views and
indexes, and the savings in database space and overhead
compensate for the residual performance overhead.
Semantically, the change rover shows changes to
devices, device attributes, device interconnections, and
zoning configurations. Fundamentally, there are four
types of change operations that are of interest with
respect to the configuration of an entity: addition (e.g.,
provisioning a new volume on a storage subsystem),
modification (e.g., increasing the capacity of a given
volume), deletion (e.g., deleting a storage volume), and
no change.
A typical usage scenario for the change rover follows.
In a large distributed system configuration, changes
happen quite frequently. A change that negatively
impacts performance may not be noticed for weeks. At
the point when the administrator tries to solve the
problem, it is typically very difficult to determine which of
the many configuration changes could have caused the
problem. Using the change rover, the administrator can
go back and compare the system state from the time
before trouble reports started coming in and compare it
with later states of the system. The time slot under
consideration can be further refined until the problem is
identified and fixed. The synchronized graphical and
tabular views generated by the change rover, along with
drill down (moving from a summary view to more
detailed data), make it possible for the administrator to
view and compare the configuration at discrete points in
time and thus rapidly determine which configuration
change was the culprit.
In summary, the change rover provides a scalable and
easy-to-use way to visualize storage configuration at a
specific point in time and to compare configurations at
specific points in time for rapid problem determination.
Configuration analysisAdherence to best practices is essential for successful
configuration and deployment of complex systems. While
IBM J. RES. & DEV. VOL. 52 NO. 4/5 JULY/SEPTEMBER 2008 S. GOPISETTY ET AL.
343
deploying a system in a data center, experts rely on
experience and best-practice guidelines to proactively
prevent configuration problems from occurring.
According to the IBM SAN Central team—an internal
group in IBM that deals with installation, configuration,
and troubleshooting of SANs for customers and gathers
and maintains a large knowledge base of customer
problems, solutions, and best practices—80% of
configuration problems are caused by the violation of
best practices. Generating a best-practices user’s manual
is costly, requiring many man-years of data gathering and
analysis. It is difficult for system administrators to
maintain their own dynamic set of best practices because
the technology is continuously evolving and intervendor
interoperability standards are still immature and lead to
hard-to-diagnose configuration problems.
The configuration analysis functionality in TPC is a
better approach. It is an extensible, policy-based analytic
framework to validate storage infrastructures against
best-practice violations in an end-to-end fashion. Best-
practice policies are encoded in a declarative policy
language and cover a wide range of domains, such as
fabric security, fabric configuration, storage and server
security, and configuration. The functionality is
extensible and allows the addition of policies for such
areas as server management and IP (Internet Protocol)
network fabric management. These policies are grouped
into the following categories:
1. Parametric—Accepts input parameters from the
administrator as thresholds.
2. Nonparametric—Does not require input parameters
from the administrator.
The following is an example of a parametric policy.
� Policy—Each fabric may have a maximum of n
number of zones. (In this policy, the administrator
can supply the value of n on the basis of the type of
fabric that imposes the zone number constraint.)� Explanation—The configuration analysis function
checks whether the number of zone definitions in the
fabric is larger than the number that was entered by
the administrator. In large fabrics, too large a number
of zone definitions can become a problem. Fabric
zone definitions are controlled by one of the switches
in that fabric, and limiting their number ensures that
the zoning tables for the switch do not run out of
space. The zone-set scope is not supported by this
policy.
The following is an example of a nonparametric policy.
� Policy—Each host bus adapter (HBA) accesses
storage subsystem ports or tape ports, but not both.� Explanation—The configuration analysis function
determines whether an HBA accesses both storage
subsystem and tape ports. Because HBA buffer
management is configured differently for storage
subsystems and tape, it is not desirable to use the
same HBA for both disk and tape traffic. A policy
violation is generated if a zone set allows an HBA
port to access both disk and tape. The fabric and
zone-set scopes are not supported by this policy
because an HBA can be connected to multiple fabrics.
The configuration analysis tool can be configured to
have different scopes that can range from the entire
environment to a single Fibre Channel fabric or a set of
Fibre Channel zone sets. These scopes can be selected on
the basis of the policies to be verified. Administrators can
decide to run a group of policies on a particular scope,
which is called a profile. Primitives such as scope and
profile help administrators customize their configuration
analysis environment.
Generally, configuration changes are scheduled
periodically or are synchronized with important event
occurrences in a managed storage environment. Tasks
such as storage provisioning and access control are tested
offline before being put into production. Administrators
can synchronize their configuration changes using
configuration analysis to determine whether any best
practice will be violated because of these changes. They
can incrementally fix the violations and run configuration
analysis. A more detailed discussion of currently
supported policies is available in the TPC version 3.3
update guide [16]. In our ongoing research, we are
applying machine-learning techniques to generate the list
of best practices from large collections of customer
problem logs [17].
Provisioning and capacity planningOne of the most challenging and time-consuming tasks in
enterprise data centers is application provisioning.
Introducing a new application (or even changing the
characteristics of an existing application) often takes
weeks. This is due primarily to the complexity involved in
capacity planning (identifying appropriate resources that
can be allocated to the application) and executing the
plan to provision the actual resources for the application.
Capacity planning has long been done manually by
using rules of thumb and back-of-the-envelope
calculations. Beginning with the basic capacity
requirement, an administrator decides how many storage
volumes to create, what their individual sizes should be,
and whether enough space is available in the subsystems
to accommodate the new volumes. With an understanding
S. GOPISETTY ET AL. IBM J. RES. & DEV. VOL. 52 NO. 4/5 JULY/SEPTEMBER 2008
344
of the nature of the new workload (e.g., the read/write
ratio and the random/sequential ratio), the administrator
can try to choose where to place the new volumes so that
the application performance objectives can be met
without adversely impacting any preexisting workloads.
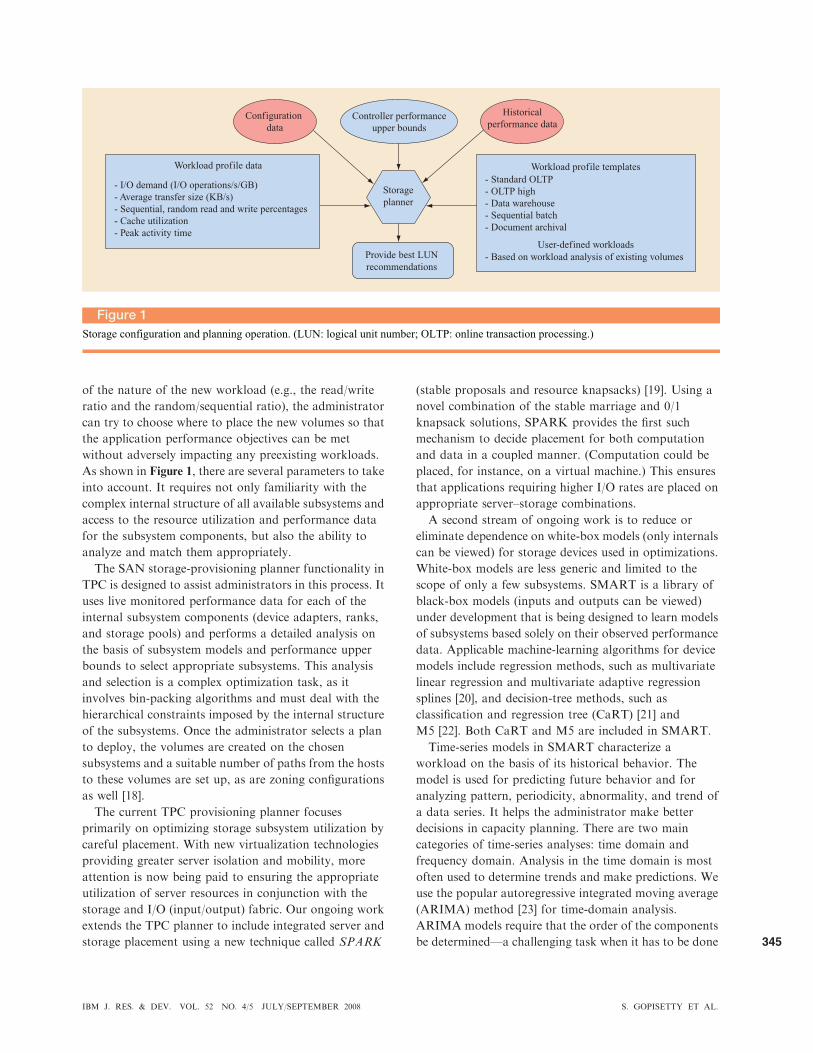
As shown in Figure 1, there are several parameters to take
into account. It requires not only familiarity with the
complex internal structure of all available subsystems and
access to the resource utilization and performance data
for the subsystem components, but also the ability to
analyze and match them appropriately.
The SAN storage-provisioning planner functionality in
TPC is designed to assist administrators in this process. It
uses live monitored performance data for each of the
internal subsystem components (device adapters, ranks,
and storage pools) and performs a detailed analysis on
the basis of subsystem models and performance upper
bounds to select appropriate subsystems. This analysis
and selection is a complex optimization task, as it
involves bin-packing algorithms and must deal with the
hierarchical constraints imposed by the internal structure
of the subsystems. Once the administrator selects a plan
to deploy, the volumes are created on the chosen
subsystems and a suitable number of paths from the hosts
to these volumes are set up, as are zoning configurations
as well [18].
The current TPC provisioning planner focuses
primarily on optimizing storage subsystem utilization by
careful placement. With new virtualization technologies
providing greater server isolation and mobility, more
attention is now being paid to ensuring the appropriate
utilization of server resources in conjunction with the
storage and I/O (input/output) fabric. Our ongoing work
extends the TPC planner to include integrated server and
storage placement using a new technique called SPARK
(stable proposals and resource knapsacks) [19]. Using a
novel combination of the stable marriage and 0/1
knapsack solutions, SPARK provides the first such
mechanism to decide placement for both computation
and data in a coupled manner. (Computation could be
placed, for instance, on a virtual machine.) This ensures
that applications requiring higher I/O rates are placed on
appropriate server–storage combinations.
A second stream of ongoing work is to reduce or
eliminate dependence on white-box models (only internals
can be viewed) for storage devices used in optimizations.
White-box models are less generic and limited to the
scope of only a few subsystems. SMART is a library of
black-box models (inputs and outputs can be viewed)
under development that is being designed to learn models
of subsystems based solely on their observed performance
data. Applicable machine-learning algorithms for device
models include regression methods, such as multivariate
linear regression and multivariate adaptive regression
splines [20], and decision-tree methods, such as
classification and regression tree (CaRT) [21] and
M5 [22]. Both CaRT and M5 are included in SMART.
Time-series models in SMART characterize a
workload on the basis of its historical behavior. The
model is used for predicting future behavior and for
analyzing pattern, periodicity, abnormality, and trend of
a data series. It helps the administrator make better
decisions in capacity planning. There are two main
categories of time-series analyses: time domain and
frequency domain. Analysis in the time domain is most
often used to determine trends and make predictions. We
use the popular autoregressive integrated moving average
(ARIMA) method [23] for time-domain analysis.
ARIMA models require that the order of the components
be determined—a challenging task when it has to be done
Figure 1Storage configuration and planning operation. (LUN: logical unit number; OLTP: online transaction processing.)
Provide best LUN
recommendations
Configuration
data
- I/O demand (I/O operations/s/GB)
- Average transfer size (KB/s)
- Sequential, random read and write percentages
- Cache utilization
- Peak activity time
- Standard OLTP
- OLTP high
- Data warehouse
- Sequential batch
- Document archival
- Based on workload analysis of existing volumes
Historical
performance dataController performance
upper bounds
User-defined workloads
Workload profile data Workload profile templates
Storage
planner
IBM J. RES. & DEV. VOL. 52 NO. 4/5 JULY/SEPTEMBER 2008 S. GOPISETTY ET AL.
345
manually. Through an extensive series of experiments, we
have developed best-practice values that allow us to
determine this order. We use fast Fourier transforms [24]
for frequency-domain analysis. Fourier transform gives
periodograms in which a periodic data series shows spikes
at its cycle, while a nonperiodic series is typically flat with
little variation.
Performance management and problemdeterminationStorage administrators are responsible for ensuring that
enterprise applications maintain a certain level of I/O
performance (in terms of average I/O throughput and
response time). This task involves a detailed
understanding of the end-to-end server–storage path
consisting of server connectivity to Fibre Channel
switches, the connectivity of switches to other switches
and storage controllers, and the logical configuration of
storage pools and volumes within the storage controllers.
A typical enterprise-scale storage environment consists of
thousands of hosts, hundreds of Fibre Channel switches
with 8 to 64 ports each connecting tens of enterprise-class
storage controllers, tape libraries, and other devices. The
order of the number of end-to-end paths from host
servers to storage volumes can range upward from
thousands to millions. Manually correlating data
collected from individual devices within the infrastructure
is no longer a feasible alternative.
Performance management starts with appropriately
provisioning storage capacity and bandwidth on the basis
of application requirements. In addition, path and zone
planning is required to ensure that there is sufficient
bandwidth for connectivity between the application
server or servers and the storage subsystem. After the
initial setup, administrators continuously monitor and
analyze the end-to-end path to ensure that the
performance requirements are satisfied. Performance
violations can occur for several reasons with varying
levels of complexity. Violations can be caused by simple
device failures that are easy to detect or by relatively
complex device saturation caused by skew in the
workload of one or more applications sharing the device.
Thus, problem determination is an important aspect of
performance management and requires that
administrators drill down until they uncover the reason
for a performance violation.
There are several performance-management and
problem-determination tools with varying levels of
automation available in TPC. As described earlier, the
configuration analyzer continuously analyzes
configuration changes and checks for violations of best
practices as a method intended to prevent performance
problems before they occur. Similarly, the change rover
maintains historical configuration information, making it
possible for an administrator to review configuration
changes that could possibly have led to a performance
violation.
An important aspect of performance management and
problem determination is to provide end-to-end
information to the administrator using an intuitive,
flexible interface that allows administrators to understand
the overall environment and enables them to drill down
into the details of logical or physical entities to diagnose
system problems. The TPC datapath explorer is such an
interface. It uses advanced human–computer interaction
(HCI) concepts [25]. Its design objectives were derived
from numerous real-world case studies conducted to
understand how administrators execute their day-to-day
tasks and make use of available data for decision making.
The explorer provides a view of the end-to-end path
dependencies between servers and storage subsystems or
between storage subsystems (e.g., from a SAN volume
controller to back-end storage). In addition to
discovering path dependencies, the explorer also derives
the end-to-end performance and health information, that
is, information that consists of critical and other
configuration alerts related to the devices (typically found
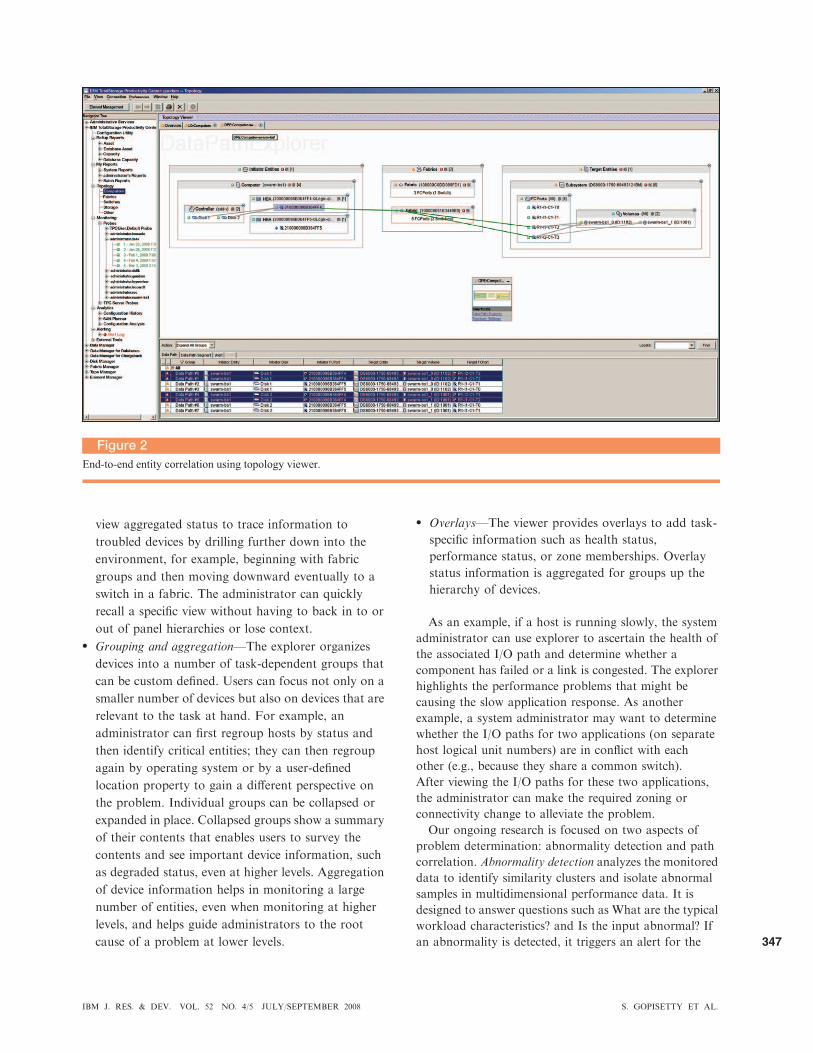
in the device logs). In order to provide an intuitive view,
the overall datapath (Figure 2) is divided into three
groups: host, fabric, and subsystem.
Some of the key HCI concepts the explorer uses to
radically simplify tasks such as system diagnosis to trace
the source of a problem from a host to a switch to a
storage subsystem [26–28] are as follows:
� Semantic zooming and progressive disclosure—A
visualization technique for rendering very-high-
density data by adaptively changing the level of data
abstraction. While graphical zooming changes the
scale of the object being viewed, semantic zooming
changes the level of information abstraction, for
example, zooming out would mean going to a higher
level of abstraction. It is often employed in
conjunction with progressive disclosure, which
provides task-specific presentation and interaction in
a sequence of displays. Much of this capability was
achieved by anticipating the steps administrators
would take in completing tasks and then creating
displays to support the completion of those tasks
quickly.� Multilevel, multiperspective layouts—Explorer is
capable of providing multiple views of the system
topology (server, fabric, and storage centric) with
varying levels of abstraction (overview, group, single
devices). Initially, users are shown an overview of
their entire systems environment in which devices are
grouped by type. In the event of a problem, users can
S. GOPISETTY ET AL. IBM J. RES. & DEV. VOL. 52 NO. 4/5 JULY/SEPTEMBER 2008
346
view aggregated status to trace information to
troubled devices by drilling further down into the
environment, for example, beginning with fabric
groups and then moving downward eventually to a
switch in a fabric. The administrator can quickly
recall a specific view without having to back in to or
out of panel hierarchies or lose context.
� Grouping and aggregation—The explorer organizes
devices into a number of task-dependent groups that
can be custom defined. Users can focus not only on a
smaller number of devices but also on devices that are
relevant to the task at hand. For example, an
administrator can first regroup hosts by status and
then identify critical entities; they can then regroup
again by operating system or by a user-defined
location property to gain a different perspective on
the problem. Individual groups can be collapsed or
expanded in place. Collapsed groups show a summary
of their contents that enables users to survey the
contents and see important device information, such
as degraded status, even at higher levels. Aggregation
of device information helps in monitoring a large
number of entities, even when monitoring at higher
levels, and helps guide administrators to the root
cause of a problem at lower levels.
� Overlays—The viewer provides overlays to add task-
specific information such as health status,
performance status, or zone memberships. Overlay
status information is aggregated for groups up the
hierarchy of devices.
As an example, if a host is running slowly, the system
administrator can use explorer to ascertain the health of
the associated I/O path and determine whether a
component has failed or a link is congested. The explorer
highlights the performance problems that might be
causing the slow application response. As another
example, a system administrator may want to determine
whether the I/O paths for two applications (on separate
host logical unit numbers) are in conflict with each
other (e.g., because they share a common switch).
After viewing the I/O paths for these two applications,
the administrator can make the required zoning or
connectivity change to alleviate the problem.
Our ongoing research is focused on two aspects of
problem determination: abnormality detection and path
correlation. Abnormality detection analyzes the monitored
data to identify similarity clusters and isolate abnormal
samples in multidimensional performance data. It is
designed to answer questions such as What are the typical
workload characteristics? and Is the input abnormal? If
an abnormality is detected, it triggers an alert for the
Figure 2End-to-end entity correlation using topology viewer.
IBM J. RES. & DEV. VOL. 52 NO. 4/5 JULY/SEPTEMBER 2008 S. GOPISETTY ET AL.
347
administrator and records a detailed snapshot of the
system configuration for later analysis. Path correlation
refers to the task of determining the mapping of each
application workload to the different paths and links in
the system. It is used to answer questions such as Which
applications are going through this link, port, or device?
and What are the application paths? Path correlation
functions are the basis for dependency discovery, problem
determination, and impact analysis. The literature shows
that there has been significant interest in using correlation
models for problem diagnosis and root-cause analysis
[26–30]. These models capture the relationships among
different components in the system by analyzing request
traces collected by node instrumentation or request
probing. These path correlation models capture the
relationships among different components in the system
by analyzing request traces collected by node
instrumentation or request probing.
To provide support for abnormality detection, we are
implementing a data-clustering module as part of the
SMART library. Data clustering is done using machine-
learning algorithms, namely k-means [31] and expectation
maximization [32]. The basic idea is that normal
monitoring samples will have similar values and will
always be clustered together (e.g., the response time of a
device for a given load will be similar in normal
circumstances); the abnormal samples will be far away
from their corresponding clusters and hence can be
detected and notification provided. The distance
measurement for abnormality considers the weighted
Euclidean distance between the sample and its cluster
centroid. We use weighted distance because different
metrics have different statistics, for example, a cache hit is
between 0% and 100%, while the I/O rate ranges into the
thousands. Metric weights are obtained from in-house
experiments and preloaded in the SMART library.
The path correlation module in SMART uses the
topology and fabric zoning information available in TPC.
The application-to-server mappings and those to the
server port, controller port, controller, and disk array are
extracted from the TPC. Routing information within the
fabric network is managed automatically by fabric
switches and, thus, is not available. Fortunately, fabric
networks typically use uniform configurations with
simple topology designs, which makes it easy to infer
routing paths. High redundancy in enterprise storage
systems is a challenge for path correlation. In a typical
real-world setup, one server has at least two unshared
fabric networks connecting to the storage controller, and
each path uses two to four redundant connections at each
device for load-balancing and failover. Existing
dependency models are not applicable since we cannot
currently instrument storage controllers or send probing
requests. A complete study of load-balancing and failover
behavior remains for future work.
Related workData storage needs have been rapidly increasing, creating
the need for more automated storage management. There
has been a significant amount of research in the area of
storage resource manager (SRM) tools that can be
differentiated along five axes: discovery and monitoring
of heterogeneous storage hardware and resources,
analyzing and reporting normal and anomalous behavior,
configuration and capacity planning, change execution,
and ease of use. The key SRM tools available today
include CA Storage Resource Manager [33], EMC
ControlCenter [6], HP Storage Essentials [34], IBM
TPC [5], Symantec storage management solutions [35],
and Network Appliance NetApp Storage Suite [36]. In
addition to these, there are other smaller companies (such
as Akorri, Brocade Communications Systems, and
Tek-Tools) in the market that focus on individual aspects
of storage management. A brief comparative study of
these commercial tools is available from Russell and
Passmore [37] in their ‘‘magic quadrant’’ analysis, which
compares major SRM software against different criteria.
In our view, the key aspect that distinguishes the IBM
TPC solution from the others is an easy-to-use unified
console that integrates all the SRM functions and
provides a seamless way for the administrator to discover,
monitor, analyze, plan, and execute by making use of the
advanced analytics described in this paper.
Visualizing high-density data is an area of active
research in the HCI domain [25, 38]. Topology viewer
uses some of the HCI concepts such as semantic zooming
and progressive disclosure to change the level of data
abstraction adaptively. The change rover is related to
software versioning tools that keep track of different
software modifications and allow users to compare their
changes with earlier versions of their code. The change
rover applies similar concepts in the SAN environment so
that system administrators can keep track of changes in
the configuration of devices, zones, and interconnects.
The configuration analyzer enables the use of Technology
Infrastructure Library (ITIL**) [39] best practices for the
management of storage infrastructures and services.
Provisioning and capacity planning have been well
studied [40]. There are many commercially available tools
(e.g., EMC ControlCenter SAN Manager [6] and CA
SAN Designer [41]) and research prototypes (such as
Minerva [42], Ergastulum [43], and HP Appia [44]) that
perform capacity planning for shared storage systems.
One of the major factors that differentiate TPC from
these products is that it can plan volume allocation, port
selection, or zoning on the basis of runtime performance
and subsystem internal component utilization, which may
S. GOPISETTY ET AL. IBM J. RES. & DEV. VOL. 52 NO. 4/5 JULY/SEPTEMBER 2008
348
become necessary once the infrastructure has been
deployed. Previous algorithms [45] for disk layouts and
file placements have been proposed, but the difficulty is
taking into account the hierarchical and other practical
constraints that are common in modern SAN
environments.
Conclusion and future work
In the last few years, there has been a significant evolution
in the domain of storage management. Starting with the
manual collection of data from individual device
management graphical user interfaces, storage
management is evolving to an approach that standardizes
the collection of data for multivendor devices followed by
persistence in a common repository and provides end-to-
end topology information integrated with analytic tools
to assist administrators with day-to-day administrative
tasks. In this paper, we presented a description of various
analytic features of the IBM TPC in the context of
existing techniques used by administrators and described
how TPC tools can simplify the day-to-day tasks of
change management, configuration analysis, provisioning
and capacity planning, performance management, and
problem determination.
Our ongoing research is focused on further automation
and simplification of the error-prone tasks of disaster
recovery planning, charge back [46], end-to-end
provisioning optimization [19], storage service
outsourcing [47], and others that are currently executed
using back-of-the-envelope calculations. Management
decisions are becoming more proactive rather than being
reactive. Administrators are increasingly using what-if
analyzers [48] to evaluate the impact of configuration
changes and system events. Our grand vision is a tighter
integration of storage management with server, virtual
machine, and IP network management, providing an end-
to-end application-level management environment with
dynamic continuous optimization.
*Trademark, service mark, or registered trademark ofInternational Business Machines Corporation in the United States,other countries, or both.
**Trademark, service mark, or registered trademark of EMCCorporation, Hewlett-Packard Development Company, L.P.,Office of Government Commerce, or Sun Microsystems, Inc., inthe United States, other countries, or both.
References1. Distributed Management Task Force, Inc., Common
Information Model (CIM) Standards; see http://www.dmtf.org/standards/cim/.
2. J. Case, M. Fedor, M. Schoffstall, and J. Davin, ‘‘A SimpleNetwork Management Protocol (SNMP),’’ IETF Request forComments 1098, Network Working Group (May 1990); seehttp://www.ietf.org/rfc/rfc1157.txt.
3. Storage Networking Industry Association, SMI-S: TheStorage Management Initiative Specification; see http://www.snia.org/forums/smi/tech_programs/smis_home/.
4. The Open Group, SNIA Open Source Java CIM ObjectManagers (CIMOMs); see http://www.opengroup.org/snia-cimom/.
5. IBM Corporation, IBM TotalStorage Productivity CenterSuite; see http://www-304.ibm.com/jct03004c/systems/storage/software/center/.
6. EMC Corporation, EMC ControlCenter Family; see http://www.emc.com/products/family/controlcenter-family.htm.
7. Hewlett-Packard Development Company, HP Systems InsightManager; see http://h18000.www1.hp.com/products/servers/management/hpsim/index.html.
8. L. Yin, S. Uttamchandani, M. Korupolu, K. Voruganti, andR. Katz, ‘‘SMART: An Integrated Multi-Action Advisor forStorage Systems,’’ Proceedings of the USENIX AnnualTechnical Conference, Boston, MA, 2006, pp. 229–242.
9. S. Uttamchandani, L. Yin, G. A. Alvarez, J. Palmer, and G.Agha, ‘‘CHAMELEON: A Self-Evolving, Fully-AdaptiveResource Arbitrator for Storage Systems,’’ Proceedings of theUSENIX Annual Technical Conference, Anaheim, CA, 2005,pp. 75–88.
10. K. T. Pollack and S. M. Uttamchandani, ‘‘Genesis: A ScalableSelf-Evolving Performance Management Framework forStorage Systems,’’ Proceedings of the 26th IEEE InternationalConference on Distributed Computing Systems, Lisboa,Portugal, 2006, p. 33.
11. L. Yin, S. Uttamchandani, and R. Katz, ‘‘An EmpiricalExploration of Black-Box Performance Models for StorageSystems,’’ Proceedings of the 14th IEEE InternationalSymposium on Modeling, Analysis, and Simulation of Computerand Telecommunication Systems, Monterey, CA, 2006,pp. 433–440.
12. L. Yin, S. Uttamchandani, J. Palmer, R. Katz, and G. Agha,‘‘AutoLoop: Automated Action Selection in the ‘Observe-Analyze-Act’ Loop for Storage Systems,’’ Sixth InternationalWorkshop on Policies for Distributed Systems and Networks,Stockholm, Sweden, 2005, pp. 129–138.
13. S. Uttamchandani, K. Voruganti, S. M. Srinivasan, J. Palmer,and D. Pease, ‘‘Polus: Growing Storage QoS ManagementBeyond a ‘4-Year Old Kid’,’’ Proceedings of the ThirdUSENIX Conference on File and Storage Technologies, SanFrancisco, CA, 2004, pp. 31–44.
14. J. Gray, ‘‘Why Do Computers Stop and What Can Be DoneAbout it?’’ Proceedings of the Fifth Symposium on Reliability inDistributed Software and Database Systems, Los Angeles, CA,1986, pp. 3–12.
15. S. Beattie, S. Arnold, C. Cowan, P. Wagle, C. Wright, and A.Shostack, ‘‘Timing the Application of Security Patches forOptimal Uptime,’’ Proceedings of the 16th Conference onSystems Administration, Philadelphia, PA, 2002, pp. 101–110.
16. M. Lovelace, M. Defiebre, H. Gunatilaka, C. Neal, and Y. Xu,‘‘TotalStorage Productivity Center V3.3 Update Guide,’’ IBMRedbooks, April 23, 2008; see http://www.redbooks.ibm.com/abstracts/sg247490.html.
17. P. Sarkar, R. Routray, E. Butler, C.-H. Tan, K. Voruganti,and K. Yang, ‘‘SPIKE: Best Practice Generation for StorageArea Networks,’’ Proceedings of the Second USENIXWorkshop on Tackling Computer Systems Problems withMachine Learning Techniques, Cambridge, MA, 2007.
18. S. Gopisetty, E. Butler, S. Jaquet, M. Korupolu, T. K. Nayak,R. Routray, M. Seaman, A. Singh, C.-H. Tan, S.Uttamchandani, and A. Verma, ‘‘Automated Planners forStorage Provisioning and Disaster Recovery,’’ IBM J. Res. &Dev. 52, No. 4/5, 353–365 (2008, this issue).
19. A. Singh, M. Korupolu, and B. Bamba, ‘‘SPARK: IntegratedResource Allocation in Virtualization-Enabled SAN DataCenters,’’ Research Report RJ-10407, IBM Almaden ResearchCenter, San Jose, CA 95120, April 2007; see http://www.aameeksingh.com/projects/spark-rj10407.pdf.
IBM J. RES. & DEV. VOL. 52 NO. 4/5 JULY/SEPTEMBER 2008 S. GOPISETTY ET AL.
349
20. J. H. Friedman, ‘‘Multivariate Adaptive Regression Splines,’’Annals Statistics 19, No. 1, 1–67 (1991).
21. L. Breiman, J. Friedman, C. J. Stone, and R. A. Olshen,Classification and Regression Trees, CRC Press, Boca Raton,FL, 2003.
22. J. R. Quinlan, ‘‘Learning with Continuous Classes,’’Proceedings of the Fifth Australian Joint Conference onArtificial Intelligence, Hobart, Tasmania, 1992, pp. 343–348.
23. P. J. Brockwell and R. A. Davis, Introduction to Time Seriesand Forecasting, Second Edition, Springer Publishing,New York, 2002.
24. J. W. Cooley and J. W. Tukey, ‘‘An Algorithm for theMachine Calculation of Complex Fourier Series,’’ Math.Comput. 19, No. 90, 297–301 (1965).
25. A. Dieberger, E. Kandogan, and C. A. Kieliszewski,‘‘Scalability in System Management GUIs: A Designer’sNightmare,’’ Proceedings of the Conference on Human Factorsin Computing Systems, Montreal, Quebec, Canada, 2006,pp. 99–104.
26. S. Agarwala, F. Alegre, K. Schwan, and J. Mehalingham,‘‘E2EProf: Automated End-to-End Performance Managementfor Enterprise Systems,’’ Proceedings of the 37th Annual IEEE/IFIP International Conference on Dependable Systems andNetworks, Edinburgh, Scotland, 2007, pp. 749–758.
27. P. Barham, A. Donnelly, R. Isaacs, and R. Mortier, ‘‘UsingMagpie for Request Extraction and Workload Modelling,’’Proceedings of the Sixth USENIX Symposium on OperatingSystem Design and Implementation, San Francisco, CA, 2004,pp. 259–272.
28. M. Y. Chen, E. Kıcıman, E. Fratkin, A. Fox, and E. Brewer,‘‘Pinpoint: Problem Determination in Large, DynamicInternet Services,’’ Proceedings of the International Conferenceon Dependable Systems and Networks, Florence, Italy, 2002,pp. 595–604.
29. A. Brown, G. Kar, and A. Keller, ‘‘An Active Approach toCharacterizing Dynamic Dependencies for ProblemDetermination in a Distributed Environment,’’ Proceedings ofthe Seventh IFIP/IEEE International Symposium on IntegratedNetwork Management, Seattle, WA, 2001, pp. 377–390.
30. V. Bahl, R. Chandra, A. Greenberg, S. Kandula, D. A. Maltz,and M. Zhang, ‘‘Towards Highly Reliable Enterprise NetworkServices Via Inference of Multi-Level Dependencies,’’Proceedings of the Conference on Applications, Technologies,Architectures. and Protocols for Computer Communications,Kyoto, Japan, 2007, pp. 13–24.
31. J. B. MacQueen, ‘‘Some Methods for Classification andAnalysis of MultiVariate Observations,’’ Proceedings of theFifth Berkeley Symposium on Mathematical Statistics andProbability, Berkeley, CA, 1967, pp. 281–297.
32. A. P. Dempster, N. M. Laird, and D. B. Rubin, ‘‘MaximumLikelihood from Incomplete Data Via the EM Algorithm,’’J. R. Stat. Soc. Series B (Methodological) 39, No. 1, 1977,1–38 (1977).
33. CA, Inc., CA Storage Resource Manager; see http://ca.com/us/products/product.aspx?ID¼1541.
34. Hewlett-Packard Development Company, HP StorageEssentials (SRM) Software; see http://h18006.www1.hp.com/storage/software/srmgt/index.html.
35. Symantec Corporation, Storage Management; see http://www.symantec.com/business/products/category.jsp?pcid¼2245.
36. NetApp, Inc., NetApp Management Software: Storage Suite;see http://www.netapp.com/us/products/management-software/.
37. D. Russell and R. E. Passmore, ‘‘Magic Quadrant for StorageResource Management and SAN Management Software,2007,’’ Technical Report G00146578, Gartner RAS CoreResearch, Gartner, March 2007.
38. B. B. Bederson, L. Stead, and J. D. Hollan, ‘‘Padþþ: Advancesin Multiscale Interfaces,’’ Proceedings of the Conference onHuman Factors in Computing Systems, Boston, MA, 1994,pp. 315–316.
39. ITIL: IT Infrastructure Library; see http://www.itil-officialsite.com/home/home.asp.
40. D. A. Menasce, V. A. F. Almeida, and L. W. Dowdy, CapacityPlanning and Performance Modeling: From Mainframes toClient-Server Systems, Prentice-Hall, Inc., Upper SaddleRiver, NJ, 1994.
41. CA, Inc., CA SAN Designer; see http://ca.com/us/products/product.aspx?ID¼4590.
42. G. A. Alvarez, E. Borowsky, S. Go, T. H. Romer, R. Becker-Szendy, R. Golding, A. Merchant, M. Spasojevic, A. Veitch,and J. Wilkes, ‘‘MINERVA: An Automated ResourceProvisioning Tool for Large-Scale Storage Systems,’’ ACMTrans. Comput. Syst. 19, No. 4, 483–518 (2001).
43. E. Anderson, S. Spence, R. Swaminathan, M. Kallahalla, andQ. Wang, ‘‘Quickly Finding Near-Optimal Storage Designs,’’ACM Trans. Comput. Syst. 23, No. 4, 337–374 (2005).
44. J. Ward, M. O’Sullivan, T. Shahoumian, and J. Wilkes,‘‘Appia: Automatic Storage Area Network Fabric Design,’’Proceedings of the Conference on File and StorageTechnologies, Monterey, CA, 2002, pp. 203–217.
45. J. Wolf, ‘‘The Placement Optimization Program: A PracticalSolution to the Disk File Assignment Problem,’’ Proceedingsof the 1989 ACM SIGMETRICS International Conference onMeasurement and Modeling of Computer Systems, Oakland,CA, 1989, pp. 1–10.
46. S. Agarwala, R. Routray, and S. Uttamchandani,‘‘ChargeView: An Integrated Tool for ImplementingChargeback in IT Systems,’’ Proceedings of the 11th IEEE/IFIP Network Operations and Management Symposium,Salvador, Bahia, Brazil, 2008, see http://www.iit.edu/;routram/ChargeView.pdf.
47. S. Uttamchandani, K. Voruganti, R. Routray, L. Yin, A.Singh, and B. Yolken, ‘‘BRAHMA: Planning Tool forProviding Storage Management as a Service,’’ Proceedings ofthe IEEE International Conference on Services Computing,Salt Lake City, UT, 2007, pp. 1–10.
48. A. Singh, M. Korupolu, and K. Voruganti, ‘‘Zodiac: EfficientImpact Analysis for Storage Area Networks,’’ Proceedings ofthe Fourth USENIX Conference on File and StorageTechnologies, San Francisco, CA, 2005, pp. 73–86.
Received October 1, 2007; accepted for publication
S. GOPISETTY ET AL. IBM J. RES. & DEV. VOL. 52 NO. 4/5 JULY/SEPTEMBER 2008
350
December 19, 2007; Internet publication June 18, 2008
Sandeep Gopisetty IBM Almaden Research Center,650 Harry Road, San Jose, California 95120([email protected]). Mr. Gopisetty is a Senior TechnicalStaff Member and manager. He leads the autonomic storagemanagement research, where he is responsible for the strategy,vision, and architecture of the TPC and its analytics. He iscurrently working on various optimization and resiliency analyticsfor autonomic storage resource manager and integrated systemsmanagement. He is the recipient of several patents and IBMcorporate recognition awards including an Outstanding InnovationAward and a Supplemental Outstanding Technical AchievementAward for his vision and technical contributions to the architectureof the TPC as well as leadership in driving his vision into plan andthrough implementation with a team that spanned three divisions.He also received an Outstanding Technical Achievement Awardand a Supplemental Outstanding Technical Achievement Award,both for character recognition. His research interests includeobject-oriented systems, Sun Java**, C and Cþþ programming,and distributed database systems development. He graduated withan M.S. degree in computer engineering from Santa ClaraUniversity.
Sandip Agarwala IBM Almaden Research Center, 650 HarryRoad, San Jose, California 95120 ([email protected]).Dr. Agarwala is a Research Staff Member. He holds a Ph.D. degreein computer science from the Georgia Institute of Technology, anda B.Tech. degree in computer science from the Indian Institute ofTechnology, Kharagpur. His research interests are in the generalarea of experimental computer systems, with primary focus on thedesign, development, and analysis of system- and middleware-leveltechniques to diagnose performance, manage resources, andautomate the management of large-scale distributed systems.
Eric Butler IBM Almaden Research Center, 650 Harry Road,San Jose, California 95120. Mr. Butler is an Advisory SoftwareEngineer. He holds B.S. and M.S. degrees in electrical engineeringfrom San Jose State University. His research interests include datacenter optimization; integrated system, storage, and networkmanagement; and storage systems.
Divyesh Jadav IBM Almaden Research Center, 650 HarryRoad, San Jose, California 95120 ([email protected]).Dr. Jadav is a Software Architect in the Storage Systems andServers group. He holds a B.E. degree from Bombay University,India, and M.S. and Ph.D. degrees from Syracuse University, all incomputer engineering. He has worked in the areas of RAID(Redundant Array of Independent Disks) software, autonomicperformance control, and storage resource management.
Stefan Jaquet IBM Almaden Research Center, 650 HarryRoad, San Jose, California 95120. Mr. Jaquet is a Senior SoftwareEngineer. He holds a B.S. degree in mathematics and computerscience from Santa Clara University, and an M.S. degree incomputer science from San Jose State University. He has workedon various data management, storage systems, and storagemanagement projects, and he is currently focused on integratedstorage and systems management as well as storage performancemanagement software.
Madhukar Korupolu IBM Almaden Research Center,650 Harry Road, San Jose, California 95120([email protected]). Dr. Korupolu is a Research Staff
Member. He holds M.S. and Ph.D. degrees in computer sciencefrom the University of Texas at Austin, and a B.Tech. degree incomputer science from the Indian Institute of Technology, Madras.His areas of interest and contribution are in capacity planning andprovisioning (technology released as part of IBM TotalStorageProductivity Center), autonomic resource management and relatedserver and storage optimization in data centers, virtualizationmanagement, and more generally, algorithms and distributedsystems. He is presently an Associate Editor for the ACM journalTransactions on Storage.
Ramani Routray IBM Almaden Research Center, 650 HarryRoad, San Jose, California 95120 ([email protected]).Mr. Routray is an Advisory Software Engineer. He holds an M.S.degree in computer science from Illinois Institute of Technology.His research interests include storage systems, SAN simulation,integrated systems management, machine learning, and disasterrecovery.
Prasenjit Sarkar IBM Almaden Research Center, 650 HarryRoad, San Jose, California 95120. Dr. Sarkar is a Research StaffMember in computer science and Master Inventor whose focus ison autonomic data storage resource management. He has madekey architectural contributions in the areas of self-management,optimization, fault analysis, storage provisioning, andorchestration that are featured in the IBM TotalStorageProductivity Center suite of products. He holds a B.S. degree incomputer science and engineering from the Indian Institute ofTechnology, Kharagpur, and M.S. and Ph.D. degrees in computerscience, both from the University of Arizona. His initial researchat IBM focused on the then-emerging field of storage networkingover IP networks. In addition to authoring Internet EngineeringTask Force (IETF) industry standards, he was instrumental indesigning and releasing the industry’s first iSCSI (Internet SmallComputer System Interface) storage controller in June 2001. Hehas received five patents and three IBM Outstanding TechnicalAchievement Awards.
Aameek Singh IBM Almaden Research Center, 650 HarryRoad, San Jose, California 95120 ([email protected]).Dr. Singh holds a Ph.D. degree in computer science from theGeorgia Institute of Technology. His research interests includeintegrated management and security for enterprise-scale storageand distributed systems.
Miriam Sivan-Zimet IBM Almaden Research Center, 650Harry Road, San Jose, California 95120. Ms. Sivan-Zimet is anAdvisory Software Engineer and holds an M.S. degree in computerscience from the University of California at Santa Cruz.
Chung-Hao Tan IBM Almaden Research Center, 650 HarryRoad, San Jose, California 95120 ([email protected]).Mr. Tan is a Senior Software Engineer. He holds an M.S. degree incomputer science from the University of Southern California.His research interests include HCI, system management, andmachine learning.
Sandeep Uttamchandani IBM Almaden Research Center,650 Harry Road, San Jose, California 95120([email protected]). Dr. Uttamchandani holds M.S. andPh.D. degrees from University of Illinois, Urbana–Champaign. He
IBM J. RES. & DEV. VOL. 52 NO. 4/5 JULY/SEPTEMBER 2008 S. GOPISETTY ET AL.
351
currently leads the research effort in developing and delivering aresiliency planner for the IBM systems management product line.He has been involved in projects relating to storage protocols,distributed file systems, autonomic storage management, and large-scale customer deployments. He started and developed theSMART project at IBM Almaden Research Center, whichexplored model-based techniques for storage management. He hasauthored several papers in key systems conferences and key patentdisclosures in the systems management domain.
David Merbach IBM Systems and Technology Group,3605 Highway 52 North, Rochester, Minnesota 55901([email protected]). Mr. Merbach is an architect for theTotalStorage Productivity Center.
Sumant Padbidri IBM Almaden Research Center, 650 HarryRoad, San Jose, California 95120 ([email protected]).Mr. Padbidri is a Senior Technical Staff Member and lead architectfor the TotalStorage Productivity Center at IBM. He holds anM.S. degree in computer science from the University of Bombay.
Andreas Dieberger IBM Almaden Research Center,650 Harry Road, San Jose, California 95120. Dr. Dieberger is aResearch Staff Member working on HCI.
Eben M. Haber IBM Almaden Research Center, 650 HarryRoad, San Jose, California 95120. Dr. Haber is a Research StaffMember working on HCI. He holds a Ph.D. degree from theUniversity of Wisconsin–Madison where he worked on improvinguser interfaces for database systems. His interests includedatabases, user interfaces, and visualization of structuredinformation. He has worked on data mining and visualization aswell as user interface design, and he is currently studying humaninteractions with complex systems.
Eser Kandogan IBM Almaden Research Center, 650 HarryRoad, San Jose, California 95120. Dr. Kandogan is a ResearchStaff Member. He holds a Ph.D. degree from the University ofMaryland, where he studied computer science with a specializationin HCI. His current interests include human interaction withcomplex systems, policy-based system management, ethnographicstudies of system administrators, information visualization, andend-user programming.
Cheryl A. Kieliszewski IBM Almaden Research Center,650 Harry Road, San Jose, California 95120 ([email protected]).Dr. Kieliszewski is a Research Scientist focused on the humanelement of service system design. She has worked in human factorsand has a background in general design and HCI. She holds aPh.D. degree in industrial and systems engineering from theVirginia Polytechnic Institute.
Dakshi Agrawal IBM Research Division, Thomas J. WatsonResearch Center, 19 Skyline Drive, Hawthorne, New York 10532([email protected]).Dr.Agrawal received aB.Tech. degree fromthe Indian Institute of Technology–Kanpur, an M.S. degree fromWashington University, and a Ph.D. degree from the University ofIllinois, Urbana–Champaign, all in electrical engineering. Hemanages the Network Management Research group.
Murthy Devarakonda IBM Research Division, Thomas J.Watson Research Center, P.O. Box 218, Yorktown Heights,New York 10598. Dr. Devarakonda is a Senior Manager andResearch Staff Member in the Services Research department at theIBM T. J. Watson Research Center. He received his Ph.D. degreein computer science from the University of Illinois at Urbana–Champaign in 1988. Presently, his research is focused ondistributed file systems, Web technologies, storage and systemsmanagement, and now services computing. He received three IBMResearch Division Awards for his work on distributed file systemsand Global Technology Outlook development. Dr. Devarakondais a Senior Member of the IEEE and the ACM.
Kang-Won Lee IBM Research Division, Thomas J. WatsonResearch Center, 19 Skyline Drive, Hawthorne, New York 10532.Dr. Lee is a Research Staff Member and a manager of the WirelessNetwork Research group. He holds a Ph.D. degree in computerscience from the University of Illinois, Urbana–Champaign, andB.S. and M.S. degrees in computer engineering from the SeoulNational University. His research interest lies in distributedcomputing systems, wired and wireless computer networks, andon-demand policy-based computer system management. Hereceived an IBM Research Division Award for his contribution inpolicy-based autonomic computing systems.
Kostas Magoutis IBM Research Division, Thomas J. WatsonResearch Center, P.O. Box 218, Yorktown Heights, New York10598 ([email protected]). Dr. Magoutis is a Research StaffMember in the Services Research department. His researchinterests are in distributed systems, storage systems, and ITservices. Recently, he has been working on modeling andmanagement of distributed middleware systems, self-regulating,high-speed access to network storage systems, and improving thedesign and delivery of IT services. He holds a Ph.D. degree incomputer science from Harvard University.
Dinesh C. Verma IBM Research Division, Thomas J. WatsonResearch Center, 19 Skyline Drive, Hawthorne, New York 10532([email protected]). Dr. Verma is a researcher and seniormanager in the networking technology area. He holds a Ph.D.degree in computer networking from the University of CaliforniaBerkeley, a Masters in Management of Technology degree fromPolytechnic University, and a B.S. degree in computer science fromthe Indian Institute of Technology, Kanpur. He holds 24 patentsrelated to computer networks and has authored more than 50papers and four books in the field. He is the program manager forthe U.S. and UK International Technology Alliance in NetworkSciences. He is a Fellow of the IEEE and has served in variousprogram committees and technical committees. His researchinterests include topics in wireless networks, network management,distributed computing, and autonomic systems.
Norbert G. Vogl IBM Research Division, Thomas J. WatsonResearch Center, P.O. Box 218, Yorktown Heights, New York10598 ([email protected]). Mr. Vogl holds degrees in mathematicsand computer science from Clarkson University and PennsylvaniaState University. He develops service and application prototypes,and his experience includes decision support for storage allocation,IT in the small and medium business sector, bulk file delivery viasatellite communication systems, video and data transmission overresidential broadband, and workflows of intraenterprise electroniccommerce.
S. GOPISETTY ET AL. IBM J. RES. & DEV. VOL. 52 NO. 4/5 JULY/SEPTEMBER 2008
352
Related Documents


![Application Example 09/2016 Exchange of large data volumes ...€¦ · Raw[3] Raw[4] GetTagRawWait Tag Raw R_ID Raw[0] Raw[1] Raw[2] Raw[3] Raw[4] SetTagRawWait. 3 Basic information](https://static.cupdf.com/doc/110x72/5f1fce0444607025af2e69fc/application-example-092016-exchange-of-large-data-volumes-raw3-raw4-gettagrawwait.jpg)