Mechanics and Physics of Porous Solids (MPPS) - A tribute to Prof. Olivier Coussy EVOLUTION OF PORTLAND CEMENT MECHANICAL PROPERTIES EXPOSED TO CO 2 -RICH FLUIDS: INVESTIGATION AT DIFFERENT SCALES B. LECAMPION * , J. VANZO † , F.J. ULM † , B. HUET ** , C. GERMAY , I. KHALFALLAH ** , J. DIRRENBERGER ** * Schlumberger Doll Research One Hampshire Street Cambridge, MA 02139,USA e-mail: [email protected] † Dept. of Civil & Environmental Engineering Massachussets Institute of Technology, 77 Massachusetts Avenue Cambridge, MA 02139, USA ** Schlumberger Riboud Product Center 1 rue Henri Becquerel Clamart 92142, France Epslog S.A. Bat. PIMW, Bvd de Colonster 4/P56 Li` ege 4000, Belgium Key words: Cement Carbonation, Scratch tests, Nano-indentation grid technique, Chem- ical analysis, Micro-poroelasticity, CO 2 storage Abstract. Macroscopic scratch tests and nano-indentation grid tests on carbonated Portland cement pastes are reported. A chemical analysis (Electron Probe Micro Analysis) is also briefly presented. The scratch tests probe the macroscopic evolution of the material failure properties between the un-reacted and carbonated parts of the samples, while grid of nano-indentation tests investigate the material evolution at a smaller scale. The results are put in perspective via a micro-poroelastic analysis. The material becomes stiffer and stronger macroscopically with carbonation while a large re-organization of the microstructure takes place at small scale. 1 MOTIVATIONS The interest in carbon dioxide (CO 2 ) geological storage as well as enhanced-oil recovery applications via CO 2 injection has grown steadily in recent years. The sealing proper- 1

Welcome message from author
This document is posted to help you gain knowledge. Please leave a comment to let me know what you think about it! Share it to your friends and learn new things together.
Transcript
Mechanics and Physics of Porous Solids (MPPS) - A tribute to Prof. Olivier Coussy
EVOLUTION OF PORTLAND CEMENT MECHANICALPROPERTIES EXPOSED TO CO2-RICH FLUIDS:
INVESTIGATION AT DIFFERENT SCALES
B. LECAMPION∗, J. VANZO†, F.J. ULM†, B. HUET∗∗, C. GERMAY�,I. KHALFALLAH∗∗, J. DIRRENBERGER∗∗
∗ Schlumberger Doll ResearchOne Hampshire Street
Cambridge, MA 02139,USAe-mail: [email protected]
† Dept. of Civil & Environmental EngineeringMassachussets Institute of Technology,
77 Massachusetts AvenueCambridge, MA 02139, USA
∗∗ Schlumberger Riboud Product Center1 rue Henri BecquerelClamart 92142, France
� Epslog S.A.Bat. PIMW, Bvd de Colonster 4/P56
Liege 4000, Belgium
Key words: Cement Carbonation, Scratch tests, Nano-indentation grid technique, Chem-ical analysis, Micro-poroelasticity, CO2 storage
Abstract. Macroscopic scratch tests and nano-indentation grid tests on carbonatedPortland cement pastes are reported. A chemical analysis (Electron Probe Micro Analysis)is also briefly presented. The scratch tests probe the macroscopic evolution of the materialfailure properties between the un-reacted and carbonated parts of the samples, whilegrid of nano-indentation tests investigate the material evolution at a smaller scale. Theresults are put in perspective via a micro-poroelastic analysis. The material becomesstiffer and stronger macroscopically with carbonation while a large re-organization of themicrostructure takes place at small scale.
1 MOTIVATIONS
The interest in carbon dioxide (CO2) geological storage as well as enhanced-oil recoveryapplications via CO2 injection has grown steadily in recent years. The sealing proper-
1
B. Lecampion et al.
ties of wells -both injectors, producers and abandoned- during the life-span of a projectis a critical factor for performance and risk assessments. Portland cement - the sealingcomponents of oil wells- is known to react when exposed to CO2. This is also a matterof concern in civil engineering with respect to armature corrosion due to atmosphericcarbonation. In deep cemented wells, fluid composition, temperature and pressure aredifferent from atmospheric conditions although the main mechanisms of carbonation re-main similar and may ultimately endanger the sealing properties of the cemented annulusbetween the formation and the steel casing [1]. Cement carbonation via CO2 exposure canbe roughly split in the following stages. First, CO2 dissolves in water forming carbonicacid (dissociation) which then reacts with Portlandite (CH) to form calcite. It also reactswith Calcium-Silicate Hydrates (C-S-H) forming calcite and silica gel:
Ca(OH)2 + CO2 → CaCO3 +H2O (1)
CaOx.SiO2.nH2O + xCO2 → xCaCO3 + SiO2 + nH2O (2)
CaCO3 + CO2 +H2O → Ca2+ + 2HCO−3 (3)
For any fugacity of CO2, the Gibbs free energy of reactions 1 and 2 is negative and hydratescarbonation proceeds completely until depletion of one of the reactant. After depletionof cement hydrates, i.e. for an excess of CO2 with respect to hydrates, the solubility ofcarbonates is increased (reaction 3) therefore allowing for some significant calcium masstransfer. Finally, for an excess of water with respect to cement hydrates and CO2, calciumis leached out of the system and calcite dissolution is complete. Previous publications havethus referred to a carbonation stage and a dissolution stage. The first stage was mainlyobserved in the high pressure and high temperature closed system experiments [2], [1] anda dissolution stage with no leaching was also suggested in the latter conditions for longtime of exposure (beyond 3 months) [3]. The second stage including calcium leaching wasobserved for open system experiments, i.e for infinite supply of water and CO2, at roomtemperature and pressure [4] (see [5] for a review).
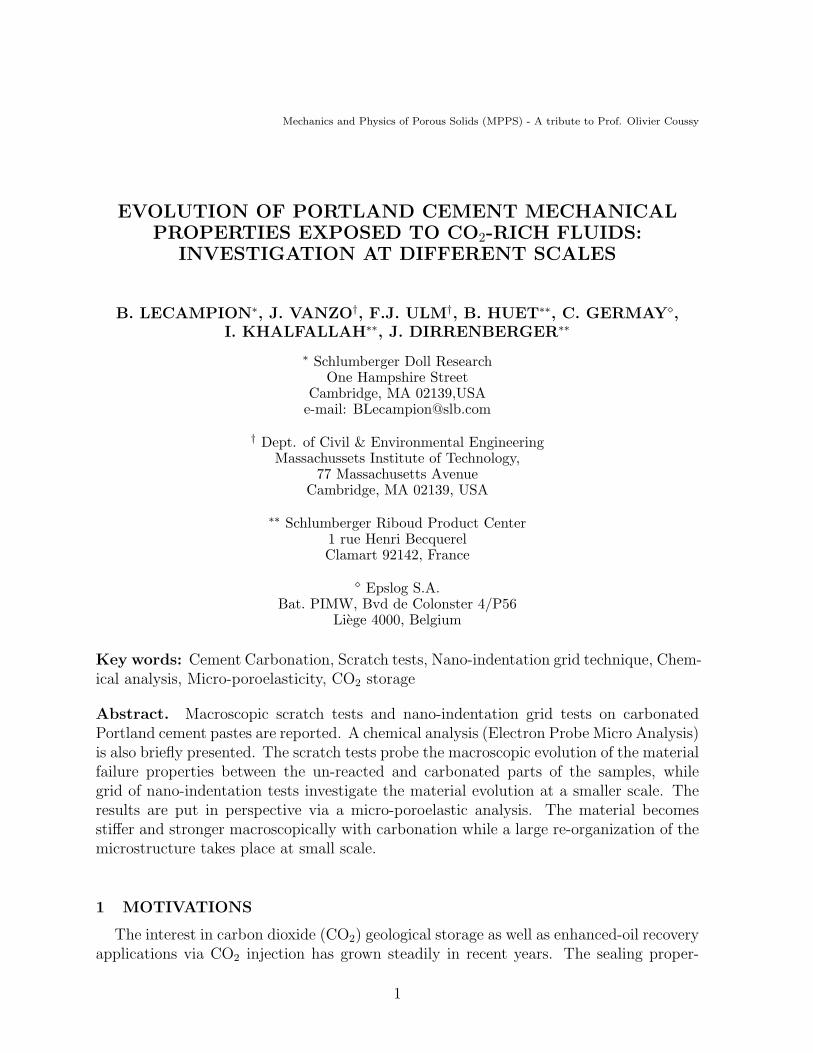
In this paper, we restrict to relatively short CO2 exposure of samples carbonated athigh pressure and temperature in closed systems (i.e. no ”leaching”) and focus on theevolution of mechanical properties of the material. The carbonated samples (see Fig. 1)clearly exhibits inhomogeneities which prohibit the quantitative analysis of conventionalmechanical tests such as uniaxial compression. Inhomogeneities of mechanical propertiesin a cylindrical core under tri-axial compression imply a non-uniform state of stress andstrain. The ”macroscopic” values of elastic and strength properties obtained from suchconventional tests therefore integrate all the inhomogeneities (size, structure of the car-bonated zones and properties). The values obtained can not be extrapolated to a differentgeometry, providing therefore little value for practical applications. In order to properlyinvestigate the evolution of the mechanical properties associated with chemical changes inthe cement paste, an approach based on finer experimental tests, sampling only particu-lar zones (unreacted, carbonated rim etc.), is investigated. Repetitive scratch tests of the
2
B. Lecampion et al.
Figure 1: Cement cores cut in half after CO2 exposure for two distinct durations (top: wet super-criticalCO2, bottom: CO2-saturated with water), the carbonated rims are clearly visible.
surface of the core are performed in order to reveal the evolution of failure properties ata scale of about a millimeter. Nano-indentation grid tests are also performed on differentzones of the exposed sample. This experimental technique samples a smaller lengthscaleof the material (few tenth of micrometers), and is well suited to probe the C-S-H matrixmechanical properties in the unreacted and carbonated zones of a sample. Some chemicalanalyses are also reported. The results are put in perspective via a micro-poroelasticanalysis.
2 MATERIALS AND CARBONATION
2.1 Materials
The material used for this study is an oil-field class G cement paste with a slurrydensity of 1.89g/cm3, which corresponds to a water-to-cement ratio of 0.45. Class Gcement is a classic blend used in the cementing of oil-wells and is very similar to CEMI system but slightly coarser [6]. The cement slurry is prepared according to ISO/APIspecifications [6], cured in cubic molds for 72 hours at a temperature of 90◦C and apressure of 28MPa. This particular cement is exactly similar to the one used in [3, 7].The large characterization of the behavior of this system with respect to CO2 exposurealready reported in several publications will be completed here by a detailed investigationof its mechanical properties.
An investigation of the cement mineralogy via XRD has been performed on a unreacted
3
B. Lecampion et al.
UCS direct 43± 2 MPaYoung’s Modulus 16.4 GPa [7]Poisson’s ratio ν 0.24 [7]
frupt 63MPa @ 30MPa of Confinement [7]
Table 1: Mechanical properties of the unreacted material obtained from conventional tests. frupt denotesthe failure load for a given confining pressure.
sample. A quantitative analysis (Rietveld method) allows to estimate the composition (seeTable 2) in terms of the weight ratio of the constituents of a dry ”powder” of the hydratedpaste (i.e dry cement minus its porosity). From these results and the knowledge of thedensity of the cement slurry ρs = 1.89SG, it is possible to obtain an estimate of the overallporosity φ of the hydrated material as: ρs = φρw + (1 − φ)ρpowder, where ρw and ρpowder
denotes respectively the density of water and of the dry powder of hydrated cement. Thedensity of the dry powder of hydrated cement can also be estimated from the XRD results:1/ρpowder =
∑j Wj/ρj where Wj denotes the mass fraction of components j of density ρj
in the dry powder. We finally obtain a value of total porosity of 33%, which is in closeagreement with the value obtained from MIP on the same material [3]. Finally, Table1 summarizes the mechanical properties obtained from conventional tests (uniaxial andtriaxial tests) on the initial material. These properties are in the usual range for such acement mix.
Components Density (SG) Weight fraction Wj (%)C4AF 3.76 16.38Quartz 2.62 1.21Calcite 2.71 2.65
Portlandite 2.25 31.89Ettringite 1.8 5.72Katoite 2.76 9.15
Amorphous content (C-S-H) 2.03 33
Table 2: Quantitative XRD estimates of the weight fraction of the different mineralogical component ofa dry powder of hydrated cement.
2.2 CO2 exposure
The cured cubic molds were either cored in order to obtain small diameters cylinders(1.25 and 2.5 cm) or left as such for some initial tests. Table 3 summarizes the five classof samples used throughout this study depending on their exposition to CO2. A set of 20samples (6 samples of 1.25 cm diameter and 14 samples of 2.5 cm diameter) was placed ina CO2 reactor at constant Temperature (90◦C) and pressure (28MPa) for either 4 days
4
B. Lecampion et al.
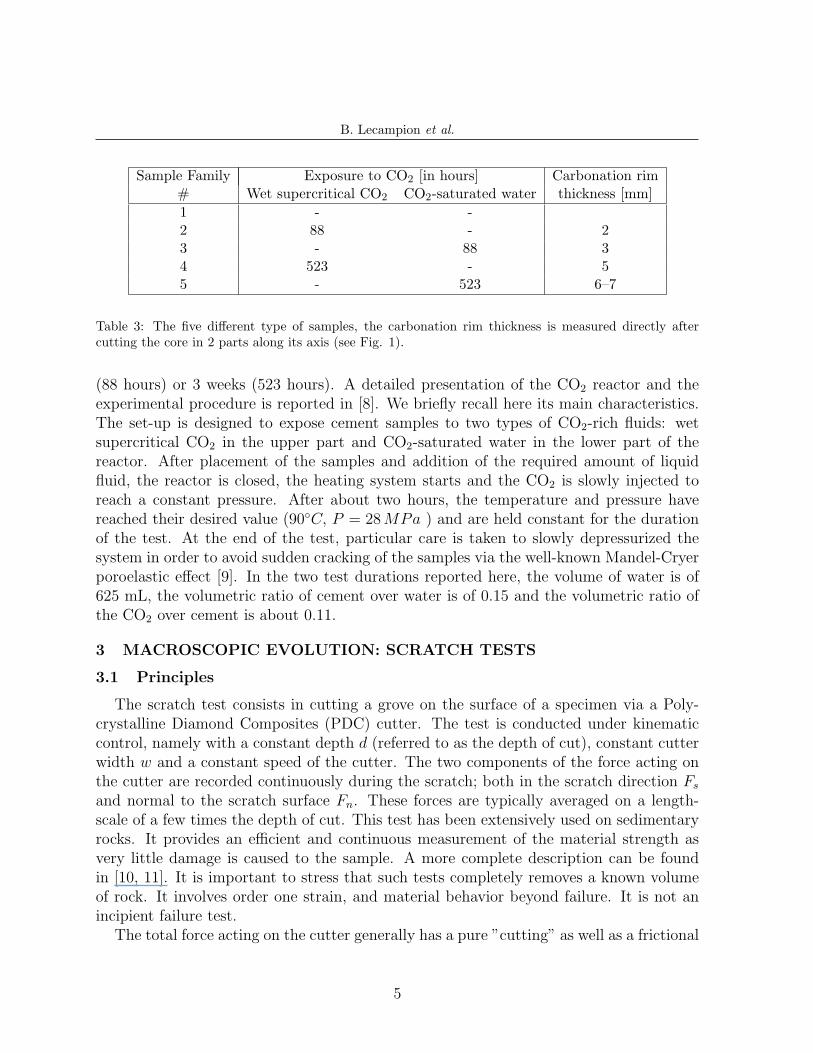
Sample Family Exposure to CO2 [in hours] Carbonation rim# Wet supercritical CO2 CO2-saturated water thickness [mm]1 - -2 88 - 23 - 88 34 523 - 55 - 523 6–7
Table 3: The five different type of samples, the carbonation rim thickness is measured directly aftercutting the core in 2 parts along its axis (see Fig. 1).
(88 hours) or 3 weeks (523 hours). A detailed presentation of the CO2 reactor and theexperimental procedure is reported in [8]. We briefly recall here its main characteristics.The set-up is designed to expose cement samples to two types of CO2-rich fluids: wetsupercritical CO2 in the upper part and CO2-saturated water in the lower part of thereactor. After placement of the samples and addition of the required amount of liquidfluid, the reactor is closed, the heating system starts and the CO2 is slowly injected toreach a constant pressure. After about two hours, the temperature and pressure havereached their desired value (90◦C, P = 28MPa ) and are held constant for the durationof the test. At the end of the test, particular care is taken to slowly depressurized thesystem in order to avoid sudden cracking of the samples via the well-known Mandel-Cryerporoelastic effect [9]. In the two test durations reported here, the volume of water is of625 mL, the volumetric ratio of cement over water is of 0.15 and the volumetric ratio ofthe CO2 over cement is about 0.11.
3 MACROSCOPIC EVOLUTION: SCRATCH TESTS
3.1 Principles
The scratch test consists in cutting a grove on the surface of a specimen via a Poly-crystalline Diamond Composites (PDC) cutter. The test is conducted under kinematiccontrol, namely with a constant depth d (referred to as the depth of cut), constant cutterwidth w and a constant speed of the cutter. The two components of the force acting onthe cutter are recorded continuously during the scratch; both in the scratch direction Fs
and normal to the scratch surface Fn. These forces are typically averaged on a length-scale of a few times the depth of cut. This test has been extensively used on sedimentaryrocks. It provides an efficient and continuous measurement of the material strength asvery little damage is caused to the sample. A more complete description can be foundin [10, 11]. It is important to stress that such tests completely removes a known volumeof rock. It involves order one strain, and material behavior beyond failure. It is not anincipient failure test.
The total force acting on the cutter generally has a pure ”cutting” as well as a frictional
5
B. Lecampion et al.
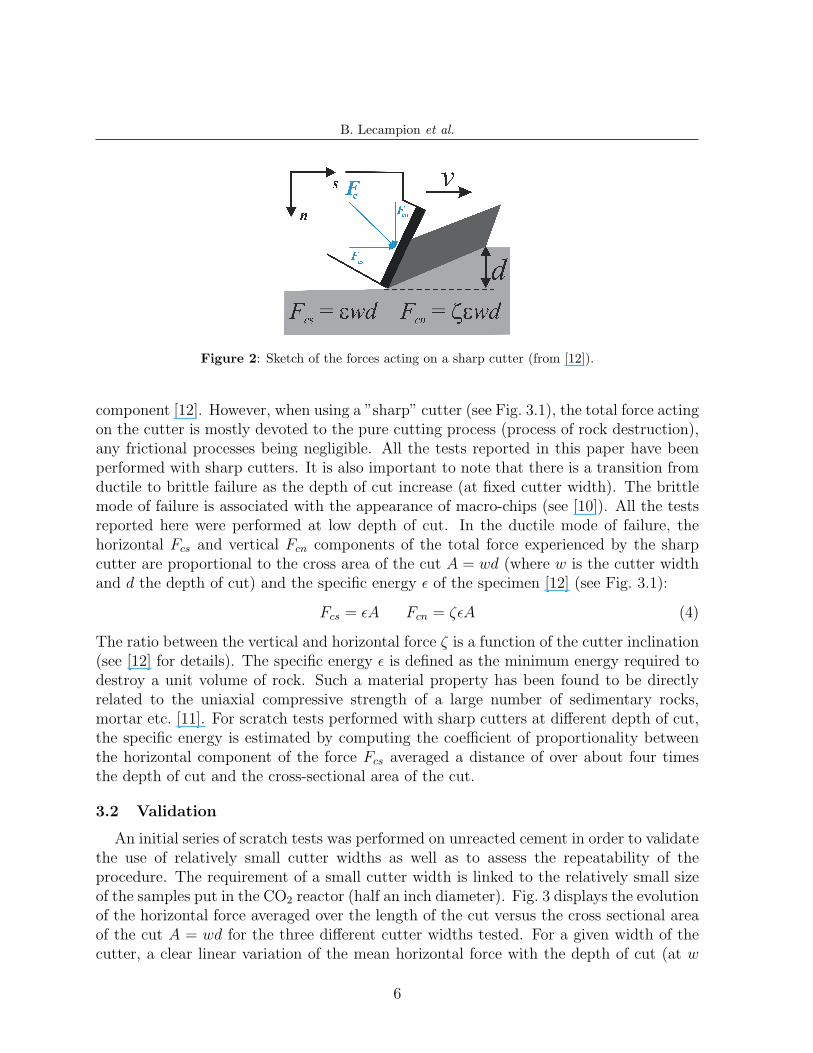
Figure 2: Sketch of the forces acting on a sharp cutter (from [12]).
component [12]. However, when using a ”sharp” cutter (see Fig. 3.1), the total force actingon the cutter is mostly devoted to the pure cutting process (process of rock destruction),any frictional processes being negligible. All the tests reported in this paper have beenperformed with sharp cutters. It is also important to note that there is a transition fromductile to brittle failure as the depth of cut increase (at fixed cutter width). The brittlemode of failure is associated with the appearance of macro-chips (see [10]). All the testsreported here were performed at low depth of cut. In the ductile mode of failure, thehorizontal Fcs and vertical Fcn components of the total force experienced by the sharpcutter are proportional to the cross area of the cut A = wd (where w is the cutter widthand d the depth of cut) and the specific energy ε of the specimen [12] (see Fig. 3.1):
Fcs = εA Fcn = ζεA (4)
The ratio between the vertical and horizontal force ζ is a function of the cutter inclination(see [12] for details). The specific energy ε is defined as the minimum energy required todestroy a unit volume of rock. Such a material property has been found to be directlyrelated to the uniaxial compressive strength of a large number of sedimentary rocks,mortar etc. [11]. For scratch tests performed with sharp cutters at different depth of cut,the specific energy is estimated by computing the coefficient of proportionality betweenthe horizontal component of the force Fcs averaged a distance of over about four timesthe depth of cut and the cross-sectional area of the cut.
3.2 Validation
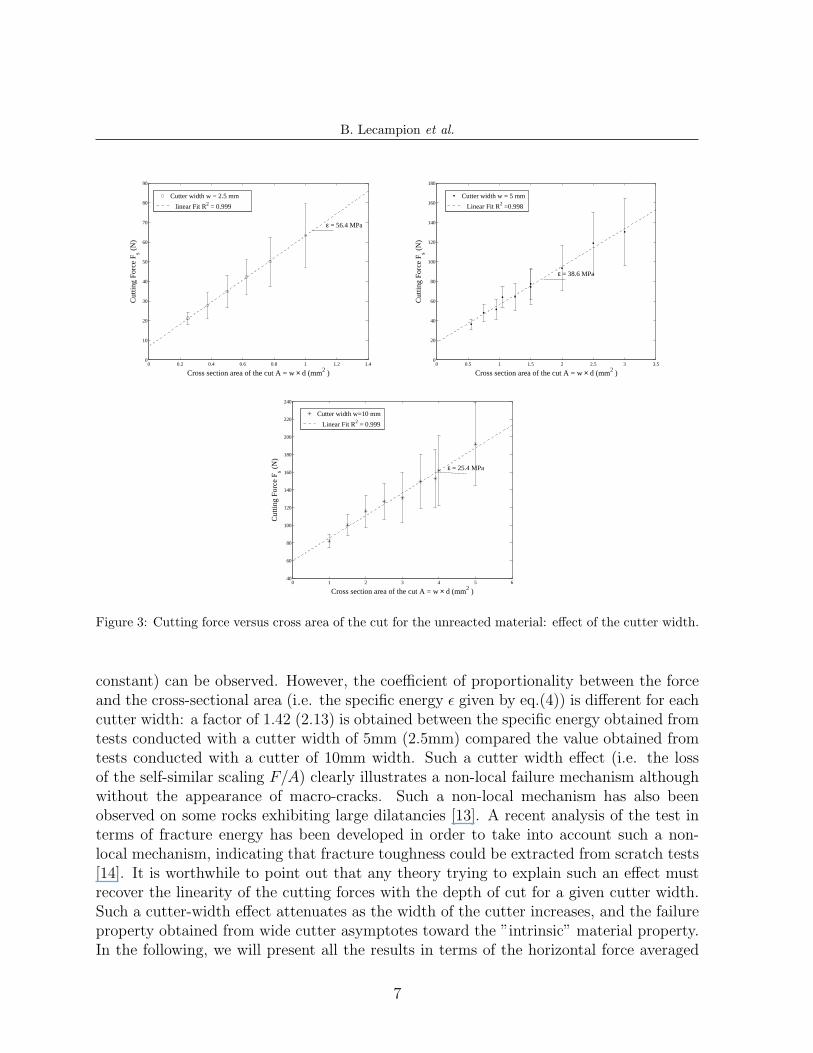
An initial series of scratch tests was performed on unreacted cement in order to validatethe use of relatively small cutter widths as well as to assess the repeatability of theprocedure. The requirement of a small cutter width is linked to the relatively small sizeof the samples put in the CO2 reactor (half an inch diameter). Fig. 3 displays the evolutionof the horizontal force averaged over the length of the cut versus the cross sectional areaof the cut A = wd for the three different cutter widths tested. For a given width of thecutter, a clear linear variation of the mean horizontal force with the depth of cut (at w
6
B. Lecampion et al.
0 0.2 0.4 0.6 0.8 1 1.2 1.40
10
20
30
40
50
60
70
80
90
Cross section area of the cut A = w × d (mm2 )
Cut
ting
Forc
e F s (
N)
Cutter width w = 2.5 mm
linear Fit R2 = 0.999
ε = 56.4 MPa
0 0.5 1 1.5 2 2.5 3 3.50
20
40
60
80
100
120
140
160
180
Cross section area of the cut A = w × d (mm2 )
Cut
ting
Forc
e F s (
N)
Cutter width w = 5 mm
Linear Fit R2 =0.998
ε = 38.6 MPa
0 1 2 3 4 5 640
60
80
100
120
140
160
180
200
220
240
Cross section area of the cut A = w × d (mm2 )
Cut
ting
Forc
e F s (
N)
Cutter width w=10 mm
Linear Fit R2 = 0.999
ε = 25.4 MPa
Figure 3: Cutting force versus cross area of the cut for the unreacted material: effect of the cutter width.
constant) can be observed. However, the coefficient of proportionality between the forceand the cross-sectional area (i.e. the specific energy ε given by eq.(4)) is different for eachcutter width: a factor of 1.42 (2.13) is obtained between the specific energy obtained fromtests conducted with a cutter width of 5mm (2.5mm) compared the value obtained fromtests conducted with a cutter of 10mm width. Such a cutter width effect (i.e. the lossof the self-similar scaling F/A) clearly illustrates a non-local failure mechanism althoughwithout the appearance of macro-cracks. Such a non-local mechanism has also beenobserved on some rocks exhibiting large dilatancies [13]. A recent analysis of the test interms of fracture energy has been developed in order to take into account such a non-local mechanism, indicating that fracture toughness could be extracted from scratch tests[14]. It is worthwhile to point out that any theory trying to explain such an effect mustrecover the linearity of the cutting forces with the depth of cut for a given cutter width.Such a cutter-width effect attenuates as the width of the cutter increases, and the failureproperty obtained from wide cutter asymptotes toward the ”intrinsic” material property.In the following, we will present all the results in terms of the horizontal force averaged
7
B. Lecampion et al.
0 1 2 3 4 5 60
20
40
60
80
100
120
140
Depth from the core surface (mm)M
ean
hori
zont
al f
orce
(N
)
Cutter width w=10mmCutter width w=5mmCutter width w=2.5mm
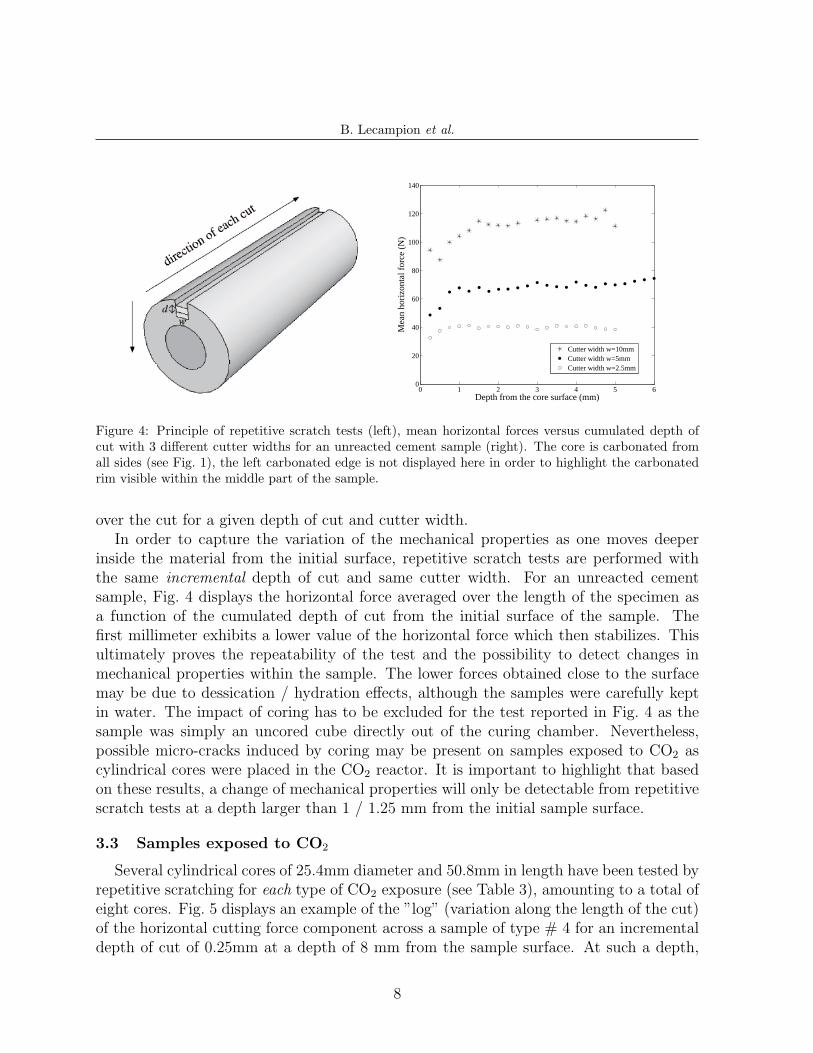
Figure 4: Principle of repetitive scratch tests (left), mean horizontal forces versus cumulated depth ofcut with 3 different cutter widths for an unreacted cement sample (right). The core is carbonated fromall sides (see Fig. 1), the left carbonated edge is not displayed here in order to highlight the carbonatedrim visible within the middle part of the sample.
over the cut for a given depth of cut and cutter width.In order to capture the variation of the mechanical properties as one moves deeper
inside the material from the initial surface, repetitive scratch tests are performed withthe same incremental depth of cut and same cutter width. For an unreacted cementsample, Fig. 4 displays the horizontal force averaged over the length of the specimen asa function of the cumulated depth of cut from the initial surface of the sample. Thefirst millimeter exhibits a lower value of the horizontal force which then stabilizes. Thisultimately proves the repeatability of the test and the possibility to detect changes inmechanical properties within the sample. The lower forces obtained close to the surfacemay be due to dessication / hydration effects, although the samples were carefully keptin water. The impact of coring has to be excluded for the test reported in Fig. 4 as thesample was simply an uncored cube directly out of the curing chamber. Nevertheless,possible micro-cracks induced by coring may be present on samples exposed to CO2 ascylindrical cores were placed in the CO2 reactor. It is important to highlight that basedon these results, a change of mechanical properties will only be detectable from repetitivescratch tests at a depth larger than 1 / 1.25 mm from the initial sample surface.
3.3 Samples exposed to CO2
Several cylindrical cores of 25.4mm diameter and 50.8mm in length have been tested byrepetitive scratching for each type of CO2 exposure (see Table 3), amounting to a total ofeight cores. Fig. 5 displays an example of the ”log” (variation along the length of the cut)of the horizontal cutting force component across a sample of type # 4 for an incrementaldepth of cut of 0.25mm at a depth of 8 mm from the sample surface. At such a depth,
8
B. Lecampion et al.
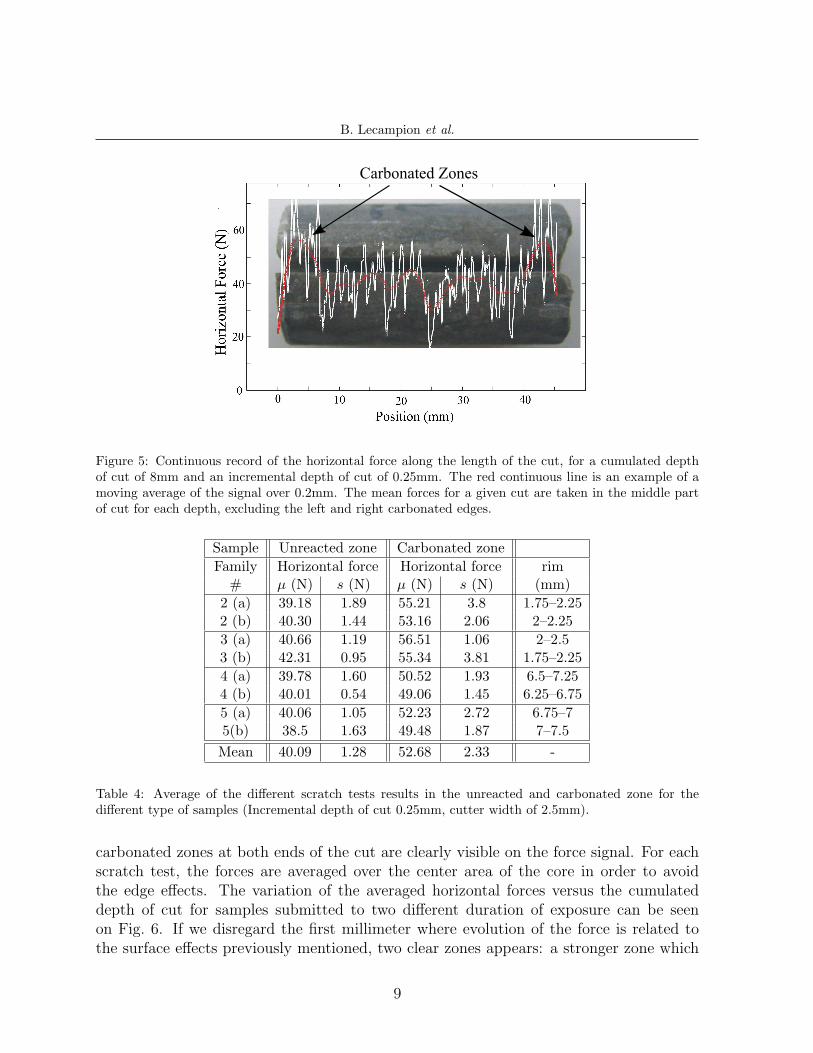
Figure 5: Continuous record of the horizontal force along the length of the cut, for a cumulated depthof cut of 8mm and an incremental depth of cut of 0.25mm. The red continuous line is an example of amoving average of the signal over 0.2mm. The mean forces for a given cut are taken in the middle partof cut for each depth, excluding the left and right carbonated edges.
Sample Unreacted zone Carbonated zoneFamily Horizontal force Horizontal force rim
# µ (N) s (N) µ (N) s (N) (mm)2 (a) 39.18 1.89 55.21 3.8 1.75–2.252 (b) 40.30 1.44 53.16 2.06 2–2.253 (a) 40.66 1.19 56.51 1.06 2–2.53 (b) 42.31 0.95 55.34 3.81 1.75–2.254 (a) 39.78 1.60 50.52 1.93 6.5–7.254 (b) 40.01 0.54 49.06 1.45 6.25–6.755 (a) 40.06 1.05 52.23 2.72 6.75–75(b) 38.5 1.63 49.48 1.87 7–7.5
Mean 40.09 1.28 52.68 2.33 -
Table 4: Average of the different scratch tests results in the unreacted and carbonated zone for thedifferent type of samples (Incremental depth of cut 0.25mm, cutter width of 2.5mm).
carbonated zones at both ends of the cut are clearly visible on the force signal. For eachscratch test, the forces are averaged over the center area of the core in order to avoidthe edge effects. The variation of the averaged horizontal forces versus the cumulateddepth of cut for samples submitted to two different duration of exposure can be seenon Fig. 6. If we disregard the first millimeter where evolution of the force is related tothe surface effects previously mentioned, two clear zones appears: a stronger zone which
9
B. Lecampion et al.
0 0.5 1 1.5 2 2.5 3 3.5 415
20
25
30
35
40
45
50
55
60
Depth from the core surface (mm)
Mea
n ho
rizo
ntal
for
ce (
N)
Carbonated
Unreacted
0 1 2 3 4 5 6 7 830
35
40
45
50
55
Depth from the core surface (mm)
Mea
n ho
rizo
ntal
for
ce (
N)
Carbonated
Unreacted
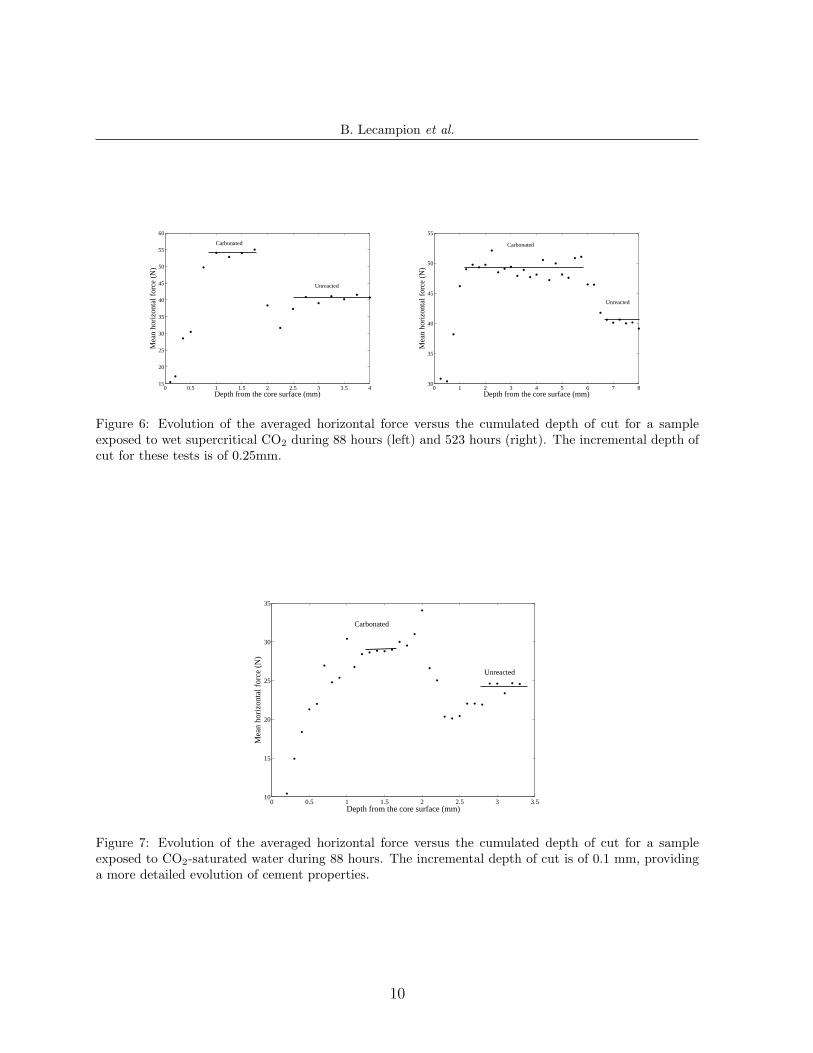
Figure 6: Evolution of the averaged horizontal force versus the cumulated depth of cut for a sampleexposed to wet supercritical CO2 during 88 hours (left) and 523 hours (right). The incremental depth ofcut for these tests is of 0.25mm.
0 0.5 1 1.5 2 2.5 3 3.510
15
20
25
30
35
Depth from the core surface (mm)
Mea
n ho
rizo
ntal
for
ce (
N)
Unreacted
Carbonated
Figure 7: Evolution of the averaged horizontal force versus the cumulated depth of cut for a sampleexposed to CO2-saturated water during 88 hours. The incremental depth of cut is of 0.1 mm, providinga more detailed evolution of cement properties.
10
B. Lecampion et al.
0.2 0.3 0.4 0.5 0.6 0.7 0.8 0.9 110
20
30
40
50
60
70
80
90
100
Cross section area of the cut A = w × d (mm2 )
Cut
ting
forc
e F s (
N)
Cutter width = 2.5 mm
Linear Fit R2 = 0.984
ε = 88.25 MPa
0 0.2 0.4 0.6 0.8 1 1.2 1.4 1.6 1.8 20
20
40
60
80
100
120
Cross section area of the cut A = w × d (mm2 )
Cut
ting
forc
e F s (
N)
Cutter width = 5 mm
Linear Fit R2 = 0.989
ε = 48.8 MPa
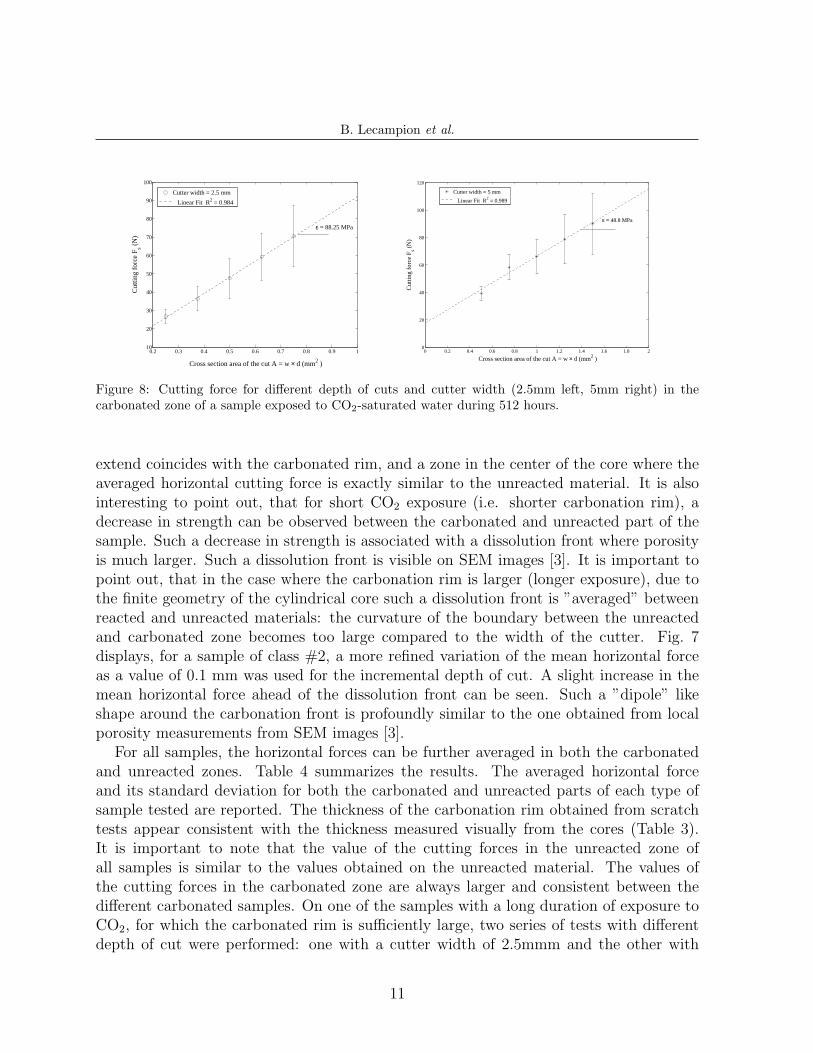
Figure 8: Cutting force for different depth of cuts and cutter width (2.5mm left, 5mm right) in thecarbonated zone of a sample exposed to CO2-saturated water during 512 hours.
extend coincides with the carbonated rim, and a zone in the center of the core where theaveraged horizontal cutting force is exactly similar to the unreacted material. It is alsointeresting to point out, that for short CO2 exposure (i.e. shorter carbonation rim), adecrease in strength can be observed between the carbonated and unreacted part of thesample. Such a decrease in strength is associated with a dissolution front where porosityis much larger. Such a dissolution front is visible on SEM images [3]. It is important topoint out, that in the case where the carbonation rim is larger (longer exposure), due tothe finite geometry of the cylindrical core such a dissolution front is ”averaged” betweenreacted and unreacted materials: the curvature of the boundary between the unreactedand carbonated zone becomes too large compared to the width of the cutter. Fig. 7displays, for a sample of class #2, a more refined variation of the mean horizontal forceas a value of 0.1 mm was used for the incremental depth of cut. A slight increase in themean horizontal force ahead of the dissolution front can be seen. Such a ”dipole” likeshape around the carbonation front is profoundly similar to the one obtained from localporosity measurements from SEM images [3].
For all samples, the horizontal forces can be further averaged in both the carbonatedand unreacted zones. Table 4 summarizes the results. The averaged horizontal forceand its standard deviation for both the carbonated and unreacted parts of each type ofsample tested are reported. The thickness of the carbonation rim obtained from scratchtests appear consistent with the thickness measured visually from the cores (Table 3).It is important to note that the value of the cutting forces in the unreacted zone ofall samples is similar to the values obtained on the unreacted material. The values ofthe cutting forces in the carbonated zone are always larger and consistent between thedifferent carbonated samples. On one of the samples with a long duration of exposure toCO2, for which the carbonated rim is sufficiently large, two series of tests with differentdepth of cut were performed: one with a cutter width of 2.5mmm and the other with
11
B. Lecampion et al.
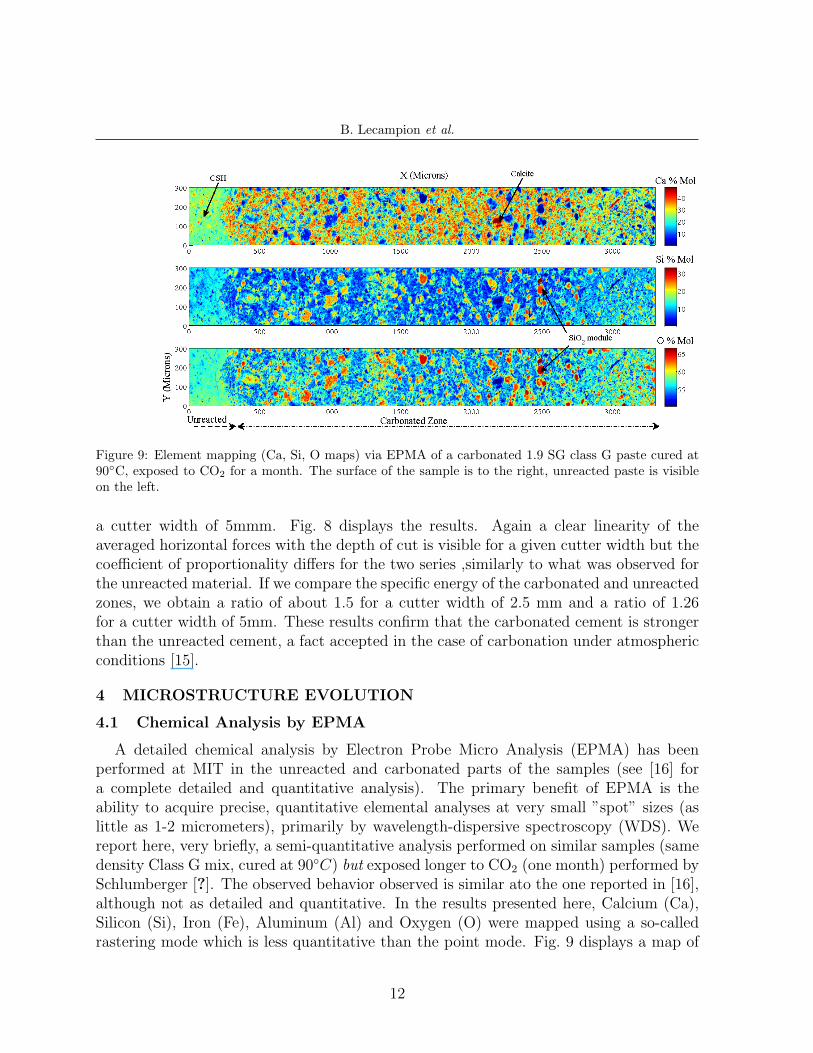
Figure 9: Element mapping (Ca, Si, O maps) via EPMA of a carbonated 1.9 SG class G paste cured at90◦C, exposed to CO2 for a month. The surface of the sample is to the right, unreacted paste is visibleon the left.
a cutter width of 5mmm. Fig. 8 displays the results. Again a clear linearity of theaveraged horizontal forces with the depth of cut is visible for a given cutter width but thecoefficient of proportionality differs for the two series ,similarly to what was observed forthe unreacted material. If we compare the specific energy of the carbonated and unreactedzones, we obtain a ratio of about 1.5 for a cutter width of 2.5 mm and a ratio of 1.26for a cutter width of 5mm. These results confirm that the carbonated cement is strongerthan the unreacted cement, a fact accepted in the case of carbonation under atmosphericconditions [15].
4 MICROSTRUCTURE EVOLUTION
4.1 Chemical Analysis by EPMA
A detailed chemical analysis by Electron Probe Micro Analysis (EPMA) has beenperformed at MIT in the unreacted and carbonated parts of the samples (see [16] fora complete detailed and quantitative analysis). The primary benefit of EPMA is theability to acquire precise, quantitative elemental analyses at very small ”spot” sizes (aslittle as 1-2 micrometers), primarily by wavelength-dispersive spectroscopy (WDS). Wereport here, very briefly, a semi-quantitative analysis performed on similar samples (samedensity Class G mix, cured at 90◦C) but exposed longer to CO2 (one month) performed bySchlumberger [?]. The observed behavior observed is similar ato the one reported in [16],although not as detailed and quantitative. In the results presented here, Calcium (Ca),Silicon (Si), Iron (Fe), Aluminum (Al) and Oxygen (O) were mapped using a so-calledrastering mode which is less quantitative than the point mode. Fig. 9 displays a map of
12
B. Lecampion et al.
0 50 1000
20
40
60
80
100
SiO2
CaO
Unreacted cement
0
100
200
300
0 50 1000
20
40
60
80
100
SiO2
CaO
Carbonated area
0
50
100
150
200
Unreacted cement
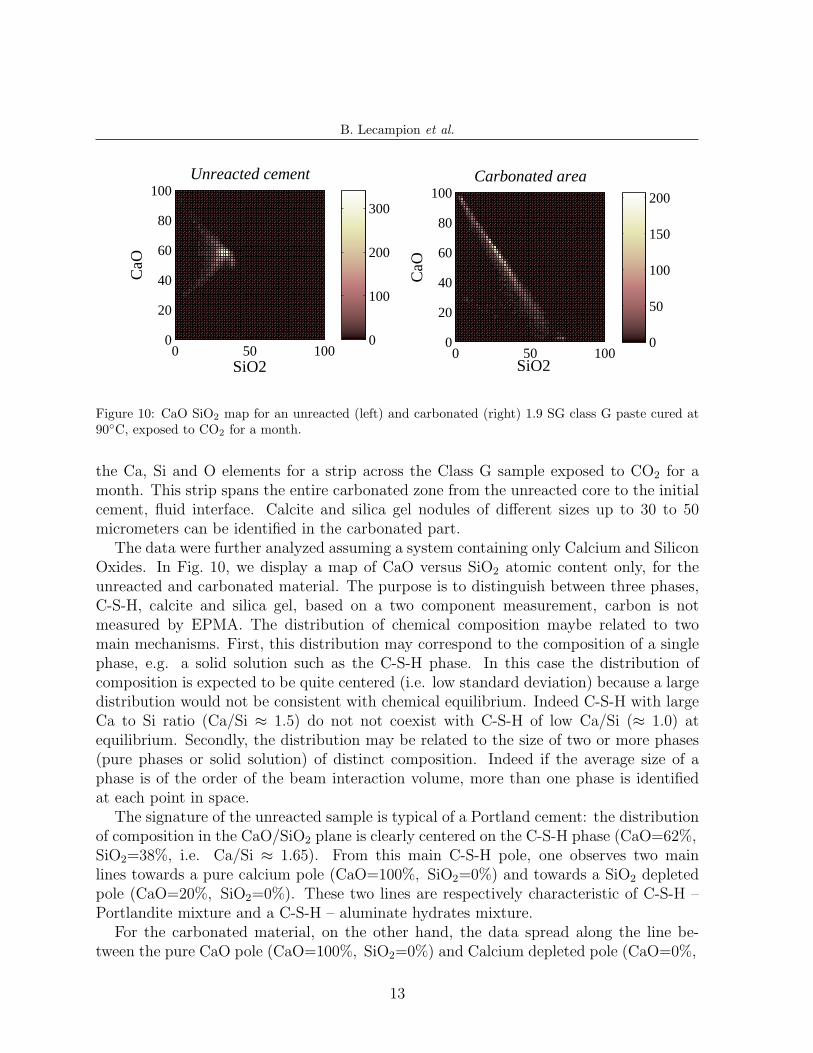
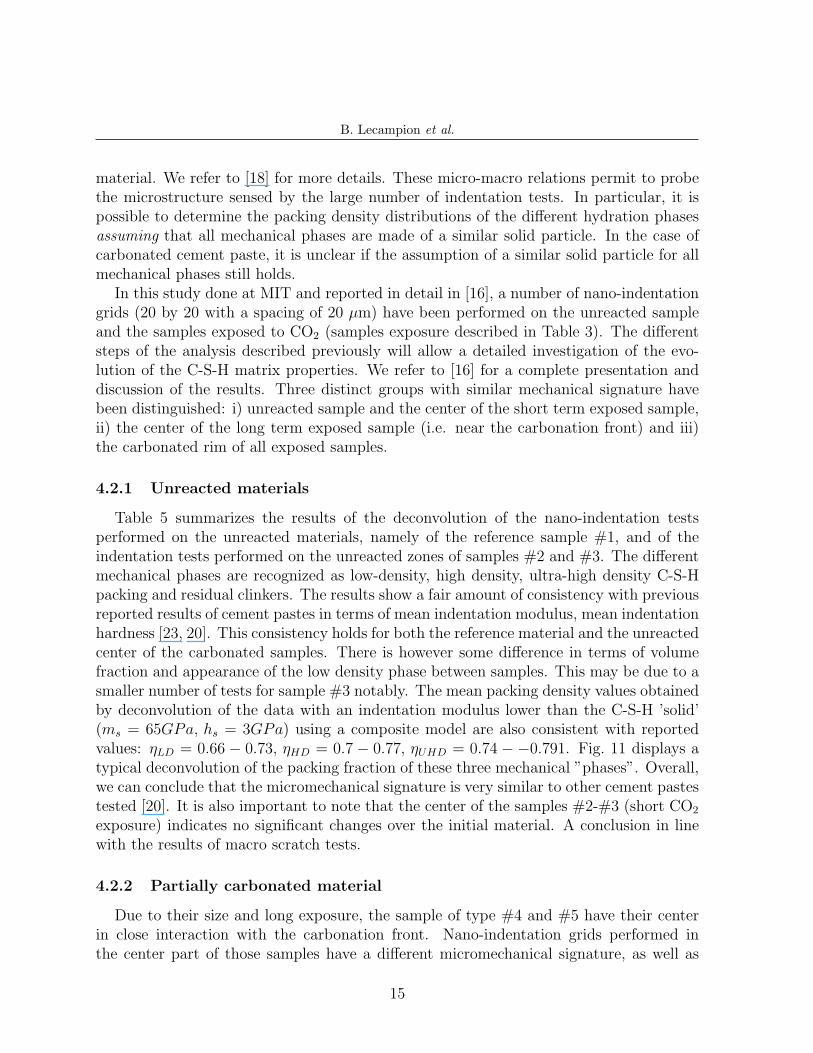
Figure 10: CaO SiO2 map for an unreacted (left) and carbonated (right) 1.9 SG class G paste cured at90◦C, exposed to CO2 for a month.
the Ca, Si and O elements for a strip across the Class G sample exposed to CO2 for amonth. This strip spans the entire carbonated zone from the unreacted core to the initialcement, fluid interface. Calcite and silica gel nodules of different sizes up to 30 to 50micrometers can be identified in the carbonated part.
The data were further analyzed assuming a system containing only Calcium and SiliconOxides. In Fig. 10, we display a map of CaO versus SiO2 atomic content only, for theunreacted and carbonated material. The purpose is to distinguish between three phases,C-S-H, calcite and silica gel, based on a two component measurement, carbon is notmeasured by EPMA. The distribution of chemical composition maybe related to twomain mechanisms. First, this distribution may correspond to the composition of a singlephase, e.g. a solid solution such as the C-S-H phase. In this case the distribution ofcomposition is expected to be quite centered (i.e. low standard deviation) because a largedistribution would not be consistent with chemical equilibrium. Indeed C-S-H with largeCa to Si ratio (Ca/Si ≈ 1.5) do not not coexist with C-S-H of low Ca/Si (≈ 1.0) atequilibrium. Secondly, the distribution may be related to the size of two or more phases(pure phases or solid solution) of distinct composition. Indeed if the average size of aphase is of the order of the beam interaction volume, more than one phase is identifiedat each point in space.
The signature of the unreacted sample is typical of a Portland cement: the distributionof composition in the CaO/SiO2 plane is clearly centered on the C-S-H phase (CaO=62%,SiO2=38%, i.e. Ca/Si ≈ 1.65). From this main C-S-H pole, one observes two mainlines towards a pure calcium pole (CaO=100%, SiO2=0%) and towards a SiO2 depletedpole (CaO=20%, SiO2=0%). These two lines are respectively characteristic of C-S-H –Portlandite mixture and a C-S-H – aluminate hydrates mixture.
For the carbonated material, on the other hand, the data spread along the line be-tween the pure CaO pole (CaO=100%, SiO2=0%) and Calcium depleted pole (CaO=0%,
13
B. Lecampion et al.
SiO2=60%). No clear C-S-H pole is visible anymore. The distribution of compositionaround the pure CaO pole supports the formation of large calcite nodules. This pole cannot be attributed to Portlandite since this pole is absent in the unreacted cement core.Similarly, the distribution of composition around the Calcium depleted pole supports theformation of large pure SiO2 nodule. XRD data of the carbonated zone (not reported here)did not indicate any increase of the Quartz content (or any other crystalline polymorph).Therefore, we suggest that these SiO2 nodules are made of silica gel. For a compositionbetween the initial C-S-H pole and the calcium depleted pole, it is difficult to differentiatebetween the coupled effect of the degree of carbonation, which is equivalent to the degreeof decalcification, and the growth of nodules of calcite and silica gel. However, the largespread of the composition distribution along the latter line, as opposed to being closeto the centered initial distribution, supports an advanced degree of carbonation of thecement hydrates.
The chemical analysis of the carbonated material shows that 1) the carbonated matrixis primarily made of partially decalcified C-S-H, calcite and silica gel, and 2) the char-acteristic length scale of the representative elementary volume is increasing (i.e. a moredisordered material at small scale).
4.2 Nano-indentation campaign
Multiple nano-indentation performed on a grid allows the investigation of complex het-erogeneous material via a statistical analysis of the results [17]. This technique has beenapplied with success to a large number of different cement pastes and has brought newinsight in the mechanical properties of the C-S-H matrix [17]. In order to properly inves-tigate the C-S-H matrix, a large number of indentation tests was performed on samplesof the different type (see Table 3). Each tests are usually spaced at about 20 micrometersapart. All the results can be de-convoluted using an a priori unknown finite number ofphases. The experimental cumulative distribution function (CDF) of the measured inden-tation modulus M and hardness H are fitted by a linear combination of a finite numberof Gaussian CDF corresponding to the number of phases present in the material. Such ananalysis provides an estimation of the number of mechanical phases in the material, themean and variance of the indentation modulus and hardness of each mechanical ”phases”as well as their respective surface fraction. For a randomly organized materials like cementpaste, surface fraction can be assimilated to volume fraction. The first point of interestis of course the difference between the unreacted and carbonated samples with respect todifferent mechanical phases present in the material.
The analysis of the nano-indentation results can also be carried a step further byrecognizing that each indentation modulus and hardness (Mi, Hi) obtained on the gridrepresents a stiffness and strength response of a composite porous material composed ofa solid phase (C-S-H particle) and pore space. Some micromechanical model links theindentation values to the properties of the solid particle (contact stiffness ms = Es/(1−ν2
s )and hardness hs) and the solid packing density η (’one minus porosity’) of the composite
14
B. Lecampion et al.
material. We refer to [18] for more details. These micro-macro relations permit to probethe microstructure sensed by the large number of indentation tests. In particular, it ispossible to determine the packing density distributions of the different hydration phasesassuming that all mechanical phases are made of a similar solid particle. In the case ofcarbonated cement paste, it is unclear if the assumption of a similar solid particle for allmechanical phases still holds.
In this study done at MIT and reported in detail in [16], a number of nano-indentationgrids (20 by 20 with a spacing of 20 µm) have been performed on the unreacted sampleand the samples exposed to CO2 (samples exposure described in Table 3). The differentsteps of the analysis described previously will allow a detailed investigation of the evo-lution of the C-S-H matrix properties. We refer to [16] for a complete presentation anddiscussion of the results. Three distinct groups with similar mechanical signature havebeen distinguished: i) unreacted sample and the center of the short term exposed sample,ii) the center of the long term exposed sample (i.e. near the carbonation front) and iii)the carbonated rim of all exposed samples.
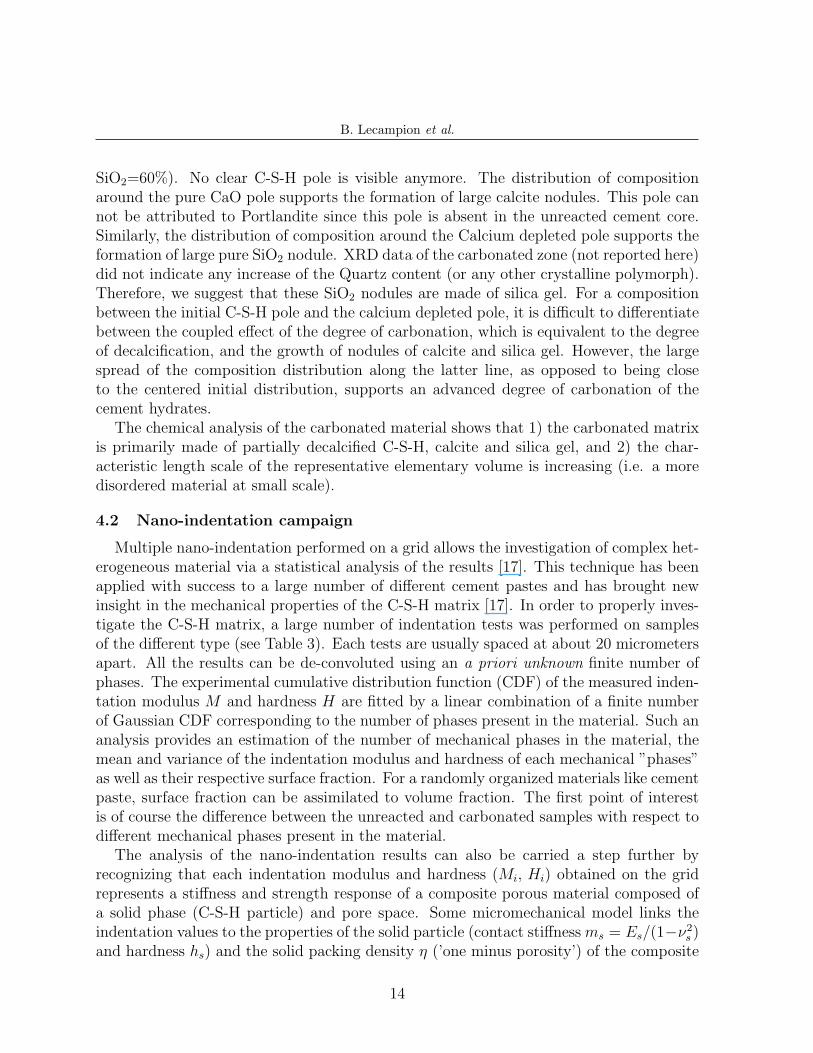
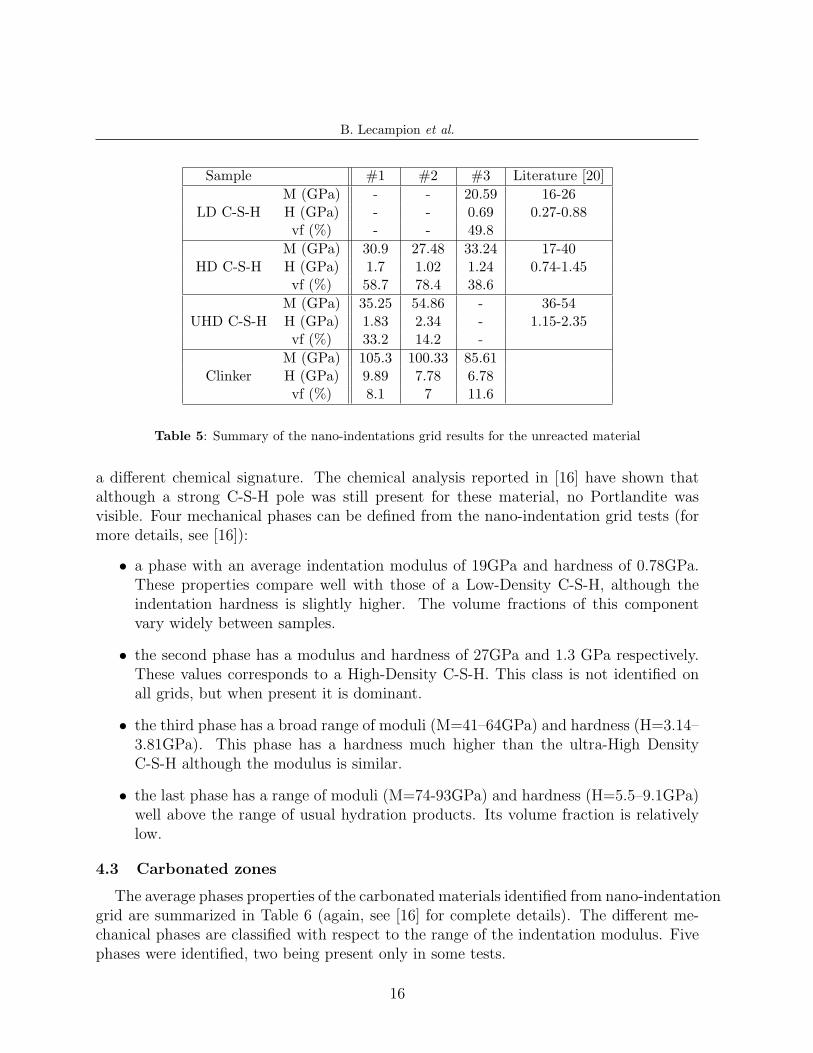
4.2.1 Unreacted materials
Table 5 summarizes the results of the deconvolution of the nano-indentation testsperformed on the unreacted materials, namely of the reference sample #1, and of theindentation tests performed on the unreacted zones of samples #2 and #3. The differentmechanical phases are recognized as low-density, high density, ultra-high density C-S-Hpacking and residual clinkers. The results show a fair amount of consistency with previousreported results of cement pastes in terms of mean indentation modulus, mean indentationhardness [23, 20]. This consistency holds for both the reference material and the unreactedcenter of the carbonated samples. There is however some difference in terms of volumefraction and appearance of the low density phase between samples. This may be due to asmaller number of tests for sample #3 notably. The mean packing density values obtainedby deconvolution of the data with an indentation modulus lower than the C-S-H ’solid’(ms = 65GPa, hs = 3GPa) using a composite model are also consistent with reportedvalues: ηLD = 0.66 − 0.73, ηHD = 0.7 − 0.77, ηUHD = 0.74 − −0.791. Fig. 11 displays atypical deconvolution of the packing fraction of these three mechanical ”phases”. Overall,we can conclude that the micromechanical signature is very similar to other cement pastestested [20]. It is also important to note that the center of the samples #2-#3 (short CO2
exposure) indicates no significant changes over the initial material. A conclusion in linewith the results of macro scratch tests.
4.2.2 Partially carbonated material
Due to their size and long exposure, the sample of type #4 and #5 have their centerin close interaction with the carbonation front. Nano-indentation grids performed inthe center part of those samples have a different micromechanical signature, as well as
15
B. Lecampion et al.
Sample #1 #2 #3 Literature [20]M (GPa) - - 20.59 16-26
LD C-S-H H (GPa) - - 0.69 0.27-0.88vf (%) - - 49.8
M (GPa) 30.9 27.48 33.24 17-40HD C-S-H H (GPa) 1.7 1.02 1.24 0.74-1.45
vf (%) 58.7 78.4 38.6M (GPa) 35.25 54.86 - 36-54
UHD C-S-H H (GPa) 1.83 2.34 - 1.15-2.35vf (%) 33.2 14.2 -
M (GPa) 105.3 100.33 85.61Clinker H (GPa) 9.89 7.78 6.78
vf (%) 8.1 7 11.6
Table 5: Summary of the nano-indentations grid results for the unreacted material
a different chemical signature. The chemical analysis reported in [16] have shown thatalthough a strong C-S-H pole was still present for these material, no Portlandite wasvisible. Four mechanical phases can be defined from the nano-indentation grid tests (formore details, see [16]):
• a phase with an average indentation modulus of 19GPa and hardness of 0.78GPa.These properties compare well with those of a Low-Density C-S-H, although theindentation hardness is slightly higher. The volume fractions of this componentvary widely between samples.
• the second phase has a modulus and hardness of 27GPa and 1.3 GPa respectively.These values corresponds to a High-Density C-S-H. This class is not identified onall grids, but when present it is dominant.
• the third phase has a broad range of moduli (M=41–64GPa) and hardness (H=3.14–3.81GPa). This phase has a hardness much higher than the ultra-High DensityC-S-H although the modulus is similar.
• the last phase has a range of moduli (M=74-93GPa) and hardness (H=5.5–9.1GPa)well above the range of usual hydration products. Its volume fraction is relativelylow.
4.3 Carbonated zones
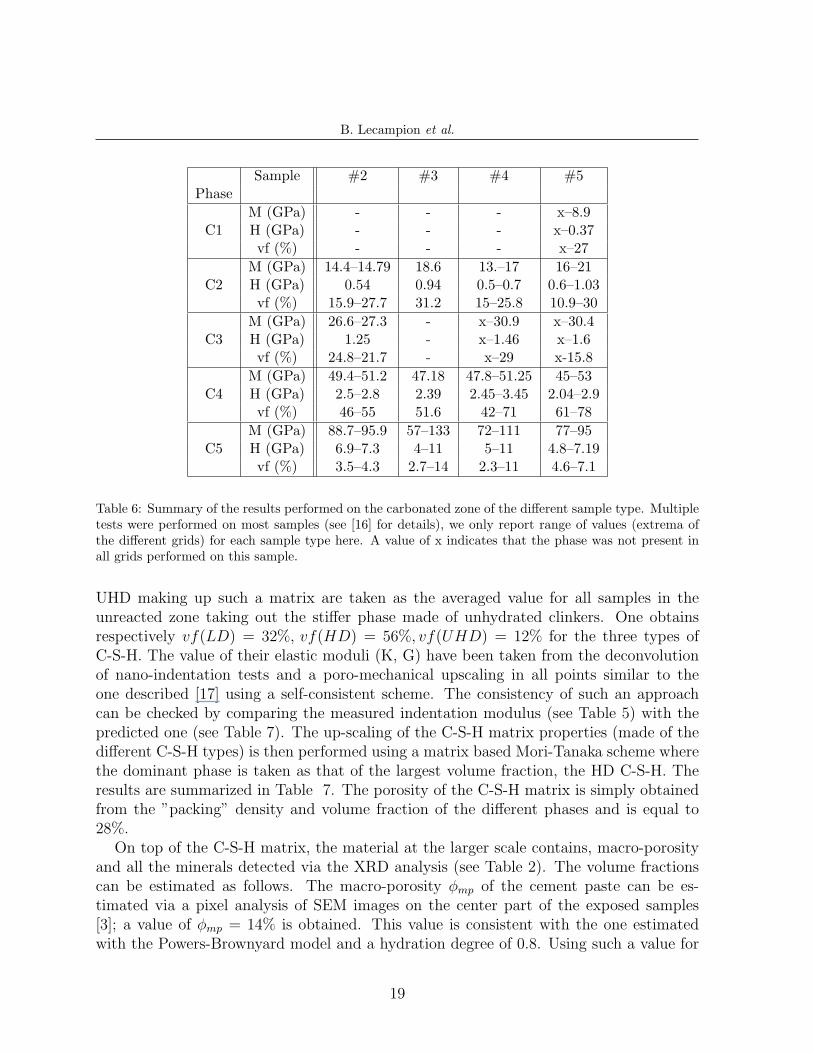
The average phases properties of the carbonated materials identified from nano-indentationgrid are summarized in Table 6 (again, see [16] for complete details). The different me-chanical phases are classified with respect to the range of the indentation modulus. Fivephases were identified, two being present only in some tests.
16
B. Lecampion et al.
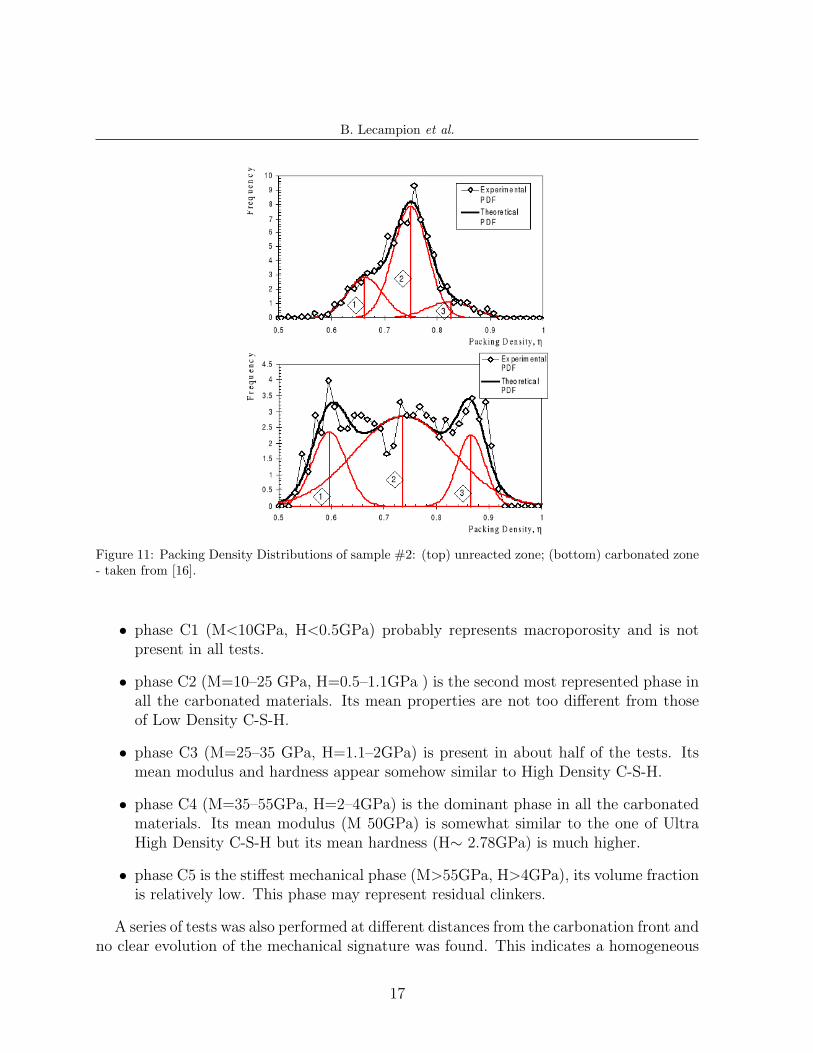
Figure 11: Packing Density Distributions of sample #2: (top) unreacted zone; (bottom) carbonated zone- taken from [16].
• phase C1 (M<10GPa, H<0.5GPa) probably represents macroporosity and is notpresent in all tests.
• phase C2 (M=10–25 GPa, H=0.5–1.1GPa ) is the second most represented phase inall the carbonated materials. Its mean properties are not too different from thoseof Low Density C-S-H.
• phase C3 (M=25–35 GPa, H=1.1–2GPa) is present in about half of the tests. Itsmean modulus and hardness appear somehow similar to High Density C-S-H.
• phase C4 (M=35–55GPa, H=2–4GPa) is the dominant phase in all the carbonatedmaterials. Its mean modulus (M 50GPa) is somewhat similar to the one of UltraHigh Density C-S-H but its mean hardness (H∼ 2.78GPa) is much higher.
• phase C5 is the stiffest mechanical phase (M>55GPa, H>4GPa), its volume fractionis relatively low. This phase may represent residual clinkers.
A series of tests was also performed at different distances from the carbonation front andno clear evolution of the mechanical signature was found. This indicates a homogeneous
17
B. Lecampion et al.
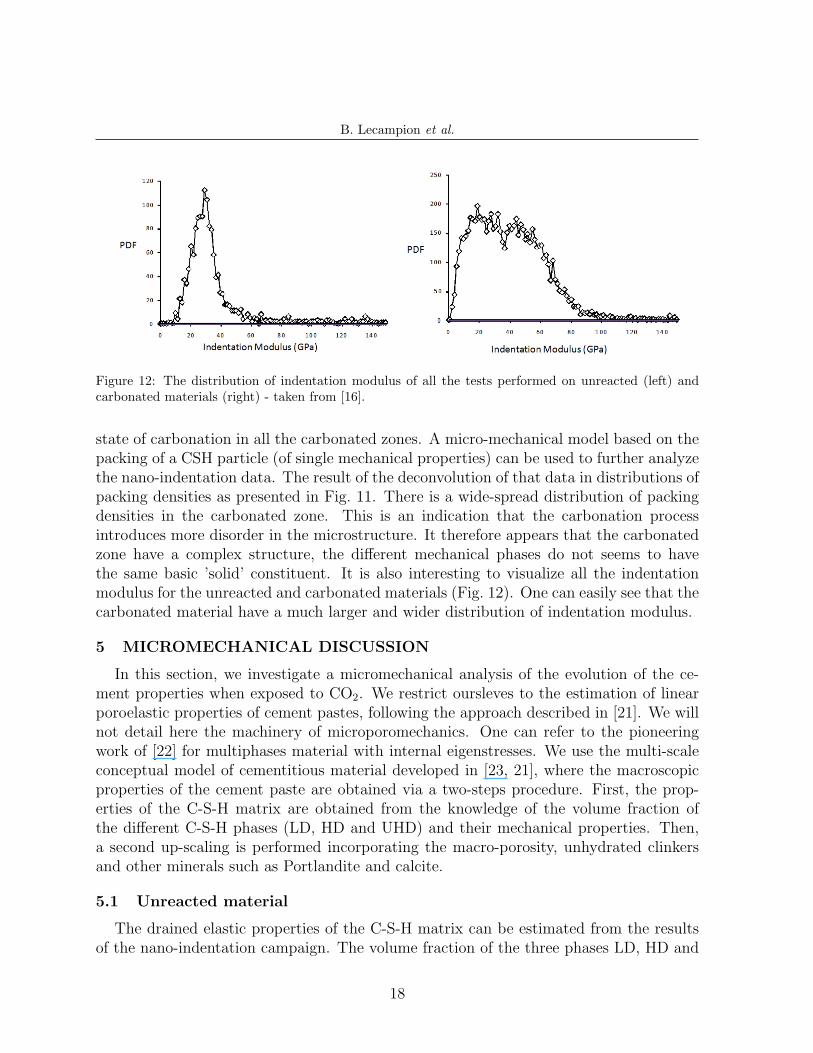
Figure 12: The distribution of indentation modulus of all the tests performed on unreacted (left) andcarbonated materials (right) - taken from [16].
state of carbonation in all the carbonated zones. A micro-mechanical model based on thepacking of a CSH particle (of single mechanical properties) can be used to further analyzethe nano-indentation data. The result of the deconvolution of that data in distributions ofpacking densities as presented in Fig. 11. There is a wide-spread distribution of packingdensities in the carbonated zone. This is an indication that the carbonation processintroduces more disorder in the microstructure. It therefore appears that the carbonatedzone have a complex structure, the different mechanical phases do not seems to havethe same basic ’solid’ constituent. It is also interesting to visualize all the indentationmodulus for the unreacted and carbonated materials (Fig. 12). One can easily see that thecarbonated material have a much larger and wider distribution of indentation modulus.
5 MICROMECHANICAL DISCUSSION
In this section, we investigate a micromechanical analysis of the evolution of the ce-ment properties when exposed to CO2. We restrict oursleves to the estimation of linearporoelastic properties of cement pastes, following the approach described in [21]. We willnot detail here the machinery of microporomechanics. One can refer to the pioneeringwork of [22] for multiphases material with internal eigenstresses. We use the multi-scaleconceptual model of cementitious material developed in [23, 21], where the macroscopicproperties of the cement paste are obtained via a two-steps procedure. First, the prop-erties of the C-S-H matrix are obtained from the knowledge of the volume fraction ofthe different C-S-H phases (LD, HD and UHD) and their mechanical properties. Then,a second up-scaling is performed incorporating the macro-porosity, unhydrated clinkersand other minerals such as Portlandite and calcite.
5.1 Unreacted material
The drained elastic properties of the C-S-H matrix can be estimated from the resultsof the nano-indentation campaign. The volume fraction of the three phases LD, HD and
18
B. Lecampion et al.
Sample #2 #3 #4 #5Phase
M (GPa) - - - x–8.9C1 H (GPa) - - - x–0.37
vf (%) - - - x–27M (GPa) 14.4–14.79 18.6 13.–17 16–21
C2 H (GPa) 0.54 0.94 0.5–0.7 0.6–1.03vf (%) 15.9–27.7 31.2 15–25.8 10.9–30
M (GPa) 26.6–27.3 - x–30.9 x–30.4C3 H (GPa) 1.25 - x–1.46 x–1.6
vf (%) 24.8–21.7 - x–29 x-15.8M (GPa) 49.4–51.2 47.18 47.8–51.25 45–53
C4 H (GPa) 2.5–2.8 2.39 2.45–3.45 2.04–2.9vf (%) 46–55 51.6 42–71 61–78
M (GPa) 88.7–95.9 57–133 72–111 77–95C5 H (GPa) 6.9–7.3 4–11 5–11 4.8–7.19
vf (%) 3.5–4.3 2.7–14 2.3–11 4.6–7.1
Table 6: Summary of the results performed on the carbonated zone of the different sample type. Multipletests were performed on most samples (see [16] for details), we only report range of values (extrema ofthe different grids) for each sample type here. A value of x indicates that the phase was not present inall grids performed on this sample.
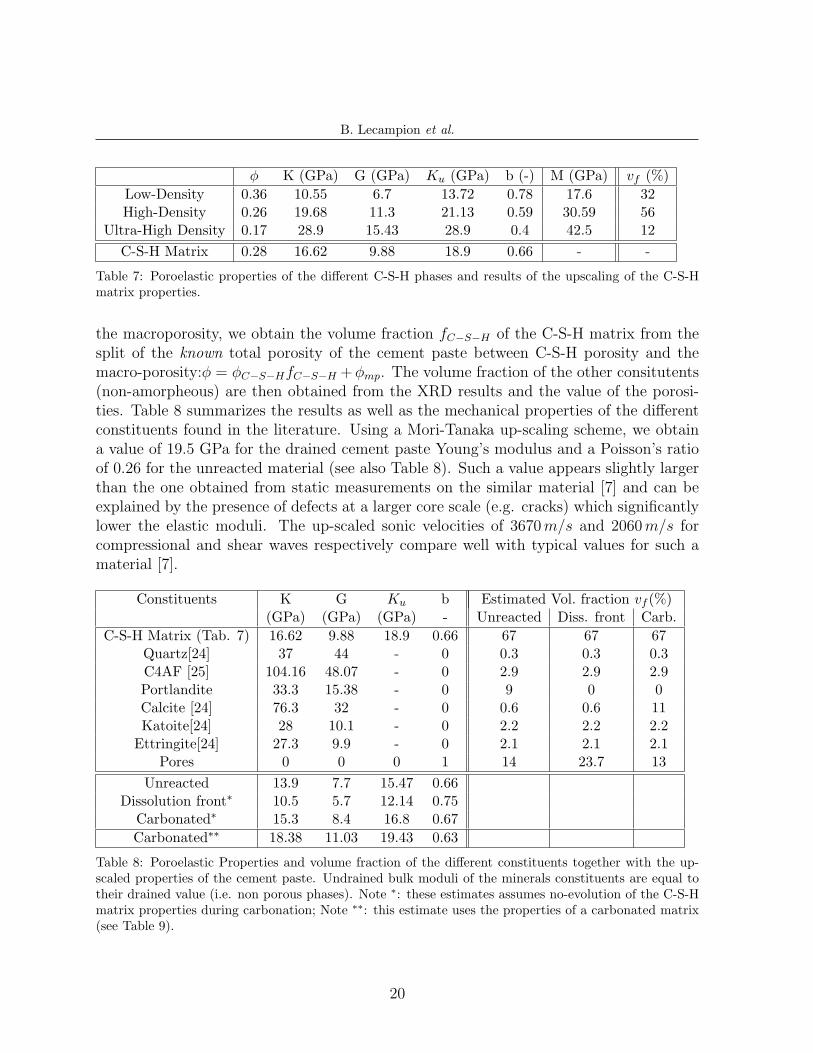
UHD making up such a matrix are taken as the averaged value for all samples in theunreacted zone taking out the stiffer phase made of unhydrated clinkers. One obtainsrespectively vf(LD) = 32%, vf(HD) = 56%, vf(UHD) = 12% for the three types ofC-S-H. The value of their elastic moduli (K, G) have been taken from the deconvolutionof nano-indentation tests and a poro-mechanical upscaling in all points similar to theone described [17] using a self-consistent scheme. The consistency of such an approachcan be checked by comparing the measured indentation modulus (see Table 5) with thepredicted one (see Table 7). The up-scaling of the C-S-H matrix properties (made of thedifferent C-S-H types) is then performed using a matrix based Mori-Tanaka scheme wherethe dominant phase is taken as that of the largest volume fraction, the HD C-S-H. Theresults are summarized in Table 7. The porosity of the C-S-H matrix is simply obtainedfrom the ”packing” density and volume fraction of the different phases and is equal to28%.
On top of the C-S-H matrix, the material at the larger scale contains, macro-porosityand all the minerals detected via the XRD analysis (see Table 2). The volume fractionscan be estimated as follows. The macro-porosity φmp of the cement paste can be es-timated via a pixel analysis of SEM images on the center part of the exposed samples[3]; a value of φmp = 14% is obtained. This value is consistent with the one estimatedwith the Powers-Brownyard model and a hydration degree of 0.8. Using such a value for
19
B. Lecampion et al.
φ K (GPa) G (GPa) Ku (GPa) b (-) M (GPa) vf (%)Low-Density 0.36 10.55 6.7 13.72 0.78 17.6 32High-Density 0.26 19.68 11.3 21.13 0.59 30.59 56
Ultra-High Density 0.17 28.9 15.43 28.9 0.4 42.5 12C-S-H Matrix 0.28 16.62 9.88 18.9 0.66 - -
Table 7: Poroelastic properties of the different C-S-H phases and results of the upscaling of the C-S-Hmatrix properties.
the macroporosity, we obtain the volume fraction fC−S−H of the C-S-H matrix from thesplit of the known total porosity of the cement paste between C-S-H porosity and themacro-porosity:φ = φC−S−HfC−S−H +φmp. The volume fraction of the other consitutents(non-amorpheous) are then obtained from the XRD results and the value of the porosi-ties. Table 8 summarizes the results as well as the mechanical properties of the differentconstituents found in the literature. Using a Mori-Tanaka up-scaling scheme, we obtaina value of 19.5 GPa for the drained cement paste Young’s modulus and a Poisson’s ratioof 0.26 for the unreacted material (see also Table 8). Such a value appears slightly largerthan the one obtained from static measurements on the similar material [7] and can beexplained by the presence of defects at a larger core scale (e.g. cracks) which significantlylower the elastic moduli. The up-scaled sonic velocities of 3670m/s and 2060m/s forcompressional and shear waves respectively compare well with typical values for such amaterial [7].
Constituents K G Ku b Estimated Vol. fraction vf (%)(GPa) (GPa) (GPa) - Unreacted Diss. front Carb.
C-S-H Matrix (Tab. 7) 16.62 9.88 18.9 0.66 67 67 67Quartz[24] 37 44 - 0 0.3 0.3 0.3C4AF [25] 104.16 48.07 - 0 2.9 2.9 2.9Portlandite 33.3 15.38 - 0 9 0 0Calcite [24] 76.3 32 - 0 0.6 0.6 11Katoite[24] 28 10.1 - 0 2.2 2.2 2.2
Ettringite[24] 27.3 9.9 - 0 2.1 2.1 2.1Pores 0 0 0 1 14 23.7 13
Unreacted 13.9 7.7 15.47 0.66Dissolution front∗ 10.5 5.7 12.14 0.75
Carbonated∗ 15.3 8.4 16.8 0.67Carbonated∗∗ 18.38 11.03 19.43 0.63
Table 8: Poroelastic Properties and volume fraction of the different constituents together with the up-scaled properties of the cement paste. Undrained bulk moduli of the minerals constituents are equal totheir drained value (i.e. non porous phases). Note ∗: these estimates assumes no-evolution of the C-S-Hmatrix properties during carbonation; Note ∗∗: this estimate uses the properties of a carbonated matrix(see Table 9).
20
B. Lecampion et al.
5.2 Carbonated material
As previously observed experimentally, the microstructure of the material undergoesa large re-organization during carbonation: the C-S-H matrix is partly decalcified, silicagel and calcite are also present.
A simple approach that assumes no evolution of the C-S-H matrix properties can befirst tested. We will simply assume that all the Portlandite crystals get dissolved and re-precipitate as calcite. The change of the volume fraction of calcite can be easily obtained,also taking into account the change of molar volume at the expense of macro-porosity.The elastic properties of the dissolution front and carbonated zones can then be easilyestimated from an up-scaling similar that used for the unreacted paste. The results aresummarized in table 8. Although, we have estimated the poroelastic properties of thematerial and not its strength, it is interesting to compare the ratio of the modulus of thecarbonated and unreacted zones with the ratio of the specific energy of these two zonesobtained via scratch tests. The ratio εcarbonated/εo obtained from scratch is in averageabout 1.4, while the ratio of the bulk modulus obtained via the up-scaling procedureKcarbonated/Ko is about 1.2. If one assumes that the ratio between elastic moduli andstrength properties remains roughly of the same order of magnitude for cementitiousmaterial (a fact often observed), such a difference necessarily results in modifications atthe level of the C-S-H matrix which have not been taken into account in such a simplisticestimate.
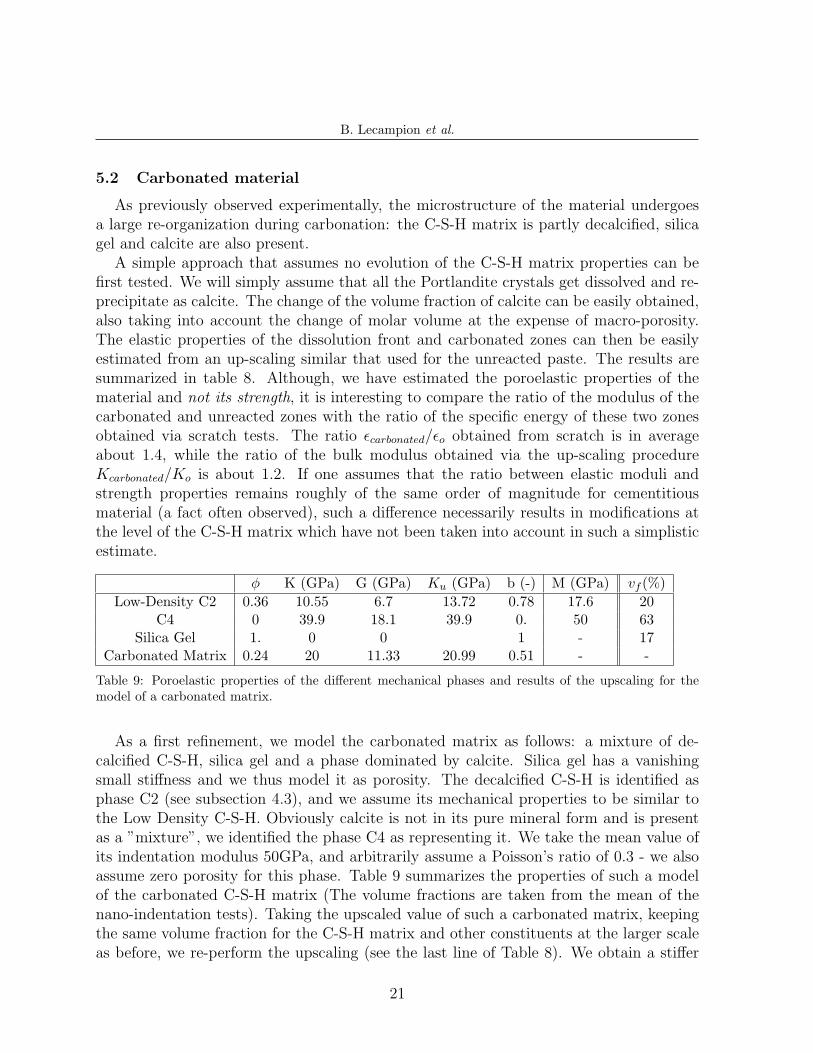
φ K (GPa) G (GPa) Ku (GPa) b (-) M (GPa) vf (%)Low-Density C2 0.36 10.55 6.7 13.72 0.78 17.6 20
C4 0 39.9 18.1 39.9 0. 50 63Silica Gel 1. 0 0 1 - 17
Carbonated Matrix 0.24 20 11.33 20.99 0.51 - -
Table 9: Poroelastic properties of the different mechanical phases and results of the upscaling for themodel of a carbonated matrix.
As a first refinement, we model the carbonated matrix as follows: a mixture of de-calcified C-S-H, silica gel and a phase dominated by calcite. Silica gel has a vanishingsmall stiffness and we thus model it as porosity. The decalcified C-S-H is identified asphase C2 (see subsection 4.3), and we assume its mechanical properties to be similar tothe Low Density C-S-H. Obviously calcite is not in its pure mineral form and is presentas a ”mixture”, we identified the phase C4 as representing it. We take the mean value ofits indentation modulus 50GPa, and arbitrarily assume a Poisson’s ratio of 0.3 - we alsoassume zero porosity for this phase. Table 9 summarizes the properties of such a modelof the carbonated C-S-H matrix (The volume fractions are taken from the mean of thenano-indentation tests). Taking the upscaled value of such a carbonated matrix, keepingthe same volume fraction for the C-S-H matrix and other constituents at the larger scaleas before, we re-perform the upscaling (see the last line of Table 8). We obtain a stiffer
21
B. Lecampion et al.
macroscopic modulus compared to the hypothesis of a non-carbonated matrix. The ratioKcarbonated/Ko is now of 1.39 - closer to the experimental ratios of specific energies reportedby scratch test. However, one has to note that the model of the carbonated matrix usedhere is very crude and definitely requires further refinement. It shows nevertheles theimportance of taking into account the decalcification of the C-S-H.
6 CONCLUSIONS
We have reported a series of experimental results geared toward the understanding ofthe evolution of mechanical properties of Portland cement exposed to CO2-rich fluids.Both scratch and nano-indentation tests have proven to be useful, and confirm that i) thecenter of the exposed cores have properties identical to the initial unreacted material, ii)the carbonated zone appears stiffer and stronger than the initial material. The dissolutionfront between the carbonated zone and the unreacted material exhibits a lower strengthas seen from scratch tests. Such a front will be a surface of weakness where deformationmight localize in structural applications (e.g. cement annulus of oil wells). However thepresence of such a front is intimately linked to the geochemical conditions and may -insome cases- disappears. At a lower scale, for the type of CO2 exposure investigated,a combination of chemical and mechanical analysis has shown that the C-S-H matrixsignificantly evolves and becomes more disordered. It is made of silica gel, calcite nodules(at different scales) and decalcified C-S-H. We have also reported some multiscales micro-poroelastic estimates of the macroscopic properties which allow to quantify the changesof the poroelastic properties during carbonation. We can use this information in practicalmechanical calculations involving a moving carbonation front and different geometries.
In this work, we have not addressed the possible detrimental effect of the crystallizationpressure associated with calcite crystallization in the pore space [26]. Such an effect isparticularly difficult to observe experimentally for carbonation, but should somehow beaddressed in further research. Ultimately, we believe that the integration of geochemicaland micro-poromechanical modeling validated with experiments at different scales is apromising approach to better understand the evolution of mechanical properties of cementexposed to various CO2 conditions. The work reported here is a tiny ”scratch” in thatdirection.
Acknowledgments The authors would like to thank Schlumberger (NYSE:SLB) forthe permission to publish this work. The samples were ”carbonated” by G. Rimmele.Fruitful discussions with Matteo Loizzo and Jean Desroches are greatly acknowledged.
REFERENCES
[1] Kutchko B., Strazisar B., Dzombak D., Lowry G., and Thaulow N., “Degradation ofWell Cement by CO2 under Geologic Sequestration Conditions,” Environ. Sci. Tech.,vol. 41, pp. 4787–4792, 2007.
22
B. Lecampion et al.
[2] Barlet-Gouedard, V., Rimmele, G., Goffe, B., and Porcherie, O., “Mitigation strate-gies for the risk of CO2 migration through wellbores,” in SPE/IADC Drilling Con-ference Proceedings, pp. 405–421, 2006. SPE 98924.
[3] Rimmele G., Barlet–Gouedart V., Porcherie O., Goffe B., and Brunet F., “Heteroge-neous porosity distribution in Portland Cement exposed to CO2–rich fluids,” CementConcrete Res., vol. 38, pp. 1038–1048, 2008.
[4] Duguid,A. and Scherer,G. W., “Degradation of oilwell cement due to exposure tocarbonated brine,” International Journal of Greenhouse Gas Control, vol. 4, no. 3,pp. 546–560, 2010.
[5] Huet, B., Prevost, J.-H., Deremble, L., and Scherer, G.W., “Mechanisms of portlandcement paste reactivity in H2O/NaCl/NaHCO3/CO2 aqueous system,” In prepara-tion, 2011.
[6] Nelson E. and Guillot D., eds., Well Cementing, Schlumberger, 2007.
[7] Fabbri A., Corvisier J., Schubnel A., Brunet F., Goffe B., Rimmele G., and Barlet–Gouedart V., “Effect of carbonation on the hydro-mechanical properties of Portlandcements,” Cem. Conc. Res., vol. 39, pp. 1156–1163, 2009.
[8] Barlet–Gouedart V., Rimmele G., Goffe B., and Porcherie O., “Well technolo-gies for CO2 geological storage: CO2–resistant cement,” Oil and Gas Science andTechnology– Rev. IFP, vol. 62, no. 3, pp. 1–12, 2007.
[9] Coussy O., Poromechanics. Wiley, 2004.
[10] Richard T., Detournay E., Drescher A., Nicodeme P., and Fourmaintraux D., “TheScratch Test as a mean to measure strength of sedimentary rocks,” in SPE/IRSMEurock’98, vol. 2, pp. 15–22, 1998. Paper number 47196.
[11] Germay C. and Dagrain F., “Measure of Rock Mechanical properties from scratchingtest,” in AAPG International Conference and Exhibition, (Paris, France), September2005.
[12] Detournay E. and Defourny P., “A phenomenological model of the drilling action ofdrag bits,” Int. J. Rock Mech. Min. Sci., vol. 29, no. 1, pp. 13–23, 1992.
[13] Richard T., “Determination of Rock Strength from Cutting Tests,” Master’s thesis,University of Minnesota, 1999.
[14] Akono, A.T. and Ulm, F.J., “Scratch test model for the determination of fracturetoughness,” Eng. Frac. Mech., vol. 78, no. 2, pp. 334–342, 2011.
23
B. Lecampion et al.
[15] Xiao, J. and Li, J. and Zhu, B. and Fan, Z., “Experimental study on strength andductility of carbonated concrete elements,” Construction and Building Materials,vol. 16, no. 3, pp. 187–192, 2002.
[16] Vanzo, J. and Ulm, F.J., “ A Nanochemomechanical investigation of CarbonatedCement Paste,” Master’s thesis, School of Engineering, Massachussets Institute ofTechnology, September 2009.
[17] Constantinides G. and Ulm F.J., “The nanogranular nature of C-S-H,” J. Mech.Phys. Sol., vol. 55, pp. 64–90, 2007.
[18] Cariou S., Ulm F.J., and Dormieux L., “Hardness-packing density scaling relationsfor cohesive-frictional porous materials,” J. Mech. Phys. Solids, vol. 56, pp. 924–952,2008.
[19] Miller M., Bobko C., Vandamme M., and Ulm F.J., “Sample preparation and rough-ness criteria for cement paste nanoindentation,” Cem. Concr. Res., vol. 38, no. 4,pp. 467–476, 2008.
[20] Vandamme M., The nanogranular nature of concrete creep: A nano-indentationInvestigation of Microstructure and fundamental properties of Calcium-Silicate-Hydrates. PhD thesis, Massachusetts Institure of Technology, 2008.
[21] Ulm F.J., Constantinides G., and Heukamp F.H., “Is concrete a poromechanicalmaterial ? - A multiscale investigation of poroelastic properties,” Materials andStructures, vol. 37, pp. 43–58, January–February 2004.
[22] Dvorak G.J. and Benveniste Y., “On transformation strains and uniform fields inmultiphase elastic media,” Proc. R. Soc. Lond. A, vol. 437, pp. 291–310, 1992.
[23] Constantinides G. and Ulm F.J., “The effect of two types of C-S-H on the elastic-ity of cement-based materials: Results from nanoindentation and micromechanicalmodeling,” Cement Concrete Res., vol. 34, pp. 67–80, 2004.
[24] Bass J.D., Mineral Physics and Crystallography: A Handbook of Physical Constants(AGU referense shelf 2), ch. Elasticity of Minerals, Glasses and Melts, pp. 45–63.AGU, 1995.
[25] Velez K., Maximilien S., Damidot D., Fantozzi G., and Sorrentino F., “Determinationby nanoidentation of elastic modulus and hardness of pure constituents of portlandcement clinker,” Cement Concrete Res., vol. 31, pp. 555–561, 2001.
[26] Coussy O., “Deformation and stress from in-pore drying-induced crystallization ofsalt,” J. Mech. Phys. Sol., vol. 54, pp. 1517–1547, 2006.
24
Related Documents