Evolution of Plasmonic Metamolecule Modes in the Quantum Tunneling Regime Jonathan A. Scholl, †,⊥ Aitzol Garcia-Etxarri,* ,†,‡,⊥ Garikoitz Aguirregabiria, ‡ Ruben Esteban, ‡ Tarun C. Narayan, † Ai Leen Koh, § Javier Aizpurua, ‡ and Jennifer A. Dionne* ,†,∥ † Department of Materials Science and Engineering, Stanford University, Stanford, California 94305, United States ‡ Center for Material Physics, CSIC - UPV/EHU and DIPC, Donostia, San Sebastian 20018, Spain § Stanford Nanocharacterization Laboratory, Stanford University, Stanford, California 94305, United States ∥ Stanford Institute for Materials and Energy Sciences, SLAC National Accelerator Laboratory, 2575 Sand Hill Road, Menlo Park, California 94025, United States * S Supporting Information ABSTRACT: Plasmonic multinanoparticle systems exhibit collective electric and magnetic resonances that are fundamental for the development of state-of-the-art optical nanoantennas, metamaterials, and surface-enhanced spec- troscopy substrates. While electric dipolar modes have been investigated in both the classical and quantum realm, little attention has been given to magnetic and other “dark” modes at the smallest dimensions. Here, we study the collective electric, magnetic, and dark modes of colloidally synthesized silver nanosphere trimers with varying inter- particle separation using scanning transmission electron microscopy (STEM) and electron energy-loss spectroscopy (EELS). This technique enables direct visualization and spatially selective excitation of individual trimers, as well as manipulation of the interparticle distance into the subnanometer regime with the electron beam. Our experiments reveal that bonding electric and magnetic modes are significantly impacted by quantum effects, exhibiting a relative blueshift and reduced EELS amplitude compared to classical predictions. In contrast, the trimer’s electric dark mode is not affected by quantum tunneling for even Ångströ m-scale interparticle separations. We employ a quantum-corrected model to simulate the effect of electron tunneling in the trimer which shows excellent agreement with experimental results. This understanding of classical and quantum-influenced hybridized modes may impact the development of future quantum plasmonic materials and devices, including Fano-like molecular sensors and quantum metamaterials. KEYWORDS: plasmon, nanoparticle, quantum tunneling, electron energy-loss spectroscopy, quantum-corrected model N oble metal nanoparticles have attracted substantial interest in recent years owing to their ability to support localized surface plasmon resonances (collec- tive oscillations of conduction electrons). These plasmonic excitations allow manipulation of light at the nanoscale and have enabled technological advances ranging from improved catalytic and photovoltaic cell efficiencies 1−3 to sensitive molecular detectors, 4−6 medical therapeutics, 7,8 nanoscale lasers, 9 spasers, 10 and modulators. 11 While most plasmonic systems have been designed using a classical electrodynamic framework, several recent studies have shown that quantum effects can significantly modify the electromagnetic response. 12−21 For example, quantum phe- nomena such as tunneling and size-dependent confinement effects have been observed, leading to relative blueshifts and resonance quenching, 12,14−16 as well as the emergence of new tunneling modes. 17 These results not only provide an important design consideration for optical nanoanten- nas, 19,22−24 but may also enable ultrafine sensors 25 and new molecular electronic devices. 17 To date, nearly all studies of quantum plasmonic systems have focused on electric dipolar modes, as are excited in one or two particle systems. Nevertheless, higher-order modes such as magnetic and dark modes are also of paramount importance in plasmonic materials and devices. For example, optical- frequency magnetic resonances have been shown to improve the sensitivity of circular dichroism spectroscopy 26,27 as well as enable tunable permeabilities for novel metamaterials. 28−32 Dark modes (plasmonic resonances that cannot be directly Received: October 26, 2015 Accepted: December 5, 2015 Published: December 5, 2015 Article www.acsnano.org © 2015 American Chemical Society 1346 DOI: 10.1021/acsnano.5b06738 ACS Nano 2016, 10, 1346−1354

Welcome message from author
This document is posted to help you gain knowledge. Please leave a comment to let me know what you think about it! Share it to your friends and learn new things together.
Transcript
Evolution of Plasmonic Metamolecule Modesin the Quantum Tunneling RegimeJonathan A. Scholl,†,⊥ Aitzol Garcia-Etxarri,*,†,‡,⊥ Garikoitz Aguirregabiria,‡ Ruben Esteban,‡
Tarun C. Narayan,† Ai Leen Koh,§ Javier Aizpurua,‡ and Jennifer A. Dionne*,†,∥
†Department of Materials Science and Engineering, Stanford University, Stanford, California 94305, United States‡Center for Material Physics, CSIC - UPV/EHU and DIPC, Donostia, San Sebastian 20018, Spain§Stanford Nanocharacterization Laboratory, Stanford University, Stanford, California 94305, United States∥Stanford Institute for Materials and Energy Sciences, SLAC National Accelerator Laboratory, 2575 Sand Hill Road, Menlo Park,California 94025, United States
*S Supporting Information
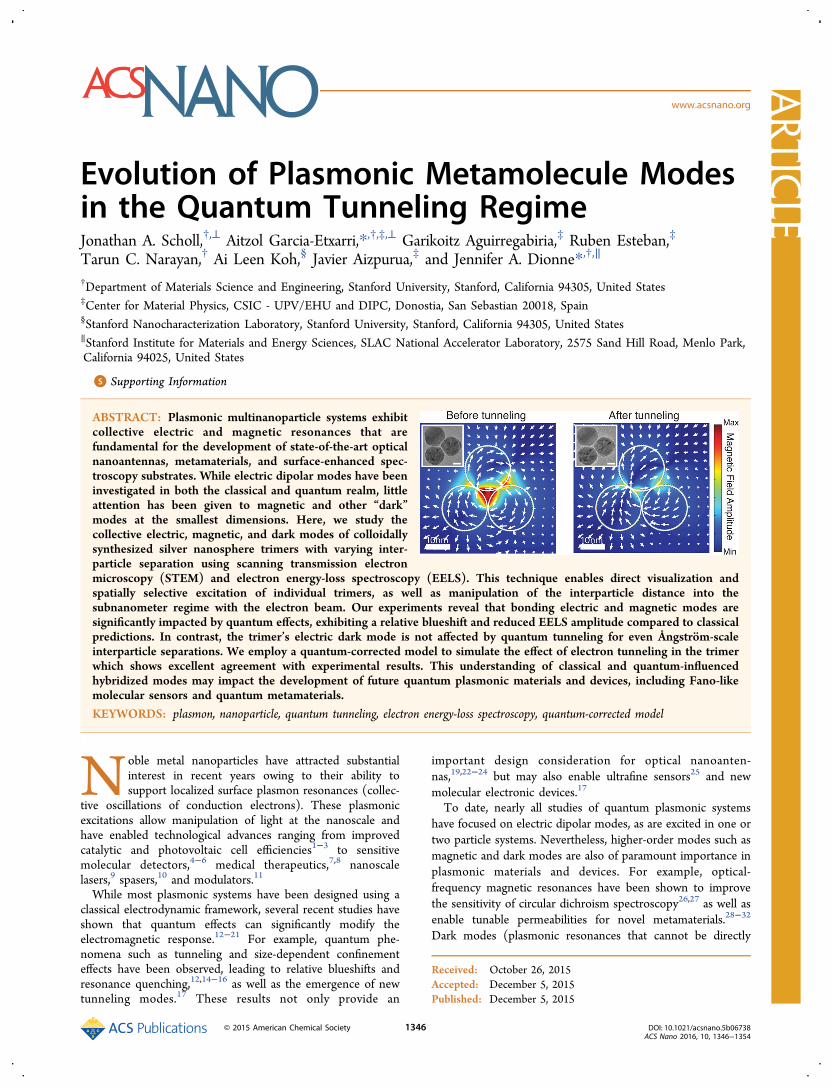
ABSTRACT: Plasmonic multinanoparticle systems exhibitcollective electric and magnetic resonances that arefundamental for the development of state-of-the-art opticalnanoantennas, metamaterials, and surface-enhanced spec-troscopy substrates. While electric dipolar modes have beeninvestigated in both the classical and quantum realm, littleattention has been given to magnetic and other “dark”modes at the smallest dimensions. Here, we study thecollective electric, magnetic, and dark modes of colloidallysynthesized silver nanosphere trimers with varying inter-particle separation using scanning transmission electronmicroscopy (STEM) and electron energy-loss spectroscopy (EELS). This technique enables direct visualization andspatially selective excitation of individual trimers, as well as manipulation of the interparticle distance into thesubnanometer regime with the electron beam. Our experiments reveal that bonding electric and magnetic modes aresignificantly impacted by quantum effects, exhibiting a relative blueshift and reduced EELS amplitude compared to classicalpredictions. In contrast, the trimer’s electric dark mode is not affected by quantum tunneling for even Ångstrom-scaleinterparticle separations. We employ a quantum-corrected model to simulate the effect of electron tunneling in the trimerwhich shows excellent agreement with experimental results. This understanding of classical and quantum-influencedhybridized modes may impact the development of future quantum plasmonic materials and devices, including Fano-likemolecular sensors and quantum metamaterials.
KEYWORDS: plasmon, nanoparticle, quantum tunneling, electron energy-loss spectroscopy, quantum-corrected model
Noble metal nanoparticles have attracted substantialinterest in recent years owing to their ability tosupport localized surface plasmon resonances (collec-
tive oscillations of conduction electrons). These plasmonicexcitations allow manipulation of light at the nanoscale andhave enabled technological advances ranging from improvedcatalytic and photovoltaic cell efficiencies1−3 to sensitivemolecular detectors,4−6 medical therapeutics,7,8 nanoscalelasers,9 spasers,10 and modulators.11
While most plasmonic systems have been designed using aclassical electrodynamic framework, several recent studies haveshown that quantum effects can significantly modify theelectromagnetic response.12−21 For example, quantum phe-nomena such as tunneling and size-dependent confinementeffects have been observed, leading to relative blueshifts andresonance quenching,12,14−16 as well as the emergence of newtunneling modes.17 These results not only provide an
important design consideration for optical nanoanten-nas,19,22−24 but may also enable ultrafine sensors25 and newmolecular electronic devices.17
To date, nearly all studies of quantum plasmonic systemshave focused on electric dipolar modes, as are excited in one ortwo particle systems. Nevertheless, higher-order modes such asmagnetic and dark modes are also of paramount importance inplasmonic materials and devices. For example, optical-frequency magnetic resonances have been shown to improvethe sensitivity of circular dichroism spectroscopy26,27 as well asenable tunable permeabilities for novel metamaterials.28−32
Dark modes (plasmonic resonances that cannot be directly
Received: October 26, 2015Accepted: December 5, 2015Published: December 5, 2015
Artic
lewww.acsnano.org
© 2015 American Chemical Society 1346 DOI: 10.1021/acsnano.5b06738ACS Nano 2016, 10, 1346−1354

excited by paraxial light owing to their lack of a net dipolemoment) are also of interest in the development ofultrasensitive molecular detectors.33,34 The influence ofquantum effects on these modes remains unexplored, largelydue to the challenges associated with fabricating subnanometerfeatures in complex nanoparticle geometries.35,36
In this article, we investigate electric, magnetic, and darkplasmonic modes as they transition from the classical to
quantum regime. We focus our study on nanoparticle trimers asone of the most basic plasmonic metamolecules supporting arich variety of resonances of different fundamental charac-ter.33,35,37−40 To access the quantum regime, we use acombination of scanning transmission electron microscopy(STEM) and electron energy-loss spectroscopy (EELS). Thefocused electron beam is used both to image and manipulatethe interparticle separation of self-assembled trimers. Con-
Figure 1. Aberration-corrected TEM images of a silver nanosphere trimer with particles converging and coalescing under the influence of theelectron beam. The particles are 25 nm in diameter and supported on an 8 nm-thick SiO2 membrane substrate. The electron beam inducesparticle convergence from a separation of 1 nm (a) down through subnanometer gaps (b) until particle contact (c) and ultimaterecrystallization into a single entity (d). Scale bars equal 10 nm.
Figure 2. Classical-regime experimental and simulated trimer spectra with field maps for three electron beam excitation positions. Trimerswith vertex (a−c), edge (d−f), and center (g−i) excitations (beam position indicated with red X’s) are depicted with their experimentalSTEM-EELS (a, d, and g) and BEM simulation spectra (b, e, and h). The nature of the resonance peak modes is identified with classical BEMfield maps and arrows depicting a time snapshot of field direction (c, f, and i). The prominent resonances include electric bonding (bluecircle), magnetic (purple square), higher-order modes (green triangle), and dark modes (gold pentagon). All scale bars equal 10 nm.
ACS Nano Article
DOI: 10.1021/acsnano.5b06738ACS Nano 2016, 10, 1346−1354
1347

currently, EELS allows direct probing of the plasmonicresponse. By correlating plasmonic spectra with trimergeometry, we discover prominent quantum influences on theelectric and magnetic modes of trimers at the smallestseparation distances but purely classical behavior for theradially symmetric dark mode.
RESULTS AND DISCUSSIONSilver nanospheres are chosen as the constituents of the trimerowing to their strong electric polarizability and capacity tostrongly couple. These properties enable the formation ofdistinct modes with relatively narrow spectral line widths. Whilesmaller particles are more responsive to electron beammanipulation,41 the nanospheres must also be sufficientlylarge to exhibit a detectable plasmonic magnetic mode EELSsignal. Consequently, 25 nm-diameter particles are selected forthis study and synthesized according to a previously reported42
colloidal chemistry procedure.The cleaned, concentrated and filtered nanoparticle solution
is dropcast on 8 nm thick SiO2 TEM membranes for analysis.During the process, particles self-assemble on the surface intomultimer clusters with varying number of nanosphereconstituents, including the equilateral triangle trimers that arethe focus of this study.The nanosphere trimers are imaged and characterized
through STEM-EELS, which has the advantages of allowingdirect visualization of the individual nanostructures andenabling the selective excitation of plasmonic modes throughthe placement of the electron beam.12,43,44 For the purpose ofthis study, we employ a spherical aberration (Cs) image-corrected FEI Titan TEM with an imaging resolution of 0.07nm in 300 kV TEM mode. STEM-EELS is performed in 80 kVmode to increase the nanoparticle scattering cross section andimprove the spectral energy resolution to 0.1 eV whencombined with a monochromator. The focused probe has aspatial resolution of 0.5 nm.The focused electron beam can be used to induce particle
motion, allowing dynamic modification of the interparticleseparation. This phenomenon is likely a combination ofCoulombic attraction and surface diffusion; the electron beamcan induce polarization of the particles into aligned, attractivedipoles41,45 as well as facilitate the diffusive movement of thenanoparticles’ surface atoms.46−49 The electron-beam-inducedmerging phenomenon is illustrated in Figure 1, where a seriesof silver nanosphere trimer TEM images depict decreasinginterparticle separation distances. Initially, the 25 nm-diameterspheres self-assemble into an equilateral triangle trimer withgap sizes of ∼1 nm (Figure 1a). After interaction with a focusedelectron beam, the particles proceed to converge and achieveÅngstrom-scale separations (Figure 1b). Upon furthercoalescence, physical connections are established (Figure 1c),which ultimately broaden and recrystallize to create fullymerged aggregates (Figure 1d). This final form remainsrelatively stable and is no longer substantially affected by theelectron beam.Before exploring the modal evolution as the particles
coalesce, a baseline understanding of the trimer’s plasmonicresponse to electron excitation is needed for the classicalregime (≥0.5 nm gap sizes). As previous EELS work onmultimers has been limited,50−52 we performed fully rigorousthree-dimensional Boundary Element Method (BEM) simu-lations53−55 (see Methods) to determine which relative electronbeam positions would most clearly reveal the trimer’s
fundamental resonant modes. These classical electrodynamiccalculations indicate that electric bonding, magnetic, and darkmodes can be excited and detected with the focused beam atthe trimer vertex, edge, and center, respectively. Theselocations are illustrated in Figure 2 along with the experimentaland simulated spectral response.The experimental data in Figure 2 depict the aligned and
summed spectra from ≥800 EELS collections, each lasting 10ms. As a first example of trimer excitation, the vertex positionSTEM-EELS experimental data is depicted in Figure 2a. Theplot features two primary resonance peaks at 2.6 eV (bluecircle) and 3.5 eV (green triangle), showing excellentagreement with the simulations of Figure 2b. Note that theSiO2 substrate used in the experiment causes the resonances toredshift compared to the simulations, which are performed invacuum. Further, since our theoretical simulations assume aperfectly monochromated electron beam, while the exper-imental spectra have a small, ∼0.1 eV energy spread in theincident electrons, the experimental spectra show broaderresonances than the theory.To discern the specific nature of the observed plasmonic
resonances, simulated field maps are generated for energiescorresponding to the spectral peaks. The field maps areaccompanied by arrows depicting the direction of the electricfield at a given time snapshot. All of the arrows are normalizedto have the same length in three dimensions; accordingly,smaller arrows indicate the presence of out-of-plane fieldcomponents. As seen in Figure 2c, the lower energy resonanceof Figure 2b can primarily be attributed to the electric bondingmode in which the field directions exhibit a dominant verticalcomponent. This field geometry indicates a strong dipolecoupling similar to the bonding dipolar plasmon resonance ofdimers.14 The two higher energy peaks (>3.4 eV) in thesimulation correspond to a more complex combination ofhigher-order modes, as illustrated in Supporting InformationFigure 1.A second trimer system with edge excitation is presented in
Figure 2d. As with the vertex excitation of Figure 2a, electricbonding (blue circle) and higher-order modes (green triangle)are observed, but unlike the vertex excitation, a third, weakerresonance at lower energy (purple square) emerges. Thisfeature, appearing as a shoulder to the electric bonding mode,again shows good correspondence to the idealized theoreticalsimulations (Figure 2e) that indicate a lower intensity thirdpeak. According to simulated field maps at this energy (Figure2f), this resonance corresponds to a magnetic mode associatedwith circulating displacement currents across the three-particleloop.In Figure 2g, the third excitation position at the trimer’s
center reveals a unique STEM-EELS resonance profilecontaining a primary, intense peak at 3.5 eV (gold pentagon).With close correspondence to the classical theoreticalsimulation (Figure 2h), this resonance indicates the presenceof an in-plane, radially symmetric dark mode in which allinduced dipoles are directed toward the center (Figure 2i). Asthe polarization of the individual particles in the trimer createzero net dipole moment, this mode is not excitable withparaxial light.33 It can, however, be accessed by judiciousplacement of the electron beam.With this understanding of the classical trimer modes and
excitation locations, we can now decrease the gap sizes into thesubnanometer size regime by using the focused electron beam.Concurrently, we can collect EELS data on the modal evolution
ACS Nano Article
DOI: 10.1021/acsnano.5b06738ACS Nano 2016, 10, 1346−1354
1348
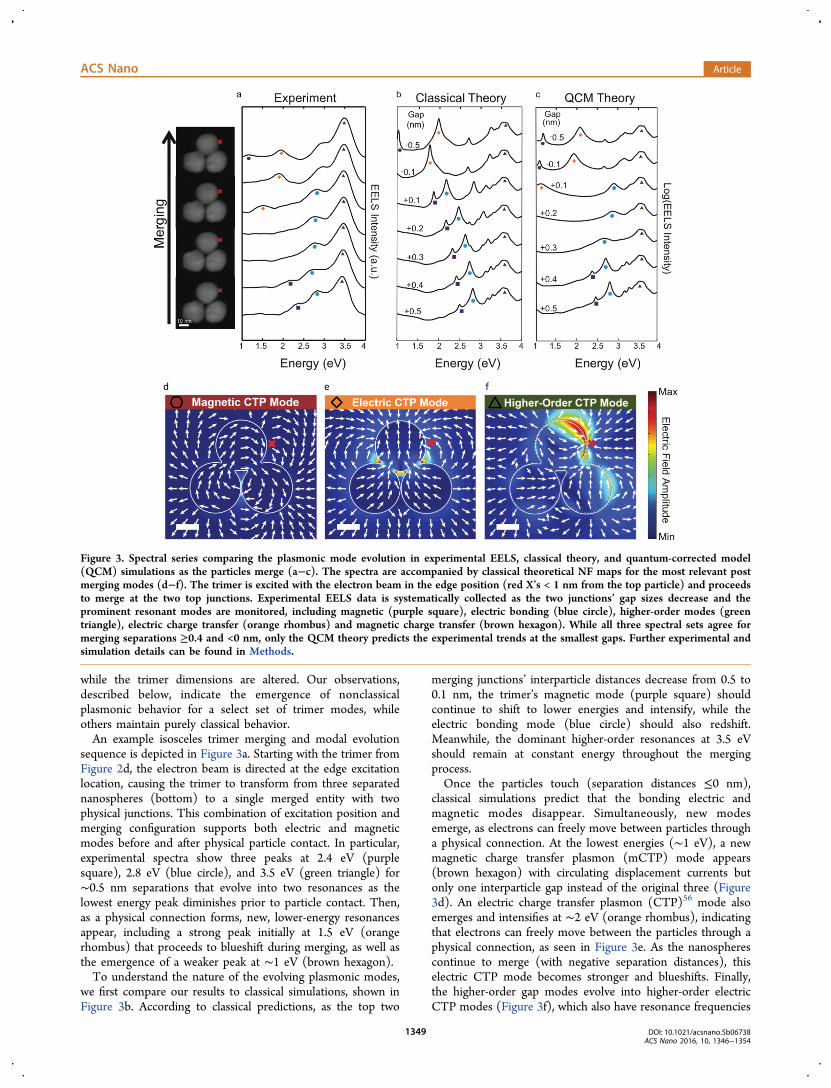
while the trimer dimensions are altered. Our observations,described below, indicate the emergence of nonclassicalplasmonic behavior for a select set of trimer modes, whileothers maintain purely classical behavior.An example isosceles trimer merging and modal evolution
sequence is depicted in Figure 3a. Starting with the trimer fromFigure 2d, the electron beam is directed at the edge excitationlocation, causing the trimer to transform from three separatednanospheres (bottom) to a single merged entity with twophysical junctions. This combination of excitation position andmerging configuration supports both electric and magneticmodes before and after physical particle contact. In particular,experimental spectra show three peaks at 2.4 eV (purplesquare), 2.8 eV (blue circle), and 3.5 eV (green triangle) for∼0.5 nm separations that evolve into two resonances as thelowest energy peak diminishes prior to particle contact. Then,as a physical connection forms, new, lower-energy resonancesappear, including a strong peak initially at 1.5 eV (orangerhombus) that proceeds to blueshift during merging, as well asthe emergence of a weaker peak at ∼1 eV (brown hexagon).To understand the nature of the evolving plasmonic modes,
we first compare our results to classical simulations, shown inFigure 3b. According to classical predictions, as the top two
merging junctions’ interparticle distances decrease from 0.5 to0.1 nm, the trimer’s magnetic mode (purple square) shouldcontinue to shift to lower energies and intensify, while theelectric bonding mode (blue circle) should also redshift.Meanwhile, the dominant higher-order resonances at 3.5 eVshould remain at constant energy throughout the mergingprocess.Once the particles touch (separation distances ≤0 nm),
classical simulations predict that the bonding electric andmagnetic modes disappear. Simultaneously, new modesemerge, as electrons can freely move between particles througha physical connection. At the lowest energies (∼1 eV), a newmagnetic charge transfer plasmon (mCTP) mode appears(brown hexagon) with circulating displacement currents butonly one interparticle gap instead of the original three (Figure3d). An electric charge transfer plasmon (CTP)56 mode alsoemerges and intensifies at ∼2 eV (orange rhombus), indicatingthat electrons can freely move between the particles through aphysical connection, as seen in Figure 3e. As the nanospherescontinue to merge (with negative separation distances), thiselectric CTP mode becomes stronger and blueshifts. Finally,the higher-order gap modes evolve into higher-order electricCTP modes (Figure 3f), which also have resonance frequencies
Figure 3. Spectral series comparing the plasmonic mode evolution in experimental EELS, classical theory, and quantum-corrected model(QCM) simulations as the particles merge (a−c). The spectra are accompanied by classical theoretical NF maps for the most relevant postmerging modes (d−f). The trimer is excited with the electron beam in the edge position (red X’s < 1 nm from the top particle) and proceedsto merge at the two top junctions. Experimental EELS data is systematically collected as the two junctions’ gap sizes decrease and theprominent resonant modes are monitored, including magnetic (purple square), electric bonding (blue circle), higher-order modes (greentriangle), electric charge transfer (orange rhombus) and magnetic charge transfer (brown hexagon). While all three spectral sets agree formerging separations ≥0.4 and <0 nm, only the QCM theory predicts the experimental trends at the smallest gaps. Further experimental andsimulation details can be found in Methods.
ACS Nano Article
DOI: 10.1021/acsnano.5b06738ACS Nano 2016, 10, 1346−1354
1349

that remain unaltered at 3.5 eV (green triangle). For a detaileddescription of the modal evolution in the classical regime seeSupporting Information Figure 2.When panels a and b in Figure 3 are compared, it can be seen
that the classical simulations display close correspondence withexperimental EELS data for separation distances ≥0.4 and ≤0nm. Both sets initially display the three primary resonancesmagnetic, electric bonding, and higher-orderwith the firsttwo showing a slight redshift as the separation distancedecreases. After contact, both simulation and experimentindicate the emergence of new electric CTP and mCTPmodes at low energies.For gap sizes between 0 and 0.4 nm, however, notable
differences become apparent. In particular, the magnetic andelectric bonding modes in the experimental data do notcontinue to redshift, as classical predictions would suggest.Instead, the magnetic mode becomes quenched, making it nolonger visible at the smallest distances. The electric bondingmode also dampens and the resonance appears to blueshiftprior to the particles coming into contact.To understand this divergent behavior at Ångstrom-length
scales, a quantum model becomes necessary. Previously, abinitio density functional theory models have provided a goodpoint of comparison for dimer systems.14,57,58 These models,however, have been computationally limited to relatively smallsystems, such as two 4 nm diameter Na spheres with ∼2000conduction electrons.57 To model the trimer composed of 25nm-diameter silver particles in this study, over 1 millionconduction electrons would need to be simulated.Therefore, we apply a recently developed quantum-modified
electrodynamic approach called the quantum-corrected model(QCM).15 This strategy incorporates a quantum-modifiedtreatment of the interparticle gap region conductivity in aclassical simulation, accounting for the electron tunnelingcurrent between particles at optical frequencies. As tunnelingprobability is dependent on gap size, the interparticle junctionis discretized into cylindric shells corresponding to differentseparation lengths and modeled with appropriate electronconductivities (σg). These, in turn, are used to calculate thepermittivities of the gaps (εg).The QCM has been benchmarked against Time-Dependent
Density Functional Theory (TDDFT) calculations, indicatingthat it accurately describes the physics of the high frequencytunneling conductivity in small dimer systems. Moreover, it hasbeen used to predict the behavior of larger, two-particleplasmonic systems.15,16 Here, the QCM is employed to studythe more complex nature of merging trimers59 (additionaldetails can be found in Methods).At interparticle separations ≥0.4 and ≤0 nm, QCM
simulations show close correspondence to both classicalprediction trends and experimental data. Within the smallestgap region, however, it diverges from the classical model andfollows a similar spectral evolution as the experimental STEM-EELS collections. As was observed in the experimental spectra,the magnetic and electric bonding resonances do not continueto redshift. Instead, the magnetic mode becomes quenched andthe electric bonding resonance dampens and transforms into ahigher-order charge transfer plasmon mode, which blueshiftsprior to the particles touching. Similar electric modephenomena have been predicted for dimers in the quantumregime.15 Finally, the QCM simulations predict that the low-energy electric CTP emerges at +0.1 nm, before the particlesphysically come into contact. This feature has been reported in
dimers17 and is generated when the quantum tunnelingprobability is sufficiently high to facilitate interparticleconductivity.56 This QCM prediction agrees well with theappearance of the CTP mode at lower energies in theexperimental data.To better illustrate the evolution of the magnetic and electric
resonances at these Ångstrom-scale separation distances, Figure4 shows the distribution of electric and magnetic field
amplitudes and electric field directions for the relevant modesas the gap sizes diminish. The first column plots the magneticfield amplitude of the premerge magnetic mode, while thesecond column shows the electric field amplitude of the electricbonding mode. Rows 1 and 2 correspond to separationdistances of 0.4 and 0.3 nm, before and after reaching thequantum tunneling threshold, respectively.For d = 0.4 nm (Figure 4a,b), quantum tunneling still does
not substantially impact the response of the system, and bothelectric and magnetic modes present the expected classicalbonding behavior. The magnetic mode (Figure 4a) generates astrong magnetic field at the center of the system as a result ofthe circulating displacement currents across the three particleloop. The electric dipole mode instead presents intense electricfields at the particle gaps as a result of the strong couplingbetween the modes of the individual particles.In contrast, the d = 0.3 nm separation distance (Figure 4c,d)
is sufficiently small to allow a high-frequency tunneling currentbetween the particles to be established. To use a circuit modelanalogy, at this threshold, the gap impedance acquires anincreasingly resistive character (from the electron tunneling).
Figure 4. Electric and magnetic simulated field maps before andafter the onset of quantum tunneling. Quantum-corrected modelsimulations of 25 nm-diameter silver nanosphere trimers with edgeexcitation (red X’s) are generated at 0.4 nm gap distances (a andb), outside the quantum regime, and at 0.3 nm gap distances (c andd), where quantum tunneling is substantially stronger. As indicatedby the electric field direction arrows, the magnetic mode isdisplayed at left (a and c), while the electric bonding mode isshown at right (b and d). The insets in b and d display a zoomedview of the electric fields in the gap regions. The quantum effects atthe smaller separation distances result in a significant decrease inthe magnetic and electric field amplitude for their correspondingmodes. All scale bars equal 10 nm.
ACS Nano Article
DOI: 10.1021/acsnano.5b06738ACS Nano 2016, 10, 1346−1354
1350

Further, the capacitive bonding nature of the modes losesstrength, resulting in the damping and quenching of thebonding electric and magnetic modes. Consequently, themagnetic field amplitude map (Figure 4c) indicates asubstantial drop in the magnetic field concentration at thecenter of the particle loop, and the electric fields in theinterparticle gaps are similarly reduced (Figure 4d).While the magnetic mode and the bonding electric mode
display distinct nonclassical behavior, other plasmonic modesare not equally affected by quantum phenomena in the sub-nmregime. This contrast is seen when a trimer is excited throughthe center gap and the three particles symmetrically merge (allconnections occurring simultaneously). The dark moderesonance, as seen in Figure 5a, initially occurs at 3.5 eV with0.5 nm gap size and remains constant throughout the entireparticle convergence.
Classical simulations (Figure 5b) are performed forcomparison with experiment. Both reveal virtually identicalresonance energy trends with separation distance, as the darkgap mode evolves into a dark merged trimer mode with similarfield orientation (see Supporting Information Figure 3). Thissimilarity between experimental data and classical simulationsindicates that quantum effects do not influence the dark moderesonance behavior, even at the smallest interparticledimensions.Why does the dark mode behavior remain consistent
between experiment and classical theory while the magneticand bonding electric gap modes show substantial differences?This discrepancy is likely caused by the orientation of electricfields and charge distribution at the junctions; in the magneticand electric bonding modes, charges with opposite polarity areinduced at the interparticle interfaces, creating a strong localfield through the gap and further facilitating electron tunneling
between the nanospheres. The radially symmetric dark mode,in contrast, has identical charge polarity at the junctions,reducing the electric field and hindering electron transportbetween particles. For this distribution of induced charges,applying the quantum corrected model to the interparticleregions yields a gap permittivity equal to that of vacuum.Consequently, no tunneling occurs and the dark mode spectralevolution is identical to the trends determined through classicalsimulations. Note that this result should also be applicable toother dark modes of metamolecule assemblies, including theantibonding longitudinal modes of nanoparticle dimers.
CONCLUSIONSTo summarize, we have employed STEM-EELS for sub-nanometer imaging, selective excitation of hybridized multimermodes, spectral analysis, and electron-beam manipulation ofnanoparticles. Further, we theoretically analyzed the responseof the system through quantum-corrected model simulations.Combined, these methods allow us to explore fundamentaltrimer modes and their progression for interparticle gap sizes inthe subnanometer regime. Plasmonic mode evolution duringmerging reveals that classical electrodynamics correctly capturesthe behavior of certain cases (e.g., radially symmetric darkmode), but is insufficient for others (i.e., electric bonding andmagnetic modes) in which quantum phenomena appear. Thesespectral features, including resonance quenching and relativeblueshifting, provide strong indication of electron tunnelingbetween particles. Consideration of quantum features will playan important role in the design of future multiparticlemetamolecules with sub-nm gaps and support new interdisci-plinary exploration bridging molecular electronics, nonlinearoptics, and plasmonics.
METHODSChemicals and Synthesis. Silver nanospheres are synthesized
with citrate ligands according to previously described methods.42 Inbrief, silver nitrate (>99% Alfa Aesar) is reduced in water by acombination of trisodium citrate (MP Biomedicals) and tannic acid(J.T. Baker), the quantity of the latter controlling the particle size. Inthis experiment, a 40 mL aqueous solution of 0.74 mM AgNO3 isheated to 60 °C under constant stirring. A 10 mL aqueous solution of6.8 mM citrate and 6 μM tannic acid is then rapidly added. Bothsolutions are prepared with Milli-Q deionized water (18 MΩ cm−1).After 3 min, the combined mixture is further heated to a vigorous boilfor 20 min before finally being allowed to cool to room temperature.
To remove excess citrate and unreacted metal salts in solution, thenanospheres are centrifuged at 8000 rpm for 10 min and theconcentrated pellet is filtered with a 0.2 μm pore filter (Pall Corp.).This results in limiting the nanosphere size distribution to 25 ± 2 nm.
The particles in the concentrated and filtered solution are thendropcast onto a 8 nm-thick SiO2 transmission electron microscope(TEM) membrane (Ted Pella, Inc.), which provides a smooth, inertsurface for extended particle observation and electron-beam-inducedmotion, while also being sufficiently thin to minimize background andsignal attenuation. Before deposition, the substrate is plasma cleanedto remove organic contamination and render the membrane morehydrophilic to aid in particle attachment. Once dropcast, the samplesolution is allowed to dry on the membrane, and during the processthe particles self-assemble into multimer clusters composed of varyingnumber of nanospheres. Included among these particle clusters are theequilateral triangle trimers that are the focus of this study. The trimerparticles are separated internally by ∼1 nm gaps owing to the citrateligands on the surfaces. The coverage of the citrate is neverthelesssufficiently sparse that particles were capable of coalescing wheninduced to move under the electron beam and do not demonstrate anycarbon contamination during exposure.
Figure 5. Spectral series comparing experimental EELS andclassical simulations for a merging trimer with center excitation.The beam positions are indicated by red X’s. Both experimental (a)and classical simulations (b) indicate a dominant peak that remainsat a consistent energy throughout the merging process. All scalebars equal 10 nm.
ACS Nano Article
DOI: 10.1021/acsnano.5b06738ACS Nano 2016, 10, 1346−1354
1351

Electron Microscopy. An FEI Titan 80−300 environmental(scanning) TEM is operated at 300 kV for highest, aberration-corrected TEM imaging resolution (0.07 nm). Scanning TEM(STEM) and electron energy-loss spectroscopy (EELS) operation,however, use 80 kV excitation, as it increases the particles’ scatteringcross-section and enables, with the aid of a monochromator, a spectralresolution of 0.1 eV, based on the full width at half-maximum of thezero-loss peak (ZLP). A Gatan 966 Quantum spectrometer is usedwith an energy dispersion of 0.01 eV per channel. A 50 μm C3aperture, camera length of 48 mm, and a spectrometer entranceaperture of 2.5 mm are used, resulting in a convergence semiangle of8.7 mrad and a collection semiangle of 20.2 mrad. The spatial imagingresolution with the focused STEM probe is 0.5 nm.EELS data is collected by focusing the STEM beam at either 1 nm
from the top trimer particle (top edge for “vertex” excitation, rightedge for “edge” excitation) or at the center of the gap between thethree nanoparticles. These relative locations are demonstrated inFigure 2. Generally, 1600 acquisitions, each lasting 10 ms, are collectedbetween STEM images; the short time durations of the individualacquisitions are necessary to prevent the saturation of the CCDdetector by the dominant ZLP.Particle coalescence is caused by the energy and electric fields of the
electron beam during spectral acquisition. Since the surface ligandcoverage of the nanospheres is reduced through the aforementionedcleaning procedures, the particles could merge through a combinationof electron-beam-facilitated surface diffusion46−49 and an induceddipole−dipole coupling caused by the passing electrons’ electricfield.41,45 To maximize particle movement during spectral acquisitionwhile minimizing perturbation during imaging, the current of the beamis modulated between 250 pA for the former and 50 pA for the latter.To generate the experimental series during trimer particle merging
in Figure 3, continuous recordings of EELS data are collected betweenthe acquisitions of the four STEM images. During those intervalperiods, the plasmonic response of the system slowly evolves, so thedata is subdivided into sections of >500 acquisitions which exhibitrelative consistency in resonance energies. These aligned and summedspectral subdivisions are presented as the seven spectra in Figure 3a.Boundary Element Method Simulations. The experimental
data of this study is compared to numerical calculations using theBoundary Element Method.53,54 In particular, we used the MetallicNanoparticle Boundary Element Method MATLAB toolbox.55 In ourstudy, a three-dimensional implementation and electron beamexcitation source are used, allowing a fully rigorous simulation of thenanoparticle system geometry. Silver nanospheres (25 nm-diameter)with empirical bulk dielectric functions60 are used as the trimercomponents and the electron beam is placed to match theexperimental methods.The particles are simulated in free space (ε = 1) to reduce
computational complexity, but in so doing, ignore the influence of theSiO2 substrate. As a result, isolated 25 nm silver spheres resonate at 3.5eV rather than the 3.35 eV observed experimentally. Heuristically, this0.15 eV difference can be accounted for through the use of an effectivemedium of ε = 1.3, which is the weighted average of the permittivity ofsurrounding vacuum (ε = 1) and that of the membrane (ε = 2.1) usinga 2-to-1 ratio.61
For the edge excitation, BEM classical simulations model the trimerfrom an interparticle gap size of +0.5 nm down to particle contact at 0nm assuming that the particles approach each other in an isosceles-likeconfiguration; the separation distance between the two lower particlesis kept constant at 0.5 nm while the other two interparticle gaps sizesare reduced. After a physical connection is formed, the nanospheresare assumed to directly overlap with negative separation distances. Atangent toroidal surface (inner radius = 0.5 nm) is applied to reducethe sharpness of this contact and ease the convergence of thecalculations. This approach has been used in previous studies tosimplify particle merging evolution14,62
For the center excitation (Figure 5 and Supplemental InformationFigure 3), the three particles are assumed to converge equilaterally.After the physical contact, the three nanospheres are modeled todirectly overlap with negative separation distances. As in the previous
case, a tangent surface has been used to avoid singularities andfacilitate the convergence of the calculations.
The Quantum-Corrected Model (QCM) simulations wereemployed using the approach introduced in ref 15. The QCM definesan effective material to be inserted in the gap, characterized by afrequency-dependent classical conductivity σg (or equivalently,permittivity εg) chosen to mimic the charge transfer from quantumtunneling. σg is initially calculated for low energies and then properlyextended to high frequencies, in good agreement with the results ofTDDFT calculations. The effective conductivity σg varies exponentiallyas a function of the local distance between each pair of opposingpoints across the gap, as described in detail in ref 63. Once εg has beendefined, the optical response of the whole system is obtained with theBEM. As the simulation solves Maxwell’s equations based on adistribution of surface charges and currents rather than using spatiallyinhomogeneous volumes, we consider several shells with a particular σgcorresponding to a local separation distance. The shells extend onlythrough the region where the local distance is smaller than 0.5 nm, asthe tunneling substantially diminishes for larger separations. Weverified that three shells are sufficient to obtain converged results ofthe EELS spectra and the NF maps. In the QCM simulations, notangent surface is required after contact in order to converge thecalculations, as the presence of the distance-dependent effectivemedium avoids discontinuities. For overlapping particles, the negativeinterparticle separation distance is defined in classical calculations asthe length between the center of the particles minus the sum of theadjacent two particles’ radii. The QCM negative separation distancesare equivalent to those of the classical model when the area of theparticle contact junction necks are the same.
ASSOCIATED CONTENT
*S Supporting InformationThe Supporting Information is available free of charge on theACS Publications website at DOI: 10.1021/acsnano.5b06738.
Additional trimer simulation field maps in the classicalregime (PDF)
AUTHOR INFORMATION
Corresponding Authors*E-mail: [email protected].*E-mail: [email protected].
Author Contributions⊥J.A.S. and A.G.-E. contributed equally to this work.
NotesThe authors declare no competing financial interest.
ACKNOWLEDGMENTS
We thank Hadiseh Alaeian and Andrei Borissov for insightfuldiscussions. Use of the Stanford Nano Shared Facilities isappreciated. A.G.-E., G.A., R.E., and J.A acknowledge projectFIS2013-41184-P of the Spanish Ministry of Economy andCompetitiveness. J.A.S. and J.A.D. acknowledge funding from aPresidential Early Career Award administered through the AirForce Office of Scientific Research (FA9550-15-1-0006), aswell as funding from a National Science Foundation CAREERAward (DMR-1151231). Electron spectroscopy was partiallysupported by the DOE ‘Light-Material Interactions in EnergyConversion’ Energy Frontier Research Center under Grant DE-SC0001293. A.G.-E. and R.E. received funding from theFellows Gipuzkoa fellowship of the Gipuzkoako Foru Aldundiathrough the FEDER “Una Manera de hacer Europa”.
ACS Nano Article
DOI: 10.1021/acsnano.5b06738ACS Nano 2016, 10, 1346−1354
1352

REFERENCES(1) Atwater, H. A.; Polman, A. Plasmonics for Improved PhotovoltaicDevices. Nat. Mater. 2010, 9, 205−213.(2) Brongersma, M. L.; Halas, N. J.; Nordlander, P. Plasmon-InducedHot Carrier Science and Technology. Nat. Nanotechnol. 2015, 10, 25−34.(3) Christopher, P.; Xin, H.; Linic, S. Visible-Light-EnhancedCatalytic Oxidation Reactions on Plasmonic Silver Nanostructures.Nat. Chem. 2011, 3, 467−472.(4) Anker, J. N.; Hall, W. P.; Lyandres, O.; Shah, N. C.; Zhao, J.; VanDuyne, R. P. Biosensing with Plasmonic Nanosensors. Nat. Mater.2008, 7, 442−453.(5) Stiles, P. L.; Dieringer, J. A.; Shah, N. C.; Van Duyne, R. P.Surface-Enhanced Raman Spectroscopy. Annu. Rev. Anal. Chem. 2008,1, 601−626.(6) Adato, R.; Yanik, A. A.; Amsden, J. J.; Kaplan, D. L.; Omenetto, F.G.; Hong, M. K.; Erramilli, S.; Altug, H. Ultra-sensitive VibrationalSpectroscopy of Protein Monolayers with Plasmonic NanoantennaArrays. Proc. Natl. Acad. Sci. U. S. A. 2009, 106, 19227−19232.(7) Bardhan, R.; Lal, S.; Joshi, A.; Halas, N. J. TheranosticNanoshells: from Probe Design to Imaging and Treatment of Cancer.Acc. Chem. Res. 2011, 44, 936−946.(8) Huang, X.; El-Sayed, M. A. Gold nanoparticles: OpticalProperties and Implementations in Cancer Diagnosis and Photo-thermal Therapy. J. Adv. Res. 2010, 1, 13−28.(9) Oulton, R. F.; Sorger, V. J.; Zentgraf, T.; Ma, R.-M.; Gladden, C.;Dai, L.; Bartal, G.; Zhang, X. Plasmon Lasers at Deep SubwavelengthScale. Nature 2009, 461, 629−632.(10) Bergman, D.; Stockman, M. Surface Plasmon Amplification byStimulated Emission of Radiation: Quantum Generation of CoherentSurface Plasmons in Nanosystems. Phys. Rev. Lett. 2003, 90, 027402.(11) Baum, B.; Alaeian, H.; Dionne, J. A parity-time SymmetricCoherent Plasmonic Absorber-Amplifier. J. Appl. Phys. 2015, 117,063106.(12) Scholl, J. A.; Koh, A. L.; Dionne, J. A. Quantum PlasmonResonances of Individual Metallic Nanoparticles. Nature 2012, 483,421−427.(13) Zuloaga, J.; Prodan, E.; Nordlander, P. Quantum Description ofthe Plasmon Resonances of a Nanoparticle dimer. Nano Lett. 2009, 9,887−891.(14) Scholl, J. A.; García-Etxarri, A.; Koh, A. L.; Dionne, J. A.Observation of Quantum Tunneling Between Two PlasmonicNanoparticles. Nano Lett. 2013, 13, 564−569.(15) Esteban, R.; Borisov, A. G.; Nordlander, P.; Aizpurua, J. BridgingQuantum and Classical Plasmonics with a Quantum-Corrected Model.Nat. Commun. 2012, 3, 825.(16) Savage, K. J.; Hawkeye, M. M.; Esteban, R.; Borisov, A. G.;Aizpurua, J.; Baumberg, J. J. Revealing the Quantum Regime inTunnelling Plasmonics. Nature 2012, 491, 574−577.(17) Tan, S. F.; Wu, L.; Yang, J. K. W.; Bai, P.; Bosman, M.; Nijhuis,C. A. Quantum Plasmon Resonances Controlled by Molecular TunnelJunctions. Science 2014, 343, 1496−1499.(18) Hajisalem, G.; Nezami, M. S.; Gordon, R. Probing the QuantumTunneling Limit of Plasmonic Enhancement by Third HarmonicGeneration. Nano Lett. 2014, 14, 6651−6654.(19) Wu, L.; Duan, H.; Bai, P.; Bosman, M.; Yang, J. K. W.; Li, E.Fowler-Nordheim Tunneling Induced Charge Transfer PlasmonsBetween Nearly Touching Nanoparticles. ACS Nano 2013, 7, 707−716.(20) Zhu, W.; Crozier, K. B. Quantum Mechanical Limit toPlasmonic Enhancement as Observed by Surface-Enhanced RamanScattering. Nat. Commun. 2014, 5, 5228.(21) Cha, H.; Yoon, J. H.; Yoon, S. Probing Quantum PlasmonCoupling Using Gold Nanoparticle Dimers with Tunable InterparticleDistances Down to the Subnanometer Range. ACS Nano 2014, 8,8554−8563.(22) Merlein, J.; Kahl, M.; Zuschlag, A.; Sell, A.; Halm, A.; Boneberg,J.; Leiderer, P.; Leitenstorfer, A.; Bratschitsch, R. NanomechanicalControl of an Optical Antenna. Nat. Photonics 2008, 2, 230−233.
(23) Sheikholeslami, S. N.; García-Etxarri, A.; Dionne, J. A.Controlling the Interplay of Electric and Magnetic Modes via Fano-like Plasmon Resonances. Nano Lett. 2011, 11, 3927−3934.(24) Nazir, A.; Panaro, S.; Zaccaria, R. P.; Liberale, C.; Angelis, F. D.;Toma, A. Fano Coil-Type Resonance for Magnetic Hot-SpotGeneration. Nano Lett. 2014, 14, 3166−3171.(25) Shafiei, F.; Monticone, F.; Le, K. Q.; Liu, X.-X.; Hartsfield, T.;Alu, A.; Li, X. A subwavelength plasmonic metamolecule exhibitingmagnetic-based optical Fano resonance. Nat. Nanotechnol. 2013, 8,95−99.(26) García-Etxarri, A.; Dionne, J. A. Surface-Enhanced CircularDichroism Spectroscopy Mediated by Nonchiral Nanoantennas. Phys.Rev. B: Condens. Matter Mater. Phys. 2013, 87, 235409.(27) Fan, Z.; Zhang, H.; Govorov, A. O. Optical Properties of ChiralPlasmonic Tetramers: Circular Dichroism and Multipole Effects. J.Phys. Chem. C 2013, 117, 14770−14777.(28) Shalaev, V. M.; Cai, W.; Chettiar, U. K.; Yuan, H.-K.; Sarychev,A. K.; Drachev, V. P.; Kildishev, A. V. Negative Index of Refraction inOptical Metamaterials. Opt. Lett. 2005, 30, 3356−3358.(29) Enkrich, C.; Wegener, M.; Linden, S.; Burger, S.; Zschiedrich,L.; Schmidt, F.; Zhou, J. F.; Koschny, T.; Soukoulis, C. M. MagneticMetamaterials at Telecommunication and Visible Frequencies. Phys.Rev. Lett. 2005, 95, 203901.(30) Alu, A.; Engheta, N. The Quest for Magnetic Plasmons atOptical Frequencies. Opt. Express 2009, 17, 5723−5730.(31) Vallecchi, A.; Albani, M.; Capolino, F. Effect of Irregularities ofNanosatellites Position and Size on Collective Electric and MagneticPlasmonic Resonances in Spherical Nanoclusters. Opt. Express 2013,21, 7667−7685.(32) Atre, A. C.; García-Etxarri, A.; Alaeian, H.; Dionne, J. A. ABroadband Negative Index Metamaterial at Optical Frequencies. Adv.Opt. Mater. 2013, 1, 327−333.(33) Gomez, D. E.; Teo, Z. Q.; Altissimo, M.; Davis, T. J.; Earl, S.;Roberts, A. The Dark Side of Plasmonics. Nano Lett. 2013, 13, 3722−3728.(34) Baldi, A.; Narayan, T. C.; Koh, A. L.; Dionne, J. A. In SituDetection of Hydrogen-Induced Phase Transitions in IndividualPalladium Nanocrystals. Nat. Mater. 2014, 13, 1143−1148.(35) Fan, J. A.; Wu, C.; Bao, K.; Bao, J.; Bardhan, R.; Halas, N. J.;Manoharan, V. N.; Nordlander, P.; Shvets, G.; Capasso, F. Self-Assembled Plasmonic Nanoparticle Clusters. Science 2010, 328, 1135−1138.(36) Alegret, J.; Rindzevicius, T.; Pakizeh, T.; Alaverdyan, Y.;Gunnarsson, L.; Kall, M. Plasmonic Properties of Silver Trimers withTrigonal Symmetry Fabricated by Electron-Beam Lithography. J. Phys.Chem. C 2008, 112, 14313−14317.(37) Urzhumov, Y. A.; Shvets, G.; Fan, J. A.; Capasso, F.; Brandl, D.;Nordlander, P. Plasmonic Nanoclusters: a Path Towards Negative-Index Metafluids. Opt. Express 2007, 15, 14129−14145.(38) Brandl, D. W.; Mirin, N. A.; Nordlander, P. Plasmon Modes ofNanosphere Trimers and Quadrumers. J. Phys. Chem. B 2006, 110,12302−12310.(39) Chuntonov, L.; Haran, G. Trimeric Plasmonic Molecules: TheRole of Symmetry. Nano Lett. 2011, 11, 2440−2445.(40) Zohar, N.; Chuntonov, L.; Haran, G. The Simplest PlasmonicMolecules: Metal Nanoparticle Dimers and Trimers. J. Photochem.Photobiol., C 2014, 21, 26−39.(41) Batson, P. E.; Reyes-Coronado, A.; Barrera, R. G.; Rivacoba, A.;Echenique, P. M.; Aizpurua, J. Plasmonic Nanobilliards: ControllingNanoparticle Movement Using Forces Induced by Swift Electrons.Nano Lett. 2011, 11, 3388−3393.(42) Dadosh, T. Synthesis of Uniform Silver Nanoparticles with aControllable Size. Mater. Lett. 2009, 63, 2236−2238.(43) Nelayah, J.; Kociak, M.; Stephan, O.; García de Abajo, F. J.;Tence, M.; Henrard, L.; Taverna, D.; Pastoriza-Santos, I.; Liz-Marzan,L. M.; Colliex, C. Mapping Surface Plasmons on a Single MetallicNanoparticle. Nat. Phys. 2007, 3, 348−353.(44) Koh, A. L.; Bao, K.; Khan, I.; Smith, W. E.; Kothleitner, G.;Nordlander, P.; Maier, S. A.; McComb, D. W. Electron Energy-Loss
ACS Nano Article
DOI: 10.1021/acsnano.5b06738ACS Nano 2016, 10, 1346−1354
1353

Spectroscopy Silver Nanoparticles and Dimers: Influence of BeamDamage and Mapping of Dark Modes. ACS Nano 2009, 3, 3015−3022.(45) Reyes-Coronado, A.; Barrera, R.; Batson, P.; Echenique, P.;Rivacoba, A.; Aizpurua, J. Electromagnetic Forces on PlasmonicNanoparticles Induced by Fast Electron Beams. Phys. Rev. B: Condens.Matter Mater. Phys. 2010, 82, 235429.(46) Jose-Yacaman, M.; Gutierrez-Wing, C.; Miki, M.; Yang, D.-Q.;Piyakis, K. N.; Sacher, E. Surface Diffusion and Coalescence of MobileMetal Nanoparticles. J. Phys. Chem. B 2005, 109, 9703−9711.(47) Chen, Y.; Palmer, R. E.; Wilcoxon, J. P. Sintering of PassivatedGold Nanoparticles under the Electron Beam. Langmuir 2006, 22,2851−2855.(48) Lim, T. H.; McCarthy, D.; Hendy, S. C.; Stevens, K. J.; Brown,S. A.; Tilley, R. D. Real-time TEM and Kinetic Monte Carlo Studies ofthe Coalescence of Decahedral Gold Nanoparticles. ACS Nano 2009,3, 3809−3813.(49) Asoro, M. A.; Kovar, D.; Shao-Horn, Y.; Allard, L. F.; Ferreira, P.J. Coalescence and sintering of Pt Nanoparticles: in Situ Observationby Aberration-Corrected HAADF STEM. Nanotechnology 2010, 21,025701.(50) Koh, A. L.; Fernandez-Domínguez, A. I.; McComb, D. W.;Maier, S. A.; Yang, J. K. W. High-Resolution Mapping of Electron-Beam-Excited Plasmon Modes in Lithographically Defined GoldNanostructures. Nano Lett. 2011, 11, 1323−1330.(51) Ogut, B.; Talebi, N.; Vogelgesang, R.; Sigle, W.; van Aken, P. A.Toroidal Plasmonic Eigenmodes in Oligomer Nanocavities for theVisible. Nano Lett. 2012, 12, 5239−5244.(52) Cherqui, C.; Bigelow, N. W.; Vaschillo, A.; Goldwyn, H.;Masiello, D. J. Combined Tight-Binding and Numerical Electro-dynamics Understanding of the STEM/EELS Magneto-opticalResponses of Aromatic Plasmon-Supporting Metal Oligomers. ACSPhotonics 2014, 1, 1013−1024.(53) García de Abajo, F. J.; Howie, A. Relativistic Electron EnergyLoss and Electron-Induced Photon Emission in InhomogeneousDielectrics. Phys. Rev. Lett. 1998, 80, 5180.(54) García de Abajo, F. J.; Howie, A. Retarded Field Calculation ofElectron Energy Loss in Inhomogeneous Dielectrics. Phys. Rev. B:Condens. Matter Mater. Phys. 2002, 65, 115418.(55) Hohenester, U.; Trugler, A. MNPBEM - A Matlab Toolbox ForThe Simulation of Plasmonic Nanoparticles. Comput. Phys. Commun.2012, 183, 370−381.(56) Perez-Gonzalez, O.; Zabala, N.; Borisov, A. G.; Halas, N. J.;Nordlander, P.; Aizpurua, J. Optical Spectroscopy of ConductiveJunctions in Plasmonic Cavities. Nano Lett. 2010, 10, 3090−3095.(57) Marinica, D. C.; Kazansky, A. K.; Nordlander, P.; Aizpurua, J.;Borisov, A. G. Quantum plasmonics: Nonlinear Effects in the FieldEnhancement of a Plasmonic Nanoparticle Dimer. Nano Lett. 2012,12, 1333−1339.(58) Barbry, M.; Koval, P.; Marchesin, F.; Esteban, R.; Borisov, A. G.;Aizpurua, J.; Sanchez-Portal, D. Atomistic Near-Field Nanoplas-monics: Reaching Atomic-Scale Resolution in Nanooptics. NanoLett. 2015, 15, 3410−3419.(59) Hohenester, U. Quantum Corrected Model for PlasmonicNanoparticles: A Boundary Element Method Implementation. Phys.Rev. B: Condens. Matter Mater. Phys. 2015, 91, 205436.(60) Johnson, P. B.; Christy, R. W. Optical Constants of the NobleMetals. Phys. Rev. B 1972, 6, 4370.(61) Biteen, J.; Sweatlock, L.; Mertens, H.; Lewis, N.; Polman, A.;Atwater, H. Plasmon-Enhanced Photoluminescence of SiliconQuantum Dots: Simulation and Experiment. J. Phys. Chem. C 2007,111, 13372−13377.(62) Romero, I.; Aizpurua, J.; Bryant, G. W.; García De Abajo, F. J.Plasmons in Nearly Touching Metallic Nanoparticles: SingularResponse in the Limit of Touching Dimers. Opt. Express 2006, 14,9988−9999.(63) Esteban, R.; Zugarramurdi, A.; Zhang, P.; Nordlander, P.;García-Vidal, F. J.; Borisov, A. G.; Aizpurua, J. A Classical Treatment ofOptical Tunneling in Plasmonic Gaps: Extending the Quantum
Corrected Model to Practical Situations. Faraday Discuss. 2015, 178,151−183.
ACS Nano Article
DOI: 10.1021/acsnano.5b06738ACS Nano 2016, 10, 1346−1354
1354
Related Documents