Evolution of Codon Usage and Base Contents in Kinetoplastid Protozoans Fernando Alvarez, * 3-f Carlos RobeIlo,$ 78 and Marissa VignalP *Departament o de Genetica, Facultad de Medicina; ~Seccion Genetica Evolutiva, Facultad de Ciencias; SDepartamento de Bioquimica, Facultad de Medicina; and @eccion Bioquimica, Facultad de Ciencias, Universidad de la Republica, Montevideo, Uruguay In this study we analyze and compare the trends in codon usage in five representative species of kinetoplastid protozoans (Crithidia fasciculata, Leishmania donovani, L. major, Trypanosoma cruzi and T. brucei), with the purpose of investigating the processes underlying these trends. A principal component analysis shows that the G + C content at the third codon position represents the main source of codon-usage variation, both within species (among genes) and among species. The non-Trypanosoma species exhibit narrow distributions in codon usage, while both Trypanosoma species present large within-species heterogeneity. The three non-Trypanosoma species have very similar codon-usage preferences. These codon preferences are also shared by the highly expressed genes of T. cruzi and to a lesser degree by those of T. brucei. This leads to the conclusion that the codon preferences shared by these species are the ancestral ones in the kinetoplastids. On the other hand, the study of noncoding sequences shows that Trypanosoma species exhibit mutational biases toward A + T richness, while the non- Trypanosoma species present mutational pressure in the opposite direction. These data taken together allow us to infer the origin of the different codon-usage distributions observed in the five species studied. In C. fasciculata and Leishmania, both mutational biases and (translational) selection pull toward G + C richness, resulting in a narrow distribution. In Trypanosoma species the mutational pressure toward A + T richness produced a shift in their genomes that differentially affected coding and noncoding sequences. The effect of these pressures on the third codon position of genes seems to have been inversely proportional to the level of gene expression. Introduction It has been well-established in all organisms so far analyzed that synonymous codons are not randomly used (e.g., see Grantham et al. 1980; Wada et al. 1990). Biased codon usage may result from a diversity of factors. It has been suggested that translational efficiency (trans- lational selection) affects codon bias in highly expressed genes (Gouy and Gautier 1982). In line with this, it has been shown that the preferred codons in highly expressed genes of Escherichia coli (Ikemura 198 1) and Saccha- romyces cerevisiae ( Bennetzen and Hall 1982; Ikemura 1982) are recognized by the most abundant tRNAs. Mutational biases may affect codon usage in genes ex- pressed at low levels, since these are less constrained by translational pressures (Sharp and .Li 1986; Shields and Sharp 1987 ) . A large within-species heterogeneity in co- don usage has been reported in Dictiostelium discoideum Key words: codon punosoma, evolution. uwe, mutational pressure, kinetoplastid, Try- Address for correspondence and reprints: Fernando Alvarez, Sec- cih GenCtica Evolutiva, Facultad de Ciencias, T&in Narvaja 1674, CP 11200 Montevideo, Uruguay. Mol. Bid. Evul. 11(5):790-802. 1994. 0 1994 by The University of Chicago. All rights reserved. 0737-4038/94f 1105-0008$02.00 and attributed to the opposite effects of translational se- lection and mutational biases (Sharp and Devine 1989). In this paper we address the evolution of codon usage in kinetoplastids, a group of parasitic Protozoa that comprises a large number of species. Two forms of host-protozoan relationships are known: monogenetic kinetoplastids, which have a single invertebrate host, and digenetic kinetoplastids, which are parasitic of two hosts, usually a vertebrate and an invertebrate. The former group comprises four genera: Crithidia, Leptomonas, Herpetomonas, and Blastochritidia, whereas digenetic species belong to two genera: Leishmania and Trypa- nosoma. Phylogenetic analysis based on sequence, bio- chemical, morphological, and life-cycle data (Lake et al. 1988) has postulated that digenetic species have arisen from a monogenetic ancestor. Previous studies of codon usage in T. brucei have shown that this species presents a great heterogeneity of codon preferences among different kinds of genes (Michels 1986; Parsons et al. 199 1). Other studies (Langford et al. 1992) have revealed that Leishmania species presents a high preference for C- and G-ending codons. Alonso et al. ( 1992)) comparing total codon frequencies, found that C. fasciculata and Leishmania 790 by guest on November 24, 2015 http://mbe.oxfordjournals.org/ Downloaded from

Welcome message from author
This document is posted to help you gain knowledge. Please leave a comment to let me know what you think about it! Share it to your friends and learn new things together.
Transcript
Evolution of Codon Usage and Base Contents in Kinetoplastid Protozoans
Fernando Alvarez, * 3-f Carlos RobeIlo,$ 78 and Marissa VignalP *Departament o de Genetica, Facultad de Medicina; ~Seccion Genetica Evolutiva, Facultad de Ciencias; SDepartamento de Bioquimica, Facultad de Medicina; and @eccion Bioquimica, Facultad de Ciencias, Universidad de la Republica, Montevideo, Uruguay
In this study we analyze and compare the trends in codon usage in five representative species of kinetoplastid protozoans (Crithidia fasciculata, Leishmania donovani, L. major, Trypanosoma cruzi and T. brucei), with the purpose of investigating the processes underlying these trends. A principal component analysis shows that the G + C content at the third codon position represents the main source of codon-usage variation, both within species (among genes) and among species. The non-Trypanosoma species exhibit narrow distributions in codon usage, while both Trypanosoma species present large within-species heterogeneity. The three non-Trypanosoma species have very similar codon-usage preferences. These codon preferences are also shared by the highly expressed genes of T. cruzi and to a lesser degree by those of T. brucei. This leads to the conclusion that the codon preferences shared by these species are the ancestral ones in the kinetoplastids. On the other hand, the study of noncoding sequences shows that Trypanosoma species exhibit mutational biases toward A + T richness, while the non- Trypanosoma species present mutational pressure in the opposite direction. These data taken together allow us to infer the origin of the different codon-usage distributions observed in the five species studied. In C. fasciculata and Leishmania, both mutational biases and (translational) selection pull toward G + C richness, resulting in a narrow distribution. In Trypanosoma species the mutational pressure toward A + T richness produced a shift in their genomes that differentially affected coding and noncoding sequences. The effect of these pressures on the third codon position of genes seems to have been inversely proportional to the level of gene expression.
Introduction
It has been well-established in all organisms so far analyzed that synonymous codons are not randomly used (e.g., see Grantham et al. 1980; Wada et al. 1990). Biased codon usage may result from a diversity of factors. It has been suggested that translational efficiency (trans- lational selection) affects codon bias in highly expressed genes (Gouy and Gautier 1982). In line with this, it has been shown that the preferred codons in highly expressed genes of Escherichia coli (Ikemura 198 1) and Saccha- romyces cerevisiae ( Bennetzen and Hall 1982; Ikemura 1982) are recognized by the most abundant tRNAs. Mutational biases may affect codon usage in genes ex- pressed at low levels, since these are less constrained by translational pressures (Sharp and .Li 1986; Shields and Sharp 1987 ) . A large within-species heterogeneity in co- don usage has been reported in Dictiostelium discoideum
Key words: codon punosoma, evolution.
uwe, mutational pressure, kinetoplastid, Try-
Address for correspondence and reprints: Fernando Alvarez, Sec- cih GenCtica Evolutiva, Facultad de Ciencias, T&in Narvaja 1674, CP 11200 Montevideo, Uruguay.
Mol. Bid. Evul. 11(5):790-802. 1994. 0 1994 by The University of Chicago. All rights reserved. 0737-4038/94f 1105-0008$02.00
and attributed to the opposite effects of translational se- lection and mutational biases (Sharp and Devine 1989).
In this paper we address the evolution of codon usage in kinetoplastids, a group of parasitic Protozoa that comprises a large number of species. Two forms of host-protozoan relationships are known: monogenetic kinetoplastids, which have a single invertebrate host, and digenetic kinetoplastids, which are parasitic of two hosts, usually a vertebrate and an invertebrate. The former group comprises four genera: Crithidia, Leptomonas, Herpetomonas, and Blastochritidia, whereas digenetic species belong to two genera: Leishmania and Trypa- nosoma. Phylogenetic analysis based on sequence, bio- chemical, morphological, and life-cycle data (Lake et al. 1988) has postulated that digenetic species have arisen from a monogenetic ancestor.
Previous studies of codon usage in T. brucei have shown that this species presents a great heterogeneity of codon preferences among different kinds of genes (Michels 1986; Parsons et al. 199 1). Other studies (Langford et al. 1992) have revealed that Leishmania species presents a high preference for C- and G-ending codons. Alonso et al. ( 1992)) comparing total codon frequencies, found that C. fasciculata and Leishmania
790
by guest on Novem
ber 24, 2015http://m
be.oxfordjournals.org/D
ownloaded from
Evolution of Codon Usage 791
species exhibit very similar codon usage, whereas 7’. cruzi shares some codon patterns with Crithidia and Leish- mania but in general is more closely related to T. brucei.
The aim of this work is to characterize and compare codon-usage trends in different kinetoplastid species, as well as to analyze these trends from an evolutionary standpoint. For this purpose, we have chosen five species of this family (C. fasciculata, L. major, L. donovani, T. brucei, and T. cruzi) that are representative of mono- genetic and digenetic kinetoplastids and for which a substantial amount of sequence data is available.
Material and Methods Sequences
The sequences used in this work (listed in table 1) were obtained from GenBank Release 76.0 (April 1993) and from new entries up to 1 June 1993. They comprise 84 sequences from Trypanosoma brucei (41,169 co- dons), 47 from T. cruzi (22,740 codons), 12 from Crithidia fasciculata (5,6 18 codons), 13 from Leish- mania major (4,622 codons), and 2 1 from L. donovani ( 10,859 codons). It should be noted that two sequences from L. infantum (X680 15 and X680 16) and three from L. chagasi (M32807, S53127, and L15559) were in- cluded in the L. donovani sample because these three Leishmania species have little if any genetic differences (van Eys et al. 1989).
Codon-Usage Data To minimize sampling errors, only those sequences
that are more than 100 codons in length were taken into account for codon-frequency computing. An exception to this rule was allowed with T. cruzi tubulin gene, be- cause information about its sequence is available in more than one species and therefore it is useful for comparative studies. Trp, Met, and termination codons were excluded from both codon-usage analysis and the calculation of G + C content at the third codon position (GC3 ) , since Trp and Met codons are not degenerate and termination codons appear only once in each gene.
Analysis In order to get a general picture of the trends in
codon usage of the group, a principal component analysis ( PCA) was performed. This analysis was carried out on the covariance matrix, which was calculated using codon frequencies as variables and genes as observations. For the analysis of variance and multiple comparisons, fre- quency data were subjected to the angular transforma- tion (arcsin 6).
Results and Discussion Codon Usage
The positions of the 177 genes analyzed in the two first principal components are shown in figure 1. The
first principal component (horizontal axis) explains 45.5% of total variation. This component is highly cor- related with G + C content at the third codon position (r = 0.978; P = 0.0). Therefore, the genes falling to the right in figure 1 present a higher GC3 content than do those located toward the left. Very similar results (first principal variable highly correlated with GC3) are ob- tained if the same analysis is performed separately for each species (data not shown). Thus, G + C content at silent sites represents the main source of codon-usage variation, both within species (among genes) and among species.
The distributions of Trypanosoma brucei and T. cruzi are widely spread on the horizontal axis. Neverthe- less, two differences can be appreciated between the two species: (a) In T. brucei the distribution is rather oblique to the horizontal axis. This is in agreement with the PCA results obtained when the analysis is performed only with T. brucei genes, where the first principal variable is less correlated with GC3 ( r = 0.9 18). This may in- dicate that in T. brucei the major trend differentiating codon-usage preferences among genes is mainly but not exclusively due to GC3 variation. (b) In T. brucei the whole distribution is shifted toward A + T richness. It is worth noting that homologous genes of these two Try- panosoma species occupy similar positions relative to the overall distribution of their respective species. For example, genes coding for calmodulin, ubiquitin, Hsp70, Hsp83, glycosomal glyceraldehyde-phosphate-dehydro- genase (gGAPDH ), major paraflagellar rod protein, and tubulin genes are placed to the rightmost (G + C rich- ness) part of T. cruzi and T. brucei distributions, whereas topoisomerase II and tripanothione reductase genes are situated near the middle of the distributions in both spe- cies. Thus each T. cruzi gene is richer in GC3 content than is its T. brucei homologue (Table 1).
In contrast to those of T. cruzi and T. brucei, the distributions of Crithidia fasciculata, Leishmania major and L. donovani are relatively narrow around high G + C values at third codon positions. Even if the number of genes analyzed in these species is rather small, genes falling on opposite ends in T. brucei (such as those coding for Hsp70 and ornithine descarboxylase) lie very close in L. donovani. This strongly suggests that the distri- butions of these nontrypanosome species are indeed narrow and not caused by the rather low number of genes considered.
To investigate the trend in codon usage along the first principal component, we divided the range of vari- ation of T. cruzi and T. brucei into three equal parts (in width) and then tabulated the codon usage of each part separately. The results are presented in table 2, along with the codon usage of C. fasciculata, L. donovani, and
by guest on Novem
ber 24, 2015http://m
be.oxfordjournals.org/D
ownloaded from
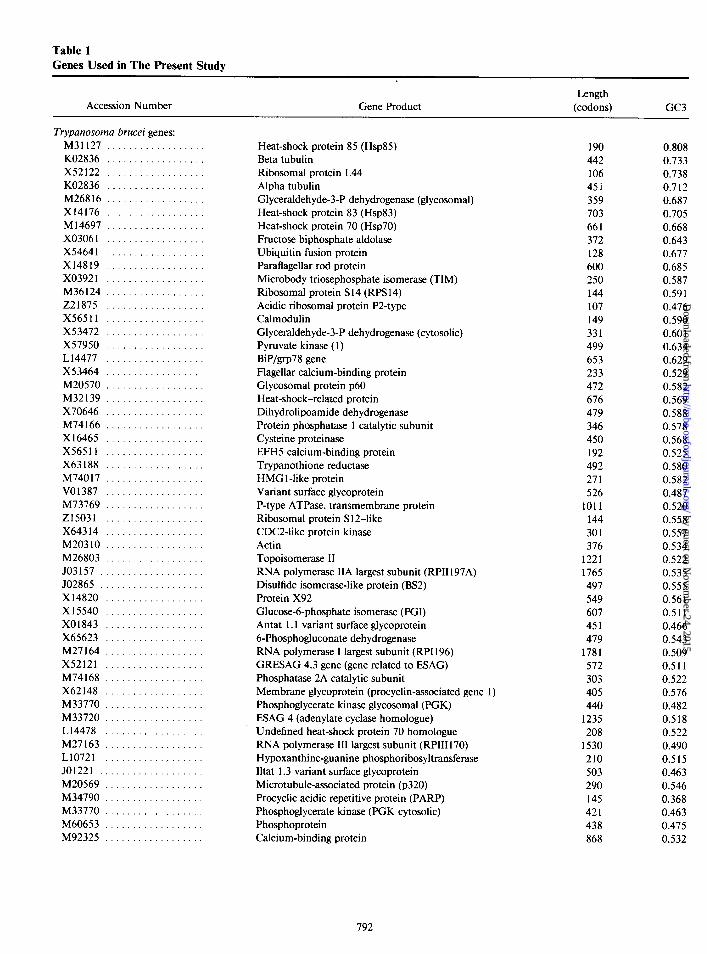
Table 1 Genes Used in The Present Study
Trypanosoma brucei genes: M31127 .................. K02836 .................. x52122 .................. K02836 .................. M26816 .................. X14176 .................. Ml4697 .................. X03061 .................. X54641 .................. X14819 .................. X03921 .................. M36124 .................. 221875 .................. X56511 .................. X53472 .................. x57950 .................. L14477 .................. X53464 .................. M20570 .................. M32139 .................. X70646 .................. M74166 .................. Xl6465 .................. X56511 .................. X63188 .................. M74017 .................. V01387 .................. M73769 .................. 215031 .................. X64314 .................. M20310 .................. M26803 .................. JO3157 ................... JO2865 ................... X14820 .................. x15540 .................. X01843 .................. X65623 .................. M27164 .................. X52121 .................. M74168 .................. X62148 .................. M33770 .................. M33720 .................. L14478 .................. M27163 .................. L10721 .................. JO1221 ................... M20569 .................. M34790 .................. M33770 .................. M60653 .................. M92325 ..................
Heat-shock protein 85 (Hsp85) Beta tubulin Ribosomal protein L44 Alpha tubulin Glyceraldehyde-3-P dehydrogenase (glycosomal) Heat-shock protein 83 (Hsp83) Heat-shock protein 70 (Hsp70) Fructose biphosphate aldolase Ubiquitin fusion protein Paraflagellar rod protein Microbody triosephosphate isomerase (TIM) Ribosomal protein S 14 (RPS 14) Acidic ribosomal protein P2-type Calmodulin Glyceraldehyde-3-P dehydrogenase (cytosolic) Pyruvate kinase (1) BiP/grp78 gene Flagellar calcium-binding protein Glycosomal protein p60 Heat-shock-related protein Dihydrolipoamide dehydrogenase Protein phosphatase 1 catalytic subunit Cysteine proteinase EFHS calcium-binding protein Trypanothione reductase HMG 1 -like protein Variant surface glycoprotein P-type ATPase, transmembrane protein Ribosomal protein S 12-like CDC2-like protein kinase Actin Topoisomerase II RNA polymerase IIA largest subunit (RPII 197A) Disulfide isomerase-like protein (BS2) Protein X92 Glucosed-phosphate isomerase (PGI) Antat 1.1 variant surface glycoprotein 6-Phosphogluconate dehydrogenase RNA polymerase I largest subunit (RPI 196) GRESAG 4.3 gene (gene related to ESAG) Phosphatase 2A catalytic subunit Membrane glycoprotein (procyclin-associated gene 1) Phosphoglycerate kinase glycosomal (PGK) ESAG 4 (adenylate cyclase homologue) Undefined heat-shock protein 70 homologue RNA polymerase III largest subunit (RPIII170) Hypoxanthine-guanine phosphoribosyltransferase Iltat 1.3 variant surface glycoprotein Microtubule-associated protein (~320) Procyclic acidic repetitive protein (PARP) Phosphoglycerate kinase (PGK cytosolic) Phosphoprotein Calcium-binding protein
190 0.808 442 0.733 106 0.738 45i 0.712 359 0.687 703 0.705 661 0.668 372 0.643 128 0.677 600 0.685 250 0.587 144 0.59 1 107 0.476 149 0.590 331 0.60 1 499 0.634 653 0.629 233 0.529 472 0.582 676 0.569 479 0.588 346 0.578 450 0.568 192 0.525 492 0.580 271 0.582 526 0.487
1011 0.520 144 0.558 301 0.557 376 0.534
1221 0.522 1765 0.535 497 0.555 549 0.561 607 0.5 11 451 0.466 479 0.543
1781 0.509 572 0.511 303 0.522 405 0.576 440 0.482
1235 0.518 208 0.522
1530 0.490 210 0.515 503 0.463 290 0.546 145 0.368 421 0.463 438 0.475 868 0.532
792
by guest on Novem
ber 24, 2015http://m
be.oxfordjournals.org/D
ownloaded from
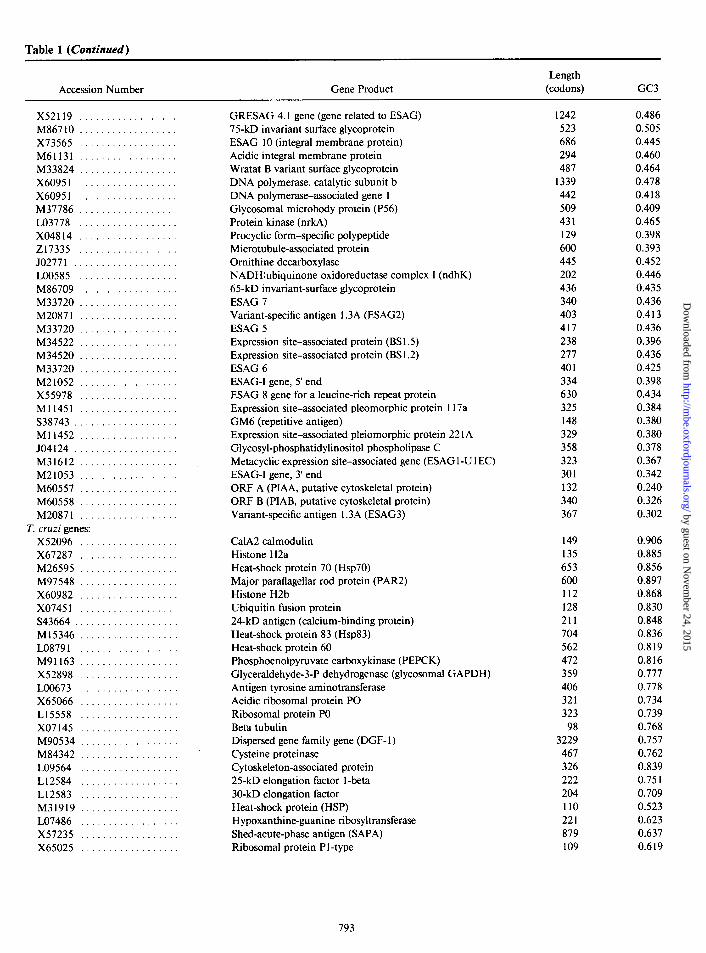
Table 1 (Continued)
Accession Number Gene Product Length
(codons) GC3
X52119 .................. M86710 .................. X73565 .................. M61131 .................. M33824 .................. X60951 .................. X60951 .................. M37786 .................. LO3778 .................. X04814 .................. 217335 .................. JO2771 ................... LOO585 .................. M86709 .................. M33720 .................. M20871 .................. M33720 .................. M34522 .................. M34520 .................. M33720 .................. M21052 .................. X55978 .................. Ml1451 .................. S38743 ................... Ml1452 .................. JO4124 ................... M31612 .................. M21053 .................. M60557 .................. M60558 .................. M20871 ..................
T. cruzi genes: X52096 .................. X67287 .................. M26595 .................. M97548 .................. X60982 .................. x07451 .................. S43664.. ................. Ml5346 .................. LO8791 .................. M91163 .................. X52898 .................. LOO673 .................. X65066 .................. L15558 .................. x07145 .................. M90534 .................. M84342 .................. LO9564 .................. L12584 .................. L12583 .................. M31919 .................. LO7486 .................. X57235 .................. X65025 ..................
GRESAG 4.1 gene (gene related to ESAG) 75-kD invariant surface glycoprotein ESAG 10 (integral membrane protein) Acidic integral membrane protein Wratat B variant surface glycoprotein DNA polymerase, catalytic subunit b DNA polymerase-associated gene 1 Glycosomal microbody protein (P56) Protein kinase (nrkA) Procyclic form-specific polypeptide Microtubule-associated protein Ornithine decarboxylase NADH:ubiquinone oxidoreductase complex I (ndhK) 65-kD invariant-surface glycoprotein ESAG 7 Variant-specific antigen 1.3A (ESAG2) ESAG 5 Expression site-associated protein (BS 1.5) Expression site-associated protein (BS 1.2) ESAG 6 ESAG-I gene, 5’ end ESAG 8 gene for a leucine-rich repeat protein Expression site-associated pleomorphic protein 117a GM6 (repetitive antigen) Expression site-associated pleiomorphic protein 22 1 A Glycosyl-phosphatidylinositol phospholipase C Metacyclic expression site-associated gene (ESAG 1 -U 1 EC) ESAG-I gene, 3’ end ORF A (PIAA, putative cytoskeletal protein) ORF B (PIAB, putative cytoskeletal protein) Variant-specific antigen 1.3A (ESAG3)
1242 0.486 523 0.505 686 0.445 294 0.460 487 0.464
1339 0.478 442 0.418 509 0.409 431 0.465 129 0.398 600 0.393 445 0.452 202 0.446 436 0.435 340 0.436 403 0.413 417 0.436 238 0.396 277 0.436 401 0.425 334 0.398 630 0.434 325 0.384 148 0.380 329 0.380 358 0.378 323 0.367 301 0.342 132 0.240 340 0.326 367 0.302
CalA calmodulin 149 0.906 Histone H2a 135 0.885 Heat-shock protein 70 (Hsp70) 653 0.856 Major paraflagellar rod protein (PAR2) 600 0.897 Histone H2b 112 0.868 Ubiquitin fusion protein 128 0.830 24-kD antigen (calcium-binding protein) 211 0.848 Heat-shock protein 83 (Hsp83) 704 0.836 Heat-shock protein 60 562 0.819 Phosphoenolpyruvate carboxykinase (PEPCK) 472 0.816 Glyceraldehyde-3-P dehydrogenase (glycosomal GAPDH) 359 0.777 Antigen tyrosine aminotransferase 406 0.778 Acidic ribosomal protein PO 321 0.734 Ribosomal protein PO 323 0.739 Beta tubulin 98 0.768 Dispersed gene family gene (DGF- 1) 3229 0.757 Cysteine proteinase 467 0.762 Cytoskeleton-associated protein 326 0.839 25-kD elongation factor l-beta 222 0.75 1 30-kD elongation factor 204 0.709 Heat-shock protein (HSP) 110 0.523 Hypoxanthine-guanine ribosyltransferase 221 0.623 Shed-acute-phase antigen (SAPA) 879 0.637 Ribosomal protein P 1 -type 109 0.619
793
by guest on Novem
ber 24, 2015http://m
be.oxfordjournals.org/D
ownloaded from
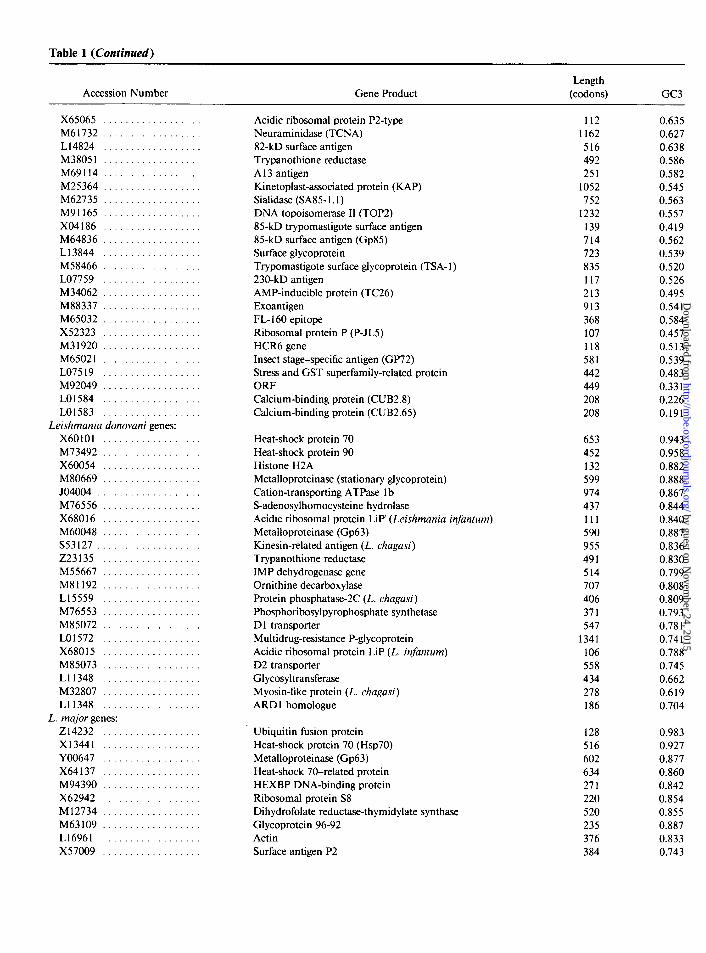
Table 1 (Continued)
Accession Number Gene Product Length
(codons) GC3
X65065 .................. M61732 .................. L14824 .................. M38051 .................. M69114 .................. M25364 .................. M62735 .................. M91165 .................. X04186 .................. M64836 .................. L13844 .................. M58466 .................. LO7759 .................. M34062 ................... M88337 .................. M65032 .................. X52323 .................. M31920 .................. M65021 .................. LO7519 .................. M92049 .................. LO1584 .................. LO1583 ..................
Leishmania donovani genes: X60101 .................. M73492 .................. X60054 .................. M80669 .................. JO4004 ................... M76556 .................. X68016 .................. M60048 .................. S53127 ................... 223135 .................. M55667 .................. M81192 .................. Ll5559 .................. M76553 .................. M85072 .................. LO1572 .................. X68015 .................. M85073 .................. Ll1348 .................. M32807 .................. Ll1348 ..................
L. major genes: 214232 .................. x13441 .................. YO0647 .................. X64137 .................. M94390 .................. X62942 .................. Ml2734 .................. M63109 .................. Ll6961 .................. x57009 ..................
Acidic ribosomal protein P2-type 112 0.635 Neuraminidase (TCNA) 1162 0.627 82-kD surface antigen 516 0.638 Trypanothione reductase 492 0.586 A 13 antigen 251 0.582 Kinetoplast-associated protein (RAP) 1052 0.545 Sialidase (SA85- 1.1) 752 0.563 DNA topoisomerase II (TOP2) 1232 0.557 85-kD trypomastigote surface antigen 139 0.419 85-kD surface antigen (Gp85) 714 0.562 Surface glycoprotein 723 0.539 Trypomastigote surface glycoprotein (TSA- 1) 835 0.520 230-kD antigen 117 0.526 AMP-inducible protein (TC26) 213 0.495 Exoantigen 913 0.54 1 FL- 160 epitope 368 0.584 Ribosomal protein P (P-JL5) 107 0.457 HCR6 gene 118 0.513 Insect stage-specific antigen (GP72) 581 0.539 Stress and GST superfamily-related protein 442 0.483 ORF 449 0.331 Calcium-binding protein (CUB2.8) 208 0.226 Calcium-binding protein (CUB2.65) 208 0.191
Heat-shock protein 70 653 0.943 Heat-shock protein 90 452 0.958 Histone H2A 132 0.882 Metalloproteinase (stationary glycoprotein) 599 0.888 Cation-transporting ATPase 1 b 974 0.867 S-adenosylhomocysteine hydrolase 437 0.844 Acidic ribosomal protein LiP’ (Leishmania in&turn) 111 0.840 Metalloproteinase (Gp63) 590 0.887 Kinesin-related antigen (L. chagasi) 955 0.836 Trypanothione reductase 491 0.830 IMP dehydrogenase gene 514 0.799 Ornithine decarboxylase 707 0.808 Protein phosphatase-2C (L. chagasi) 406 0.809 Phosphoribosylpyrophosphate synthetase 371 0.793 D 1 transporter 547 0.78 1 Multidrug-resistance P-glycoprotein 1341 0.74 1 Acidic ribosomal protein LIP (L. infanturn) 106 0.788 D2 transporter 558 0.745 Glycosyltransferase 434 0.662 Myosin-like protein (L. chagasi) 278 0.619 ARD 1 homologue 186 0.704
Ubiquitin fusion protein 128 0.983 Heat-shock protein 70 (Hsp70) 516 0.927 Metalloproteinase (Gp63) 602 0.877 Heat-shock 70-related protein 634 0.860 HEXBP DNA-binding protein 271 0.842 Ribosomal protein S8 220 0.854 Dihydrofolate reductase-thymidylate synthase 520 0.855 Glycoprotein 96-92 235 0.887 Actin 376 0.833 Surface antigen P2 384 0.743
by guest on Novem
ber 24, 2015http://m
be.oxfordjournals.org/D
ownloaded from

Evolution of Codon Usage 795
Table 1 (Continued)
Accession Number Gene Product Length
(codons) GC3
x14575 .................. X06555 .................. LO1699 ..................
Crithidia fasciculata genes: M73324 .................. x07459 .................. 223078 .................. x13490 .................. M94365 .................. Xl3489 .................. M22852 .................. M94364 .................. X59623 .................. X17251 .................. 212149 .................. L18916 ..................
Heat-shock 70-related protein 228 0.779 Membrane antigen 214 0.779 Aldoketo reductase 287 0.724
Trypanothione reductase 491 0.960 Phosphoglycerate kinase (cytosolic) 455 0.902 DNA ligase I 334 0.920 DNA polymerase, 3’ fragment 156 0.895 Metalloproteinase gene, 5’ fragment 121 0.88 1 DNA polymerase, 5’ fragment 295 0.846 Dihyrofolate reductase 515 0.860 Metalloproteinase gene, 3’ fragment 531 0.850 Topoisomerase II 1239 0.857 Phosphoglycerate kinase (glycosomal) 505 0.819 CDCZlike protein 474 0.792 Ribonuclease H (RNH 1) 494 0.688
NOTE.-For each species, the genes are ordered according to their positions (from right to left) in the horizontal axis of fig. 1.
L. major. In relation to this table, several aspects must be pointed out:
a) In the right part of the distributions in both 7’. cruzi and T. brucei (TC 1 and TB 1) all twofold-degen- erate codons prefer C or G as their ending base. This preference decreases toward the left part of the distri- bution. In fact, the preference is almost always inverted, giving rise to a preference for U- or A-ending codons.
b) In the groups of fourfold-degenerate codons of both TCl and TBl, the preferred codon is always a G- or a C-ending one (excepting glycine in T. brucei). This preference for C- and G-ending codons decreases toward the left part of the distribution in both Trypanosoma
I I 1 I I /
. 1
0 008 A
I 1 I I I J
-1 0 1 2 3
FIG. I .-Principal components analysis of codon usage on 177 kinetoplastid genes. The points represent the positions of each gene in the first two axes. Blackened triangles represent Trypanosoma brucei; blackened squares represent T. cruzi; unblackened diamonds represent Leishmania donovani; unblackened triangles represent L. major; and unblackened circles represent Crithidia fasciculata.
species, where U- and A-ending ones appear to be pre- ferred in TC3 and TB3 (excepting valine in both spe- ties) .
c) The nontrypanosome species have a highly biased codon usage, where C- and G-ending codons are by far preferred. These three species have very similar codon usages. This similitude in codon usage is not only the result of the G + C richness at the third-codon po- sition that these species exhibit, since the order of codon preference for a given fourfold-degenerate codon group is the same in the three non-Trypsanosoma species (ex- cepting glycine, whose order is C > G = U > A in C. fasciculata and C > U > G > A in both Leishmania species; also, there are swappings among the minor co- dons of threonine and alanine).
d) The GC3-rich group of T. cruzi (TCl ) has co- don-usage preferences very similar to those of non-Try- panosoma species. As it occurs between leishmanias and C. fasciculata, the similarities are not restricted to two- fold-degenerate codons. In all fourfold-degenerate co- dons the order of preference is identical or very similar to that of Leishmania species and C. fasciculata.
e) In T. brucei, the GC3-rich group (TB 1) presents a codon usage similar to that of leishmanias and C. Fas- ciculata. Nevertheless, the similarity is not as strong as in T. cruzi. Again, the resemblance is not only the result of GC3 richness, since it is not restricted to twofold- degenerate codons. In threonine, leucine, and isoleucine codon groups, the order of codon preferences is the same as in nontrypanosomes. In arginine and valine codons, the preferred codon is the same as in nontrypanosomes, while in the remaining codon groups (glycine, alanine,
by guest on Novem
ber 24, 2015http://m
be.oxfordjournals.org/D
ownloaded from
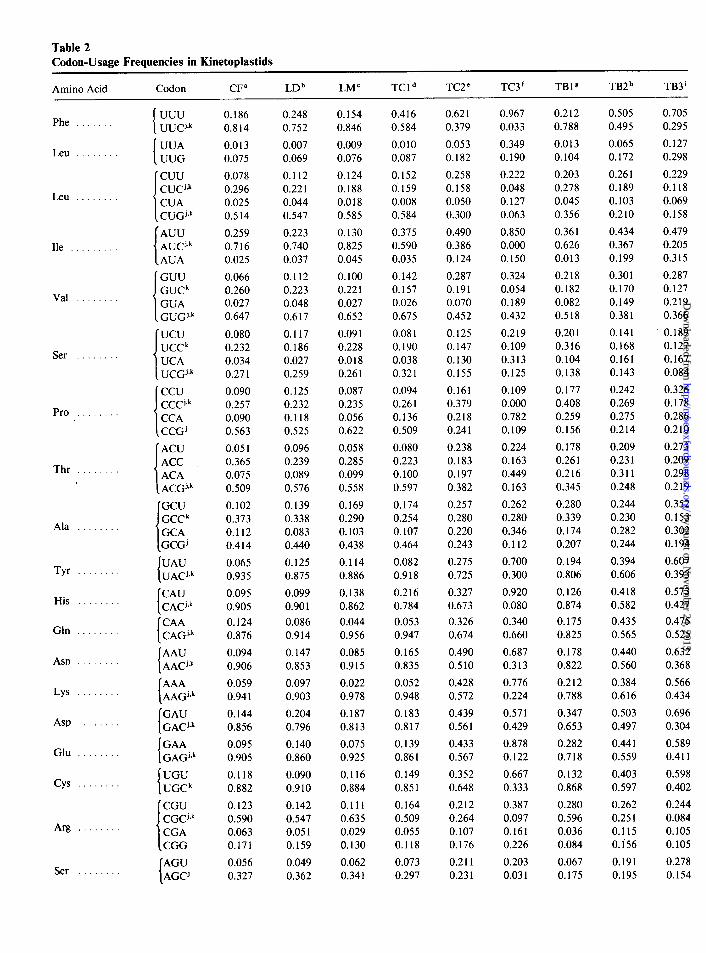
Table 2 Codon-Usage Frequencies in Kinetoplastids
Amino Acid Codon CF” LDb LMC TCld TC2” TC3f TBlg TB2h TB3 i
Phe . . . . .
Leu
Leu
Ile
Val
Ser
Pro
Thr
Ala
Tyr
His
Gln
Asn
LYS
Asp
Glu
Arg
Ser
UUA UUG
‘CUU CUek CUA L CUG’vk
i
AUU AUCjqk AUA
GUU GUCk GUA
. GUG’vk
ucu 0.080 0.117 0.09 1 UCCk 0.232 0.186 0.228 UCA 0.034 0.027 0.018 UCG’T~ 0.27 1 0.259 0.26 1
ecu 0.090 0.125 0.087 CCC’yk 0.257 0.232 0.235 CCA 0.090 0.118 0.056 CCG’ 0.563 0.525 0.622
ACU ACC ACA ACG’vk
‘GCU GCCk GCA
,GCG’
I
UAU UACjvk
I
CAU CAC’*k
CAA CAG’vk
AAU AACjvk
AAA AAGjsk
I
GAU GACjTk
(
GAA GAGjTk
[
UGU UGCk
CGU CGC’vk CGA CGG
AGU AGC’
0.186 0.248 0.814 0.752
0.013 0.007 0.075 0.069
0.078 0.112 0.296 0.22 1 0.025 0.044 0.5 14 0.547
0.259 0.223 0.716 0.740 0.025 0.037
0.066 0.112 0.260 0.223 0.027 0.048 0.647 0.617
0.154 0.846
0.009 0.076
0.124 0.188 0.018 0.585
0.130 0.825 0.045
0.100 0.22 1 0.027 0.652
0.416 0.584
0.010 0.087
0.62 1 0.379
0.053 0.182
0.152 0.258 0.159 0.158 0.008 0.050 0.584 0.300
0.375 0.490 0.590 0.386 0.035 0.124
0.142 0.287 0.157 0.191 0.026 0.070 0.675 0.452
0.967 0.033
0.349 0.190
0.222 0.048 0.127 0.063
0.850 0.000 0.150
0.324 0.054 0.189 0.432
0.219 0.109 0.313 0.125
0.109 0.000 0.782 0.109
0.212 0.788
0.013 0.104
0.203 0.278 0.045 0.356
0.36 1 0.626 0.013
0.218 0.182 0.082 0.518
0.20 1 0.316 0.104 0.138
0.177 0.408 0.259 0.156
0.178 0.26 1 0.216 0.345
0.280 0.339 0.174 0.207
0.194 0.806
0.126 0.874
0.175 0.825
0.178 0.822
0.212 0.788
0.347 0.653
0.282 0.718
0.132 0.868
0.280 0.596 0.036 0.084
0.067 0.175
0.505 0.495
0.065 0.172
0.26 1 0.189 0.103 0.210
0.434 0.367 0.199
0.301 0.170 0.149 0.38 1
0.141 0.168 0.161 0.143
0.705 0.295
0.127 0.298
0.229 0.118 0.069 0.158
0.479 0.205 0.315
0.287 0.127 0.219 0.366
0.05 1 0.365 0.075 0.509
0.102 0.373 0.112 0.414
0.065 0.935
0.095 0.905
0.124 0.876
0.094 0.906
0.059 0.94 1
0.144 0.856
0.095 0.905
0.118 0.882
0.123 0.590 0.063 0.171
0.056 0.327
0.096 0.239 0.089 0.576
0.139 0.338 0.083 0.440
0.125 0.875
0.099 0.90 1
0.086 0.914
0.147 0.853
0.097 0.903
0.204 0.796
0.140 0.860
0.090 0.910
0.142 0.547 0.05 1 0.159
0.049 0.362
0.08 1 0.190 0.038 0.321
0.094 0.26 1 0.136 0.509
0.058 0.080 0.285 0.223 0.099 0.100 0.558 0.597
0.169 0.290 0.103 0.438
0.114 0.886
0.138 0.862
0.044 0.956
0.174 0.254 0.107 0.464
0.082 0.918
0.085 0.915
0.022 0.978
0.187 0.813
0.075 0.925
0.116 0.884
0.216 0.784
0.053 0.947
0.165 0.835
0.052 0.948
0.183 0.817
0.139 0.8’6 1
0.149 0.85 1
0.111 0.164 0.635 0.509 0.029 0.055 0.130 0.118
0.062 0.073 0.341 0.297
0.125 0.147 0.130 0.155
0.161 0.379 0.218 0.24 1
0.238 0.183 0.197 0.382
0.257 0.280 0.220 0.243
0.275 0.725
0.327 0.673
0.326 0.674
0.490 0.5 10
0.428 0.572
0.439 0.561
0.433 0.567
0.352 0.648
0.212 0.264 0.107 0.176
0.211 0.23 1
0.224 0.163 0.449 0.163
0.262 0.280 0.346 0.112
0.700 0.300
0.920 0.080
0.340 0.660
0.687 0.313
0.776 0.224
0.57 1 0.429
0.878 0.122
0.667 0.333
0.387 0.097 0.161 0.226
0.203 0.03 1
0.242 0.269 0.275 0.214
0.209 0.23 1 0.311 0.248
0.244 0.230 0.282 0.244
0.394 0.606
0.418 0.582
0.435 0.565
0.440 0.560
0.384 0.616
0.503 0.497
0.44 1 0.559
0.403 0.597
0.262 0.25 1 0.115 O.i56
0.191 0.195
0.189 0.127 0.167 0.084
0.326 0.178 0.286 0.210
0.273 0.209 0.298 0.219
0.352 0.153 0.302 0.194
0.607 0.393
0.573 0.427
0.475 0.525
0.632 0.368
0.566 0.434
0.696 0.304
0.589 0.411
0.598 0.402
0.244 0.084 0.105 0.105
0.278 0.154
by guest on Novem
ber 24, 2015http://m
be.oxfordjournals.org/D
ownloaded from
Evolution of Codon Usage 797
Table 2 (Continued)
Amino Acid Codon CF” LDb LMC TCl* TC2” TC3f TBlg TB2h TB3’
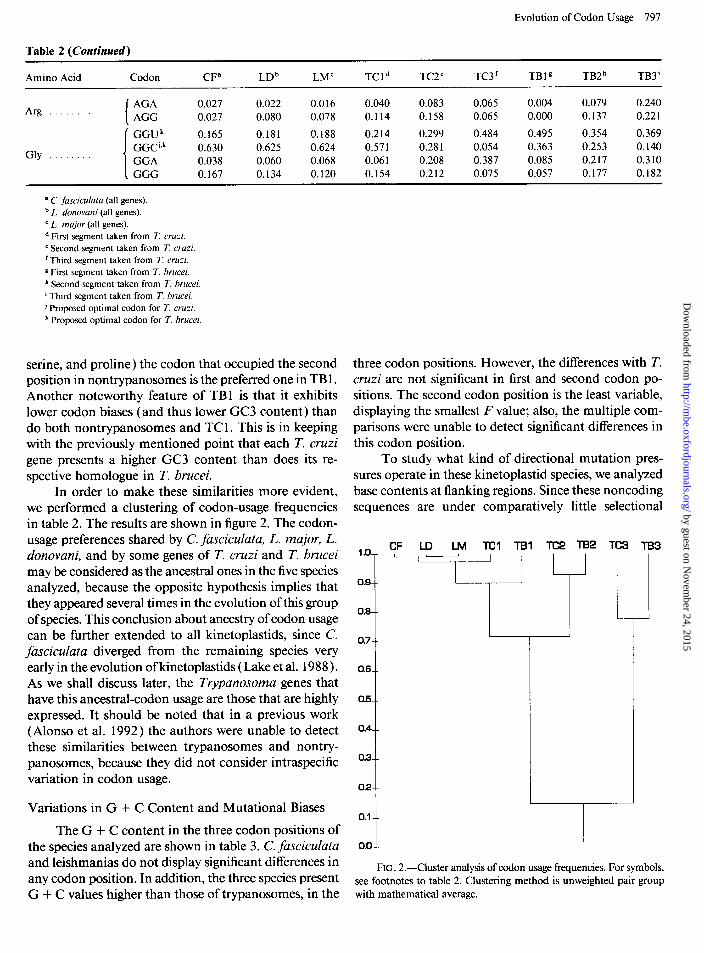
Arg AGA 0.027 0.022 0.016 0.040 0.083 0.065 0.004 0.079 0.240
. . AGG 0.027 0.080 0.078 0.114 0.158 0.065 0.000 0.137 0.22 1
GGUk 0.165 0.181 0.188 0.214 0.299 0.484 0.495 0.354 0.369 0.363 0.253 0.140
Gly GGC’qk 0.630 0.625 0.624 0.57 1 0.28 1 0.054
. . . . GGA 0.038 0.060 0.068 0.06 1 0.208 0.387 0.085 0.217 0.310 GGG 0.167 0.134 0.120 0.154 0.212 0.075 0.057 0.177 0.182
a C. ,Jzscicufula (all genes). b L. donovani (all genes). c L. major (all genes). * First segment taken from T. cruzi. ’ Second segment taken from T. cruzi. ‘Third segment taken from T. cruzi. 8 First segment taken from T. brucei. h Second segment taken from T. brucei. i Third segment taken from T. brucei. j Proposed optimal codon for T. cruzi. k Proposed optimal codon for T. brucci.
serine, and proline) the codon that occupied the second position in nontrypanosomes is the preferred one in TB 1. Another noteworthy feature of TBl is that it exhibits lower codon biases (and thus lower GC3 content) than do both nontrypanosomes and TC 1. This is in keeping with the previously mentioned point that each T. cruzi gene presents a higher GC3 content than does its re- spective homologue in T. brucei.
In order to make these similarities more evident, we performed a clustering of codon-usage frequencies in table 2. The results are shown in figure 2. The codon- usage preferences shared by C. fasciculata, L. major, L. donovani, and by some genes of T. cruzi and T. brucei may be considered as the ancestral ones in the five species analyzed, because the opposite hypothesis implies that they appeared several times in the evolution of this group of species. This conclusion about ancestry of codon usage can be further extended to all kinetoplastids, since C. fasciculata diverged from the remaining species very early in the evolution of kinetoplastids (Lake et al. 1988). As we shall discuss later, the Trypanosoma genes that have this ancestral-codon usage are those that are highly expressed. It should be noted that in a previous work ( Alonso et al. 1992) the authors were ‘unable to detect these similarities between trypanosomes and nontry- panosomes, because they did not consider intraspecific variation in codon usage.
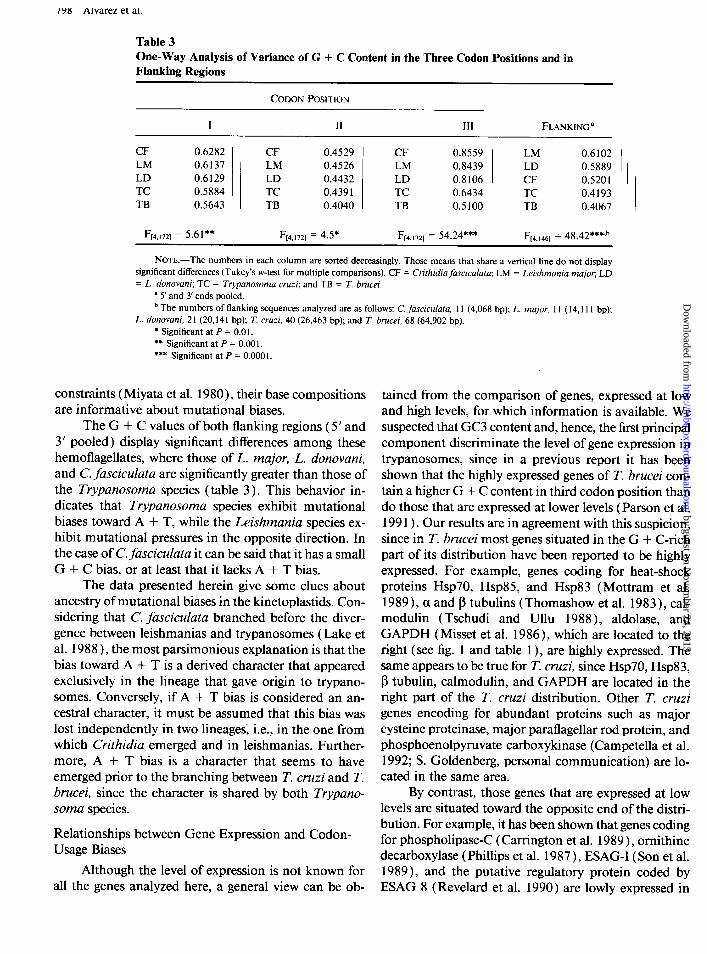
Variations in G + C Content and Mutational Biases
The G + C content in the three codon positions of the species analyzed are shown in table 3. C. fasciculata and leishmanias do not display significant differences in any codon position. In addition, the three species present G + C values higher than those of trypanosomes, in the
three codon positions. However, the differences with T. cruzi are not significant in first and second codon po- sitions. The second codon position is the least variable, displaying the smallest F value; also, the multiple com- parisons were unable to detect significant differences in this codon position.
To study what kind of directional mutation pres- sures operate in these kinetoplastid species, we analyzed base contents at flanking regions. Since these noncoding sequences are under comparatively little selectional
0.8--
0.7--
0.8-m
O.!L-
OA--
CF LO LM Tel TBI Tc2
FIG. 2.-Cluster analysis of codon usage frequencies. For symbols, see footnotes to table 2. Clustering method is unweighted pair group with mathematical average.
by guest on Novem
ber 24, 2015http://m
be.oxfordjournals.org/D
ownloaded from
/YB Alvarez et al.
Table 3 One-Way Analysis of Variance of G + C Content in the Three Codon Positions and in Flanking Regions
CODON POSITION
I II III FLANKING a
CF 0.6282 CF 0.4529 CF 0.8559 LM 0.6102 LM 0.6137 LM 0.4526 LM 0.8439 LD 0.5889 LD 0.6129 LD 0.4432 LD 0.8106 CF 0.5201 TC 0.5884 TC 0.439 1 TC 0.6434 TC 0.4193 TB 0.5643 TB 0.4040 TB 0.5100 TB 0.4067
FL4,,72j = 5.61** 54.1721 = 4.5* F14,,721 = 54.24*** FL4,,461 = 48.42***sb
NOTE.-The numbers in each column are sorted decreasingly. Those means that share a vertical line do not display significant differences (Tukey’s w-test for multiple comparisons). CF = Crithidia fasciculuta; LM = Leishmania major, LD = L. donovani; TC = Trypanosoma cruzi; and TB = T. brucei.
’ 5’ and 3’ ends pooled. b The numbers of flanking sequences analyzed are as follows: C. fascicuhzta, 11 (4,068 bp); L. major, 11 (14,111 bp);
L. donovani, 21 (20,141 bp); T. cruzi, 40 (26,463 bp); and T. brucei, 68 (64,902 bp). * Significant at P = 0.0 1. ** Significant at P = 0.00 1. *** Significant at P = 0.000 1.
constraints (Miyata et al. 1980)) their base compositions are informative about mutational biases.
The G + C values of both flanking regions (5’ and 3’ pooled) display significant differences among these hemoflagellates, where those of L. major, L. donovani, and C. fasciculata are significantly greater than those of the Trypanosoma species (table 3). This behavior in- dicates that Trypanosoma species exhibit mutational biases toward A + T, while the Leishmania species ex- hibit mutational pressures in the opposite direction. In the case of C. fasciculata it can be said that it has a small G + C bias, or at least that it lacks A + T bias.
The data presented herein give some clues about ancestry of mutational biases in the kinetoplastids. Con- sidering that C. fasciculata branched before the diver- gence between leishmanias and trypanosomes (Lake et al. 1988)) the most parsimonious explanation is that the bias toward A + T is a derived character that appeared exclusively in the lineage that gave origin to trypano- somes. Conversely, if A + T bias is considered an an- cestral character, it must be assumed that this bias was lost independently in two lineages; i.e., in the one from which Crithidia emerged and in leishmanias. Further- more, A + T bias is a character that seems to have emerged prior to the branching between T. cruzi and T. brucei, since the character is shared by both Trypano- soma species.
Relationships between Gene Expression and Codon- Usage Biases
Although the level of expression is not known for all the genes analyzed here, a general view can be ob-
I,
tamed from the comparison of genes, expressed at low and high levels, for which information is available. We suspected that GC3 content and, hence, the first principal component discriminate the level of gene expression in trypanosomes, since in a previous report it has been shown that the highly expressed genes of T. brucei con- tain a higher G + C content in third codon position than do those that are expressed at lower levels (Parson et al. 199 1) . Our results are in agreement with this suspicion, since in T. brucei most genes situated in the G + C-rich part of its distribution have been reported to be highly expressed. For example, genes coding for heat-shock proteins Hsp70, Hsp85, and Hsp83 (Mottram et al. 1989), a and p tubulins (Thomashow et al. 1983), cal- modulin (Tschudi and Ullu 1988)) aldolase, and GAPDH (Misset et al. 1986), which are located to the right (see fig. 1 and table 1 ), are highly expressed. The same appears to be true for T. cruzi, since Hsp70, Hsp83, p tubulin, calmodulin, and GAPDH are located in the right part of the T. cruzi distribution. Other T. cruzi genes encoding for abundant proteins such as major cysteine proteinase, major paraflagellar rod protein, and phosphoenolpyruvate carboxykinase (Campetella et al. 1992; S. Goldenberg, personal communication) are lo- cated in the same area.
By contrast, those genes that are expressed at low levels are situated toward the opposite end of the distri- bution. For example, it has been shown that genes coding for phospholipase-C (Carrington et al. 1989 ) , ornithine decarboxylase (Phillips et al. 1987), ESAG-I (Son et al. 1989), and the putative regulatory protein coded by ESAG 8 (Revelard et al. 1990) are lowly expressed in
by guest on Novem
ber 24, 2015http://m
be.oxfordjournals.org/D
ownloaded from
Evolution of Codon Usage 799
T. brucei and are among the most GC3-poor genes of this species. Similarly, in T. cruzi the putative calcium- binding proteins CUB2.8 and CUB2.65, which are ex- pressed at low levels (Ajioka and Swindle 1993), are located in the A + T-rich extreme of the distribution. The first principal component (highly correlated to G + C richness) thus appears to discriminate the level of gene expression in these Trypanosoma species.
The case of the T. brucei genes coding for the vari- able surface glycoproteins (VSGs) deserves special at- tention, since these genes are highly expressed in the bloodstream forms (Turner 1982 ) but do not contain a high GC3 content. Michels ( 1986) explained this lack of codon bias of VSG genes as resulting from the high evolutionary rate that these genes have. However, we think that this may be alternatively explained by taking into account the fact that each individual VSG gene is rarely expressed. Since there are hundreds of copies of different VSG genes that have to be rearranged to the only active site in order to be expressed (Pays et al. 1989), each basic copy behaves most of the time as a silent open reading frame. This fact implies that any kind of translational selection affecting codon-usage biases would have little effect on these genes.
On the basis of the previous considerations, it can be said that those codons that exhibit a significantly higher frequency in TBl in relation to TB3 are the op- timal ones of T. brucei, while those that present higher frequencies in TCl than in TC3 are optimal in T. cruzi. The proposed optimal codons for T. cruzi and T. brucei are indicated in table 2. This assignment of optimal co- dons is further supported by the comparisons of codon distributions between the known lowly and highly ex- pressed genes of each species (in T. brucei, VSG genes were excluded). We found that most of these proposed optimal codons are used at significantly higher levels (P < 0.05 in a 2 X 2 contingency table) in the highly ex- pressed group than in the lowly expressed one (data not shown ) .
The situation appears to be quite different for the non- Trypanosoma species, where genes expressed at both high and low levels have similar codon-usage preferences. For example, in L. donovani, the genes coding for me- talloproteinase (Gp63), Hsp70, and histone H2a pro- teins, which are highly expressed (Lepay et al. 1983; Button et al. 1989; Toye and Remold 1989; Soto et al. 1992)) lie very close in the distribution to ornithine de- carboxylase and to multidrug-resistance P-glycoprotein genes, which are expressed at very low levels (Hanson et al. 1992; Henderson et al. 1992). Similarly, in C. fas- ciculata the gene coding for metalloproteinase (homo- logue to leishmania Gp63), which is expected to be highly expressed ( Inverso et al. 1993 ), presents codon
preferences similar to those of the dihydrofolate reduc- tase-thymidylate synthase gene, which is expressed at very low levels (Hughes et al. 1989). It should be noted, however, that even though in these non-Trypanosma species there exists not very much differentiation in co- don usage between genes, in leishmanias the highly ex- pressed genes present stronger codon biases than do the lower expressed ones. Comparing the codon distributions of L. donovani Hsp70, methalloprotease (Gp63), and histone H2a, versus ornithine descarboxylase and mul- tidrug-resistance P-glycoprotein genes, we have found that UUC, CUG, AUC, CCG, AAC, AAG, GAC, GAG, CGC, and GGC are present at significantly higher fre- quencies in the former genes than in the latter ones. Furthermore, other codons are more frequently used in the highly expressed group (GUG, UCC, ACC, ACG, GCC, GCG, UAC, CAC, CAG, UGC, and AGC), but their values did not differ significantly (between lowly and highly expressed genes), probably because of the relatively small sample considered. It is worth noting that those codons that present significantly higher fre- quencies in genes with high expression of Leishmania fall within the set of optimal codons of both Trypano- soma species indicated in table 2 (excepting CGC, which is optimal only in T. cruzi).
Evolutionary Trends in Codon Usage of Kinetoplastids
The fact that the preferred codons in the highly expressed genes (optimal codons) of T. cruzi (and, to a lesser extent, of T. brucei) are practically the same as those preferred by all C. fasciculata and Leishmania genes (several of these codons were also identified as optimal in Leishmania) indicates that the distributions of isoaccepting tRNAs have been conserved during the evolution of kinetoplastids. This fact, taken together with mutational biases, allows us to understand why try- panosomes have widely spread distributions of G + C in the third codon position, whereas the distributions of Crithidia and Leishmania are narrower. In these two latter genera, both translational selection and mutational biases pull toward the same direction, i.e., G + C rich- ness. Thus, all genes (both those expressed at high levels and those expressed at low levels) will be G + C rich, giving rise to a narrow distribution. The genome of the Trypanosoma ancestor probably was very similar to the present genomes of Crithidia and Leishmania, since, as was previously stated, A + T bias is very probably a derived character present only in the trypanosome lin- eage. The acquisition of A + T mutational pressure af- fected, to a variable extent, the different kinds of se- quences. Those that are less constrained to vary, such as flanking regions and other noncoding sequences, be- came A + T rich. On the other hand, in coding sequences
by guest on Novem
ber 24, 2015http://m
be.oxfordjournals.org/D
ownloaded from
800 Alvarez et al.
the shift toward A + T was dependent on the degree of selectional constraints. The second codon position is ex- pected to be the less affected, since it is the most signif- icant coding position because any change in it would result in an amino acid substitution. The first codon position is less constrained than the second, since some changes are synonymous. As we show in table 3, this corresponds to what can be observed in trypanosomes. The third codon position will vary in a way that is con- ditioned by translational selection. Those genes that are highly expressed will remain closer to the ancestral con- dition (G + C richness) than will those that are expressed at a lower level, because the latter are less affected by tRNAs abundances. Again, this fits with what has been described in this work. According to our interpretation, each Trypanosoma gene would be in a GC3-content po- sition that reflects the balance between two processes that act in opposite directions: mutation and selection (as reported in other species, such as Dictostelium dis- coideum [Sharp and Devine 19891).
Conclusions
In this work we have shown that the preferred co- dons in the highly expressed genes of Trypanosoma cruzi (and, to a lesser extent, of T. brucei) are practically the same as those preferred by all Crithidia fasciculata and Leishmania genes. This emphatically suggests that the tRNA distributions have been conserved in kinetoplas- tids. Despite this lack of differentiation in relative tRNA abundances, kinetoplastids differ in their codon-usage distributions. The non- Trypanosoma species exhibit relatively narrow codon distributions; in these species the differences between lowly and highly expressed genes are in the degree rather than in the direction of codon preferences. By contrast, in Trypanosoma species, lowly and highly expressed genes have almost opposite codon patterns. On the other hand, we have shown in this work that trypanosomes present mutational pressures toward A + T, while nontrypanosome species present muta- tional pressures in the opposite direction. This change in the direction of mutational biases appears to be un- derlying the codon-usage differences between trypano- somes and nontrypanosomes. Selectional constraints (translational selection) and directional mutational pressures (Sueoka 1988, 1992) thus appear to be the main forces shaping the codon-choice patterns of ki- netoplastids.
Changing codon usage without changing the tRNA distributions was proposed for other unicellular species, both prokaryotes and eukaryotes. For instance, Sharp ( 1990) showed that Escherichia coli and Serratia mar- cescens have similar codon choices in genes expressed at high levels, whereas dissimilar codon patterns are ob- served in genes expressed at low levels. Furthermore, the
direction of the divergence in the genes with low expres- sion is consistent with the direction of the divergence in the whole genomic G + C content, suggesting that dif- ferences in the mutation biases of each genome are ac- tually driving the divergence. Another interesting case of codon-usage differentiation is that between Saccha- romyces cerevisiae and Candida albicans (Lloyd and Sharp 1992). In these yeast species, the optimal codons appear to be the same, but when homologous genes are compared, a consistent difference (toward a higher silent A + T content) can be observed in C. albicans genes. Despite the fact that C. albicans exhibits an overall higher A + T content (which may be interpreted as A + T pressure), the magnitude of the silent A + T difference is small in highly expressed genes but very variable in genes with low expression.
An interesting point regarding the large within-spe- cies heterogeneity of trypanosomes is that most silent mutations in the highly expressed genes (that are from G/C to A/T) are expected to be slightly deleterious. This means that Trypanosoma populations have a con- siderable mutational genetic load. Shields ( 1990) has postulated that such situations are unstable and that their long-term fate is a shift in codon preferences (here, from G/C-ending to A/T-ending codons). However, it is not clear how transient (in amount of time) these putative unstable states are. In trypanosomes this situation ap- pears to be rather ancient, since mutational biases toward A + T arose prior to the divergence between T. cruzi and T. brucei, an event that occurred not before 80 Mya (Lake et al. 1988).
Acknowledgments
We thank Drs. D. Brooks, R. Ehrlich, P. Isackson, E. Lessa, and E. Scvortzoff for helpful suggestions and critical reading of the manuscript. We also wish to thank Dr. S. Goldenberg for allowing the citation of unpub- lished data. This work was supported by C.S.I.C. (Com- isibn Sectorial de Investigation Cientifica, Universidad de la Republica, Uruguay).
LITERATURE CITED
AJIOKA, J., and J. T. SWINDLE. 1993. The calmodulin-ubi- quitin associated gene of Trypanosoma cruzi: their identi- fication and transcription. Mol. Biochem. Parasitol. 57: 127- 136.
ALONSO, G., P. GUEVARA, and J. L. RAMIREZ. 1992. Trypa- nosomatidea codon usage and GC distribution. Mem. Inst. Oswald0 Cruz 87:5 17-523.
BENNETZEN, J. L., and B. D. HALL. 1982. Codon selection in yeast. J. Biol. Chem. 257:3026-3031.
BUTTON, L. L., D. G. RUSSELL, H. L. KLEIN, E. MEDINA- ACOSTA, R. E. KARESS, and W. R. MCMASTER. 1989. Genes encoding the major surface glycoprotein in Leish-
by guest on Novem
ber 24, 2015http://m
be.oxfordjournals.org/D
ownloaded from
Evolution of Codon Usage 801
mania are tandemly linked at a single chromosomal locus and are constitutively transcribed. Mol. Biochem. Parasitol. 32:27 l-284.
CAMPETELLA, O., J. HERIKSSON, L. ASLUND, A. C. C. FRASCH, U. PETERSSON, and J. J. CAZZULO. 1992. The major cys- teine proteinase (cruzipain) from Trypanosoma cruzi is en- coded by multiple polymorphic tandemly organized genes located on different chromosomes. Mol. Biochem. Parasitol. 50:225-234.
CARRINGTON, M., B. ROLAND, H. REINKE, and P. OVERATH. 1989. Sequence and expression of the glycosyl-phosphati- dylinositol-specific phospholipase C of Trypanosome brucei. Mol. Biochem. Parasitol. 33:289-296.
GOUY, M., and C. GAUTIER. 1982. Codon usage in bacteria: correlation with gene expressivity. Nucleic Acids Res. 10: 70557074.
GRANTHAM, R., C. GAUTIER, M. GOUY, R. MERCIER, and R. PAVE. 1980. Codon catalog usage and the genome hypoth- esis. Nucleic Acids Res. 8:49-62.
HANSON, S. S., J. P. ADELMAN, and B. ULLMAN. 1992. Am- plification and molecular cloning of the ornithine decar- boxylase gene of Leishmania donovani. J. Biol. Chem. 267: 2350-2359.
HENDERSON, D. M., C. D. SIFRI, M. RODGERS, D. F. WIRTH, N. HENDRICKSON, and B. ULLMAN. 1992. Multidrug re- sistance in Leishmania donovani is conferred by amplifi- cation of a gene homologous to the mammalian mdrl gene. Mol. Cell. Biol. 12:2855-2865.
HUGHES, E. D., 0. A. SHONEKAN, and L. SIMPSON. 1989. Structure, genomic organization and transcription of the bifunctional dihydrofolate reductase-thymidylate synthase gene of Citridia fasciculata. Mol. Biochem. Parasitol. 34: 155-166.
IKEMURA, T. 198 1. Correlation between the abundance of Escherichia coli transfer RNAs and the occurrence of the respective codons in its protein genes. J. Mol. Biol. 146: l- 21.
- 1982. Correlation between the abundance of yeast . transfer RNAs and the occurrence of the respective codons in protein genes. J. Mol. Biol. 158:573-597.
INVERSO, J. A., E. MEDINA-ACOSTA, J. O’CONNOR, D. G. RUSSELL, and G. A. CROSS. 1993. Crithidia fasciculata contains a transcribed leishmanial surface proteinase (gp63 ) gene homologue. Mol. Biochem. Parasitol. 57:47-54.
LAKE, A. L., V. F. DE LA CRUZ, P. C. G. FERREIRA, C. MOREL, and L. SIMPSON. 1988. Evolution of parasitism: kineto- plastid protozoan history reconstructed from mitochondrial rRNA gene sequence. Proc. Natl. Acad. Sci. USA 85:4779- 4783.
LANGFORD, C. IS., B. ULLMAN, and S. M. LANDFEAR. 1992. Leishmania: codon utilization of nuclear genes. Exp. Par- asitol. 74:360-36 1.
LEPAY, D. A., N. NOGUEIRA, and Z. COHN. 1983. Surface antigens of Leishmania donovani promastigotes. J. Exp. Med. 157:1562-1572.
LLOYD, A. T., and P. M. SHARP. 1992. Evolution of codon usage patterns: the extent and nature of divergence between Candida albicans and Saccharomyces cerevisiae. Nucleic Acids Res. 20:5289-5295.
MICHELS, P. A. M. 1986. Evolutionary aspects of trypano- somes: analysis of genes. J. Mol. Evol. 24:45-52.
MISSET, O., 0. J. M. Bos, and F. R. OPPERDOES. 1986. Gly- colytic enzymes of Trypanosome brucei: simultaneous pu- rification, intraglycosomal concentrations and physical properties. Eur. J. Biochem. 157:441-453.
MIYATA, J., T. YASANAGA, and T. NISHIDA. 1980. Nucleotide sequence divergence and functional constraint in mRNA evolution. Proc. Natl. Acad. Sci. USA 77:7328-7332.
MOTTRAM, J., W. MURPHY, and N. AGABIAN. 1989. A tran- scriptional analysis of the Trypanosoma brucei hsp 83 gene cluster. Mol. Biochem. Parasitol. 37: 115- 128.
PARSONS, M., STUART, K., and B. SMILEY. 199 1. Trypanosoma brucei: analysis of codon usage and nucleotide composition of nuclear genes. Exp. Parasitol. 73: 101-105.
PAYS, E., P. TEBABI, H. COQUELET, P. REVELARD, D. SALMON, and M. STEINER. 1989. The genes and transcripts of an antigen gene expression site from T. brucei. Cell 57:835- 845.
PHILLIPS, M. A., P. COFFINO, and C. C. WANG. 1987. Cloning and sequencing of the omithine decarboxylase gene from Trypanosoma brucei. J. Biol. Chem. 262: 8721-8727.
REVELARD, P., S. LIPS, and E. PAYS. 1990. A gene from the VSG expression site of Trypanosoma brucei encodes a pro- tein with both leucine-rich repeats and a putative zinc finger. Nucleic Acids Res. l&7299-7303.
SHARP, P. M. 1990. Processes of genome evolution reflected by base frequency differences among Serratia marcescens genes. Mol. Microbial. 4: 119- 122.
SHARP, P. M., and K. M. DEVINE. 1989. Codon usage and gene expression level in Dictyostelium discoideum: highly expressed genes do “prefer” optimal codons. Nucleic Acids Res. 17:5029-5039.
SHARP, P. M., and W.-H. LI. 1986. Codon usage in regulatory genes in Escherichia coli does not reflect selection for “rare” codons. Nucleic Acids Res. 19:7737-7749.
SHIELDS, D. C. 1990. Switches is species-specific codon pref- erences: the influence of mutations biases. J. Mol. Evol. 31: 7 l-80.
SHIELDS, D. C., and P. M. SHARP. 1987. Synonymous codon usage in Bacillus subtilis reflects both translational selection and mutational biases. Nucleic Acids Res. 15:8023-8040.
SON, H. J., G. A. COOK, T. HALL, and J. E. DONELSON. 1989. Expression site associated genes of Trypanosoma brucei rhodesiense. Mol. Biochem. Parasitol. 33:59-66.
SOTO, M., J. M. REQUENA, L. C. GOMEZ, I. NAVARRETE, and C. ALONSO. 1992. Molecular characterization of a Leish- mania donovani infantum antigen identified as histone H2A. Eur. J. Biochem. 205:21 l-2 16.
SUEOKA, N. 1988. Directional mutation pressure and neutral molecular evolution. Proc. Natl. Acad. Sci. USA 85:2653- 2657.
- 1992. Directional mutation pressure, selective con- . straints, and genetic equilibria. J. Mol. Evol. 34:95-l 14.
THOMASHOW, L. S., M. MILHAUSEN, W. J. RUFFER, and N. AGABIAN. 1983. Tubulin genes are tandemly linked and clustered in the genome of Trypanosome brucei. Cell 32: 35-43.
by guest on Novem
ber 24, 2015http://m
be.oxfordjournals.org/D
ownloaded from
802 Alvarez et al.
TOYE, P., and H. REMOLD. 1989. The influence of temperature and serum deprivation on the synthesis of heat-shock pro- teins and alpha and beta tubulin in promatstigotes of Leishmania major. Mol. Biochem. Parasitol. 35: 1- 10.
TSCHUDI, C., and E. ULLU. 1988. Polygene transcripts are the precursors to calmodulin mRNAs in trypanosomes. EMBO J. 7:445-463.
TURNER, M. J. 1982. Biochemistry of the variant surface gly- coproteins of salivarian trypanosomes. Adv. Parasitol. 21: 69-153.
VAN EYS, G. J. J. M., G. J. SCHOONE, G. S. LIGHTHART, J. ALVAR, D. A. EVANS, and W. J. TERPSTRA. 1989. Identi-
fication of “Old World” Leishmaniu by DNA recombinant probes. Mol. Biochem. Parasitol. 34:53-62.
WADA, K., S. AOTA, R. TSUCHIYA, F. ISHIBASHI, T. GOJOBORI, and T. IKEMURA. 1990. Codon usage tabulated from GenBank genetic sequence data. Nucleic Acids Res Suppl. l&2367-24 11.
PAUL SHARP, reviewing editor
Received October 2 1, 1993
Accepted April 26, 1994
by guest on Novem
ber 24, 2015http://m
be.oxfordjournals.org/D
ownloaded from
Related Documents