ORIGINAL ARTICLE doi:10.1111/evo.12555 Evolution of antipredator behavior in an island lizard species, Podarcis erhardii (Reptilia: Lacertidae): The sum of all fears? Kinsey M. Brock, 1,2 Peter A. Bednekoff, 3 Panayiotis Pafilis, 4 and Johannes Foufopoulos 1 1 School of Natural Resources & Environment, University of Michigan, Dana Hall, 440 Church Street, Ann Arbor, Michigan 48109 2 E-mail: [email protected] 3 Department of Biology, Eastern Michigan University, Mark Jefferson Science Complex, 900 Oakwood Street, Ypsilanti, Michigan 48197 4 Section of Human and Animal Physiology, Department of Biology, University of Athens, Panepistimioupolis 157-84, Athens, Greece Received April 11, 2014 Accepted October 1, 2014 Organisms generally have many defenses against predation, yet may lack effective defenses if from populations without predators. Evolutionary theory predicts that “costly” antipredator behaviors will be selected against when predation risk diminishes. We examined antipredator behaviors in Aegean wall lizards, Podarcis erhardii, across an archipelago of land-bridge islands that vary in predator diversity and period of isolation. We examined two defenses, flight initiation distance and tail autotomy. Flight initiation distance generally decreased with declining predator diversity. All predator types had distinctive effects on flight initiation distance with mammals and birds having the largest estimated effects. Rates of autotomy observed in the field were highest on predator- free islands, yet laboratory-induced autotomy increased linearly with overall predator diversity. Against expectation from previous work, tail autotomy was not explained solely by the presence of vipers. Analyses of populations directly isolated from rich predator communities revealed that flight initiation distance decreased with increased duration of isolation in addition to the effects of current predator diversity, whereas tail autotomy could be explained simply by current predator diversity. Although selection against costly defenses should depend on time with reduced threats, different defenses may diminish along different trajectories even within the same predator–prey system. KEY WORDS: Antipredator behavior, autotomy, flight initiation distance, islands, predation, selection-natural. Predation selects on the behavior and physiology of prey species (Edmunds 1974; Blumstein and Daniel 2005; Blumstein 2006; Losos et al. 2006; Shepard 2007), and potential prey use many antipredator behaviors to reduce the possibility of becoming ac- tual prey (Bulova 1994). While being eaten has obvious costs, antipredator defenses also have costs (Ydenberg and Dill 1986; Salvador et al. 1995; P´ erez-Cembranos et al. 2013), which vary with environmental pressures and type of defense. All else be- ing equal, the persistence of antipredator behaviors should only occur if the benefits outweigh the costs incurred, and costly be- haviors should be eliminated by selection if they serve no benefit (Magurran 1999; Blumstein 2002; Blumstein and Daniel 2005; Pafilis et al. 2009a). Therefore, the degree of expression of antipredator behavior seems to be related to the prevailing preda- tion environment (Darwin 1839; Reynolds and Bruno 2013). Islands generally host fewer predators than the mainland, and prey species may show little in the way of behavioral or physiological defenses (Darwin 1839; MacArthur and Wilson 1967; P´ erez-Mellado et al. 1997; Blumstein and Daniel 2005; Cooper and P´ erez-Mellado 2012). This phenomenon, termed is- land tameness, likely occurs where costly antipredator behav- iors and physiological adaptations have been selected against in 1 C ⃝ 2014 The Author(s). Evolution

Welcome message from author
This document is posted to help you gain knowledge. Please leave a comment to let me know what you think about it! Share it to your friends and learn new things together.
Transcript

ORIGINAL ARTICLE
doi:10.1111/evo.12555
Evolution of antipredator behavior in anisland lizard species, Podarcis erhardii(Reptilia: Lacertidae): The sum of all fears?Kinsey M. Brock,1,2 Peter A. Bednekoff,3 Panayiotis Pafilis,4 and Johannes Foufopoulos1
1School of Natural Resources & Environment, University of Michigan, Dana Hall, 440 Church Street, Ann Arbor, Michigan
481092E-mail: [email protected]
3Department of Biology, Eastern Michigan University, Mark Jefferson Science Complex, 900 Oakwood Street, Ypsilanti,
Michigan 481974Section of Human and Animal Physiology, Department of Biology, University of Athens, Panepistimioupolis 157-84,
Athens, Greece
Received April 11, 2014
Accepted October 1, 2014
Organisms generally have many defenses against predation, yet may lack effective defenses if from populations without predators.
Evolutionary theory predicts that “costly” antipredator behaviors will be selected against when predation risk diminishes. We
examined antipredator behaviors in Aegean wall lizards, Podarcis erhardii, across an archipelago of land-bridge islands that vary
in predator diversity and period of isolation. We examined two defenses, flight initiation distance and tail autotomy. Flight initiation
distance generally decreased with declining predator diversity. All predator types had distinctive effects on flight initiation distance
with mammals and birds having the largest estimated effects. Rates of autotomy observed in the field were highest on predator-
free islands, yet laboratory-induced autotomy increased linearly with overall predator diversity. Against expectation from previous
work, tail autotomy was not explained solely by the presence of vipers. Analyses of populations directly isolated from rich predator
communities revealed that flight initiation distance decreased with increased duration of isolation in addition to the effects of
current predator diversity, whereas tail autotomy could be explained simply by current predator diversity. Although selection
against costly defenses should depend on time with reduced threats, different defenses may diminish along different trajectories
even within the same predator–prey system.
KEY WORDS: Antipredator behavior, autotomy, flight initiation distance, islands, predation, selection-natural.
Predation selects on the behavior and physiology of prey species(Edmunds 1974; Blumstein and Daniel 2005; Blumstein 2006;Losos et al. 2006; Shepard 2007), and potential prey use manyantipredator behaviors to reduce the possibility of becoming ac-tual prey (Bulova 1994). While being eaten has obvious costs,antipredator defenses also have costs (Ydenberg and Dill 1986;Salvador et al. 1995; Perez-Cembranos et al. 2013), which varywith environmental pressures and type of defense. All else be-ing equal, the persistence of antipredator behaviors should onlyoccur if the benefits outweigh the costs incurred, and costly be-haviors should be eliminated by selection if they serve no benefit
(Magurran 1999; Blumstein 2002; Blumstein and Daniel 2005;Pafilis et al. 2009a). Therefore, the degree of expression ofantipredator behavior seems to be related to the prevailing preda-tion environment (Darwin 1839; Reynolds and Bruno 2013).
Islands generally host fewer predators than the mainland,and prey species may show little in the way of behavioral orphysiological defenses (Darwin 1839; MacArthur and Wilson1967; Perez-Mellado et al. 1997; Blumstein and Daniel 2005;Cooper and Perez-Mellado 2012). This phenomenon, termed is-land tameness, likely occurs where costly antipredator behav-iors and physiological adaptations have been selected against in
1C⃝ 2014 The Author(s).Evolution

KINSEY M. BROCK ET AL.
reduced predation environments (Blumstein and Daniel 2005),for instance in Galapagos marine iguanas (Amblyrhynchus crista-tus) (Berger et al. 2007), and tammar wallabies (Macropus eu-genii) on Australian islands (Blumstein and Daniel 2005). Assuch, naıve island species, perhaps most infamously the dodo(Raphus cucullatus), have been disproportionally affected by theintroduction of novel predators into previously predator-free en-vironments (Beauchamp 2003; Baillie et al. 2004; Blackburnet al. 2004; Losos et al. 2006; Bonnaud et al. 2010).
When approached by a potential predator, animals com-monly flee to a refuge (Greene 1988; Cooper 1997; Blumsteinand Daniel 2005; Cromie and Chapple 2013). Because fleeingis energetically costly (Ydenberg and Dill 1986; Martın andLopez 2003; Perez-Cembranos et al. 2013), and may decreaseopportunities for fitness-enhancing activities such as foragingand mating (Ydenberg and Dill 1986; Cooper and Frederick2007), animals balance the costs of fleeing against the costs ofremaining in place (Magurran 1990; Stankowich and Blumstein2005). The flight initiation distance (FID) (distance betweenpredator and prey the moment before the prey flees) of prey isa quantifiable measure of perceived predation risk (Bonenfantand Kramer 1996; Blumstein and Daniel 2005; Amo et al. 2006;Cooper 2011), and is predicted to reflect the prevailing predationregime for prey populations (Cooper and Perez-Mellado 2012).
Tail autotomy, or the self-severing of the tail, is a common an-tipredator defense among lacertid lizards (Arnold 1984; Batemanand Fleming 2009; Pafilis et al. 2009a). Autotomy in lacertidsoccurs along specialized breakage planes located within verte-brae throughout the tail (Chapple and Swain 2002a; Lin and Ji2005). The shed tail writhes about for a period of time, a processthought to distract the predator from the escaping lizard (Dial andFitzpatrick 1983; Arnold 1984, 1988). Although tail sheddingis a highly effective escape strategy (Dial and Fitzpatrick 1984;Daniels 1985), it is also a very costly defense that is usually onlydeployed after frontline defenses such as hiding or fleeing havefailed (Arnold 1984; Cromie and Chapple 2013). In many speciesthe tail contains a significant portion of fat deposits, and losingthose stores is energetically expensive (Ballinger and Tinkle 1979;Bateman and Fleming 2009; Pafilis et al. 2009a). Regeneration ofthe tail, which occurs at various rates among species, also requiresa considerable amount of energy (Vitt and Cooper 1986; Pafiliset al. 2009a; Tsasi et al. 2009). Costs related to tail loss in variouslizard species include impaired locomotive capabilities, makingquick and efficient escape difficult (Chapple and Swain 2002b;Lin and Ji 2005). Lowered social status (Fox and Rostker 1982;Schall et al. 1989; Salvador et al. 1995) and decreased repro-ductive output are additional transient, negative effects incurredby recently autotomized individuals (Ballinger and Tinkle 1979;Vitt and Cooper 1986; Pafilis et al. 2009a; Cromie and Chap-ple 2013). Because autotomy can occur accidentally and without
survival benefit during intraspecific interactions (Vitt et al. 1977,Jennings and Thompson 1999; Pafilis et al. 2008; Vervust et al.2009), ease of autotomy in a population should reflect associatedcosts and benefits.
Although predators demonstratively exert selective pressureson behavior (Edmunds 1974; Blumstein and Daniel 2005; Lososet al 2006; Shepard 2007), the mechanistic factors underlying is-land tameness and the rate at which it occurs are unclear. Previousbehavioral studies on islands have largely focused on compar-ing island behavior to mainland behavior (Blumstein and Daniel2005), often across many species (Beauchamp 2004; Cooper et al.2014), with vague predation variables (e.g., low, medium, high).We aim to provide unprecedented resolution in the study of islandtameness by comparing many populations of one species in a sys-tem where predator presence and history of isolation are knownin detail.
The present study focuses on the evolution of antipreda-tor behaviors in distinct populations of the Aegean wall lizard(Podarcis erhardii), a habitat generalist that is found in southeastEurope and islands in the Aegean Sea (Greece) (Hurston et al.2009). This species is known to be a poor overwater disperser(Foufopoulos and Ives 1999) and because lizards on Cycladesislands have been isolated with varying subsets of the originalpre-Pleistocene predation regime, they provide an excellent op-portunity to study evolutionary mechanisms responsible for theretention of antipredator behaviors. We focus on two defenses:FID and tail autotomy, which are considered here together ina combined frame to enhance our understanding of antipreda-tor behavior evolution. Further, we develop a novel approach toassess the rate of island tameness by combining geomorpholog-ical seafloor and historic sea-level data to identify island agesand assess the relationship between duration of isolation frompredators and behavior. Based on the ecological knowledge ofthe Aegean Sea region and previously documented patterns ofbehavior (Pafilis et al. 2009a,b; Li et al. 2014), we predicted that(1) flight behavior would vary across the Cyclades Archipelagowith current predator diversity, (2) ability for autotomy wouldbe mostly influenced by the presence of vipers (see Pafilis et al.2009a), and (3) FID and tail autotomy rates would decrease withlonger isolation in reduced predation environments.
MethodsSTUDY SYSTEM
The Cyclades are a group of land-bridge islands located in thecentral Aegean Sea (Fig. 1), which were formed when risingsea levels since the last glacial maximum flooded parts of a largePleistocene island mass termed “Cycladia” (Foufopoulos and Ives1999; Broodbank 2002; Poulos et al. 2009). The current climateis typical of the Mediterranean region with warm, dry summers
2 EVOLUTION 2014

EVOLUTION OF ANTIPREDATOR BEHAVIOR ON ISLANDS
Figure 1. Map of Greece and Cycladic island sites in the Aegean. Agios Nikolaos (NI), Agia Paraskevi (PA), Agriloussa (AG), Amorgos(AM), Anafi (AF), Andreas (AD), Andros (AN), Aspronissi (AS), Chtenia CH), Daskalio (DA), Dhonoussa (DH), Fidussa (FI), Gaiduronissi(GA), Glaronissi (GL), Gramvoussa (GR), Ios (IO), Irakleia (IR), Kato Fira (KF), Kato Kufonissi (KK), Keros (KE), Kisiri (KI), Lazaros (LA),Loumboudiaris (LO), Makronissi (MA), Mando (MN), Megali Plaka (MP), Mikri Vigla (MV), Naxos (NA), Nikouria (NI), Ovriokastro (OV),Pano Fira (PF), Pano Kufonissi (PK), Parnitha∗ (PA), Parthenos (PR), Petalidi (PE), Schoinoussa (SC), Strongyllo (ST), Venetiko (VE). Anasterisk signifies the mainland location.
and cool, rainy winters. The islands experience more temperateconditions than the mainland due to their proximity to the seaand the very strong winds that prevail much of the year (Valakoset al. 2008). Vegetation cover has been shaped by anthropogenicdisturbance over thousands of years (Rackham and Grove 2001).
It consists of a patchwork of agricultural areas, sclerophyllousevergreen maquis, and a diverse, summer-deciduous dwarf scrubcommunity termed “phrygana” (Fielding and Turland 2008).
The Aegean wall lizard (P. erhardii) is a small, ground-dwelling lacertid, with an adult snout-vent length of 49–78 mm,
EVOLUTION 2014 3

KINSEY M. BROCK ET AL.
and a tail twice as long as the body (Gruber 1987). This speciesis endemic to the southern Balkans and many Aegean islands,and occurs in a variety of habitats. It preferentially inhabits areaswith dry stone walls and spiny vegetation, which serve as refugiafrom terrestrial and aerial predators. This species eats mainlyarthropods (Arnold 1987), especially Coleoptera (Adamopoulouet al. 1999), but has been observed foraging opportunistically onfruits and plant matter (Brock et al. 2014). A once continuousP. erhardii distribution across Cycladia was fragmented andisolated by rising sea levels into >60 small island populationsexperiencing different subsets of the pre-Pleistocene predationregime (Foufopoulos and Ives 1999; Hurston et al. 2009; Pouloset al. 2009).
QUANTIFICATION OF ISLAND CHARACTERISTICS
We measured the relative abundance of lizards on all island studysites and one mainland location (N = 38). On Aegean islandswith no predators, population densities of lizards are high, whichcould intensify intraspecific competition, potentially having aneffect on the maintenance of the ability to autotomy (Pafilis et al.2009a,b). Lizard densities were determined by walking one ortwo transects (100 m length and 4 m width) of suitable habitat(most islands were too small for multiple transects, see Jaeger1994; Pafilis et al. 2013) and recording any P. erhardii detectedwithin this area. All transects were conducted during the monthsof May–early June under favorable weather conditions (sunny,nearly windless 22–26°C) and during the peak activity hours ofthe species (0900–1100 and 1500–1700).
Due to the restricted time window we had for each is-land, we assessed the predator community on 37 islands and onemainland location by combining published information (Valakoset al. 2008; Pafilis et al. 2009a, and references within) with fieldsurveys conducted over the course of several visits. Surveys ofuninhabited islets consisted of walking an entire island search-ing for signs of known, regional predators (e.g., skins, fecal ma-terial, burrows, or live individuals). Our predator species wereelusive in several different ways (nocturnal, semifossorial, andaerial hunters), and thus it was not possible to obtain predatorpopulation densities during our visits to the scattered, often unin-habited islands. We therefore use an index of predation pressureapplied in other behavioral studies of similar taxa (Perez-Melladoet al. 1997; Cooper et al. 2004; Pafilis et al. 2009a) whereinpredator categories are determined by life-history, taxonomic af-filiation, and hunting strategy. We calculated this index by not-ing the presence or absence of predator types and summing allpresent categories for a measure of “Total Predation.” We dividedpredators on the islands into six categories: (1) rats (Rattus rat-tus), (2) sand boas (Eryx jaculus), (3) birds (Falco tinnunculusand Buteo buteo), (4) Colubrid snakes (Dolichophis caspius,Elaphe quatuorlineata muenteri, Natrix natrix persa, referred to
as “other snakes”), (5) mammals (feral cats [Felis catus], stonemartens [Martes foina]), and (6) vipers (Vipera ammodytes). Thethree different categories of snake predators differ markedly inhunting strategy. Vipers are sit-and-wait predators that ambushand envenomate their prey (Nowak et al. 2008, Pafilis et al. 2009a),whereas Colubrid snakes hunt down their prey following activesearching. The sand boa, E. jaculus, preys sometimes on adultlizards though more often engages in fossorial lizard egg predation(J. Foufopoulos, pers. obs.; Cattaneo 2010). We also distinguishrats from the “mammals” category because rats in the Cycladesare small-bodied opportunistic predators that lack the capacity ofcats and stone martens to prey efficiently on lizards. Cats (F. catus)and rats (R. rattus) were introduced to the Greek islands thousandsof years ago (Klippel and Snyder 1991; Serpell 2000). Becauseboth species are now well-established parts of local ecosystemsand both have been implicated in the extinctions of island en-demic reptiles (Iverson 1978; Perez-Mellado et al. 2008; Nogalesand Medina 2009), we treat them the same as our other predatorcategories.
Environmental characteristics of islands were determinedremotely using spatial analysis tools combined with field sur-veys. Information on island area (km2) for inhabited islandswas available either from published or from government sources(Foufopoulos and Ives 1999; Poulos et al. 2009). For uninhabitedislets without published spatial data we used the ArcGIS ArcMap10 Field Calculator to calculate polygon area (km2) (spatial datacourtesy of the Natural History Museum of Crete). To determinethe time of separation of islands, we used fine-scaled bathymetricdata derived from navigation charts and targeted sonar measure-ments collected by one of us (J. Foufopoulos) in the field, inconjunction with geomorphological reconstructions of past sealevels from global and local sea-level change graphs (Pirazzoli1991, 1996; USDMA 1991; Foufopoulos and Ives 1999; Hurston2009; Poulos et al. 2009). Evergreen bush vegetation cover wascalculated using a combination of Google Earth image data andmeasurements on the ground (N = 29 islands). We walked 100-m-long random transects and estimated the percent of the landscapecovered by woody evergreens, and representativeness of theseresults were then confirmed by investigating large-scale aerialphotographs. Dry stone walls provide lizards refuge space frompredators. We therefore recorded the presence or absence of drystone walls on all islands to test for relationships with FID. We alsochecked for a relationship between FID and human presence on is-lands (humans inhabited 11 of 37 islands). Nonpredatory seabirdspreferentially nest on a small subset of uninhabited islets in theCyclades during the summer (Pafilis et al. 2009b; Foufopoulos,unpubl. data). Although there are no records of seabirds preyingon P. erhardii, or lizards in general (Cooper et al. 2004; Pafiliset al. 2009b), cohabitation on small islets may maintain flight be-havior through historic avian predator recognition (Curio 1993;
4 EVOLUTION 2014

EVOLUTION OF ANTIPREDATOR BEHAVIOR ON ISLANDS
Blumstein 2006). We measured nesting seabird densities (N = 35islands) by counting the number of nests per island, and assumedeach nest belonged to two birds (Foufopoulos and Mayer 2007).
ANTIPREDATOR BEHAVIOR
Flight initiation distanceWe measured the FID of adult P. erhardii (N = 913) from 37 Cy-cladic islands and one site on mainland Greece (Fig. 1, Table 1).FID was recorded as the distance between the observer and thefocal animal when escape was initiated (Ydenberg and Dill 1986;Blumstein et al. 2003; Amo et al. 2006; Perez-Cembranos et al.2013; Cooper et al. 2014). This method presumes that the focal an-imal responds primarily to visual stimuli (the approaching preda-tor). FID was measured in the morning hours during the species’main activity period (May to early July) on warm (22–26°C),sunny days with little wind (wind speed < 10 km/h). Exposed,resting lizards were located by walking across an island in onedirection until an individual was detected through binoculars, usu-ally from a distance of 5–10 m. Because island scrub habitat wasvery similar on all study sites—being comprised of open rockyground interspersed by low (<80 cm), sclerophyllous evergreenbushes (Juniperus phoenicea, Pistacea lentiscus)—visibility oflizards was similar between sites. To simulate a predation event,the same observer approached every focal animal by walking di-rectly toward it at a practiced pace of approximately 80 m/min(Perez-Cembranos et al. 2013). We avoided measuring the flightresponse of gravid female lizards due to their predilection for re-maining close to refugia and differing physiological requirementsduring the reproductive period (Brana 1993). Cooper et al. (2009)found that at this speed detection distance did not have an effecton FID in a similar species, P. lilfordi. All approaches in this studywere performed by the same individual (K. M. Brock), wearingthe same attire to avoid confounding effects (Amo et al. 2006;Perez-Cembranos et al. 2013). Further, the observer never re-turned to previously sampled areas to avoid encountering the samelizard twice. Because direction and angle of approach, as well asobserver shadow may have an effect on a lizard’s response to pre-dation (Burger and Gochfeld 1990), we only performed head-onapproaches where no shadow was apparent. Both the publishedliterature (Dill and Houtman 1989; Bonenfant and Kramer 1996;Amo et al. 2006; Li et al. 2014) and our own data suggest that FIDis positively correlated to the distance a lizard has to cover to reachthe nearest refuge; we therefore recorded this measure (henceforthreferred to as distance to the refuge, DR) for every observation ofFID (Dill and Houtman 1989; Bulova 1994; Kramer and Bonen-fant 1997; Amo et al. 2006; Cooper and Perez-Mellado 2012). Assuggested by previous studies of other lizards (see Cooper et al.2009; Cooper 2011), we measured detection distance (distancebetween the focal animal and surrogate predator when focal an-imal detects the presence of the surrogate predator), as well as
body size (snout-vent length in cm) for a subset of the observedlizards at several island sites to test for potential relationships withFID (see Appendix S1).
Field autotomyField autotomy rates were calculated for each lizard populationas the proportion of individuals encountered that had previouslyautotomized tails. We observed how often lizards lost their tails inthe field using well-established methodologies (see Pafilis et al.2009a). Lizards were located using the same methods describedfor FID. Once an animal was detected in the field, through binocu-lars we observed the sex of the individual and whether its tail wasintact or previously autotomized. Previously autotomized tails arereadily distinguishable from intact tails by size, shape, color, andscale morphology (Simou et al. 2008). We considered adult malesand females in analyses of field autotomy.
Laboratory autotomyBeyond predation pressure, field autotomy depends on additionalfactors such as aggressive intraspecific interactions, predator ef-ficacy, microhabitat use, and average age of individuals within apopulation (Turner et al. 1982; Medel et al. 1988; Bateman andFleming 2009; Pafilis et al. 2009a). We therefore used a standard-ized measure of autotomy induced under controlled laboratoryconditions to distinguish between the innate predisposition ofmembers of a population to shed their tails and the environmen-tally determined opportunity for this to occur (Pafilis et al. 2009a;Hare and Miller 2010; Bateman and Fleming 2011). Laboratoryautotomy rates (LARs) were obtained for lizards from 28 of ourstudy sites (Fig. 1, Table 1). Individual lizards were wild-caughtusing a noose to minimize chance of tail autotomy that often oc-curs during capture by hand. Because ability to autotomize a tailis affected by age (Bellairs and Bryant 1985; Pafilis and Valakos2008), sex (Vitt 1981; Simou et al. 2008), and prior condition ofthe tail (Arnold 1984; Bateman and Fleming 2009), as well as toremain consistent with the methodologies used by Pafilis et al.(2009a), we limited laboratory autotomy analyses to adult malelizards with intact tails. Although it is possible that inclusion of fe-males may produce slightly different results, a prior study on thisgenus failed to reveal any intersexual differences (Pafilis 2003).
Lizards were housed in individual terraria (32 cm × 16 cm ×12 cm) for 48 h before conducting the tail autotomy measure-ments. Because autotomy in reptiles is potentially affected by ananimal’s body temperature (Daniels 1984; Pafilis et al. 2005),animals were allowed to thermoregulate freely along a thermalgradient until the time of procedure. Lizards were then individu-ally placed on a rough cork substrate placed at a 45o angle wherethey could firmly hold on. To standardize pressure across all trials,the same observer placed a pair of calipers approximately 20 mmbehind the cloacal vent and then closed to half the diameter of
EVOLUTION 2014 5

KINSEY M. BROCK ET AL.
Table 1. Island trait data for all 38 of our study sites.
Isolation Island Mean Total Vegetation LizardIsland period area FID (cm) FAR LAR Predators predation cover (%) density
Naxos 0 448 276.7 0.71 0.55 r, sb, b, v, os, m 6 . . . 6(NA) a (107) (21) (18)Parnitha∗ 0 1000 226.5 0.67 0.55 r, sb, b, v, os, m 6 . . . 5(PA) (13) (24) (47)Mando 4 0.025 267.9 0.80 0.40 r, sb, b 3 51 6(MN) aa (75) (30) (10)Pano Fira 100 0.35 221.5 0.50 . . . r, b, m 3 50 3(PF) dd (13) (12)Fidussa 1000 0.632 172.5 0.64 0.33 r, sb, b(FI) cc (8) (14) (12) 3 25 2.5Kato Fira 1000 0.728 210.9 0.70 0.11 r, sb, b, m 4 51 5(KF) d (21) (30) (18)Daskalio 2000 0.018 217.5 0.71 . . . r, b 2 80 8(DA) (4) (21)Kato Kufonissi 5000 4.3 158 0.50 0.33 r, sb, b 3 . . . 1.5(KK) (10) (20) (18)Aspronissi 5450 0.038 191.7 0.65 0.27 b 1 80 12(AS) cc (24) (20) (22)Ovriokastro 5600 0.22 178.1 0.80 0.35 r, sb 2 22 5.5(OV) (21) (25) (20)Petalidi 5600 0.05 105.7 . . . . . . r 1 10 2(PE) bb (23)Parthenos 5650 0.004 158.9 . . . . . . b 1 100 11(PR) aa (19)Nikouria 5700 2.75 116.5 0.71 (21) 0.40 (10) r, sb, b 3 90 6.75(NI) bb (20)Kisiri 5750 0.012 127.7 0.64 0.20 r, b 2 22 3.5(KI) bb (13) (11) (10)Andros 5800 384 252.8 0.67 0.50 r, sb, b, v, os, m 6 . . . 4(AN) (16) (24) (48)Glaronissi 6100 0.0102 194.4 0.77 0.17 b 1 100 19(GL) aa (25) (35) (17)Mikri Vigla 6100 0.002 261.4 . . . . . . None 0 40 7(MV) (7)Gramvoussa 6700 0.759 113.9 0.56 0.30 r, sb, b 3 51 3.67(GR) bb (33) (18) (10)Makronissi 6700 0.039 183.5 0.73 . . . None 0 80 14(MA) (69) (22)Gaiduronissi 7100 0.133 139.1 0.69 0.23 r 1 13 8(GA) (74) (42) (13)Loumboudiaris 8100 0.096 117.1 . . . . . . None 0 38 8(LO) (14)Megali Plaka 8100 0.031 135.5 0.81 . . . None 0 35 1.5(MP) (11) (16)Pano Kufonissi 9000 13 186.7 0.75 0.40 (10) r, sb, b, v, os 5 . . . 0.5(PK) (3) (16)Andreas 9100 0.045 137.1 0.84 0.15 None 0 5 1.5(AD) (14) (13) (13)Lazaros 9100 0.0137 160.7 . . . . . . None 0 19 3(LA) (14)Keros 9150 15.05 222.9 0.60 0.40 r, sb, b 3 70 4(KE) (7) (10) (5)
(Continued)
6 EVOLUTION 2014

EVOLUTION OF ANTIPREDATOR BEHAVIOR ON ISLANDS
Table 1. Continued.
Isolation Island Mean Total Vegetation LizardIsland period area FID (cm) FAR LAR Predators predation cover (%) density
Schoinoussa 9550 8.83 234.4 0.76 0.45 r, sb, b, os, m 5 . . . 1(SC) c (9) (13) (11)Venetiko 9550 0.11 123.3 . . . . . . None 0 39 7(VE) ee (21)Agriloussa 9650 0.084 151.9 0.67 0.15 r 1 54 8(AG) cc (21) (24) (20)Irakleia 9800 18.078 191.2 0.75 0.58 r, sb, b, v, os, m 6 . . . 3(IR) aa, e (17) (28) (12)Ios 11,750 109.02 255.3 0.75 0.50 r, sb, b, v, os, m 6 . . . 5(IO) (47) (56) (12)Agios Nikolaos 11,900 0.89 137 0.60 0.20 r, sb 2 40 10(NI) (22) (20) (15)Agia Paraskevi 11,900 0.27 117 0.65 0.27 r, sb 2 50 14(PA) (27) (20) (18)Strongyllo 11,900 0.36 118.7 0.64 0.37 a 1 30 13(ST) (31) (44) (16)Dhonoussa 12,800 15 272.2 0.70 0.50 r, sb, b, m 4 35 3.5(DH) aa (18) (20) (10)Amorgos 200,000 123 243.8 0.72 0.40 r, sb, b, os, m 5 80 2(AM) b (8) (22) (10)Chtenia 450,000 0.004 100 1 0 None 0 70 12(CH) aa (15) (18) (6)Anafi 3,600,00049 168.9 0.61 0.32 r, b, m 3 . . . 4(AF) aa (19) (21) (25)
Islands and their corresponding abbreviations (Fig. 1) are listed by increasing period of isolation. Isolation period is given in years and is the inferred age
of the island as calculated from bathymetric data and regionally calibrated sea-level change graphs. Parnitha is marked with an asterisk (also in Fig. 1) to
indicate it is a mainland location. Island area is in square kilometers. The average flight initiation distance (FID) is reported in centimeters, and sample sizes
are given in parentheses. Field autotomy rates (FAR) and laboratory autotomy rates (LARs) are reported as the fraction of tails autotomized per island with
sample sizes in parentheses. Predator categories are listed for each island (r = rats, sb = sand boas [Eryx jaculus], b = birds, v = vipers [Vipera ammodytes],
os = other saurophagus Colubrid snakes, and m = mammals). The “Total Predation” score is given in the last column and is the summation of predator
categories present on an island. Parnitha (marked by an asterisk) is a Greek mainland location (located 15 km north of Athens, 38.1734°N, 23.7174°E). Islands
used in our isolation analyses are notated with matching symbols: predator-rich baseline islands (a, b, c, d, e) and corresponding islets that had a direct split
(aa, bb, cc, dd, ee) (N = 16 for FID, and N = 12 FAR and LAR). Fields for which we could not obtain data are marked with ellipses.
the tail for a period of 15 s (Perez-Mellado et al. 1997). At theend of the 15 s trial, we recorded whether the lizard autotomizedor not. Each lizard was tested only once and was not included inother experiments. LARs are reported as the proportion of tailsthat were autotomized for each island population.
Effects of isolation on antipredator behaviorLand-bridge islands provide an excellent system to systematicallytest the effects of duration of isolation on loss of antipredator be-haviors. We estimated ancestral predator diversity by assuming allpresent-day islands shared the same predator communities whenthey were joined as Cycladia prior to Pleistocene sea-level rise.All previously mentioned predator types were included in analy-ses of isolation. We restricted our isolation analyses to those isletsthat split directly off from large, predator diverse post-Cycladia
islands (FID N = 17, field and laboratory autotomy N = 12, seeTable 1 and Appendix S1), for which we have confidence of theancestral predator community, as opposed to being derived sec-ondarily from an intermediate-sized island that had itself split offfrom a large island.
STATISTICAL ANALYSES AND MODEL SELECTION
We used a mixed modeling approach to study how flight behaviorchanged with varying degrees of predation (Table 2). Analysis ofFID was completed fitting the following model:
y = Xβ + Zu + ε.
The fixed effects (β) are the categorical predation vari-ables. Random effects (u), are given by a vector with meanE (u) = 0, and a covariance matrix var (u) = G. We used randomeffects for intercept and distance to the refuge, with the subject
EVOLUTION 2014 7

KINSEY M. BROCK ET AL.
Table 2. Selection criteria data for the seven mixed models constructed to explain variation in FID of Cycladic populations of P. erhardii.
Model AICc ! AICc Akaike weight
V + OS + M + SB + B + R 10,435.906 - 0.99999813M +B + OPM,B 10,462.648 26.742 1.559 × 10⁻⁶
M + V + OPM,V 10,465.908 30.002 3.056 × 10⁻⁷
M + OPM 10,474.875 38.969 3.451 × 10⁻⁹
B + OPB 10,476.109 40.203 1.862 × 10⁻⁹
V + OPV 10,478.728 42.822 5.027 × 10⁻¹⁰
" Predation 10,487.734 51.828 5.568 × 10⁻¹²
All models include flight initiation distance as the dependent variable, and distance to the refuge (DR) as a covariate (FID and DR Pearson corr = 0.0358,
P < 0.001, N = 913). The output of our final model (boldfaced), which considers all predator categories separately, suggests not all predator categories
are interchangeable and each is distinctly important. Predator predictors in this study include: V = vipers; OS = other saurophagus Colubrid snakes; M =mammalian predators; SB = sand boas (Eryx jaculus); B = predatory birds; R = rats; OP = other predators, calculated as the sum of all other predators
present besides the categorical predator predictor entered separately in the model; ! Predation = summary of all predator categories on an island. Models
were formulated a priori (Burnham and Anderson 1998) and were compared using AICc values and their associated Akaike model weights, calculated as
wi = exp( − "i /2)/!M
r=1 exp( − "r/2) (Turkheimer et al. 2003).
category being island. Detection distance, lizard body size (snout-vent length), and the relative abundance of intraspecific lizardswere also tested for relationships with FID to implement as poten-tial covariates in our models. We tested for correlation betweenpredator categories, and addressed this potential situation withmixed modeling techniques followed by model selection.
To identify predators most important for the maintenanceof specific defenses, we compared seven models developed fromour a priori knowledge of the study area and published literatureon predator–lizard interactions (Nowak et al. 2008; Pafilis et al.2009a; Reynolds and Bruno 2013). One model (“Total Preda-tion” " Predation) simply summed the number of categories ofpredators present for each island (Cooper et al. 2004; Pafilis et al.2009a,b; Cooper and Perez-Mellado 2012). This model assumesthat each predator category adds a similar amount to predationpressure. At the other extreme, we tested a model that considersall predator categories simultaneously and individually (“V + OS+ M + SB + B + R” Table 2). Other models followed an interme-diate logic in individually testing the effects of specific predatorsthought to have the greatest impact on FID, with all remainingpredators being pooled into an aggregate “other predators” (OP)category (Table 2). Based on prior research in this system and ourknowledge of hunting strategies in general, we formulated fivemodels that highlighted the role of mammals (M), avian preda-tors (AP), and vipers (V) in determining FID. As a result thecomposition of the “OP” category varied from model to modeland this was denoted with differing subscripts (Table 2).
Models were compared using AICc values and their associ-ated Akaike model weights
wi = exp (−!i/2) /"M
r=1exp(−!r/2)
(see Burnham and Anderson 1998; Turkheimer et al. 2003). Weused AICc instead of AIC scores to correct for finite sample size
and decrease the probability of overfitting data with excessiveparameters (Burnham and Anderson 2002, 2004).
Field and LARs were studied using generalized linear mod-els. We formed three competing hypotheses prior to data analysisto explain variation in autotomy at the island level, which we againcompared using AICc and the corresponding Akaike weights. Pre-dictors implemented in the model building process include: “TotalPredation” (the summation of all predator categories present on anisland), “0 Predation” (a categorical “yes/no” variable noting thepresence or absence of any predators on an island), and “Vipers”(a categorical “yes/no” variable noting the presence or absence ofvipers on an island). An earlier study of 15 Mediterranean lizardspecies found that ease of autotomy was largely explained by thepresence of vipers (Pafilis et al. 2009a), therefore, we specificallyanalyzed the effects of vipers on the retention of antipredator be-havior. Intercept was a fixed effect in all autotomy models. Giventhe relatively small sample sizes (N < 30 islands) of field and lab-oratory autotomy data, we constructed simple models with justone predictor variable to avoid overfitting. To avoid potential con-founding effects of excluding sex from the models, we comparedmale and female field autotomy rates with Pearson’s Chi-squareanalysis.
To examine effects of isolation time on FID and autotomiccapacity, we modeled behaviors from islets directly separatedfrom larger post-Cycladia populations (Table 1 and AppendixS1). Large, post-Cycladia islands similar to Naxos (with diversepresent-day predator regimes) were used as a baseline to compareyounger, smaller islets that were directly separated by rising sealevels. Of our 38 study locations, 17 islets fit our selection criteriaand were directly separated from much larger, predator-diverseislands. Autotomy data (both field and laboratory measurements)only existed for 12 of this subset of 17 islands. We compared twomixed models of each antipredator strategy, one using the same
8 EVOLUTION 2014

EVOLUTION OF ANTIPREDATOR BEHAVIOR ON ISLANDS
variables from the best predation model, and the other addingperiod of isolation (Ln-transformed) as a predictor variable tosee if time of isolation improves predictive power of antipredatorbehaviors on islands. All correlations are given using Pearson’s runless otherwise noted. Where hypotheses had a clear direction,we report one-tailed P values.
ResultsFLIGHT INITIATION DISTANCE
FID varied widely between individual lizards (10–855 cm:X = 180.2 cm, N = 913). As expected, FID was positively corre-lated with distance to refuge (r = 0.358, one-tailed P < 0.001, N =913). A preliminary analysis of a large subset of our data revealedsimilar FIDs for males and nongravid females (F1,309 = 0.308,P = 0.579, N = 142 females, 169 males), thus we included allnongravid individuals in our analyses. Predator category measure-ments were correlated with each other (Cohen’s Kappa, K range:0.194–0.857, P < 0.038, N = 38) due to the partially nested na-ture of where species occur on islands. Detection distance, lizardbody size, relative abundance of intraspecific lizards, nesting non-predatory seabird density, vegetation cover, presence of humans,and presence of walls had no relationship with FID, hence theywere not included as covariates in our models (see Appendix S1).
FID was best described by the diversity of predator typesof an island (Table 2). Lizards from islands with greater predatordiversity fled at greater distances (r = 0.618, one-tailed P < 0.001,N = 38) (Fig. 2). Predator diversity decreases with island size(r = 0.676, P < 0.01, N = 38), and small islets (<0.05 km2)tend to be completely predator-free (Table 1). An analysis of themarginal means from the final model shows that predatory birdsand mammals exerted the strongest effect on FID, whereas theeffects of vipers, sand boas, rats, and other snakes were small(Fig. 3). These small effects are apparently distinct, however,as the model that accounted for each predator class individuallygreatly outperformed the model that separated birds and mammalsand lumped all other predators together (Table 2).
FIELD AUTOTOMY
We obtained field autotomy rates for P. erhardii at 32 of our 38study sites (mean = 0.7, range: 0.5–1.0, N = 32; Table 1). Of 301females 209 (approximately 69%) had autotomized tails, and of430 males 306 had previously autotomized (approximately 71%).Autotomy rates were similar for males and females pooled acrossislands (χ2 = 0.254, P = 0.614, N = 731), so we combineddata from both sexes in further analyses. Of our competing gen-eralized linear models, “0 Predation” had the highest likelihoodand associated AIC weight (Table 3). Field autotomy rates werehigher on islands without any predators (X= 0.85, N = 4) than on
0 1 2 3 4 5 6
100
150
200
250
300
Total predation (# predator classes)
Mea
n fli
ght i
nitia
tion
dist
ance
(cm
)
Figure 2. Scatterplot of mean flight initiation distance by totalnumber of predator types per island. Each circle represents anisland. Mean FID increases as predation regime intensifies (R2 =0.382, r = 0.618, P < 0.001, N = 38).
-100
-50
0
50
100
Mammals Birds Vipers SandBoas
Rats OtherSnakes
Flig
ht in
itiat
ion
dist
ance
(cm
)
*
*
Figure 3. Effects for how each class of predators affected flightinitiation distances estimated by the marginal means from thebest model [FID ! DR + V + OS + M + SB + B + R]. Means anderror bars represent the average change in FID given the pres-ence of that predator. Means notated by asterisks have 95% con-fidence intervals that do not overlap the overall average, whichis notated as 0 (N = 913). Large lizard FIDs are most strongly as-sociated with the presence of mammalian and aerial predators,although all predators have an effect on the expression of thisbehavior.
EVOLUTION 2014 9
KINSEY M. BROCK ET AL.
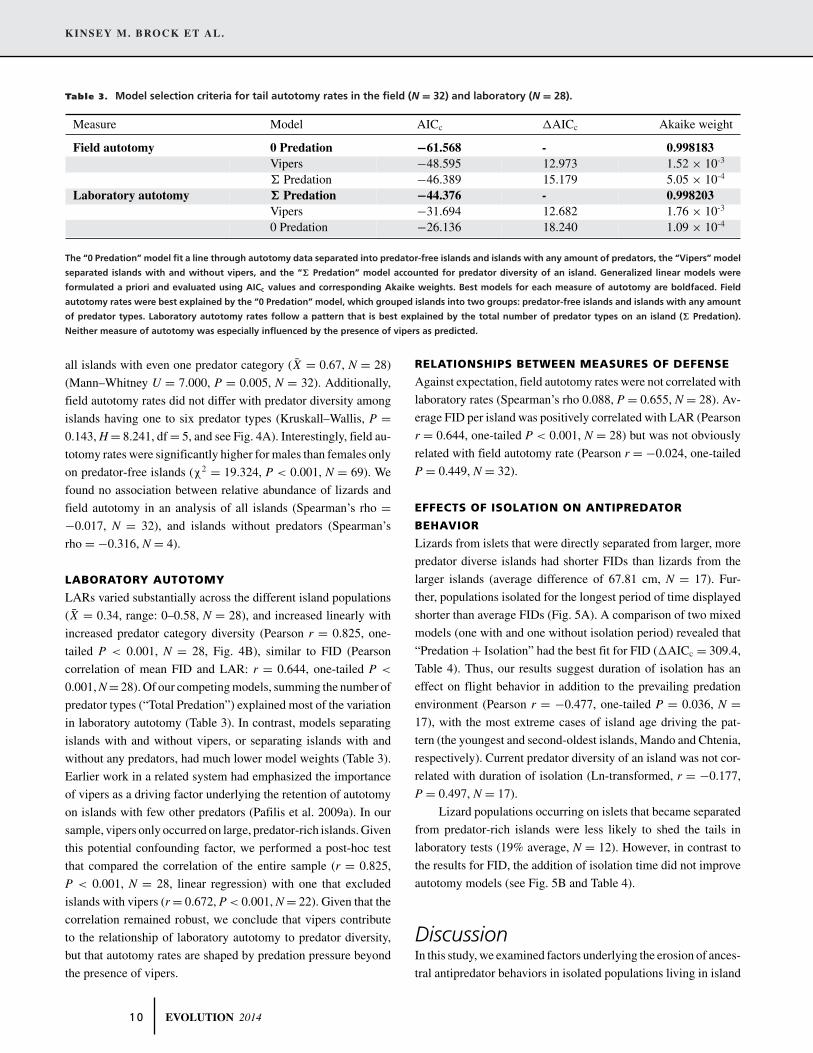
Table 3. Model selection criteria for tail autotomy rates in the field (N = 32) and laboratory (N = 28).
Measure Model AICc !AICc Akaike weight
Field autotomy 0 Predation −61.568 - 0.998183Vipers −48.595 12.973 1.52 × 10⁻³
" Predation −46.389 15.179 5.05 × 10⁻⁴
Laboratory autotomy ! Predation −44.376 - 0.998203Vipers −31.694 12.682 1.76 × 10⁻³
0 Predation −26.136 18.240 1.09 × 10⁻⁴
The “0 Predation” model fit a line through autotomy data separated into predator-free islands and islands with any amount of predators, the “Vipers” model
separated islands with and without vipers, and the “! Predation” model accounted for predator diversity of an island. Generalized linear models were
formulated a priori and evaluated using AICc values and corresponding Akaike weights. Best models for each measure of autotomy are boldfaced. Field
autotomy rates were best explained by the “0 Predation” model, which grouped islands into two groups: predator-free islands and islands with any amount
of predator types. Laboratory autotomy rates follow a pattern that is best explained by the total number of predator types on an island (! Predation).
Neither measure of autotomy was especially influenced by the presence of vipers as predicted.
all islands with even one predator category (X = 0.67, N = 28)(Mann–Whitney U = 7.000, P = 0.005, N = 32). Additionally,field autotomy rates did not differ with predator diversity amongislands having one to six predator types (Kruskall–Wallis, P =0.143, H = 8.241, df = 5, and see Fig. 4A). Interestingly, field au-totomy rates were significantly higher for males than females onlyon predator-free islands (χ2 = 19.324, P < 0.001, N = 69). Wefound no association between relative abundance of lizards andfield autotomy in an analysis of all islands (Spearman’s rho =−0.017, N = 32), and islands without predators (Spearman’srho = −0.316, N = 4).
LABORATORY AUTOTOMY
LARs varied substantially across the different island populations(X = 0.34, range: 0–0.58, N = 28), and increased linearly withincreased predator category diversity (Pearson r = 0.825, one-tailed P < 0.001, N = 28, Fig. 4B), similar to FID (Pearsoncorrelation of mean FID and LAR: r = 0.644, one-tailed P <
0.001, N = 28). Of our competing models, summing the number ofpredator types (“Total Predation”) explained most of the variationin laboratory autotomy (Table 3). In contrast, models separatingislands with and without vipers, or separating islands with andwithout any predators, had much lower model weights (Table 3).Earlier work in a related system had emphasized the importanceof vipers as a driving factor underlying the retention of autotomyon islands with few other predators (Pafilis et al. 2009a). In oursample, vipers only occurred on large, predator-rich islands. Giventhis potential confounding factor, we performed a post-hoc testthat compared the correlation of the entire sample (r = 0.825,P < 0.001, N = 28, linear regression) with one that excludedislands with vipers (r = 0.672, P < 0.001, N = 22). Given that thecorrelation remained robust, we conclude that vipers contributeto the relationship of laboratory autotomy to predator diversity,but that autotomy rates are shaped by predation pressure beyondthe presence of vipers.
RELATIONSHIPS BETWEEN MEASURES OF DEFENSE
Against expectation, field autotomy rates were not correlated withlaboratory rates (Spearman’s rho 0.088, P = 0.655, N = 28). Av-erage FID per island was positively correlated with LAR (Pearsonr = 0.644, one-tailed P < 0.001, N = 28) but was not obviouslyrelated with field autotomy rate (Pearson r = −0.024, one-tailedP = 0.449, N = 32).
EFFECTS OF ISOLATION ON ANTIPREDATOR
BEHAVIOR
Lizards from islets that were directly separated from larger, morepredator diverse islands had shorter FIDs than lizards from thelarger islands (average difference of 67.81 cm, N = 17). Fur-ther, populations isolated for the longest period of time displayedshorter than average FIDs (Fig. 5A). A comparison of two mixedmodels (one with and one without isolation period) revealed that“Predation + Isolation” had the best fit for FID (!AICc = 309.4,Table 4). Thus, our results suggest duration of isolation has aneffect on flight behavior in addition to the prevailing predationenvironment (Pearson r = −0.477, one-tailed P = 0.036, N =17), with the most extreme cases of island age driving the pat-tern (the youngest and second-oldest islands, Mando and Chtenia,respectively). Current predator diversity of an island was not cor-related with duration of isolation (Ln-transformed, r = −0.177,P = 0.497, N = 17).
Lizard populations occurring on islets that became separatedfrom predator-rich islands were less likely to shed the tails inlaboratory tests (19% average, N = 12). However, in contrast tothe results for FID, the addition of isolation time did not improveautotomy models (see Fig. 5B and Table 4).
DiscussionIn this study, we examined factors underlying the erosion of ances-tral antipredator behaviors in isolated populations living in island
1 0 EVOLUTION 2014

EVOLUTION OF ANTIPREDATOR BEHAVIOR ON ISLANDS
0 1 2 3 4 5 6
0.5
0.6
0.7
0.8
0.9
1.0
Total predation (# predator classes)
Fiel
d au
toto
my
rate
(pro
porti
on)
AVipersAbsentPresent
0 1 2 3 4 5 6
0.0
0.1
0.2
0.3
0.4
0.5
0.6
Total predation (# predator classes)
Lab
auto
tom
y ra
te (p
ropo
rtion
)
B
Figure 4. (A, top) Field autotomy rate (FAR) versus total num-ber of predator categories per island (Total Predation). Field au-totomy rates did not increase with rising predator diversity (R2 =0.039, P = 0.279, 95% CI ! Predation = −0.027 to 0.008, df = 1,N = 32). Conversely, predator-free islands had significantly higherFARs than islands with any amount of predation (mean ranks ofpredator-free vs. predator islands were 28.75 and 14.75, respec-tively, U = 7.000, Z = −2.798, P = 0.005, N = 32, Mann–WhitneyU-test). Because past work (Pafilis et al. 2009a) suggested a specialeffect of viperids on autotomy rates, islands inhabited by vipersare marked with triangles. (B, bottom) Laboratory autotomy rate(LAR) versus total amount of predator categories per island (To-tal Predation). LARs increased steadily with increased number ofpredator categories present (R2 = 0.680, P < 0.001, 95% CI ! Pre-dation = 0.046–0.082, df = 1, N = 28). Triangles represent islandswith vipers, and circles islands without vipers.
100 101 102 103 104 105 106 107
100
150
200
250
300
Duration of population isolation (years)
Mea
n fli
ght i
nitia
tion
dist
ance
(cm
)
A
100 101 102 103 104 105 106 107
0.0
0.1
0.2
0.3
0.4
0.5
0.6
Duration of population isolation (years)
Lab
auto
tom
y ra
te (p
ropo
rtion
)B
Figure 5. (A, top) Average flight initiation distance (cm) on isletsagainst duration of isolation (Ln-transformed) from the main is-land landmass (R2 = 0.200, Pearson r = −0.477 (one-tailed), P =0.036, N = 17). (B, bottom) Laboratory autotomy rates against du-ration of isolation (Ln-transformed) (linear regression R2 = 0.094,Pearson r = −0.306, P = 0.333, N = 12). This represents the rela-tionship between antipredator defenses with increasing period ofisolation.
environments. We predicted that flight behavior would vary acrossdistinct island populations of lizards, and decrease with loss ofpredator types. Results match our predictions for two main lizardantipredator defenses, flight response and laboratory autotomy(Figs. 2 and 4B). For FID, each predator type had an impact, with
EVOLUTION 2014 1 1

KINSEY M. BROCK ET AL.
more predator-diverse islands having the strongest responses. Forautotomic ability, predator diversity predicted ease of autotomywith no special effect of vipers apparent, counter to our secondprediction. Finally, lizard populations from islets that had beenisolated for the longest period of time under conditions of reducedpredator diversity indeed displayed decreased expression of flightbehavior.
Predator diversity was positively correlated with longer FID,and the absence of mammalian and avian predators had a strongeffect on the erosion of flight behavior in particular (Figs. 2, 3,5A). Presence of either mammalian or avian predation increasedlizard FID on average by 60 cm and 40 cm, respectively (Fig. 3).This is probably best explained by the particular hunting strate-gies employed by these predator guilds, and the ability of lizardsto recognize these particular predators prior to an attack. Feralcats (F. catus) and stone martens (M. foina), the main mammalianpredators on the islands, hunt by using speed to close the gapbetween themselves and the prey (Peck et al. 2008). Similarly,predatory birds fly in from a distance, often casting a recognizableshadow (Curio 1976; Smith 1976). These approaches differ dra-matically from snake predators in this island system. Vipers usu-ally employ a sit-and-wait hunting strategy and all snake speciesremain relatively close to the ground before striking prey (Valakoset al. 2008; Pafilis et al. 2009a). Hence, the reliance on speed toapproach a prey item from afar means that lizards that escapeearly reap the largest benefits. However, it is important to em-phasize that chemosensory cues, although not evaluated in thisstudy, may be more important for detecting at least some typesof predators (Cooper 2003). Nonetheless, the candidate modelthat simply summed the number of predator categories present(" Predation), had the least predictive power, whereas the modelthat considered all predator categories separately had a modelweight close to 1, even after the penalty AICc imposes for theinclusion of six explanatory variables (Table 2). This suggeststhat predator categories are not all interchangeable and that eachis important in a distinct manner in determining the expression offlight behavior (Table 2), and that simply aggregating the numberof predator groups is not sufficient to predict FIDs.
Populations of P. erhardii showed declines in flight behaviorwith increasing duration of isolation, particularly on predator-poor islands isolated for milennia, suggesting that time tells ussomething more about antipredator behavior than current predatorcommunity alone (Fig. 5A, Table 4). This evidence for gradualloss expands on past work that showed that island populationshave attenuated antipredator responses (Blumstein 2002;Blumstein and Daniel 2005; Cooper and Perez-Mellado 2012;Cooper et al. 2014). Although these studies have shown that iso-lated populations have lost some of their antipredator defenses,they provide little insight into the rate at which behaviors change(see Cooper et al. 2014). Reduced flight behavior was particularly
evident during visits to very old islands (see Fig. 5A and B):lizards from some of the oldest islands (450,000 years and older)were tame enough to approach within arm’s reach, and wouldsit in one’s hand after capture without attempting to flee (K. M.Brock, pers. obs.). Because flight behavior is largely recognizedas an “experience-dependent” antipredator behavior (Blumstein2002; Blumstein and Daniel 2005; Rodl et al. 2007), tamenesson islands with limited predation is probably due to an inabilityto adequately identify predators and correctly respond. Previouswork has suggested that loss of vigilance, a type of antipredatorbehavior, can occur rapidly (Blumstein 2002; Li et al. 2014). Wefound that short-term isolation (4–1000 years) of populations ex-perienced marginal reduction in FID (8–61 cm), with a greaterloss occurring over thousands of years (15–176 cm). Further, theinability for insular populations to mount an adequate endocrinestress response could also be related to the tameness we observedon our oldest islands (see Rodl et al. 2007). An effect of isolationremains even if predator diversity is taken into account (Table 4),thus suggesting an impact of duration of isolation directly on theextent of FID erosion. Extreme tameness on islands is probablythe result of a combination of decreased predator diversity (es-pecially hawks and mammals) and subsequent loss of predatorexperience and recognition, an effect that increases with periodof isolation.
Researchers have long debated whether the highest inci-dences of autotomy should occur in areas with inefficient preda-tors (because failed attacks are likely to result in autotomy andescape), or areas with the greater diversity of predators (Cooperet al. 2004; Pafilis et al. 2009a; Bateman and Fleming 2011;reviewed in Bateman and Fleming 2009). In contrast to otherstudies on Mediterranean herpetofauna (Diego-Rasilla 2003;Cooper et al. 2004; Pafilis et al. 2008, 2009a), we found that fieldautotomy rates did not reflect prevailing predation levels (in termsof predator diversity), nor were they correlated with standardizedlaboratory autotomy trials. Counterintuitively, the highest ratesof autotomy were actually observed on islets completely isolatedfrom predators, suggesting that autotomy on predator-free isletswas driven by intraspecific aggression and not by predation. In-creased intraspecific aggressiveness on islets without predators islikely a product of intensified competition for food, territory, andmates (Castilla and Van Damme 1996; Pafilis et al. 2009b; Raiaet al. 2010; Capula and Aloise 2011). Our results also suggestthat intraspecific aggression is more intensive among male indi-viduals in predator-free environments. In an effort to prevail overtheir (extremely numerous in the case of dense populations) rivals,male lizards attack conspecifics (Knell 2009). These fierce battlesregularly result in amputated body limbs (Jennings and Thompson1999; Knell 2009; Pafilis et al. 2009b; Vervust et al. 2009), andmay include cannibalism (Elgar and Crespi 1992; Bonsall andKlug 2011). Thus, it is possible the high rates of field autotomy
1 2 EVOLUTION 2014

EVOLUTION OF ANTIPREDATOR BEHAVIOR ON ISLANDS
Table 4. Selection criteria for alternative models investigating the importance of duration of isolation on antipredator behaviors.
Measure Model AICc ! AICc Akaike weight
Field autotomy 0 Predation −19.283 - 0.911580 Predation + Isolation −14.617 4.666 8.84 × 10⁻²
Laboratory autotomy ! Predation −21.617 - 0.81967" Predation + Isolation −18.607 3.01 1.8 × 10⁻¹
Flight initiation distance R + SB + B + M + Isolation 3930.11 - 0.99999(+DR) R + SB + B + M 4239.51 309.4 1 × 10⁻¹⁰
Winning models are boldfaced. Both field autotomy rate (N = 12), and laboratory autotomy rate (N = 12) predation models did not improve by adding period
of isolation, possibly due to small sample size and the penalty AICc imposes on additional explanatory variables. However, adding duration of isolation
(Ln-transformed) as a covariate (in addition to distance to refuge) did improve our best predator model of flight initiation distance (N = 371). Because these
analyses were performed on a subset of islands that directly split from larger, more predator diverse islands, there are no vipers (V) or other saurophagus
Colubrid snakes (OS) present, thus we did not include them in our isolation mixed models.
we observed on predator-free islands could be due to intraspe-cific agonistic encounters, although our results do not indicate adirect correlation between population density and field autotomy.However, this result could be due to small sample size or factorsunaccounted for in this study. This phenomenon should be in-vestigated more specifically in the future, by taking into accountfactors such as sex ratio, islet carrying capacity, food abundance,marines subsidies, etc.
In contrast to a similar study of autotomy in Mediterraneanlizards by Pafilis et al. (2009a), we found no relationship betweenfield and LARs, which likely reflects that none of that study’s lo-cations (with the exception of Dragonada) were small enough forsmall-islet intraspecific aggression effects to come into account.Interestingly, only the lizards from Dragonada, the one island eco-logically similar to the present predator-free islets, displayed thesame contrasting pattern of high field and low LARs as seen inthe present study (see Pafilis et al. 2009a). Small islet populationsof P. erhardii may differ in age structure because lizards are notbeing killed by predators, and therefore contain, on average, olderindividuals that have likely encountered more aggressive eventsand thus have more regenerated tails (Bateman and Fleming 2009;Pafilis 2009a; Pleguezuelos et al. 2010). Further investigation isrequired into intraspecific dynamics, food availability, and in-traspecific interactions on predator-free islands to explain whythese predator-free populations have such high autotomy rates inthe field and yet low rates in standardized trials.
LARs increased linearly with predator diversity. In distinctdeparture from field autotomy, LARs declined linearly with theloss of any predator category (Fig. 4B). Of our three competinghypotheses, the model that added all predator types captured themost variation in LARs (Table 3). A post-hoc investigation ofthe influence of vipers supports the claim that overall predatordiversity, and not viper presence alone, has a strong relationshipwith retained autotomic abilities. Thus, even after the removal ofislands where vipers were present from our analysis, we found alinear relationship between LARs and number of predator types.
Indeed, nonviperid snakes, as well as mammalian predators in-cluding rats, will attack lizards and induce autotomy (McCallum1986; Hare and Miller 2010, J. Foufopoulos, pers. obs.), and itappears that all predator categories can exert selective pressure onthe maintenance of tail autotomy.
In general, islets that were isolated for longer periods oftime lost more predator types, specifically vipers, mammals, othersaurophagus Colubrid snakes, and hawks, although there was nostatistically significant relationship between predator diversityand island isolation (see Table 1 and Appendix S1). This pat-tern is consistent with other island systems around the world thathave fewer predator species relative to mainland areas of com-parable size and habitat type (Darwin 1839; MacArthur and Wil-son 1967; Blumstein and Daniel 2005; Foufopoulos et al. 2011;Cooper and Perez-Mellado 2012). LARs were not correlated withprolonged duration of isolation (Fig. 5B), which was surprisinggiven the lifetime fitness costs of autotomy (Ballinger and Tin-kle 1979; Vitt and Cooper 1986; Pafilis et al. 2009a; Cromie andChapple 2013). Although our model that accounted for isolationperiod and predation performed somewhat worse than our modelthat considered only predation (Table 4), we feel that this issuewould be worth revisiting with a larger sample size containingmore islands younger than 6000 and older than 9000 years. Al-though a less-refined fear response and reduced ability for tailautotomy may be advantageous to a lizard’s fitness in a less-diverse predation environment (Cooper et al. 2004, 2014; Rodlet al. 2007), individuals may not have the capacity to adapt ifa novel predator were suddenly introduced (Beauchamp 2003;Baillie et al. 2004; Blackburn et al. 2004; Losos et al. 2006;Bonnaud et al. 2010). Our data suggest that when it comes tosusceptibility to invasive predators (cats and rats in our case), thesmaller and older the population, the more likely that populationwill be susceptible to predation.
We demonstrated that expression of antipredator behaviors inanimals with multiple predators varies sensitively according thenumber of predator species the prey is exposed to, and that certain
EVOLUTION 2014 1 3

KINSEY M. BROCK ET AL.
predator types are more important for the preservation of prac-ticed behaviors, such as FID. A basic yet novel finding was thatFID, a main antipredator behavior, decayed largely according toperiod of isolation from intense predation pressure. Interestingly,the current predation regime of an island effectively predicts thedegree of expression of antipredator behavior, but for FID, the du-ration of isolation improves our understanding of this trajectory.Taken together, our results suggest that tameness is strongly se-lected for on predator-free islands, where the energetic and fitnesscosts of maintaining antipredator behaviors greatly outweigh thebenefits. Costly antipredator behaviors may fade away quicklyin the absence of selective pressure; however, extreme tamenessmay result from many years of isolation from predators.
ACKNOWLEDGMENTSThis study would not have been possible without financial support fromthe University of Michigan School of Natural Resources & Environment,University of Michigan Museum of Zoology, University of MichiganInternational Institute, The SNRE Envoys, and the University of Michi-gan Marching Band. Generous statistical advice was given by Drs. D.Costello, K. Welch, and I. Ibanez. Supplies for field work were providedby G. Schneider and the Herpetology Division of UMMZ. We appreciatethe visual consultation given by J. Estrada and Drs. A. Davis-Rabosky andD. Rabosky. Our sincerest thanks to the wonderful field and laboratoryassistants who worked many hours to ensure this project was successful:M. White, C. Weber, W.-C. Cheng, C. Bergman, C. Donihue, J. Jozlin, F.Elias, and the entire Foskolos family.
DATA ARCHIVINGThe doi for our data is 10.5061/dryad.bt52f.
LITERATURE CITEDAdamopoulou, C., P. Pafilis, and E. Valakos. 1999. Diet composition of Podar-
cis milensis, Podarcis gaigeae and Podarcis erhardii (Sauria: Lacertidae)during summer. Bonn. Zool. Beitr. 48:275–282.
Amo, L., P. Lopez, and J. Martın. 2006. Nature-based tourism as a formof predation risks affects body condition and health state of Podarcismuralis lizards. Biol. Conserv. 131:402–409.
Arnold, E. 1984. Evolutionary aspects of tail shedding in lizards and theirrelatives. J. Nat. Hist. 18:127–169.
———. 1987. Resource partitioning among lacertid lizards in Southern Eu-rope. J. Zool. 1(Suppl.):739–782.
———. 1988. Caudal autotomy as a defense. Pp. 235–273 in C. Gans and R.B. Huey, eds. Biology of the reptilia. Vol. 16. Alan R. Liss Inc., NewYork.
Baillie, J., C. Hilton-Taylor, and S. Stuart, eds. 2004. 2004 IUCN red list ofthreatened species. A global species assessment. IUCN, Gland, Switzer-land and Cambridge, U.K.
Ballinger, R. E., and D. W. Tinkle. 1979. On the cost of tail regeneration tobody growth in lizards. J. Herpetol. 13:374–375.
Bateman, P., and P. Fleming. 2009. To cut a long tail short: a review oflizard caudal autotomy studies carried out over the last 20 years. J. Zool.277:1–14.
———. 2011. Frequency of tail loss reflects variation in predation levels,predator efficiency, and the behavior of three populations of brownanoles. Biol. J. Linn. Soc. 103:648–656.
Beauchamp, G. 2003. Group-size effects on vigilance: a search for mecha-nisms. Behav. Processes 63:111–121.
———. 2004. Reduced flocking by birds on islands with relaxed predation.Proc. R. Soc. Lond. B 271:1039–1042.
Bellairs, A., and S. Bryant. 1985. Autotomy and regeneration in reptiles. Pp.301–410 in C. Gans, ed. Biology of the reptilia. Vol. 15. John Wiley &Sons, New York.
Berger, S., M. Wikelski, L. Romero, E. Kalko, and T. Rodl. 2007. Behav-ioral and physiological adjustments to new predators in an endemicisland species, the Galapagos marine iguana. Horm. Behav. 52:653–663.
Blackburn, T., P. Cassey, R. Duncan, K. Evans, and K. Gaston. 2004. Avianextinction and mammalian introductions on oceanic islands. Science305:1955–1958.
Blumstein, D. 2002. Moving to suburbia: ontogenetic and evolutionaryconsequences of life on predator-free islands. J. Biogeogr. 29:685–692.
———. 2006. The multipredator hypothesis and the evolutionary persistenceof antipredator behavior. Ethology 112:209–217.
Blumstein, D., and J. Daniel. 2005. The loss of antipredator behavior followingisolation on islands. Proc. R. Soc. Lond. B 272:1663–1668.
Blumstein, D., L. Anthony, R. Harcourt, and G. Ross. 2003. Testing a keyassumption of wildlife buffer zones: is flight initiation distance a species-specific trait? Biol. Conserv. 110:97–100.
Bonenfant, M., and D. Kramer. 1996. The influence of distance to burrowon flight initiation distance in the woodchuck, Marmota monax. Behav.Ecol. 7:299–303.
Bonnaud, E., F. M. Medina, E. Vidal, M. Nogales, B. Tershy, E. Zavaleta, C.J. Donlan, B. Keitt, M. Le Corre, and S. V. Horwarth. 2010. The diet offeral cats on islands: a review and a call for more studies. Biol. Invasions13:581–603.
Bonsall, M. B., and H. Klug. 2011. Effects of among-offspring relatedness onthe origins and evolution of parental care and filial cannibalism. J. Evol.Biol. 24:1335–1350.
Brana, F. 1993. Shifts in body temperature and escape bahaviour of femalePodacis muralis during pregnancy. Oikos 66:216–222.
Brock, K., C. Donihue, and P. Pafilis. 2014. New records of frugivory andovophagy in Podarcis (Lacertidae) lizards from East Mediterranean Is-lands. Northwest. J. Zool. 10:223–225.
Broodbank, C. 2002. The dawn treaders. Pp. 6–35 in An island archaeologyof the early cyclades. Cambridge Univ. Press, Cambridge, U.K.
Bulova, S. 1994. Ecological correlates of population and individual variationin antipredator behavior of two species of desert lizards. Copeia 4:980–992.
Burger, J., and M. Gochfeld. 1990. Risk discrimination of direct versus tangen-tial approach by basking black iguanas (Ctenosaura similis): variationas a function of human exposure. J. Comp. Psychol. 104:388–394.
Burnham, K., and D. Anderson. 1998. Model selection and multimodel in-ference: a practical information-theoretic approach. 1st ed. Springer-Verlag, New York
———. 2002. Model selection and multimodel inference: a practicalinformation-theoretic approach. 2nd ed. Springer-Verlag, New York.
———. 2004. Multimodel inference: understanding AIC and BIC in modelselection. Sociol. Methods Res. 33:261–304.
Capula, M., and G. Aloise. 2011. Extreme feeding behaviors in the Italianwall lizard, Podarcis siculus. Acta Herpetol. 6:11–14.
Castilla, A., and R. Van Damme. 1996. Cannibalistic propensities in the lizardPodarcis hispanica atrata. Copeia 4:991–994.
Cattaneo, A. 2010. Note ecomorfologiche: Su alcune specie ofidiche egee,con particolare riferimento alle popolazioni delle centro-orientali. Nat.Sicil. XXXIV:319–350.
1 4 EVOLUTION 2014

EVOLUTION OF ANTIPREDATOR BEHAVIOR ON ISLANDS
Chapple, D., and R. Swain. 2002a. Distributions of energy reserves in aviviparous skink: does tail autotomy involve the loss of lipid stores?Austral Ecol. 27:565–572.
———. 2002b. Effect of caudal autotomy on locomotor performance in aviviparous skink, Niveoscincus metallicus. Funct. Ecol. 16:817–825.
Cooper, W. 1997. Escape by a refuging prey, the broad-headed skink (Eumeceslaticeps). Can. J. Zool. 75:943–947.
———. 2003. Foraging mode and evolution of strike-induced chemosensorysearching in lizards. J. Chem. Ecol. 29:1013–1026.
———. 2011. Age, sex and escape behavior in the Striped Plateau Lizard(Sceloporus virgatus) and the Mountain Spiny Lizard (S. jarrovii), witha review of age and sex effects on escape by lizards. Behaviour 148:1215-1238.
Cooper, W., and W. Frederick. 2007. Optimal flight initiation distance. J.Theor. Biol. 244:59–67.
Cooper, W., and V. Perez-Mellado. 2012. Historical influence of predationpressure on escape by Podarcis lizards in the Balearic Islands. Biol. J.Linn. Soc. 107:1–15.
Cooper, W., V. Perez-Mellado, and L. Vitt. 2004. Ease and effectiveness ofcostly autotomy vary with predation intensity among lizard populations.J. Zool. 262:243–255.
Cooper, W., D. Hawlena, and V. Perez-Mellado. 2009. Interactive effect ofstarting distance and approach speed on escape behavior challengestheory. Behav. Ecol. 20:542–546.
Cooper, W., R. Pyron, and T. Garland Jr. 2014. Island tameness: living onislands reduces flight initiation distance. Proc. R. Soc. Lond. B 281:1–7.
Cromie, G., and D. Chapple. 2013. Is partial tail loss the key to a completeunderstanding of caudal autotomy? Austral Ecol. 38:452–455.
Curio, E. 1976. The ethology of predation, Vol. 7. Springer-Verlag, New York.———. 1993. Proximate and developmental aspects of antipredator behavior.
Adv. Study Behav. 22:135–238.Daniels, C. 1984. The importance of caudal lipid in the gecko Phyllodactylus
marmoratus. Herpetologica 40:337–344.———. 1985. Economy of autotomy as a lipid conserving mechanism: an
hypothesis rejected for the gecko Phyllodactylus marmoratus. Copeia1985:468–472.
Darwin, C. 1839. Journal of researches into the geology and natural history ofthe various countries visited by the H.M.S. Beagle, under the commandof Captain Fitzroy. R.N. from 1832–1836. Henry Colburn, Lond.
Dial, B., and L. Fitzpatrick. 1983. Lizard tail autotomy: function and energeticsof postautotomy tail movement in Scincella lateralis. Science 219:391–393.
———. 1984. Predator escape success in tailed versus tailless Scincella lat-eralis (Sauria: Scincidae). Anim. Behav. 32:301–302.
Diego-Rasilla, F. 2003. Influence of predation pressure on the escape behaviorof Podarcis muralis lizards. Behav. Processes 63:1–7.
Dill, L., and R. Houtman. 1989. The influence of distance to refuge on flightinitiation distance in gray squirrels (Sciurus carolinensis). Can. J. Zool.67:233–235.
Edmunds, M. 1974. Defense in animals: a survey of anti-predator defenses.Longman, Lond.
Elgar, M. A., and B. J. Crespi. 1992. Cannibalism: ecology and evolutionamong diverse taxa. Oxford Univ. Press, Oxford, U.K.
Fielding, J., and N. Turland. 2008. Flowers of crete. 2nd ed. Royal BotanicGardens, Kew, London, Surrey, U.K.
Foufopoulos, J., and A. Ives. 1999. Reptile extinctions on land-bridge islands:life history attributes and vulnerability to extinction. Am. Nat. 153:1–25.
Foufopoulos, J., and G. Mayer. 2007. Turnover of passerine birds on islandsin the Aegean Sea. J. Biogeogr. 34:1113–1123.
Foufopoulos, J., A. Marm Kilpatrick, and A. Ives. 2011. Climate change andelevated extinction rates of reptiles from Mediterranean islands. Am.Nat. 177:119–129.
Fox, S., and M. Rostker. 1982. Social cost of tail loss in Uta stansburiana.Science 218:692–693.
Greene, H. W. 1988. Antipredator mechanism in reptiles. Pp. 1–152 in C.Gans and R. B. Huey, eds. Biology of the reptilia: ecology defense andlife history. Vol. 16. Liss, New York.
Gruber, U. 1987. Podarcis erhardii (Bedriaga, 1876)—Agaische Mauerei-dechse. Pp. 25–49 in W. Bohme, ed. Handbuch der Reptilien und Am-phibien Europas (Band 2/II Echsen (Sauria) III (Lacertidae III: Podarcis).AULA-Verlag, Wiesbaden, Germany.
Hurston, H., L. Voith, J. Bonanno, J. Foufopoulos, P. Pafilis, E. Valakos, and N.Anthony. 2009. Effects of fragmentation on genetic diversity in islandpopulations of the Aegean wall lizard Podarcis erhardii (Lacertidae,Reptilia). Mol. Phylogenet. Evol. 52:395–405.
Hare, K., and K. Miller. 2010. Frequency of tail loss does not reflect innatepredisposition in temperate New Zealand lizards. Naturwissenschaften97:197–203.
Iverson, J. B. 1978. The impact of feral cats and dogs on populations ofthe West Indian rock iguana, Cyclura carinata. Biol. Conserv. 14:63–73.
Jaeger, R. 1994. Transect sampling. Pp. 103–107 in W. R. Heyer, M. A.Donnelly, R. W. McDiarmid, L. A. C. Hayek, and M. S. Foster, eds.Measuring and monitoring biological diversity. Smithsonian InstitutionPress, Washington, DC.
Jennings, W., and G. Thompson. 1999. Territorial behavior in the Australianscincid lizard Ctenotus fallens. Herpetologica 55:352–361.
Klippel, W. E., and L. M. Snyder. 1991. Dark-age fauna from kavousi, crete:the vertebrates from the 1987 and 1988 excavations. Hesperia 60:179–186.
Knell, R. J. 2009. Population density and the evolution of male aggression. J.Zool. 278:83–90.
Kramer, D., and M. Bonenfant. 1997. Direction of predator approach and thedecision to flee the refuge. Anim. Behav. 54:289–295.
Li, B., A. Belasen, P. Pafilis, P. Bednekoff, and J. Foufopoulos. 2014. Ef-fects of feral cats on the evolution of anti-predator behaviours in islandreptiles: insights from an ancient introduction. Proc. R. Soc. Lond. B281:20140339.
Lin, Z., and X. Ji. 2005. Partial tail loss has no severe effects on energy storesand locomotor performance in a lacertid lizard, Takydromus septentri-onalis. J. Comp. Physiol. B 175:567–573.
Losos, J., T. Schoener, R. Langerhans, and D. Spiller. 2006. Rapid temporalreversal in predator-driven natural selection. Science 314:1111.
MacArthur, R., and E. Wilson. 1967. The theory of island biogeography.Princeton Univ. Press, Princeton, NJ.
Magurran, A. 1990. The inheritance and development of minnow anti-predatorbehavior. Anim. Behav. 39:834–842.
———. 1999. The causes and consequences of geographic variation in an-tipredator behavior: perspectives from fish populations. Pp. 139–163in S. A. Foster and J. A. Endler, eds. Geographic variation in behav-ior: perspectives on evolutionary mechanisms. Oxford Univ. Press, NewYork.
Martın, J., and P. Lopez. 2003. Changes in the escape response of the lizardAcanthodactylus erythrurus under persistent predatory attacks. Copeia2:408–413.
McCallum, J. 1986. Evidence of predation by kiore upon lizards from theMokohinau Islands. N. Z. J. Ecol. 9:83–87.
Medel, R., J. Jiminez, S. Fox, and F. Jaksic. 1988. Experimental evidence thathigh-population frequencies of lizard tail autotomy indicates inefficientpredation. Oikos 53:321–324.
Nogales, M., and F. M. Medina. 2009. Trophic ecology of feral cats (Felis sil-vestris f. catus) in the main environments of an oceanic archipelago(Canary Islands): an updated approach. Mamm. Biol. 74:169–181.
EVOLUTION 2014 1 5

KINSEY M. BROCK ET AL.
Nowak, E., T. Theimer, and G. Schuett. 2008. Functional and numeric re-sponses of predators: where do vipers fit in the traditional paradigms?Biol. Rev. 83:601–620.
Pafilis, P. 2003. Adaptations of lacertids based on their thermal biology,metabolic rate and phylogenetic history. Ph.D. thesis, University ofAthens, Athens, Greece.
Pafilis, P., and E. Valakos. 2008. Loss of caudal autotomy during ontogeny ofBalkan Green Lizard, Lacerta trilineata. J. Nat. Hist. 42:409–419.
Pafilis, P., E. D. Valakos, and J. Foufopoulos. 2005. Comparative post-autotomy tail activity in six Mediterranean lacertid lizard species. Phys-iol. Biochem. Zool. 78:828–838.
Pafilis, P., V. Perez-Mellado, and E. D. Valakos. 2008. Post autotomy tailactivity in Balearic wall lizard, Podarcis lilfordi. Naturwissenschaften95:217–221.
Pafilis, P., J. Foufopoulos, N. Poulakakis, P. Lymberakis, and E. Valakos.2009a. Tail shedding in island lizards [Lacertidae, Reptilia]: declineof antipredator defenses in relaxed predation environments. Evolution63:1262–1278.
Pafilis, P., S. Meiri, J. Foufopoulos, and E. Valakos. 2009b. Intraspecific com-petition and high food availability are associated with insular gigantismin a lizard. Naturwissenschaften 96:1107–1113.
Pafilis, P., I. Anastasiou, K. Sagonas, and E. Valakos. 2013. Grazing by goatson islands affects the populations of an endemic Mediterranean lizard.J. Zool. 290:255–264.
Peck, D. R., L. Faulquier, P. Pinet, S. Jaquemet, and M. L. Corre. 2008. Feralcat diet and impact on sooty terns at Juan de Nova Island, MozambiqueChannel. Anim. Conserv. 11:65–74.
Perez-Cembranos, A., V. Perez-Mellado, and W. Cooper. 2013. Predation riskand opportunity cost of fleeing while foraging on plants influence escapedecisions of an insular lizard. Ethology 119:522–530.
Perez-Mellado, V., C. Corti, and P. Lo Cascio. 1997. Tail autotomy and ex-tinction in Mediterranean lizards: a preliminary study of continental andinsular populations. J. Zool. 243:553–541.
Perez-Mellado, V., J. A. Hernandez-Estevez, T. Garcıa-Dıez, B. Terrassa, M.M. Ramon, J. Castro, A. Picornell, J. Martın-Vallejo, and R. Brown.2008. Population density in Podarcis lilfordi (Squamata, Lacertidae), alizard species endemic to small islets (Spain). Amphibia-Reptilia 29:49–60.
Pirazzoli, P. A. 1991. World atlas of Holocene sea-level changes. ElsevierScience, Amsterdam.
———. 1996. Sea-level changes: the last 20,000 years. Wiley, Chichester.Pleguezuelos, J. M., M. Feriche, S. Reguera, and X. Santos. 2010. Patterns of
tail breakage in the ladder snake (Rhinechis scalaris) reflect differentialpredation pressure according to body size. Zoology 113:269–274.
Poulos, S., G. Ghionis, and H. Maroukian. 2009. Sea-level rise trends in theAttico-Cycladic region (Aegean Sea) during the last 500 years. Geomor-phology 107:10–17.
Rackham, O., and A. Grove. 2001. The nature of Mediterranean Europe: anecological history. Yale Univ. Press, New Haven, CT.
Raia, P., F. Guarino, M. Turano, G. Polese, D. Rippa, F. Carotenuto, D. M.Monti, M. Cardi, and D. Fulgione. 2010. The blue lizard spandrel andthe island syndrome. BMC Evol. Biol. 10:289.
Reynolds, P., and J. Bruno. 2013. Multiple predator species alter prey behavior,population growth, and a trophic cascade in a model estuarine food web.Ecol. Monogr. 83:119–132.
Rodl, T., S. Berger, L. Romero, and M. Wikelski. 2007. Tameness and stressphysiology in a predator-naıve island species confronted with novelpredation threat. Proc. R. Soc. Lond. B 247:577–582.
Salvador, A., J. Martin, and P. Lopez. 1995. Tail loss reduces home range sizeand access to females in male lizards (Psammadromus algirus). Behav.Ecol. 6:382–387.
Sanchez-Pinero, F., and G. Polis. 2000. Bottom-up dynamics of allochthonousinput: direct and indirect effects of seabirds on islands. Ecology 81:3117–3132.
Schall, J., C. Bromwich, Y. Werner, and J. Mildedge. 1989. Clubbed regener-ated tails in Agama agama and their possible use in social interactions.J. Herpetol. 23:305–307.
Serpell, J. A. 2000. Domestication and history of the cat. Pp. 179–192 in D.C. Turner and P. Bateson, eds. The domestic cat: the biology and itsbehavior. Cambridge Univ. Press, Cambridge, U.K.
Shepard, D. 2007. Habitat but not body affects predator attack fre-quency on lizard models in Brazillian Cerrado. Herpetologica 63:193–202.
Simou, C., P. Pafilis, A. Skella, A. Kourkouli, and E. Valakos. 2008. Physi-ology of original and regenerated tails in Aegean Wall Lizard (Podarciserhardii). Copeia 3:504–509.
Smith, S. 1976. A study of prey-attack behavior in young loggerhead shrikes,Lanius ludovicianus. Behavior 44:113–141.
Stankowich, T., and D. Blumstein. 2005. Fear in animals: a meta-analysis andreview of risk assessment. Proc. R. Soc. Lond. B 272:2627–2634.
Tsasi, G., P. Pafilis, C. Simou, and E. Valakos. 2009. Predation pressure,density-induced stress and tail regeneration: a casual nexus situa-tion or a bunch of independent factors? Amphibia-Reptilia 30:471–482.
Turkheimer, F., R. Hinz, and V. Cunningham. 2003. On the undecidabilityamong kinetic models: from model selection to model averaging. J.Cereb. Blood Flow Metab. 23:490–498.
Turner, F., P. Medica, R. Jennrich, and B. Maza. 1982. Frequencies of brokentails among Uta stansburiana in southern Nevada and a test of thepredation hypothesis. Copeia 1982:835–840.
USDMA. 1991. Mediterranean, Aegean Sea, Greece—south coast, KikladhesNisoi to Kriti. U.S. Defense Mapping Agency, Washington, DC.
Valakos, E., P. Pafilis, K. Sotiropoulos, P. Lymberakis, P. Maragou, and J.Foufopoulos. 2008. The amphibians and reptiles of Greece. EditionChimaira, Frankfurt, Germany.
Vervust, B., S. Van Dongen, I. Grbac, and R. Van Damme. 2009. The mysteryof the missing toes: extreme levels of natural mutilation in island lizardpopulations. Funct. Ecol. 23:996–1003.
Vitt, L. 1981. Tail autotomy and regeneration in the tropical skink, Mabuyaheathi. J. Herpetol. 15:454–457.
Vitt, L., and J. Cooper. 1986. Tail loss, tail color, and predator escape inEumeces (Lacertilia: Scincidae): age-specific differences in costs andbenefits. Can. J. Zool. 64:583–592.
Vitt, L., J. Congdon, and N. Dickson. 1977. Adaptive strategies and energeticsof tail autotomy in lizards. Ecology 58:326–337.
Ydenberg, R., and L. Dill. 1986. The economics of fleeing from predators.Adv. Study Behav. 16:229–249.
Associate Editor: E. B. Rosenblum
Supporting InformationAdditional Supporting Information may be found in the online version of this article at the publisher’s website:
Appendix S1. This file contains supplemental analyses and statistics referenced in the main text.
1 6 EVOLUTION 2014
Related Documents


