arXiv:astro-ph/0503365v1 16 Mar 2005 Draft version June 25, 2011 Preprint typeset using L A T E X style emulateapj v. 6/22/04 EVOLUTION IN THE CLUSTER EARLY-TYPE GALAXY SIZE-SURFACE BRIGHTNESS RELATION AT Z ≃ 1 1 B. P. Holden 2 , J. P. Blakeslee 3 , M. Postman 4 , G. D. Illingworth 2 , R. Demarco 3 , M. Franx 5 , P. Rosati 6 , R. J. Bouwens 2 , A. R. Martel 3 , H. Ford 3 , M. Clampin 7 , G.F. Hartig 4 , N. Ben´ itez 8 , N. J. G. Cross 3 , N. Homeier 3 , C. Lidman 9 , F. Menanteau 3 , A. Zirm 5 , D.R. Ardila 3 , F. Bartko 10 , L.D. Bradley 3 , T.J. Broadhurst 11 , R.A. Brown 4 , C.J. Burrows 4 , E.S. Cheng 12 , P.D. Feldman 3 , D.A. Golimowski 3 , T. Goto 3 , C. Gronwall 13 , L. Infante 14 , R.A. Kimble 7 , J.E. Krist 4 , M.P. Lesser 15 , D. Magee 2 , S. Mei 3 , G.R. Meurer 3 , G.K. Miley 5 , V. Motta 14 , M. Sirianni 4 , W.B. Sparks 4 , H.D. Tran 16 , Z.I. Tsvetanov 3 , R.L. White 4 , and W. Zheng 3 Draft version June 25, 2011 ABSTRACT We investigate the evolution in the distribution of surface brightness, as a function of size, for elliptical and S0 galaxies in the two clusters RDCS J1252.9-2927, z =1.237 and RX J0152.7-1357, z =0.837. We use multi-color imaging with the Advanced Camera for Surveys on the Hubble Space Telescope to determine these sizes and surface brightnesses. Using three different estimates of the surface brightnesses, we find that we reliably estimate the surface brightness for the galaxies in our sample with a scatter of < 0.2 mag and with systematic shifts of 0.05 mag. We construct samples of galaxies with early-type morphologies in both clusters. For each cluster, we use a magnitude limit in a band which closely corresponds to the rest-frame B, to magnitude limit of M B = −18.8 at z = 0, and select only those galaxies within the color-magnitude sequence of the cluster or by using our spectroscopic redshifts. We measure evolution in the rest-frame B surface brightness, and find −1.41 ± 0.14 mag from the Coma cluster of galaxies for RDCS J1252.9-2927 and −0.90 ± 0.12 mag of evolution for RX J0152.7-1357, or an average evolution of (−1.13 ± 0.15)z mag. Our statistical errors are dominated by the observed scatter in the size-surface brightness relation, σ =0.42 ± 0.05 mag for RX J0152.7-1357 and σ =0.76 ± 0.10 mag for RDCS J1252.9-2927. We find no statistically significant evolution in this scatter, though an increase in the scatter could be expected. Overall, the pace of luminosity evolution we measure agrees with that of the Fundamental Plane of early-type galaxies, implying that the majority of massive early-type galaxies observed at z ≃ 1 formed at high redshifts. Subject headings: galaxies: clusters: general — galaxies: elliptical and lenticular, cD — galaxies: evolution — galaxies: fundamental parameters — galaxies: photometry — galaxies: clusters: individual (RDCS J1252.9-2927, RX J1052.7-1357) 1 Based on observations with the NASA/ESA Hubble Space Telescope, obtained at the Space Telescope Science Institute, which is operated by the Association of Universities for Research in As- tronomy, Inc. under NASA contract No. NAS5-26555. Based on observations obtained at the European Southern Observatory us- ing the ESO Very Large Telescope on Cerro Paranal (ESO Large Programme 166.A-0701). 2 Department of Astronomy, UCO/Lick Observatories, Univer- sity of California, Santa Cruz, 95064; [email protected] 3 Department of Physics and Astronomy, Johns Hopkins Uni- versity, 3400 North Charles Street, Baltimore, MD 21218. 4 STScI, 3700 San Martin Drive, Baltimore, MD 21218. 5 Leiden Observatory, Postbus 9513, 2300 RA Leiden, Nether- lands. 6 European Southern Observatory, Karl-Schwarzschild-Strasse 2, D-85748 Garching, Germany. 7 NASA Goddard Space Flight Center, Code 681, Greenbelt, MD 20771. 8 Inst ´ ituto de Astrof ´ isica de Andaluc ´ ia, Camino Bajo de Hu´ etor 24, Granada, 18008, Spain. 9 European Southern Observatory, Alonso de Cordova 3107, Casilla 19001, Santiago, Chile. 10 Bartko Science & Technology, 14520 Akron Street, Brighton, CO 80602. 11 Racah Institute of Physics, The Hebrew University, Jerusalem, Israel 91904. 12 Conceptual Analytics, LLC, 8209 Woburn Abbey Road, Glenn Dale, MD 20769 13 Department of Astronomy and Astrophysics, The Pennsylva- nia State University, 525 Davey Lab, University Park, PA 16802. 14 Departmento de Astronom´ ıa y Astrof´ ısica, Pontificia Univer- sidad Cat´ ølica de Chile, Casilla 306, Santiago 22, Chile. 15 Steward Observatory, University of Arizona, Tucson, AZ 1. INTRODUCTION The apparent evolution in the colors and magnitudes of early-type cluster galaxies has long been used as a test of the history of galaxy evolution. The re- lations between magnitude and size or velocity dis- persion play an important role, as they give the ob- server a way to predict the apparent luminosity of a galaxy based on some other observable property (Faber & Jackson 1976; Tully & Fisher 1977; Kormendy 1977; Djorgovski & Davis 1987). Using these scaling relations, it has been observed that there is remark- able uniformity in cluster early-type galaxy properties at low redshifts, z 0.2, (Sandage & Perelmuter 1991; Jørgensen et al. 1996; Bernardi et al. 2003, for example). At redshifts up to ≃ 1, there have been a number of papers that have established a decrease in the mass-to- light ratio, using the Fundamental Plane. These studies find that the trend with redshift corresponds to a pas- sively evolving stellar population which has a luminosity- weighted last epoch of major star-formation around z ≃ 2 − 3 (van Dokkum & Franx 1996; Kelson et al. 1997; van Dokkum et al. 1998; Kelson et al. 2000c; van Dokkum & Franx 2001; van Dokkum & Stanford 85721. 16 W. M. Keck Observatory, 65-1120 Mamalahoa Hwy., Ka- muela, HI 96743

Welcome message from author
This document is posted to help you gain knowledge. Please leave a comment to let me know what you think about it! Share it to your friends and learn new things together.
Transcript

arX
iv:a
stro
-ph/
0503
365v
1 1
6 M
ar 2
005
Draft version June 25, 2011Preprint typeset using LATEX style emulateapj v. 6/22/04
EVOLUTION IN THE CLUSTER EARLY-TYPE GALAXY SIZE-SURFACE BRIGHTNESS RELATION ATZ ≃ 1 1
B. P. Holden2, J. P. Blakeslee3, M. Postman4, G. D. Illingworth2, R. Demarco3, M. Franx5, P. Rosati6, R. J.Bouwens2, A. R. Martel3, H. Ford3, M. Clampin7, G.F. Hartig4, N. Benitez8, N. J. G. Cross3, N. Homeier3, C.
Lidman9, F. Menanteau3, A. Zirm5, D.R. Ardila3, F. Bartko10, L.D. Bradley3, T.J. Broadhurst11, R.A. Brown4,C.J. Burrows4, E.S. Cheng12, P.D. Feldman3, D.A. Golimowski3, T. Goto3, C. Gronwall13, L. Infante14, R.A.
Kimble7, J.E. Krist4, M.P. Lesser15, D. Magee2, S. Mei3, G.R. Meurer3, G.K. Miley5, V. Motta14, M. Sirianni4,W.B. Sparks4, H.D. Tran16, Z.I. Tsvetanov3, R.L. White4, and W. Zheng3
Draft version June 25, 2011
ABSTRACT
We investigate the evolution in the distribution of surface brightness, as a function of size, forelliptical and S0 galaxies in the two clusters RDCS J1252.9-2927, z = 1.237 and RX J0152.7-1357,z = 0.837. We use multi-color imaging with the Advanced Camera for Surveys on the Hubble SpaceTelescope to determine these sizes and surface brightnesses. Using three different estimates of thesurface brightnesses, we find that we reliably estimate the surface brightness for the galaxies in oursample with a scatter of < 0.2 mag and with systematic shifts of . 0.05 mag. We construct samplesof galaxies with early-type morphologies in both clusters. For each cluster, we use a magnitude limitin a band which closely corresponds to the rest-frame B, to magnitude limit of MB = −18.8 atz = 0, and select only those galaxies within the color-magnitude sequence of the cluster or by usingour spectroscopic redshifts. We measure evolution in the rest-frame B surface brightness, and find−1.41± 0.14 mag from the Coma cluster of galaxies for RDCS J1252.9-2927 and −0.90± 0.12 mag ofevolution for RX J0152.7-1357, or an average evolution of (−1.13± 0.15)z mag. Our statistical errorsare dominated by the observed scatter in the size-surface brightness relation, σ = 0.42± 0.05 mag forRX J0152.7-1357 and σ = 0.76±0.10 mag for RDCS J1252.9-2927. We find no statistically significantevolution in this scatter, though an increase in the scatter could be expected. Overall, the pace ofluminosity evolution we measure agrees with that of the Fundamental Plane of early-type galaxies,implying that the majority of massive early-type galaxies observed at z ≃ 1 formed at high redshifts.Subject headings: galaxies: clusters: general — galaxies: elliptical and lenticular, cD — galaxies:
evolution — galaxies: fundamental parameters — galaxies: photometry — galaxies:clusters: individual (RDCS J1252.9-2927, RX J1052.7-1357)
1 Based on observations with the NASA/ESA Hubble SpaceTelescope, obtained at the Space Telescope Science Institute, whichis operated by the Association of Universities for Research in As-tronomy, Inc. under NASA contract No. NAS5-26555. Based onobservations obtained at the European Southern Observatory us-ing the ESO Very Large Telescope on Cerro Paranal (ESO LargeProgramme 166.A-0701).
2 Department of Astronomy, UCO/Lick Observatories, Univer-sity of California, Santa Cruz, 95064; [email protected]
3 Department of Physics and Astronomy, Johns Hopkins Uni-versity, 3400 North Charles Street, Baltimore, MD 21218.
4 STScI, 3700 San Martin Drive, Baltimore, MD 21218.5 Leiden Observatory, Postbus 9513, 2300 RA Leiden, Nether-
lands.6 European Southern Observatory, Karl-Schwarzschild-Strasse 2,
D-85748 Garching, Germany.7 NASA Goddard Space Flight Center, Code 681, Greenbelt,
MD 20771.8 Instituto de Astrofisica de Andalucia, Camino Bajo de Huetor
24, Granada, 18008, Spain.9 European Southern Observatory, Alonso de Cordova 3107,
Casilla 19001, Santiago, Chile.10 Bartko Science & Technology, 14520 Akron Street, Brighton,
CO 80602.11 Racah Institute of Physics, The Hebrew University,
Jerusalem, Israel 91904.12 Conceptual Analytics, LLC, 8209 Woburn Abbey Road,
Glenn Dale, MD 2076913 Department of Astronomy and Astrophysics, The Pennsylva-
nia State University, 525 Davey Lab, University Park, PA 16802.14 Departmento de Astronomıa y Astrofısica, Pontificia Univer-
sidad Catølica de Chile, Casilla 306, Santiago 22, Chile.15 Steward Observatory, University of Arizona, Tucson, AZ
1. INTRODUCTION
The apparent evolution in the colors and magnitudesof early-type cluster galaxies has long been used asa test of the history of galaxy evolution. The re-lations between magnitude and size or velocity dis-persion play an important role, as they give the ob-server a way to predict the apparent luminosity ofa galaxy based on some other observable property(Faber & Jackson 1976; Tully & Fisher 1977; Kormendy1977; Djorgovski & Davis 1987). Using these scalingrelations, it has been observed that there is remark-able uniformity in cluster early-type galaxy propertiesat low redshifts, z . 0.2, (Sandage & Perelmuter 1991;Jørgensen et al. 1996; Bernardi et al. 2003, for example).At redshifts up to ≃ 1, there have been a number ofpapers that have established a decrease in the mass-to-light ratio, using the Fundamental Plane. These studiesfind that the trend with redshift corresponds to a pas-sively evolving stellar population which has a luminosity-weighted last epoch of major star-formation aroundz ≃ 2 − 3 (van Dokkum & Franx 1996; Kelson et al.1997; van Dokkum et al. 1998; Kelson et al. 2000c;van Dokkum & Franx 2001; van Dokkum & Stanford
85721.16 W. M. Keck Observatory, 65-1120 Mamalahoa Hwy., Ka-
muela, HI 96743

2
2003; Wuyts et al. 2004; Holden et al. 2005). Thesesystems also appear to have old stellar populationswhen examined using their colors (e. g.; Bower et al.1992; Aragon-Salamanca et al. 1993; Ellis et al. 1997;Stanford et al. 1998; Blakeslee et al. 2003b; Holden et al.2004), with a similar last epoch of star formation ofz ≃ 2 − 3. Combining the evolution in colors and inthe scaling relations provide us with the data to measurethe luminosity-weighted age of early-type galaxies and,therefore, the epoch when most of the constituent starsformed.
The size-magnitude relation is a projection of theFundamental Plane (FP) along the velocity dispersionaxis. It has long been known that low redshift early-type galaxies follow such a relation (Kormendy 1977).By examining how the apparent magnitude changes asa function of redshift at a fixed size, we can measurethe apparent luminosity evolution in early-type galax-ies. Earlier measurements of this at z ≃ 0.4 − 0.6(Sandage & Perelmuter 1990a,b, 1991), and at z ≃ 0.7−1.0 (Schade et al. 1996, 1997, 1999; Sandage & Lubin2001; Lubin & Sandage 2001a,b,c), found the same paceof evolution as found by the evolution of colors or fromthe FP of early-type galaxies.
We investigate the size-surface brightness relation fortwo complementary goals. First, we can extend themeasured evolution to z = 1.237, which corresponds tothe highest redshifts that the FP has been measured todate (van Dokkum & Stanford 2003; Holden et al. 2005).However, because we have a much larger sample, we canalso examine the distribution of the size-surface bright-ness relation to see if we find evidence for early-typegalaxies that have younger stellar populations. Tradi-tionally, this has been done with colors or spectroscop-ically (see Tran et al. 2003, for “E+A” galaxies thathave early-type morphologies). van Dokkum & Stanford(2003), however, find that one of their early-type galaxieshas an “E+A” like spectrum and appears to be an out-lier from the distribution of sizes and magnitudes for thatcluster (Holden et al. 2004). A significant population ofsuch objects would imply that we are finding the epochwhen intermediate mass cluster galaxies are completingtheir evolution into cluster early-type galaxies.
Our sample has two clusters, RDCS J1252.9-2927 atz = 1.237 (Rosati et al. 2004) and RX J0152.7-1357 atz = 0.837 (Della Ceca et al. 2000). For each we use Hub-ble Space Telescope imaging data and other supportingground-based data, discussed in §2, to construct a sam-ple of early-type cluster galaxies. For each galaxy in oursample, we measure three different total magnitudes andtwo different half-light radii (rh). The comparison ofthese measurements are discussed in §3. We verify thatour sizes and total magnitudes are consistent, then usethose two quantities to measure the mean surface bright-ness interior to the galaxy’s half-light radius (< µh >).In §4, we use rh and < µh > to estimate the amount of lu-minosity evolution seen from low redshift to the clustersin our sample. In addition, we examine the scatter in therelation and search for galaxies out of the norm. We dis-cuss and summarize, in §5, our results in the context ofother work. Throughout the paper we compute distancesand absolute magnitudes using the cosmological parame-ters of Ωm = 0.3, ΩΛ = 0.7 and Ho = 70 km s−1 Mpc−1.We use the AB magnitude system (Oke 1990) unless oth-
Fig. 1.— A 13 Gyrs old early-type galaxy spectral energy distri-bution at a redshift of z = 0.837, top, and z = 1.237, bottom. Inboth panels, we plot the filters we used for the observations withdotted lines and the Johnson B filter as a solid line in the rest-frame of the galaxy. In each case, we have a color that straddlesthe 4000 A break and a filter that overlaps with the Johnson B.
erwise noted.
2. DATA
We combine a number of different datasets to ex-plore the evolution of the size-magnitude relation. Forour high redshift samples, we use the Advanced Cam-era for Surveys (ACS) imaging data for RDCS J1252.9-2927, already discussed in Blakeslee et al. (2003b), andfor RX J0152.7-1357. Both clusters are described inPostman et al. (2005) which focuses specifically on mor-phological classification and the morphology-density re-lation. Both clusters have additional ground-based datain the form of spectra and multi-wavelength imaging. Wecompare our high redshift result with the data for MS1358+62, at z = 0.328, from Kelson et al. (2000a). Weselect this particular dataset because of the similaritiesin methods used by the authors.
2.1. RDCS J1252.9-2927
As described in Blakeslee et al. (2003b), the AdvancedCamera for Surveys (ACS) imaged RDCS J1252.9-2927,at z = 1.237, for 12 orbits in the F775W filter, or i775,and 20 orbits in the F850LP filter, or z850. The clusterwas imaged as a mosaic of two by two positions, withthree orbits in i775 and five orbits in z850 at each posi-tion. The central area was covered by each of the fourpositions, resulting in deeper imaging over the centralarcminute. In Figure 1, we plot the filter transmissioncurves and a representative spectral energy distribution.We note here that the 850 in the F850LP designationrefers to the wavelength where the filter begins. Thecentral wavelength of the filter, when combined with theCCD performance is 9077A, sampling at 4058A in therest-frame of RDCS J1252.9-2927.
The data were processed using APSIS, the ACSpipeline science investigation software, described in

3
Blakeslee et al. (2003a). This pipeline generates drizzledimages in each band, a detection image made by com-bining all of the drizzled data, and photometric catalogsconstructed using a combination of the detection imageand the final images in each filter.
As discussed in Blakeslee et al. (2003b), we selectedobjects in RDCS J1252.9-2927 with z850 < 24.8 to ensureadequate signal-to-noise for the fits. Each galaxy wasfit with a single component Sersic model (Sersic 1968)using v1.7a, Rev 3 of the GALFIT package (Peng et al.2002). The approach of Peng et al. (2002) is to constructa model, convolve it with a point spread function andthen compare the χ2 of the resulting model with the data.For a noise model, we use the variance maps producedby the APSIS pipeline. Our point spread functions arebased on ACS imaging data of crowded star fields. Wewill discuss this further in §3.1.
Each galaxy with 0.5 < i775 − z850 < 1.2 was mor-phologically identified by four of us (BH, NC, MP, andMF). These identifications will be discussed in anotherpaper (Postman et al. 2005). The identifications weremade using the T-type morphological classification sys-tem (de Vaucouleurs et al. 1991). For the classifications,we found that 75% of the time all four classifiers agreedon the morphological type, and three out of four agreed80% of the time. These statistics are for the whole ofthe sample and the agreement is much higher for thebrighter galaxies. However, what matters for this workis how robust the classification for early-type galaxies inthe final sample. There are only two galaxies in RDCSJ1252.9-2927 that appear in our final sample where amajority of the four classifiers did not agree on a clas-sification as an early type (i.e.; lenticular or elliptical).Both of those galaxies appear near the magnitude limitof our sample and neither are part of the spectroscopicsample we will discuss below. At z850 < 23, 15 out of the20 early-type galaxies were classified unanimously. From24.5 > z850 > 23, the fraction drops to 20 unanimousidentifications out of 32 early-type galaxies, or 63%, butfor 30 out of 32 times at least three out of the four clas-sifiers agreed, higher than the 80% average for the wholesample.
Despite the high degree of internal consistency, one po-tential concern is a systematic offset in our classificationsas compared with other publications. To control for this,one of the classifiers, MP, assigned types to every galaxyin the MS 1358+62 sample of Fabricant et al. (2000).The classifications by MP of MS 1358+62 agreed 80% ofthe time with those from Fabricant et al. (2000).
In Figure 2, we plot the color-magnitude diagram ofthe early-type galaxies with T < 0 that are within 1Mpc, or 1.′92, of the cluster center and have z850 < 24.5mag. The circles represent galaxies classified as ellipticals(−5 ≤ T ≤ −4) and squares represent S0 (−3 ≤ T ≤ 1)galaxies. The solid line is the color-magnitude relation(i−z) = 0.958−0.025(z850−23). The dotted diagonal linerepresents two standard deviations, or 0.08 mag, fromthis relation, see Blakeslee et al. (2003b) for details. Wewill use this color criteria for selecting early-type galaxiesin the cluster. We remove spectroscopic non-membersthat, nonetheless, have the colors of the early-type redsequence in RDCS J1252.9-2927. We plot the magnitudelimit for morphological identification, z850 = 24.5, as avertical, dotted line in Figure 2. This magnitude limit
Fig. 2.— Color-magnitude diagram for the early-type galaxiesin the ACS imaging data for RDCS J1252.9-2927 (Blakeslee et al.2003b). The colors are measured within the half-light radius asmeasured from fitting Sersic models. The red circles represent el-liptical galaxies, while the blue squares are the galaxies classified asS0’s. The solid line is the mean color-magnitude relation while theparallel dotted lines represent the 2σ limits for the color-selectedsample. The vertical dotted line is the magnitude limit for thecolor-selected sample.
corresponds to ≃ 0.2L⋆. We calculate L⋆ starting withthe value from Norberg et al. (2002) and evolving it withthe relation of van Dokkum & Stanford (2003). At z =1.24, M⋆
B = −21.7 in AB magnitudes using the previousresults (Blakeslee et al. 2003b).
In addition to the ACS imaging data describedabove, we also use the photometric and spectroscopicdata collected in Demarco (2003); Rosati et al. (2004);Lidman et al. (2004); Toft et al. (2004). The catalogfor RDCS J1252.9-2927 contains photometry in the B,V, R, i, z, J and Ks bands. The near-infrared imageswere obtained with ISAAC on the VLT (Lidman et al.2004), while the optical images were observed using theFORS1 and FORS2 (Appenzeller & Rupprecht 1992) in-strument on the VLT. These optical and near-infraredimages were used to create a sample of galaxies for aredshift survey of potential cluster members. All galax-ies have Ks < 21 and J − K < 2.1 and R − K > 3(Demarco 2003; Rosati et al. 2005). These colors werechosen to preferentially select galaxies at the redshift ofthe cluster regardless of the spectral energy distributionwhile ignoring redder stars as well as low redshift sys-tems. A total of 383 objects were observed, of which 235have secure redshifts. This yields a sample of 36 clustermembers. The sample is almost complete for z850 < 23,which is ≃ 0.8L⋆. When comparing other samples withthe redshift sample of RDCS J1252.9-2927, we will movethe magnitude limit to z850 < 23 but we will not usethe color selection, shown with the two dotted lines, ofFigure 2. This only adds one object to the sample thatwould not be included in the color-selected sample.

4
2.2. RX J0152.7-1357
For RX J0152.7-1357, at z = 0.837, the ACS imageswere taken with the F625W, or r625, filter along with thei775 and z850 filters. Each of the three filters was observedfor two orbits. As with RDCS J1252.9-2927, RX J0152.7-1357 was observed using a two-by-two mosaic patternwith deeper imaging in the cluster core. In Figure 3, weshow the inner 2′ around the cluster center. This colorimage was made from the combination of all three filters.
Our sample for RX J0152.7-1357 was constructed inas similar a manner as possible as our sample for RDCSJ1252.9-2927. We used the SExtractor detection catalogto find galaxies. All objects with isophotal i775 < 24.8were fit with a Sersic model with 1 ≤ n ≤ 4 and visuallytyped (Postman et al. 2005). The model fits were deter-mined in the i775 filter as that filter corresponds closest tothe rest-frame B (see Figure 1), and the resulting aper-tures were used to measure the apparent colors. Theseresults are shown in Figure 4.
For RX J0152.7-1357, we have obtained B, V, R, andI imaging data using the Keck telescope with the LRIS(Oke et al. 1995). We used SOFI (Moorwood et al. 1998)on the New Technology Telescope (Demarco et al. 2005a)to observe in the J and Ks bands. Using FORS1 andFORS2 on the VLT, Demarco et al. (2005a) targetedgalaxies with R ≤ 24 using the photometric redshiftselection criterion of 0.7 ≤ zphot ≤ 0.95. 262 objectswere observed resulting in 102 cluster members out of227 measured redshifts.
As discussed in Postman et al. (2005), the classifica-tions for RX J0152.7-1357 were done by three of us (MP,NC, and BH). The error rates are effectively the sameas for RDCS J1252.9-2927 but we examined all galaxiesdown to i775 < 24, a fainter limit than our completenessfor the redshift survey (discussed below).
In the field of RX J0152.7-1357, Demarco et al. (2005a)found a group at z = 0.64 which has a significant numberof early-type galaxies. These objects are, at best, slightlybluer than the cluster members (see Figure 4). The in-clusion of these early-type galaxies in the photometricredshift selected sample reaffirms this. As such, we willnot make a color selected sample for RX J0152.7-1357but, rather, will only use the spectroscopic redshift sam-ple. In the magnitude range of 20 < i775 < 24, the com-pleteness of early-type galaxies ranges from 80% to 0%.The effective magnitude limit of the survey is i775 < 23 asthere is only one early-type galaxy fainter than that witha measured redshift. In the range 20.25 < i775 < 22.75,roughly 70% of the early-type galaxies with spectra arecluster members. In that same magnitude range, 60%of all early-type galaxies have spectra. This complete-ness is roughly the same as MS 1358+62 (Kelson et al.2000c) against which we will compare our data. How-ever, it should be realized that the photometric redshiftselection imposes, in effect, a color selection as photomet-ric redshifts are based on colors. Objects with stronger4000 A breaks are more likely to be selected for spec-troscopic follow-up. For the remainder of the paper, weselect all early-type galaxies in RX J0152.7-1357 withi775 < 22.75 that are spectroscopically confirmed clustermembers. This corresponds to ≃ 0.5L⋆.
2.3. MS 1358+62
For our sample in RDCS J1252.9-2927 and RXJ0152.7-1357, we used filters that straddled the 4000 Abreak for cluster members (see Figure 1). To measurethe amount of apparent luminosity evolution, at a fixedsize, requires that we measure the magnitudes and sizesin filters that match, as closely as possible, the samerest-frame band pass.
For a low redshift sample, we use the results fromMS1358+62, at z = 0.33, from Kelson et al. (2000a,b,c)because of the thorough study of the surface brightnessprofiles in the rest-frame B band. For MS 1358+62,Kelson et al. (2000a,b) conducted a spectroscopic surveyto determine the velocity dispersion for a flux-limitedsample of galaxies. The 52 objects were selected fromthe Fisher et al. (1998) study of MS 1358+62 to R ≤ 21.The total sample of Kelson et al. (2000a,b) includes anadditional three galaxies that are below the magnitudelimit, but we used only those with R ≤ 21. The selectionfor this sample was done regardless of morphology, so weinclude only galaxies that are classified earlier than 0, orthe S0/a morphological class, according to the scheme ofde Vaucouleurs et al. (1991).
We use the tabulated values of the observed rest-frameV band surface brightnesses from Kelson et al. (2000a)along with the half-light radii in that paper. To convertthe V band surface brightness into a B band surfacebrightness, we use the color from Kelson et al. (2000c)(taken from van Dokkum et al. 1998). The aperturesused to define these colors are the half-light radii mea-sured by fitting a de Vaucouleurs profile. In addition,the authors fit Sersic models. There is a difference intheir Sersic models, however, when compared to theSersic models in this paper. In Kelson et al. (2000a)the authors allowed the Sersic parameter to the range1 ≤ n ≤ 6. We restricted n over a smaller range,1 ≤ n ≤ 4 for our fits of RDCS J1252.9-2927 and RXJ0152.7-1357. So, in all cases where Kelson et al. (2000a)finds n > 4, we replace the results of that fit, namely rh
and < µh >, with corresponding n = 4 results fromKelson et al. (2000a).
3. MEASURES OF THE SIZE AND MAGNITUDE
In order to measure the evolution in the Kormendy re-lation (Kormendy 1977), we need robust measures of thehalf-light radius and surface brightness. Below we discusstwo methods, one parametric and one non-parametric,we used to measure both the total magnitudes, fromwhich we infer the surface brightness, and the half-lightradii.
3.1. Model Fitting
To determine the colors of each of the galaxies, we usedmodels to establish the appropriate size of the apertures.We fit a single Sersic profile and allowed the parametern to vary over the range 1 ≤ n ≤ 4. We imposed thisrestriction because we found that, if we did not, a fewobjects would settle to very high n numbers and, cor-respondingly large half-light radii. As the goal for thefits was to provide radii for measuring the colors of thered-sequence galaxies, large radii potentially could leadto systematic errors in the measurements.
The models were fitted using GALFIT (Peng et al.2002), and yield the half-light radius and total magni-tude of the model. The mean interior surface bright-

5
Fig. 3.— Color image made from combining the r625, i775 and z850 imaging data for RX J0152.7-1357. The image is 2′on a side, withNorth up and East to the left. Some “red” galaxies in this image are actually members of a foreground group at z = 0.64.
ness within the half-light radius for that model can thenbe computed as < µh >= m + 5 log10 rh + 2.5 log10 2π(Jørgensen et al. 1995). The GALFIT output for the sizeis actually the semi-major axis of the best fitting ellip-tical model. We convert this radius into the effectiveradius, rh =
√ab, where a and b are the semi-major and
semi-minor axes respectively, when we discuss the half-light radius. As mentioned above, the fitting procedureconstructs a model, convolves it with the point spreadfunction, and then compares the resulting χ2 betweenthe model and the data. Because the modeling processexplicitly includes the point spread function, even for ob-jects with sizes smaller than the point spread function, afull width at half maximum of ≃ 0.′′09, could be, in prin-ciple, reliably measured. However, errors in our pointspread functions could cause systematic biases in our re-sulting half-light radii. Thus, we will exclude from ouranalysis objects with model half-light radii less than 0.′′1
for the rest of the paper.One of the advantages of the GALFIT software is the
ability to fit multiple component models to multiplegalaxies simultaneously. For most of the galaxies, how-ever, we masked out neighboring objects using the resultsof the SExtractor segmentation map, i. e., the map ofpixels above the isophotal detection threshold. At min-imum, each postage stamp was 50 by 50 pixels. Theactual size was four times the square root of SExtrac-tor’s isophotal area, the number of pixels one σ abovethe sky. For close galaxies, however, we had to fit modelssimultaneously. This was often the case for the luminousellipticals in the cores of the clusters. In cases where amultiple galaxies had to be fit, we ensured that all ofthe pixels that would be in the individual stamps usingthe above recipe were included in the stamp containingmultiple galaxies.
For every object in the color-selected and spectroscopic

6
Fig. 4.— Color-magnitude diagram for the early-type galaxies inthe ACS imaging data for RX J0152.7-1357. The colors are mea-sured within the half-light radius. Red circles represent ellipticalgalaxies while blue squares are the galaxies classified as S0. Thedotted line represents the magnitude limit. Symbols with soliddots are confirmed to be cluster members while points with crossesare non-members. Unlike RDCS J1252.9-2927, we did not selectgalaxies using colors because of the presence of a z = 0.64 groupof galaxies. Known members of this group can be seen as crosseswith colors very close to the “red-sequence” of the RX J0152.7-1357members.
redshift sample of RDCS J1252.9-2927 and spectroscopicredshift sample of RX J0152.7-1357 we fit a pure de Vau-couleurs, or n = 4 Sersic profile, in addition to the al-ready existing Sersic model. We selected a fixed n model,in addition to the Sersic fits, for two reasons. First, themodels have one less degree of freedom and thereforethe potential to be more robust. Second, a de Vau-couleurs’ model has traditionally been used. Thus, wecan compare with a broader range of results from theliterature. We plot in Figures 5 and 6 the observed size-surface brightness relation using the results from pure deVaucouleurs model fits. The relation appears linear butwith a large scatter for RDCS J1252.9-2927. This scatterlikely comes from a combination of observational errors,the inclusion of non-cluster members and systematic bi-ases in addition to the intrinsic scatter in the relation.The size-surface brightness relation for RX J0152.7-1357is much tighter. The biweight scale (Beers et al. 1990)of the scatter around the mean relation for RX J0152.7-1357 is 0.42 ± 0.05 for the de Vaucouleurs models and0.36±0.03 for the Sersic models as opposed to 0.76±0.10for the de Vaucouleurs and 0.72±0.09 for the Sersic mod-els for RDCS J1252.9-2927. We estimate the errors onthe scatter using a jackknife process (Beers et al. 1990;Lupton 1996).
In general, the error bars in Figures 5 and 6 are some-what misleading. GALFIT reports the errors on the in-dividual terms but it is well known that there are sig-nificant anti-correlations between the errors for the sur-face brightness and size (Hamabe & Kormendy 1987;Jørgensen et al. 1993). Fortunately, these errors are al-
Fig. 5.— Size-surface brightness relation for the early-type galax-ies in the ACS imaging data of RDCS J1252.9-2927. Filled symbolsare spectroscopically selected members and the open symbols arecolor selected, red circles for ellipticals and blue squares for S0’s.The surface brightnesses are in z850 magnitudes. We show the re-sults for Sersic models with 1 ≤ n ≤ 4 in the top diagram whilethe bottom diagram shows the sizes and magnitudes estimated us-ing de Vaucouleurs models. The best fitting relation to the wholesample is shown as a solid line, while the magnitude limit of thecolor-selected sample is shown as a dotted line and the magnitudelimit we impose for the spectroscopically selected sample is shownwith a dashed line, see §2.1 for details. We plot the semi-majoraxis of the ellipse of the anti-correlation between rh and < µh > asa line. The slope of the anti-correlation is very close to the slopeof the size-surface brightness relation. We do note that the sampleappears incomplete at the smallest sizes, rh <0.′′1.
most parallel with the actual size-surface brightness rela-tion, so objects will be scattered along the relation. Weillustrate the expected anti-correlation in Figures 5 and6. Both figures show a good deal of incompleteness forobjects with sizes rh <0.′′1. For RX J0152.7-1357, thisappears to be from the magnitude limit of the sample.However, for RDCS J1252.9-2927 we see a lack of objectswith rh <0.′′1 and faint surface brightness even thoughsuch galaxies would be above our magnitude limit. Weassume that this is a point spread function effect, as dis-cussed above, and will not use galaxies with sizes rh <0.′′1for our analysis.
3.2. Non-Parametric Magnitudes
The main problem with both of our current measure-ments of the size and total magnitude is that they de-pend on fitting models to the data. To complementthese model magnitudes, we implemented the approachof Wirth et al. (1994) and Wirth (1996). This approachuses the Petrosian η measure (Petrosian 1976) to derivea model independent aperture. To review, the Petrosianη = I(r)/ < I(< r) > computes the ratio of the surfacebrightness, I(r) at a particular radius, r to the averagesurface brightness within that radius < I(< r) >. Thisis the inverse of the function originally developed by Pet-rosian, but this version produces more tractable errors.Given η for our galaxies, we need to decide on how to use
7
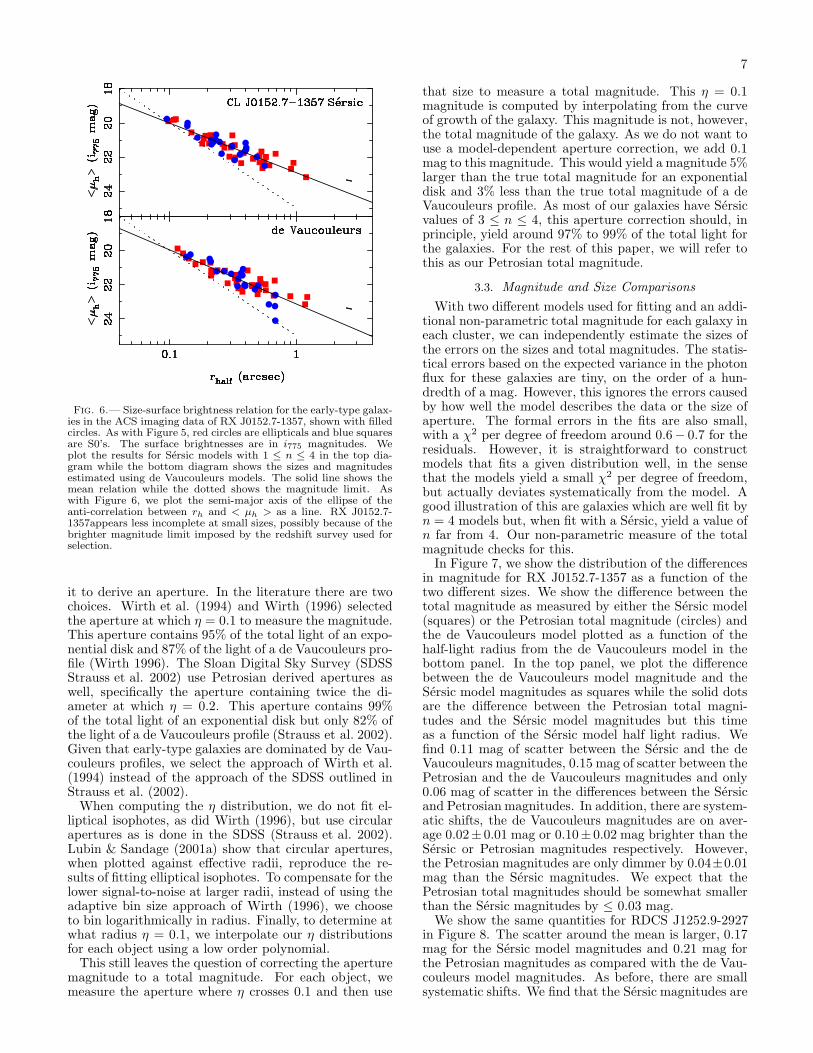
Fig. 6.— Size-surface brightness relation for the early-type galax-ies in the ACS imaging data of RX J0152.7-1357, shown with filledcircles. As with Figure 5, red circles are ellipticals and blue squaresare S0’s. The surface brightnesses are in i775 magnitudes. Weplot the results for Sersic models with 1 ≤ n ≤ 4 in the top dia-gram while the bottom diagram shows the sizes and magnitudesestimated using de Vaucouleurs models. The solid line shows themean relation while the dotted shows the magnitude limit. Aswith Figure 6, we plot the semi-major axis of the ellipse of theanti-correlation between rh and < µh > as a line. RX J0152.7-1357appears less incomplete at small sizes, possibly because of thebrighter magnitude limit imposed by the redshift survey used forselection.
it to derive an aperture. In the literature there are twochoices. Wirth et al. (1994) and Wirth (1996) selectedthe aperture at which η = 0.1 to measure the magnitude.This aperture contains 95% of the total light of an expo-nential disk and 87% of the light of a de Vaucouleurs pro-file (Wirth 1996). The Sloan Digital Sky Survey (SDSSStrauss et al. 2002) use Petrosian derived apertures aswell, specifically the aperture containing twice the di-ameter at which η = 0.2. This aperture contains 99%of the total light of an exponential disk but only 82% ofthe light of a de Vaucouleurs profile (Strauss et al. 2002).Given that early-type galaxies are dominated by de Vau-couleurs profiles, we select the approach of Wirth et al.(1994) instead of the approach of the SDSS outlined inStrauss et al. (2002).
When computing the η distribution, we do not fit el-liptical isophotes, as did Wirth (1996), but use circularapertures as is done in the SDSS (Strauss et al. 2002).Lubin & Sandage (2001a) show that circular apertures,when plotted against effective radii, reproduce the re-sults of fitting elliptical isophotes. To compensate for thelower signal-to-noise at larger radii, instead of using theadaptive bin size approach of Wirth (1996), we chooseto bin logarithmically in radius. Finally, to determine atwhat radius η = 0.1, we interpolate our η distributionsfor each object using a low order polynomial.
This still leaves the question of correcting the aperturemagnitude to a total magnitude. For each object, wemeasure the aperture where η crosses 0.1 and then use
that size to measure a total magnitude. This η = 0.1magnitude is computed by interpolating from the curveof growth of the galaxy. This magnitude is not, however,the total magnitude of the galaxy. As we do not want touse a model-dependent aperture correction, we add 0.1mag to this magnitude. This would yield a magnitude 5%larger than the true total magnitude for an exponentialdisk and 3% less than the true total magnitude of a deVaucouleurs profile. As most of our galaxies have Sersicvalues of 3 ≤ n ≤ 4, this aperture correction should, inprinciple, yield around 97% to 99% of the total light forthe galaxies. For the rest of this paper, we will refer tothis as our Petrosian total magnitude.
3.3. Magnitude and Size Comparisons
With two different models used for fitting and an addi-tional non-parametric total magnitude for each galaxy ineach cluster, we can independently estimate the sizes ofthe errors on the sizes and total magnitudes. The statis-tical errors based on the expected variance in the photonflux for these galaxies are tiny, on the order of a hun-dredth of a mag. However, this ignores the errors causedby how well the model describes the data or the size ofaperture. The formal errors in the fits are also small,with a χ2 per degree of freedom around 0.6− 0.7 for theresiduals. However, it is straightforward to constructmodels that fits a given distribution well, in the sensethat the models yield a small χ2 per degree of freedom,but actually deviates systematically from the model. Agood illustration of this are galaxies which are well fit byn = 4 models but, when fit with a Sersic, yield a value ofn far from 4. Our non-parametric measure of the totalmagnitude checks for this.
In Figure 7, we show the distribution of the differencesin magnitude for RX J0152.7-1357 as a function of thetwo different sizes. We show the difference between thetotal magnitude as measured by either the Sersic model(squares) or the Petrosian total magnitude (circles) andthe de Vaucouleurs model plotted as a function of thehalf-light radius from the de Vaucouleurs model in thebottom panel. In the top panel, we plot the differencebetween the de Vaucouleurs model magnitude and theSersic model magnitudes as squares while the solid dotsare the difference between the Petrosian total magni-tudes and the Sersic model magnitudes but this timeas a function of the Sersic model half light radius. Wefind 0.11 mag of scatter between the Sersic and the deVaucouleurs magnitudes, 0.15 mag of scatter between thePetrosian and the de Vaucouleurs magnitudes and only0.06 mag of scatter in the differences between the Sersicand Petrosian magnitudes. In addition, there are system-atic shifts, the de Vaucouleurs magnitudes are on aver-age 0.02± 0.01 mag or 0.10± 0.02 mag brighter than theSersic or Petrosian magnitudes respectively. However,the Petrosian magnitudes are only dimmer by 0.04±0.01mag than the Sersic magnitudes. We expect that thePetrosian total magnitudes should be somewhat smallerthan the Sersic magnitudes by ≤ 0.03 mag.
We show the same quantities for RDCS J1252.9-2927in Figure 8. The scatter around the mean is larger, 0.17mag for the Sersic model magnitudes and 0.21 mag forthe Petrosian magnitudes as compared with the de Vau-couleurs model magnitudes. As before, there are smallsystematic shifts. We find that the Sersic magnitudes are

8
Fig. 7.— The difference in the total magnitudes for RX J0152.7-1357 plotted as a function of size. The top panel plots the differencebetween the de Vaucouleurs model magnitudes and the Sersic mag-nitudes as squares, and the Petrosian minus Sersic differences asdots. This plot uses the Sersic half-light radius as the abscissa.In the bottom panel, we plot the difference between these Sersicmodel magnitudes and the de Vaucouleurs model magnitudes, assquares, and the difference between the Petrosian magnitudes andthe de Vaucouleurs model magnitudes, as dots, as a function of thede Vaucouleurs model half-light radius. There are a few outlierswhen comparing with Petrosian magnitudes, see §3.3 for details.Regardless of the magnitudes or sizes used, the overall scatter issmall, ≃ 0.1 mag, with no statistically significant offset betweenthe different magnitude types.
Fig. 8.— Same as Figure 7 but using the results of RDCSJ1252.9-2927 at z = 1.237. Compared to RX J0152.7-1357, thescatter is larger, ≃ 0.2 mag, and there appears to be a small cor-relation between the difference in magnitude and de Vaucouleursmodel half-light radius. Most of this apparent correlation comesfrom galaxies with best fitting Sersic indices of n ≤ 2.5. Thiscorrelation, and the outliers, are more fully discussed in §3.3.
Fig. 9.— Four galaxies from RX J0152.7-1357. For each galaxywe show the original image (top), the residual image from the Sersicmodel fit (center) and the de Vaucouleurs model residuals (bot-tom). We give the Sersic index in the bottom left corner of the topimage, and the ∆ between the Sersic and de Vaucouleurs modelmagnitudes the top left corner. In some cases, there are still strongresiduals after removing the Sersic model which either point to ahigher Sersic index being a better fit, or galaxy substructure.
0.03 ± 0.03 mag dimmer than the de Vaucouleurs mag-nitudes, while the Petrosian magnitudes are 0.07 ± 0.03mag dimmer. The scatter between the Sersic magnitudeand the Petrosian magnitude is smaller, 0.16 mag, andthe systematic shift is also smaller, 0.04 ± 0.02 mag.
In Figures 7 and 8 there is an apparent correlation be-tween the plotted differences and some of the measuredsizes. We examine the data using a Spearman Rank Cor-relation test. This test yields a parameter, referred here-after as t, which is the estimate of the degree of the cor-relation and can range −1 ≤ t ≤ 1. Examining the datafor RDCS J1252.9-2927, we find that t = 0.30 for thecorrelation between the de Vaucouleurs magnitudes mi-nus the Sersic model magnitudes as a function of the deVaucouleurs half-light radii. The expected error on thismeasurement of the correlation, assuming that there isno true correlation for our sample is 0.09, yielding 3.3σ difference from 0 or no correlation. There is less ofa correlation with Petrosian magnitude, t = 0.21 ± 0.09and we find no correlation, t = −0.05±0.09 between thedifference in the Sersic and the Petrosian magnitudes asa function of the Sersic half-light radii. These positivecorrelations mean that the difference in the Sersic modeland the de Vaucouleurs model magnitudes increases withlarge size, or the Sersic model magnitudes are fainterthan the de Vaucouleurs model magnitudes as we mea-sure larger sizes. This correlation exists regardless ofwhether we use the Sersic model or de Vaucouleurs modelhalf-light radii. These correlations do not appear for RXJ0152.7-1357, however. For this cluster we find correla-tions with t = 0.12 ± 0.10 or smaller.
Most of the apparent correlation in Figures 7 8 comesfrom a handful of galaxies. In each case, the galaxyhas a large de Vaucouleurs model magnitude when com-pared with the Sersic or Petrosian magnitude. We ex-amined each of these in detail. In every case where agalaxy lies more than three standard deviations from themean of Figure 8, the best fitting Sersic model has a

9
Fig. 10.— A histogram of the distribution of Sersic indices inRDCS J1252.9-2927, RX J0152.7-1357, and MS 1358+62. Thereis, as expected, a strong peak at n = 4, as we constrain the fitsto 1 ≤ n ≤ 4. There are a number of galaxies, however, that areclassified as early-types but have small n values. Such galaxies arethe strong outliers in Figure 8.
low, n ≤ 2.5 Sersic index and smaller half-light radius.Therefore, the de Vaucouleurs model is not a good fitto the data. In Figure 9, we show two examples of this,along with two examples of models where the Sersic andde Vaucouleurs models are in good agreement. In Fig-ure 10, we plot the distribution of Sersic indices for thethree data sets, RDCS J1252.9-2927, RX J0152.7-1357,and MS 1358+62. In each case, the galaxies are identi-fied, by eye, as early-type galaxies. It appears that thehigher redshift clusters have a broader range of Sersic in-dices than MS 1358+62. This will be further discussed inPostman et al. (2005). Nevertheless, the de Vaucouleursmodels appear to be a bad fit to a number of galaxies,which should explain the scatter in Figure 8.
When comparing the Petrosian magnitudes with thede Vaucouleurs model magnitudes for RDCS J1252.9-2927, there are four strong outliers. Each of these outliersis caused by neighboring galaxies that contaminate thePetrosian total magnitude. This is because our measureof the Petrosian total magnitude assumes nothing aboutthe underlying surface brightness profile. We simply usethe SExtractor segmentation maps to mask out brightpixels. We do not attempt to compute the contributionto the galaxy’s flux by the surrounding objects. Thus,in crowded areas where a larger number of pixels arecontaminated by luminous or extended objects such asthe brightest cluster members, our Petrosian estimatesare significantly overestimated and so appear as largenegative values in Figures 7 and 8.
To compliment our Petrosian, or non-parametric totalmagnitudes, we can estimate a half-light radius by de-termining the radius where the curve of growth containshalf of the total light from the galaxy. However, unlesswe make an attempt to remove the effect of the point
spread function, we will find a bias towards larger sizesas the galaxies become intrinsically smaller. We com-puted these half-light radii and find that, on average forRDCS J1252.9-2927, the Petrosian sizes are 2% largerthan the Sersic model sizes and 5% larger than the deVaucouleurs model sizes for objects with model sizes ofat least 0.′′15. This size bias grows markedly at smallermodel radii, as expected. We find no statistically signif-icant difference between the de Vaucouleurs model sizesand the Sersic model sizes. For RX J0152.7-1357, we findvery similar numbers. The scatter in the size as deter-mined by the de Vaucouleurs model as compared withthe Sersic model is slightly larger because of the handfulof cases where the best fitting Sersic parameter is low,n ≤ 2.5 which causes large magnitude discrepancies aswell. Overall, the agreement between the Petrosian es-timated half-light radii and the model radii are good.However, because of the bias towards larger sizes in ourPetrosian half-light radii, we rely on the model half-lightradii for the rest of this paper.
Overall, it is encouraging that our different magnitudeand size measurements yield a small scatter and little orno systematic offsets. Nonetheless, it is prudent not tomix the various measurements because of the small cor-relations seen above. The Petrosian magnitudes, whichyield numbers close to the Sersic model magnitudes,could potentially be used in conjunction with the Sersichalf-light radii. However, for the rest of the paper, wewill measure evolution using the sizes and surface bright-nesses determined by the model fits and we will onlycompare Sersic model fits with other Sersic model fits,not with pure de Vaucouleurs models.
3.4. Rest-frame Magnitudes
To measure the amount of evolution, we need to com-pare the surface brightnesses in the same rest-framepass band. Most measurements of the evolution of theFP are given in terms of the rest-frame Johnson B, orBrest mass-to-light ratio. We used the templates ofBenıtez et al. (2004), which are modified versions of thetemplates from Coleman et al. (1980), to compute theBrest value as a function of an observed filter and a color.For RDCS J1252.9-2927, we computed Brest − z850 as afunction of i775−z850 while for RX J0152.7-1357 we com-puted Brest− i775 as a function of r625− i775. For a givengalaxy in RDCS J1252.9-2927 or RX J0152.7-1357, wethen interpolate between the colors of the templates fromBenıtez et al. (2004) to then compute the Brest − z850 orBrest − i775 color. Why we chose these particular filtercombinations is illustrated in Figure 1, namely that thez850 and i775 filters match the Brest filter at the red-shifts of RDCS J1252.9-2927 and RX J0152.7-1357 re-spectively. The color was selected to span, roughly, theU −B color in the rest frame of the galaxy. This processis very similar to what was employed by Holden et al.(2004). In that paper, the authors found that when theBrest filter was spanned by the observed colors, the er-ror on the magnitude transformation was on the orderof 2%. In a case like RDCS J1252.9-2927, however, theerror was higher, at around 5%.
4. APPARENT LUMINOSITY EVOLUTION
4.1. Measuring the offset at a fixed size

10
We would like to investigate how much apparent evolu-tion there is in the size-surface brightness relation. First,we shall examine if the zero-point in this relation changeswith redshift. The simplest way to measure this is to fita linear relation to the size-surface brightness relation forthe low redshift cluster, and then compute the constantrequired to minimize the deviation around the same slopefor the higher redshift cluster.
To determine the slope of the size-surface brightnessrelation at low redshift, we fit all of the data in MS1358+62. We then transform the MS 1358+62 data tothe i775 or z850 band in the manner described in §3.4,and rescale the sizes as appropriate for the z ≃ 1 cluster,either RDCS J1252.9-2927 or RX J0152.7-1357. We limitboth the z ≃ 1 cluster and MS 1358+62 to the same mag-nitude. We then apply a series of cuts in the half-lightradius, starting at a size of 0.′′25 and working down to 0.′′1,below which the effects of the point spread function willbecome important. At each size, we compute the zero-point in the size-surface brightness relation required tominimize the scatter around a line defined by the slopeas measured for the whole of the MS 1358+62 sample.We compute this zero-point for both the trimmed MS1358+62 and z ≃ 1 cluster samples. We then change themagnitude limit of the sample of MS 1358+62 by thecurrently measured amount of evolution. We trim thedata at the new magnitude limit and continue iteratinguntil we converge. To compute the zero-point for bothdistributions, we simply compute the biweight center forthe deviations between the average surface brightnessesand the slope times the half-light radii.
We find −1.04 ± 0.13 mag of evolution is requiredto match the size-surface brightness relation of MS1358+62 when comparing the de Vaucouleurs model re-sults for galaxies with rh >0.′′15 and z850 < 24.5 inRDCS J1252.9-2927. In rest-frame B, z850 = 24.5 cor-responds to MB = −20.0 at z = 1.24 and MB =−18.8 at z = 0 after assuming the FP evolution ofvan Dokkum & Stanford (2003). We plot, in Figure 11,the data from MS 1358+62 as open squares, both forthe pure de Vaucouleurs models. The results for RDCSJ1252.9-2927 are represented by solid dots. The solidline represents the fit to the whole data for MS 1358+62.The dotted line is the same but shifted by −1.04±0.13 Bmag. This shift was calculated by minimizing the scatteraround a line with the slope specified by the whole sam-ple. Repeating the process but using the Sersic modelprofiles, we find −1.08 ± 0.13 B mag of evolution (seeFigure 12). We note here, that, as we discussed above,Kelson et al. (2000a) allows a larger range of the param-eter n in their fits. All galaxies with n > 4 in Sersicmodels in Kelson et al. (2000a) were replaced by the cor-responding de Vaucouleurs model.
We make the same computation for RX J0152.7-1357and find −0.44 ± 0.06 mag of B band evolution forrh >0.′′15, the size limit for the smallest galaxies in MS1358+62, and −0.66 ± 0.05 mag of evolution in the Bband for the Sersic models. If we restrict ourselves toonly those galaxies in RDCS J1252.9-2927 with redshiftinformation and with z850 < 23, we find −1.41±0.16 mag(de Vaucouleurs model) and −1.42± 0.13 (Sersic model)mag of B band evolution for rh >0.′′15.
We summarize the results of these fits in Table 1. Inthat table, we also show the results for a selection of cut-
Fig. 11.— Size-surface brightness relation for the early-typegalaxies in the ACS imaging data of both RDCS J1252.9-2927 andRX J0152.7-1357 using de Vaucouleurs fits. In each case, the lowredshift data, MS 1358+62, are represented by the open squareswhile the filled circles are the data for the color selected samplefrom the redshift sample of RX J0152.7-1357 (top), the spectro-scopic redshift sample from RDCS J1252.9-2927 (middle) and thecolor selected sample from RDCS J1252.9-2927 (bottom). Thegalaxies in MS 1358+62 are iteratively selected to be above thesame magnitude limit plus the measured evolution to either RDCSJ1252.9-2927 or RX J0152.7-1357. The solid lines represent thefits to the size-magnitude relation for all the data for MS 1358+62,while the dotted line is the relation shifted by the amount of mea-sured evolution. For RX J0152.7-1357, we find −0.44±0.06 mag ofevolution between z = 0.328 and z = 0.837. We find 1.41±0.16 magof evolution for the redshift selected sample between MS 1358+62and RDCS J1252.9-2927 while we find −1.04 ± 0.13 mag of evolu-tion for the color-selected sample.
off radii and for each of the samples of RDCS J1252.9-2927. We selected a number of half-light radii thresholds.We decided to not examine galaxies with rh <0.′′10 asthey are close in size to the full-width at half-maximumof the point spread function and the samples appear in-complete at those sizes, see §3.1. However, there arefew galaxies in the sample of MS 1358+62 that haverh <0.′′15, so we selected that for our practical limit.We included a cutoff of rh >0.′′20 along with rh >0.′′10to illustrate that our results are insensitive to the exactthreshold selected.
The error we quote is the error on the mean shift be-tween the low redshift size-surface brightness relationand the high redshift relation. We assume no error onthe slope measurement, simply taking the scatter aroundthe mean relation and dividing it by the square root ofthe number of galaxies in our high redshift sample. Thisraises the question of how our particular choice of theslope of the size-surface brightness relation affects our re-sults. It appears, when looking at Figures 11 and 12, thatthe slope of the size-surface brightness relation is differ-ent for the different samples. We compare the data fromMS 1358+62 and RDCS J1252.9-2927 using the slope ofthe best fitting relation for RDCS J1252.9-2927 insteadthe slope of the relation for MS 1358+62. We find almost

11
Fig. 12.— Size-surface brightness relation for the early-typegalaxies in the ACS imaging data of both RDCS J1252.9-2927 andRX J0152.7-1357 as compared with MS 1358+62. The sizes andsurface brightnesses are from the Sersic model profiles. See Figure11 for an explanation of the symbols and the lines. The amountof measured evolution is similar as for the de Vaucouleurs modelfits. We find −0.66 ± 0.05 mag for RX J0152.7-1357 (top) whenthe samples are compared with MS 1358+62, −1.42± 0.13 mag ofevolution for the redshift-selected sample of RDCS J1252.9-2927(middle), and −1.08 ± 0.13 mag of evolution for the color-selectedsample of RDCS J1252.9-2927 (bottom).
the same results with small changes, ≃ 0.01 mag, in themeasured evolution. For RX J0152.7-1357, our changesin measured evolution are larger, on the order of 0.03mag to, at most, 0.05 mag. This provides an additionalsource of uncertainty which we will add in quadrature.
4.2. Comparison with the Fundamental Plane
van Dokkum & Stanford (2003) measured the velocitydispersions for three galaxies inCL 0848+4453, a low mass cluster of galaxies at z =1.276. Holden et al. (2005) measured velocity dispersionsfor four galaxies in RDCS J1252.9-2927, which, whencombined with van Dokkum & Stanford (2003), yields asample of seven objects with z = 1.25. Using those val-ues along with sizes and surface brightness from HSTimaging, the authors measured the offset in the FP fromz = 0 to the redshift of the cluster. The evolution cor-responds to a change in the mass-to-light ratio (M/L)with redshift of −0.98 z in the rest-frame B filter, or(−1.06±0.06) z mag of B band evolution at a fixed mass.For RDCS J1252.9-2927, this should correspond to −1.31mag of evolution in the rest-frame B band. To compareour relative measurements between clusters at differentredshifts with those made using the FP, we need to com-pare our measured evolution with the Coma cluster, thez = 0 baseline for van Dokkum & Stanford (2003) andHolden et al. (2005).
To measure how much evolution occurs between MS1358+62 and Coma, we implemented the same proce-dure as we used for comparing RDCS J1252.9-2927 and
RX J0152.7-1357 with MS 1358+62. For the data forthe Coma cluster, we use the B half-light radii and sur-face brightnesses, listed in Table A 7 of Jørgensen et al.(1996). In Kelson et al. (2000a), the authors comparethe techniques used to measure the half-light radii andsurface brightnesses in Jørgensen et al. (1996) with thetwo-dimensional fitting techniques they used and find nosignificant offsets. Thus, we compare the Coma radii andsurface brightnesses directly with the values tabulated inKelson et al. (2000c). We measure a shift of −0.35±0.07mag in the rest-frame B band between Coma and MS1358+62. These measurements were done with the wholesample of Coma and MS 1358+62, as both are magnitudelimited, redshift selected samples.
The amount of evolution expected between z = 0 andz = 0.328 is −0.35 ± 0.06 mag in rest-frame B usingthe best fitting relation from van Dokkum & Stanford(2003), in good agreement with the −0.31 ± 0.12 magexpected from van Dokkum & Franx (1996) and the−0.33 ± 0.12 mag from Kelson et al. (1997). Our resultof −0.35 ± 0.07 mag is in excellent agreement but withsmaller statistical error bars. The systematic errors arethe same as the FP, see Kelson et al. (2000a).
We add the measured evolution between Comaand MS 1358+62 to the measured evolution we findfor RDCS J1252.9-2927 and RX J0152.7-1357. Weplot both in Figure 13 along with the FP resultsfrom van Dokkum & Stanford (2003) and Holden et al.(2005). We fit a line to the data for RX J0152.7-1357and for the color-selected sample of RDCS J1252.9-2927and find (−1.13 ± 0.15)z mag of B evolution, very closeto the (−1.06 ± 0.06)z mag found with the FP. We find(−1.42 ± 0.33)z mag of evolution if we use the redshift-selected sample of RDCS J1252.9-2927, a result not sta-tistically different from the FP because of the much errorestimate.
Overall, our agreement with the measurements fromthe FP are good, with the caveat that it is clear thatsample selection plays a critical role. Our first sampleof early-type galaxies in RDCS J1252.9-2927 was con-structed by finding all galaxies with the correct mor-phologies that also fall within the color-magnitude se-quence of RDCS J1252.9-2927. Restricting our sampleto galaxies with sizes of rh >0.′′15, we find a result in al-most perfect agreement with restuls from the Fundamen-tal Plane (van Dokkum & Stanford 2003; Holden et al.2005), regardless of whether we use Sersic or de Vau-couleurs models. If, however, we restrict ourselves tothose galaxies identified only by redshift, we find moreevolution at the highest redshifts. The redshift selec-tion was made using a K magnitude-limited sample, withsome color selection. As shown in Figures 2 and 5, almostall early-type galaxies with z < 23 are included. There-fore, it is puzzling why such a sample would appear toshow so much more evolution.
4.3. Scatter in the Size-Surface Brightness Relation
In Figure 14, we plot the the histogram of the scat-ter around the size-surface brightness relation. This isthe difference, in magnitudes, between the measured sur-face brightnesses and those predicted by the size-surfacebrightness relation. We plot the residuals for RDCSJ1252.9-2927 as compared with those from MS 1358+62,using the de Vaucouleurs model sizes and surface bright-

12
Fig. 13.— Amount of B luminosity evolution from the changein the zero-point of the size-surface brightness relation with red-shift. The results for MS 1358+62, represented as an open blue di-amond at z = 0.33, shows the measured amount of evolution withrespect to Coma using our size-surface brightness measurements.The orange square represents the average of the Sersic and de Vau-couleurs results for the rh ≤0.′′15 sample of RX J0152.7-1357. Thesolid red circle is average for the spectroscopically-selected sampleof RDCS J1252.9-2927 and the open red circle represents averagefor the color-selected sample. We plot, with a solid line, a fit tothe evolution of MS 1358+62, RX J0152.7-1357, and the color-selected sample of RDCS J1252.9-2927. The dotted line showsthe fit to the the same data except using the spectroscopically-selected sample of RDCS J1252.9-2927. For both lines, the er-ror bars at z = 1 represents the error in the slope. The resultsfor either fit agree with the FP measurements in CL 0848+4453(van Dokkum & Stanford 2003), shown with a green cross, andRDCS J1252.9-2927 (Holden et al. 2005), shown with a purple tri-angle.
nesses. The solid line represents the results for RDCSJ1252.9-2927, while the dotted line is scatter for the com-parison sample of MS 1358+62. We plot the histogramcontaining only confirmed cluster members in the toppanel while the bottom panel shows all color selectedgalaxies. In both panels, the histograms are normalizedto one. For this figure, we plot all galaxies with pro-jected sizes of rh > 0.′′15 at z = 1.237. The magnitudesfor the galaxies in MS 1358+62 have been brightened bythe measured −1.04 ± 0.13 mag of evolution in the Bband for the bottom panel and −1.44 ± 0.15 mag in thetop panel.
Examining Figure 5 again, however, we see that the ob-jects below the mean relation have, on average, a largererror in both the size and average surface brightness thanthose above the mean relation. Thus, a low tail towardslarge deviations is expected. At brighter magnitudesthere are three galaxies brighter than expected based onthe distribution of MS 1358+62. The observed scatteris, as mentioned before, 0.76 ± 0.10 mag around a fixedsize. Given that the errors in our total magnitude mea-surements are, based on the comparisons between the deVaucouleurs model magnitudes and the Petrosian totalmagnitudes, around 0.2 mag, most of the scatter must
Fig. 14.— The deviations from the mean size-surface brightnessrelation for RDCS J1252.9-2927 (solid line) and MS 1358+62 (dot-ted line) plotted as normalized histograms. All galaxies in RDCSJ1252.9-2927 with rh >0.′′15 are included. The top panel containsall galaxies in the redshift sample and the bottom panel containsall those in the color selected sample, all galaxies within the dottedlines in Figure 2. The scatter for RDCS J1252.9-2927 is 0.76±0.10mag for the color selected sample and 0.65± 0.12 mag for the red-shift selected sample, in contrast to the 0.57 ± 0.07 mag found forMS 1358+62.
be intrinsic or systematic. For RX J0152.7-1357, thereare 55 early-type galaxies cluster members that meet ourmagnitude and size criteria. In Figure 15, we plot the dis-tribution of the two sets of galaxies, and note that thescatter is 0.42±0.05 mag. For comparison, we find in thesample from MS 1358+62a scatter of 0.57 ± 0.07 mag.
We calculate for each of our scatter measurements anerror based on the jackknife of the data as recommendedby Beers et al. (1990). It seems that the scatter measure-ments are statistically very different. For example, thedifference between the scatter in RX J0152.7-1357 and inMS 1358+62 is 0.15±0.06 mag, a 2.5 standard deviationdifference. If we make the assumption that scatter in thesize-surface brightness relation comes from a Gaussianparent population, we can use the F-ratio test to com-pare the variances of two different scatter measurements.When we compare the scatter for RDCS J1252.9-2927,0.75 ± 0.10 mag, with that of MS 1358+62, 0.57 ± 0.07mag, we find that, despite the 0.19 mag difference, theodds of the two populations being drawn from the sameparent population is around 2%, not a statistically sig-nificant difference. We find a better agreement whencomparing RX J0152.7-1357 with MS 1358+62, a 15%probability that variance measurements of the two sam-ples are drawn from the same distribution, despite theapparent 2.5 standard deviation difference.
In §2.1, we discussed the accuracy of our morphologi-cal classifications. At fainter magnitudes, we found thatour scatter in classification was higher, as measured bythe disagreement amongst the classifiers. The inclusionof later-type galaxies could cause a bias in the estimate

13
Fig. 15.— The deviations around the mean size-surface bright-ness relation for RX J0152.7-1357 (solid line) and MS 1358+62(dotted line). This Figure is similar to Figure 14. All galax-ies with redshifts in RX J0152.7-1357, solid points in Figure 4,and rh >0.′′15 are included. The scatter for RX J0152.7-1357,0.42 ± 0.05 mag, is smaller than the results for MS 1358+62.
of the evolution. We measured the evolution using onlythose galaxies with unanimous agreement amongst thefour classifiers and found a larger result, −1.46±0.13 magfor the color selected sample. This agrees well with the−1.44± 0.15 mag found for the redshift selected sample.The inclusion of late-type galaxies should bias towardsmore evolution, as spiral structure and large disks usu-ally hold star formation, yet the inclusion of the moreuncertain classifications actually lessens the amount ofevolution. However, the lower surface brightness galaxiesare also the galaxies with more uncertainty in their clas-sification. Thus, by removing the galaxies with higheruncertainy in their classification, we naturally removethe lower surface brightness galaxies. The scatter for thecolor-selected sample, with uncertain objects removed,is 0.64 ± 0.12 mag, very close to 0.65 ± 0.12 mag wefind for the spectroscopically selected sample. Thus, weraise the possiblity that the difference in the two sam-ples could come from classification errors as the majorityof uncertain classifications are in the 23 < z850 < 24.5mag range, and below the cutoff for the spectroscopicallyselected sample. Removing these less certain classifica-tions lower the scatter and raises the amount of evolutionmeasured in the color-selected sample. However, theseobjects have, on average, a lower surface brightness, 0.35mag in z850, than the objects with unanimous classifica-tions. These lower surface brightnesses could also explainwhy the classifications are uncertain.
5. DISCUSSION
We observe, using the size-surface brightness relation,(−1.13±0.15)z B mag of luminosity evolution from z = 0to z = 1.237. If we restrict our highest redshift sam-ple to only those galaxies with spectroscopic redshifts,instead of the large sample of galaxies with red colors,
we find (−1.42 ± 0.33)z mag of evolution, which is instatistical agreement with our other result. If we useonly the color selection for RDCS J1252.9-2927, we findthat both of the measurements agree well with the FPresults at the same redshifts (van Dokkum et al. 1998;van Dokkum & Stanford 2003; Holden et al. 2005) and,thus, with the overall trend in luminosity evolution foundfrom other size-surface brightness studies (Schade et al.1997, 1999; Lubin & Sandage 2001c). The overall agree-ment points towards the conclusion that the majority ofmassive elliptical galaxies at these redshifts are passivelyevolving, in agreement with their color evolution.
Given that we find slow luminosity evolution forthe majority of cluster early-type galaxies in our sam-ples, this is another indication that the luminosity-weighted redshift of formation is high for these ob-jects. van Dokkum & Stanford (2003) finds zf > 2.5,though for a different cosmology, using the FP, whileHolden et al. (2005) finds zf2.3+0.3
−0.2 for certain assump-tions about early-type galaxy evolution. As the evolu-tion found in that paper agrees with the evolution inoffset of the size-surface brightness relation, we wouldfind a similar result. This epoch of formation is also inagreement with Blakeslee et al. (2003b) from the colorsof galaxies in RDCS J1252.9-2927. In general, the largescatter on the size-surface brightness relation prevents usfrom making significantly more accurate measurementsof zf . Since we selected galaxies for red colors in RDCSJ1252.9-2927, we could very well be missing an importantpart of the cluster early-type population, namely thosegalaxies that will become red early-types but are bluerthan our selection criteria at the epoch of the observa-tions. This would bias our results to higher redshifts.
The redshift selected sample of RDCS J1252.9-2927,however, shows much more evolution, (−1.42 ± 0.33)zmag as compared with the color-selected sample. It ispossible that this is a selection effect. Namely, it is eas-ier to measure redshifts for higher surface brightnessesobjects. We attempted to mitigate this by trimming theredshift-selected sample at z850 < 23, where the redshift-selected sample is almost complete, containing 17 out of20 early-type galaxies with rh >0.′′15, regardless of color.One possible explanation for this result is the scatteraround the mean size-surface brightness relation.
We observe that the apparent scatter for RDCSJ1252.9-2927 around the size-surface brightness relationis larger than for RX J0152.7-1357. This result is notstatistically siginificant though an increase in the scat-ter would be expected at higher redshifts. There are acouple of lines of evidence that, at z ≃ 1, there are ellipti-cal galaxies that show evidence of recent star formation.Such objects would show a smaller than average M/L.Both van Dokkum & Stanford (2003) and Tran et al.(2003) find galaxies morphologically classified as early-type galaxies but with strong Balmer absorption linesindicating recent starbursts. The example galaxy in theFundamental Plane sample of van Dokkum & Stanford(2003) has a much lower than expected M/L value, afactor of ≃13 lower than the massive galaxies in thatsample, and Holden et al. (2005) finds a large scatter inthe M/L value for a purely luminosity selected sample,much larger than the scatter for lower redshift clusterssuch as Coma or MS 1358+62. The inclusion of a handfulof such galaxies in our sample would increase the scatter

14
but disentangling them requires spectra or good infor-mation. Spectroscopic evidence for recent bursts of star-formation in RDCS J1252.9-2927, which could explainboth the larger scatter and the larger apparent evolutionwhen using only the spectroscopically-selected sample,will be discussed in a future paper (Rosati et al. 2005).
6. SUMMARY
We have investigated the size-surface brightness re-lation for two clusters of galaxies, RDCS J1252.9-2927at z = 1.237 and RX J0152.7-1357 at z = 0.837. Foreach cluster, we identified, by eye, a sample of early-typegalaxies across a broad range in color and in magnitude(Postman et al. 2005). Using our ACS imaging, whichcovers the rest-frame B, we created a magnitude limitedsample for each cluster. The magnitude limits corre-spond to approximately 0.3L⋆ for RDCS J1252.9-2927and 0.5L⋆ for RX J0152.7-1357. For RX J0152.7-1357,we selected galaxies based on the 102 spectroscopic red-shifts (Demarco 2003). RDCS J1252.9-2927 has 36 spec-troscopic members (Demarco 2003; Rosati et al. 2004,2005) and we expanded the sample for that clusterusing a color selection. Our color criteria for RDCSJ1252.9-2927 utilizes the color-magnitude relation andscatter from Blakeslee et al. (2003b), including all galax-ies within two standard deviations of the mean relation.In each case, we chose the observed magnitude limit inthe filter that corresponds most closely to the rest-frameB band.
We fit both Sersic and de Vaucouleurs models to eachgalaxy in our two cluster samples. These models pro-vide total magnitudes and half-light radii with the pointspread function broadening removed. We converted thetotal magnitudes to the average surface brightness withinthe half-light radius. In addition to the model total mag-nitudes, we implemented a third total magnitude mea-surement. We used the Petrosian magnitudes as im-plemented in Wirth (1996) and found excellent agree-ment between these non-parametric measurements andthe Sersic model magnitudes. The disagreement withthe de Vaucouleurs models in general involved a smallsystematic of 0.04 − 0.1 mag depending on the cluster.In addition, we found that the difference between thede Vaucouleurs model magnitudes and either the Sersicor Petrosian magnitudes correlated with the model sizesfor one of the two clusters. In general, we find that our
overall trends are robust, regardless of which size andmagnitude we used for determining the surface bright-ness as long as we compare a given cluster measurementwith a measurement made using the same model in adifferent cluster.
We measured the amount of rest-frame B magnitudeevolution by computing the shift in apparent surfacebrightness at a fixed size. We compare the clusters in thispaper to the results from MS 1358+62 in Kelson et al.(2000a), which contains both Sersic and de Vaucouleursaverage surface brightnesses and half-light radii. For MS1358+62, we compute the amount of evolution requiredto match the size-surface brightness relation between MS1358+62 and either RDCS J1252.9-2927 or RX J0152.7-1357, with the data trimmed at a fixed size and mag-nitude limit. We apply this correction to the data inMS 1358+62, recompute which galaxies would fall aboveour magnitude limit, and repeat until we converge. Wealso apply this to MS 1358+62 and the B band Comacluster data of Jørgensen et al. (1996). For that, we mea-sure −0.35 ± 0.07 mag of evolution, in excellent agree-ment with the Fundamental Plane, or FP, measurements(van Dokkum & Franx 1996; Kelson et al. 1997, 2000c).The rest of the evolution measurements, summarized inTable 1, show results consistent with the FP in mostcases. We find that the average surface brightness at afixed sized changes with redshift as (1.13 ± 0.15)z, veryclose to the (−1.15±0.13)z found with the FP. Only whenwe examine the subset of galaxies in RDCS J1252.9-2927selected by spectroscopic membership do we find a devi-ation.
The overall trend in the luminosity evolution that wefind agrees with this. At the redshift of RDCS J1252.9-2927, we are likely within a 2−3 Gyrs of observing epochwhen most of the stars formed in cluster early-type galax-ies.
We would like to thank Greg Wirth for advice on mea-suring Petrosian magnitudes and for supplying copy ofhis software package. BH would also like to thank S.Adam Stanford and Daniel Kelson for useful discussions.ACS was developed under NASA contract NAS5-32865,this research was supported by NASA grant NAG5-7697.We are grateful to K. Anderson, J. McCann, S. Busching,A. Framarini, S. Barkhouser, and T. Allen for their in-valuable contributions to the ACS project at JHU.
REFERENCES
Appenzeller, I. & Rupprecht, G. 1992, ESO Messenger, 67, 18Aragon-Salamanca, A., Ellis, R. S., Couch, W. J., & Carter, D.
1993, MNRAS, 262, 764Beers, T. C., Flynn, K., & Gebhardt, K. 1990, AJ, 100, 32Benıtez, N., Ford, H., Bouwens, R., Menanteau, F., Blakeslee, J.,
Gronwall, C., Illingworth, G., Meurer, G., Broadhurst, T. J.,Clampin, M., Franx, M., Hartig, G. F., Magee, D., Sirianni, M.,Ardila, D. R., Bartko, F., Brown, R. A., Burrows, C. J., Cheng,E. S., Cross, N. J. G., Feldman, P. D., Golimowski, D. A., Infante,L., Kimble, R. A., Krist, J. E., Lesser, M. P., Levay, Z., Martel,A. R., Miley, G. K., Postman, M., Rosati, P., Sparks, W. B.,Tran, H. D., Tsvetanov, Z. I., White, R. L., & Zheng, W. 2004,ApJS, 150, 1
Bernardi, M., Sheth, R. K., Annis, J., Burles, S., Eisenstein, D. J.,Finkbeiner, D. P., Hogg, D. W., Lupton, R. H., Schlegel, D. J.,SubbaRao, M., Bahcall, N. A., Blakeslee, J. P., Brinkmann, J.,Castander, F. J., Connolly, A. J., Csabai, I., Doi, M., Fukugita,M., Frieman, J., Heckman, T., Hennessy, G. S., Ivezic, Z., Knapp,G. R., Lamb, D. Q., McKay, T., Munn, J. A., Nichol, R.,Okamura, S., Schneider, D. P., Thakar, A. R., & York, D. G.2003, AJ, 125, 1866
Blakeslee, J. P., Anderson, K. R., Meurer, G. R., Benıtez, N., &Magee, D. 2003a, in ASP Conf. Ser. 295: Astronomical DataAnalysis Software and Systems XII, 257
Blakeslee, J. P., Franx, M., Postman, M., Rosati, P., Holden, B. P.,Illingworth, G. D., Ford, H. C., Cross, N. J. G., Gronwall, C.,Benıtez, N., Bouwens, R. J., Broadhurst, T. J., Clampin, M.,Demarco, R., Golimowski, D. A., Hartig, G. F., Infante, L.,Martel, A. R., Miley, G. K., Menanteau, F., Meurer, G. R.,Sirianni, M., & White, R. L. 2003b, ApJ, 596, L143
Bower, R. G., Lucey, J. R., & Ellis, R. S. 1992, MNRAS, 254, 601

15
Coleman, G. D., Wu, C.-C., & Weedman, D. W. 1980, ApJS, 43,393
de Vaucouleurs, G., de Vaucouleurs, A., Corwin, H. G., Buta, R. J.,Paturel, G., & Fouque, P. 1991, Third Reference Catalogue ofBright Galaxies (Volume 1-3, XII, 2069 pp. 7 figs.. Springer-Verlag Berlin Heidelberg New York)
Della Ceca, R., Scaramella, R., Gioia, I., Rosati, P., Fiore, F., &Squires, G. 2000, A&A, 353, 498
Demarco, R. 2003, Ph.D. ThesisDemarco, R., Rosati, P., Lidman, C., Homeier, N. L., Scannapieco,
E., Benitez, N., Mainieri, V., Nonino, M., Girardi, M., Stanford,S. A., Tozzi, P., Borgani, S., Silk, J., Squires, G., & Broadhurst,T. J. 2005a, A&A, in press (astro-ph/0411386)
Djorgovski, S. & Davis, M. 1987, ApJ, 313, 59Ellis, R. S., Smail, I., Dressler, A., Couch, W. J., Oemler, A. J.,
Butcher, H., & Sharples, R. M. 1997, ApJ, 483, 582Faber, S. M. & Jackson, R. E. 1976, ApJ, 204, 668Fabricant, D., Franx, M., & van Dokkum, P. 2000, ApJ, 539, 577Fisher, D., Fabricant, D., Franx, M., & van Dokkum, P. 1998, ApJ,
498, 195Hamabe, M. & Kormendy, J. 1987, in IAU Symp. 127: Structure
and Dynamics of Elliptical Galaxies, 379Holden, B. P., Stanford, S. A., Eisenhardt, P. R., & Dickinson, M.
2004, AJ, 127, 2484Holden, B. P., van der Wel, A., Franx, M., Illingworth, G. D.,
Blakeslee, J. P., van Dokkum, P. G., Ford, H., Magee, D., Rix,H.-W., & Rosati, P. 2005, ApJ, astro
Jørgensen, I., Franx, M., & Kjaergaard, P. 1993, ApJ, 411, 34—. 1995, MNRAS, 273, 1097—. 1996, MNRAS, 280, 167Kelson, D. D., Illingworth, G. D., van Dokkum, P. G., & Franx,
M. 2000a, ApJ, 531, 137—. 2000b, ApJ, 531, 159—. 2000c, ApJ, 531, 184Kelson, D. D., van Dokkum, P. G., Franx, M., Illingworth, G. D.,
& Fabricant, D. 1997, ApJ, 478, L13Kormendy, J. 1977, ApJ, 218, 333Lidman, C., Rosati, P., Demarco, R., Nonino, M., Mainieri, V.,
Stanford, S. A., & Toft, S. 2004, A&A, 416, 829Lubin, L. M. & Sandage, A. 2001a, AJ, 121, 2289—. 2001b, AJ, 122, 1071—. 2001c, AJ, 122, 1084Lupton, R. H. 1996, Statistics in Theory and Practice (Princeton:
Princeton Univ. Press)Moorwood, A., Cuby, J.-G., & Lidman, C. 1998, ESO Messenger,
91, 9Norberg, P., Cole, S., Baugh, C. M., Frenk, C. S., Baldry, I., Bland-
Hawthorn, J., Bridges, T., Cannon, R., Colless, M., Collins, C.,Couch, W., Cross, N. J. G., Dalton, G., De Propris, R., Driver,S. P., Efstathiou, G., Ellis, R. S., Glazebrook, K., Jackson, C.,Lahav, O., Lewis, I., Lumsden, S., Maddox, S., Madgwick, D.,Peacock, J. A., Peterson, B. A., Sutherland, W., & Taylor, K.2002, MNRAS, 336, 907
Oke, J. B. 1990, AJ, 99, 1621Oke, J. B., Cohen, J. G., Carr, M., Cromer, J., Dingizian, A.,
Harris, F. H., Labrecque, S., Lucinio, R., Schaal, W., Epps, H.,& Miller, J. 1995, PASP, 107, 375
Peng, C. Y., Ho, L. C., Impey, C. D., & Rix, H. 2002, AJ, 124, 266
Petrosian, V. 1976, ApJ, 209, L1Postman, M. Franx, M., Cross, N., Holden, B., Ford, H.,
Illingworth, G., Goto, T., Demarco, R., Rosati, P., Blakeslee,J. P., Tran, K.-V., Benıtez, T., Clampin, M., Hartig, G. F.,Homeier, N., Ardila, D. R., Bartko, F., Bouwens, R., Bradley,L. D., Broadhurst, T. J., Brown, R. A., Burrows, C. J., Cheng,E. S., Feldman, P. D., Golimowski, D. A., Gronwall, C., Infante,L., Kimble, R. A., Krist, J. E., Lesser, M. P., Martel, A. R.,Mei, S., Menanteau, F., Meurer, G. R., Miley, G. K., Motta, V.,Sirianni, M., Sparks, W. B., Tran, H. D. Tsvetanov, Z. I., White,R. I., & Zheng, W. 2005, ApJ, accepted (astro-ph/0501224)
Rosati, P., Tozzi, P., Ettori, S., Mainieri, V., Demarco, R.,Stanford, S. A., Lidman, C., Nonino, M., Borgani, S., Della Ceca,R., Eisenhardt, P., Holden, B. P., & Norman, C. 2004, AJ, 127,230
—. 2005, AJ, in prepSandage, A. & Lubin, L. M. 2001, AJ, 121, 2271Sandage, A. & Perelmuter, J. 1990a, ApJ, 350, 481—. 1990b, ApJ, 361, 1—. 1991, ApJ, 370, 455
Schade, D., Barrientos, L. F., & Lopez-Cruz, O. 1997, ApJ, 477,L17
Schade, D., Carlberg, R. G., Yee, H. K. C., Lopez-Cruz, O., &Ellingson, E. 1996, ApJ, 464, L63
Schade, D., Lilly, S. J., Crampton, D., Ellis, R. S., Le Fevre,O., Hammer, F., Brinchmann, J., Abraham, R., Colless, M.,Glazebrook, K., Tresse, L., & Broadhurst, T. 1999, ApJ, 525,31
Sersic, J. L. 1968, Atlas de Galaxıes de Australes (Cørdoba,Argentina: Observatorio Astronomico, 1968)
Stanford, S. A., Eisenhardt, P. R., & Dickinson, M. 1998, ApJ, 492,461
Strauss, M. A., Weinberg, D. H., Lupton, R. H., Narayanan, V. K.,Annis, J., Bernardi, M., Blanton, M., Burles, S., Connolly, A. J.,Dalcanton, J., Doi, M., Eisenstein, D., Frieman, J. A., Fukugita,M., Gunn, J. E., Ivezic, Z., Kent, S., Kim, R. S. J., Knapp,G. R., Kron, R. G., Munn, J. A., Newberg, H. J., Nichol, R. C.,Okamura, S., Quinn, T. R., Richmond, M. W., Schlegel, D. J.,Shimasaku, K., SubbaRao, M., Szalay, A. S., Vanden Berk, D.,Vogeley, M. S., Yanny, B., Yasuda, N., York, D. G., & Zehavi,I. 2002, AJ, 124, 1810
Toft, S., Mainieri, V., Rosati, P., Lidman, C., Demarco, R., Nonino,M., & Stanford, S. A. 2004, A&A, accepted
Tran, K. H., Franx, M., Illingworth, G., Kelson, D. D., & vanDokkum, P. 2003, ApJ, 599, 865
Tully, R. B. & Fisher, J. R. 1977, A&A, 54, 661van Dokkum, P. G. & Franx, M. 1996, MNRAS, 281, 985—. 2001, ApJ, 553, 90van Dokkum, P. G., Franx, M., Kelson, D. D., & Illingworth, G. D.
1998, ApJ, 504, L17van Dokkum, P. G. & Stanford, S. A. 2003, ApJ, 585, 78Wirth, G. D. 1996, Ph.D. ThesisWirth, G. D., Koo, D. C., & Kron, R. G. 1994, ApJ, 435, L105Wuyts, S., van Dokkum, P. G., Kelson, D. D., Franx, M., &
Illingworth, G. D. 2004, ApJ, 605, 677

16
TABLE 1Summary of Measured Evolution from MS 1358+62
Cluster z Membershipa Min. rha ∆µ (n = 4)c ∆µ (1 ≤ n ≤ 4)c
(Brest mag) (Brest mag)
RX J0152.7-1357 0.837 z 0.′′20 -0.42 ± 0.06 -0.67 ± 0.06RX J0152.7-1357 0.837 z 0.′′15 -0.44 ± 0.06 -0.66 ± 0.06RX J0152.7-1357 0.837 z 0.′′10 -0.57 ± 0.06 -0.68 ± 0.05RDCS J1252.9-2927 1.237 color 0.′′20 -0.97 ± 0.14 -1.17 ± 0.13RDCS J1252.9-2927 1.237 color 0.′′15 -1.04 ± 0.13 -1.08 ± 0.13RDCS J1252.9-2927 1.237 color 0.′′10 -1.09 ± 0.11 -1.06 ± 0.11RDCS J1252.9-2927 1.237 z 0.′′20 -1.32 ± 0.16 -1.28 ± 0.11RDCS J1252.9-2927 1.237 z 0.′′15 -1.41 ± 0.16 -1.42 ± 0.13RDCS J1252.9-2927 1.237 z 0.′′10 -1.53 ± 0.16 -1.47 ± 0.13
aThis column notes whether the galaxies in the sample were selected based on spectroscopicredshifts (z) or based on the galaxies’ colors.bMinimum half-light radius for inclusion in the sample.cAverage change in surface brightness measured for the sample based on de Vaucouleurs
models (n = 4) or Sersic models (1 ≤ n ≤ 4.)
Related Documents


![X-one-クレイパックリーフ-単 EX INUI) EX INI]PEX INUPEX Brightness Clay Pack for your brightness life íNUP Brightness Clay Pack far your brightness life íNUP](https://static.cupdf.com/doc/110x72/5c8b11e009d3f2d5658ce1da/x-one-ex-inui-ex-inipex-inupex-brightness-clay.jpg)