Evoked amygdala responses to negative faces revealed by adaptive MEG beamformers Brian R Cornwell 1 , Frederick W Carver 2 , Richard Coppola 2 , Linda Johnson 1 , Ruben Alvarez 1 , and Christian Grillon 1 1Mood & Anxiety Disorders Program, National Institute of Mental Health, National Institutes of Health, Bethesda, MD 2Magnetoencephalography Core Facility, National Institute of Mental Health, National Institutes of Health, Bethesda, MD Abstract Adaptive beamformer analyses of magnetoencephalograms (MEG) have shown promise as a method for functional imaging of cortical processes. Although recent evidence is encouraging, it is unclear whether these methods can both localize and reconstruct the time course of activity in subcortical structures such as the amygdala. Fourteen healthy participants (7 women) performed a perceptual matching task of negative emotional faces (angry and fearful) and geometric shapes that was designed for functional magnetic resonance imaging (fMRI) studies to maximize amygdala activation. Neuromagnetic data were collected with a 275-channel whole-head magnetometer, and event-related adaptive beamformer analyses were conducted to estimate broadband evoked responses to faces and shapes across the whole brain in 7mm steps. Group analyses revealed greater left amygdala activity to faces over shapes, both when face-matching and shape-matching trials were presented in separate blocks and when they were randomly intermixed. This finding was replicated in a second experiment with 7 new participants (3 women). Virtual sensor time series showed clear evoked responses in the left amygdala and left fusiform gyrus in both runs and experiments. We conclude that amygdala activity can be resolved from MEGs with adaptive beamformers with temporal resolution superior to other neuroimaging modalities. This demonstration should encourage use of MEG for elucidating functional networks mediating fear-related neural phenomena that likely unfold rapidly in time across cortical and subcortical structures. Keywords adaptive beamformer; amygdala; anger; facial expressions; fear; magnetoencephalography Introduction Magnetic source imaging techniques have begun to capitalize on the wealth of information existing in magnetoencephalograms (MEG) recorded by whole-head neuromagnetometers. While most MEG studies focus on the cerebral cortex, increasing evidence suggests that Corresponding Author: Brian R Cornwell, Mood and Anxiety Disorders Program, National Institute of Mental Health, 15K North Drive, MSC 2670, Bethesda MD 20892, Email: [email protected], Phone: 301-402-8992, Fax: 301-594-9959. Publisher's Disclaimer: This is a PDF file of an unedited manuscript that has been accepted for publication. As a service to our customers we are providing this early version of the manuscript. The manuscript will undergo copyediting, typesetting, and review of the resulting proof before it is published in its final citable form. Please note that during the production process errors may be discovered which could affect the content, and all legal disclaimers that apply to the journal pertain. NIH Public Access Author Manuscript Brain Res. Author manuscript; available in PMC 2009 December 9. Published in final edited form as: Brain Res. 2008 December 9; 1244: 103–112. doi:10.1016/j.brainres.2008.09.068. NIH-PA Author Manuscript NIH-PA Author Manuscript NIH-PA Author Manuscript

Welcome message from author
This document is posted to help you gain knowledge. Please leave a comment to let me know what you think about it! Share it to your friends and learn new things together.
Transcript

Evoked amygdala responses to negative faces revealed byadaptive MEG beamformers
Brian R Cornwell1, Frederick W Carver2, Richard Coppola2, Linda Johnson1, RubenAlvarez1, and Christian Grillon1
1Mood & Anxiety Disorders Program, National Institute of Mental Health, National Institutes of Health,Bethesda, MD
2Magnetoencephalography Core Facility, National Institute of Mental Health, National Institutes of Health,Bethesda, MD
AbstractAdaptive beamformer analyses of magnetoencephalograms (MEG) have shown promise as a methodfor functional imaging of cortical processes. Although recent evidence is encouraging, it is unclearwhether these methods can both localize and reconstruct the time course of activity in subcorticalstructures such as the amygdala. Fourteen healthy participants (7 women) performed a perceptualmatching task of negative emotional faces (angry and fearful) and geometric shapes that was designedfor functional magnetic resonance imaging (fMRI) studies to maximize amygdala activation.Neuromagnetic data were collected with a 275-channel whole-head magnetometer, and event-relatedadaptive beamformer analyses were conducted to estimate broadband evoked responses to faces andshapes across the whole brain in 7mm steps. Group analyses revealed greater left amygdala activityto faces over shapes, both when face-matching and shape-matching trials were presented in separateblocks and when they were randomly intermixed. This finding was replicated in a second experimentwith 7 new participants (3 women). Virtual sensor time series showed clear evoked responses in theleft amygdala and left fusiform gyrus in both runs and experiments. We conclude that amygdalaactivity can be resolved from MEGs with adaptive beamformers with temporal resolution superiorto other neuroimaging modalities. This demonstration should encourage use of MEG for elucidatingfunctional networks mediating fear-related neural phenomena that likely unfold rapidly in time acrosscortical and subcortical structures.
Keywordsadaptive beamformer; amygdala; anger; facial expressions; fear; magnetoencephalography
IntroductionMagnetic source imaging techniques have begun to capitalize on the wealth of informationexisting in magnetoencephalograms (MEG) recorded by whole-head neuromagnetometers.While most MEG studies focus on the cerebral cortex, increasing evidence suggests that
Corresponding Author: Brian R Cornwell, Mood and Anxiety Disorders Program, National Institute of Mental Health, 15K North Drive,MSC 2670, Bethesda MD 20892, Email: [email protected], Phone: 301-402-8992, Fax: 301-594-9959.Publisher's Disclaimer: This is a PDF file of an unedited manuscript that has been accepted for publication. As a service to our customerswe are providing this early version of the manuscript. The manuscript will undergo copyediting, typesetting, and review of the resultingproof before it is published in its final citable form. Please note that during the production process errors may be discovered which couldaffect the content, and all legal disclaimers that apply to the journal pertain.
NIH Public AccessAuthor ManuscriptBrain Res. Author manuscript; available in PMC 2009 December 9.
Published in final edited form as:Brain Res. 2008 December 9; 1244: 103–112. doi:10.1016/j.brainres.2008.09.068.
NIH
-PA Author Manuscript
NIH
-PA Author Manuscript
NIH
-PA Author Manuscript
subcortical sources can be observed despite relatively low signal strength (Cornwell, Johnson,Holroyd, Carver, & Grillon, 2008; Ioannides, Liu, Kwapien, Drozdz & Streit, 2000; Moses etal., 2007; Streit et al., 2003; Tesche & Karhu, 2000). An array of different source analysistechniques have been employed to localize activation in thalamus, hippocampus andcerebellum, among other regions. Recently, three separate studies have reported observingamygdala activation elicited by negatively affective stimuli using minimum-variance adaptivebeamformer techniques (Cornwell et al., 2007; Garolera et al., 2007; Luo, Holroyd, Jones,Hendler & Blair, 2007).
Adaptive beamformer analysis has proven successful in spatial localization of cortical activityassociated with sensory and cognitive processes (Hillebrand, Singh, Holliday, Furlong &Barnes, 2005; Schultz et al., 2004; Singh, Barnes, Hillebrand, Forde, Williams, 2002;Taniguchi et al., 2000). An adaptive beamformer acts as an optimum spatial filter tuned to aparticular point in source space that passes through the uncorrelated fraction of activity (signalplus noise) at that point and attenuates activity from elsewhere (Van Veen, van Drongelen,Yuchtman, & Suzuki, 1997; Vrba & Robinson, 1999). Computationally, the output of anadaptive beamformer is the weighted sum of sensor data, where these weights or coefficientsare derived from the biomagnetic forward solution for a specific source location and thecovariance matrix of unaveraged sensor data for a defined time-frequency window (Vrba &Robinson, 1999). The distribution of activity across the brain can be mapped by defining a 3-dimensional grid and constructing, one-by-one, beamformers at each point in the volume, witheach point yielding an estimate of source power integrated over the time-frequency windowused for covariance calculation. Statistical volumes can be produced from the source powerestimates, spatially co-registered to structural magnetic resonance images (MRI) and spatiallywarped into a standardized space (i.e., Talairach space) for group analyses (Barnes &Hillebrand, 2003; Hillebrand et al., 2005).
Previous work with intracranial electroencephalography (iEEG) has shown differential event-related potentials (ERPs) in the amygdala to faces displaying negative and positive emotionalexpressions, with fearful expressions eliciting a greater response than other expressions by200ms following stimulus presentation (Krolak-Salmon et al., 2004). Despite the clear spatialand temporal resolving ability of intracranial recordings, it is difficult to determine whatproperties of the data may not be generalizable to the healthy brain given that they are obtainedfrom patients suffering from intractable epileptic seizures that require surgical intervention.Our aim was to explore the extent to which event-related beamformer analyses can producefrom noninvasive MEG recordings information about amygdala activity with a similar levelof temporal specificity. Such a demonstration would greatly enhance our ability to investigaterapid fear-related neural processes in healthy participants on a time-scale impossible with othernoninvasive imaging modalities.
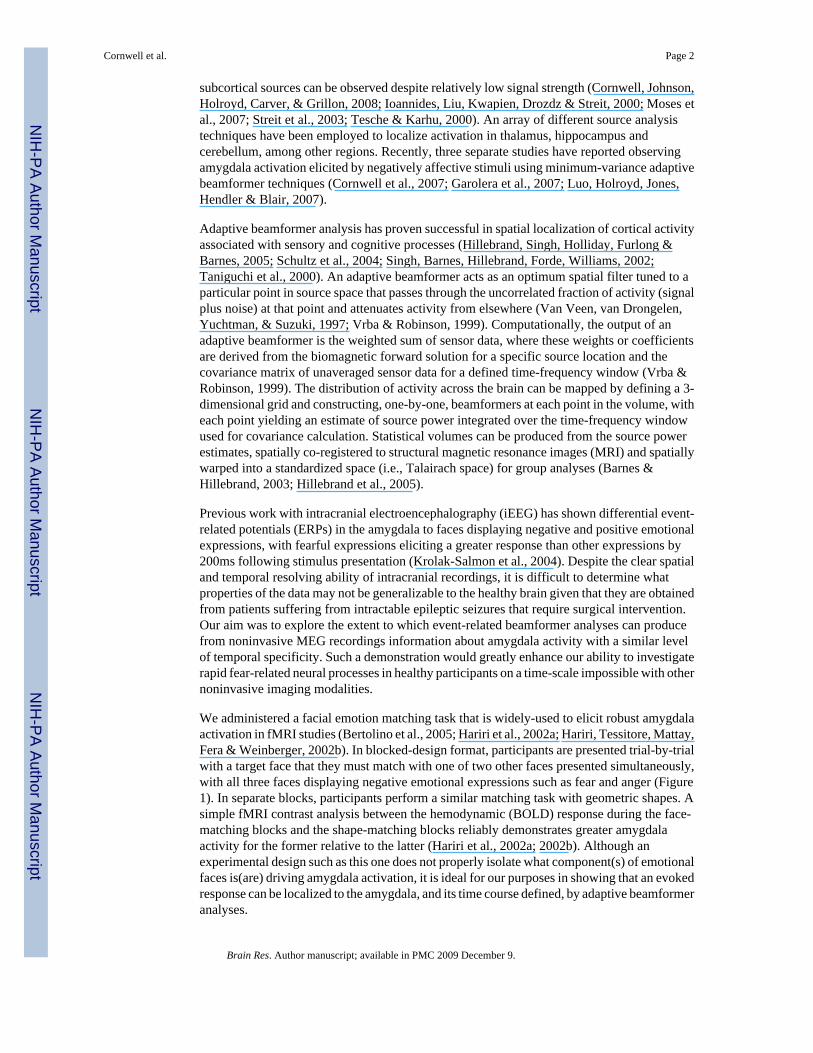
We administered a facial emotion matching task that is widely-used to elicit robust amygdalaactivation in fMRI studies (Bertolino et al., 2005; Hariri et al., 2002a; Hariri, Tessitore, Mattay,Fera & Weinberger, 2002b). In blocked-design format, participants are presented trial-by-trialwith a target face that they must match with one of two other faces presented simultaneously,with all three faces displaying negative emotional expressions such as fear and anger (Figure1). In separate blocks, participants perform a similar matching task with geometric shapes. Asimple fMRI contrast analysis between the hemodynamic (BOLD) response during the face-matching blocks and the shape-matching blocks reliably demonstrates greater amygdalaactivity for the former relative to the latter (Hariri et al., 2002a; 2002b). Although anexperimental design such as this one does not properly isolate what component(s) of emotionalfaces is(are) driving amygdala activation, it is ideal for our purposes in showing that an evokedresponse can be localized to the amygdala, and its time course defined, by adaptive beamformeranalyses.
Cornwell et al. Page 2
Brain Res. Author manuscript; available in PMC 2009 December 9.
NIH
-PA Author Manuscript
NIH
-PA Author Manuscript
NIH
-PA Author Manuscript
In this study, we presented face-matching and shape-matching trials in the standard blocked-trial format and also randomly intermixed in two different runs to explore the reliability of theresults within the same participants. The latter run was also intended to limit the degree towhich evoked responses to faces and shapes were influenced by state-related neural activity,as might be expected in a blocked-trial format when participants are repeatedly exposed to aparticular kind of stimulus (in this case, negative emotional faces). These procedures were thenrepeated in a second experiment to examine the replicability of the findings in a second groupof participants. In the second experiment, we explicitly instructed participants to focus on theemotional expressions of the faces to make their matching judgments to potentially increaseamygdala reactivity in these participants (Pessoa, Japee, Sturman & Ungerleider, 2006; Pessoa,McKenna, Guiterrez, & Ungerleider, 2002).
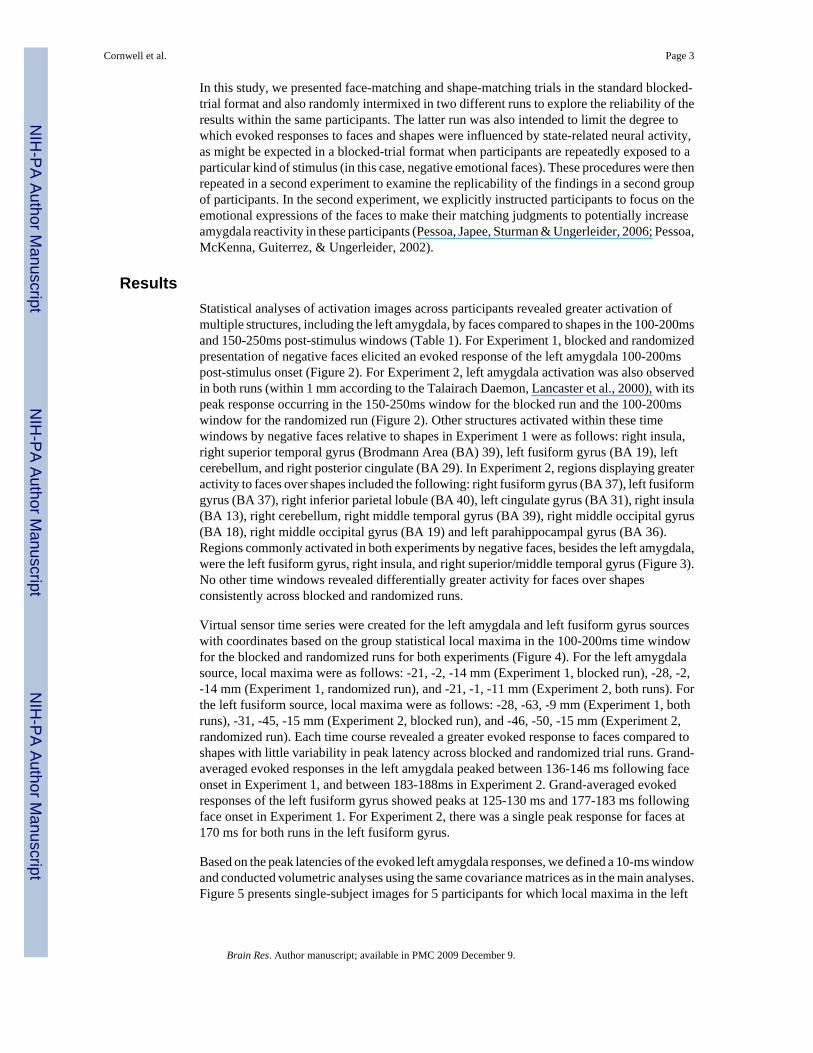
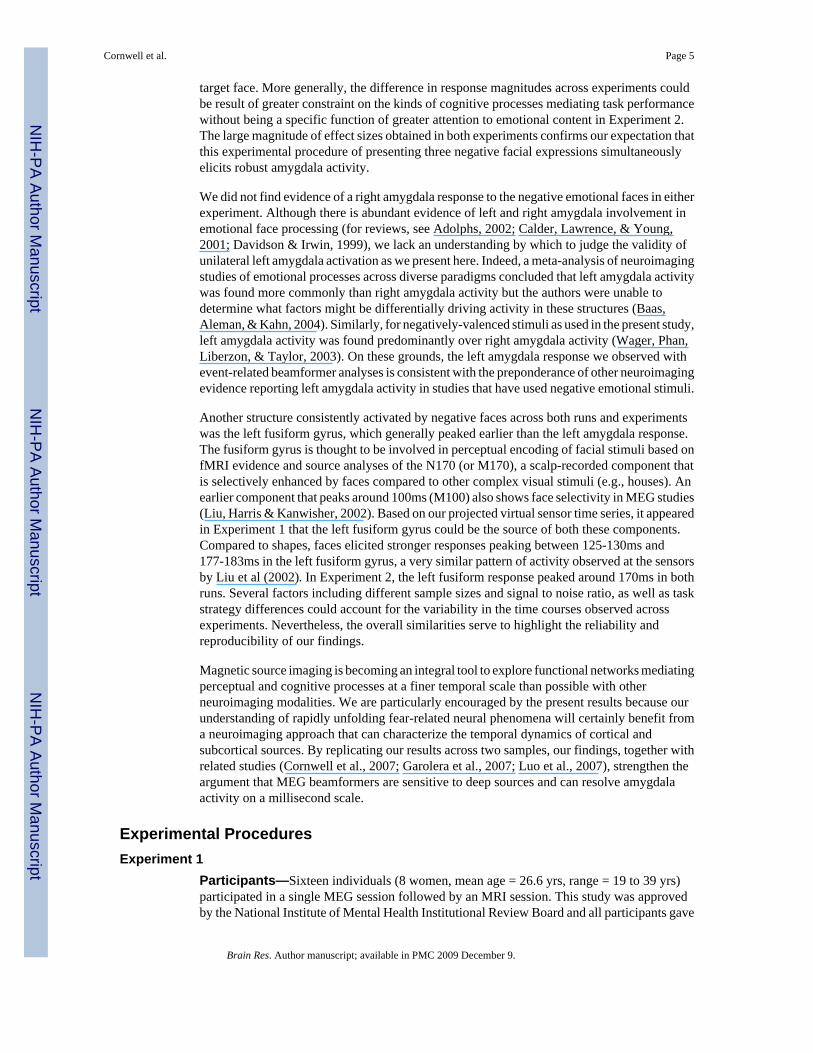
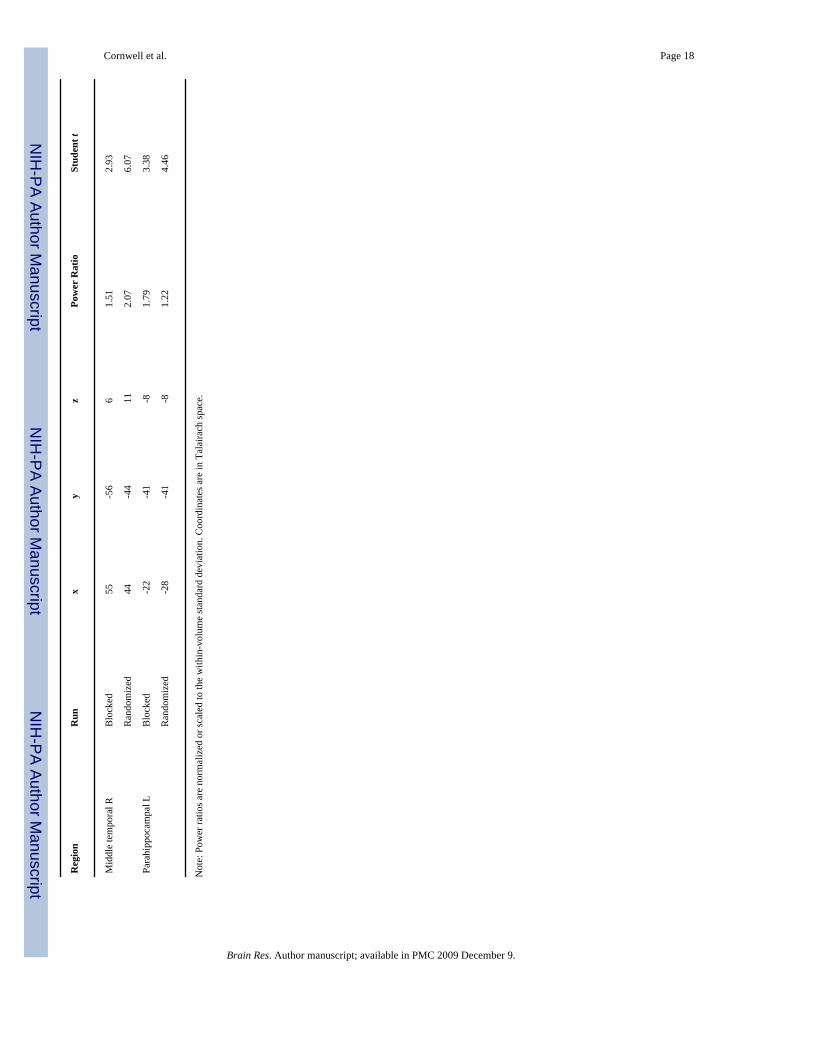
ResultsStatistical analyses of activation images across participants revealed greater activation ofmultiple structures, including the left amygdala, by faces compared to shapes in the 100-200msand 150-250ms post-stimulus windows (Table 1). For Experiment 1, blocked and randomizedpresentation of negative faces elicited an evoked response of the left amygdala 100-200mspost-stimulus onset (Figure 2). For Experiment 2, left amygdala activation was also observedin both runs (within 1 mm according to the Talairach Daemon, Lancaster et al., 2000), with itspeak response occurring in the 150-250ms window for the blocked run and the 100-200mswindow for the randomized run (Figure 2). Other structures activated within these timewindows by negative faces relative to shapes in Experiment 1 were as follows: right insula,right superior temporal gyrus (Brodmann Area (BA) 39), left fusiform gyrus (BA 19), leftcerebellum, and right posterior cingulate (BA 29). In Experiment 2, regions displaying greateractivity to faces over shapes included the following: right fusiform gyrus (BA 37), left fusiformgyrus (BA 37), right inferior parietal lobule (BA 40), left cingulate gyrus (BA 31), right insula(BA 13), right cerebellum, right middle temporal gyrus (BA 39), right middle occipital gyrus(BA 18), right middle occipital gyrus (BA 19) and left parahippocampal gyrus (BA 36).Regions commonly activated in both experiments by negative faces, besides the left amygdala,were the left fusiform gyrus, right insula, and right superior/middle temporal gyrus (Figure 3).No other time windows revealed differentially greater activity for faces over shapesconsistently across blocked and randomized runs.
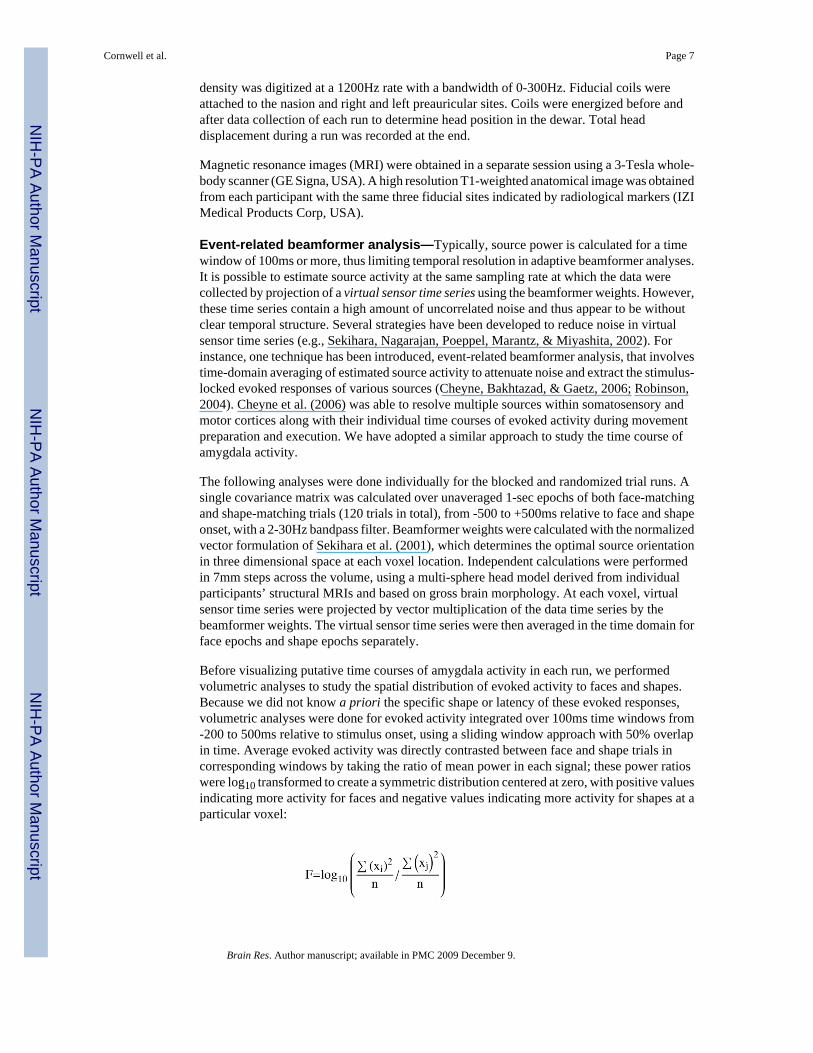
Virtual sensor time series were created for the left amygdala and left fusiform gyrus sourceswith coordinates based on the group statistical local maxima in the 100-200ms time windowfor the blocked and randomized runs for both experiments (Figure 4). For the left amygdalasource, local maxima were as follows: -21, -2, -14 mm (Experiment 1, blocked run), -28, -2,-14 mm (Experiment 1, randomized run), and -21, -1, -11 mm (Experiment 2, both runs). Forthe left fusiform source, local maxima were as follows: -28, -63, -9 mm (Experiment 1, bothruns), -31, -45, -15 mm (Experiment 2, blocked run), and -46, -50, -15 mm (Experiment 2,randomized run). Each time course revealed a greater evoked response to faces compared toshapes with little variability in peak latency across blocked and randomized trial runs. Grand-averaged evoked responses in the left amygdala peaked between 136-146 ms following faceonset in Experiment 1, and between 183-188ms in Experiment 2. Grand-averaged evokedresponses of the left fusiform gyrus showed peaks at 125-130 ms and 177-183 ms followingface onset in Experiment 1. For Experiment 2, there was a single peak response for faces at170 ms for both runs in the left fusiform gyrus.
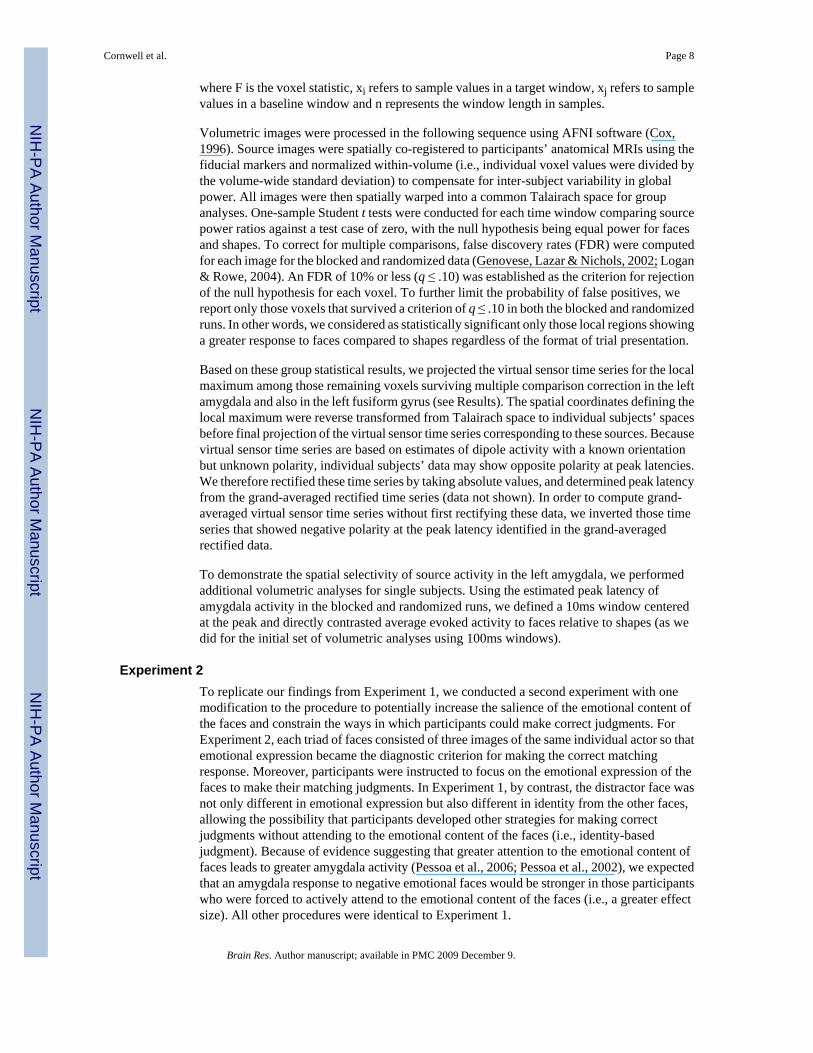
Based on the peak latencies of the evoked left amygdala responses, we defined a 10-ms windowand conducted volumetric analyses using the same covariance matrices as in the main analyses.Figure 5 presents single-subject images for 5 participants for which local maxima in the left
Cornwell et al. Page 3
Brain Res. Author manuscript; available in PMC 2009 December 9.
NIH
-PA Author Manuscript
NIH
-PA Author Manuscript
NIH
-PA Author Manuscript

amygdala were evident. The majority of participants showed activations that extended into,but peaked outside, the left amygdala.
Effect sizes were computed at peak latencies for the left amygdala response to compare thedifference in evoked activity across experiments. Cohen’s d’s were as follows: 1.08(Experiment 1, blocked), 1.41 (Experiment 1, randomized), 2.43 (Experiment 2, blocked) and2.08 (Experiment 2, randomized). For both runs, negative faces elicited larger left amygdalaresponses in Experiment 2 relative to Experiment 1.
DiscussionResults of this study constitute a successful demonstration that event-related beamformeranalyses can resolve amygdala activity in whole-head MEG recordings, consistent withprevious studies using minimum-variance adaptive beamformers (Cornwell et al., 2007;Garolera et al., 2007; Luo et al., 2007). Using a well-tested paradigm for eliciting amygdalaactivity in fMRI studies (Hariri et al., 2002a; 2002b), we observed and replicated greater leftamygdala activity to negative emotional faces relative to geometric shapes as participantsacross two experiments performed a simple matching task. Similar activation of the leftamygdala was found irrespective of trial presentation format, both when face-matching andshape-matching trials were blocked and intermixed/randomized, demonstrating consistency incapturing signals from the amygdala within subjects over time. We also observed activationof the left fusiform gyrus, right insula and superior/middle temporal cortices in bothexperiments, structures that have been widely shown to be involved in facial emotionalprocessing (for a review, see Haxby, Hoffman & Gobbini, 2000).
Of central interest, projection of virtual sensor time series of the left amygdala source evidenceda clear evoked response that was larger for faces compared to shapes and consistent in peaklatency within subjects across trial presentation formats (i.e., between runs). Time coursesrevealed that the left amygdala activity peaked earlier than those obtained from iEEGrecordings in epileptic patients (Halgren et al., 1994; Krolak-Salmon et al., 2004). These timecourses generally fit with the detailed neuroanatomical model of facial emotion recognitionproposed by Adolphs (2002). Peak latencies of the amygdala responses appeared to differ byas much as 50ms between experiments, but response onsets differed by no more than 30ms.Although volumetric analyses showed high consistency in localizing amygdala activity in bothexperiments, projected time courses were more variable and thus seem to be more dependenton sample size for reliable estimation. Nevertheless, with these estimated time courses, wewere able to show focal activation of the left amygdala at the peak latency in several individualparticipants.
Given that negative emotional faces and geometric shapes differ in multiple ways, we cannotmake strong conclusions about what differential amygdala activity reflects in this study. Ourfindings could be interpreted as showing that greater attention to negative faces increasedevoked activity of the left amygdala, in line with fMRI findings (Pessoa et al., 2006; Pessoaet al., 2002), and led to more widespread activation of posterior visual areas (Figure 4). Aneffect size comparison across experiments, which is not biased by unequal sample sizes,suggests that presentation of negative emotional faces exerted a stronger effect on left amygdalaactivity in participants in Experiment 2 relative to Experiment 1. The critical proceduraldifference between the two experiments was that Experiment 2 demanded that participants usethe emotional expression of the faces, or at least the internal features of the face, as the basisby which to make matching responses, insofar as triads were comprised of different facialexpressions of the same individual actor. Participants in Experiment 1 could have usednonemotional cues, such as the identity of the actors, to make correct matching responsesbecause the distractor face in each triad differed by emotional expression and identity from the
Cornwell et al. Page 4
Brain Res. Author manuscript; available in PMC 2009 December 9.
NIH
-PA Author Manuscript
NIH
-PA Author Manuscript
NIH
-PA Author Manuscript
target face. More generally, the difference in response magnitudes across experiments couldbe result of greater constraint on the kinds of cognitive processes mediating task performancewithout being a specific function of greater attention to emotional content in Experiment 2.The large magnitude of effect sizes obtained in both experiments confirms our expectation thatthis experimental procedure of presenting three negative facial expressions simultaneouslyelicits robust amygdala activity.
We did not find evidence of a right amygdala response to the negative emotional faces in eitherexperiment. Although there is abundant evidence of left and right amygdala involvement inemotional face processing (for reviews, see Adolphs, 2002; Calder, Lawrence, & Young,2001; Davidson & Irwin, 1999), we lack an understanding by which to judge the validity ofunilateral left amygdala activation as we present here. Indeed, a meta-analysis of neuroimagingstudies of emotional processes across diverse paradigms concluded that left amygdala activitywas found more commonly than right amygdala activity but the authors were unable todetermine what factors might be differentially driving activity in these structures (Baas,Aleman, & Kahn, 2004). Similarly, for negatively-valenced stimuli as used in the present study,left amygdala activity was found predominantly over right amygdala activity (Wager, Phan,Liberzon, & Taylor, 2003). On these grounds, the left amygdala response we observed withevent-related beamformer analyses is consistent with the preponderance of other neuroimagingevidence reporting left amygdala activity in studies that have used negative emotional stimuli.
Another structure consistently activated by negative faces across both runs and experimentswas the left fusiform gyrus, which generally peaked earlier than the left amygdala response.The fusiform gyrus is thought to be involved in perceptual encoding of facial stimuli based onfMRI evidence and source analyses of the N170 (or M170), a scalp-recorded component thatis selectively enhanced by faces compared to other complex visual stimuli (e.g., houses). Anearlier component that peaks around 100ms (M100) also shows face selectivity in MEG studies(Liu, Harris & Kanwisher, 2002). Based on our projected virtual sensor time series, it appearedin Experiment 1 that the left fusiform gyrus could be the source of both these components.Compared to shapes, faces elicited stronger responses peaking between 125-130ms and177-183ms in the left fusiform gyrus, a very similar pattern of activity observed at the sensorsby Liu et al (2002). In Experiment 2, the left fusiform response peaked around 170ms in bothruns. Several factors including different sample sizes and signal to noise ratio, as well as taskstrategy differences could account for the variability in the time courses observed acrossexperiments. Nevertheless, the overall similarities serve to highlight the reliability andreproducibility of our findings.
Magnetic source imaging is becoming an integral tool to explore functional networks mediatingperceptual and cognitive processes at a finer temporal scale than possible with otherneuroimaging modalities. We are particularly encouraged by the present results because ourunderstanding of rapidly unfolding fear-related neural phenomena will certainly benefit froma neuroimaging approach that can characterize the temporal dynamics of cortical andsubcortical sources. By replicating our results across two samples, our findings, together withrelated studies (Cornwell et al., 2007; Garolera et al., 2007; Luo et al., 2007), strengthen theargument that MEG beamformers are sensitive to deep sources and can resolve amygdalaactivity on a millisecond scale.
Experimental ProceduresExperiment 1
Participants—Sixteen individuals (8 women, mean age = 26.6 yrs, range = 19 to 39 yrs)participated in a single MEG session followed by an MRI session. This study was approvedby the National Institute of Mental Health Institutional Review Board and all participants gave
Cornwell et al. Page 5
Brain Res. Author manuscript; available in PMC 2009 December 9.
NIH
-PA Author Manuscript
NIH
-PA Author Manuscript
NIH
-PA Author Manuscript

informed consent prior to participation. Participant inclusion criteria included: (1) no past orcurrent psychiatric disorders as per Structured Clinical Interview for DSM-IV (First et al.,1995); (2) no current use of psychoactive medications as per self-report; and (3) no current useof illicit drugs determined by urine analysis. Participants were also screened for metallicimplants, tattoos and other non-removable metallic objects. Because of excessive headmovement (displacement exceeding 5mm based on pre- and post-run calculations), twoparticipants were excluded from analyses. The final sample consisted of 14 participants (7women, mean age = 26.5 yrs, range 19 to 39 yrs).
Stimuli—Emotional faces were taken from the NimStim-MacBrain Face Stimulus Set,overseen by Nim Tottenham and supported by the John D. and Catherine T. MacArthurFoundation Research Network on Early Experience and Brain Development. Please contactNim Tottenham at [email protected] for more information concerning the stimulus set. Inbrief, it is a set of static, color photographs of male and female actors’ faces exhibiting diversenegative and positive facial emotional expressions. From this set, we selected fearful and angryopen-mouth facial displays from 30 different actors (50% women). Geometric shapes, ovalsand rectangles, were created in horizontal orientation and varied among 6 different colorsacross trials. Figure 1 presents sample face and shape stimuli. All stimuli were back-projectedonto a screen positioned approximately 75cm from the participant. A fiber-optic button boxwas used to record responses of the participants.
Procedure—Participants completed two runs of a matching task with each run consisting of120 trials divided into 6 blocks (5s break between blocks). Each trial consisted of a 1spresentation of a triad of faces or geometric shapes with a triangular arrangement (Figure 1).The top image was defined as the target, and participants were instructed to match it with eitherthe bottom left or bottom right image by button press. To cue participants to a new trial, triadswere preceded 500-600ms by rectangular cues of the same dimension in the same locations.Participants were instructed to fixate the target image location to limit early eye movements.Following 1s presentation of a triad, participants were cued to make a manual response. Theywere asked to only make a response after triad presentation ended; since responses werewithheld for a 1s duration, reaction times were unlikely to contain information about taskdifficulty or speed of mediating cognitive processes and were therefore not analyzed. Therewas a 2s interval between the end of a triad presentation and the onset of a new set of fixationcues. Across trials within a run, the same target image was never repeated, although the sameactor posing an angry or fearful expression may have been presented as the target image ontwo different trials and the same image may have served as the target on one trial and as thedistractor image on another. The distractor image was always a different actor posing a differentemotional expression than the target image.
In one run, blocks alternated between the face-matching task and shape-matching task, with20 trials per block and 3 blocks per task. Each block began with the relevant instructionspresented on the screen for 5 s (i.e., “Match Faces” or “Match Shapes”). The blocked formatclosely matches the design typically conducted in fMRI studies (blocked run). We alsoadministered a second run in which the two tasks were intermixed, with instructions to “MatchStimuli” after every 20 trials (randomized run). In the randomized run, the order of task trialswas pseudo-randomized with the constraint that there were no more than 3 consecutive trialsof either face-matching or shape-matching. The order of blocked and randomized runs wascounterbalanced across participants.
Data Acquisition—Neuromagnetic activity was measured in a magnetically-shielded room(Vacuumschmelze, Germany) with a CTF-OMEGA whole-head magnetometer equipped with275 radial 1st order gradiometers (VSM MedTech, Ltd., Canada). Synthetic 3rd gradientbalancing was used for active noise cancellation (Vrba & Robinson, 1999). Magnetic flux
Cornwell et al. Page 6
Brain Res. Author manuscript; available in PMC 2009 December 9.
NIH
-PA Author Manuscript
NIH
-PA Author Manuscript
NIH
-PA Author Manuscript
density was digitized at a 1200Hz rate with a bandwidth of 0-300Hz. Fiducial coils wereattached to the nasion and right and left preauricular sites. Coils were energized before andafter data collection of each run to determine head position in the dewar. Total headdisplacement during a run was recorded at the end.
Magnetic resonance images (MRI) were obtained in a separate session using a 3-Tesla whole-body scanner (GE Signa, USA). A high resolution T1-weighted anatomical image was obtainedfrom each participant with the same three fiducial sites indicated by radiological markers (IZIMedical Products Corp, USA).
Event-related beamformer analysis—Typically, source power is calculated for a timewindow of 100ms or more, thus limiting temporal resolution in adaptive beamformer analyses.It is possible to estimate source activity at the same sampling rate at which the data werecollected by projection of a virtual sensor time series using the beamformer weights. However,these time series contain a high amount of uncorrelated noise and thus appear to be withoutclear temporal structure. Several strategies have been developed to reduce noise in virtualsensor time series (e.g., Sekihara, Nagarajan, Poeppel, Marantz, & Miyashita, 2002). Forinstance, one technique has been introduced, event-related beamformer analysis, that involvestime-domain averaging of estimated source activity to attenuate noise and extract the stimulus-locked evoked responses of various sources (Cheyne, Bakhtazad, & Gaetz, 2006; Robinson,2004). Cheyne et al. (2006) was able to resolve multiple sources within somatosensory andmotor cortices along with their individual time courses of evoked activity during movementpreparation and execution. We have adopted a similar approach to study the time course ofamygdala activity.
The following analyses were done individually for the blocked and randomized trial runs. Asingle covariance matrix was calculated over unaveraged 1-sec epochs of both face-matchingand shape-matching trials (120 trials in total), from -500 to +500ms relative to face and shapeonset, with a 2-30Hz bandpass filter. Beamformer weights were calculated with the normalizedvector formulation of Sekihara et al. (2001), which determines the optimal source orientationin three dimensional space at each voxel location. Independent calculations were performedin 7mm steps across the volume, using a multi-sphere head model derived from individualparticipants’ structural MRIs and based on gross brain morphology. At each voxel, virtualsensor time series were projected by vector multiplication of the data time series by thebeamformer weights. The virtual sensor time series were then averaged in the time domain forface epochs and shape epochs separately.
Before visualizing putative time courses of amygdala activity in each run, we performedvolumetric analyses to study the spatial distribution of evoked activity to faces and shapes.Because we did not know a priori the specific shape or latency of these evoked responses,volumetric analyses were done for evoked activity integrated over 100ms time windows from-200 to 500ms relative to stimulus onset, using a sliding window approach with 50% overlapin time. Average evoked activity was directly contrasted between face and shape trials incorresponding windows by taking the ratio of mean power in each signal; these power ratioswere log10 transformed to create a symmetric distribution centered at zero, with positive valuesindicating more activity for faces and negative values indicating more activity for shapes at aparticular voxel:
Cornwell et al. Page 7
Brain Res. Author manuscript; available in PMC 2009 December 9.
NIH
-PA Author Manuscript
NIH
-PA Author Manuscript
NIH
-PA Author Manuscript
where F is the voxel statistic, xi refers to sample values in a target window, xj refers to samplevalues in a baseline window and n represents the window length in samples.
Volumetric images were processed in the following sequence using AFNI software (Cox,1996). Source images were spatially co-registered to participants’ anatomical MRIs using thefiducial markers and normalized within-volume (i.e., individual voxel values were divided bythe volume-wide standard deviation) to compensate for inter-subject variability in globalpower. All images were then spatially warped into a common Talairach space for groupanalyses. One-sample Student t tests were conducted for each time window comparing sourcepower ratios against a test case of zero, with the null hypothesis being equal power for facesand shapes. To correct for multiple comparisons, false discovery rates (FDR) were computedfor each image for the blocked and randomized data (Genovese, Lazar & Nichols, 2002; Logan& Rowe, 2004). An FDR of 10% or less (q ≤ .10) was established as the criterion for rejectionof the null hypothesis for each voxel. To further limit the probability of false positives, wereport only those voxels that survived a criterion of q ≤ .10 in both the blocked and randomizedruns. In other words, we considered as statistically significant only those local regions showinga greater response to faces compared to shapes regardless of the format of trial presentation.
Based on these group statistical results, we projected the virtual sensor time series for the localmaximum among those remaining voxels surviving multiple comparison correction in the leftamygdala and also in the left fusiform gyrus (see Results). The spatial coordinates defining thelocal maximum were reverse transformed from Talairach space to individual subjects’ spacesbefore final projection of the virtual sensor time series corresponding to these sources. Becausevirtual sensor time series are based on estimates of dipole activity with a known orientationbut unknown polarity, individual subjects’ data may show opposite polarity at peak latencies.We therefore rectified these time series by taking absolute values, and determined peak latencyfrom the grand-averaged rectified time series (data not shown). In order to compute grand-averaged virtual sensor time series without first rectifying these data, we inverted those timeseries that showed negative polarity at the peak latency identified in the grand-averagedrectified data.
To demonstrate the spatial selectivity of source activity in the left amygdala, we performedadditional volumetric analyses for single subjects. Using the estimated peak latency ofamygdala activity in the blocked and randomized runs, we defined a 10ms window centeredat the peak and directly contrasted average evoked activity to faces relative to shapes (as wedid for the initial set of volumetric analyses using 100ms windows).
Experiment 2To replicate our findings from Experiment 1, we conducted a second experiment with onemodification to the procedure to potentially increase the salience of the emotional content ofthe faces and constrain the ways in which participants could make correct judgments. ForExperiment 2, each triad of faces consisted of three images of the same individual actor so thatemotional expression became the diagnostic criterion for making the correct matchingresponse. Moreover, participants were instructed to focus on the emotional expression of thefaces to make their matching judgments. In Experiment 1, by contrast, the distractor face wasnot only different in emotional expression but also different in identity from the other faces,allowing the possibility that participants developed other strategies for making correctjudgments without attending to the emotional content of the faces (i.e., identity-basedjudgment). Because of evidence suggesting that greater attention to the emotional content offaces leads to greater amygdala activity (Pessoa et al., 2006; Pessoa et al., 2002), we expectedthat an amygdala response to negative emotional faces would be stronger in those participantswho were forced to actively attend to the emotional content of the faces (i.e., a greater effectsize). All other procedures were identical to Experiment 1.
Cornwell et al. Page 8
Brain Res. Author manuscript; available in PMC 2009 December 9.
NIH
-PA Author Manuscript
NIH
-PA Author Manuscript
NIH
-PA Author Manuscript
Participants—Eight additional healthy participants (3 women), mean age = 25.4 yrs, range= 22 to 32 yrs) were recruited for Experiment 2. One participant was excluded from analysisfor excessive head movement, leaving 7 participants (3 women, mean age = 24.4 yrs, range =22 to 29 yrs).
AcknowledgementsThis research was supported by the intramural research program at the National Institute of Mental Health. We wouldlike to thank Arter Biggs for his assistance in obtaining MRIs from participants. We are grateful to Stephen Robinson(Neuromagnetism Laboratory, Department of Neurology, Henry Ford Hospital, Detroit, MI) for developing theSAMerf program that we used for event-related beamformer analysis.
Literature ReferencesAdolphs R. Recognizing emotion from facial expressions: Psychological and neurological mechanisms.
Behav Cogn Neurosci Rev 2002;1(1):21–62. [PubMed: 17715585]Baas D, Aleman A, Kahn RS. Lateralization of amygdala activation: a systematic review of functional
neuroimaging studies. Brain Res Rev 2004;45:96–103. [PubMed: 15145620]Bertolino A, Arciero G, Rubino V, Latorre V, De Candia M, Mazzola V, et al. Variation of human
amygdala response during threatening stimuli as a function of 5’HTTLPR genotype and personalitystyle. Biol Psychiatry 2005;57:1517–1525. [PubMed: 15953488]
Buchel C, Morris J, Dolan RJ, Friston KJ. Brain systems mediating aversive conditioning: an event-related fMRI study. Neuron 1998;20:947–957. [PubMed: 9620699]
Calder AJ, Lawrence AD, Young AW. Neuropsychology of fear and loathing. Nat Neurosci Rev2001;2:352–363.
Cheyne D, Bakhtazad L, Gaetz W. Spatiotemporal mapping of cortical activity accompanying voluntarymovements using an event-related beamforming approach. Hum Brain Mapp 2006;27:213–229.[PubMed: 16037985]
Cornwell BR, Baas JM, Johnson L, Holroyd T, Carver FW, Lissek S, Grillon C. Neural responses toauditory stimulus deviance under threat of electric shock revealed by spatially-filteredmagnetoencephalography. NeuroImage 2007;37:282–289. [PubMed: 17566766]
Cornwell BR, Johnson LL, Holroyd T, Carver FW, Grillon C. Human hippocampal and parahippocampaltheta during goal-directed spatial navigation predicts performance on a virtual Morris water maze. JNeurosci 2008;28:5983–5990. [PubMed: 18524903]
Cox RW. AFNI: Software for analysis and visualization of functional magnetic resonance neuroimages.Comput Biomed Res 1996;29:162–173. [PubMed: 8812068]
Davidson RJ, Irwin W. The functional neuroanatomy of emotion and affective style. Trends Cogn Sci1999;3(1):11–21. [PubMed: 10234222]
First, MB.; Spitzer, RI.; Williams, JBW.; Gibbon, M. Structured clinical interview fro DSM-IV (SCID).Washington, DC: American Psychiatric Association; 1995.
Garolera M, Coppola R, Munoz KE, Elvevag B, Carver FW, Weinberger DR, Goldberg TE. Amygdalaactivation in affective priming: a magnetoencephalogram study. Neuroreport 2007;18:1449–1453.[PubMed: 17712272]
Genovese CR, Lazar NA, Nichols T. Thresholding of statistical maps in functional neuroimaging usingfalse discovery rates. Neuroimage 2002;15:772–786. [PubMed: 11906219]
Halgren E, Bauden P, Heit G, Clark JM, Marinkovic K. Spatiotemporal stages of face and wordprocessing. 1. Depth-recorded potentials in the human occipital, temporal and parietal lobes. J Physiol1994;88:1–50.
Hariri AR, Mattay VS, Tessitore A, Kolachana B, Fera F, Goldman D, Egan MF, Weinberger DR.Serotonin transporter genetic variation and the response of the human amygdala. Science 2002a;297(5580):400–403. [PubMed: 12130784]
Hariri AR, Tessitore A, Mattay VS, Fera F, Weinberger DR. The amygdala response to emotional stimuli:a comparison of faces and scenes. NeuroImage 2002b;17:317–323. [PubMed: 12482086]
Cornwell et al. Page 9
Brain Res. Author manuscript; available in PMC 2009 December 9.
NIH
-PA Author Manuscript
NIH
-PA Author Manuscript
NIH
-PA Author Manuscript
Haxby JV, Hoffman EA, Gobbini MI. The distributed human neural system for face perception. TrendsCog Sci 2000;4:223–233.
Hillebrand A, Singh KD, Holliday IE, Furlong PL, Barnes GR. A new approach to neuroimaging withmagnetoencephalography. Hum Brain Mapp 2005;25:199–211. [PubMed: 15846771]
Ioannides AA, Liu LC, Kwapien J, Drozdz S, Streit M. Coupling of regional activations in a human brainduring an object and face affect recognition task. Hum Brain Mapp 2000;11:77–92. [PubMed:11061335]
Krolak-Salmon P, Henaff MA, Vighetto A, Bertrand B, Mauguiere F. Early amygdala reaction to fearspreading in occipital, temporal, and frontal cortex: A depth electrode ERP study in human. Neuron2004;42(4):665–676. [PubMed: 15157426]
LaBar KS, Gatenby JC, Gore JC, LeDoux JE, Phelphs EA. Human amygdala activation duringconditioned fear acquisition and extinction: a mixed-trial fMRI study. Neuron 1998;20:937–945.[PubMed: 9620698]
Lancaster JL, Woldorff MG, Parsons LM, Liotti M, Freitas CS, Rainey L, Kochunov PV, Nickerson D,Mikiten SA, Fox PT. Automated Talairach atlas labels for functional brain mapping. Hum BrainMapp 2000;10:120–131. [PubMed: 10912591]
Liu J, Harris A, Kanwisher N. Stages of processing in face perception: an MEG study. Nat Neurosci2002;5(9):910–916. [PubMed: 12195430]
Logan BR, Rowe DB. An evaluation of thresholding techniques in fMRI analysis. Neuroimage2004;22:95–108. [PubMed: 15110000]
Luo Q, Holroyd T, Jones M, Hendler T, Blair J. Neural dynamics for facial threat processing as revealedby gamma band synchronization using MEG. NeuroImage 2007;34(2):839–847. [PubMed:17095252]
Moses SN, Houck JM, Martin T, Hanlon FM, Ryan JD, Thoma RJ, et al. Dynamic neural activity recordedfrom human amygdala during fear conditioning using magnetoencephalography. Brain Res Bull2007;71:452–460. [PubMed: 17259013]
Pessoa L, Japee S, Sturman D, Ungerleider LG. Target visibility and visual awareness modulate amygdalaresponses to fearful faces. Cereb Cortex 2006;16(3):366–375. [PubMed: 15930371]
Pessoa L, McKenna M, Gutierrez E, Ungerleider LG. Neural processing of emotional faces requiresattention. Proc Natl Acad Sci USA 2002;99:1458–1463.
Robinson SE. Localization of event-related activity by SAM(erf). Neurol Clin Neurophysiol 2004;109Robinson, SE.; Vrba, J. Functional neuroimaging by synthetic aperture magnetometry. In: Yoshimine,
T.; Kotani, M.; Kuriki, S.; Karibe, H.; Nakasato, N., editors. Recent Advances in Biomagnetism:Proceedings from the 11th International Conference on Biomagnetism. Sendai: Tokoku UniversityPress; 1999. p. 302-305.
Sekihara K, Nagarajan SS, Poeppel D, Marantz A, Miyashita Y. Reconstructing spatio-temporal activitiesof neural sources using an MEG vector beamformer technique. IEEE Trans Biomed Eng2001;48:760–771. [PubMed: 11442288]
Sekihara K, Nagarajan SS, Poeppel D, Marantz A, Miyashita Y. Application of an MEG eigenspacebeamformer to reconstructing spatio-temporal activities of neural sources. Hum Brain Mapp 2002;15(4):199–215. [PubMed: 11835609]
Singh KD, Barnes GR, Hillebrand A, Forde EME, Williams AL. Task-related changes in corticalsynchronization are spatially coincident with the hemodynamic response. NeuroImage 2002;16:103–114. [PubMed: 11969322]
Schultz M, Chau W, Graham SJ, McIntosh AR, Ross B, Ishii R, Pantev C. An integrative MEG-fMRIstudy of the primary somatosensory cortex using cross-modal correspondence analysis. NeuroImage2004;22:120–133. [PubMed: 15110002]
Streit M, Dammers J, Simsek-Kraues S, Brinkmeyer J, Wolwer W, Ioannides A. Time course of regionalbrain activations during facial emotion recognition in humans. Neurosci Lett 2003;342(1):101–104.[PubMed: 12727328]
Taniguchi M, Kato A, Fujita N, Hirata M, Tanaka H, Kihara T, et al. Movement-related desynchronizationof the cerebral cortex studied with spatially filtered magnetoencephalography. NeuroImage2000;12:298–306. [PubMed: 10944412]
Cornwell et al. Page 10
Brain Res. Author manuscript; available in PMC 2009 December 9.
NIH
-PA Author Manuscript
NIH
-PA Author Manuscript
NIH
-PA Author Manuscript

Tesche CD, Karhu J. Theta oscillations index human hippocampal activation during a working memorytask. Proc Natl Acad Sci USA 2000;97(2):919–924. [PubMed: 10639180]
Van Veen BD, van Drongelen W, Yuchtman M, Suzuki A. Localization of brain electrical activity vialinearly constrained minimum variante spatial filtering. IEEE Trans Biomed Eng 1997;44:867–880.[PubMed: 9282479]
Vrba J, Robinson SE. Signal processing in magnetoencephalography. Methods 1999;25:249–271.[PubMed: 11812209]
Wager TD, Phan KL, Liberzon I, Taylor SF. Valence, gender, and lateralization of functional brainanatomy in emotion: a meta-analysis of findings from neuroimaging. NeuroImage 2003;19:513–531.[PubMed: 12880784]
Cornwell et al. Page 11
Brain Res. Author manuscript; available in PMC 2009 December 9.
NIH
-PA Author Manuscript
NIH
-PA Author Manuscript
NIH
-PA Author Manuscript

Figure 1.Format of stimulus presentation for face-matching (left) and shape-matching (right) trials.Triads were presented simultaneously and participants were instructed to match the top image(target image) with either the bottom left or bottom right image by a corresponding buttonpress.
Cornwell et al. Page 12
Brain Res. Author manuscript; available in PMC 2009 December 9.
NIH
-PA Author Manuscript
NIH
-PA Author Manuscript
NIH
-PA Author Manuscript

Figure 2.Axial and coronal views of left amygdala activity for both blocked and randomized runs inExperiment 1 and Experiment 2. Color map represents magnitude of normalized log10 powerratios. Anatomical underlays are averaged anatomical images across participants within anexperiment. Images are in radiological view (right = left, and vice versa). Coordinates are inTalairach space.
Cornwell et al. Page 13
Brain Res. Author manuscript; available in PMC 2009 December 9.
NIH
-PA Author Manuscript
NIH
-PA Author Manuscript
NIH
-PA Author Manuscript

Figure 3.Axial and sagittal views showing significantly greater evoked activity to negative facescompared to shapes 100-200ms post-stimulus onset that was common to both the blocked andrandomized runs and both experiments. Color map represents mean normalized log10 powerratios for the blocked and randomized data. Anatomical underlays are averaged structuralimages across participants within an experiment, and shown in radiological orientation.Coordinates are in Talairach space. FG = fusiform gyrus, STG/MTG = superior temporal gyrus/middle temporal gyrus.
Cornwell et al. Page 14
Brain Res. Author manuscript; available in PMC 2009 December 9.
NIH
-PA Author Manuscript
NIH
-PA Author Manuscript
NIH
-PA Author Manuscript

Figure 4.Grand-averaged waveforms of left amygdala and left fusiform gyrus activity for the blocked(top) and randomized runs (bottom) and for Experiment 1 (left) and Experiment 2 (right).Virtual sensor time series for each structure were projected from the location in Talairachstandardized space of the group statistical local maxima for each run and experiment. Pleasesee Results for the specific coordinates. AM = amygdala, FG = fusiform gyrus.
Cornwell et al. Page 15
Brain Res. Author manuscript; available in PMC 2009 December 9.
NIH
-PA Author Manuscript
NIH
-PA Author Manuscript
NIH
-PA Author Manuscript
Figure 5.Single-subject images, in axial and coronal views, showing local maxima in the left amygdala.Normalized power ratio data are overlayed on individual anatomical MRIs in original subjectspace, shown in radiological orientation.
Cornwell et al. Page 16
Brain Res. Author manuscript; available in PMC 2009 December 9.
NIH
-PA Author Manuscript
NIH
-PA Author Manuscript
NIH
-PA Author Manuscript

NIH
-PA Author Manuscript
NIH
-PA Author Manuscript
NIH
-PA Author Manuscript
Cornwell et al. Page 17Ta
ble
1Pe
ak d
iffer
entia
l act
ivat
ions
occ
urrin
g 10
0-20
0ms r
elat
ive
to st
imul
us o
nset
com
parin
g fa
ce-e
voke
d ac
tivity
to sh
ape-
evok
ed a
ctiv
ity.
Reg
ion
Run
xy
zPo
wer
Rat
ioSt
uden
t t
Expe
rim
ent 1
Am
ygda
la L
Blo
cked
-21
-2-1
40.
813.
12
Ran
dom
ized
-28
-2-1
40.
994.
16
Cer
ebel
lum
LB
lock
ed-4
2-4
3-2
90.
873.
15
Ran
dom
ized
-42
-50
-27
1.16
3.86
Insu
la R
Blo
cked
41-7
11.
234.
02
Ran
dom
ized
36-7
70.
915.
59
Post
erio
r cin
gula
te R
Blo
cked
14-4
520
1.01
4.27
Ran
dom
ized
14-4
520
1.33
4.18
Supe
rior T
empo
ral R
Blo
cked
43-5
013
1.25
4.23
Ran
dom
ized
50-4
88
1.26
4.08
Expe
rim
ent 2
Am
ygda
la L
Blo
cked
-21
-1-1
11.
863.
86
Ran
dom
ized
-21
-1-1
12.
158.
89
Cer
ebel
lum
RB
lock
ed13
-58
-30
0.87
4.75
Ran
dom
ized
651
-30
1.07
3.32
Cin
gula
te L
Blo
cked
-19
-45
261.
825.
61
Ran
dom
ized
-20
-43
261.
633.
75
Fusi
form
LB
lock
ed-3
1-4
5-1
51.
856.
34
Ran
dom
ized
-46
-50
-15
1.47
4.97
Fusi
form
RB
lock
ed34
-57
-14
1.71
3.95
Ran
dom
ized
49-5
0-2
11.
753.
71
Infe
rior p
arie
tal R
Blo
cked
42-3
127
1.61
5.88
Ran
dom
ized
49-3
721
2.06
14.3
4
Insu
la R
Blo
cked
35-1
131.
766.
89
Ran
dom
ized
35-7
221.
627.
40
Mid
dle
occi
pita
l RB
lock
ed28
-84
-81.
647.
47
Ran
dom
ized
28-8
4-8
1.53
6.43
Mid
dle
occi
pita
l RB
lock
ed35
-71
-10
1.68
5.90
Ran
dom
ized
35-7
9-1
1.56
5.01
Brain Res. Author manuscript; available in PMC 2009 December 9.
NIH
-PA Author Manuscript
NIH
-PA Author Manuscript
NIH
-PA Author Manuscript
Cornwell et al. Page 18
Reg
ion
Run
xy
zPo
wer
Rat
ioSt
uden
t t
Mid
dle
tem
pora
l RB
lock
ed55
-56
61.
512.
93
Ran
dom
ized
44-4
411
2.07
6.07
Para
hipp
ocam
pal L
Blo
cked
-22
-41
-81.
793.
38
Ran
dom
ized
-28
-41
-81.
224.
46
Not
e: P
ower
ratio
s are
nor
mal
ized
or s
cale
d to
the
with
in-v
olum
e st
anda
rd d
evia
tion.
Coo
rdin
ates
are
in T
alai
rach
spac
e.
Brain Res. Author manuscript; available in PMC 2009 December 9.
Related Documents


![Self-Regulation of Amygdala Activation Using Real-Time ...€¦ · amygdala participates in more detailed and elaborate stimulus evaluation [20,26,27]. The involvement of the amygdala](https://static.cupdf.com/doc/110x72/5fa8a495e8acaa50d8405bd2/self-regulation-of-amygdala-activation-using-real-time-amygdala-participates.jpg)