Government of India TB INDIA 2014 Revised National TB Control Programme ANNUAL STATUS REPORT Reach the Unreached FIND, TREAT, CURE TB, SAVE LIVES Central TB Division Directorate General of Health Services, Ministry of Health and Family Welfare, Nirman Bhavan, New Delhi–110108 www.tbcindia.nic.in A L E T H H L M A I S N S O I I O T A N N jk"Vªh; LokLF; fe'ku

Welcome message from author
This document is posted to help you gain knowledge. Please leave a comment to let me know what you think about it! Share it to your friends and learn new things together.
Transcript
Go
vern
men
t of In
dia
TB IN
DIA 2
014R
evise
d N
atio
nal T
B C
on
trol P
rog
ram
me
AN
NU
AL S
TA
TU
S R
EP
OR
T
Reach
the
Un
reach
ed
FIN
D, T
REA
T, C
UR
E T
B, S
AV
E L
IVES
Cen
tral T
B D
ivisio
nD
irecto
rate
Gen
era
l of H
ealth
Serv
ices,
Min
istry o
f Health
an
d Fa
mily
Welfa
re, N
irman
Bh
avan
, New
Delh
i–11
01
08
ww
w.tb
cind
ia.n
ic.in
AL
ET
HH
LM
A
IS
N
S
OI
IO
TA
N
N
jk"Vªh;
LokLF;
fe'ku

NIK
SH
AY
gets
NA
TIO
NA
L e
GO
VER
NA
NC
E A
WA
RD
(GO
LD
) 20
13
-14
for H
ealth
care
NIK
SH
AY
was h
on
ou
red
with
Natio
nal e
-Go
vern
an
ce A
ward
(Go
ld) 2
013-1
4 d
urin
g th
e
Natio
nal C
on
fere
nce
on
e-G
ove
rnan
ce h
eld
at K
och
i on
30-3
1 Ja
nu
ary, 2
014 u
nd
er ca
teg
ory
Secto
ral A
ward
– Health
care
.

TB Annual Report
TB INDIA 2014Revised N
ational TB Control Programm
e
AN
NU
AL STATU
S REPORT
Reach the UnreachedFIN
D, TREAT, CU
RE TB, SAVE LIV
ES
Central TB Division
Directorate G
eneral of Health Services,
Ministry of H
ealth and Family W
elfare, Nirm
an Bhavan, New
Delhi–110108
ww
w.tbcindia.nic.in

This Publication can be obtained from
Central TB D
ivisionD
irectorate General of H
ealth ServicesM
inistry of Health and Fam
ily Welfare
Nirm
an Bhavan, New
Delhi–110108
http://ww
w.tbcindia.nic.inM
arch 2014
© Central TB D
ivision, Directorate G
eneral of Health Services
Printed by Mehra Im
pressions, New
Delhi. (w
ww.m
ehraimpressions.com
)
TB Annual Report


TB Annual Report


TB Annual Report


TB Annual Report


TB Annual Report


TB Annual Report
Ab
br
ev
iAt
ion
sACSM
Advocacy, Com
munication and Social M
obilizationAID
S Acquired Im
muno D
eficiency Syndrome
AIIMS
All India Institute of Medical Sciences
ANSV
Annual Negative Slide Volum
eART
Anti-Retroviral TherapyARTI
Annual Risk of Tuberculosis InfectionASH
A Accredited Social H
ealth ActivistCBCI
Catholic Bishop's Conference of IndiaCG
HS
Central Governm
ent Health Schem
eCH
AICatholic H
ealth Association of IndiaCH
C Com
munity H
ealth CentreCII
Confederation of Indian IndustriesCM
AIChristian M
edical Association of IndiaCTD
Central TB Division
DALYsD
isability Adjusted Life YearsD
BSD
omestic Budgeting Source
DD
GD
eputy Director G
eneralD
FID
Departm
ent for International Developm
entD
GH
S D
irector General of H
ealth ServicesD
MC
Designated M
icroscopy CentreD
OTS D
irectly Observed Treatment Short Course
DRS
Drug Resistance Surveillance
DRTB
Drug Resistant Tuberculosis
DST
Drug Susceptibility Testing
DTC D
istrict Tuberculosis CentreDTO
District Tuberculosis Officer
E Etham
butolEPTB
Extra-pulmonary Tuberculosis
EQA External Quality Assessm
entG
MSD
G
overnment M
edical Store Depot
GoI
Governm
ent of IndiaG
FATMThe G
lobal Fund to Fight against AIDS, Tuberculosis and M
alariaH
IsoniazidH
BCs H
igh Burden CountriesH
IV H
uman Im
muno D
eficiency VirusH
RDH
uman Resource D
evelopment
IACIEC Advisory Com
mittee
ICB International Com
petitive BiddingICELT
International Centre for Excellence in Laboratory TrainingICM
RIndian Council of M
edical ResearchICTC
Integrated Counselling and Testing Centre ID
SP Integrated D
isease Surveillance ProjectIEC
Information, Education and Com
munication
IMA
Indian Medical Association
IPTIsoniazid Preventive Therapy

IRLInterm
ediate Reference LaboratoryIUALTD
International Union Against Tuberculosis and Lung D
iseaseJM
MJoint M
onitoring Mission
KAPKnow
ledge, Attitude and PracticesLT
Laboratory TechnicianM
DG
sM
illennium D
evelopment G
oalsM
DRTB
Multi D
rug Resistant TBM
IS M
anagement Inform
ation SystemM
O M
edical OfficerM
oHFW
M
inistry of Health and Fam
ily Welfare
MOTC
Medical Officer-Tuberculosis Control
MoU
Mem
orandum of Understanding
NACO
National AID
S Control OrganisationN
ACPN
ational AIDS Control Program
me
NCD
CN
ational Centre for Disease Control
NEP
New
Extra Pulmonary
NG
O N
on Governm
ental OrganisationN
IRT N
ational Institute of Research in TuberculosisN
JIMOD
National Jalm
a Institute of Mycobacterial and Other D
iseasesN
RHM
National Rural H
ealth Mission
NRL
National Reference Laboratory
NSN
New
Smear N
egativeN
SP N
ew Sm
ear PositiveN
TFN
ational Task ForceN
TIN
ational Tuberculosis InstituteN
TPN
ational Tuberculosis Programm
eN
UHM
National Urban H
ealth Mission
OROperational Research
OSEOn-Site Evaluation
PHC
Primary H
ealth CentrePH
I Peripheral H
ealth InstitutionPLH
IVPeople Living w
ith HIV and AID
SPP
Private PractitionerPPM
Public-Private Mix
PSUPublic Sector Undertaking
PTBPulm
onary TuberculosisPW
B Patient-W
ise BoxQA
Quality AssuranceR
Rifampicin
RBRCRandom
Blinded Re-CheckingRCH
Reproductive and Child Health
RNTCP
Revised National Tuberculosis Control Program
me
S Streptom
ycinSD
SState D
rug StoreSH
Gs
Self Help G
roups
Ab
br
ev
iAt
ion
s

TB Annual Report
SOPStandard Operating Procedure
SPRSlide Positivity Rate
STCState TB Cell
STDC
State Tuberculosis Training & D
emonstration Centre
STFState Task Force
STLSSenior TB Laboratory Supervisor
STOState TB Officer
STS Senior Treatm
ent SupervisorTB
TuberculosisTU
Tuberculosis UnitUH
CUrban H
ealth CentreUN
OPSUnited N
ations Office for Project ServicesUSAID
United States Agency for International D
evelopment
WH
OW
orld Health Organization
WVI
World Vision India
XDR-TB
Extensively Drug Resistant TB
ZPyrazinam
ideZTF
Zonal Task Force
Ab
br
ev
iAt
ion
s


TB Annual Report
Central TB Division is publishing Annual Status Report of Revised
National TB Control Program
me since year 2001. On W
orld TB D
ay, the 24th March of 2014; this 14th report is being published.
Important indicators of program
me perform
ance are continued in this report w
ith trends (tabular and graphical) over years in the chapter on RN
TCP performance. H
owever, there are certain changes
in this report as compared to previous reports. N
ew indicators on
TB notification by private sectors have been included e.g. number of
private health facilities (laboratories, clinics, hospitals etc) registered w
ith RNTCP as w
ell as number of TB patients notified by these private
health facilities. This inclusion of notification from private sector is
also in sync with the W
orld TB Day them
e on missing three m
illion, one m
illion of which are estim
ated to be in India. Though notification rate per 1,00,000 population at national level is m
uch less as compared
to RNTCP patient notification, there has been considerable increase
in private sector notification in 2013 as compared to 2012. As the
case based surveillance system is established across all districts in
the country, more can be know
n about the practices in private sector and appropriate steps can be taken by the program
me to prom
ote diagnostic and treatm
ent practices as per ‘Standards for TB Care in India’.
As per WH
O estimations, Tuberculosis prevalence per lakh population
has reduced from 465 in year 1990 to 230 in 2012. In absolute
numbers, prevalence has reduced from
40 lakhs to 28 lakhs annually.Incidence per lakh population has reduced from
216 in year 1990 to 176 in 2012.Tuberculosis m
ortality per lakh population has reduced from
38 in year 1990 to 22 in 2012. In absolute numbers, m
orality due to TB has reduced from
3.3 lakhs to 2.7 lakhs annually.
ex
ec
ut
ive
s
um
mA
ry

In 2013, TB suspects examination rate has further increased to 651 per 100,000 population. A
total of 928190 smear positive TB patients w
ere diagnosed and 14,10,880 patients were registered
for treatment under RN
TCP. Total case notification rate per 1,00,000 population was 113 w
hich is decreasing since last 5 years. Incident TB case notification rate is also declining since last 5-6 years and in 2013 it w
as 91 per 1,00,000 population. Overall success rate of new and retreatm
ent TB cases is 88%
and 70% respectively.
TB-HIV coordination is increm
entally improving w
ith 60% of the patients w
ith known H
IV status, and 90%
of the HIV positive TB patients receiving Cotrim
oxazole Preventive Therapy (CPT), and 84%
receiving Anti-Retroviral Therapy (ART). How
ever,outcomes of H
IV positive TB patients continue to be poorer w
ith less than 80% success rate am
ongst the new patients. Program
me is considering to
pilot daily anti-TB regimen to im
prove these outcomes.
Among new
TB cases 5% of patients w
ere in pediatric age-group (0-14 yrs).
After complete geographical coverage of the country for PM
DT services, number of M
DR TB suspects
who w
ere offered DST increased in 2013 w
ith diagnosis of 23289 MD
R TB cases, of which 20763
were put on treatm
ent. With early diagnosis of M
DR TB, the outcom
es of treatment are expected to
improve, how
ever mortality and default are still around 20%
each.
Contribution of partners like IMA, The Union, W
orld Vision, FIND
, PATH, CBCI-CARD
, IHBP and others
have been described in details in the chapter of partnerships. Cases studies are also shared with
intention of cross learning and motivating those w
ho work for TB control in India. Various effective
strategies are illustrated in the chapter relevant on advocacy, comm
unication and social mobilization
though these are only examples and m
any success stories remain unheard across the country.
Chapter on financial planning and managem
ent describes important decisions including the details
of 12th Five Year Plan budget of Rs.4500/- crores and its components. Also financial outlay of year
2013-14 is detailed State/UT wise.
In this report many repetitions from
previous annual reports have been avoided as these are already available on http://w
ww.tbcindia.nic.in w
ebsite and other programm
e documents and training
modules.
Executive summ
ary

TB Annual Report
co
nt
en
ts
Foreword, m
essages, preface
Abbreviations
Executive summ
ary
1. Central TB D
ivision: Activities in 2013
2. TB disease burden in India
3. RNTCP im
plementation status
3.1 Case detection and treatment
3.2 Programatic M
anagement of D
rug Resistant TB
3.3 TB-HIV
3.4 Childhood TB
3.5 Partnerships
3.6 Case studies
3.7 ACSM
3.8 Financial planning &
managem
ent
4. TB Surveillance in India
4.1 Nikshay
4.2 TB Notification
5. RN
TCP Performance (N
otification and treatment
outcome trends)
6. State w
ise and district wise perform
ance indicators (2013)
1711111720242735384045454851
65


TB Annual Report1
Ja
nu
ary
1. The first m
eeting of the National Expert Com
mittee on D
iagnosis and Treatm
ent of Tuberculosis under RNTCP w
as held at Nirm
an Bhaw
an, New
Delhi on 3rd and 4th January 2013. Key policy
decisions were taken during the deliberations by the experts in light
of the recent scientific evidences pertaining to diagnosis, follow-
up, use of newer rapid diagnostics under RN
TCP, identification of tw
o additional National Reference Laboratories, revision of TB
case definitions, scale-up for universal access of PMDT services
in India and adoption of recently developed Standards of TB Care in India in a national consultation m
ode under RNTCP.
2. RN
TCP Bi-annual
National
Review
meeting
of STOs
and Consultants w
as held from 9-11 January 2013 at N
ew D
elhi. All STOs w
ere updated with changes in strategies and objectives
under 12th Five Year Plan. Brainstorming group w
orks were
conducted to devise implem
entable micro-plans.
3. The Regional PM
DT Review M
eeting was conducted for States
of the East and NE zones at Kolkata from
24–25 January 2013 to intensively review
the status of scale-up and quality of im
plementation of PM
DT services in the States of the zone and also to address critical bottlenecks through support from
CTD,
States and programm
e partners.
4. The N
ational Task Force for involvement of M
edical Colleges was
organized from 31st Jan. to 1st Feb. 2013 at Jaipur, Rajasthan.
The workshop aim
ed to review the progress since the last
National Task Force m
eeting in 2011 and develop the action plan for active involvem
ent of medical colleges.
Ch
ap
te
r 1
: C
en
tr
al
tB
D
ivis
ion
: aC
tiv
itie
s
un
De
rt
ak
en
in
20
13

2
5. The N
ational Research Comm
ittee meeting w
as held on 28th January 2013. The experts reviewed and
discussed the new and revised research proposals and an im
petus to research agenda was finalized.
Fe
bru
ary
6. The Regional PM
DT Review M
eeting was conducted for States of south zone at Trivandrum
from 14–15
February and west zone at Aurangabad from
21–22 February to intensively review the status of scale-up
and quality of implem
entation of PMDT services in the States of the zones and to also address critical
bottlenecks through support from CTD
, States and programm
e partners.
7. A special w
orkshop was held at M
umbai on 24–25 February to strengthen the urban TB control system
s with
special focus on clinically and socially vulnerable slum population and develop a com
prehensive plan for universal access to quality TB care in M
umbai w
ith support and active participation of CTD, N
TI Bangalore, W
HO India, M
aharashtra State TB Cell, eminent private and public sector providers, im
plementation partners
and donors.
8. Training of m
aster trainers for the comm
unity pharmacist’s partnership w
ith RNTCP held on 18 February
under the chairmanship of D
r. Jagdish Prasad, Director G
eneral of Health Services, G
overnment of India.
Ma
rch
9. The Central Internal Evaluation of H
aryana was held from
4th to 8th March to evaluate the program
me
performance and im
plementation in the State. Tw
o Districts in the State, Karnal and H
isar were evaluated
along with the State level institutions.
10. The Regional PMDT Review
Meeting w
as conducted for States of North zone at Lucknow
from 28th February
to 1st March to intensively review
the status of scale-up and quality of implem
entation of PMDT services
in the States of the zone and also to address critical bottlenecks through support from CTD
, State and program
me partners.
11. Nationw
ide coverage of programm
atic managem
ent of Drug Resistant (D
R) TB services under RNTCP w
as achieved on 15th M
arch 2013.
ap
ril12. M
eeting of DR TB Survey w
as held on 5th April by the National Oversight G
roup to review changes required
in DRS Protocol as w
ell as logistics and implem
entation issues.
13. National PM
DT Trainings scheduled and held at Calicut in Kerala, Ahmedabad in G
ujarat and LRS in New
D
elhi.
14. The record of proceedings (ROP) of 34 States has been approved in National Program
me Coordination
comm
ittee meetings.
15. The TB Laboratory Managem
ent Training held at Mum
bai from 8th to 12th April.
16. An experience sharing workshop to pilot the integration of Tuberculosis Units w
ith the existing administrative
blocks held on the 4th April in New
Delhi.
17. The Central Internal Evaluation of Maharashtra w
as held from 22nd to 27th April to evaluate the program
me
performance and im
plementation in the State along w
ith State-level institutions.
18. The TB-Diabetes Screening project dissem
ination meeting organized by the Union w
as held on 25 April.
Chapter1: Central TB D
ivision: Activities undertaken in 2013

TB Annual Report3
Ma
y19. D
issemination of the D
R TB directory on availability of PMDT services on 16th M
ay 2013.
20. One batch of the RNTCP M
odular Training organized at the National Tuberculosis Institute from
the 6 to 18 M
ay.
21. Renewal of M
OU for two years w
ith the Indian Pharmaceutical Association, SEAR Pharm
a, All India Organization of Chem
ist and Druggist, Pharm
acy Council of India for involvement of com
munity pharm
acists in RN
TCP.
22. Extension of single stream funding TB G
rant of Global Fund w
as approved by the Global Fund Board - the
total value of the project is 226.74 million USD
.
23. The Central Internal Evaluation of Him
achal Pradesh was held from
27 to 31May to evaluate program
me
performance and im
plementation in the State along w
ith State-level Institutions.
Ju
ne
24. The Central Internal Evaluation of Kerala was held from
17 to 21 June to evaluate the programm
e perform
ance and implem
entation in the State along with State-level Institutions.
25. The first draft of audio-visual training aid for basic modular training of RN
TCP shared on 24th June, as part of the H
uman Resource D
evelopment plan under the 12th FYP.
26. Media advocacy w
orkshop for STOs was conducted in M
umbai on 27-28 June 2013.
Ju
ly27. Seven batches of N
ational training 185 Master Trainers in N
ikshay were conducted by Central TB D
ivision, betw
een 1st July to 25th July at NTI, Bangalore.
28. Meeting of the N
ational Technical Working G
roup on TB-HIV Co-ordination w
as held on 15 July.
29. The National PM
DT trainings scheduled and held from 1st to 5th July at Ahm
edabad (Gujarat), and 22nd to
26th July at Calicut (Kerala).
30. The Central Internal Evaluation of Gujarat w
as held from 22nd to 26th July to evaluate the program
me
performance and im
plementation in the State along w
ith State-level institutions. The CIE team visited
Mehsana and Surat M
unicipal Corporation districts.
au
gu
st31. The RN
TCP Modular Training organized at the N
ational Institute for TB & Respiratory D
iseases (erstwhile
LRS Institute) in New
Delhi from
19th to 31st August
32. National Operational Research dissem
ination workshop held in D
elhi.
33. Meeting of the N
ational Technical Working G
roup on TB-HIV Co-ordination w
as held on 14th August.
34. The Central Internal Evaluation of Chattisgarh was held from
26th to 30th August to evaluate the programm
e perform
ance and implem
entation in the State along with State-level Institutions. D
uring the CIE Mahasam
und and Rajnandgaon D
istricts were evaluated.
35. Medical College Zonal Task Force m
eeting conducted in west zone.
36. The Zonal Operational research workshop w
as held in the South-2 Zone (Thiruvananthapuram).

4
se
pte
mb
er
37. The Medical College Zonal Task Force m
eetings in south-2 and north zones.
38. The Zonal Operational research workshop w
as held in the North Zone (Srinagar).
39. The Central Internal Evaluation of Punjab was held from
23rd to 27th September to evaluate the program
me
performance and im
plementation in the State along w
ith State-level institutions. During the CIE, Taran Taran
and Mohali D
istricts were visited by the evaluation team
.
40. National PM
DT Training held from 2nd to 6th Septem
ber at the National Institute for TB &
Respiratory D
iseases, New
Delhi (erstw
hile LRS Institute) and 23rd-27th September at Ahm
edabad.
41. RNTCP M
odular Training organized at the National Tuberculosis Institute, Bangalore from
the 16th to 28th Septem
ber.
42. The Leadership and Managem
ent course conducted with support from
the Global Fund Round 9 TB G
rant under Project Axshya w
as organised from 16th-20th Septem
ber.
43. Two sensitization w
orkshops for the RNTCP TB Xpert Project organized in Septem
ber for North and South
zones.
44. The National Biannual STO-Consultants’ m
eeting held in Kolkata from 16th-18th Septem
ber.
45. Meeting of the N
ational Research Comm
ittee held at the National Institute for TB &
Respiratory Diseases in
New
Delhi (erstw
hile LRS Institute) on 30th September.
46. The grant agreement of G
FTAM-SSF Phase II w
as signed by India CCM and D
epartment of Econom
ic Affairs and G
FATM for period of 30 m
onths starting 1st April 2013. The total value of the grant is 226.74 million
USD.
oc
tob
er
47. Zonal Task Force workshops for involvem
ent of Medical Colleges in RN
TCP organised at Raipur for East Zone.
48. Zonal Task Force workshops for involvem
ent of Medical Colleges in RN
TCP at Dibrugarh for N
orth-East Zone.
49. Meeting w
ith Rotary India on leadership for care providers in quality TB care in India on 4th October.
50. Review of the activities of the Sub Recipient of G
lobal Fund Project – CBCI CARD Project at the N
ational STPC Review
Meeting at G
haziabad.
51. Interactive session to integration of Pharmacovigilance program
me of India (PvPI) and form
al launch of integration of PVPI and RN
TCP for patient safety.
52. The first meeting of the N
ational ACSM Advisory Com
mittee convened in N
ew D
elhi.
no
vem
be
r53. RN
TCP modular training at N
TI Bangalore organized from 11-23 N
ovember.
54. Central Internal Evaluation of Delhi w
as conducted in two districts - Baba Am
bedkar Hospital Chest Clinic
and Shastri Park Chest Clinic between 11-15 N
ovember.
55. RNTCP M
odular Training at NITRD
, New
Delhi (erstw
hile LRS Institute) organised between 18-30 N
ovember.
Chapter1: Central TB D
ivision: Activities undertaken in 2013
TB Annual Report5
56. ACSM and M
edia Engagement w
orkshop for State IEC and ACSM officers organized in N
ew D
elhi from 19th-
20th Novem
ber.
57. Zonal or capacity building workshop, G
uwahati, Assam
organized.
De
ce
mb
er
58. The Central Internal Evaluation of West Bengal conducted from
9th to 13th Decem
ber. During the CIE, tw
o districts (N
adia and East Mednipur) w
ere visited.
59. Quarterly Review M
eeting of Haryana conducted on 20th D
ecember at the State TB Cell in Panchkula. The
performance of districts of H
aryana was review
ed and feedback was given to D
istrict TB Officers about their respective perform
ance and ways to im
prove it.
60. Training of stakeholders on Pharmacovigilance w
as conducted in two zones - South Zone from
9-10 D
ecember and W
est Zone from 12-13 D
ecember.
61. The Departm
ent of Economic Affairs has approved W
orld Bank support to RNTCP for tw
o years for 100 m
illion USD.

6
TB Annual Report7
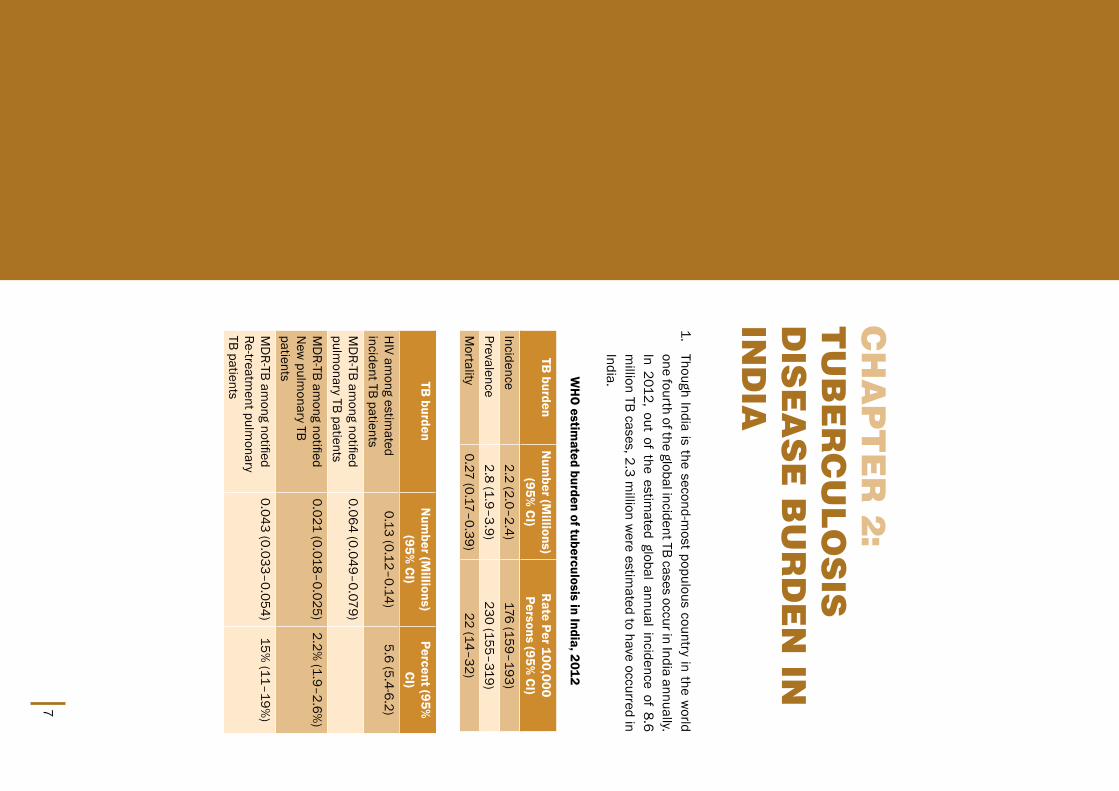
1. Though India is the second-m
ost populous country in the world
one fourth of the global incident TB cases occur in India annually. In 2012, out of the estim
ated global annual incidence of 8.6 m
illion TB cases, 2.3 million w
ere estimated to have occurred in
India.
WH
O estim
ated burden of tuberculosis in India, 2012
Ch
ap
te
r 2
: t
uB
er
Cu
lo
sis
D
ise
as
e B
ur
De
n in
in
Dia
TB burden
Num
ber (Millions)
(95% CI)
Rate Per 100,000
Persons (95% CI)
Incidence2.2 (2.0–2.4)
176 (159–193)Prevalence
2.8 (1.9–3.9) 230 (155–319)
Mortality
0.27 (0.17–0.39)22 (14–32)
TB burden
Num
ber (Millions)
(95% CI)
Percent (95%
CI)H
IV among estim
ated incident TB patients
0.13 (0.12–0.14)5.6 (5.4-6.2)
MD
R-TB among notified
pulmonary TB patients
0.064 (0.049–0.079)
MD
R-TB among notified
New
pulmonary TB
patients
0.021 (0.018–0.025)2.2%
(1.9–2.6%)
MD
R-TB among notified
Re-treatment pulm
onary TB patients
0.043 (0.033–0.054)15%
(11–19%)

8Chapter 2: Tuberculosis disease burden in India
India’s TB control programm
e is on track as far as reduction in disease burden is concerned. There is 42%
reduction in TB mortality rate by 2012 as com
pared to 1990 level. Similarly there is 51%
reduction in TB prevalence rate by 2012 as com
pared to 1990 level.
These estimations w
ere based on RNTCP data, 7 Prevalence surveys in India conducted betw
een 2007-2010, N
ational ARTI surveys, mortality surveys conducted in 2005.
Tuberculosis prevalence per lakh population has reduced from 465 in year 1990 to 230 in 2012. In absolute
numbers, prevalence has reduced from
40 lakhs to 28 lakhs annually.

TB Annual Report9
Tuberculosis incidence per lakh population has reduced from 216 in year 1990 to 176 in 2012.
Tuberculosis mortality per lakh population has reduced from
38 in year 1990 to 22 in 2012. In absolute num
bers, morality due to TB has reduced from
3.3 lakhs to 2.7 lakhs annually.

10

TB Annual Report11
3.1
Ca
se D
ete
ctio
nThe
RNTCP
laboratory netw
ork for
sputum
smear
microscopy
comprises a three-tier system
of National Reference Laboratories
(NRLs), Interm
ediate Reference Laboratories (IRLs) and Designated
Microscopy Centres (D
MCs) offering appropriate, affordable and
accessible quality
assured diagnostic
services. To
align w
ith internationally recom
mended standards of diagnostic practices for
TB, the programm
e supplies quality equipment and reagents to its
nationwide netw
ork of laboratories. An inbuilt routine system has
been designed for sputum m
icroscopy, External Quality Assessment
(EQA) and for supervision and monitoring of diagnostic system
s by RN
TCP Senior TB Laboratory Supervisors (STLSs) locally and by the Interm
ediate and National Reference Laboratories netw
ork at state and higher levels. The program
me has a certification procedure
for Culture and Drug Susceptibility Testing (C&
DST) for solid and
liquid, and Line Probe Assay (LPA) for molecular diagnosis w
ith quality assurance protocol based on the W
HO and G
lobal Laboratory Initiative recom
mendations.
tre
atm
en
t of t
B p
atie
nts u
nd
er
rn
tC
pIN
H (H
), Rifampicin (R), Pyrazinam
ide (Z), Ethambutol, (E) and
streptomycin (S) is used in the treatm
ent of TB patients; all drugs are given three tim
es weekly. A new
case of TB patient will receive 6
months of treatm
ent with 2 m
onths of IP (HRZE) and 4 m
onths of CP (H
R). Re-treatment TB case w
ill receive 8 months of treatm
ent with 3
months of IP (2 m
onth HRZES and 1 m
onths HRZE) and 5 m
onths of CP (H
RE). Drugs are supplied in an individual patient-w
ise box (PWB),
which contain the entire course of treatm
ent for each patient. The PW
B have a colour code indicating the category [Red for Category I and Blue for Category II]. In each PW
B, there are two pouches one for
Ch
ap
te
r 3
: r
nt
Cp
iM
pl
eM
en
ta
tio
n
st
at
us
12
intensive phase (A) and one for continuation phase (B). All doses of the intensive phase and at least the first dose of each w
eek of the continuation phase are given under direct observation by a DOT provider. Follow
up sputum
smear exam
inations are done at the end of the intensive phase (IP), 2 months into the continuation
phase (CP) and at the end of treatment. If the sm
ear is positive at the end of the intensive phase, the same
drugs are given for 1 more m
onth and then the CP is started. The treatment outcom
e is determined according
to the results of the follow-up sm
ear examinations done during treatm
ent. For paediatric TB patients separate PW
B is developed under the programm
e. Asymptom
atic children under 6 years who are household contacts of
smear positive pulm
onary TB patients, chemoprophylaxis w
ith isoniazid (10 mg/kg body w
eight) is administered
daily for a period of 6 months.
In the year 2013 the RNTCP put 1416014 patients on treatm
ent
Quality assured laboratory services: RN
TCP has established a nationwide laboratory netw
ork of over 13,000 D
MCs, w
hich are supervised by the IRLs at the state level and the NRLs and Central TB D
ivision at the national level. The RN
TCP aims to consolidate its laboratory netw
ork and organize a defined hierarchy for conducting sputum
microscopy w
ith external quality assessment (EQA).
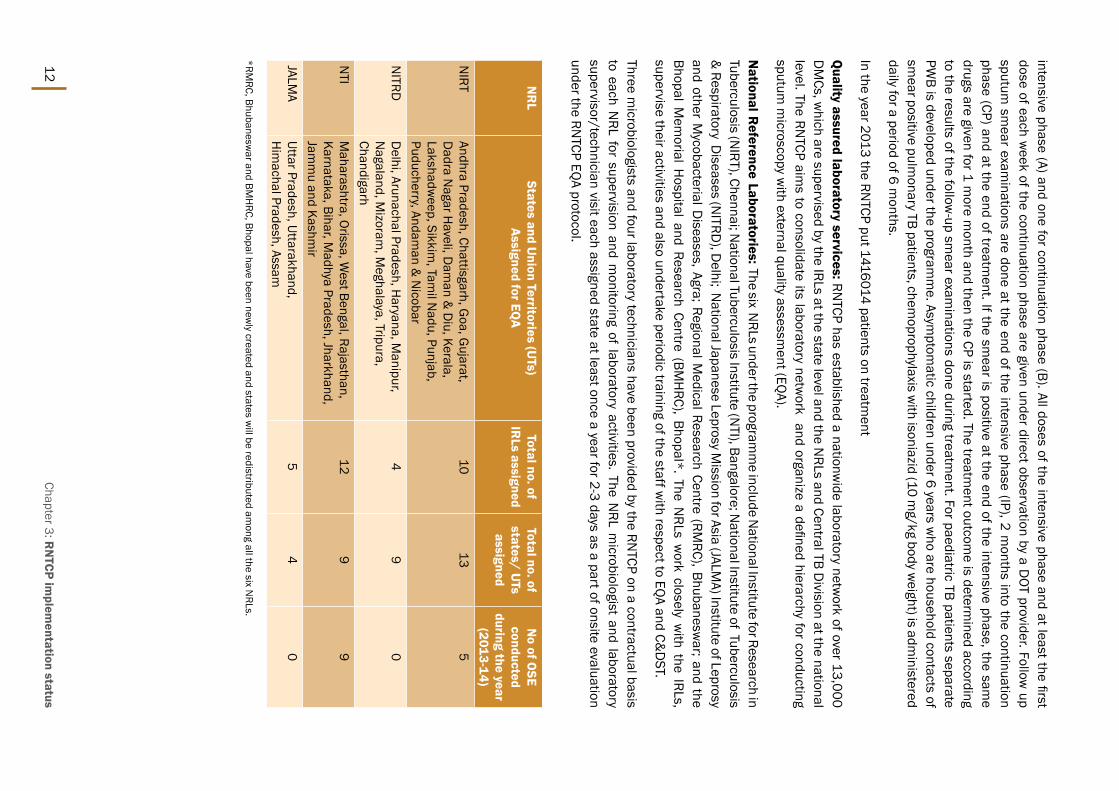
National R
eference Laboratories: The six NRLs under the program
me include N
ational Institute for Research in Tuberculosis (N
IRT), Chennai; National Tuberculosis Institute (N
TI), Bangalore; National Institute of Tuberculosis
& Respiratory D
iseases (NITRD
), Delhi; N
ational Japanese Leprosy Mission for Asia (JALM
A) Institute of Leprosy and other M
ycobacterial Diseases, Agra; Regional M
edical Research Centre (RMRC), Bhubanesw
ar; and the Bhopal M
emorial H
ospital and Research Centre (BMH
RC), Bhopal*. The NRLs w
ork closely with the IRLs,
supervise their activities and also undertake periodic training of the staff with respect to EQA and C&
DST.
Three microbiologists and four laboratory technicians have been provided by the RN
TCP on a contractual basis to each N
RL for supervision and monitoring of laboratory activities. The N
RL microbiologist and laboratory
supervisor/technician visit each assigned state at least once a year for 2-3 days as a part of onsite evaluation under the RN
TCP EQA protocol.
NR
LStates and U
nion Territories (UTs)
Assigned for EQA
Total no. of IR
Ls assignedTotal no. of states/ U
Ts assigned
No of O
SE conducted
during the year (2013-14)
NIRT
Andhra Pradesh, Chattisgarh, Goa, G
ujarat, D
adra Nagar H
aveli, Dam
an & D
iu, Kerala, Lakshadw
eep, Sikkim, Tam
il Nadu, Punjab,
Puducherry, Andaman &
Nicobar
1013
5
NITRD
Delhi, Arunachal Pradesh, H
aryana, Manipur,
Nagaland, M
izoram, M
eghalaya, Tripura, Chandigarh
49
0
NTI
Maharashtra, Orissa, W
est Bengal, Rajasthan, Karnataka, Bihar, M
adhya Pradesh, Jharkhand, Jam
mu and Kashm
ir
129
9
JALMA
Uttar Pradesh, Uttarakhand, H
imachal Pradesh, Assam
54
0
*RMRC, Bhubanesw
ar and BMH
RC, Bhopal have been newly created and states w
ill be redistributed among all the six N
RLs.
Chapter 3: RN
TCP implem
entation status

TB Annual Report13
Figure 1: Schematic representation of the EQ
A reporting process
Intermediate R
eference Laboratory (IRL): One IRL has been designated in the STD
C Public Health Laboratory/
Medical College of the respective state. The functions of IRL include supervision and m
onitoring of EQA activities, M
ycobacterial culture and DST as w
ell as Drug Resistance Surveys (D
RS) in selected states. The IRL conducts regular trainings to ensure that the district and sub-district laboratory staff have the technical know
-how to
efficiently perform sm
ear microscopy activities. Additionally, they undertake onsite evaluation and panel testing
of each district in the state at least once a year.
Culture and DST Laboratories (C &
DST): In addition to IRLs, the RN
TCP also involves the Microbiology
Departm
ent of medical colleges for providing diagnostic services for drug resistance tuberculosis, extra-
pulmonary tuberculosis (EP-TB) and research as w
ell as human resources, equipm
ent and training.
Designated M
icroscopy Centre (DM
C): The most peripheral laboratory under the RN
TCP network is the D
MC,
which serves a population of around 100,000 (50,000 in tribal and hilly areas). Currently, all the districts
in the country are implem
enting EQA. For quality improvem
ent purposes, the NRL onsite evaluation (OSE)
recomm
endations to IRLs and districts are discussed in the RNTCP Laboratory N
RL Coordination Comm
ittee m
eetings and National Expert Com
mittee for D
iagnosis and Managem
ent of Tuberculosis. The quality im
provement w
orkshops for state level TB officers and laboratory managers are conducted at N
RLs based on the observations of the N
RL-OSEs. These workshops focus on issues such as hum
an resource requirements,
training, AMC for binocular m
icroscopes, quality specifications for ZN stains, RBRC blinding and coding issues,
bio-medical w
aste disposal, infection control measures etc. The Quality Assurance activities include:
yOnsite Evaluation
yPanel Testing (PT)
yRandom
Blinded Rechecking (RBRC)

14
The National Laboratory Com
mittee and N
ational DOTS Plus Com
mittee have been m
erged into the National
Expert Comm
ittee on Diagnosis and M
anagement of Tuberculosis under RN
TCP and provides technical guidelines for diagnosis and m
anagement of all form
s of tuberculosis.
There are 51 RNTCP certified C&
DST laboratories in the country, w
hich include laboratories from the public
sector (IRLs and medical colleges), private sector and operated by N
GOs.
Solid Culture Certification: The RNTCP has certified 37 laboratories for solid C &
DST and includes:
yFour N
RLs: NTI, Bangalore; N
IRT, Chennai; JALMA , Agra; N
ITRD, N
ew D
elhi;
y18 IRLs: H
yderabad, Raipur, Delhi, Ahm
edabad, Karnal, Ranchi, Thiruvanthapuram, N
agpur, Pune, Indore, Bhopal, Puducherry, Ajm
er, Cuttack, Lucknow, Kolkata, Dehradun and Chennai.
ySix m
edical colleges: PGIM
ER, Chandigarh; AIIMS-D
ept. of Medicine, N
ew D
elhi; J J Hospital, M
umbai; SM
S, Jaipur; M
PSMC, Jam
nagar; and MG
IMS, W
ardha
yThree-N
GO: BPH
RC, Hyderabad; Choithram
Hospital, Indore; and D
FIT Nellore
yFour ICM
R institutes: RMRC-Port Blair; RM
RC, Dibrugarh; RM
RC, Jabalpur and RMRC Bhubanesw
ar
yTw
o private labs: CMC, Vellore and M
icrocare, Surat
The proficiency testing for solid culture for RNTCP certification is in advance stages for IRLs in Assam
, Karnataka, M
anipur, Arunachal Pradesh, Punjab, Him
achal Pradesh, Srinagar and Jamm
u. The RNTCP also encourages
laboratories from m
edical colleges, ICMR, private sector and N
GOs to apply for certification by providing technical
assistance and training of staff at NRLs.
Liquid Culture Certification: The RNTCP has certified 12 laboratories for liquid culture, w
hich include four NRLs;
Four IRLs (Hyderabad, Ahm
edabad, Nagpur and D
elhi); one medical college (SM
S Jaipur); one NG
O laboratory (P D
Hinduja-M
umbai); and tw
o private laboratories (SRL Mum
bai and Kolkata). The proficiency testing for liquid culture and certification is an ongoing process for IRLs in G
uwahati, Bangalore, Pune, Lucknow, Cuttack, Ajm
er, Kolkata, Karnal, D
elhi, Jamnagar, Chennai, Chandigarh and Indore. The RN
TCP is in the process of establishing 20 Biosafety level-3 laboratories for liquid culture as per its laboratory scale up plan for liquid culture in selected IRL and C &
DST laboratories in m
edical colleges.
Line Probe Assay (LPA): The LPA is a molecular diagnostic test, w
hich can provide the DST results w
ithin one day. The RN
TCP has completed the dem
onstration and evaluation phase in selected laboratories and based upon the evidence, adopted the policy for rapid diagnosis of M
DR-TB by LPA. As on D
ecember 2013, 41 laboratories
have been certified by RNTCP, these include:
yFour N
RLs: NIRT, Chennai; N
TI, Bangalore; JALMA, Agra; and N
ITRD, N
ew D
elhi
y24 IRLs: G
uwahati, H
yderabad, Patna, Raipur, Delhi, Ahm
edabad, Karnal, Dharam
pur, Ranchi, Bengaluru, Thiruvanthapuram
, Indore, Bhopal, Pune, Nagpur, Cuttack, Puducherry, Ajm
er, Chennai, Patiala, Dehradun,
Lucknow, Agra and Kolkata.
y8 m
edical colleges: Vishakhapatnam; AIIM
S-Dept. of M
edicine-New
Delhi; AIIM
S-Dept. of Laboratory
Medicine-N
ew D
elhi; Governm
ent Medical College-Jam
nagar; JJ Hospital-M
umbai; SM
S-Jaipur; PGIM
ER, Chandigarh; KIM
S, Hubli
yFour N
GOs: D
FIT, Nellore; BPH
RC, Hyderabad; N
azerath, Shillong; and PD H
induja, Mum
bai
yOne private m
edical college: Subharti Medical College, M
eerut.
The molecular laboratories are equipped w
ith clean room facility and GT BLOT m
achines to perform upto 90
tests per day for the diagnosis of MD
R-TB.
Second line DST (SLD
): As on Decem
ber 2013, Five laboratories which include three N
RLs (NIRT-Chennai,
NTI-Bangalore and N
ITRD-N
ew D
elhi), One IRLs (Gujarat and Kerala) and one N
GO laboratory (P D
Hinduja) are
performing the second line D
ST in solid and liquid culture. The RNTCP has identified additional laboratories for
performing second line D
ST which include IRLs in Andhra Pradesh, D
elhi, Nagpur- M
aharashtra, Rajasthan,
Chapter 3: RN
TCP implem
entation status
TB Annual Report15
JALMA-Agra; and SM
S Jaipur and JJ Hospital M
umbai m
edical colleges. The RNTCP w
ill provide necessary technical support for certification of SLD
in private and medical colleges as w
ell.
Training: The RNTCP’s N
RLs have conducted trainings for Microbiologists, Senior Laboratory Technicians
and Laboratory Technicians in solid culture DST and EQA in sputum
smear m
icroscopy. In 2013, all reference laboratories conducted m
odular training and trained more than 60 laboratory staff for laboratory procedures.
International Centre for Excellence in Laboratory Training (ICELT): The centre at NTI Bangalore is addressing
the training needs of laboratory staff in newer technologies such as the LPA, CB-N
AAT, Liquid Culture and Biosafety. Over the last year, the centre has trained lab professional from
across the country on LPA and Liquid Culture &
DST.
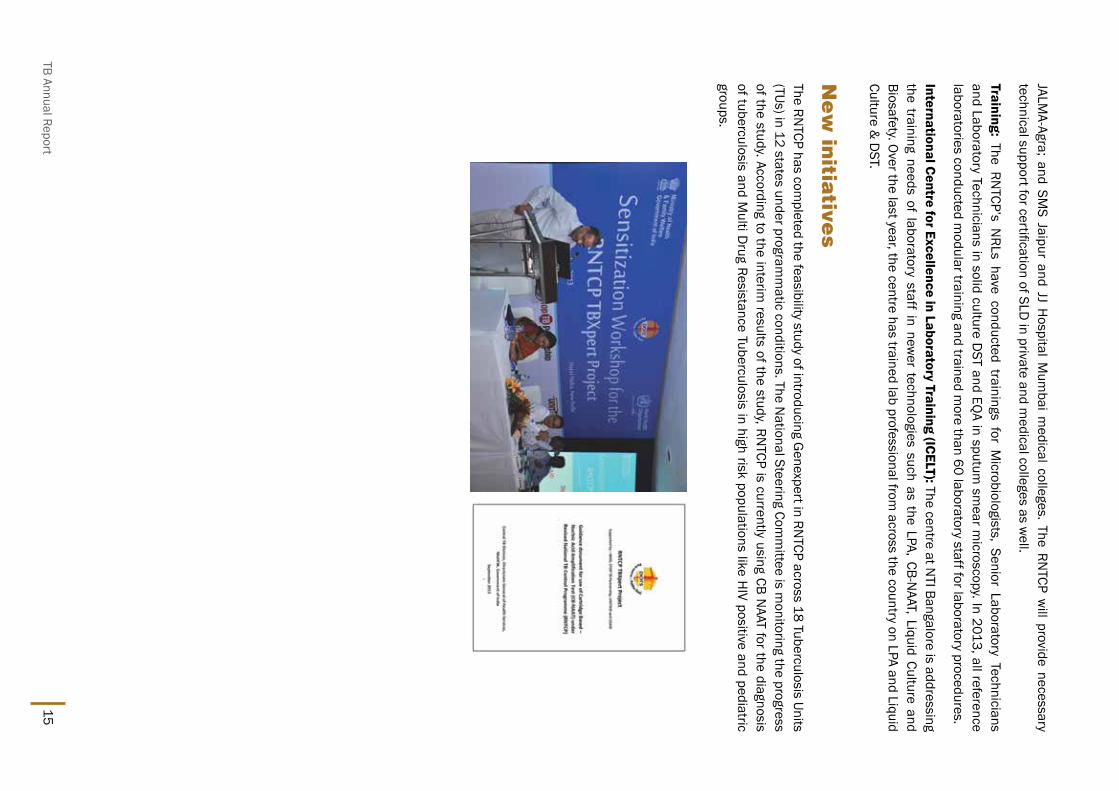
ne
w in
itiative
s The RN
TCP has completed the feasibility study of introducing G
enexpert in RNTCP across 18 Tuberculosis Units
(TUs) in 12 states under programm
atic conditions. The National Steering Com
mittee is m
onitoring the progress of the study. According to the interim
results of the study, RNTCP is currently using CB N
AAT for the diagnosis of tuberculosis and M
ulti Drug Resistance Tuberculosis in high risk populations like H
IV positive and pediatric groups.

16
S.No
StateCB
NAAT Laboratory
1Arunachal Pradesh
IRL Naharlagun
2Andam
an & N
icobarPort Blair, Andam
an & N
icobar3
AssamDTC,Kam
rup; Hajo TU
4Andhra Pradesh
Parvatipuram TU; Vizianagaram
, DTC; Medak DTC
5Bihar
Muzaffarpur, Bhagalpur, Rohtas
6Chhattisgarh
Bilaspur, Bilha TU; Jagdalpur, Bastar7
Delhi
LNJP Chest Clinic; Safdarjung H
ospital; Rajan Babu Institute of Pulmonary
Medicine
8H
aryanaM
eham TU; Rohtak
9H
imachal Pradesh
Indira Gandhi M
edical College, Shimla
10Jharkhand
Bundu; Ranchi, DTC11
KarnatakaN
TI Bangalore; Pavagada; Bijapur; KIMS, H
ubli; IRL Bangalore12
RajasthanJodhpur, DTC; Badgaon; DTC Bikaner
13M
aharashtraAm
ravati; UHC, D
haravi; Centenary Hospital (Shatabdi), G
ovandi; Centenary H
ospital Kandivalli; Kurla Bhabha Hospital; Aurangabad;
Sewree, M
umbai; IRL Pune; BJ M
edical College, Pune14
Madhya Pradesh
Indore, DTC; RMRC, Jabalpur; Rew
a; Sagar; Gw
alior15
Manipur
IRL Imphal
16N
agalandDTC, Kohim
a17
Odhisa Koraput, DTC
18Punjab
Patiala; Amritsar; Faridkot
19Jam
mu &
Kashmir
STDC Srinagar; IRL Jam
mu
20Uttarakhand
New
Tehri; Haldw
ani21
Uttar PradeshBH
U, Varanasi; DTC, Allahabad; Kanpur; Basti; DTC, Ghaziabad; Bareilly
22G
ujaratDTC, Surat; Rajkot; Vadodara; LG
Hospital, M
aninagar, Ahmedabad
23Sikkim
DTC, South Sikkim24
Tamil N
aduM
adurai Medical College; IRL Chennai; Coim
batore; CMC Vellore
25M
izoramD
R-TB Centre Aizawl,
26W
est BengalM
urshidabad; DTC Kolkata; How
rah City; Amtala
List of CBN
AAT laboratories under RN
TCP
The RNTCP w
ith the support from UN
ITAID, W
orld Health Organization (W
HO) and STOP TB Partnership initiated
the RNTCP TB Xpert Project. The project currently provides services for rapid decentralized diagnosis of M
DR-TB.
Under the project, sites are also implem
enting innovative mechanism
to adopt PPM m
odels to provide diagnosis of TB and D
R-TB from the private sector. The program
me has also developed a guidance docum
ent for the use of CB-N
AAT technology and the list of CBNAAT laboratories across the country are listed below
:
Chapter 3: RN
TCP implem
entation status

TB Annual Report17
3.2
pro
gra
mm
atic
Ma
na
ge
me
nt o
f Dru
g r
esista
nt
tB
(pM
Dt
) India is one of the countries in the w
orld with the highest burden of m
ultidrug-resistant tuberculosis (MD
R-TB). As per the W
HO G
lobal Report on Tuberculosis 2013, India accounts for 64,000 MD
RTB cases out of 300,000 cases estim
ated globally to occur among the notified pulm
onary TB cases annually.
rn
tC
p r
esp
on
se to
the
ch
alle
ng
e o
f dru
g re
sistan
t tB
The key focus of RN
TCP combating the challenge of drug resistance is to prevent its em
ergence by providing quality D
OTS diagnostic and treatment services, increasing the visibility and reach of the program
me services
and promoting adherence to International Standards of TB care and Standards of TB Care in India by all
healthcare providers.
Indiscriminate and injudicious use of anti-TB drugs, especially outside the program
me, is a significant contributor
to the emergence of drug resistance TB. The program
me has taken concrete steps to prom
ote rational use of anti-TB drugs; these include the novel initiative of extending universal access to free quality anti-TB drugs across India and the developm
ent of a guidance document, popularly called “The Chennai Consensus Statem
ent”, for healthcare providers on the prevention and m
anagement of drug resistance TB outside the program
me settings.
The programm
e through the aegis of professional medical associations and M
edical Council of India is sensitizing, educating and urging healthcare providers on judicious use of anti-TB drugs. The intervention of drug regulatory authority of the country is being sought to strictly enforce sale of anti-TB drugs against valid prescription through a special directive.
Besides initiating and strengthening measures for prevention of drug resistance, the program
me has
simultaneously initiated diagnostic and treatm
ent services for the managem
ent of MD
R TB. These services are considered “Standard of Care” and are an integral com
ponent of RNTCP to m
anage M/XD
R-TB through the existing program
me.
The PMDT services for quality diagnosis and treatm
ent of drug resistant TB cases were initiated in 2007 in
Gujarat and M
aharashtra. Despite the m
odest progress from 2007 - 2009, the program
me had am
bitious plans to rapidly scale up the PM
DT services in the country. In 2009, it was envisioned that by the end of 2011 the
MD
R TB services will be introduced in all the states across the country in a phased m
anner that was achieved in
time. The plan to extend drug susceptibility testing to all sm
ear positive retreatment cases upon diagnosis, and
all new cases that are sm
ear-positive early during the first-line anti-TB treatment by 2012 also w
as achieved. This is further com
plemented by a nationw
ide laboratory scale up plan developed by the programm
e n to have 43 culture &
DST laboratories (Solid &
LPA techniques including Liquid Culture in 33 labs) in the public health sectors by 2015
Dia
gn
osis o
f dru
g re
sistan
t tB
Currently all re-treatm
ent cases at diagnosis, any smear positive during follow
up, contacts of confirmed D
R TB case and H
IV associated TB cases at diagnosis are included in the definition of presumptive D
RTB cases. For diagnosis of XD
R-TB, DST for second-line drugs is offered to patients on M
DR TB regim
en if culture positive at 6 m
onths or if culture reversion occurs during MD
RTB treatment after culture conversion to negative.
For drug susceptibility testing sputum specim
en is transported to accredited reference laboratory. Rapid m
olecular test like Line Probe Assay (LPA) and CB-NAAT, if available is the preferred D
ST method for first line
drugs. DST for 2nd line drugs is done at 3 N
ational Reference Labs (NIRT-Chennai, N
TI-Bangalore, LRS-Delhi).
DST to second-line drugs w
ill be offered to all confirmed M
DR TB cases at diagnosis as the lab capacity becom
es increasingly available in all 33 labs being developed for liquid culture and D
ST in a phased manner up to 2015.

18 As the laboratory diagnostic capacity got enhanced, districts have moved from
higher risk criteria to lower risk
criteria for early diagnosis of DRTB. By the end of 2013, only 107 districts follow
criteria A, 151 districts are
implem
enting criteria B and the rem
aining 446 districts have moved into criteria C.
XDRTB is suspected if the follow
-up culture of MD
RTB patient on treatment rem
ains positive at 6th month or
later or culture reversion occurs at any time of treatm
ent. In such cases, that culture isolate from the follow
-up culture laboratory w
ill be sent to the linked National Reference Laboratory (N
RL) for Drug Sensitivity Test (D
ST) for second line anti TB drugs.
In 2013, examination of D
RTB suspects recorded 71% and enrolm
ent of MD
RTB patients for treatment recorded
47% increase com
pared to the previous year. A total of 1,81,021 DRTB suspects w
ere tested and 20,763 M
DRTB cases w
ere put on treatment in 2013.
tre
atm
en
t of d
rug
resista
nt t
B
Treatment of D
rug Resistant TB is based on Rifampicin D
ST results. Initial hospitalization at DR-TB Centers
is followed by am
bulatory care. Standardized treatment regim
en for MD
R TB under daily DOT includes (6-
9m) Kanam
ycin, Levofloxacin, Cycloserine, Ethionamide, Pyrazinam
ide, Ethambutol / (18m
) Levofloxacin, Cycloserine, Ethionam
ide, Ethambutol. PAS is used as a substitute drug in case of intolerance. In cases w
ith Ofloxacin or Kanam
ycin resistance detected at baseline wherever facilities to undertake quality assured D
ST to second line drugs is locally available, the regim
en for MD
R TB can be suitably modified to replace Levofloxacin
with M
oxifloxacin and PAS or to replace Kanamycin w
ith Capreomycin respectively. D
rug supply using 1 monthly
patient wise box of different w
eight bands is in place.
Standardized treatment Regim
en for XDR TB under daily D
OT includes (6-12m) Capreom
ycin, PAS, Moxifloxacin,
High dose IN
H, Clofazim
ine, Linezolid, Amoxy-Clavulanic Acid / (18m
) all the above drugs except Capreomycin.
Clarithromycin and Thyacitazone used as a substitute drug in case of intolerance.
Result of M
DR
TB Treatm
ent: The treatment outcom
e report is submitted 31-33 m
onths after patients in the respective cohort are started treatm
ent. Thus the latest annual cohort of MD
RTB patients whose treatm
ent outcom
es were reported in 2013 is from
July 2010 to June 2011. Of the 3530 MD
RTB cases registered during this period, 48%
were successfully treated, 22%
died, 18% defaulted and 6%
failed treatment. Only 14 states
have MD
RTB cases registered during this period. Majority of these patients w
ere heavily treatment experienced
and detected late during the early scale up phase of the respective states. These factors could have contributed to the high death rates am
ong them.
Chapter 3: RN
TCP implem
entation status
TB Annual Report19
ac
hie
vem
en
ts du
ring
20
13
The key activities undertaken for enhancem
ents of programm
atic managem
ent of drug resistant TB under RN
TCP in India are summ
arized below:
yIndia has introduced PM
DT services in all 35 states on 24th March 2013. As on February 2014,PM
DT services are available in all 35 states of the country across 704 districts covering the entire population (100%
) of the country
y110 D
R TB wards established w
ith airborne infection control measures by end of 2013.
yThe country has show
n an accelerated progress in scale up of PMDT diagnostic services as com
pared to the early im
plementation years from
2007 – 2012. A total of 51 C-DST labs w
ere established using various technologies- 37 Solid culture labs, 12 Liquid culture labs and 41 LPA labs.
y181021 M
DR-TB suspects w
ere tested for MD
R-TB and 20763 patients were initiated on M
DR-TB treatm
ent during 2013.
yFocused and periodic intensive PM
DT review m
eetings at regional levels with key state officials w
ere conducted in 2013 w
ith the objective to closely monitor the progress m
ade by every state in their PMDT
scale up plans and to further accelerate the scale up of PMDT services by addressing challenges through
timely intervention.
yProgram
me is in the process of developing guidelines and regulation of new
er anti-TB drugs in India. To look into possibility of introduction of Bedaquiline in India a protocol for m
ulti-centric study is being finalized for four selected sites in the country.
yAdditional H
uman R
esources: Each DRTB Centre is provided w
ith a counselor. Counseling of DRTB patients
and their families is im
portant for compliance to treatm
ent, identification and managem
ent of adverse reaction to drugs and to ensure social security.
ne
we
r initia
tives in
pM
Dt
One of the aims of ensuring effective m
anagement of tuberculosis (TB) is to m
inimize the developm
ent of drug resistance. Surveillance of antituberculosis drug resistance is, therefore, an essential tool for m
onitoring the effectiveness of TB control program
mes and im
proving national and global TB control efforts. Antituberculosis drug resistance am
ong new and previously untreated TB cases, a proxy indicator for prim
ary or initial drug resistance, suggests tuberculosis transm
ission. Antituberculosis drug resistance among previously treated TB
cases, a proxy indicator for acquired drug resistance, suggests failure of effective managem
ent in the prior TB episode.
Worldw
ide, approximately 4%
of new cases and 20%
of previously treated cases had multidrug resistant TB
(MD
R-TB), that is TB resistant to at least two of the first-line drugs, isoniazid and rifam
picin [1,2]. Extensively drug resistant TB (XD
R-TB), a severe form of TB, has been reported by 84 countries, and the average proportion
of MD
R-TB cases with XD
R-TB worldw
ide is 9.0%. By the end of 2011, China, India and the Russian Federation
contributed to almost 60%
of the estimated global burden of M
DR-TB, yet to date, no nationally representative
antituberculosis drug resistance data is available in India.
The Revised National Tuberculosis Control Program
me (RN
TCP)with support from
U.S. Centers for Disease
Control and Prevention (CDC) and the W
orld Health Organization (W
HO); is in the process of undertaking a
“National Antituberculosis D
rug Resistance Survey” in a representative sample of both new
ly diagnosed sputum
smear-positive pulm
onary TB cases and previously treated sputum sm
ear-positive pulmonary TB cases.
The survey will provide a statistically representative national estim
ate of the prevalence of antituberculosis drug resistance am
ong new and previously treated patients in India, and w
ill contribute to a more accurate estim
ate of antituberculosis drug resistance globally.
20 3.3
tB
-hiv
Ba
ck
gro
un
dTuberculosis and H
IV duo forms the deadly synergy; the patients w
ith these diseases more often w
ill have unfavourable outcom
es. HIV infection increases the risk of progression of latent TB infection to active TB disease
thus increasing risk of death if not timely treated for both TB and H
IV. Correspondingly, TB is the most com
mon
opportunistic infection and cause of mortality am
ong people living with H
IV (PLHIV), difficult to diagnose and
treat owing to challenges related to co-m
orbidity, pill burden, co-toxicity and drug interactions. HIV prevalence
among incident TB patients is estim
ated to be 5.95% (95%
CI 5.93%–5.97%
). 130000 HIV-associated TB
patients are emerging annually. By num
bers India ranks 2nd in the world and accounts for about 10%
of the global burden of H
IV-associated TB. The mortality in this group is very high and every year: 42000 people die
every year among TB/H
IV coinfected patients.
TB-H
IV collaborative activities between Revised N
ational Tuberculosis Control Programm
e (RNTCP) and
Departm
ent of AIDS Control (DAC) started initially in the year 2001. Since then, TB-H
IV activities have evolved tim
e to time in line w
ith updated scientific evidences prevailed. National Fram
ework for joint TB-H
IV collaborative activities w
as developed under which N
ational and State TB/HIV coordinating m
echanism w
ere put in place; Service delivery level coordination bodies w
ere established at district level. Components such as dedicated
human resources, integration of surveillance, joint training, standard recording &
reporting, joint monitoring &
evaluation, operational research w
ere strategically implem
ented and nationwide coverage w
as achieved in July 2012. At the N
ational level TB-HIV coordination com
mittee (N
TCC) and technical working group (N
TWG
) regularly m
onitor and suggest on key policy related to TB/HIV Collaborative activities.
pro
gre
ss Interventions to reduce the burden of TB am
ong people living with H
IV include the early provision of antiretroviral therapy (ART) for people living w
ith HIV in line w
ith WH
O guidelines and the Three I’s for HIV/TB: intensified TB
case-finding followed by high-quality antituberculosis treatm
ent, isoniazid preventive therapy (IPT) and infection control in H
IV care setting. There has been significant improvem
ent on above indicators in recent years. India adopted all recom
mendations suggested by the W
orld Health Organization recom
mended TB/H
IV collaborative activities.
HIV testing of TB patients is now
routine through provider initiated testing and counseling (PITC), implem
ented in all states. At Country level, as of 4th Quarter (Oct-D
ec) 2013, 61% of TB patients knew
their HIV status w
hich has increased from
11% in 2008. In 2013, 887903 TB patients (63%
of total TB patients registered) were tested
for HIV; 45,999 (5%
of those tested) were diagnosed as H
IV positive and were offered access to H
IV care.
Chapter 3: RN
TCP implem
entation status

TB Annual Report21
Trend of proportion of TB patients w
ith known H
IV Status, 4Q08-4Q
13
Trend of HIV-infected TB
patients receiving CPT during TB treatm
ent, 4q 2008 – 4q 2012
The updated WH
O TB/HIV policy of 2012 recom
mended im
plementation of PITC am
ong presumptive TB cases.
Considering the country evidence and global recomm
endation, the National Technical W
orking Group on TB/H
IV decided to im
plement PITC am
ong presumptive TB cases in all “high” H
IV prevalent settings in India (A and B category districts) in a phased m
anner. Routine screening of Presumptive TB cases for H
IV is being implem
ented in phase w
ise manner throughout the country.
Similarly Am
ong HIV-infected TB patients diagnosed in 4Q13 91%
were put on (co-trim
oxazole preventive therapy (CPT). The coverage of ART am
ong TB patients who w
ere known to be H
IV-positive reached 86% in patients
registered in Oct-Dec 2012, up from
49% in 2008.

22
Trend of HIV-infected TB
patients receiving ART during TB
treatment, 4q 2008 – 4q 2012
Intensified TB case finding has been implem
ented nationwide at all H
IV Care centers (at Integrated Counseling and Testing Centres (ICTCs) and ART centres. As of D
ecember 2013, 410 ART centres, and 871 link ART centres
and 158 Link ART plus Centres are operating in the country. Table below show
s the trend of intensive case finding at ICTC and ART centres in India.
YearTotal
clientsPresum
ptive TB
cases referred
Total TB
cases D
etected
Total Put on D
OTS
Proportion referred
Proportion detected TB
Proportion
Put on DO
TS
ICTC
20107678746
48461751412
401856%
11%78%
20119774581
58069555572
422236%
10%76%
20129193113
55235046863
368426%
8%79%
20137264722
62053964506
454719%
10%71%
ART Centre
20101748431
5673915911
133183%
28%84%
20113822281
11152128435
237733%
25%84%
20125591758
13711328012
244102%
20%87%
20136483326
16638324914
231243%
15%93%
In proportion ART and ICTC centres contributes to around 4% of case finding of the RN
TCP (Table below).
Table: Trend of Intensive case finding at ICTC and ART centers India
Table: Contribution of ICTC and ART centers in TB
case detection
YearTotal TB
cases Detected
(ICF ICTC+ ART)
Total cases Put on D
OTS
Total TB cases notified
under RN
TCPPercentage Contribution of ICF in TB
notification2010
6732353503
15214383.5%
201184007
659961515872
4.4%2012
7487561252
14675854.2%
201389420
685951415617
4.8%
Chapter 3: RN
TCP implem
entation status

TB Annual Report23
Table: Trend of Treatment outcom
e among TB
/HIV patients
Country is monitoring Treatm
ent outcome am
ong TB HIV patients over the years (Table Below
).
YearAll TB
-HIV Total
Case Registered
Treatment
SuccessD
iedFailure
Default
Transferred out
Switch to
Cat IV2009
3648327727 (76%
)5472 (15%
)365 (1%
)2189 (6%
)730(2%
)0
201043093
33277 (77%)
5764 (13%)
556 (1%)
2644 (6%)
724 (2%)
02011
4709736661 (78%
)5292 (11%
)2323 (5%
)2093 (4%
)488 (1%
)185 (0.5%
)2012
3413426363 (77%
) 4538 (13%
)418 (1%
)2230 (7%
)443 (1%
)150 (0.5%
)
imp
orta
nt d
eve
lop
me
nts /d
ec
ision
s in 2
01
31.
National Fram
ework for Joint H
IV/TB Collaborative Activities, Novem
ber 2013 has been published which
incorporates recent policy updates in NACP and RN
TCP and align with respective national strategic plan for
next 5 year along with recom
mendations in W
HO H
IV/TB policy guidelines 2012.
2. The form
erly-named ‘intensified package’ of H
IV/TB services is now the national TB/H
IV policy standard for all states. A single and uniform
policy, national policy framew
ork exists.
3. The G
overnment of India has constituted ‘N
ational TB/HIV Co-ordination Com
mittee’ (N
TCC) to oversee the TB H
IV coordination at various level.
4. Isoniazid Prevention Therapy (IPT) im
plementation plan approved by N
TWG
. The policy recomm
ends the use of a sim
plified clinical algorithm for TB screening that relies on the absence or presence of four clinical
symptom
s (current cough, weight loss, fever and night sw
eats) to identify people eligible for IPT or for further diagnostic w
ork-up of TB.) This is being implem
ented in phase wise m
anner.
5. RN
TCP has also endorsed the policy of prioritizing to offer rapid molecular test Xpert-M
TB/Rif (CBNN
AT) to all presum
ptive TB cases among PLH
IV for early diagnosis of TB as well as Rif resistance. Currently 80 such
CBNAAT m
achines deployed across the country.
6. PITC am
ong presumptive TB being im
plemented in phase w
ise manner in India
7. Airborne infection control at ART centres and associated H
IV care settings has been identified as an area of increasing im
portance. This component is crucial in cutting the chain of transm
ission for air borne diseases. N
ational Airborne Infection Control guidelines have been developed, including special recomm
endations for airborne infection control activities in ART centres. The sam
e has been endorsed by the NTW
G. Adm
inistrative, Environm
ental and respiratory control measures to be put I effect as per the existing AIC guideline.
8. The eligibility for receiving ART has been revised from
CD4 level of 350 to 500 for all PLH
IV. This step will
ensure that HIV positive persons are initiated on treatm
ent at an early stage and while enhancing their
longevity and productivity, it will contribute to preventing new
infections as well.

24 3.4
Ch
ildh
oo
d t
ub
erc
ulo
sis
Ba
ck
gro
un
dAs per the G
lobal Report on Tuberculosis 2013, there were an estim
ated 5,30,000 TB cases among children
(under 15 years of age) and 74000 TB deaths (among H
IV-negative children) in 2012 (6% and 8%
of the global totals, respectively). It is one of the top 10 causes of childhood m
ortality. Though MD
R-TB and XDR-
TB is documented am
ong paediatric age group, there are no estimates of overall burden, chiefly because of
diagnostic difficulties and exclusion of children in most of the drug resistance surveys.
pro
gra
m fe
atu
res fo
r pa
ed
iatric
tu
be
rcu
losis
In order to simplify the m
anagement of paediatric TB, RN
TCP in association with Indian Academ
y of Paediatrics (IAP) has described criteria for suspecting TB am
ong children, has separate algorithms for diagnosing pulm
onary TB and peripheral TB lym
phadenitis and a strategy for treatment and m
onitoring patients who are on treatm
ent. In brief, TB diagnosis is based on clinical features, sm
ear examination of sputum
where this is available, positive
family history, tuberculin skin testing, chest radiography and histo-pathological exam
ination as appropriate. The treatm
ent strategy comprises three key com
ponents. First, as in adults, children with TB are classified,
categorised, registered and treated with interm
ittent short-course chemotherapy (thrice-w
eekly therapy from
treatment initiation to com
pletion), given under direct observation of a treatment provider (D
OT provider) and the disease status is m
onitored during the course of treatment. Second, based on their pre- treatm
ent weight,
children are assigned to one of pre-treatment w
eight bands and are treated with good quality anti-TB drugs
through ‘‘ready-to-use’’ patient wise boxes containing the patients’ com
plete course of anti-TB drugs are made
available to every registered TB patient according to programm
e guidelines.
imp
lem
en
tatio
n sta
tus in
dia
RNTCP India is reporting the age w
ise case detection since beginning. The proportion of paediatric TB cases registered under RN
TCP has been constant in the past five years and for 2013, 63919 new TB cases w
ere notified accounting for 5%
of all cases. This is in the range of the expected incidence by WH
O report. How
ever considering difficulties in diagnosis of paediatric TB under field condition, the notification rates can be further strengthened.
Trend of Paediatric TB cases out of all N
ew TB
cases under RN
TCP
Chapter 3: RN
TCP implem
entation status
TB Annual Report25
How
ever, the proportion of paediatric TB case detection significantly varies from 5-14%
in larger states.
Co
nta
ct t
rac
ing
an
d C
he
mo
pro
ph
ylax
isThe contact screening is one of the w
ays for intensified case finding activity which RN
TCP has implem
ented since its inception. Under RN
TCP all children less than 6 years of age, contacts of the family m
ember suffering
with active TB are screened for TB and provided IN
H chem
oprophylaxis once active TB has been ruled out. The im
plementation is through G
eneral Health System
, which varies from
place to place and the adherence to guideline is less than satisfactory. On analyzing last 10 Central Internal Evaluations conducted in year 2012, it w
as noted that 35% of children less than 6 years did not receive chem
oprophylaxis.
In general the integration of the programm
e to the basic health service is a key process to success and hence there is an opportunity to im
prove the situation further. It’s worth noting that, the induction training m
anual for m
edical officers, health care worker includes the com
ponent on contact screening and chemoprophylaxis.
Hence focusing on the training quality and post training follow
-up in long run will help to im
prove the situation. RN
TCP is focusing on the issue and continuously monitoring the perform
ance through regular review.
In addition the RNTCP under its case base w
eb base notification (NIKSH
AY), India has started getting following
information for all TB cases registered in India. This step w
ill further improve the m
onitoring the contact tracing and chem
o prophylaxis among children.
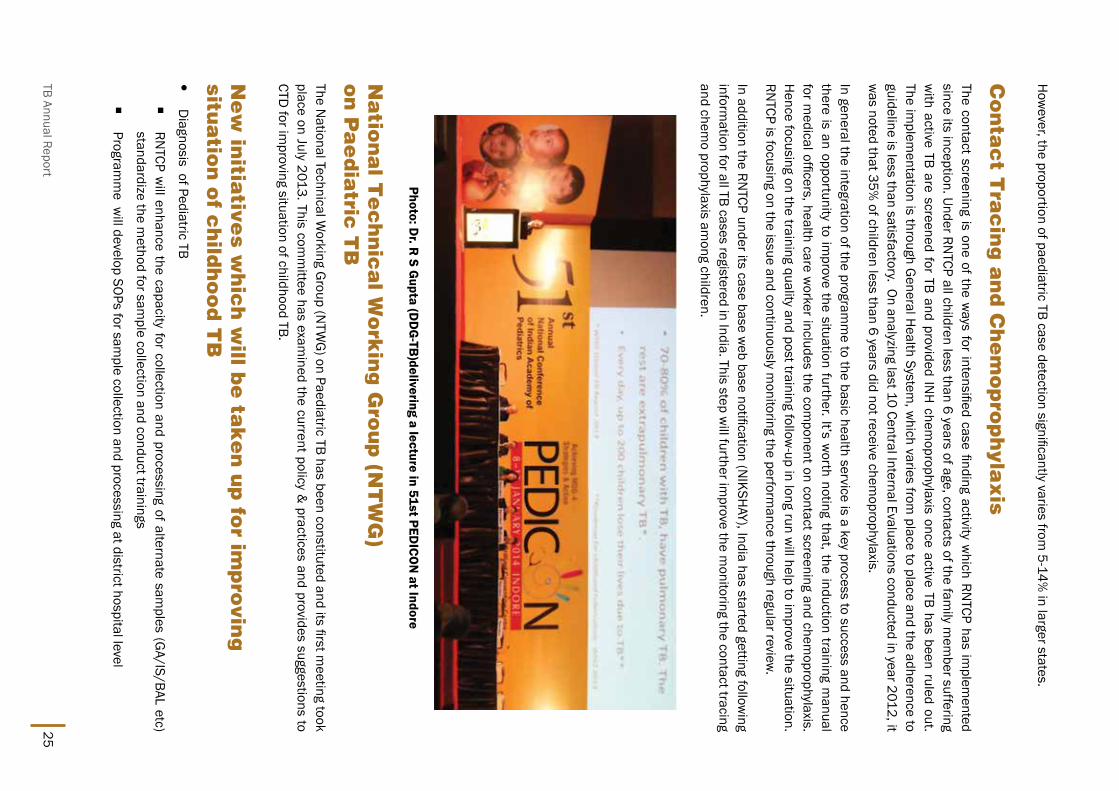
Photo: Dr. R
S Gupta (D
DG
-TB)delivering a lecture in 51st PED
ICON
at Indore
na
tion
al t
ec
hn
ica
l Wo
rkin
g G
rou
p (n
tW
G)
on
pa
ed
iatric
tB
The National Technical W
orking Group (N
TWG
) on Paediatric TB has been constituted and its first meeting took
place on July 2013. This comm
ittee has examined the current policy &
practices and provides suggestions to CTD
for improving situation of childhood TB.
ne
w in
itiative
s wh
ich
will b
e ta
ke
n u
p fo
r imp
rovin
g
situa
tion
of c
hild
ho
od
tB
yD
iagnosis of Pediatric TB
�RN
TCP will enhance the capacity for collection and processing of alternate sam
ples (GA/IS/BAL etc)
standardize the method for sam
ple collection and conduct trainings
�Program
me w
ill develop SOPs for sample collection and processing at district hospital level
26
�SOP for paediatricians outside the system
for:
�Correctly interpreting X ray findings and identifying radiological changes highly suggestive of TB
�G
iving intradermal TST and interpreting the findings of M
antoux test correctly
�diagnosis of paediatric TB through new
er diagnostic RNTCP approved technologies
yTreatm
ent of Pediatric TB
�Program
is actively considering
�D
aily treatment regim
en to be provided for all pediatric TB cases.
�D
ispersible FDCs are to be used in children provided that the defined criteria are m
et
�M
aking DOT patient-friendly: Program
will explore alternative approaches like “M
other or care giver at hom
e as DOT provider”
�12 m
onths of treatment to be given for serious form
s of TB i.e. miliary TB, TB m
eningitis, disseminated
TB, spinal TB and osteo-articular TB.
Chapter 3: RN
TCP implem
entation status

TB Annual Report27
3.5
pa
rtne
rship
sTo achieve “Universal access to TB care and treatm
ent for all,” RNTCP has taken steps to reach the unreached
through synergising the efforts of all partners and stakeholders. This change is reflected through increased allocation for partnerships, increase in m
anpower through sanction of dedicated positions to focus on partnership
at state and district levels, greater flexibility to allow for innovation, capacity building through focussed training
and an enabling environment to pilot new
initiatives and supplement efforts being m
ade by RNTCP in both rural
and urban areas.
The guidelines for the NG
O/PP schemes have undergone revision in 2008 and are again under revision in
consultation with various stakeholders to provide them
with m
ore options as per RNTCP priorities. RN
TCP is also exploring options for structured engagem
ent with private sector partners in m
ajor cities of India with prim
ary focus on notification through innovative partnership m
echanisms. At present RN
TCP has established 2569 NG
O partnerships and 13150 collaborations w
ith private practitioners and other private sector entities.
CB
Ci C
ar
D
CBCI-CARD (Catholic Bishops Conference of India-Coalition for AID
S & Related D
iseases) is a civil society organisation com
prising over 3000 healthcare and social work facilities, associated w
ith the Catholic Church in India. The CBCI-CARD
Project is a GFATM
supported partnership initiative of RNTCP, w
hich endeavours to im
prove access to diagnostic and treatment services w
ithin the Catholic Church Healthcare Facilities (CH
Fs) and thereby im
prove the quality of care for patients suffering from tuberculosis in India.
Under this partnership, across 19 states of India, field consultants visit CHFs, conduct situational analysis, liaise
with program
me m
anagers and other CHF personnel to participate in TB control and care. The project conducts
training and sensitization workshops for healthcare providers to ensure that RN
TCP is implem
ented according to guidelines, ensures participation of CH
Fs in the programm
e through MoUs signed w
ith the local District/
State TB Programm
e Managers under the N
GO-PP schem
es, sensitization workshops and training program
mes
at national, state and district levels are also conducted to facilitate effective dialogue and interaction between
partners. Advocacy, awareness generation, supervision and m
onitoring are important com
ponents of the project.

28 The key achievements of the project are:
y9879 TB patients w
ere notified to district TB authorities
y9008 sputum
positive TB patients were diagnosed from
86 designated microscopy centres (D
MCs)
yFive M
edical Colleges, 9 DN
B training institutes, 90 hospitals and 433 dispensaries have been involved in RN
TCP
y2721 hospital and health centre staffs w
ere sensitized in RNTCP
y1480 m
edical and paramedical personnel underw
ent one-day RNTCP m
odular trainings
y77 school health activities w
ere organized
y77920 TB suspects w
ere referred for sputum exam
ination to RNTCP D
MCs
yW
orld TB Day activities w
ere organized in 95 centres across 19 states
Fo
un
da
tion
for in
no
vative
ne
w D
iag
no
stics (F
inD
) FIN
D w
orks as an implem
enting partner, providing access to rapid and quality assured diagnosis of TB and M
DR TB as per the N
ational PMDT scale up plan. FIN
D supplem
ents RNTCP efforts through technical support,
equipment, consum
ables, human resources, infrastructure, m
onitoring and mentoring It provides 300 additional
laboratory professionals under the GFATM
project. These include microbiologists, technical officers, technicians
and attendants to support day-to-day functioning of the laboratories.
Key activities of the year include:
yEight national-level trainings for 89 laboratory professionals equipping them
with hands-on know
ledge of diagnostic procedures
y35 onsite trainings in rapid TB diagnostics for 275 people
yIn the first three quarters of 2013, about 100,000 M
DR TB suspects w
ere tested with new
rapid TB diagnostics and about 17,000 M
DR TB cases w
ere diagnosed
ind
ian
Me
dic
al a
ssoc
iatio
n (iM
a)
The IMA RN
TCP PPM project started as a sub recipient to the Central TB D
ivision’s Global Fund Round Six in
April 2008 in five states and one union territory of India, namely, Uttar Pradesh, Punjab, H
aryana, Maharashtra,
Andhra Pradesh and Chandigarh covering 167 districts. Subsequently, 10 more states viz Bihar, Chhattisgarh,
Gujarat, Jharkhand, Kerala, Orissa, Rajasthan, Tam
il Nadu, Uttaranchal and W
est Bengal were added.
The objective of this project is to improve access to the diagnostic and treatm
ent services of DOTS and thereby,
improve the quality of care for patients suffering from
tuberculosis through the involvement of IM
A leaders and RN
TCP staff. The key activities undertaken as part of the project include state/district level workshops,
Chapter 3: RN
TCP implem
entation status
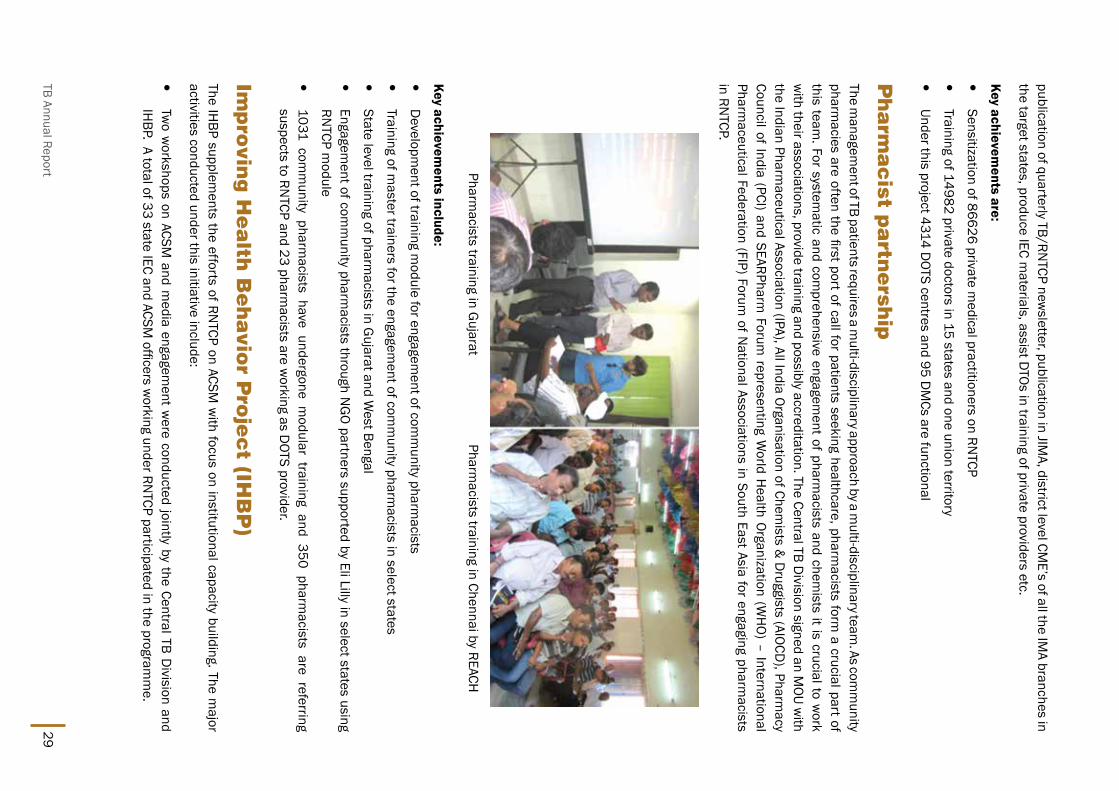
TB Annual Report29
publication of quarterly TB/RNTCP new
sletter, publication in JIMA, district level CM
E’s of all the IMA branches in
the target states, produce IEC materials, assist DTOs in training of private providers etc.
Key achievements are:
ySensitization of 86626 private m
edical practitioners on RNTCP
yTraining of 14982 private doctors in 15 states and one union territory
yUnder this project 4314 D
OTS centres and 95 DM
Cs are functional
ph
arm
ac
ist pa
rtne
rship
The managem
ent of TB patients requires a multi-disciplinary approach by a m
ulti-disciplinary team. As com
munity
pharmacies are often the first port of call for patients seeking healthcare, pharm
acists form a crucial part of
this team. For system
atic and comprehensive engagem
ent of pharmacists and chem
ists it is crucial to work
with their associations, provide training and possibly accreditation. The Central TB D
ivision signed an MOU w
ith the Indian Pharm
aceutical Association (IPA), All India Organisation of Chemists &
Druggists (AIOCD
), Pharmacy
Council of India (PCI) and SEARPharm Forum
representing World H
ealth Organization (WH
O) – International Pharm
aceutical Federation (FIP) Forum of N
ational Associations in South East Asia for engaging pharmacists
in RNTCP.
Pharmacists training in G
ujarat Pharm
acists training in Chennai by REACH
Key achievements include:
yD
evelopment of training m
odule for engagement of com
munity pharm
acists
yTraining of m
aster trainers for the engagement of com
munity pharm
acists in select states
yState level training of pharm
acists in Gujarat and W
est Bengal
yEngagem
ent of comm
unity pharmacists through N
GO partners supported by Eli Lilly in select states using
RNTCP m
odule
y1031 com
munity pharm
acists have undergone modular training and 350 pharm
acists are referring suspects to RN
TCP and 23 pharmacists are w
orking as DOTS provider.
imp
rovin
g h
ea
lth B
eh
avio
r pro
jec
t (ihB
p)
The IHBP supplem
ents the efforts of RNTCP on ACSM
with focus on institutional capacity building. The m
ajor activities conducted under this initiative include:
yTw
o workshops on ACSM
and media engagem
ent were conducted jointly by the Central TB D
ivision and IH
BP. A total of 33 state IEC and ACSM officers w
orking under RNTCP participated in the program
me.

30
ySupport in strengthening m
edia engagement in RN
TCP programm
e, through media content analysis of
tuberculosis in the country. The media analysis w
as carried out from February till Septem
ber 2013 to understand the dynam
ics of news m
edia discussion about tuberculosis in India.
yA study to assess the im
plementation of ACSM
in states with respect to its planning, im
plementation,
monitoring and evaluation. The assessm
ent was carried out in six states - Bihar, Uttar Pradesh, G
ujarat, M
eghalaya and Karnataka.
th
e in
tern
atio
na
l un
ion
ag
ain
st tu
be
rcu
losis a
nd
lu
ng
D
isea
ses
Project ‘Axshya’ (meaning TB-Free) is being im
plemented by The Union South East Asia Office (USEA) since April
2010. ‘Axshya’ is a unique civil society initiative working tow
ards improving access to quality TB care and support
especially for the vulnerable and marginalized populations across 300 districts across 21 States. W
orking in tandem
with the flagship RN
TCP, the project through advocacy, comm
unication and comm
unity engagement
activities assists in enhancing comm
unity ownership and creating dem
and for quality services for TB control.
Key achievements of the project are:
yAxshya facilitated referral and testing of over 3, 50,000 TB sym
ptomatics, of w
hich over 21,000 were
diagnosed as smear positive TB patients. Of these, over 20,000 w
ere successfully initiated on treatment.
yThe project reached out to over 2,00,000 people through m
ore than 16,000 comm
unity meetings held w
ith the G
aon Kalyan Samitis, Panchayati Raj Institutions (local self-governm
ent)) and Self Help G
roups (SHG
s).
yThe project has trained over 3,000 RH
CPs and AYUSH Providers.
yThe project scaled up the sputum
collection and transportation services thus facilitating TB symptom
atic from
inaccessible areas in availing programm
e services.
yOver 250 TB forum
s have been formed at the district level and have facilitated nutritional support, linkages
with social w
elfare schemes, rehabilitation of several thousand TB patients. The forum
s are also actively sensitizing the TB patients on their rights and responsibilities through the Patient Charter on TB care and control.
yTB Epidem
iology: A TB Epidemiology Course w
as organized from 4-15 M
arch 2013, at the National Institute
of TB and Respiratory Diseases.
Wo
rld v
ision
ind
iaTo support RN
TCP in improving TB case detection, W
orld Vision India (WVI) and its 6 civil society partners -
GLRA, AD
RA India, CARE India, SHIS, TB Alert and LEPRA India have been im
plementing Project Axshya in
selected problematic areas in W
est Bengal, Bihar, Jharkhand, Chhattisgarh, Orissa, Madhya Pradesh and
Andhra Pradesh, with the assistance of G
lobal Fund Round 9 TB Grant since April 2010. The key interventions
of the project involve engaging local grass-root level CBOs and comm
unity care givers in TB control and care, linking them
with RN
TCP through advocacy, capacity building and mobilization activities and strengthening
health systems. The key achievem
ents of the project are:
yTraining 153 Project M
anagers of TI projects and 532 mem
bers of district level PLHIV netw
orks
y1180 RH
CPs and AYUSH practitioners on TB and RN
TCP
y140 trainers and 1771 RN
TCP and health staff on soft-skills
yFacilitated 140 Village H
ealth & Sanitation Com
mittees (VH
SCs) to develop their TB action plan
yAssisted RN
TCP in the retrieval of 911 default cases, referred 20,521 suspects, tested 17,425 cases, detected 2207 TB cases and put 2134 TB cases on D
OTS.
Chapter 3: RN
TCP implem
entation status

TB Annual Report31
th
e p
artn
ersh
ip fo
r tu
be
rcu
losis C
are
an
d C
on
trol
The Partnership for Tuberculosis Care and Control (PTCC) brings together civil society on a comm
on platform to
support and strengthen India’s national TB control efforts. It serves as a liaison and coordinating body among
groups involved in TB care and control initiatives.
The key activities undertaken in the year were:
yM
embership of PTCC has risen to 177 organizations and has placed 19 state focal points chosen by state
partners and the State TB Officer
yTo recognize/acknow
ledge the effort of individuals and organizations working for tuberculosis care and
control in India, PTCC has instituted an Annual award for TB cham
pions - individual and TB Campion
Organization from across India.W
inner of the first award in organization category w
as P. D. H
induja Hospital
and in the individual category it was D
r. Nalini Krishnan, REACH
. Each received a cash prize of Rs 50,000 and a m
emento during the national m
eeting of PTCC.
yThe regional m
eetings of the Western and N
orthern regions were held at Indore and N
ew D
elhi respectively in collaboration w
ith the Central TB Division. The objective of the m
eetings was to provide a platform
for brainstorm
ing among all stakeholders in finding collaborative solutions to various challenges in the field
and chalking out state-wise action plan on strengthening RN
TCP. .
yThe Partnership new
sletter Partners Speak, which features best practices, case studies etc. w
as distributed am
ongst participants.
pro
gra
mm
e fo
r ap
pro
pria
te t
ec
hn
olo
gy in
he
alth
(pa
th
)PATH
provides RNTCP w
ith technical assistance to support its efforts to strengthen the laboratory network’s
capacity to diagnose drug-resistant TB; facilitate the introduction of improved infection control practices and
build infection control expertise within India and support the effective expansion of Program
matic M
anagement
of Drug Resistant TB (PM
DT) activities.
During the year 2013, PATH
has supported RN
TCP in the following activities:
yCollaborated w
ith FIND
, WH
O, State TB Offices and National Reference Laboratories (N
RLs) to undertake clean room
upgrades for the introduction of Line Probe Assays.
yConducted tuberculosis laboratory m
anagement training in collaboration w
ith CTD, W
HO and FIN
D.
yUnder the leadership of the CTD
, partner Initiatives Inc., with support from
PATH and W
HO com
pleted Phase 3 of the H
uman Resources for H
ealth pilot in four districts to test district administrative and block program
me
managem
ent integration. The pilot yielded some notable achievem
ents including the orientation of district and block staff.
yAudio visual training m
odules, which w
ill be used by various agencies and institutions identified by the Central TB D
ivision for training of Block Medical Officers.
ta
rge
ted
rh
Cp
inte
rven
tion
– un
ion
pro
jec
t sup
po
rted
by
lilly M
Dr
-tB
pa
rtne
rship
This project involves engagement w
ith RHCPs to build their capacity and establish effective linkages betw
een the RN
TCP and NG
Os. These trained providers then act as a DOT provider and refer TB sym
ptomatics to D
MCs.
The project has been piloted in four districts in Jharkhand, Madhya Pradesh, Uttar Pradesh and Rajasthan.
The districts were selected based on RN
TCP performance data for Q3 2011 - low
er symptom
atic referral (<100/100000) and annualized total case notification rate (<135/100000).

32 A mobile application is being piloted in three D
MCs of Khunti, a tribal district in Jharkhand India. Tw
o applications have been developed under the m
obile platform. One is used by RH
CPs and NG
O supervisors while referring
patients to DM
Cs and the other is used by laboratory technicians to upload the sputum test results of referred
patients, thus creating a referral and tracking database updated on real-time basis. The application also includes
engaging audio-visual clips to aid RHCPs counselling on TB. In the seven m
onths since its f implem
entation, 314 sym
ptomatics have been referred, of w
hich 22 have been diagnosed with TB and put on D
OTs. The RHCPs have
also become D
OT providers for these TB patients. Overall, in four sites 588 RHCPs w
ere trained, 1079 chest sym
ptomatic w
ere referred, 110 TB patients were diagnosed and 80 RH
CPs were providing D
OTS between M
ay and D
ecember 2013.
Patient referral using mobile application and counselling
Chapter 3: RN
TCP implem
entation status

TB Annual Report33
invo
lvem
en
t of M
ed
ica
l Co
lleg
es in
rn
tC
pUnder RN
TCP Medical Colleges play im
portant roles in service delivery, advocacy, training and operational research. RN
TCP is supporting Medical Colleges w
ith additional human resources, logistics for m
icroscopy, funds to conduct sensitizations, trainings and research in RN
TCP priority areas. Medical colleges have contributed in
a major w
ay in finding more TB cases, especially sm
ear negative and extra - pulmonary cases. Keeping in view
of increasing participation of M
edical colleges in the Programm
e as tuberculosis units, microscopy centers,
treatment observation centres, etc., m
edical colleges are currently divided into six zones North, East, W
est, South 1, South 2 and N
orth-East Zones. At present over 330 medical colleges both public and private m
edical colleges have been involved in TB control in India.
The Medical college involvem
ent under RNTCP is through the Task Force M
echanism w
herein the representation from
the Medical College faculty in each m
edical college core comm
ittee, representation from each m
edical college core com
mittee in the State Task Force and at the Zonal Task Force.
Medical College Core Com
mittee: A M
edical College Core comm
ittee is formed in each M
edical college including least 4 m
embers, w
ith representatives from departm
ent of medicine, chest m
edicine, microbiology
and comm
unity medicine. The Core Com
mittee functions to establish quality assured sputum
smear m
icroscopy facility in the m
edical college as well as treatm
ent and referral services to all kind of TB patients. Furthermore
it Organize sensitization / workshops / trainings for faculty m
embers / PG
s / UGs / Interns / param
edical staff, etc and also undertake Operational Research for RN
TCP.
Each Medical College is provided w
ith a Medical Officer, Lab technician and a TB H
ealth Visitor to facilitate the RN
TCP activities through the respective District H
ealth Societies. The logistics for the laboratory and all the reporting form
ats are provided by RNTCP
State Task Force (STF): Composed of a Chairm
an who is an elected representative from
the medical college
in the State, STO of the State is the mem
ber secretary. Mem
bers of STF include representatives of each of the M
edical colleges of the State, on rotation basis if required. The main task of STF is to provide leadership and
advocacy, coordination, undertake monitoring, lead operational research and support policy developm
ent on issues related to effective involvem
ent of medical colleges in RN
TCP at State level and to ensure establishment
of DM
C cum D
OT centres in all Medical Colleges.
Zonal Task Force (ZTF): Composed of a Chairm
an who is an elected representative from
STF chairpersons in the respective Zone w
ith two years tenure. M
ember secretary of ZTF w
ill be the STO of the State where M
edical College of ZTF Chairm
an is situated. Mem
bers of ZTF are representatives of the State Task forces within the
zone. In addition to Ensuring constitution of State Task Force (STF) in all States under the Zone, the main task of
ZTF is to provide leadership and advocacy, coordination, undertake monitoring, lead operational research and
support policy development on issues related to effective involvem
ent of medical colleges in RN
TCP at Zonal level. The annual Zonal Task Force (ZTF) CM
Es cum w
orkshops are held every year. The Medical college Zonal
task force workshop is an opportunity for review
ing the performance of m
edical colleges and advocating the guidelines of RN
TCP.
S. No.
ZoneVenue of ZTF
1W
est ZoneG
oa2
South 2 ZonePudducherry
3N
orth ZoneD
haramshala, H
imachal Pradesh
4East Zone
Raipur, Chhattisgarh5
North East Zone
Dibrugarh, Assam
ZTF workshops w
ere held as follows during 2013

34 This year one of the key activities was the process of capacity building of the m
edical college faculty in doing operational research and for w
hich the Zonal OR Capacity building workshops have been initiated.
National Task Force (N
TF): The NTF com
prises of representatives from seven nodal m
edical colleges, CTD, TRC,
NTI, LRS and W
HO. It has a Chairm
an who is selected on rotational basis from
amongst the 7 nodal m
edical colleges. D
DG
(TB) is the mem
ber-secretary of the NTF. The m
ain task of NTF is to provide leadership and
advocacy, coordination, undertake monitoring, lead operational research and support policy developm
ent on issues related to effective involvem
ent of medical colleges in RN
TCP at National level.
In 2013, the medical colleges diagnosed a total of 214330 TB cases including 95450 Sputum
Positive Pulm
onary, 40680 Sputum N
egative Pulmonary and 78200 Extra Pulm
onary TB cases.
re
sea
rch
un
de
r rn
tC
pThe RN
TCP is based on global scientific and operational guidelines and evidence, and that evidence has continued to evolve w
ith time. As new
evidence became available, RN
TCP has made necessary changes in
its policies and programm
e managem
ent practices. In addition, with the changing global scenario, RN
TCP is incorporating new
er and more com
prehensive approaches to TB control. To generate the evidence needed to guide policy m
akers and programm
e managers, the program
me im
plemented m
easures to encourage operational research (OR). Efforts of RN
TCP to promote OR yielded success and m
ost of the studies has are linked to the m
ain priorities of TB control.
The programm
e requires more know
ledge and evidence of the effectiveness of interventions to optimize policies,
improve service quality, and increase operational efficiency. This has led to the realization of the need for a m
ore proactive approach to prom
oting OR for the benefit of the TB control efforts. Further more, the program
me
seeks to better leverage the enormous technical expertise and resources existing w
ith in India both with in the
Programm
e, and across the many m
edical colleges, institutions, and agencies. Operational research aims to
improve the quality, effectiveness, efficiency and accessibility (coverage) of the control efforts.
Following is the sum
mary of num
ber of Operational Research proposals and status of approval by the mechanism
of State OR Com
mittees, Zonal OR Com
mittees and N
ational Standing OR Comm
ittee in year 3Q12-2Q13.
ParticularEast
West
North
North-East
South-ISouth-II
TotalPost G
raduate Thesis approved8
3911
413
1691
OR proposal submitted to Zonal
OR comm
ittee3
72
43
1019
OR proposal approved by Zonal OR com
mittee
20
14
010
17
imp
orta
nt d
eve
lop
me
nts
yN
ational Research Dissem
ination Workshop w
as organized on 26-27 August 2013 at Delhi; em
inent experts participated as delegates and presented operational research findings w
ith policy implications
yProgram
has initiated process to develop web-based application for stream
lining operational research to facilitate transparent and accountable system
ensuring timely feedback and decisions of the respective OR
comm
ittees to the applicant Principle Investigators.
yThe program
is considering establishment of a N
ational Research Cell which w
ill act as a focal point for Research in RN
TCP.
Chapter 3: RN
TCP implem
entation status

TB Annual Report35
3.6
Ca
se stu
die
s of c
om
mu
nity in
terve
ntio
n
CB
Ci-C
ar
DD
iagnosing 100% M
DR
TB patients in M
eghalaya
The Nazareth H
ospital, Shillong invested in a TB culture laboratory based on Line-Probe Assay, while w
orking closely w
ith the CBCI CARD and the State TB Cell. The hospital has been certified by the Central TB D
ivision and is the only laboratory in the state diagnosing M
DR-TB. The N
azareth Hospital w
as also given the Best NG
O award
in the state on the World TB D
ay.
Inauguration of LPA by Mr. D
.P. Wahlang, Com
missioner of H
ealth, in the presence of Archbishop Dom
inic Jala
se
cu
rity ag
ain
st tB
Mr Jonus Soreng, 40 years, w
ho worked as security guard lost his job after he w
as diagnosed w
ith spinal TB with paraplegia. H
is condition deteriorated within days and
he was unable to even sit dow
n. The Sisters of Missionaries of Charity carried him
to their centre Shanti Bhaw
an, Gopabandhupally, Rourkela w
hich also functions as a D
OT centre. Over 42 TB cases have been treated at this centre between Jan.-D
ec. 2013. The centre also offers residential and nutrition facilities to patients. M
r. Soreng w
as put on treatment in April and com
pleted treatment in D
ecember 2013 under the
supervision of the Sisters. He has now
recovered and resumed w
ork.
Fro
m a
tB
pa
tien
t to b
ein
g th
e c
lass to
pp
er
Fatima lives in a slum
in Kolkata. She was suffering from
extra pulmonary TB and receiving D
OTS from Seva
Kendra since October 2012. She was unable to attend school regularly and lead a norm
al life because of her illness. After taking m
edicines for 2-months, she started feeling w
ell and her family m
embers thought she had
been cured and decided to stop her medicine. The D
OT provider Shama Khatoon and Sister Rozina visited
her home, counselled her parents and helped them
understand that the full course of DOT is necessary and
incomplete treatm
ent can put the patient at risk of developing drug resistant MD
R TB which is difficult to cure.
She resumed her m
edicines and completed her treatm
ent. Now
she is able to concentrate on her studies and socialise w
ith her friends. She topped her class in the annual examinations and has been prom
oted to Class X now.
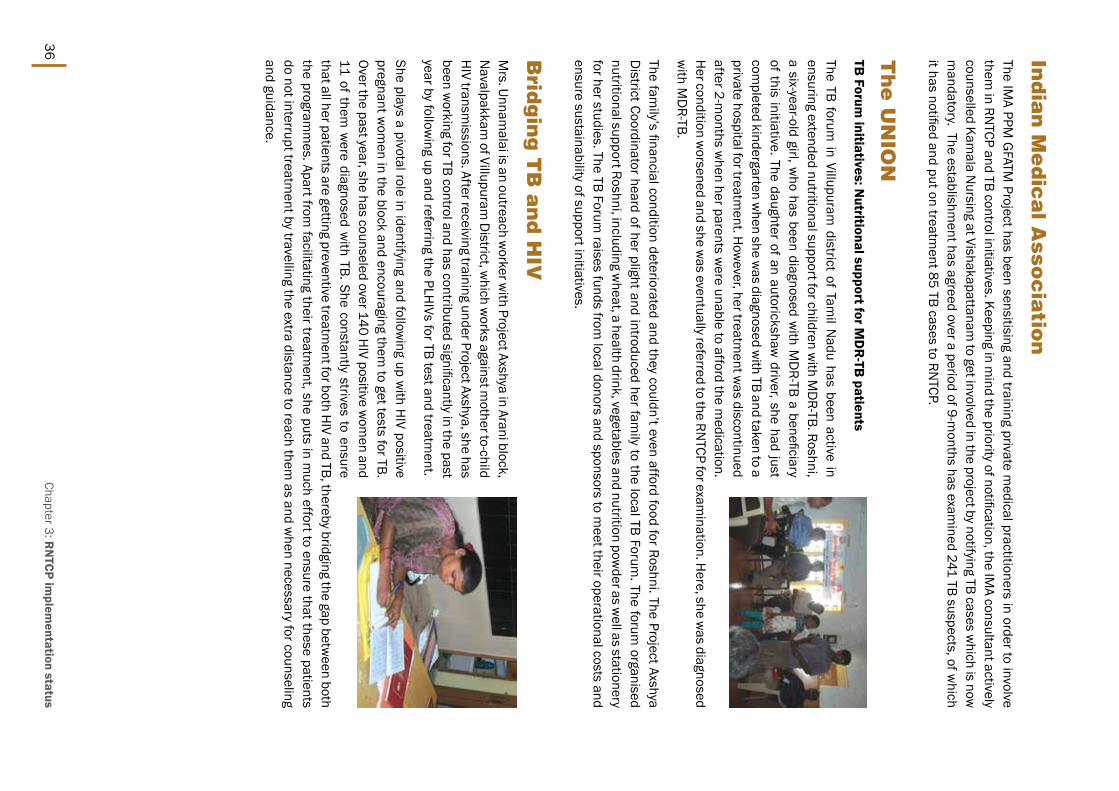
36 ind
ian
Me
dic
al a
ssoc
iatio
nThe IM
A PPM G
FATM Project has been sensitising and training private m
edical practitioners in order to involve them
in RNTCP and TB control initiatives. Keeping in m
ind the priority of notification, the IMA consultant actively
counselled Kamala N
ursing at Vishakapattanam to get involved in the project by notifying TB cases w
hich is now
mandatory. The establishm
ent has agreed over a period of 9-months has exam
ined 241 TB suspects, of which
it has notified and put on treatment 85 TB cases to RN
TCP.
th
e u
nio
nTB
Forum initiatives: N
utritional support for MD
R-TB
patients
The TB forum in Villupuram
district of Tamil N
adu has been active in ensuring extended nutritional support for children w
ith MD
R-TB. Roshni, a six-year-old girl, w
ho has been diagnosed with M
DR-TB a beneficiary
of this initiative. The daughter of an autorickshaw driver, she had just
completed kindergarten w
hen she was diagnosed w
ith TB and taken to a private hospital for treatm
ent. How
ever, her treatment w
as discontinued after 2-m
onths when her parents w
ere unable to afford the medication.
Her condition w
orsened and she was eventually referred to the RN
TCP for examination. H
ere, she was diagnosed
with M
DR-TB.
The family’s financial condition deteriorated and they couldn’t even afford food for Roshni. The Project Axshya
District Coordinator heard of her plight and introduced her fam
ily to the local TB Forum. The forum
organised nutritional support Roshni, including w
heat, a health drink, vegetables and nutrition powder as w
ell as stationery for her studies. The TB Forum
raises funds from local donors and sponsors to m
eet their operational costs and ensure sustainability of support initiatives.
Brid
gin
g t
B a
nd
hiv
M
rs. Unnamalai is an outreach w
orker with Project Axshya in Arani block,
Navalpakkam
of Villupuram D
istrict, which w
orks against mother to-child
HIV transm
issions. After receiving training under Project Axshya, she has been w
orking for TB control and has contributed significantly in the past year by follow
ing up and referring the PLHIVs for TB test and treatm
ent.
She plays a pivotal role in identifying and following up w
ith HIV positive
pregnant wom
en in the block and encouraging them to get tests for TB.
Over the past year, she has counseled over 140 HIV positive w
omen and
11 of them w
ere diagnosed with TB. She constantly strives to ensure
that all her patients are getting preventive treatment for both H
IV and TB, thereby bridging the gap between both
the programm
es. Apart from facilitating their treatm
ent, she puts in much effort to ensure that these patients
do not interrupt treatment by travelling the extra distance to reach them
as and when necessary for counseling
and guidance.
Chapter 3: RN
TCP implem
entation status

TB Annual Report37
Me
ssiah
of t
BM
r. Manas Kum
ar Dhara is a com
munity volunteer in Project Axshya and
works in the Tam
luk Tuberculosis Unit (TU) of the challenging district of East M
edinipur. GLRA, a SR partner of W
orld Vision India implem
ents Project Axshya in East M
edinipur and seven other districts of West Bengal.
A number of tim
es, as we have traversed through the dusty roads and
narrow bylanes of Tam
luk, meeting villagers, PRI and club m
embers, SH
Gs
and other comm
unity groups, as part of TB control activities, we have heard
the varying tales of Mr M
anas, as if a messiah of D
OTS, who roam
s around every day enquiring about TB sym
ptoms, referring suspects, providing D
OTS, retrieving defaulters, counseling patients and peers, and tagging the needy patients to social support schem
es. His daily schedule starts early
in the morning and ends late evening. A readily available and com
mitted volunteer, w
e found both patients and health providers looking up to him
for support related to TB cure and care. He has also been acting as a
Comm
unity DOT-Plus Provider for a num
ber of MD
R cases. A summ
ary of his achievements in the July-Septem
ber quarter are listed below
:
y28 suspects w
ere referred
yEight patients w
ere confirmed TB
ySeven default retrieval and 10 TB patients w
ere linked to social support schemes
a m
ea
nin
gfu
l pa
rtne
rship
M
r. G. Venkata Sw
ami of Shivani M
edicals, Kasipet in Mandam
arri TU in Adilabad district was identified by
REACH for training and involvem
ent as comm
unity pharmacist w
orking for TB control. After undergoing modular
training he became m
otivated to work for TB patients. H
e referred eight TB symptom
atic cases and two am
ongst them
were diagnosed w
ith pulmonary TB. These num
bers were achieved over a span of just four m
onths. Sreenivas an 18-year-old boy w
as suffering with cough and often visited M
r. Swam
i for medicines. M
r. Swam
i referred Sreenivas for a TB test and sent his assistant w
ith him to the D
MC. After being diagnosed positive for
TB, Sreenivas expressed his apprehension about taking DOTS from
the local ASHA w
orker who w
as a known
person. Understanding the sensitivity of the situation and fear of stigma, M
r. Swam
i come forw
ard to take up his D
OTS provision and assured him of confidentiality. After taking D
OTS, Sreenivas at present is much better
and is going to college regularly. As Mr. Sw
ami’s shop is near the bus-stand, Sreenivas takes his m
edicines on his w
ay to college. He serves as D
OTS provider to another person diagnosed with TB. M
ost of these referred sym
ptomatic cases cam
e to the medical shop for cough m
edicines.

38 3.7
ad
voc
ac
y, Co
mm
un
ica
tion
an
d s
oc
ial
Mo
biliza
tion
in r
nt
Cp
Advocacy, Comm
unication and Social Mobilization (ACSM
) is an important com
ponent of RNTCP and form
s a supportive strategy that focuses on addressing challenges related to early identification of TB cases, treatm
ent com
pletion and combating stigm
a.
As part of the strategy, multiple-stakeholders including policy-m
akers, healthcare providers, NG
Os, CBOs, local self-governm
ents, media and other vibrant com
munity groups are targeted for im
proved provision of treatment
and care.
Bu
ildin
g c
ap
ac
ities
The media advocacy w
orkshop for State TB Officers was organized in June to help them
reach out to the media
to appropriately articulate and highlight pertinent TB related issues.
The State IEC Officers are responsible for planning and implem
entation of ACSM strategy at both the State and
District levels. An ACSM
and media engagem
ent workshop w
as organized in Novem
ber in Delhi for IEC officers
from across all States and Union Territories (UTs) w
ith support from IH
BP - FHI 360, a partner organization. The
workshop aim
ed to develop the capabilities of State IEC officers in the planning and implem
entation of ACSM
activities in the field as well as enhancing outreach w
ithin comm
unities through the media.
Wo
rld t
B D
ay
The annual calendar of outreach and awareness initiatives culm
inate in a flurry of activities converging on 24 M
arch, celebrated the world over as the W
orld TB Day. This day is designed to help focus public attention on
tuberculosis and serve as a reminder of the fact that TB continues to be an epidem
ic in many parts of the w
orld to this day, especially our ow
n country –2,74,000 people die from TB each year in India. The W
orld TB Day
comm
emorates the day in 1882 w
hen Dr Robert Koch discovered the cause of tuberculosis, the TB bacillus,
charting the way tow
ards diagnosis and cure.
Like every year, the day was celebrated w
ith the usual zest and gusto across States and UTs. The theme w
as, ‘Stop TB in m
y life time – zero deaths from
TB.’ A complete spectrum
of activities were planned and executed
ranging from aw
areness walks and runs; quiz, draw
ing and painting competitions; folk dance, m
usic and a host of other aw
areness generating performances; exhibitions, events and other public functions to rew
ard and recognize patients, health providers, civil society m
embers, organizations and support groups.
Currently, there are four key activities integrated within the ACSM
strategy implem
ented at the district and sub-district levels, that seek to engage and interface w
ith individuals, groups and influencers within the com
munity
- patient provider meetings, com
munity level m
eetings, school-based activities and activities to sensitize PRIs and N
GOs etc.
In 2013-14 RN
TCP, reached out to people across the country through
y660241 patient provider m
eetings
y636899 com
munity level m
eetings
y108614 school outreach activities
y587110 sensitization m
eetings with PRIs, N
GOs etc.
These along with a com
plete set of planned activities helped the programm
e make inroads into the com
munity
to enhance case finding and treatment adherence along w
ith other programm
atic goals.
The first meeting of the ACSM
technical taskforce – the National ACSM
Advisory Comm
ittee comprising
stakeholders from RN
TCP, NG
O partners and specialists in core competency areas w
as convened in New
Delhi
Chapter 3: RN
TCP implem
entation status
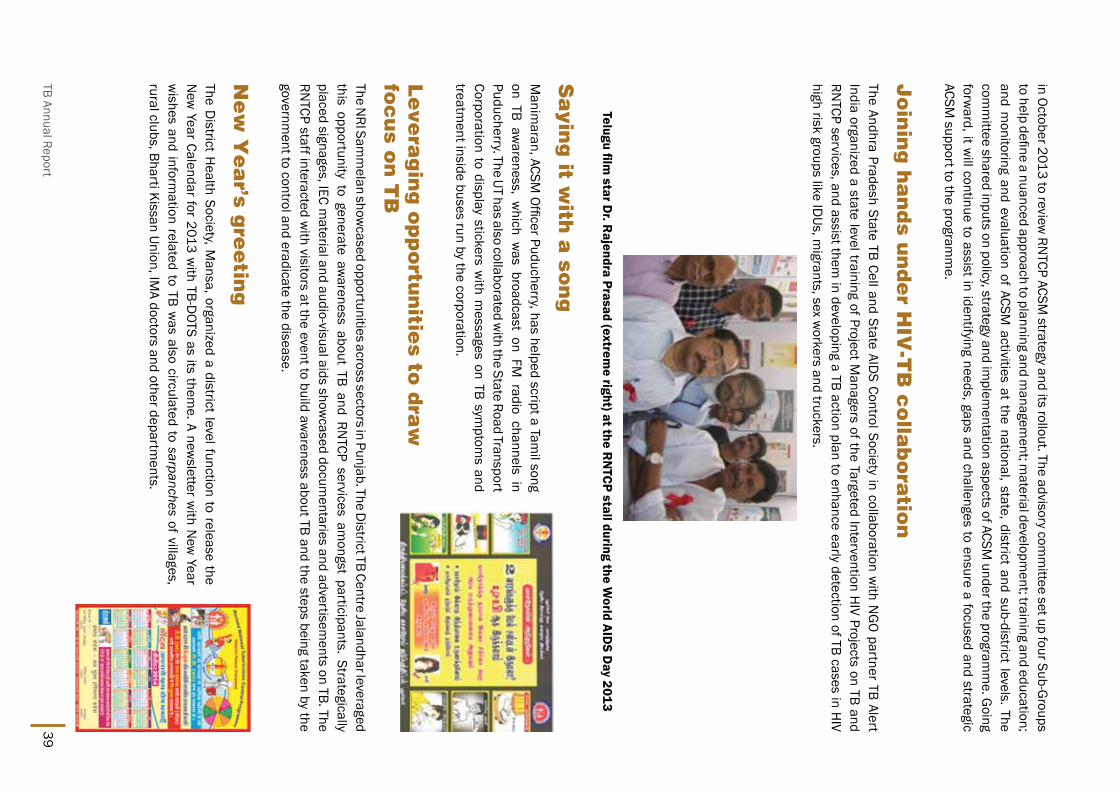
TB Annual Report39
in October 2013 to review RN
TCP ACSM strategy and its rollout. The advisory com
mittee set up four Sub-G
roups to help define a nuanced approach to planning and m
anagement; m
aterial development; training and education;
and monitoring and evaluation of ACSM
activities at the national, state, district and sub-district levels. The com
mittee shared inputs on policy, strategy and im
plementation aspects of ACSM
under the programm
e. Going
forward, it w
ill continue to assist in identifying needs, gaps and challenges to ensure a focused and strategic ACSM
support to the programm
e.
Jo
inin
g h
an
ds u
nd
er h
iv-t
B c
olla
bo
ratio
n
The Andhra Pradesh State TB Cell and State AIDS Control Society in collaboration w
ith NG
O partner TB Alert India organized a state level training of Project M
anagers of the Targeted Intervention HIV Projects on TB and
RNTCP services, and assist them
in developing a TB action plan to enhance early detection of TB cases in HIV
high risk groups like IDUs, m
igrants, sex workers and truckers.
Telugu film star D
r. Rajendra Prasad (extrem
e right) at the RN
TCP stall during the World AID
S Day 2013
sa
ying
it with
a so
ng
Manim
aran, ACSM Officer Puducherry, has helped script a Tam
il song on TB aw
areness, which w
as broadcast on FM radio channels in
Puducherry. The UT has also collaborated with the State Road Transport
Corporation to display stickers with m
essages on TB symptom
s and treatm
ent inside buses run by the corporation.
le
vera
gin
g o
pp
ortu
nitie
s to d
raw
fo
cu
s on
tB
The N
RI Samm
elan showcased opportunities across sectors in Punjab. The D
istrict TB Centre Jalandhar leveraged this opportunity to generate aw
areness about TB and RNTCP services am
ongst participants. Strategically placed signages, IEC m
aterial and audio-visual aids showcased docum
entaries and advertisements on TB. The
RNTCP staff interacted w
ith visitors at the event to build awareness about TB and the steps being taken by the
government to control and eradicate the disease.
ne
w Y
ea
r’s gre
etin
gThe D
istrict Health Society, M
ansa, organized a district level function to release the N
ew Year Calendar for 2013 w
ith TB-DOTS as its them
e. A newsletter w
ith New
Year w
ishes and information related to TB w
as also circulated to sarpanches of villages, rural clubs, Bharti Kissan Union, IM
A doctors and other departments.
40
3.8
Fin
an
cia
l pla
nn
ing
& m
an
ag
em
en
tRevised N
ational Tuberculosis Control Programm
e is a centrally sponsored scheme im
plemented through
NRH
M w
ith the State, District &
Municipal Corporation H
ealth Societies having a separate sub-account for TB Control Activities through w
hich the funds from the M
inistry of Health and Fam
ily Welfare are disbursed for
implem
entation of the project activities within the concerned State/ D
istrict/ Municipal Corporation.
Financial Managem
ent is an integral and important com
ponent for RNTCP. The planning process focuses on
financial analysis for programm
atic and managem
ent use and meeting reporting obligations for all stakeholders
and producing accurate and timely inform
ation that forms basis for better decisions, reducing delays and
bottlenecks. This also deals with overall financial m
anagement deals w
ith approval and review of annual plans
and budgets. The budgetary managem
ent is about fund flow m
echanisms, delegation of financial pow
ers, accounting and internal control system
and to ensure that funds are effectively used for programm
e objectives. It brings together planning, budgeting, accounting, disbursem
ents, procurements, financial reporting, internal
control including internal audit, external audit, filing programm
e updates and disbursement requests and
managing resources efficiently as w
ell as effectively. Fiduciary requirements are addressed by designing and
implem
enting effective audit mechanism
s at all levels. This provides reasonable assurance that:
(i) Operations are being conducted effectively, efficiently and in accordance w
ith RNTCP financial norm
s
(ii) Financial and operational reporting are reliable
(iii) Laws and regulations are being com
plied with
(iv) Assets and records are being maintained properly
Fo
cu
s are
as u
nd
er p
lan
nin
g a
nd
fin
an
cia
l ma
na
ge
me
nt
un
de
r rn
tC
p d
urin
g 1
2th
FY
p
The areas that will receive attention during 12th Five Year Plan of R
NTCP include:
yD
elegation of financial powers
yAsset m
anagement
yAudit structures
yG
rants managem
ent
yN
GO financing and accounts
yTim
ely settlement of advances
yInter-unit transfers
yAlignm
ent with the financial m
anagement of N
RHM
FMR
yH
uman resource for financial m
anagement
Chapter 3: RN
TCP implem
entation status

TB Annual Report41
De
tails o
f allo
ca
tion
un
de
r rn
tC
p in
20
12
-13
an
d 2
01
3-1
4The overall financial perform
ance of RNTCP in the first tw
o years of 12th Five Year Plan is as under (all figures in Rs Crores):
Financial yearB
udgetary Estimate
(BE)
Revised Estim
ate (RE)
Final Estimate (FE)
Expenditure
2012-13710.15
557.15467.00
466.152013-14
710.15500.00
500.00472.59*
*All figures are till February 2014
Release and Expenditure in Financial Year 2013-14 (All figures in lakhs)
(Rs. in lakhs)
Sl.No.
Nam
e of the State / U
T2013-14
Releases
ExpenditureCash
Comm
odity Total
Cash Com
modity
Total1
Andhra Pradesh1782.22
2233.304015.52
977.562233.3
3210.862
Andaman &
Nicobar
73.082.15
75.2329.17
2.1531.32
3Arunachal Pradesh
408.579.91
418.48330.51
9.91340.42
4Assam
894.71364.61
1259.32797.76
364.611162.37
5Bihar
890.04134.70
1024.74585.62
134.7720.32
6Chandigarh
113.0221.72
134.7494.72
21.72116.44
7Chattisgarh
788.1813.02
801.2313.76
13.02326.78
8D
& N
Haveli
51.241.44
52.6833.63
1.4435.07
9D
aman &
Diu
24.801.03
25.837.87
1.038.9
10D
elhi1049.23
377.471426.7
476.52377.47
853.9911
Goa
75.9711.34
87.3162.66
11.3474
12G
ujarat1890.13
4025.135915.26
1627.924025.13
5653.0513
Haryana
451.6113.64
465.25406.44
13.64420.08
14H
imachal Pradesh
383.50127.02
510.52199.25
127.02326.27
15Jam
mu &
Kashmir
591.3288.69
680.01405.38
88.69494.07
16Jharkhand
886.6317.14
903.77531.49
17.14548.63
17Karnataka
1379.5863.74
1443.321296.84
63.741360.58
18Kerala
996.98662.31
1659.29562.07
662.311224.38
19Lakshadw
eep19.56
0.3519.91
6.010.35
6.3620
Madhya Pradesh
1449.59693.22
2142.81770.92
693.221464.14
21M
aharashtra4983.68
1039.076022.75
3617.61039.07
4656.6722
Manipur
255.8721.95
277.82264.35
21.95286.3
23M
eghalaya266.88
21.2288.08
136.8621.2
158.0624
Mizoram
295.928.17
304.09116.79
8.17124.96
25N
agaland233.18
20.08253.26
185.9520.08
206.0326
Orissa879.51
22.82902.33
795.8522.82
818.6727
Puducherry156.71
21.25177.96
95.8221.25
117.0728
Punjab694.91
358.421053.33
436.14358.42
794.5629
Rajasthan967.52
1082.072049.59
924.771082.07
2006.8430
Sikkim176.59
5.02181.61
98.895.02
103.9131
Tamil N
adu1578.88
927.252506.13
1312.56927.25
2239.8132
Tripura156.03
27.99184.02
89.0127.99
117

42
Annual audit under RN
TCP:
The annual audit of RNTCP is being done by D
irectorate General of Audit and Central Expenditure (D
CACE).
RN
TCP – financial updates in 2013
Following policy level updates have happened under RN
TCP in 2013:
1. The N
ational Strategic Plan of RNTCP w
as approved in January 2013 where RN
TCP was allocated a funding
of Rs 4500.15 crore under 12th Five Year Plan (2012-17). The distribution across the plan period is as under:
Sl.No.
Nam
e of the State / U
T2013-14
Releases
ExpenditureCash
Comm
odity Total
Cash Com
modity
Total33
Uttar Pradesh 3817.66
1014.134831.79
2709.881014.13
3724.0134
Uttrakhand265.41
5.33270.74
254.635.33
259.9635
West Bengal
1119.85480.56
1600.411984.97
480.562465.53
Total30048.56
13917.2443965.80
22540.1713917.24
36457.41Releases to N
GOs/
Study1205.64
0.001205.64
153.410.00
153.41
HQ Expenditure
410.830.00
410.83409.84
0.00409.84
Grand Total
31665.0313917.24
45582.2723103.42
13917.2437020.66
Chapter 3: RN
TCP implem
entation status
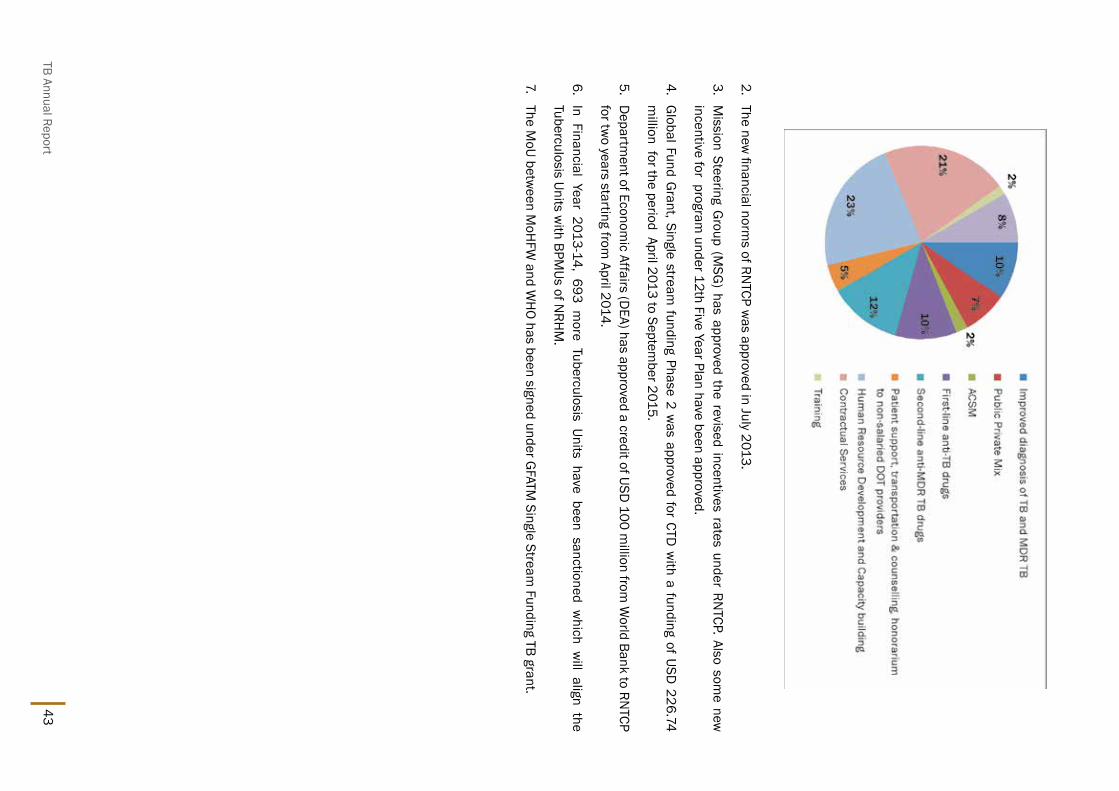
TB Annual Report43
2. The new
financial norms of RN
TCP was approved in July 2013.
3. M
ission Steering Group (M
SG) has approved the revised incentives rates under RN
TCP. Also some new
incentive for program
under 12th Five Year Plan have been approved.
4. G
lobal Fund Grant, Single stream
funding Phase 2 was approved for CTD
with a funding of USD
226.74 m
illion for the period April 2013 to September 2015.
5. D
epartment of Econom
ic Affairs (DEA) has approved a credit of USD
100 million from
World Bank to RN
TCP for tw
o years starting from April 2014.
6. In Financial Year 2013-14, 693 m
ore Tuberculosis Units have been sanctioned which w
ill align the Tuberculosis Units w
ith BPMUs of N
RHM
.
7. The M
oU between M
oHFW
and WH
O has been signed under GFATM
Single Stream Funding TB grant.

44

TB Annual Report45
4.1
nik
sha
y (Ca
se B
ase
d
on
line
softw
are
) B
ackground: RNTCP since im
plementation follow
ed international guidelines
for recording
and reporting
for Tuberculosis
Control Program
me w
ith minor m
odifications. Epi-info based EPI-CENTRE
software
was
being used
for the
purpose of
electronic data
transmission from
district level upwards. Initially D
OS version was in
use and the programm
e shifted to window
s version in 2007. How
ever, the data available at district, state or national level w
as in aggregated form
, with a lead tim
e of >4 months, excluding private sector and
neither could help much for TB burden estim
ation or individual case m
anagement or m
onitoring. To address this Central TB Division (CTD
) in collaboration w
ith National Inform
atics Centre (NIC) undertook
the initiative to develop a Case Based Web online (cloud) application
named N
ikshay. This software w
as launched in May 2012 and has
following functional com
ponents.
yM
aster managem
ent
yUser details
yTB Patient registration &
details of diagnosis, DOT Provider, H
IV status, Follow
-up, contact tracing, Outcomes
yD
etails of solid and liquid culture & D
ST, LPA, CBNAAT details
yD
R-TB patient registration with details
yReferral and transfer of patients
yPrivate health facility registration and TB N
otification
yM
obile application for TB notification
ySM
S alerts to patients on registration
ySM
S alerts to programm
e officers
Ch
ap
te
r 4
: t
B s
ur
ve
ill
an
Ce
in
inD
ia W
ith
nik
sh
aY

46
yAutom
ated periodic Reports
�Case Finding
�Sputum
conversion
�Treatm
ent outcome
Da
ta se
cu
rity / co
nfi
de
ntia
litySecurity audit of N
ikshay application is done as per guidelines of Departm
ent of IT. Password protection is
applicable for each level of user. Password reset facility is available at higher users in hierarchy. Access to
relevant information for each user, based on defined functions.
Da
ta q
ua
litySince the softw
are do not itself generate information and alm
ost all information is digitized from
the source w
hich exists in the programm
e; the inherent quality of data of the programm
e is transferred. Transcription errors if any are being evaluated by the program
me in im
plementation research m
ode. How
ever, Nikshay
already has internal validations for most of the variables based on the logic flow
and conditionality’s. But a judgem
ent of choice of stricter validations against the availability of complete and accurate inform
ation; is also an opportunity to im
prove processes in the programm
e. It started with certain m
andatory fields which
were defined and these now
ensure completeness of inform
ation regarding those variables e.g. DOT provider
details. Unwanted characters avoided at entry. Regular feedback from
administrator to check bugs if any, has
been established. Most im
portantly data point formats of M
etadata and Data Standards (M
DD
S) have been follow
ed in the development of this could application. In future, this w
ill be the basis for system integration and
interoperability to set an example of EM
R/EHR.
Till 10th March 2014, status of im
plementation and is as below
:
TB Patients Registered under RNTCP
23,69,515
Peripheral Health Institutes (PH
I) registered41,277
Tuberculosis Officials details 2703
District TB Officers details
667State TB Officers details
35Contractual Em
ployees details 6901
Non-RN
TCP Health Establishm
ents registered64,073
Non-RN
TCP Patients registered56,087
Culture & D
rug Resistant Labs Patients registered20995
Drug Resistant Tuberculosis Patients registered
1979
imp
lem
en
tatio
n c
ha
llen
ge
s M
any of the PHCs in the country do not have adequate ICT infrastructure like com
puter, internet connectivity and D
ata Entry Operator. Also intermittent electricity supply ham
pers the data entry and use of Nikshay. Also
patient treatment cards need to be brought to TU/Block level or even at district level in certain areas for data
entry. Slow internet / w
eb connectivity in some places and incom
plete treatment cards at m
any places also slow
s down the process.
How
ever, support from N
RHM
in terms of ICT infrastructure and data entry operators has significantly contributed
to use of Nikshay softw
are across the country.
Chapter 4: TB surveillance in India w
ith Nikshay

TB Annual Report47
na
tion
al e
-Go
vern
an
ce
aw
ard
N
IKSHAY
was
honored w
ith N
ational e-G
overnance Aw
ard (G
old) 2013-14
during the
National
Conference on
e-Governance held at Kochi on 30-31
January, 2014 under category Sectoral Aw
ard – Healthcare. These aw
ards are organized by M
inistry of Administrative
Reforms,
Grievence
Redressal and
Pensions in collaboration with D
epartment
of IT,
Ministry
of Com
munication
and Inform
ation Technology, Governm
ent of India.
The award w
as given by Sh Nikhil Kum
ar, H
on’ble Governor of Kerala, Sh V. N
arayanasamy, H
on’ble Minister for State of Personnel, Public G
rievances and Pensions. The gold aw
ard was received by officials from
Central TB Division and N
IC.

48 4.2
tB
no
tific
atio
n
Background: India’s N
ational TB Control programm
e provides quality assured diagnostic and treatment
services to all the TB patients including necessary supportive mechanism
s for ensuring treatment adherence
and completion. H
owever these services cannot be m
ade available to large number of patients availing services
from private sector, as they are not currently reported to the program
me. The N
ational Programm
e is unable to support TB patients and facilitate effective treatm
ent as there is no information on TB and M
/XDR TB diagnosis
and treatment in private sector and unable to m
onitor and act for this looming epidem
ic. The country has a huge private sector and it is grow
ing at enormous pace. Private sector predom
inates in health care and TB treatm
ent. Extremely large quantities of anti-TB drugs are sold in the private sector. Poor prescribing practices
among private providers w
ith inappropriate and inadequate regimens and unsupervised treatm
ent continues in private sector w
ithout supporting patient for ensuring treatment adherence and com
pletion with unrestricted
access to first and second line TB drugs without prescription. H
igh cost of TB and M/XD
R TB drugs for privately treated patients is leading to further poverty and treatm
ent interruptions.
A large number of patients are not benefitted w
ith programm
e services and this leads to non adherence, incom
plete, inadequate treatment leading to M
/XDR TB, m
itigating all the efforts of the programm
e to prevent em
ergence and spread of drug resistance. If the TB patients diagnosed and treated under private sector are reported to public health authorities, the m
echanisms available under the program
me can be extended to these
patients to ensure treatment adherence and com
pletion. The impending epidem
ic of M/XD
R TB can only be prevented to a large extent by this intervention.
To curb this situation, Govt of India declared Tuberculosis a notifiable disease on 7th M
ay 2012 with the follow
ing objectives.
ob
jec
tives
1. To have establish Tuberculosis surveillance system
in the country
2. To extend m
echanisms of TB treatm
ent adherence and contact tracing to patients treated in private sector
3. To ensure proper TB diagnosis and case m
anagement and further accelerate reduction of TB transm
ission
4. To m
itigate the impeding D
rug resistant TB epidemic in the country
imp
lem
en
tatio
n to
ols &
me
tho
ds
For the purpose of notification, the contact details of the nodal officer at district level and the reporting formats
are available on the website w
ww.tbcindia.nic.in. All the health establishm
ents throughout the country in public as w
ell as private and non governmental sector are expected to notify TB cases.
For the purpose of notification the definition of TB cases is as below
:
yM
icrobiologically-confirmed TB case – Patient diagnosed w
ith at least one clinical specimen positive for
acid fast bacilli, or Culture-positive for Mycobacterium
tuberculosis, or RNTCP-approved Rapid D
iagnostic m
olecular test positive for tuberculosis.
OR yClinical TB case – Patient diagnosed clinically as tuberculosis, w
ithout microbiologic confirm
ation and initiated on anti-TB drugs.
List of RN
TCP endorsed TB diagnostics are as below
:
Smear M
icroscopy (for AFB):
�Sputum
smear stained w
ith Zeil-Nelson Staining or
�Fluorescence stains and exam
ined under direct or indirect microscopy w
ith or without LED
.
Chapter 4: TB surveillance in India w
ith Nikshay
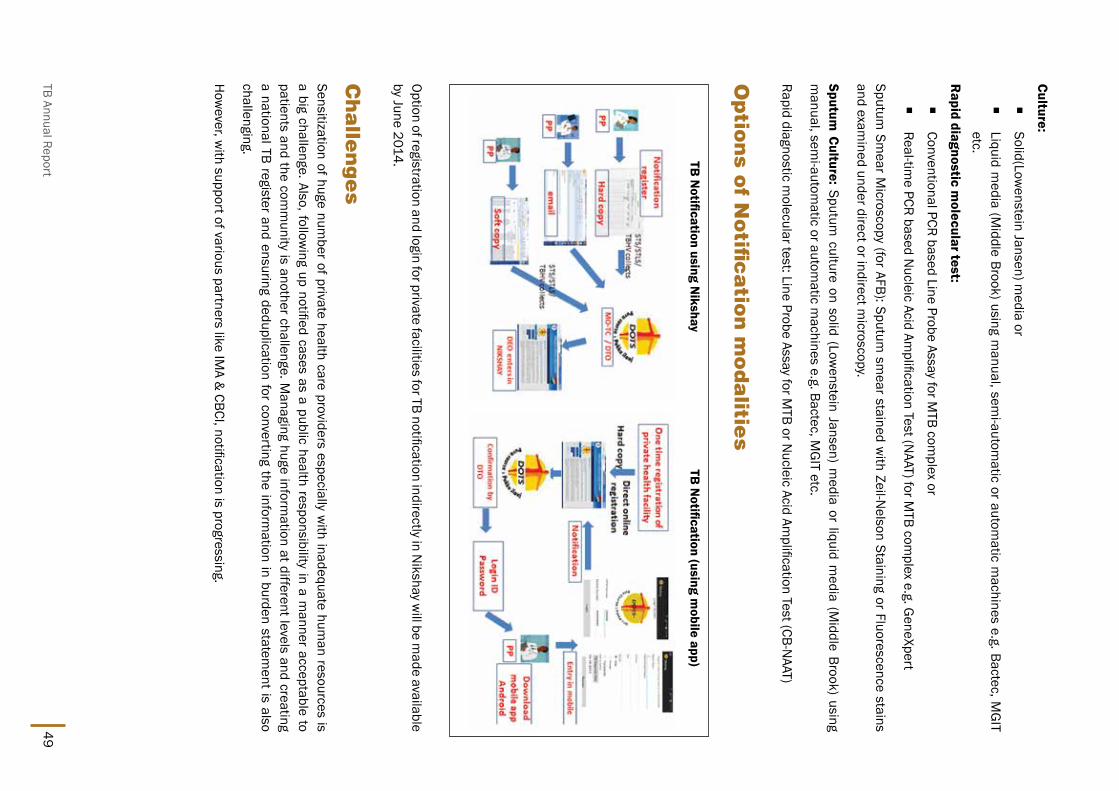
TB Annual Report49
Culture:
�Solid(Low
enstein Jansen) media or
�Liquid m
edia (Middle Brook) using m
anual, semi-autom
atic or automatic m
achines e.g. Bactec, MG
IT etc.
Rapid diagnostic m
olecular test:
�Conventional PCR based Line Probe Assay for M
TB complex or
�Real-tim
e PCR based Nucleic Acid Am
plification Test (NAAT) for M
TB complex e.g. G
eneXpert
Sputum Sm
ear Microscopy (for AFB): Sputum
smear stained w
ith Zeil-Nelson Staining or Fluorescence stains
and examined under direct or indirect m
icroscopy.
Sputum Culture: Sputum
culture on solid (Lowenstein Jansen) m
edia or liquid media (M
iddle Brook) using m
anual, semi-autom
atic or automatic m
achines e.g. Bactec, MG
IT etc.
Rapid diagnostic molecular test: Line Probe Assay for M
TB or Nucleic Acid Am
plification Test (CB-NAAT)
op
tion
s of n
otifi
ca
tion
mo
da
lities
Option of registration and login for private facilities for TB notification indirectly in Nikshay w
ill be made available
by June 2014.
Ch
alle
ng
es
Sensitization of huge number of private health care providers especially w
ith inadequate human resources is
a big challenge. Also, following up notified cases as a public health responsibility in a m
anner acceptable to patients and the com
munity is another challenge. M
anaging huge information at different levels and creating
a national TB register and ensuring deduplication for converting the information in burden statem
ent is also challenging.
How
ever, with support of various partners like IM
A & CBCI, notification is progressing.
TB N
otification using Nikshay
TB N
otification (using mobile app)

50 tB
no
tific
atio
n sta
tus
With increasing num
ber of health facilities registered notification of TB cases also increased many fold. Till now,
>41,000 TB cases have been notified by private sector in addition to ~5,000 cases notified by public sector being treated outside RN
TCP. Though this is still the beginning and case based surveillance with increasingly
complete notification by all health facilities across the country w
ill be the milestone for RN
TCP in the coming
years.
With efforts for sensitization of program
me officials &
staff and then subsequently to private sector, the number
of private health facilities registered in Nikshay for TB notification increased m
any fold in 2013 as compared to
2012. A total of >57,000 private health facilities are registered till now.
Chapter 4: TB surveillance in India w
ith Nikshay
TB Annual Report51
Every quarter, Central TB Division receives aggregate case-finding,
programm
e m
anagement,
sputum
conversion, and
treatment
outcome inform
ation for patients registered under the programm
e from
over 2,700 Tuberculosis Units nationwide. RN
TCP follows the
global method of cohort analysis for describing case finding and
treatment outcom
es. Timely data collection and dissem
ination are hallm
arks of the RNTCP surveillance and data m
anagement system
s. The data from
the quarterly reports are analyzed and disseminated in
the public domain as quarterly perform
ance reports before the end of the subsequent quarter and as an annual report. For the purpose of describing the notification in this section, the data from
the reports of the 4 quarters in a calendar year have been added and is presented in the form
of annual data. Though the programm
e was form
ally initiated in the year 1997 and the quarterly reporting m
echanism
was in place since inception, the data presented below
extend from
the year 1999, when approxim
ately about 10% of the country’s
population was covered onw
ards. The rapid pace of DOTS expansion
over the past decade complicates longitudinal data analysis in a
number of w
ays. District-by-district scale-up of RN
TCP services over several years changes the denom
inator of population covered every quarter. Basic dem
ographic characteristics of implem
enting districts differed over the expansion years, as w
ell as the expected evolution of services and TB epidem
iology in areas implem
enting RNTCP over
longer time periods.
For the purposes of this analysis, districts implem
enting RNTCP less
than one year during the initial year of implem
entation were attributed
to cover a population proportionate to the number of days in the first
year that services were available in each district. The rates presented
in this section are all per 100,000 populations after adjusting for the
Ch
ap
te
r 5
: r
nt
Cp
p
er
Fo
rM
an
Ce
: n
ot
iFiC
at
ion
a
nD
tr
ea
tM
en
t
ou
tC
oM
e t
re
nD
s
52 number of days of im
plementation by individual districts till year 2006. Also the population of the districts is
based on 2001 census and 2011 Census India for these two years and estim
ated for the rest of the years based on these tw
o Censuses. Though the population in the tables is complete population of services covered as on
31st Decem
ber of that year.
sp
utu
m M
icro
sco
py s
ervic
es a
nd
tB
su
spe
ct e
xa
min
atio
nOver the 13 year analysis period, the population covered increased from
139 million to 1.23 billion populations
(Table 1). Smear m
icroscopy services are reported independently of case notification results. As expected from
service expansion, the absolute number of TB suspects exam
ined by smear m
icroscopy annually has increased m
anifold, from 0.96 m
illion to 7.8 million. Over the sam
e time period, the rate of TB suspect exam
ination increased by 50%
, from 421 per 100,000 population covered by RN
TCP services to 651 per 100,000 population in 2013. Sim
ilarly, the rate of sputum sm
ear positive cases diagnosed by microscopy has increased by 20%
, from
65 to 79 per 100,000 population by the year 2008, remained at that level for four years and has started
decreasing to 74 per 100,000 in year 2013 [Figure 1]. The average number of suspects exam
ined for every sputum
smear positive case diagnosed has gradually increased at the rate of2%
per year, from 2001 to 2013,
the number of suspects exam
ined per smear positive case diagnosed has increased by 36%
from 6.4 to 8.7
suspects (Figure 2) still suggesting that yield is progressively decreasing per unit case finding activity. Total and sputum
smear positive case notification is also show
n in Table 1. An average difference of 14% [Range 9–15%
] w
as observed between the rate of sputum
-positive cases diagnosed and the sputum-positive case notification
rate. This is one of the challenge programm
e will have to address in com
ing quarters, for which registration of
each TB case at diagnosis would be first step to bring in m
ore accountability to treat each diagnosed cases in the country.
no
tific
atio
n r
ate
s of t
B C
ase
sOverall, case notification has increased over the 13 year analysis period, and the notification rates of m
ost types of TB cases has steadily increased or rem
ained stable, with the exceptions of new
smear-negative (Table 2 and
Figure 3) and “treatment after default” later suggesting overall im
provement in program
me though indirectly
(Table 2 and Figure 4). The total case notification rate has increased from 101 cases per 100,000 population in
1999 to 139 per 100,000 population in 2004, remained near 130 till 2009 and started decreasing since 2010
stooping to 113 per 100,000 population in 2013 (Table 1). The NSP case notification rate has increased from
39 cases per 100,000 population in 1999 to 53 per 100,000 population in the year 2008, and has rem
ained at around 53/100,000 till 2011 but has decreased to 50 per 100,000 population in year 2013. The N
SN
notification rates have shown a decreasing trend from
45 per 100,000 population in 2004 to 23 per 100,000 population in 2013 (Table 2 and Figure 3), and continues to fall. Som
e of the arguments for this are increased
efforts to get the sputum exam
ined and bacilli demonstrated w
ith increasing availability and application of quality sputum
smear m
icroscopy services expanded under the programm
e.
The notification rate of re-treatment cases has increased by 40%
over first few years, from
18 per 100,000 population in 1999 to 26 per 100,000 population in 2008, but has started show
ing decline to 22 per 10000 population by 2013. The increase in retreatm
ent notification rates appears to be driven largely by increases in the notification rates of the ‘relapse’ and ‘others’ types of re-treatm
ent cases. The ‘re-treatment others’
notification rate has almost doubled from
4 per 100,000 population in 1999 to 8 per 100,000 population by the year 2008 and continues to at that level in 2013. The notification rate of failure-type re-treatm
ent cases has rem
ained almost stable from
2002 to 2010at the rate of 2 cases per 100,000 population. But after that, decreasing trend is evident w
ith expansion of PMDT services across the country w
ith DST being offered earlier
to high risk patients. The “Treatment after default” notification rates have declined from
10/100,000 population in 2001 to 5/100,000 population in 2011 (Table 2 and Figure 4).
Chapter 5: RN
TCP performance: notification and Treatm
ent Outcom
e trends
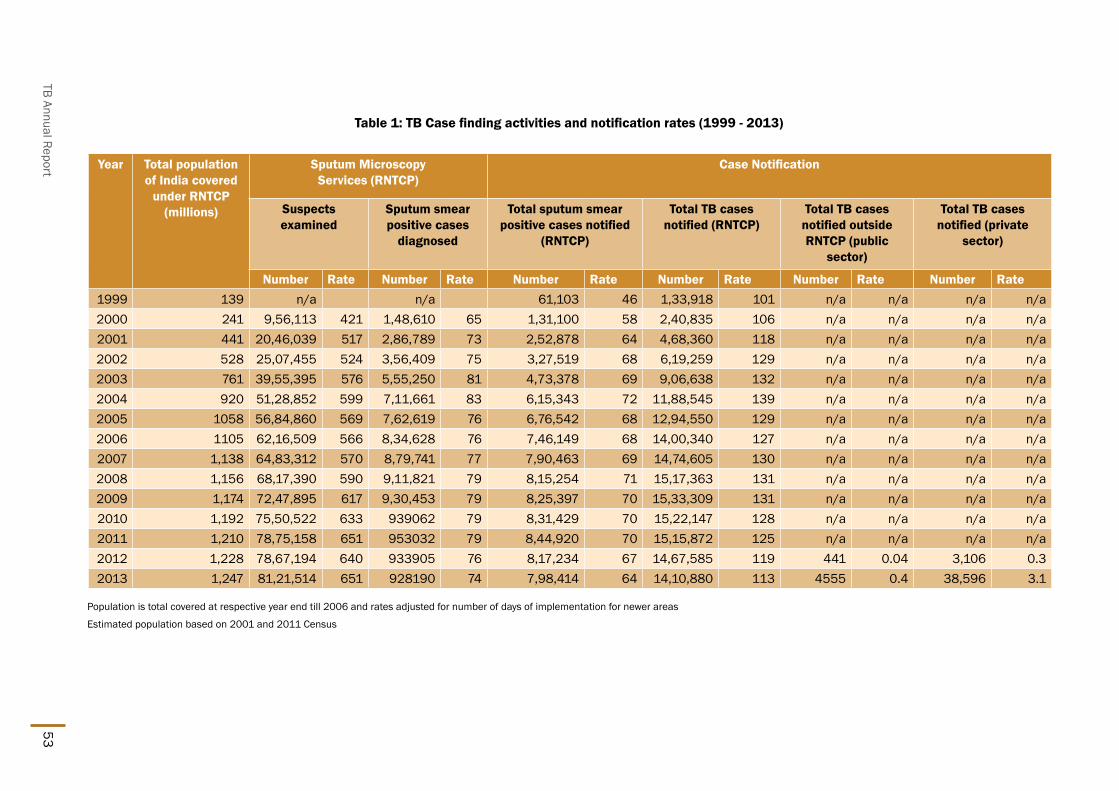
TB Annual Report53
Table 1: TB Case finding activities and notification rates (1999 - 2013)
Year Total population of India covered
under RNTCP (millions)
Sputum Microscopy Services (RNTCP)
Case Notification
Suspects examined
Sputum smear positive cases
diagnosed
Total sputum smear positive cases notified
(RNTCP)
Total TB cases notified (RNTCP)
Total TB cases notified outside RNTCP (public
sector)
Total TB cases notified (private
sector)
Number Rate Number Rate Number Rate Number Rate Number Rate Number Rate1999 139 n/a n/a 61,103 46 1,33,918 101 n/a n/a n/a n/a 2000 241 9,56,113 421 1,48,610 65 1,31,100 58 2,40,835 106 n/a n/a n/a n/a 2001 441 20,46,039 517 2,86,789 73 2,52,878 64 4,68,360 118 n/a n/a n/a n/a 2002 528 25,07,455 524 3,56,409 75 3,27,519 68 6,19,259 129 n/a n/a n/a n/a 2003 761 39,55,395 576 5,55,250 81 4,73,378 69 9,06,638 132 n/a n/a n/a n/a 2004 920 51,28,852 599 7,11,661 83 6,15,343 72 11,88,545 139 n/a n/a n/a n/a 2005 1058 56,84,860 569 7,62,619 76 6,76,542 68 12,94,550 129 n/a n/a n/a n/a 2006 1105 62,16,509 566 8,34,628 76 7,46,149 68 14,00,340 127 n/a n/a n/a n/a 2007 1,138 64,83,312 570 8,79,741 77 7,90,463 69 14,74,605 130 n/a n/a n/a n/a 2008 1,156 68,17,390 590 9,11,821 79 8,15,254 71 15,17,363 131 n/a n/a n/a n/a 2009 1,174 72,47,895 617 9,30,453 79 8,25,397 70 15,33,309 131 n/a n/a n/a n/a 2010 1,192 75,50,522 633 939062 79 8,31,429 70 15,22,147 128 n/a n/a n/a n/a 2011 1,210 78,75,158 651 953032 79 8,44,920 70 15,15,872 125 n/a n/a n/a n/a 2012 1,228 78,67,194 640 933905 76 8,17,234 67 14,67,585 119 441 0.04 3,106 0.32013 1,247 81,21,514 651 928190 74 7,98,414 64 14,10,880 113 4555 0.4 38,596 3.1
Population is total covered at respective year end till 2006 and rates adjusted for number of days of implementation for newer areas
Estimated population based on 2001 and 2011 Census

54
Figure 1: Rate of TB
suspect examined and sm
ear positive TB cases diagnosed per 100,000 population
Figure 2: Trends in suspects examined per sm
ear positive TB case diagnosed (2000-2013)
Chapter 5: RN
TCP performance: notification and Treatm
ent Outcom
e trends
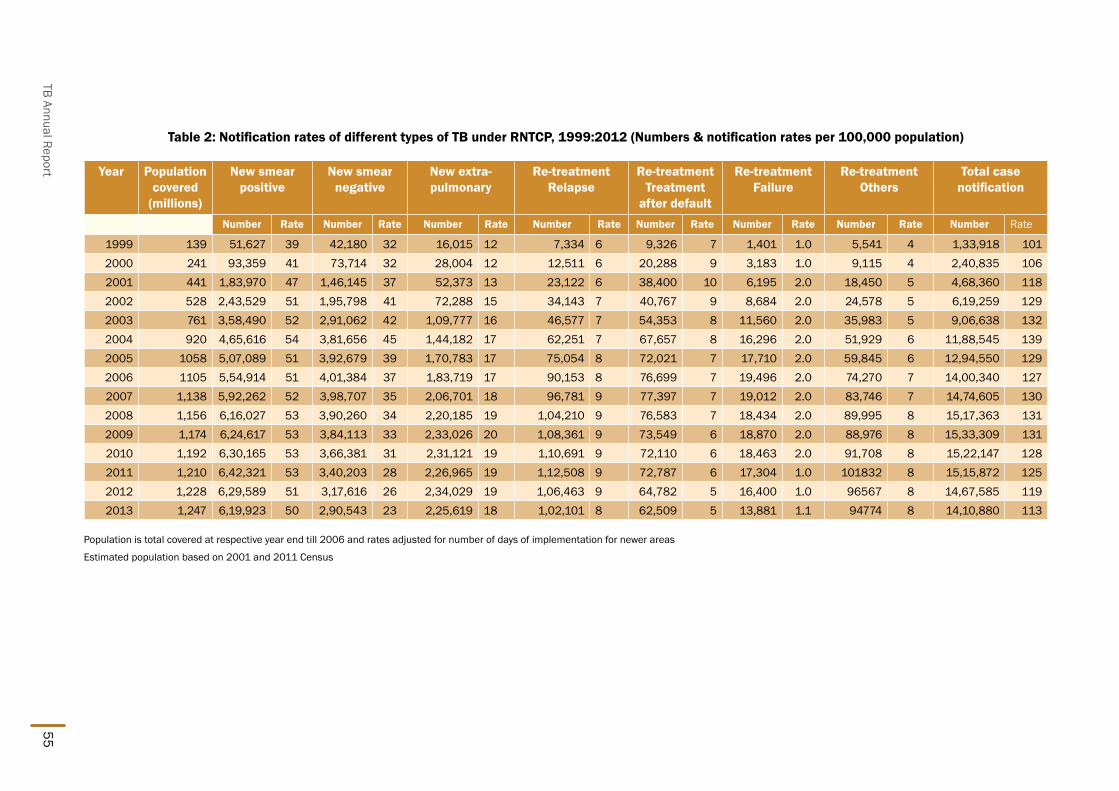
TB Annual Report55
Table 2: Notification rates of different types of TB under RNTCP, 1999:2012 (Numbers & notification rates per 100,000 population)
Year Population covered
(millions)
New smear positive
New smear negative
New extra-pulmonary
Re-treatment Relapse
Re-treatment Treatment
after default
Re-treatment Failure
Re-treatment Others
Total case notification
Number Rate Number Rate Number Rate Number Rate Number Rate Number Rate Number Rate Number Rate
1999 139 51,627 39 42,180 32 16,015 12 7,334 6 9,326 7 1,401 1.0 5,541 4 1,33,918 1012000 241 93,359 41 73,714 32 28,004 12 12,511 6 20,288 9 3,183 1.0 9,115 4 2,40,835 1062001 441 1,83,970 47 1,46,145 37 52,373 13 23,122 6 38,400 10 6,195 2.0 18,450 5 4,68,360 1182002 528 2,43,529 51 1,95,798 41 72,288 15 34,143 7 40,767 9 8,684 2.0 24,578 5 6,19,259 1292003 761 3,58,490 52 2,91,062 42 1,09,777 16 46,577 7 54,353 8 11,560 2.0 35,983 5 9,06,638 1322004 920 4,65,616 54 3,81,656 45 1,44,182 17 62,251 7 67,657 8 16,296 2.0 51,929 6 11,88,545 1392005 1058 5,07,089 51 3,92,679 39 1,70,783 17 75,054 8 72,021 7 17,710 2.0 59,845 6 12,94,550 1292006 1105 5,54,914 51 4,01,384 37 1,83,719 17 90,153 8 76,699 7 19,496 2.0 74,270 7 14,00,340 1272007 1,138 5,92,262 52 3,98,707 35 2,06,701 18 96,781 9 77,397 7 19,012 2.0 83,746 7 14,74,605 1302008 1,156 6,16,027 53 3,90,260 34 2,20,185 19 1,04,210 9 76,583 7 18,434 2.0 89,995 8 15,17,363 1312009 1,174 6,24,617 53 3,84,113 33 2,33,026 20 1,08,361 9 73,549 6 18,870 2.0 88,976 8 15,33,309 1312010 1,192 6,30,165 53 3,66,381 31 2,31,121 19 1,10,691 9 72,110 6 18,463 2.0 91,708 8 15,22,147 1282011 1,210 6,42,321 53 3,40,203 28 2,26,965 19 1,12,508 9 72,787 6 17,304 1.0 101832 8 15,15,872 1252012 1,228 6,29,589 51 3,17,616 26 2,34,029 19 1,06,463 9 64,782 5 16,400 1.0 96567 8 14,67,585 1192013 1,247 6,19,923 50 2,90,543 23 2,25,619 18 1,02,101 8 62,509 5 13,881 1.1 94774 8 14,10,880 113
Population is total covered at respective year end till 2006 and rates adjusted for number of days of implementation for newer areas
Estimated population based on 2001 and 2011 Census

56
Figure 3: Trends in type of TB case notification rate (1999-2013)
all n
ew
(inc
ide
nt) t
B C
ase
no
tific
atio
nThe num
ber and rate of all new (incident) cases notified in the country has steadily increased at the rate of
7% annually for several years initially in the im
plementation of the program
me starting from
83 per 100,000 population in 1999 to 116 per 100,000 population in 2004, w
ith almost 40%
increase in half a decade (Figure 5). The decline began after com
plete coverage in the country, and the all new (incident) TB case notification rate
has decreased from 116 per 100,000 population in 2004 to 91 per 100,000 population in year 2013 show
ing a decline of 20%
, almost 2%
annually. This is corroborative with the findings of repeat ARTI surveys, suggesting
declining transmission rates in the com
munity.
tre
atm
en
t ou
tco
me
s of n
otifi
ed
tB
Ca
ses
Treatment outcom
es of pulmonary sputum
-positive cases notified under RNTCP is sum
marized in Table 3.
Among N
SP cases, the treatment success rate has been > 85%
since the year 2001. The death rate and failure rate has been about 5%
and 2% respectively. The default rates has decreased from
9% for the cohort of
TB patients registered in 1999 to 6% for the cohort of patients registered in 2012. Am
ong smear positive re-
treatment cases the treatm
ent success rate has been ~70% since im
plementation. The death rate has show
n increase from
7% to 8%
, failure rate about 6%. H
igh default rates > 15% has been an area of concern am
ong the re-treatm
ent cases. The treatment success rate has been relatively less favorable am
ong re-treatment TAD
cases and failure cases (Table 4) w
hen compared to the treatm
ent success rate among other sm
ear positive TB cases (N
SP and relapse).
Death rates am
ong re-treatment cases have been higher w
hen compared to the death rates am
ong new sm
ear positive TB cases (Table 3 and Table 4). Am
ong re-treatment cases, the death rates am
ong failure cases has been consistently higher by about 1-2%
when com
pared to the death rates among other types of re-treatm
ent cases.
Chapter 5: RN
TCP performance: notification and Treatm
ent Outcom
e trends

TB Annual Report57
Figure 4: Trends in type of re-treatment TB
case notification rate (1999-2013)
Figure 5: Trend in incident TB case notification rate (1999-2013)

58
Table 3: Treatment outcomes among notified new TB cases, 1999–2012
New smear positive New smear negative New Extra PulmonaryYear Success Death Failure Default Success Death Failure Default Success Death Failure Default1999 82% 5% 3% 9% 85% 4% 1% 9% 91% 2% 0% 6%2000 84% 4% 3% 8% 86% 3% 1% 9% 91% 2% 0% 7%2001 85% 5% 3% 7% 86% 4% 1% 8% 91% 2% 0% 6%2002 87% 4% 3% 6% 87% 4% 1% 7% 92% 2% 0% 5%2003 86% 5% 2% 6% 87% 4% 1% 7% 92% 2% 0% 5%2004 86% 4% 2% 7% 87% 4% 1% 8% 92% 2% 0% 5%2005 86% 5% 2% 7% 87% 4% 1% 8% 91% 2% 0% 6%2006 86% 5% 2% 6% 87% 4% 1% 8% 90% 3% 0% 5%2007 87% 5% 2% 6% 87% 3% 1% 8% 91% 2% 0% 5%2008 87% 4% 2% 6% 88% 3% 1% 7% 92% 3% 0% 4%2009 87% 4% 2% 6% 88% 3% 1% 7% 92% 2% 0% 4%2010 88% 4% 2% 6% 89% 3% 1% 7% 93% 3% 0% 4%2011 88% 4% 2% 5% 89% 3% 0% 7% 93% 2% 0% 4%2012 87% 4% 2% 6% 89% 4% 0% 6% 93% 2% 0% 3%
The year shown is the year of registration
Chapter 5: RN
TCP performance: notification and Treatm
ent Outcom
e trends

TB Annual Report59
Table 4: Treatment outcomes among notified smear-positive re-treatment TB cases, 1999–2012
Year Relapse Failure Treatment After Default Total Smear positive Re-treatmentSuccess Death Failure Default Success Death Failure Default Success Death Failure Default Success Death Failure Default
1999 73% 7% 6% 13% 61% 7% 13% 17% 65% 7% 6% 21% 68% 7% 6% 18%2000 73% 7% 6% 14% 57% 9% 14% 19% 69% 7% 5% 17% 69% 7% 6% 16%2001 74% 7% 6% 12% 59% 9% 15% 16% 71% 7% 5% 16% 71% 7% 6% 15%2002 75% 7% 6% 12% 60% 8% 15% 16% 71% 7% 5% 16% 72% 7% 6% 14%2003 75% 7% 5% 12% 60% 9% 14% 16% 69% 8% 5% 18% 70% 8% 6% 15%2004 74% 7% 5% 13% 62% 8% 13% 16% 69% 7% 4% 18% 71% 7% 6% 16%2005 73% 7% 5% 14% 59% 8% 14% 18% 67% 8% 4% 20% 69% 7% 6% 17%2006 73% 7% 5% 14% 58% 9% 14% 18% 66% 8% 4% 19% 69% 8% 6% 16%2007 74% 7% 4% 12% 60% 9% 13% 16% 68% 8% 4% 18% 70% 8% 5% 15%2008 75% 7% 5% 12% 59% 9% 14% 16% 68% 8% 4% 17% 71% 8% 5% 14%2009 75% 7% 5% 12% 58% 10% 16% 15% 68% 8% 4% 17% 71% 8% 6% 14%2010 75% 7% 5% 12% 57% 10% 15% 16% 68% 8% 4% 18% 71% 8% 5% 14%2011 75% 7% 5% 11% 55% 10% 15% 16% 68% 8% 4% 17% 71% 8% 5% 14%2012 74% 7% 4% 11% 54% 9% 12% 15% 66% 8% 3% 17% 70% 8% 5% 14%
The year shown is the year of registration
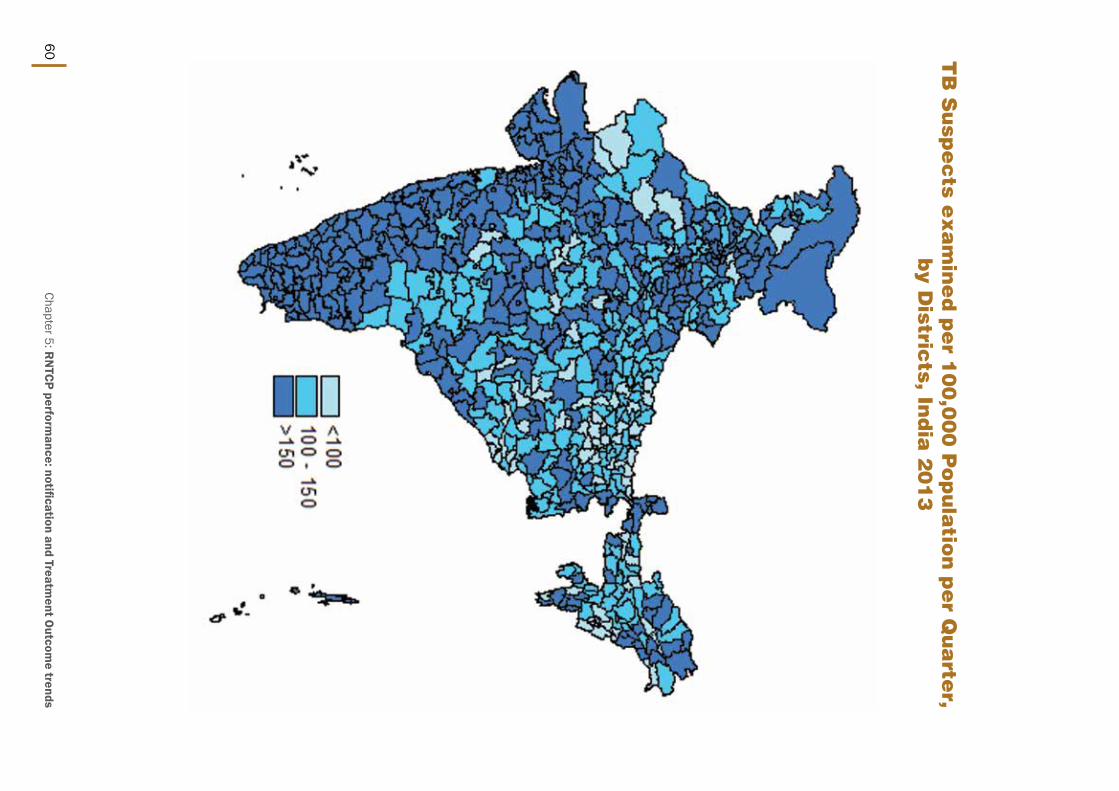
60 tB
su
spe
cts e
xa
min
ed
pe
r 10
0,0
00
po
pu
latio
n p
er Q
ua
rter,
by D
istricts, in
dia
20
13
Chapter 5: RN
TCP performance: notification and Treatm
ent Outcom
e trends

TB Annual Report61
inc
ide
nt t
B c
ase
no
tifie
d p
er 1
,00
,00
0 p
op
ula
tion
by
Distric
t, ind
ia 2
01
3
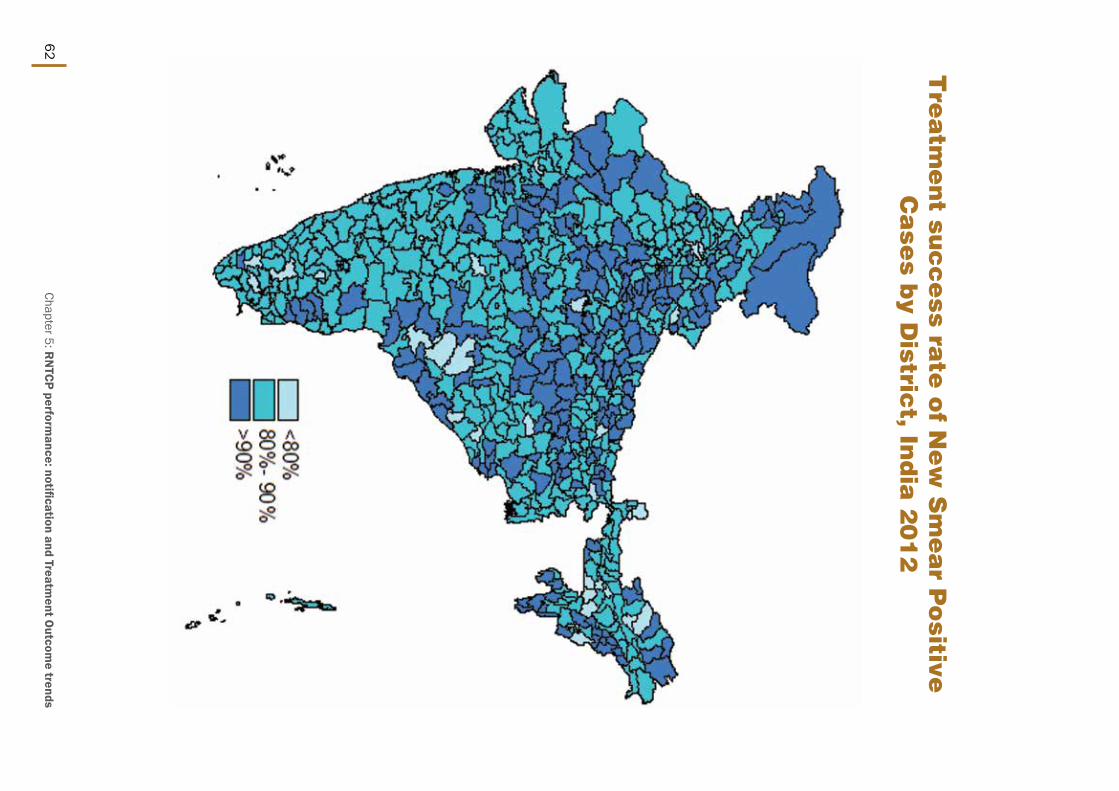
62
tre
atm
en
t suc
ce
ss rate
of n
ew
sm
ea
r po
sitive
Ca
ses b
y Distric
t, ind
ia 2
01
2
Chapter 5: RN
TCP performance: notification and Treatm
ent Outcom
e trends

TB Annual Report63
tre
atm
en
t suc
ce
ss rate
of r
e-tre
atm
en
t sm
ea
r p
ositive
Ca
ses b
y Distric
t, ind
ia 2
01
2

64

TB Annual Report65
State and District W
ise A
nnualized Performance 2013

State and District W
ise Annualized Performance 2013
66
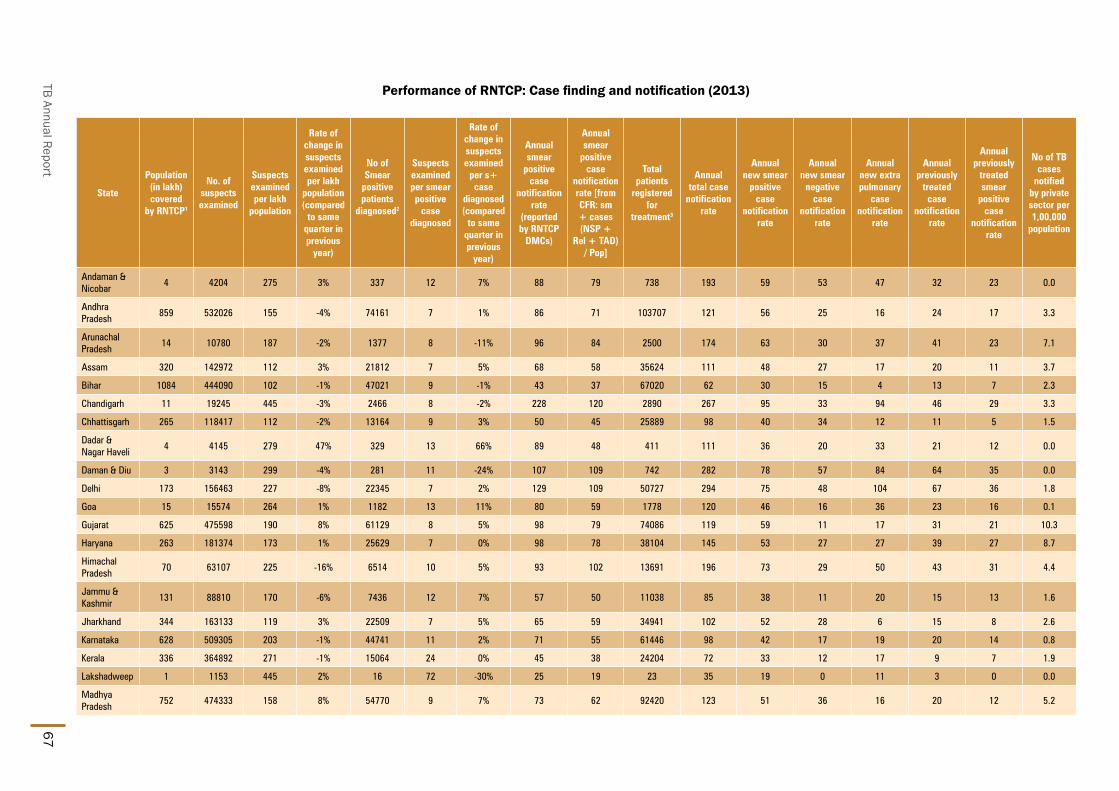
TB Annual Report67
Performance of RNTCP: Case finding and notification (2013)
State
Population (in lakh) covered
by RNTCP1
No. of suspects examined
Suspects examined per lakh
population
Rate of change in suspects examined per lakh
population (compared
to same quarter in previous
year)
No of Smear
positive patients
diagnosed2
Suspects examined per smear positive
case diagnosed
Rate of change in suspects examined
per s+ case
diagnosed (compared
to same quarter in previous
year)
Annual smear
positive case
notification rate
(reported by RNTCP
DMCs)
Annual smear
positive case
notification rate [from CFR: sm + cases (NSP +
Rel + TAD) / Pop]
Total patients
registered for
treatment3
Annual total case
notification rate
Annual new smear
positive case
notification rate
Annual new smear
negative case
notification rate
Annual new extra pulmonary
case notification
rate
Annual previously
treated case
notification rate
Annual previously
treated smear
positive case
notification rate
No of TB cases
notified by private sector per 1,00,000
population
Andaman & Nicobar
4 4204 275 3% 337 12 7% 88 79 738 193 59 53 47 32 23 0.0
Andhra Pradesh
859 532026 155 -4% 74161 7 1% 86 71 103707 121 56 25 16 24 17 3.3
Arunachal Pradesh
14 10780 187 -2% 1377 8 -11% 96 84 2500 174 63 30 37 41 23 7.1
Assam 320 142972 112 3% 21812 7 5% 68 58 35624 111 48 27 17 20 11 3.7
Bihar 1084 444090 102 -1% 47021 9 -1% 43 37 67020 62 30 15 4 13 7 2.3
Chandigarh 11 19245 445 -3% 2466 8 -2% 228 120 2890 267 95 33 94 46 29 3.3
Chhattisgarh 265 118417 112 -2% 13164 9 3% 50 45 25889 98 40 34 12 11 5 1.5
Dadar & Nagar Haveli
4 4145 279 47% 329 13 66% 89 48 411 111 36 20 33 21 12 0.0
Daman & Diu 3 3143 299 -4% 281 11 -24% 107 109 742 282 78 57 84 64 35 0.0
Delhi 173 156463 227 -8% 22345 7 2% 129 109 50727 294 75 48 104 67 36 1.8
Goa 15 15574 264 1% 1182 13 11% 80 59 1778 120 46 16 36 23 16 0.1
Gujarat 625 475598 190 8% 61129 8 5% 98 79 74086 119 59 11 17 31 21 10.3
Haryana 263 181374 173 1% 25629 7 0% 98 78 38104 145 53 27 27 39 27 8.7
Himachal Pradesh
70 63107 225 -16% 6514 10 5% 93 102 13691 196 73 29 50 43 31 4.4
Jammu & Kashmir
131 88810 170 -6% 7436 12 7% 57 50 11038 85 38 11 20 15 13 1.6
Jharkhand 344 163133 119 3% 22509 7 5% 65 59 34941 102 52 28 6 15 8 2.6
Karnataka 628 509305 203 -1% 44741 11 2% 71 55 61446 98 42 17 19 20 14 0.8
Kerala 336 364892 271 -1% 15064 24 0% 45 38 24204 72 33 12 17 9 7 1.9
Lakshadweep 1 1153 445 2% 16 72 -30% 25 19 23 35 19 0 11 3 0 0.0
Madhya Pradesh
752 474333 158 8% 54770 9 7% 73 62 92420 123 51 36 16 20 12 5.2

State and District W
ise Annualized Performance 2013
68
State
Population (in lakh) covered
by RNTCP1
No. of suspects examined
Suspects examined per lakh
population
Rate of change in suspects examined per lakh
population (compared
to same quarter in previous
year)
No of Smear
positive patients
diagnosed2
Suspects examined per smear positive
case diagnosed
Rate of change in suspects examined
per s+ case
diagnosed (compared
to same quarter in previous
year)
Annual smear
positive case
notification rate
(reported by RNTCP
DMCs)
Annual smear
positive case
notification rate [from CFR: sm + cases (NSP +
Rel + TAD) / Pop]
Total patients
registered for
treatment3
Annual total case
notification rate
Annual new smear
positive case
notification rate
Annual new smear
negative case
notification rate
Annual new extra pulmonary
case notification
rate
Annual previously
treated case
notification rate
Annual previously
treated smear
positive case
notification rate
No of TB cases
notified by private sector per 1,00,000
population
Maharashtra 1153 879121 191 14% 80068 11 10% 69 59 137237 119 46 23 22 27 14 9.6
Manipur 28 8125 72 -33% 926 9 -13% 33 36 2329 83 29 20 20 14 8 0.0
Meghalaya 31 24638 198 -2% 2366 10 11% 76 68 5002 160 53 26 46 34 19 32.3
Mizoram 11 8589 190 1% 711 12 13% 63 57 2005 178 44 30 72 32 14 0.8
Nagaland 20 14469 181 -4% 1566 9 9% 78 79 3339 167 61 35 35 35 21 14.1
Orissa 429 200964 117 -12% 27818 7 -5% 65 57 45269 105 48 21 21 14 9 0.0
Pondicherry 13 24192 465 4% 2727 9 5% 210 65 1458 112 53 12 30 17 14 0.0
Punjab 284 186568 164 -8% 23864 8 -5% 84 73 37258 131 52 22 28 29 22 1.6
Rajasthan 711 448894 158 8% 63028 7 17% 89 71 94698 133 52 34 20 27 20 0.7
Sikkim 6 7685 310 0% 796 10 0% 128 110 1637 264 85 50 77 52 32 0.0
Tamil Nadu 742 659389 222 7% 52769 12 0% 71 60 80407 108 48 23 20 17 13 2.5
Tripura 37 20020 134 -6% 1746 11 -3% 47 42 2540 68 36 12 11 9 7 0.0
Uttar Pradesh 2068 1239375 150 0% 176153 7 3% 85 76 256733 124 62 27 14 22 15 0.3
Uttarakhand 105 64102 153 -13% 9711 7 -4% 93 70 13700 131 49 26 24 31 22 0.3
West Bengal 932 562619 151 1% 61658 9 1% 66 58 90423 97 48 13 18 18 13 0.3
Grand Total 12471 8121514 163 2% 928190 9 4% 74 79 1416014 114 63 30 21 27 17 3.1
1. Projected population based on census population of 2011 is used for calculation of case-detection rate. 1 lakh = 100,000 population
2. Smear positive patients diagnosed include new smear positive cases and smear positive retreatment cases, data from DMCs
3. Total patients registered for treatment includes new sputum smear positive cases, new smear negative cases, new EP cases, new others, relapse, failure, TAD and retreatment others
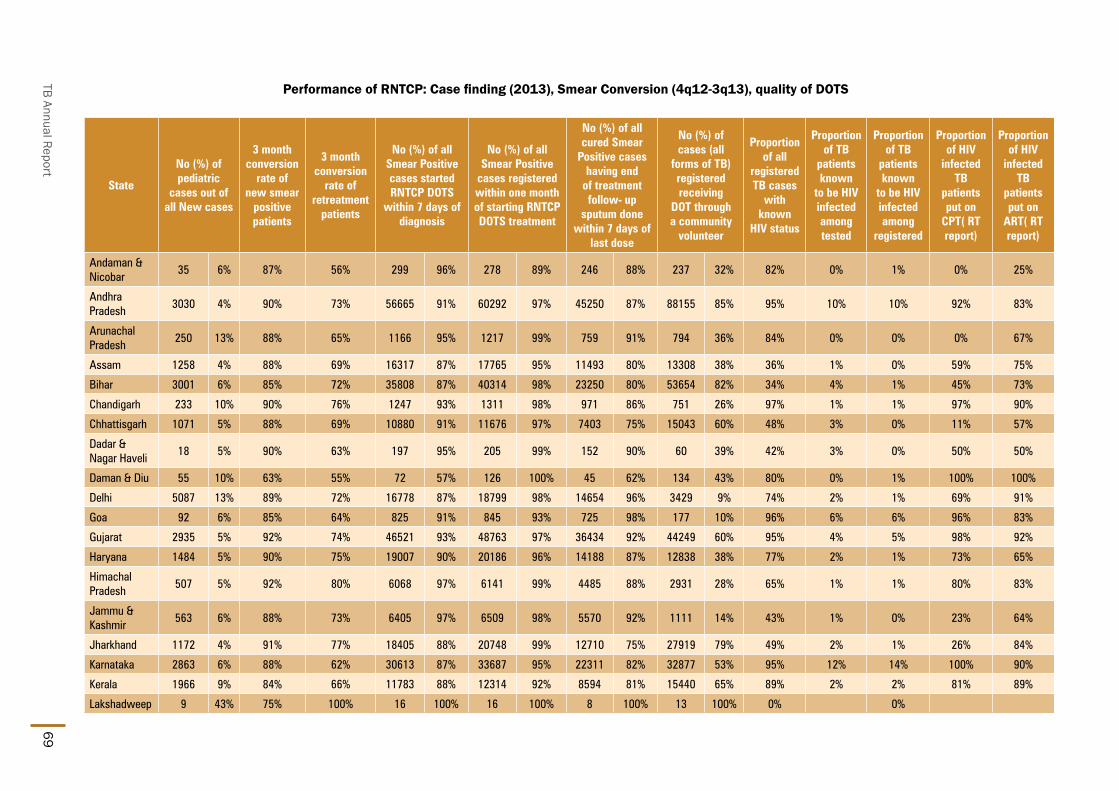
TB Annual Report69
Performance of RNTCP: Case finding (2013), Smear Conversion (4q12-3q13), quality of DOTS
State
No (%) of pediatric
cases out of all New cases
3 month conversion
rate of new smear
positive patients
3 month conversion
rate of retreatment
patients
No (%) of all Smear Positive cases started RNTCP DOTS
within 7 days of diagnosis
No (%) of all Smear Positive
cases registered within one month of starting RNTCP DOTS treatment
No (%) of all cured Smear
Positive cases having end
of treatment follow- up
sputum done within 7 days of
last dose
No (%) of cases (all
forms of TB) registered receiving
DOT through a community
volunteer
Proportion of all
registered TB cases
with known
HIV status
Proportion of TB
patients known
to be HIV infected among tested
Proportion of TB
patients known
to be HIV infected among
registered
Proportion of HIV
infected TB
patients put on
CPT( RT report)
Proportion of HIV
infected TB
patients put on
ART( RT report)
Andaman & Nicobar
35 6% 87% 56% 299 96% 278 89% 246 88% 237 32% 82% 0% 1% 0% 25%
Andhra Pradesh
3030 4% 90% 73% 56665 91% 60292 97% 45250 87% 88155 85% 95% 10% 10% 92% 83%
Arunachal Pradesh
250 13% 88% 65% 1166 95% 1217 99% 759 91% 794 36% 84% 0% 0% 0% 67%
Assam 1258 4% 88% 69% 16317 87% 17765 95% 11493 80% 13308 38% 36% 1% 0% 59% 75%
Bihar 3001 6% 85% 72% 35808 87% 40314 98% 23250 80% 53654 82% 34% 4% 1% 45% 73%
Chandigarh 233 10% 90% 76% 1247 93% 1311 98% 971 86% 751 26% 97% 1% 1% 97% 90%
Chhattisgarh 1071 5% 88% 69% 10880 91% 11676 97% 7403 75% 15043 60% 48% 3% 0% 11% 57%
Dadar & Nagar Haveli
18 5% 90% 63% 197 95% 205 99% 152 90% 60 39% 42% 3% 0% 50% 50%
Daman & Diu 55 10% 63% 55% 72 57% 126 100% 45 62% 134 43% 80% 0% 1% 100% 100%
Delhi 5087 13% 89% 72% 16778 87% 18799 98% 14654 96% 3429 9% 74% 2% 1% 69% 91%
Goa 92 6% 85% 64% 825 91% 845 93% 725 98% 177 10% 96% 6% 6% 96% 83%
Gujarat 2935 5% 92% 74% 46521 93% 48763 97% 36434 92% 44249 60% 95% 4% 5% 98% 92%
Haryana 1484 5% 90% 75% 19007 90% 20186 96% 14188 87% 12838 38% 77% 2% 1% 73% 65%
Himachal Pradesh
507 5% 92% 80% 6068 97% 6141 99% 4485 88% 2931 28% 65% 1% 1% 80% 83%
Jammu & Kashmir
563 6% 88% 73% 6405 97% 6509 98% 5570 92% 1111 14% 43% 1% 0% 23% 64%
Jharkhand 1172 4% 91% 77% 18405 88% 20748 99% 12710 75% 27919 79% 49% 2% 1% 26% 84%
Karnataka 2863 6% 88% 62% 30613 87% 33687 95% 22311 82% 32877 53% 95% 12% 14% 100% 90%
Kerala 1966 9% 84% 66% 11783 88% 12314 92% 8594 81% 15440 65% 89% 2% 2% 81% 89%
Lakshadweep 9 43% 75% 100% 16 100% 16 100% 8 100% 13 100% 0% 0%

State and District W
ise Annualized Performance 2013
70
State
No (%) of pediatric
cases out of all New cases
3 month conversion
rate of new smear
positive patients
3 month conversion
rate of retreatment
patients
No (%) of all Smear Positive cases started RNTCP DOTS
within 7 days of diagnosis
No (%) of all Smear Positive
cases registered within one month of starting RNTCP DOTS treatment
No (%) of all cured Smear
Positive cases having end
of treatment follow- up
sputum done within 7 days of
last dose
No (%) of cases (all
forms of TB) registered receiving
DOT through a community
volunteer
Proportion of all
registered TB cases
with known
HIV status
Proportion of TB
patients known
to be HIV infected among tested
Proportion of TB
patients known
to be HIV infected among
registered
Proportion of HIV
infected TB
patients put on
CPT( RT report)
Proportion of HIV
infected TB
patients put on
ART( RT report)
Madhya Pradesh
6264 8% 91% 71% 41960 89% 45664 97% 29410 79% 58900 66% 50% 1% 0% 51% 86%
Maharashtra 6687 6% 90% 64% 62654 90% 68365 98% 43756 84% 58687 46% 87% 9% 9% 98% 86%
Manipur 106 5% 88% 74% 686 94% 698 96% 517 84% 1015 69% 73% 8% 8% 47% 51%
Meghalaya 448 11% 84% 61% 1919 91% 1980 94% 1225 84% 2254 49% 29% 1% 0% 100% 75%
Mizoram 154 9% 94% 74% 654 100% 651 99% 557 91% 448 22% 80% 13% 12% 91% 50%
Nagaland 299 11% 93% 84% 1299 89% 1365 93% 1013 80% 1528 58% 82% 7% 6% 86% 54%
Orissa 1901 5% 88% 68% 20593 84% 24090 98% 15226 75% 35379 78% 59% 2% 1% 46% 63%
Pondicherry 90 7% 92% 81% 785 90% 774 88% 633 96% 0 98% 3% 3% 95% 95%
Punjab 1541 5% 89% 76% 20026 92% 21292 98% 16511 93% 13579 36% 86% 1% 1% 90% 87%
Rajasthan 3598 5% 91% 78% 41615 82% 48880 96% 36743 81% 17275 19% 48% 1% 0% 78% 85%
Sikkim 117 9% 82% 63% 708 98% 718 99% 522 97% 605 37% 81% 0% 0% 100% 100%
Tamil Nadu 3385 5% 90% 70% 37621 83% 43621 96% 27665 82% 20872 26% 92% 6% 6% 90% 79%
Tripura 61 3% 90% 72% 1329 83% 1573 98% 1107 80% 1062 42% 68% 1% 1% 81% 63%
Uttar Pradesh 9920 5% 91% 76% 141830 90% 156018 99% 115595 86% 182844 74% 25% 2% 0% 21% 62%
Uttarakhand 632 6% 86% 71% 6312 87% 6873 95% 5119 87% 7719 60% 58% 1% 0% 67% 76%
West Bengal 3087 4% 87% 66% 45948 82% 53485 95% 37846 87% 20782 24% 64% 2% 1% 91% 83%
Grand Total 63919 5% 90% 72% 705011 88% 777239 97% 542693 84% 736069 54% 63% 5% 3% 91% 84%

TB Annual Report71
StatePopulation (in lakh) covered by RNTCP1
Number of health facilities
registered in 2013
Number of health facilities
registered (Laboratories
- Private)
Number of health facilities
registered (Single clinic
- Private)
Number of health facilities
registered (Multi-clicnic -
Private)
Number of patients
notified by (Laboratories
- Private)
Number of patients
notified by (Single clinic
- Private)
Number of patients
notified by (Multi-clinic -
Private)
No of TB patients
notification by private sector
No of TB cases notified
by private sector per 1,00,000
population
Andaman & Nicobar
4 0 0 0 0 0 0 0 0 0.0
Andhra Pradesh 859 3551 309 923 2254 48 617 2133 2798 3.3
Arunachal Pradesh
14 18 0 0 8 0 0 102 102 7.1
Assam 320 416 16 257 90 81 665 440 1186 3.7
Bihar 1084 2633 164 1918 164 153 2135 211 2499 2.3
Chandigarh 11 106 0 101 2 0 30 6 36 3.3
Chhattisgarh 265 720 98 374 209 0 37 361 398 1.5
Dadar & Nagar Haveli
4 0 0 0 0 0 0 0 0 0.0
Daman & Diu 3 8 0 8 0 0 0 0 0 0.0
Delhi 173 608 68 309 209 0 136 172 308 1.8
Goa 15 401 0 398 3 0 0 2 2 0.1
Gujarat 625 3275 51 2175 740 35 3144 3270 6449 10.3
Haryana 263 580 53 146 364 17 260 2012 2289 8.7
Himachal Pradesh 70 459 74 279 104 3 59 249 311 4.4
Jammu & Kashmir
131 627 225 191 60 12 180 11 203 1.6
Jharkhand 344 208 30 85 84 2 576 309 887 2.6
Karnataka 628 6555 469 4794 1263 9 258 227 494 0.8
Kerala 336 5077 880 2129 1012 11 170 471 652 1.9
Lakshadweep 1 0 0 0 0 0 0 0 0 0.0
Madhya Pradesh 752 1096 69 571 330 58 2646 1231 3935 5.2
Maharashtra 1153 22766 1014 15875 5139 781 5061 5221 11063 9.6
TB case notificaiotn in 2013

State and District W
ise Annualized Performance 2013
72
StatePopulation (in lakh) covered by RNTCP1
Number of health facilities
registered in 2013
Number of health facilities
registered (Laboratories
- Private)
Number of health facilities
registered (Single clinic
- Private)
Number of health facilities
registered (Multi-clicnic -
Private)
Number of patients
notified by (Laboratories
- Private)
Number of patients
notified by (Single clinic
- Private)
Number of patients
notified by (Multi-clinic -
Private)
No of TB patients
notification by private sector
No of TB cases notified
by private sector per 1,00,000
population
Manipur 28 2 0 0 1 0 0 0 0 0.0
Meghalaya 31 32 1 19 11 0 365 642 1007 32.3
Mizoram 11 35 6 4 12 0 0 9 9 0.8
Nagaland 20 16 0 11 4 0 82 200 282 14.1
Orissa 429 9 0 0 1 0 0 2 2 0.0
Pondicherry 13 0 0 0 0 0 0 0 0 0.0
Punjab 284 1399 206 543 539 17 89 336 442 1.6
Rajasthan 711 478 21 178 261 0 131 370 501 0.7
Sikkim 6 1 0 0 0 0 0 0 0 0.0
Tamil Nadu 742 3088 144 2034 889 96 456 1293 1845 2.5
Tripura 37 9 0 3 5 0 0 1 1 0.0
Uttar Pradesh 2068 866 72 453 248 43 305 274 622 0.3
Uttarakhand 105 3 1 1 1 19 0 16 35 0.3
West Bengal 932 4016 853 1738 1165 45 133 60 238 0.3
Grand Total 12471 59058 4824 35517 15172 1430 17535 19631 38596 3.1
1. Projectedpopulationbasedoncensuspopulationof2011isusedforcalculationofcasenotificationrate1lakh=1,00,000population
2. NotificationinformationasperinformationinNikshay
3. Cohort for 2013 is based on Date of diagnosis reported
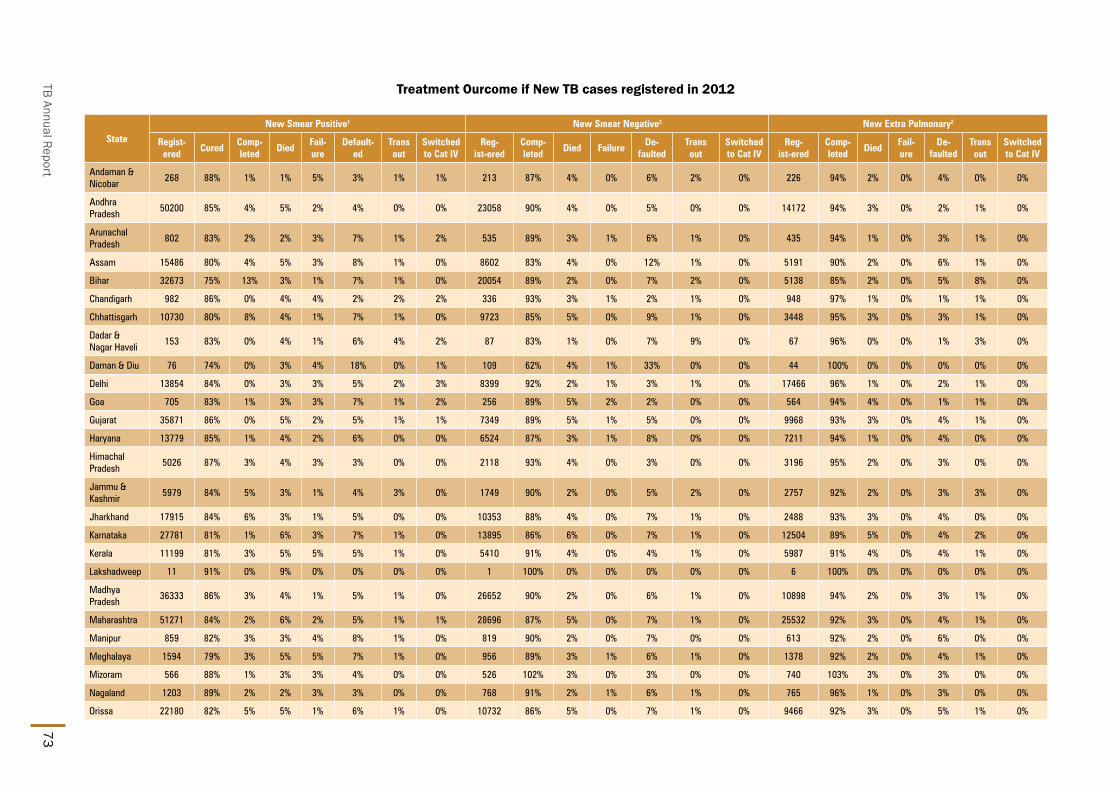
TB Annual Report73
Treatment Ourcome if New TB cases registered in 2012
State
New Smear Positive1 New Smear Negative2 New Extra Pulmonary2
Regist-ered
CuredComp- leted
Died Fail-ure
Default-ed
Trans out
Switched to Cat IV
Reg-ist-ered
Comp- leted
Died FailureDe-
faultedTrans out
Switched to Cat IV
Reg-ist-ered
Comp- leted
Died Fail-ure
De-faulted
Trans out
Switched to Cat IV
Andaman & Nicobar
268 88% 1% 1% 5% 3% 1% 1% 213 87% 4% 0% 6% 2% 0% 226 94% 2% 0% 4% 0% 0%
Andhra Pradesh
50200 85% 4% 5% 2% 4% 0% 0% 23058 90% 4% 0% 5% 0% 0% 14172 94% 3% 0% 2% 1% 0%
Arunachal Pradesh
802 83% 2% 2% 3% 7% 1% 2% 535 89% 3% 1% 6% 1% 0% 435 94% 1% 0% 3% 1% 0%
Assam 15486 80% 4% 5% 3% 8% 1% 0% 8602 83% 4% 0% 12% 1% 0% 5191 90% 2% 0% 6% 1% 0%
Bihar 32673 75% 13% 3% 1% 7% 1% 0% 20054 89% 2% 0% 7% 2% 0% 5138 85% 2% 0% 5% 8% 0%
Chandigarh 982 86% 0% 4% 4% 2% 2% 2% 336 93% 3% 1% 2% 1% 0% 948 97% 1% 0% 1% 1% 0%
Chhattisgarh 10730 80% 8% 4% 1% 7% 1% 0% 9723 85% 5% 0% 9% 1% 0% 3448 95% 3% 0% 3% 1% 0%
Dadar & Nagar Haveli
153 83% 0% 4% 1% 6% 4% 2% 87 83% 1% 0% 7% 9% 0% 67 96% 0% 0% 1% 3% 0%
Daman & Diu 76 74% 0% 3% 4% 18% 0% 1% 109 62% 4% 1% 33% 0% 0% 44 100% 0% 0% 0% 0% 0%
Delhi 13854 84% 0% 3% 3% 5% 2% 3% 8399 92% 2% 1% 3% 1% 0% 17466 96% 1% 0% 2% 1% 0%
Goa 705 83% 1% 3% 3% 7% 1% 2% 256 89% 5% 2% 2% 0% 0% 564 94% 4% 0% 1% 1% 0%
Gujarat 35871 86% 0% 5% 2% 5% 1% 1% 7349 89% 5% 1% 5% 0% 0% 9968 93% 3% 0% 4% 1% 0%
Haryana 13779 85% 1% 4% 2% 6% 0% 0% 6524 87% 3% 1% 8% 0% 0% 7211 94% 1% 0% 4% 0% 0%
Himachal Pradesh
5026 87% 3% 4% 3% 3% 0% 0% 2118 93% 4% 0% 3% 0% 0% 3196 95% 2% 0% 3% 0% 0%
Jammu & Kashmir
5979 84% 5% 3% 1% 4% 3% 0% 1749 90% 2% 0% 5% 2% 0% 2757 92% 2% 0% 3% 3% 0%
Jharkhand 17915 84% 6% 3% 1% 5% 0% 0% 10353 88% 4% 0% 7% 1% 0% 2488 93% 3% 0% 4% 0% 0%
Karnataka 27781 81% 1% 6% 3% 7% 1% 0% 13895 86% 6% 0% 7% 1% 0% 12504 89% 5% 0% 4% 2% 0%
Kerala 11199 81% 3% 5% 5% 5% 1% 0% 5410 91% 4% 0% 4% 1% 0% 5987 91% 4% 0% 4% 1% 0%
Lakshadweep 11 91% 0% 9% 0% 0% 0% 0% 1 100% 0% 0% 0% 0% 0% 6 100% 0% 0% 0% 0% 0%
Madhya Pradesh
36333 86% 3% 4% 1% 5% 1% 0% 26652 90% 2% 0% 6% 1% 0% 10898 94% 2% 0% 3% 1% 0%
Maharashtra 51271 84% 2% 6% 2% 5% 1% 1% 28696 87% 5% 0% 7% 1% 0% 25532 92% 3% 0% 4% 1% 0%
Manipur 859 82% 3% 3% 4% 8% 1% 0% 819 90% 2% 0% 7% 0% 0% 613 92% 2% 0% 6% 0% 0%
Meghalaya 1594 79% 3% 5% 5% 7% 1% 0% 956 89% 3% 1% 6% 1% 0% 1378 92% 2% 0% 4% 1% 0%
Mizoram 566 88% 1% 3% 3% 4% 0% 0% 526 102% 3% 0% 3% 0% 0% 740 103% 3% 0% 3% 0% 0%
Nagaland 1203 89% 2% 2% 3% 3% 0% 0% 768 91% 2% 1% 6% 1% 0% 765 96% 1% 0% 3% 0% 0%
Orissa 22180 82% 5% 5% 1% 6% 1% 0% 10732 86% 5% 0% 7% 1% 0% 9466 92% 3% 0% 5% 1% 0%

State and District W
ise Annualized Performance 2013
74
State
New Smear Positive1 New Smear Negative2 New Extra Pulmonary2
Regist-ered
CuredComp- leted
Died Fail-ure
Default-ed
Trans out
Switched to Cat IV
Reg-ist-ered
Comp- leted
Died FailureDe-
faultedTrans out
Switched to Cat IV
Reg-ist-ered
Comp- leted
Died Fail-ure
De-faulted
Trans out
Switched to Cat IV
Pondicherry 633 83% 0% 6% 5% 5% 0% 1% 192 87% 8% 1% 4% 0% 0% 358 97% 1% 0% 1% 0% 0%
Punjab 15642 83% 3% 5% 2% 5% 2% 0% 6483 89% 5% 1% 5% 1% 0% 8614 94% 3% 0% 2% 1% 0%
Rajasthan 39904 86% 3% 4% 1% 5% 0% 0% 25680 91% 3% 0% 6% 0% 0% 15044 95% 2% 0% 3% 0% 0%
Sikkim 494 79% 0% 4% 7% 1% 0% 8% 341 90% 2% 3% 1% 2% 1% 554 95% 4% 0% 1% 1% 0%
Tamil Nadu 33671 84% 1% 5% 2% 7% 0% 0% 18723 92% 4% 0% 4% 0% 0% 14674 96% 2% 0% 2% 0% 0%
Tripura 1393 87% 2% 5% 2% 4% 0% 0% 395 86% 7% 0% 6% 1% 0% 443 89% 5% 0% 6% 0% 0%
Uttar Pradesh 130268 86% 5% 3% 1% 6% 1% 0% 59951 90% 2% 0% 7% 1% 0% 32509 94% 1% 0% 3% 1% 0%
Uttarakhand 5558 81% 4% 4% 2% 7% 2% 0% 3178 87% 3% 1% 7% 3% 0% 2863 94% 1% 0% 3% 1% 0%
West Bengal 43838 83% 2% 4% 3% 6% 1% 0% 14292 85% 6% 0% 7% 1% 0% 17355 90% 4% 0% 4% 1% 0%
Grand Total 628897 84% 4% 4% 2% 6% 1% 0% 317155 89% 4% 0% 6% 1% 0% 233622 93% 2% 0% 3% 1% 0%
1. Treatment success for New Smear Positive is cured and treatment completed.
2. TreatmentsuccessforNewSmearNegativeandNewExtraPulmonaryaretreatmentcompleted.

TB Annual Report75
Outcome of Smear Positive Retreatment cases for India 2012 (excluding “Others”)
Type of retreatment
case
No. registered
Cured Success Died Failure Defaulted Transferred
outSwitched to Cat IV
Relapse 106370 67% 74% 7% 4% 11% 1% 3%
Failure 16384 47% 54% 9% 12% 15% 1% 8%
Treatment after default
64771 58% 66% 8% 3% 17% 3% 2%
Total 187525 62% 70% 8% 5% 14% 2% 3%
State-wise outcome of Smear Positive Retreatment cases 2012 (excluding “Others”)
State
Relapse Failure TAD
No. reg-istered
CuredSuc-cess
DiedFail-ure
De-fault-
ed
Trans-ferred
out
Switched to Cat IV
No. regis-tered
CuredSuc-cess
Died FailureDe-
faulted
Trans-ferred
out
Switched to Cat IV
No. regis-tered
CuredSuc-cess
DiedFail-ure
De-faulted
Trans-ferred
out
Switched to Cat IV
Andaman & Nicobar
50 62% 68% 16% 6% 6% 0% 4% 18 39% 39% 11% 22% 6% 6% 17% 17 47% 53% 35% 6% 6% 0% 0%
Andhra Pradesh
7530 70% 76% 8% 5% 9% 0% 2% 1516 49% 56% 11% 14% 13% 1% 5% 5709 61% 70% 10% 4% 13% 1% 2%
Arunachal Pradesh
161 75% 79% 1% 4% 8% 1% 7% 44 41% 41% 9% 18% 5% 0% 27% 85 53% 64% 9% 6% 12% 2% 7%
Assam 1861 57% 68% 8% 6% 16% 1% 1% 425 38% 49% 12% 16% 16% 1% 6% 1296 49% 58% 9% 4% 22% 5% 1%
Bihar 2948 62% 79% 6% 4% 10% 1% 1% 519 37% 51% 10% 16% 15% 2% 6% 4429 58% 77% 6% 2% 12% 1% 1%
Chandigarh 248 81% 81% 2% 3% 5% 3% 5% 66 65% 65% 8% 9% 5% 2% 12% 57 65% 65% 11% 2% 12% 5% 5%
Chhattisgarh 768 61% 74% 6% 4% 14% 1% 1% 149 47% 62% 5% 8% 20% 3% 2% 625 50% 66% 8% 4% 21% 1% 0%
Dadar & Nagar Haveli
50 62% 62% 6% 2% 20% 4% 6% 2 50% 50% 0% 0% 0% 50% 0% 18 50% 50% 6% 11% 28% 6% 0%
Daman & Diu 13 85% 85% 0% 0% 8% 0% 8% 4 0% 0% 0% 0% 100% 0% 0% 10 60% 60% 0% 10% 20% 0% 10%
Delhi 4045 70% 71% 5% 4% 7% 2% 11% 548 54% 55% 4% 8% 9% 3% 20% 1932 64% 64% 6% 2% 13% 3% 11%
Goa 168 66% 69% 4% 11% 13% 0% 4% 34 41% 41% 15% 15% 6% 3% 21% 60 55% 55% 2% 5% 30% 2% 7%
Gujarat 7658 69% 71% 8% 6% 13% 1% 2% 755 52% 54% 10% 13% 20% 1% 3% 4692 62% 64% 9% 5% 19% 2% 2%
Haryana 4560 70% 75% 7% 5% 12% 0% 1% 777 53% 61% 9% 10% 16% 1% 4% 2123 60% 67% 9% 4% 19% 1% 1%
Himachal Pradesh
1738 75% 82% 6% 5% 4% 0% 2% 216 50% 59% 11% 17% 7% 1% 5% 243 56% 69% 9% 5% 16% 0% 1%
Jammu & Kashmir
1261 73% 82% 4% 4% 6% 4% 0% 178 53% 58% 9% 13% 15% 4% 1% 346 62% 73% 5% 5% 13% 3% 0%

State and District W
ise Annualized Performance 2013
76
State
Relapse Failure TAD
No. reg-istered
CuredSuc-cess
DiedFail-ure
De-fault-
ed
Trans-ferred
out
Switched to Cat IV
No. regis-tered
CuredSuc-cess
Died FailureDe-
faulted
Trans-ferred
out
Switched to Cat IV
No. regis-tered
CuredSuc-cess
DiedFail-ure
De-faulted
Trans-ferred
out
Switched to Cat IV
Jharkhand 1605 65% 77% 6% 3% 9% 3% 2% 164 44% 55% 8% 16% 11% 0% 10% 1150 63% 75% 7% 2% 11% 2% 1%
Karnataka 4593 60% 64% 9% 8% 17% 1% 1% 1098 36% 41% 13% 17% 23% 1% 5% 3574 44% 49% 13% 6% 27% 5% 1%
Kerala 1229 69% 74% 6% 6% 7% 1% 5% 643 65% 70% 5% 10% 9% 1% 5% 598 42% 49% 12% 6% 29% 2% 2%
Lakshadweep 1 100% 100% 0% 0% 0% 0% 0% 0 0
Madhya Pradesh
5336 65% 76% 6% 3% 12% 1% 1% 898 45% 57% 10% 12% 16% 0% 5% 3912 55% 70% 8% 3% 16% 2% 1%
Maharashtra 10495 57% 62% 9% 4% 13% 2% 9% 1481 38% 42% 12% 11% 17% 1% 17% 4496 46% 52% 11% 4% 21% 4% 7%
Manipur 139 73% 78% 2% 8% 9% 1% 2% 34 44% 47% 9% 29% 9% 0% 6% 68 65% 72% 7% 4% 16% 0% 0%
Meghalaya 322 61% 68% 7% 9% 8% 1% 7% 171 25% 27% 6% 23% 18% 1% 25% 173 43% 47% 10% 13% 20% 6% 3%
Mizoram 126 70% 75% 6% 3% 8% 1% 9% 22 50% 55% 5% 32% 18% 0% 9% 23 43% 65% 0% 4% 26% 0% 4%
Nagaland 231 74% 84% 3% 4% 5% 0% 3% 74 54% 65% 8% 14% 7% 1% 5% 155 73% 80% 7% 5% 5% 2% 1%
Orissa 2126 59% 74% 8% 2% 13% 2% 1% 316 53% 64% 8% 7% 14% 2% 5% 1689 49% 63% 9% 2% 21% 4% 1%
Pondicherry 116 72% 72% 6% 10% 7% 0% 5% 39 51% 51% 10% 26% 13% 0% 0% 52 60% 63% 13% 4% 19% 0% 0%
Punjab 4844 69% 76% 8% 4% 9% 1% 1% 494 52% 60% 10% 10% 12% 3% 6% 1232 60% 66% 10% 4% 15% 3% 1%
Rajasthan 9462 71% 79% 6% 3% 10% 0% 2% 810 56% 68% 6% 8% 13% 0% 4% 5280 65% 74% 7% 3% 13% 0% 2%
Sikkim 183 65% 65% 6% 8% 2% 1% 19% 57 32% 32% 14% 12% 0% 2% 40% 27 33% 33% 22% 4% 11% 0% 30%
Tamil Nadu 4969 64% 69% 8% 4% 16% 1% 2% 730 41% 45% 11% 12% 22% 1% 9% 3661 53% 60% 9% 3% 26% 1% 1%
Tripura 193 75% 77% 7% 5% 9% 1% 1% 30 63% 63% 3% 3% 20% 0% 10% 31 48% 52% 19% 6% 19% 3% 0%
Uttar Pradesh 18984 72% 81% 5% 2% 11% 1% 0% 1842 54% 64% 8% 10% 17% 1% 1% 12835 64% 74% 6% 2% 14% 4% 0%
Uttarakhand 1596 67% 73% 6% 5% 12% 3% 1% 208 37% 42% 12% 18% 15% 3% 10% 746 53% 61% 8% 5% 15% 10% 1%
West Bengal 6761 69% 72% 8% 6% 11% 1% 2% 2022 45% 48% 8% 14% 15% 2% 14% 3427 52% 57% 10% 5% 23% 3% 2%
Grand Total 106370 67% 74% 7% 4% 11% 1% 3% 16384 47% 54% 9% 12% 15% 1% 8% 64771 58% 66% 8% 3% 17% 3% 2%

TB Annual Report77
Programme infrastructure, staffing and training status 2013
Implementing states
Total no. of reporting
units (Districts /
DTC)
Implementing district details
Involvement of Other sectors Number of key staff in positionIn Place and trained
in RNTCP
No. of TB Units
No. of DMCs
NGO PPMedical College
DTO 2nd MO MO-TC STS STLS LT MO Para Staff
Andaman & Nicobar
1 3 13 0 0 0 1 0 0 3 3 40 100% 100%
Andhra Pradesh 24 182 931 83 137 35 17 20 20 172 173 849 74% 85%
Arunachal Pradesh
14 15 34 17 0 0 14 1 1 13 13 44 69% 58%
Assam 26 76 345 22 0 5 26 7 7 75 76 421 77% 65%
Bihar 38 183 742 651 2 8 22 30 30 146 148 751 64% 71%
Chandigarh 1 3 17 5 76 2 1 1 1 3 3 17 100% 100%
Chhattisgarh 27 77 326 22 12 3 26 3 3 68 53 336 80% 79%
Dadar & Nagar Haveli
1 1 7 0 9 0 1 0 0 1 1 7 67% 89%
Daman & Diu 2 2 4 0 3 0 2 0 0 2 1 4 100% 100%
Delhi 25 40 196 48 44 9 24 11 11 41 36 190 76% 33%
Goa 2 4 20 2 48 1 2 0 0 3 3 20 99% 100%
Gujarat 30 144 757 145 4971 18 21 14 14 142 135 717 95% 96%
Haryana 21 65 252 30 45 6 19 10 10 66 49 246 72% 65%
Himachal Pradesh
12 49 193 4 42 2 12 2 2 51 48 156 76% 79%
Jammu & Kashmir
14 42 172 16 22 5 13 16 16 40 44 231 86% 91%
Jharkhand 24 117 300 34 4 2 21 9 9 66 66 427 69% 78%
Karnataka 31 141 665 61 82 42 29 7 7 134 128 630 86% 87%
Kerala 14 73 502 70 20 24 14 11 11 74 72 657 80% 81%
Lakshadweep 1 1 9 0 0 0 1 0 0 1 1 19 84% 100%
Madhya Pradesh
50 161 761 49 172 12 50 9 9 148 153 796 82% 86%

State and District W
ise Annualized Performance 2013
78
Implementing states
Total no. of reporting
units (Districts /
DTC)
Implementing district details
Involvement of Other sectors Number of key staff in positionIn Place and trained
in RNTCP
No. of TB Units
No. of DMCs
NGO PPMedical College
DTO 2nd MO MO-TC STS STLS LT MO Para Staff
Maharashtra 78 381 1441 330 6963 169 74 62 62 230 328 811 72% 93%
Manipur 9 13 55 298 14 12 9 9 9 3 6 2 52% 89%
Meghalaya 7 13 64 10 0 12 4 6 6 0 12 12 50% 86%
Mizoram 8 9 33 54 17 8 8 8 8 0 7 7 100% 100%
Nagaland 11 13 38 34 3 10 9 11 11 0 1 1 63% 78%
Orissa 31 111 549 44 0 104 31 33 33 6 109 96 35% 100%
Pondicherry 1 4 26 3 0 6 1 1 1 0 4 4 25% 100%
Punjab 20 58 284 41 215 58 18 18 18 7 56 53 45% 100%
Rajasthan 34 184 850 37 154 147 32 29 29 11 172 155 36% 91%
Sikkim 4 5 20 0 1 5 4 5 5 0 4 3 100% 100%
Tamil Nadu 31 193 805 160 88 164 24 25 25 23 182 154 32% 97%
Tripura 4 10 55 2 0 10 4 5 5 1 12 10 33% 100%
Uttar Pradesh 75 403 1890 135 62 364 63 54 54 41 416 379 33% 89%
Uttarakhand 13 31 151 9 5 28 13 12 12 4 28 21 76% 100%
West Bengal 19 193 818 175 62 186 19 19 19 8 194 182 11% 100%
Grand Total 703 3000 13325 2591 13273 1457 629 448 448 1583 2737 8448 69% 88%

TB Annual Report79
State District Population (in lakh)
covered by RNTCP1
No. of suspects examined
Suspects examined per lakh
population
Rate of change in suspects examined per lakh
population
No of Smear positive patients
diagnosed2
Suspects examined per smear
positive case diagnosed
Rate of change in suspects examined
per s+ case diagnosed
Annual Smear
positive case detection rate (from
PMR)
Annual smear
positive case notification rate [from CFR: sm + cases (NSP
+ Rel + TAD) / Pop]
Total patients
registered for
treatment3
Annual total case
notification rate
Annual new smear
positive case notification
rate
Andaman & Nicobar Andaman 3.8 4204 275 3% 337 12 7% 88 79 738 193 59
Andhra Pradesh Adilabad 27.8 13826 124 6% 2388 6 7% 86 84 3916 141 67
Andhra Pradesh Anantapur 41.4 27121 164 4% 3831 7 4% 93 68 4795 116 54
Andhra Pradesh Bhadrachalam 8.5 8012 235 2% 1383 6 7% 162 147 1893 222 109
Andhra Pradesh Chittoor 42.3 26285 155 -4% 4216 6 -2% 100 65 4325 102 52
Andhra Pradesh Cuddapah 29.3 18188 155 -7% 2145 8 -10% 73 71 3380 116 50
Andhra Pradesh East Godavari 52.2 37575 180 -11% 3978 9 -1% 76 68 7104 136 57
Andhra Pradesh Guntur 49.6 36661 185 -6% 5367 7 -2% 108 81 6617 133 65
Andhra Pradesh Hyderabad 40.7 39009 240 -3% 5701 7 1% 140 68 6612 163 53
Andhra Pradesh Karimnagar 38.7 22765 147 6% 2963 8 15% 77 65 3785 98 50
Andhra Pradesh Khammamh 19.9 13709 173 -4% 2368 6 -1% 119 97 2847 143 69
Andhra Pradesh Krishna 45.9 25027 136 -10% 3351 7 2% 73 59 4668 102 47
Andhra Pradesh Kurnool 41.0 24568 150 3% 3387 7 3% 83 69 5535 135 53
Andhra Pradesh Mahbubnagar 41.0 22632 138 15% 2993 8 9% 73 65 4076 99 52
Andhra Pradesh Medak 30.7 12479 101 4% 1743 7 10% 57 60 2844 92 48
Andhra Pradesh Nalgonda 35.3 15133 107 -4% 3003 5 1% 85 71 3801 108 56
Andhra Pradesh Nellore 30.1 17828 148 -8% 2491 7 1% 83 64 3232 107 49
Andhra Pradesh Nizamabad 25.9 14311 138 -32% 1562 9 -19% 60 59 2361 91 50
Andhra Pradesh Prakasam 34.4 19081 139 -7% 2589 7 -1% 75 72 4457 130 56
Andhra Pradesh Rangareddi 53.7 23368 109 4% 3766 6 8% 70 61 5791 108 47
Andhra Pradesh Srikakulam 27.4 19050 174 -8% 2065 9 -7% 75 68 3258 119 57
Andhra Pradesh Visakhapatnam 43.5 33681 194 3% 3838 9 5% 88 75 5578 128 64
Andhra Pradesh Vizianagaram 23.8 16307 172 -13% 2050 8 -1% 86 76 3628 153 63
Andhra Pradesh Warangal 35.7 18835 132 -6% 3597 5 -6% 101 75 3901 109 52
Performance of RNTCP case finding (2013), Smear conversion (4q12-3q13), Treatment Outcome 2012 and Notification by private sector

State and District W
ise Annualized Performance 2013
80
State District Annual new smear
negative case
notification rate
Annual new extra pulmonary
case notification
rate
Annual previously
treated case notification
rate
Annual previously
treated smear
positive case
notification rate
No (%) of pediatric cases out of all New cases
3 month conversion
rate of new smear
positive patients4
3 month conversion
rate of retreatment
patients4
Treatment Success rate of
new smear positive patients5
Treatment success
rate among smear
positive previously
treated cases5
No (%) of all Smear Positive cases started RNTCP DOTS within 7 days of diagnosis
No (%) of all Smear Positive
cases registered within one month of
starting RNTCP DOTS treatment
Andaman & Nicobar Andaman 53 47 32 32 35 6% 87% 56% 89% 59% 299 96% 278 89%
Andhra Pradesh Adilabad 35 13 26 26 106 3% 89% 66% 90% 73% 2242 93% 2379 99%
Andhra Pradesh Anantapur 25 12 25 25 98 3% 83% 62% 82% 64% 2590 89% 2703 93%
Andhra Pradesh Bhadrachalam 47 12 55 55 21 1% 85% 69% 90% 77% 1187 92% 1186 92%
Andhra Pradesh Chittoor 13 17 20 20 77 2% 90% 68% 88% 64% 2578 92% 2785 99%
Andhra Pradesh Cuddapah 19 15 31 31 59 2% 91% 68% 91% 74% 1909 90% 2000 95%
Andhra Pradesh East Godavari 38 18 22 22 185 3% 93% 81% 90% 76% 3245 91% 3498 98%
Andhra Pradesh Guntur 29 16 24 24 146 3% 93% 82% 91% 79% 3848 95% 4014 99%
Andhra Pradesh Hyderabad 29 51 30 30 493 9% 92% 76% 87% 70% 2737 97% 2808 99%
Andhra Pradesh Karimnagar 18 7 23 23 54 2% 91% 66% 88% 67% 2365 91% 2530 97%
Andhra Pradesh Khammamh 24 12 39 39 46 2% 66% 56% 74% 59% 1590 80% 1882 94%
Andhra Pradesh Krishna 19 14 22 22 91 2% 89% 67% 89% 69% 2472 88% 2631 94%
Andhra Pradesh Kurnool 34 14 34 34 179 4% 90% 75% 85% 66% 2588 87% 2961 100%
Andhra Pradesh Mahbubnagar 20 9 18 18 118 4% 90% 83% 85% 71% 2509 92% 2640 97%
Andhra Pradesh Medak 16 12 16 16 106 5% 90% 73% 86% 65% 1753 94% 1837 99%
Andhra Pradesh Nalgonda 18 14 20 20 100 3% 91% 68% 90% 75% 2323 91% 2416 95%
Andhra Pradesh Nellore 25 9 25 25 55 2% 91% 67% 86% 57% 1797 91% 1950 99%
Andhra Pradesh Nizamabad 19 8 14 14 56 3% 89% 69% 89% 61% 1477 94% 1518 97%
Andhra Pradesh Prakasam 35 9 30 30 81 2% 87% 66% 84% 63% 2233 88% 2516 99%
Andhra Pradesh Rangareddi 14 27 20 20 314 7% 93% 78% 89% 76% 3095 92% 3293 98%
Andhra Pradesh Srikakulam 31 12 19 19 97 4% 95% 86% 93% 83% 1644 87% 1767 94%
Andhra Pradesh Visakhapatnam 25 23 17 17 210 4% 95% 83% 91% 72% 3061 93% 3233 98%
Andhra Pradesh Vizianagaram 35 27 27 27 139 5% 93% 87% 91% 82% 1653 89% 1801 97%
Andhra Pradesh Warangal 17 9 31 31 45 2% 93% 82% 91% 82% 2589 94% 2702 98%
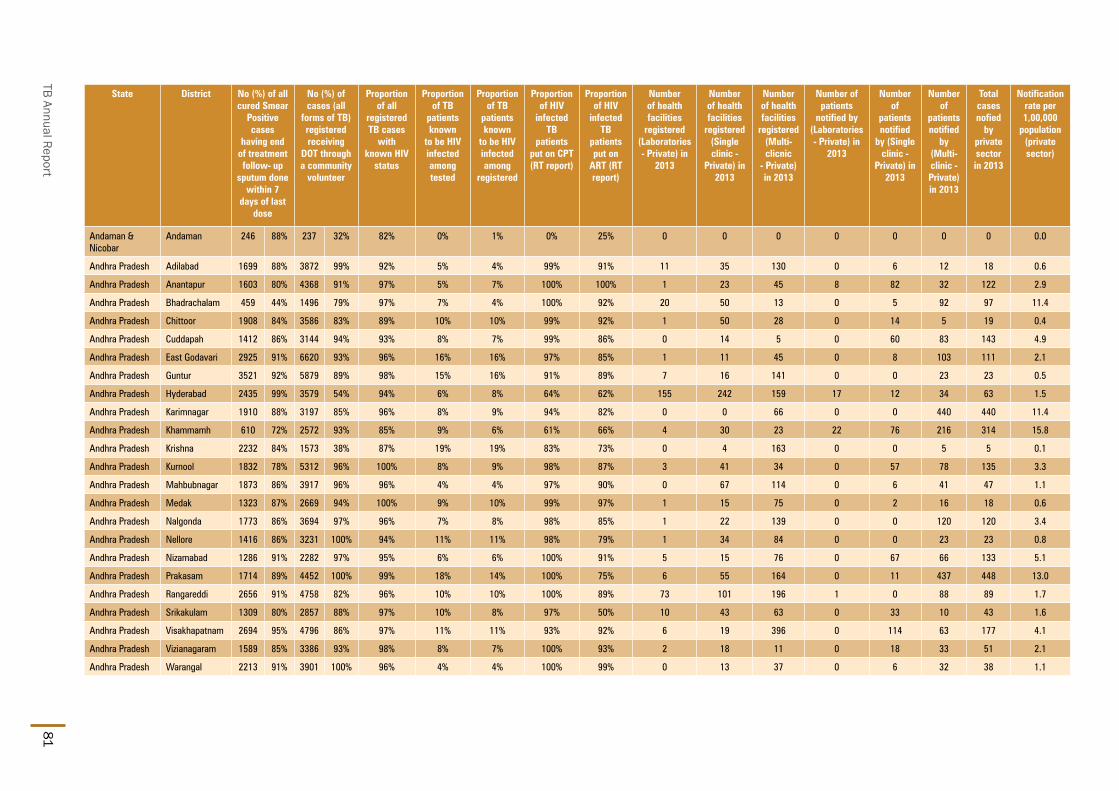
TB Annual Report81
State District No (%) of all cured Smear
Positive cases
having end of treatment follow- up
sputum done within 7
days of last dose
No (%) of cases (all
forms of TB) registered receiving
DOT through a community
volunteer
Proportion of all
registered TB cases
with known HIV
status
Proportion of TB
patients known
to be HIV infected among tested
Proportion of TB
patients known
to be HIV infected among
registered
Proportion of HIV
infected TB
patients put on CPT (RT report)
Proportion of HIV
infected TB
patients put on
ART (RT report)
Number of health facilities
registered (Laboratories - Private) in
2013
Number of health facilities
registered (Single clinic -
Private) in 2013
Number of health facilities
registered (Multi-clicnic
- Private) in 2013
Number of patients
notified by (Laboratories - Private) in
2013
Number of
patients notified
by (Single clinic -
Private) in 2013
Number of
patients notified
by (Multi-clinic - Private) in 2013
Total cases nofied
by private sector in 2013
Notification rate per 1,00,000
population (private sector)
Andaman & Nicobar
Andaman 246 88% 237 32% 82% 0% 1% 0% 25% 0 0 0 0 0 0 0 0.0
Andhra Pradesh Adilabad 1699 88% 3872 99% 92% 5% 4% 99% 91% 11 35 130 0 6 12 18 0.6
Andhra Pradesh Anantapur 1603 80% 4368 91% 97% 5% 7% 100% 100% 1 23 45 8 82 32 122 2.9
Andhra Pradesh Bhadrachalam 459 44% 1496 79% 97% 7% 4% 100% 92% 20 50 13 0 5 92 97 11.4
Andhra Pradesh Chittoor 1908 84% 3586 83% 89% 10% 10% 99% 92% 1 50 28 0 14 5 19 0.4
Andhra Pradesh Cuddapah 1412 86% 3144 94% 93% 8% 7% 99% 86% 0 14 5 0 60 83 143 4.9
Andhra Pradesh East Godavari 2925 91% 6620 93% 96% 16% 16% 97% 85% 1 11 45 0 8 103 111 2.1
Andhra Pradesh Guntur 3521 92% 5879 89% 98% 15% 16% 91% 89% 7 16 141 0 0 23 23 0.5
Andhra Pradesh Hyderabad 2435 99% 3579 54% 94% 6% 8% 64% 62% 155 242 159 17 12 34 63 1.5
Andhra Pradesh Karimnagar 1910 88% 3197 85% 96% 8% 9% 94% 82% 0 0 66 0 0 440 440 11.4
Andhra Pradesh Khammamh 610 72% 2572 93% 85% 9% 6% 61% 66% 4 30 23 22 76 216 314 15.8
Andhra Pradesh Krishna 2232 84% 1573 38% 87% 19% 19% 83% 73% 0 4 163 0 0 5 5 0.1
Andhra Pradesh Kurnool 1832 78% 5312 96% 100% 8% 9% 98% 87% 3 41 34 0 57 78 135 3.3
Andhra Pradesh Mahbubnagar 1873 86% 3917 96% 96% 4% 4% 97% 90% 0 67 114 0 6 41 47 1.1
Andhra Pradesh Medak 1323 87% 2669 94% 100% 9% 10% 99% 97% 1 15 75 0 2 16 18 0.6
Andhra Pradesh Nalgonda 1773 86% 3694 97% 96% 7% 8% 98% 85% 1 22 139 0 0 120 120 3.4
Andhra Pradesh Nellore 1416 86% 3231 100% 94% 11% 11% 98% 79% 1 34 84 0 0 23 23 0.8
Andhra Pradesh Nizamabad 1286 91% 2282 97% 95% 6% 6% 100% 91% 5 15 76 0 67 66 133 5.1
Andhra Pradesh Prakasam 1714 89% 4452 100% 99% 18% 14% 100% 75% 6 55 164 0 11 437 448 13.0
Andhra Pradesh Rangareddi 2656 91% 4758 82% 96% 10% 10% 100% 89% 73 101 196 1 0 88 89 1.7
Andhra Pradesh Srikakulam 1309 80% 2857 88% 97% 10% 8% 97% 50% 10 43 63 0 33 10 43 1.6
Andhra Pradesh Visakhapatnam 2694 95% 4796 86% 97% 11% 11% 93% 92% 6 19 396 0 114 63 177 4.1
Andhra Pradesh Vizianagaram 1589 85% 3386 93% 98% 8% 7% 100% 93% 2 18 11 0 18 33 51 2.1
Andhra Pradesh Warangal 2213 91% 3901 100% 96% 4% 4% 100% 99% 0 13 37 0 6 32 38 1.1

State and District W
ise Annualized Performance 2013
82
State District Population (in lakh)
covered by RNTCP1
No. of suspects examined
Suspects examined per lakh
population
Rate of change in suspects examined per lakh
population
No of Smear positive patients
diagnosed2
Suspects examined per smear
positive case diagnosed
Rate of change in suspects examined
per s+ case diagnosed
Annual Smear
positive case detection rate (from
PMR)
Annual smear
positive case notification rate [from CFR: sm + cases (NSP
+ Rel + TAD) / Pop]
Total patients
registered for
treatment3
Annual total case
notification rate
Annual new smear
positive case notification
rate
Andhra Pradesh West Godavari 39.9 26575 166 -9% 3386 8 1% 85 81 5303 133 66
Arunachal Pradesh Changlang 1.5 606 98 -28% 81 7 -37% 53 68 184 119 57
Arunachal Pradesh Dibang Valley 0.6 396 154 0% 52 8 2% 81 82 71 110 57
Arunachal Pradesh East Kameng 0.8 589 180 28% 88 7 5% 108 115 217 266 85
Arunachal Pradesh East Siang 1.0 952 231 6% 98 10 -12% 95 105 227 220 78
Arunachal Pradesh Kurung Kumey 0.9 337 90 1% 22 15 -15% 24 34 61 65 22
Arunachal Pradesh Lohit 1.7 850 122 -3% 136 6 -15% 78 73 191 110 55
Arunachal Pradesh Lower Subansiri 0.9 557 161 17% 32 17 57% 37 49 87 101 36
Arunachal Pradesh Papum Pare 1.8 3582 488 0% 550 7 -17% 299 163 739 402 111
Arunachal Pradesh Tawang 0.5 292 140 -14% 22 13 0% 42 44 62 119 35
Arunachal Pradesh Tirap 1.2 787 169 -19% 89 9 -10% 76 86 239 205 69
Arunachal Pradesh Upper Siang 0.4 367 250 -4% 38 10 -20% 103 101 65 177 82
Arunachal Pradesh Upper Subansiri 0.9 367 106 -34% 41 9 0% 47 65 99 114 47
Arunachal Pradesh West Kameng 0.9 447 123 16% 62 7 14% 68 68 125 138 62
Arunachal Pradesh West Siang 1.2 651 139 20% 66 10 20% 56 56 133 114 50
Assam Baksa 9.5 1248 33 214 6 22 49 878 92 42
Assam Barpeta 16.8 5969 89 17% 759 8 2% 45 30 1034 62 24
Assam Bongaigaon 7.3 5099 175 28% 691 7 10% 95 76 830 114 63
Assam Cachar 17.8 8375 117 0% 1141 7 -5% 64 50 1976 111 46
Assam Chirang 5.1 1052 52 191 6 38 39 274 54 31
Assam Darrang 9.3 3002 80 -4% 395 8 -5% 42 40 687 74 34
Assam Dhemaji 7.1 2441 86 -1% 484 5 5% 68 66 753 106 55
Assam Dhubri 20.0 7366 92 7% 1080 7 21% 54 48 1836 92 39
Assam Dibrugarh 13.6 8646 158 14% 1843 5 15% 135 95 2699 198 81

TB Annual Report83
State District Annual new smear
negative case
notification rate
Annual new extra pulmonary
case notification
rate
Annual previously
treated case notification
rate
Annual previously
treated smear
positive case
notification rate
No (%) of pediatric cases out of all New
cases
3 month conversion
rate of new smear
positive patients4
3 month conversion rate of retreatment
patients4
Treatment Success rate of
new smear positive patients5
Treatment success
rate among smear
positive previously
treated cases5
No (%) of all Smear Positive cases started RNTCP DOTS within 7 days of diagnosis
No (%) of all Smear Positive
cases registered within one month of
starting RNTCP DOTS treatment
Andhra Pradesh West Godavari 31 12 24 24 154 4% 96% 85% 94% 86% 3180 97% 3242 99%
Arunachal Pradesh Changlang 24 17 21 21 10 7% 82% 74% 82% 85% 99 93% 107 100%
Arunachal Pradesh Dibang Valley 14 8 31 31 1 2% 93% 65% 97% 70% 54 100% 54 100%
Arunachal Pradesh East Kameng 51 43 87 87 30 21% 89% 75% 81% 50% 82 85% 96 100%
Arunachal Pradesh East Siang 62 38 43 43 18 10% 96% 74% 95% 67% 105 96% 107 98%
Arunachal Pradesh Kurung Kumey 7 11 24 24 8 21% 95% 40% 77% 57% 35 100% 35 100%
Arunachal Pradesh Lohit 17 9 29 29 11 8% 88% 71% 82% 81% 125 98% 128 100%
Arunachal Pradesh Lower Subansiri 16 17 31 31 10 17% 84% 58% 78% 53% 35 80% 44 100%
Arunachal Pradesh Papum Pare 80 89 123 123 74 14% 78% 50% 68% 58% 313 97% 323 100%
Arunachal Pradesh Tawang 13 56 15 15 9 17% 95% 80% 91% 100% 22 96% 23 100%
Arunachal Pradesh Tirap 27 78 28 28 35 17% 96% 75% 94% 79% 99 97% 101 99%
Arunachal Pradesh Upper Siang 11 60 24 24 5 9% 94% 71% 100% 100% 37 100% 37 100%
Arunachal Pradesh Upper Subansiri 15 21 31 31 8 11% 97% 80% 95% 83% 32 78% 34 83%
Arunachal Pradesh West Kameng 29 41 7 7 11 9% 98% 100% 98% 100% 62 100% 62 100%
Arunachal Pradesh West Siang 6 21 15 15 20 17% 96% 91% 85% 72% 66 100% 66 100%
Assam Baksa 27 7 16 16 18 2% 87% 74% 207 80% 259 100%
Assam Barpeta 17 6 14 14 19 2% 83% 71% 83% 66% 593 81% 728 100%
Assam Bongaigaon 18 9 24 24 14 2% 91% 64% 87% 64% 512 91% 525 93%
Assam Cachar 31 24 10 10 47 3% 89% 69% 84% 52% 796 87% 875 95%
Assam Chirang 10 4 9 9 4 2% 78% 55% 113 56% 62 31%
Assam Darrang 16 12 12 12 13 2% 80% 60% 81% 50% 348 90% 383 99%
Assam Dhemaji 19 13 19 19 11 2% 84% 70% 80% 59% 451 94% 480 100%
Assam Dhubri 27 5 20 20 44 3% 85% 64% 89% 70% 802 81% 915 93%
Assam Dibrugarh 32 61 24 24 240 10% 87% 72% 87% 72% 1258 95% 1232 93%
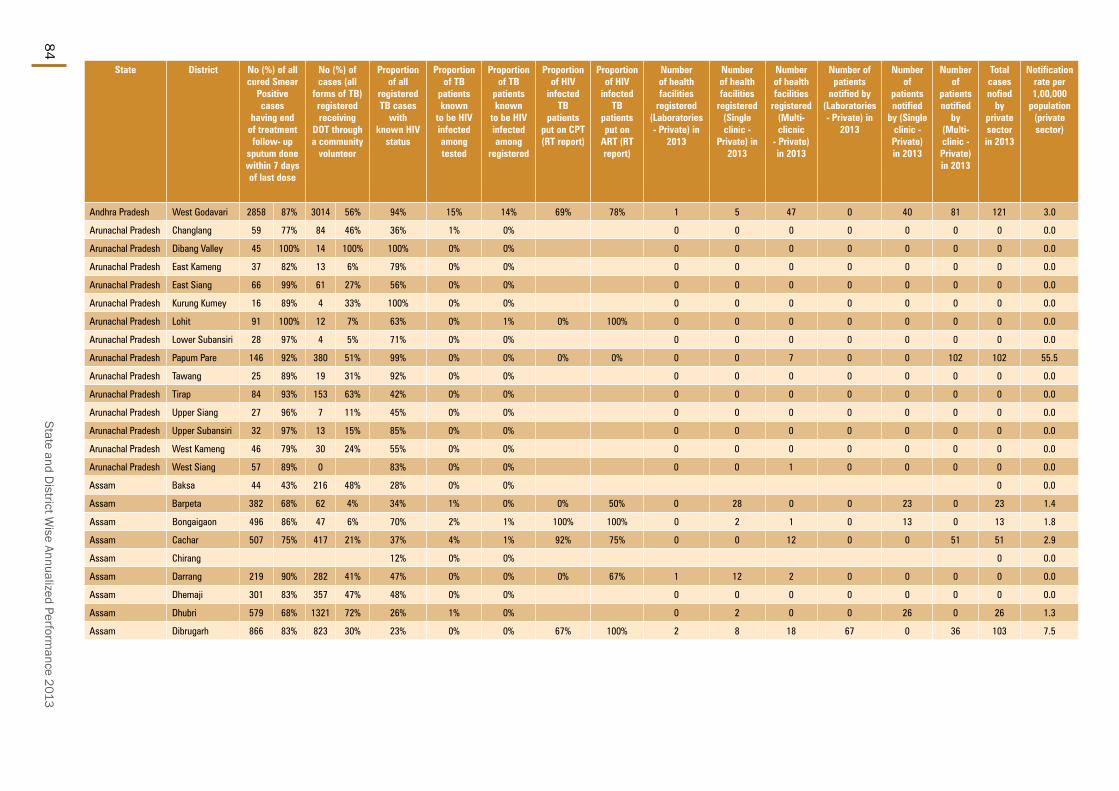
State and District W
ise Annualized Performance 2013
84
State District No (%) of all cured Smear
Positive cases
having end of treatment follow- up
sputum done within 7 days of last dose
No (%) of cases (all
forms of TB) registered receiving
DOT through a community
volunteer
Proportion of all
registered TB cases
with known HIV
status
Proportion of TB
patients known
to be HIV infected among tested
Proportion of TB
patients known
to be HIV infected among
registered
Proportion of HIV
infected TB
patients put on CPT (RT report)
Proportion of HIV
infected TB
patients put on
ART (RT report)
Number of health facilities
registered (Laboratories - Private) in
2013
Number of health facilities
registered (Single clinic -
Private) in 2013
Number of health facilities
registered (Multi-clicnic
- Private) in 2013
Number of patients
notified by (Laboratories - Private) in
2013
Number of
patients notified
by (Single clinic - Private) in 2013
Number of
patients notified
by (Multi-clinic - Private) in 2013
Total cases nofied
by private sector in 2013
Notification rate per 1,00,000
population (private sector)
Andhra Pradesh West Godavari 2858 87% 3014 56% 94% 15% 14% 69% 78% 1 5 47 0 40 81 121 3.0
Arunachal Pradesh Changlang 59 77% 84 46% 36% 1% 0% 0 0 0 0 0 0 0 0.0
Arunachal Pradesh Dibang Valley 45 100% 14 100% 100% 0% 0% 0 0 0 0 0 0 0 0.0
Arunachal Pradesh East Kameng 37 82% 13 6% 79% 0% 0% 0 0 0 0 0 0 0 0.0
Arunachal Pradesh East Siang 66 99% 61 27% 56% 0% 0% 0 0 0 0 0 0 0 0.0
Arunachal Pradesh Kurung Kumey 16 89% 4 33% 100% 0% 0% 0 0 0 0 0 0 0 0.0
Arunachal Pradesh Lohit 91 100% 12 7% 63% 0% 1% 0% 100% 0 0 0 0 0 0 0 0.0
Arunachal Pradesh Lower Subansiri 28 97% 4 5% 71% 0% 0% 0 0 0 0 0 0 0 0.0
Arunachal Pradesh Papum Pare 146 92% 380 51% 99% 0% 0% 0% 0% 0 0 7 0 0 102 102 55.5
Arunachal Pradesh Tawang 25 89% 19 31% 92% 0% 0% 0 0 0 0 0 0 0 0.0
Arunachal Pradesh Tirap 84 93% 153 63% 42% 0% 0% 0 0 0 0 0 0 0 0.0
Arunachal Pradesh Upper Siang 27 96% 7 11% 45% 0% 0% 0 0 0 0 0 0 0 0.0
Arunachal Pradesh Upper Subansiri 32 97% 13 15% 85% 0% 0% 0 0 0 0 0 0 0 0.0
Arunachal Pradesh West Kameng 46 79% 30 24% 55% 0% 0% 0 0 0 0 0 0 0 0.0
Arunachal Pradesh West Siang 57 89% 0 83% 0% 0% 0 0 1 0 0 0 0 0.0
Assam Baksa 44 43% 216 48% 28% 0% 0% 0 0.0
Assam Barpeta 382 68% 62 4% 34% 1% 0% 0% 50% 0 28 0 0 23 0 23 1.4
Assam Bongaigaon 496 86% 47 6% 70% 2% 1% 100% 100% 0 2 1 0 13 0 13 1.8
Assam Cachar 507 75% 417 21% 37% 4% 1% 92% 75% 0 0 12 0 0 51 51 2.9
Assam Chirang 12% 0% 0% 0 0.0
Assam Darrang 219 90% 282 41% 47% 0% 0% 0% 67% 1 12 2 0 0 0 0 0.0
Assam Dhemaji 301 83% 357 47% 48% 0% 0% 0 0 0 0 0 0 0 0.0
Assam Dhubri 579 68% 1321 72% 26% 1% 0% 0 2 0 0 26 0 26 1.3
Assam Dibrugarh 866 83% 823 30% 23% 0% 0% 67% 100% 2 8 18 67 0 36 103 7.5

TB Annual Report85
State District Population (in lakh)
covered by RNTCP1
No. of suspects examined
Suspects examined per lakh
population
Rate of change in suspects examined per lakh
population
No of Smear positive patients
diagnosed2
Suspects examined per smear
positive case diagnosed
Rate of change in suspects examined
per s+ case diagnosed
Annual Smear
positive case detection rate (from
PMR)
Annual smear
positive case notification rate [from CFR: sm + cases (NSP
+ Rel + TAD) / Pop]
Total patients
registered for
treatment3
Annual total case
notification rate
Annual new smear
positive case notification
rate
Assam Goalpara 10.4 3870 93 -1% 608 6 2% 59 55 1003 97 49
Assam Golaghat 10.9 4551 105 24% 756 6 2% 69 65 1493 137 57
Assam Hailakandi 6.8 3235 119 2% 308 11 -11% 45 39 478 71 33
Assam Jorhat 11.2 7409 165 4% 776 10 16% 69 58 1300 116 47
Assam Kamrup 28.7 13574 118 -9% 2284 6 -7% 80 58 3463 121 42
Assam Karbi Anglong 9.9 4126 104 1% 604 7 11% 61 55 1194 120 46
Assam Karimganj 12.5 5118 102 9% 558 9 6% 45 39 978 78 34
Assam Kokrajhar 9.3 4580 124 44% 714 6 27% 77 71 1164 126 63
Assam Lakhimpur 10.7 2871 67 -8% 613 5 -3% 57 55 1000 94 47
Assam Marigaon 9.8 3783 96 -6% 476 8 3% 48 43 909 92 34
Assam Nagaon 29.0 12316 106 3% 1509 8 4% 52 37 2173 75 31
Assam Nalbari 8.7 4198 121 39% 527 8 7% 61 58 829 95 48
Assam North Cachar Hills 2.2 1293 147 18% 195 7 -13% 89 84 295 134 54
Assam Sibsagar 11.8 5600 118 11% 940 6 14% 80 74 1627 138 60
Assam Sonitpur 19.8 11032 139 5% 1878 6 13% 95 81 2930 148 68
Assam Tinsukia 13.5 8374 155 4% 1732 5 2% 128 104 2634 195 85
Assam Udalguri 8.6 3844 112 -6% 536 7 -5% 63 58 1187 139 50
Bihar Araria 29.3 9312 79 4% 937 10 12% 32 28 1465 50 24
Bihar Arwal 7.3 4454 152 6% 418 11 2% 57 42 421 58 33
Bihar Aurangabad 26.2 10188 97 -5% 1031 10 -9% 39 34 1253 48 27
Bihar Banka 21.2 10796 127 13% 817 13 -3% 39 38 1445 68 32
Bihar Begusarai 30.9 14003 113 1% 1291 11 12% 42 38 2120 69 30
Bihar Bhagalpur 31.7 18824 149 -7% 1660 11 -3% 52 39 2424 77 32
Bihar Bhojpur 28.4 11462 101 -8% 900 13 -1% 32 27 1312 46 21

State and District W
ise Annualized Performance 2013
86
State District Annual new smear
negative case
notification rate
Annual new extra pulmonary
case notification
rate
Annual previously
treated case notification
rate
Annual previously
treated smear
positive case
notification rate
No (%) of pediatric cases out of all New
cases
3 month conversion
rate of new smear
positive patients4
3 month conversion
rate of retreatment
patients4
Treatment Success rate of
new smear positive patients5
Treatment success
rate among smear
positive previously
treated cases5
No (%) of all Smear Positive cases started RNTCP DOTS within 7 days of diagnosis
No (%) of all Smear Positive
cases registered within one month of
starting RNTCP DOTS treatment
Assam Goalpara 23 10 15 15 22 3% 89% 67% 82% 51% 533 90% 593 100%
Assam Golaghat 45 18 16 16 56 4% 91% 70% 83% 69% 674 95% 685 96%
Assam Hailakandi 15 13 9 9 12 3% 88% 83% 81% 60% 200 75% 260 98%
Assam Jorhat 24 24 21 21 63 6% 88% 61% 83% 56% 621 95% 656 100%
Assam Kamrup 29 18 32 32 70 3% 87% 70% 84% 53% 1521 89% 1655 97%
Assam Karbi Anglong 41 11 22 22 28 3% 88% 72% 85% 64% 517 93% 548 99%
Assam Karimganj 17 15 13 13 22 3% 92% 79% 87% 68% 431 87% 485 98%
Assam Kokrajhar 35 8 20 20 27 3% 89% 73% 81% 62% 561 84% 630 94%
Assam Lakhimpur 21 10 15 15 38 5% 83% 67% 83% 71% 552 91% 600 99%
Assam Marigaon 31 4 24 24 17 3% 85% 74% 79% 52% 381 89% 382 89%
Assam Nagaon 22 7 14 14 43 2% 90% 73% 88% 67% 795 74% 993 92%
Assam Nalbari 15 15 17 17 19 3% 89% 73% 85% 64% 438 85% 511 100%
Assam North Cachar Hills
31 6 43 43 5 3% 86% 75% 77% 83% 179 96% 175 94%
Assam Sibsagar 24 31 23 23 93 7% 90% 67% 85% 67% 738 83% 794 90%
Assam Sonitpur 37 15 28 28 120 5% 85% 61% 82% 59% 1435 87% 1563 94%
Assam Tinsukia 25 52 33 33 191 9% 90% 74% 88% 72% 1231 85% 1285 89%
Assam Udalguri 49 15 25 25 22 2% 90% 78% 87% 72% 430 86% 491 98%
Bihar Araria 16 2 8 8 87 7% 84% 69% 83% 67% 679 82% 823 99%
Bihar Arwal 8 2 14 14 17 5% 88% 75% 90% 85% 256 82% 311 100%
Bihar Aurangabad 9 1 11 11 51 5% 86% 73% 82% 66% 812 90% 906 100%
Bihar Banka 18 3 15 15 39 3% 82% 63% 88% 68% 725 90% 785 97%
Bihar Begusarai 23 2 13 13 119 7% 93% 81% 93% 84% 1077 91% 1185 100%
Bihar Bhagalpur 23 7 16 16 234 12% 87% 74% 85% 68% 1171 93% 1254 100%
Bihar Bhojpur 10 3 12 12 55 6% 84% 70% 84% 69% 521 68% 729 96%
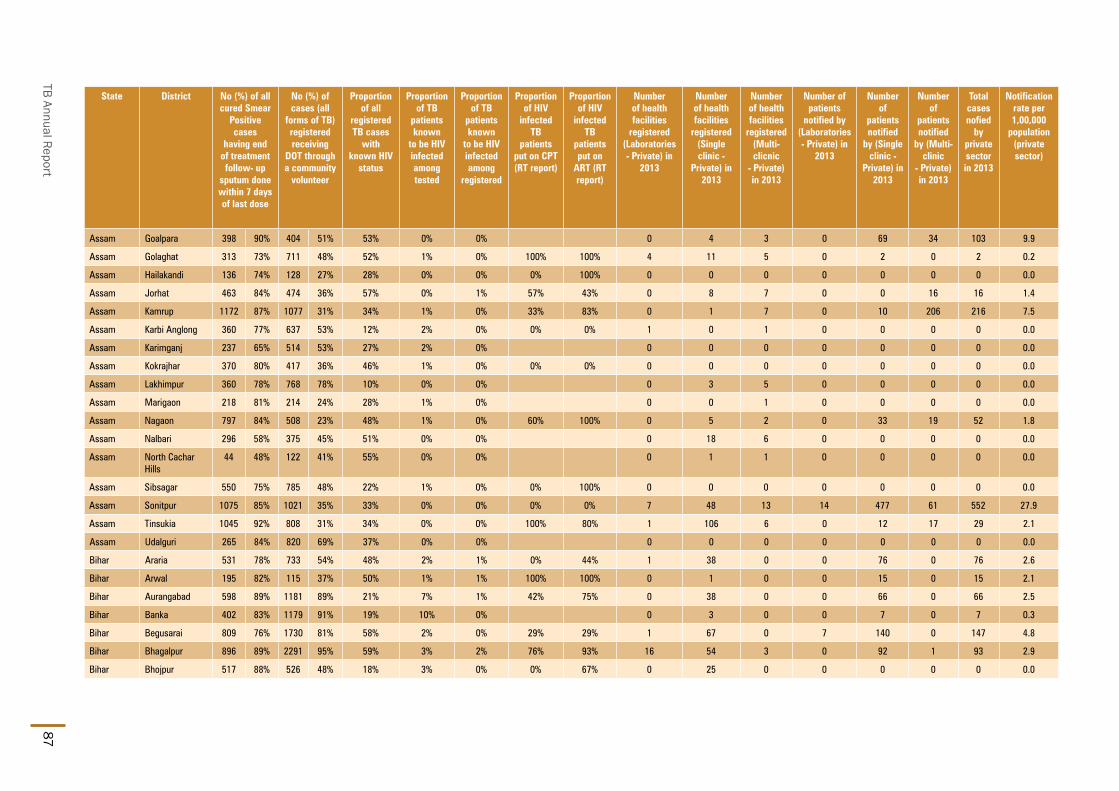
TB Annual Report87
State District No (%) of all cured Smear
Positive cases
having end of treatment follow- up
sputum done within 7 days of last dose
No (%) of cases (all
forms of TB) registered receiving
DOT through a community
volunteer
Proportion of all
registered TB cases
with known HIV
status
Proportion of TB
patients known
to be HIV infected among tested
Proportion of TB
patients known
to be HIV infected among
registered
Proportion of HIV
infected TB
patients put on CPT (RT report)
Proportion of HIV
infected TB
patients put on
ART (RT report)
Number of health facilities
registered (Laboratories - Private) in
2013
Number of health facilities
registered (Single clinic -
Private) in 2013
Number of health facilities
registered (Multi-clicnic
- Private) in 2013
Number of patients
notified by (Laboratories - Private) in
2013
Number of
patients notified
by (Single clinic -
Private) in 2013
Number of
patients notified
by (Multi-clinic
- Private) in 2013
Total cases nofied
by private sector in 2013
Notification rate per 1,00,000
population (private sector)
Assam Goalpara 398 90% 404 51% 53% 0% 0% 0 4 3 0 69 34 103 9.9
Assam Golaghat 313 73% 711 48% 52% 1% 0% 100% 100% 4 11 5 0 2 0 2 0.2
Assam Hailakandi 136 74% 128 27% 28% 0% 0% 0% 100% 0 0 0 0 0 0 0 0.0
Assam Jorhat 463 84% 474 36% 57% 0% 1% 57% 43% 0 8 7 0 0 16 16 1.4
Assam Kamrup 1172 87% 1077 31% 34% 1% 0% 33% 83% 0 1 7 0 10 206 216 7.5
Assam Karbi Anglong 360 77% 637 53% 12% 2% 0% 0% 0% 1 0 1 0 0 0 0 0.0
Assam Karimganj 237 65% 514 53% 27% 2% 0% 0 0 0 0 0 0 0 0.0
Assam Kokrajhar 370 80% 417 36% 46% 1% 0% 0% 0% 0 0 0 0 0 0 0 0.0
Assam Lakhimpur 360 78% 768 78% 10% 0% 0% 0 3 5 0 0 0 0 0.0
Assam Marigaon 218 81% 214 24% 28% 1% 0% 0 0 1 0 0 0 0 0.0
Assam Nagaon 797 84% 508 23% 48% 1% 0% 60% 100% 0 5 2 0 33 19 52 1.8
Assam Nalbari 296 58% 375 45% 51% 0% 0% 0 18 6 0 0 0 0 0.0
Assam North Cachar Hills
44 48% 122 41% 55% 0% 0% 0 1 1 0 0 0 0 0.0
Assam Sibsagar 550 75% 785 48% 22% 1% 0% 0% 100% 0 0 0 0 0 0 0 0.0
Assam Sonitpur 1075 85% 1021 35% 33% 0% 0% 0% 0% 7 48 13 14 477 61 552 27.9
Assam Tinsukia 1045 92% 808 31% 34% 0% 0% 100% 80% 1 106 6 0 12 17 29 2.1
Assam Udalguri 265 84% 820 69% 37% 0% 0% 0 0 0 0 0 0 0 0.0
Bihar Araria 531 78% 733 54% 48% 2% 1% 0% 44% 1 38 0 0 76 0 76 2.6
Bihar Arwal 195 82% 115 37% 50% 1% 1% 100% 100% 0 1 0 0 15 0 15 2.1
Bihar Aurangabad 598 89% 1181 89% 21% 7% 1% 42% 75% 0 38 0 0 66 0 66 2.5
Bihar Banka 402 83% 1179 91% 19% 10% 0% 0 3 0 0 7 0 7 0.3
Bihar Begusarai 809 76% 1730 81% 58% 2% 0% 29% 29% 1 67 0 7 140 0 147 4.8
Bihar Bhagalpur 896 89% 2291 95% 59% 3% 2% 76% 93% 16 54 3 0 92 1 93 2.9
Bihar Bhojpur 517 88% 526 48% 18% 3% 0% 0% 67% 0 25 0 0 0 0 0 0.0

State and District W
ise Annualized Performance 2013
88
State District Population (in lakh)
covered by RNTCP1
No. of suspects examined
Suspects examined per lakh
population
Rate of change in suspects examined per lakh
population
No of Smear positive patients
diagnosed2
Suspects examined per smear
positive case diagnosed
Rate of change in suspects examined
per s+ case diagnosed
Annual Smear
positive case detection rate (from
PMR)
Annual smear
positive case notification rate [from CFR: sm + cases (NSP
+ Rel + TAD) / Pop]
Total patients
registered for
treatment3
Annual total case
notification rate
Annual new smear
positive case notification
rate
Bihar Buxar 17.8 8964 126 3% 784 11 14% 44 40 1108 62 31
Bihar Darbhanga 41.0 19259 118 11% 2699 7 -2% 66 54 3425 84 43
Bihar Gaya 45.7 12503 68 4% 1533 8 4% 34 28 3284 72 24
Bihar Gopalganj 26.7 11831 111 -7% 1014 12 -12% 38 34 1397 52 28
Bihar Jamui 18.3 6437 88 10% 775 8 -12% 42 37 1132 62 31
Bihar Jehanabad 11.7 4235 90 -9% 522 8 -3% 44 42 896 76 32
Bihar Kaimur 17.0 5465 80 2% 593 9 -4% 35 30 812 48 24
Bihar Katihar 32.0 13864 108 -5% 2092 7 -5% 65 57 2218 69 48
Bihar Khagaria 17.3 6615 96 -9% 534 12 0% 31 28 719 42 24
Bihar Kishanganj 17.7 6895 98 5% 864 8 -3% 49 44 1063 60 38
Bihar Lakhisarai 10.5 4297 103 14% 324 13 41% 31 28 613 59 22
Bihar Madhepura 20.8 9851 118 -7% 1011 10 -18% 49 44 1087 52 36
Bihar Madhubani 46.8 15736 84 -6% 1892 8 -5% 40 35 2272 49 31
Bihar Munger 14.2 7997 141 9% 860 9 -1% 61 58 1289 91 47
Bihar Muzaffarpur 49.9 21916 110 -1% 2528 9 -7% 51 45 4202 84 35
Bihar Nalanda 30.0 9588 80 -7% 888 11 14% 30 26 1251 42 23
Bihar Nawada 23.2 6612 71 0% 655 10 15% 28 27 905 39 22
Bihar Paschim Champaran 41.0 17261 105 2% 2028 9 5% 49 45 2241 55 38
Bihar Patna 60.3 24528 102 -6% 2900 8 -6% 48 31 4662 77 24
Bihar Purba Champaran 53.1 18964 89 1% 2360 8 -1% 44 38 2785 52 33
Bihar Purnia 34.2 20362 149 -3% 2358 9 -4% 69 61 3019 88 50
Bihar Rohtas 30.9 14760 119 -12% 1200 12 5% 39 35 1654 53 30
Bihar Saharsa 19.8 6412 81 -3% 575 11 1% 29 26 916 46 24
Bihar Samastipur 44.4 20749 117 -3% 2254 9 -3% 51 44 3159 71 35
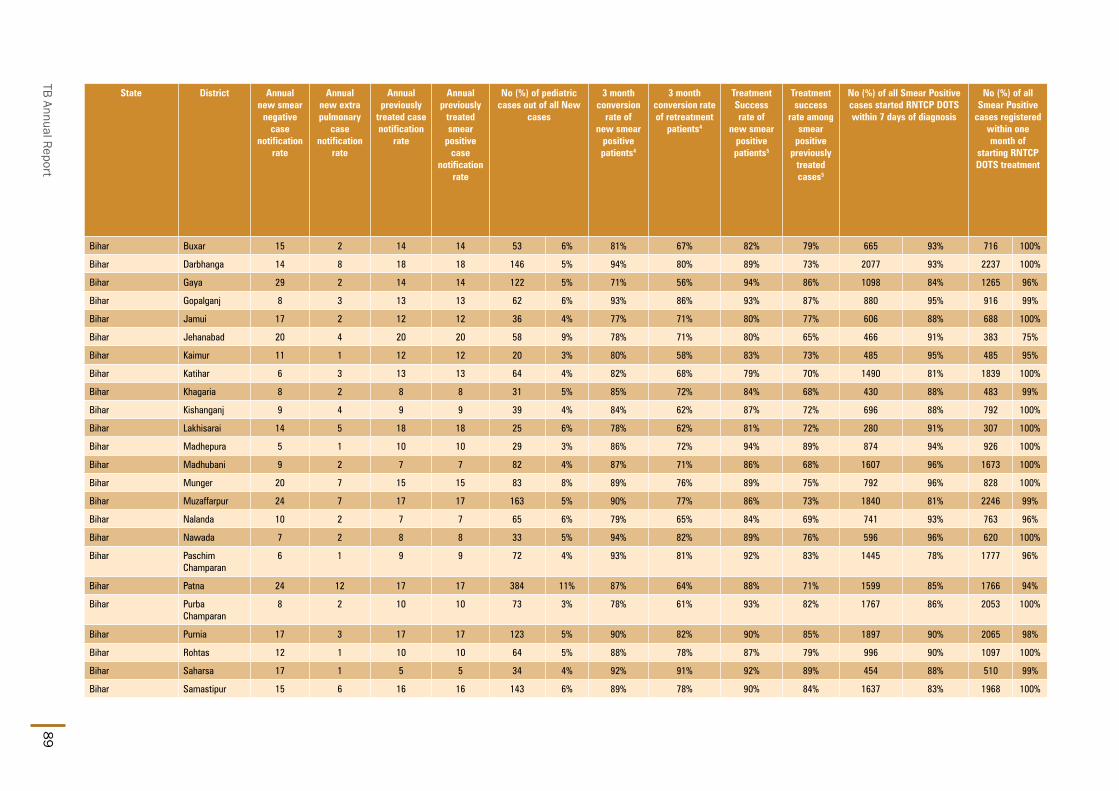
TB Annual Report89
State District Annual new smear
negative case
notification rate
Annual new extra pulmonary
case notification
rate
Annual previously
treated case notification
rate
Annual previously
treated smear
positive case
notification rate
No (%) of pediatric cases out of all New
cases
3 month conversion
rate of new smear
positive patients4
3 month conversion rate of retreatment
patients4
Treatment Success rate of
new smear positive patients5
Treatment success
rate among smear
positive previously
treated cases5
No (%) of all Smear Positive cases started RNTCP DOTS within 7 days of diagnosis
No (%) of all Smear Positive
cases registered within one month of
starting RNTCP DOTS treatment
Bihar Buxar 15 2 14 14 53 6% 81% 67% 82% 79% 665 93% 716 100%
Bihar Darbhanga 14 8 18 18 146 5% 94% 80% 89% 73% 2077 93% 2237 100%
Bihar Gaya 29 2 14 14 122 5% 71% 56% 94% 86% 1098 84% 1265 96%
Bihar Gopalganj 8 3 13 13 62 6% 93% 86% 93% 87% 880 95% 916 99%
Bihar Jamui 17 2 12 12 36 4% 77% 71% 80% 77% 606 88% 688 100%
Bihar Jehanabad 20 4 20 20 58 9% 78% 71% 80% 65% 466 91% 383 75%
Bihar Kaimur 11 1 12 12 20 3% 80% 58% 83% 73% 485 95% 485 95%
Bihar Katihar 6 3 13 13 64 4% 82% 68% 79% 70% 1490 81% 1839 100%
Bihar Khagaria 8 2 8 8 31 5% 85% 72% 84% 68% 430 88% 483 99%
Bihar Kishanganj 9 4 9 9 39 4% 84% 62% 87% 72% 696 88% 792 100%
Bihar Lakhisarai 14 5 18 18 25 6% 78% 62% 81% 72% 280 91% 307 100%
Bihar Madhepura 5 1 10 10 29 3% 86% 72% 94% 89% 874 94% 926 100%
Bihar Madhubani 9 2 7 7 82 4% 87% 71% 86% 68% 1607 96% 1673 100%
Bihar Munger 20 7 15 15 83 8% 89% 76% 89% 75% 792 96% 828 100%
Bihar Muzaffarpur 24 7 17 17 163 5% 90% 77% 86% 73% 1840 81% 2246 99%
Bihar Nalanda 10 2 7 7 65 6% 79% 65% 84% 69% 741 93% 763 96%
Bihar Nawada 7 2 8 8 33 5% 94% 82% 89% 76% 596 96% 620 100%
Bihar Paschim Champaran
6 1 9 9 72 4% 93% 81% 92% 83% 1445 78% 1777 96%
Bihar Patna 24 12 17 17 384 11% 87% 64% 88% 71% 1599 85% 1766 94%
Bihar Purba Champaran
8 2 10 10 73 3% 78% 61% 93% 82% 1767 86% 2053 100%
Bihar Purnia 17 3 17 17 123 5% 90% 82% 90% 85% 1897 90% 2065 98%
Bihar Rohtas 12 1 10 10 64 5% 88% 78% 87% 79% 996 90% 1097 100%
Bihar Saharsa 17 1 5 5 34 4% 92% 91% 92% 89% 454 88% 510 99%
Bihar Samastipur 15 6 16 16 143 6% 89% 78% 90% 84% 1637 83% 1968 100%

State and District W
ise Annualized Performance 2013
90
State District No (%) of all cured Smear
Positive cases
having end of treatment follow- up
sputum done within 7 days of last dose
No (%) of cases (all
forms of TB) registered receiving
DOT through a community
volunteer
Proportion of all
registered TB cases
with known HIV
status
Proportion of TB
patients known
to be HIV infected among tested
Proportion of TB
patients known
to be HIV infected among
registered
Proportion of HIV
infected TB
patients put on CPT (RT report)
Proportion of HIV
infected TB
patients put on
ART (RT report)
Number of health facilities
registered (Laboratories - Private) in
2013
Number of health facilities
registered (Single clinic -
Private) in 2013
Number of health facilities
registered (Multi-clicnic
- Private) in 2013
Number of patients
notified by (Laboratories - Private) in
2013
Number of
patients notified
by (Single clinic -
Private) in 2013
Number of
patients notified
by (Multi-clinic
- Private) in 2013
Total cases nofied
by private sector in 2013
Notification rate per 1,00,000
population (private sector)
Bihar Buxar 530 92% 929 91% 39% 3% 0% 75% 100% 0 0 0 0 0 0 0 0.0
Bihar Darbhanga 1520 91% 3151 92% 46% 12% 4% 76% 87% 0 123 2 0 51 0 51 1.2
Bihar Gaya 498 80% 3010 94% 10% 6% 0% 0 0 0 0 56 5 61 1.3
Bihar Gopalganj 692 91% 1319 95% 43% 5% 2% 56% 74% 0 39 2 0 488 0 488 18.3
Bihar Jamui 197 55% 1097 97% 35% 3% 2% 5% 86% 0 0 0 0 2 0 2 0.1
Bihar Jehanabad 262 84% 685 77% 10% 14% 1% 0% 57% 0 0 0 0 0 0 0 0.0
Bihar Kaimur 274 77% 486 60% 8% 8% 1% 0% 100% 12 10 4 0 16 0 16 0.9
Bihar Katihar 1364 100% 1947 88% 34% 4% 2% 76% 88% 0 73 9 0 9 0 9 0.3
Bihar Khagaria 229 72% 575 85% 44% 4% 1% 67% 52% 0 37 3 0 64 2 66 3.8
Bihar Kishanganj 403 68% 893 84% 44% 5% 2% 0% 0% 0 37 0 0 42 0 42 2.4
Bihar Lakhisarai 190 74% 456 74% 81% 2% 1% 86% 100% 2 37 0 0 13 0 13 1.2
Bihar Madhepura 561 85% 3070 98% 30% 3% 0% 0% 100% 0 0 0 0 0 0 0 0.0
Bihar Madhubani 971 79% 2002 92% 66% 4% 4% 31% 31% 0 56 1 0 0 0 0 0.0
Bihar Munger 430 75% 1234 96% 32% 2% 1% 0% 33% 5 51 17 0 72 2 74 5.2
Bihar Muzaffarpur 926 59% 2589 63% 17% 3% 0% 20% 90% 0 75 1 0 22 0 22 0.4
Bihar Nalanda 564 84% 1103 89% 21% 5% 0% 10 194 41 0 21 0 21 0.7
Bihar Nawada 499 87% 822 93% 28% 4% 0% 0% 0% 0 23 1 0 0 0 0 0.0
Bihar Paschim Champaran
1089 79% 1166 57% 27% 1% 0% 0% 50% 0 0 0 0 0 0 0 0.0
Bihar Patna 1040 79% 931 35% 27% 1% 0% 33% 100% 69 364 4 1 92 0 93 1.5
Bihar Purba Champaran
720 68% 1885 85% 56% 4% 1% 84% 80% 0 0 30 0 40 130 170 3.2
Bihar Purnia 1368 87% 2859 95% 40% 2% 0% 17% 50% 1 56 0 19 95 0 114 3.3
Bihar Rohtas 886 87% 1143 76% 26% 3% 0% 6 123 1 0 170 51 221 7.1
Bihar Saharsa 270 75% 695 75% 25% 0% 0% 0 23 0 0 0 0 0 0.0
Bihar Samastipur 1184 77% 2297 73% 21% 4% 1% 0% 95% 8 91 0 0 104 0 104 2.3

TB Annual Report91
State District Population (in lakh)
covered by RNTCP1
No. of suspects examined
Suspects examined per lakh
population
Rate of change in suspects examined per lakh
population
No of Smear positive patients
diagnosed2
Suspects examined per smear
positive case diagnosed
Rate of change in suspects examined
per s+ case diagnosed
Annual Smear
positive case detection rate (from
PMR)
Annual smear
positive case notification rate [from CFR: sm + cases (NSP
+ Rel + TAD) / Pop]
Total patients
registered for
treatment3
Annual total case
notification rate
Annual new smear
positive case notification
rate
Bihar Saran 41.2 12957 79 6% 1198 11 -4% 29 27 2025 49 20
Bihar Sheikhpura 6.6 2844 107 -4% 204 14 1% 31 28 393 59 19
Bihar Sheohar 6.9 2097 76 -6% 247 8 -12% 36 35 658 96 26
Bihar Sitamarhi 35.7 16073 113 0% 1738 9 7% 49 46 2364 66 40
Bihar Siwan 34.7 15317 110 16% 1334 11 3% 38 32 2028 59 24
Bihar Supaul 23.3 6420 69 -4% 601 11 1% 26 25 873 38 21
Bihar Vaishali 36.5 14242 98 -3% 1402 10 -3% 38 28 2130 58 20
Chandigarh Chandigarh 10.8 19245 445 -3% 2466 8 -2% 228 120 2890 267 95
Chhattisgarh Balod 9.3 2997 81 199 15 21 18 421 45 16
Chhattisgarh Baloda 13.3 3327 63 303 11 23 35 895 68 32
Chhattisgarh Balrampur 7.2 776 27 114 7 16 17 322 45 17
Chhattisgarh Bastar 8.5 4878 143 16% 765 6 -17% 90 63 1204 141 54
Chhattisgarh Bemetara 6.7 1332 50 111 12 17 20 270 41 17
Chhattisgarh Bijapur-CG 2.9 1685 146 -27% 286 6 -24% 99 76 363 126 65
Chhattisgarh Bilaspur 21.3 10664 125 14% 1384 8 -4% 65 59 2569 121 54
Chhattisgarh Dantewada 3.0 2365 199 96% 369 6 10% 124 90 418 141 79
Chhattisgarh Dhamtari 8.3 2806 84 -21% 397 7 -6% 48 41 732 88 36
Chhattisgarh Durg 17.8 13340 187 50% 1334 10 -11% 75 66 3080 173 58
Chhattisgarh Gariaband 6.7 1403 53 219 6 33 34 356 53 31
Chhattisgarh Janjgir 16.2 6241 96 -8% 444 14 29% 27 28 1208 75 27
Chhattisgarh Jashpur 8.9 5077 143 42% 467 11 29% 53 49 741 84 46
Chhattisgarh Kanker 7.7 5341 173 -5% 529 10 -7% 69 65 971 126 59
Chhattisgarh Kawardha 8.5 3421 100 5% 315 11 2% 37 38 535 63 33
Chhattisgarh Kondagaon 5.7 1098 48 94 12 16 14 266 46 12

State and District W
ise Annualized Performance 2013
92
State District Annual new smear
negative case
notification rate
Annual new extra pulmonary
case notification
rate
Annual previously
treated case notification
rate
Annual previously
treated smear
positive case
notification rate
No (%) of pediatric cases out of all New
cases
3 month conversion
rate of new smear
positive patients4
3 month conversion rate of retreatment
patients4
Treatment Success rate of
new smear positive patients5
Treatment success
rate among smear
positive previously
treated cases5
No (%) of all Smear Positive cases started RNTCP DOTS within 7 days of diagnosis
No (%) of all Smear Positive
cases registered within one month of
starting RNTCP DOTS treatment
Bihar Saran 12 3 14 14 52 4% 81% 61% 73% 62% 1044 92% 1129 100%
Bihar Sheikhpura 16 1 23 23 15 6% 78% 59% 80% 58% 96 50% 122 64%
Bihar Sheohar 39 5 24 24 25 5% 76% 53% 85% 51% 179 75% 238 100%
Bihar Sitamarhi 12 5 10 10 137 7% 84% 68% 88% 74% 1425 86% 1621 98%
Bihar Siwan 15 1 18 18 59 4% 84% 68% 92% 89% 979 87% 1123 100%
Bihar Supaul 7 1 8 8 20 3% 74% 76% 97% 86% 517 87% 589 100%
Bihar Vaishali 19 2 16 16 87 6% 79% 63% 87% 73% 909 81% 1096 98%
Chandigarh Chandigarh 33 94 46 46 233 10% 90% 76% 86% 76% 1247 93% 1311 98%
Chhattisgarh Balod 15 8 6 6 19 5% 75% 71% 130 79% 163 99%
Chhattisgarh Baloda 24 6 5 5 47 6% 94% 88% 91% 45% 304 98% 310 100%
Chhattisgarh Balrampur 17 5 6 6 10 4% 91% 100% 120 97% 124 100%
Chhattisgarh Bastar 46 19 22 22 44 4% 69% 71% 79% 64% 492 91% 537 99%
Chhattisgarh Bemetara 17 4 3 3 2 1% 84% 60% 106 80% 120 91%
Chhattisgarh Bijapur-CG 31 9 20 20 18 6% 73% 58% 61% 69% 167 76% 212 96%
Chhattisgarh Bilaspur 37 18 11 11 94 4% 92% 59% 94% 79% 1168 92% 1253 99%
Chhattisgarh Dantewada 35 11 15 15 13 3% 80% 55% 71% 54% 229 86% 243 91%
Chhattisgarh Dhamtari 34 9 9 9 6 1% 89% 69% 87% 63% 294 85% 341 99%
Chhattisgarh Durg 60 38 17 17 186 7% 85% 62% 83% 67% 1097 92% 1186 99%
Chhattisgarh Gariaband 14 3 6 6 13 4% 88% 86% 93% 89% 200 87% 209 91%
Chhattisgarh Janjgir 35 7 6 6 22 2% 97% 94% 94% 84% 441 96% 457 100%
Chhattisgarh Jashpur 24 4 9 9 13 2% 94% 90% 88% 78% 394 87% 383 85%
Chhattisgarh Kanker 43 13 12 12 48 5% 90% 70% 90% 70% 442 87% 507 100%
Chhattisgarh Kawardha 17 3 10 10 12 3% 90% 76% 93% 86% 300 90% 328 99%
Chhattisgarh Kondagaon 24 4 7 7 9 4% 70% 57% 82 100% 61 74%

TB Annual Report93
State District No (%) of all cured Smear
Positive cases
having end of treatment follow- up
sputum done within 7 days of last dose
No (%) of cases (all
forms of TB) registered receiving
DOT through a community
volunteer
Proportion of all
registered TB cases
with known HIV
status
Proportion of TB
patients known
to be HIV infected among tested
Proportion of TB
patients known
to be HIV infected among
registered
Proportion of HIV
infected TB
patients put on CPT (RT report)
Proportion of HIV
infected TB
patients put on
ART (RT report)
Number of health facilities
registered (Laboratories - Private) in
2013
Number of health facilities
registered (Single clinic -
Private) in 2013
Number of health facilities
registered (Multi-clicnic
- Private) in 2013
Number of patients
notified by (Laboratories - Private) in
2013
Number of
patients notified
by (Single clinic -
Private) in 2013
Number of
patients notified
by (Multi-clinic - Private) in 2013
Total cases nofied
by private sector
in 2013
Notification rate per 1,00,000
population (private sector)
Bihar Saran 426 80% 1748 86% 7% 18% 1% 100% 100% 5 124 12 0 34 8 42 1.0
Bihar Sheikhpura 86 66% 393 100% 32% 0% 1% 0% 40% 0 4 0 0 59 0 59 8.9
Bihar Sheohar 102 74% 658 69% 24% 10% 1% 0% 89% 0 0 0 0 0 0 0 0.0
Bihar Sitamarhi 807 69% 2206 93% 28% 8% 1% 29% 85% 28 54 11 126 231 12 369 10.3
Bihar Siwan 432 69% 1747 86% 31% 1% 0% 22% 22% 0 98 22 0 0 0 0 0.0
Bihar Supaul 274 79% 870 100% 38% 1% 0% 0 0 0 0 0 0 0 0.0
Bihar Vaishali 508 73% 1933 87% 54% 1% 1% 28% 89% 0 0 0 0 58 0 58 1.6
Chandigarh Chandigarh 971 86% 751 26% 97% 1% 1% 97% 90% 0 101 2 0 30 6 36 3.3
Chhattisgarh Balod 92 69% 318 76% 22% 0% 0% 0 0.0
Chhattisgarh Baloda 219 95% 343 57% 33% 3% 1% 0% 0% 0 0.0
Chhattisgarh Balrampur 63 82% 240 75% 47% 0% 0% 0 0.0
Chhattisgarh Bastar 155 93% 644 53% 18% 3% 0% 0% 67% 1 7 6 0 0 0 0 0.0
Chhattisgarh Bemetara 8 80% 104 39% 60% 3% 0% 0 0.0
Chhattisgarh Bijapur-CG 60 45% 0 14% 0% 0% 0 0 1 0 0 0 0 0.0
Chhattisgarh Bilaspur 878 79% 2143 81% 59% 2% 0% 44% 56% 6 106 67 0 0 350 350 16.4
Chhattisgarh Dantewada 153 70% 332 79% 69% 0% 0% 0 0 0 0 0 0 0 0.0
Chhattisgarh Dhamtari 218 62% 523 71% 49% 1% 0% 0% 0% 0 6 4 0 0 2 2 0.2
Chhattisgarh Durg 674 68% 1827 62% 37% 4% 0% 0 76 47 0 29 0 29 1.6
Chhattisgarh Gariaband 97 104% 149 43% 55% 1% 0% 0 0.0
Chhattisgarh Janjgir 471 82% 683 57% 27% 0% 0% 34 17 8 0 0 0 0 0.0
Chhattisgarh Jashpur 186 95% 651 94% 60% 31% 0% 0 0 0 0 0 0 0 0.0
Chhattisgarh Kanker 307 79% 239 25% 53% 1% 0% 0 0 6 0 0 9 9 1.2
Chhattisgarh Kawardha 151 61% 250 53% 71% 2% 0% 17 11 8 0 0 0 0 0.0
Chhattisgarh Kondagaon 25 100% 135 56% 46% 0% 0% 0 0.0

State and District W
ise Annualized Performance 2013
94
State District Population (in lakh)
covered by RNTCP1
No. of suspects examined
Suspects examined per lakh
population
Rate of change in suspects examined per lakh
population
No of Smear positive patients
diagnosed2
Suspects examined per smear
positive case diagnosed
Rate of change in suspects examined
per s+ case diagnosed
Annual Smear
positive case detection rate (from
PMR)
Annual smear
positive case notification rate [from CFR: sm + cases (NSP
+ Rel + TAD) / Pop]
Total patients
registered for
treatment3
Annual total case
notification rate
Annual new smear
positive case notification
rate
Chhattisgarh Korba 12.5 6467 130 -7% 515 13 18% 41 40 1272 102 36
Chhattisgarh Koriya 6.8 2240 83 -13% 273 8 -42% 40 33 532 79 29
Chhattisgarh Mahasamund 10.3 4373 106 23% 545 8 19% 53 50 935 91 46
Chhattisgarh Mungeli 7.1 1004 35 105 10 15 17 231 32 15
Chhattisgarh Narayanpur 1.5 855 147 -19% 148 6 -6% 102 91 247 169 80
Chhattisgarh Raigarh 15.2 5566 92 -2% 774 7 20% 51 47 1544 102 44
Chhattisgarh Raipur 22.3 14188 159 37% 1777 8 -4% 80 64 2848 127 56
Chhattisgarh Rajnandgaon 16.0 9032 141 6% 956 9 13% 60 60 1916 120 52
Chhattisgarh Sukma 2.6 464 45 85 5 33 27 98 38 21
Chhattisgarh Surajpur 8.2 1078 33 122 9 15 17 382 47 15
Chhattisgarh Surguja 8.0 6399 201 124% 534 12 20% 67 59 1533 192 54
Dadar & Nagar Haveli Dadra & Nagar Haveli 3.7 4145 279 47% 329 13 66% 89 48 411 111 36
Daman & Diu Daman 2.1 2197 266 -17% 232 9 -32% 112 42 217 105 26
Daman & Diu Diu 0.6 946 420 56% 49 19 3% 87 357 525 932 268
Delhi Bijwasan 5.1 3368 166 90% 450 7 -14% 89 114 1523 300 86
Delhi BJRM Chest Clinic 5.2 5619 272 11% 714 8 0% 138 140 1712 331 92
Delhi BSA Chest Clinic 5.1 3908 192 25% 618 6 -8% 122 124 1727 340 87
Delhi CD Chest Clinic 5.1 4495 221 41% 604 7 -1% 119 91 1431 282 63
Delhi DDU Chest Clinic 9.1 10673 292 0% 1382 8 -15% 151 145 3705 406 101
Delhi DFIT Chest Clinic 9.6 2001 52 -74% 281 7 12% 29 29 676 70 21
Delhi GTB Chest Clinic 7.6 9883 325 14% 1369 7 19% 180 94 1914 251 67
Delhi Gulabi Bagh 5.7 4657 205 -21% 663 7 3% 116 88 1313 231 69
Delhi Hedgewar Chest Clinic 4.9 3348 172 -16% 503 7 -10% 103 64 768 158 47
Delhi Jhandewalan 5.6 3199 142 -15% 472 7 1% 84 83 1448 258 51

TB Annual Report95
State District Annual new smear
negative case
notification rate
Annual new extra pulmonary
case notification
rate
Annual previously
treated case notification
rate
Annual previously
treated smear
positive case
notification rate
No (%) of pediatric cases out of all New
cases
3 month conversion
rate of new smear
positive patients4
3 month conversion
rate of retreatment
patients4
Treatment Success rate of
new smear positive patients5
Treatment success
rate among smear
positive previously
treated cases5
No (%) of all Smear Positive cases started RNTCP DOTS within 7 days of diagnosis
No (%) of all Smear Positive
cases registered within one month of
starting RNTCP DOTS treatment
Chhattisgarh Korba 46 11 10 10 66 6% 94% 73% 94% 78% 452 91% 496 100%
Chhattisgarh Koriya 32 11 8 8 28 6% 89% 72% 91% 64% 190 84% 227 100%
Chhattisgarh Mahasamund 27 9 9 9 48 6% 91% 68% 83% 67% 498 94% 529 100%
Chhattisgarh Mungeli 8 7 2 2 11 5% 95% 78% 109 92% 119 100%
Chhattisgarh Narayanpur 32 41 16 16 15 7% 86% 65% 7% 91% 113 84% 134 100%
Chhattisgarh Raigarh 47 5 7 7 18 1% 89% 68% 87% 74% 698 97% 717 100%
Chhattisgarh Raipur 41 17 14 14 118 5% 89% 69% 87% 63% 1315 88% 1396 94%
Chhattisgarh Rajnandgaon 33 17 18 18 105 6% 87% 61% 88% 66% 915 93% 973 99%
Chhattisgarh Sukma 8 3 6 6 1 1% 71% 56% 54 77% 54 77%
Chhattisgarh Surajpur 22 3 6 6 11 3% 99% 100% 126 92% 136 99%
Chhattisgarh Surguja 92 20 26 26 94 7% 93% 89% 94% 84% 444 94% 461 98%
Dadar & Nagar Haveli
Dadra & Nagar Haveli 20 33 21 21 18 5% 90% 63% 83% 59% 197 95% 205 99%
Daman & Diu Daman 37 11 32 32 12 8% 54% 54% 68% 58% 49 48% 103 100%
Daman & Diu Diu 133 352 179 179 43 10% 100% 57% 100% 100% 23 100% 23 100%
Delhi Bijwasan 42 115 57 57 136 11% 85% 70% 87% 76% 506 85% 592 100%
Delhi BJRM Chest Clinic 51 109 79 79 174 13% 91% 71% 88% 67% 622 85% 722 99%
Delhi BSA Chest Clinic 64 119 69 69 141 10% 81% 68% 79% 66% 622 97% 639 100%
Delhi CD Chest Clinic 54 105 59 59 118 10% 88% 67% 76% 64% 427 91% 469 100%
Delhi DDU Chest Clinic 73 146 87 87 376 13% 87% 70% 84% 67% 1149 85% 1325 97%
Delhi DFIT Chest Clinic 9 23 17 17 56 11% 84% 69% 86% 73% 254 89% 30 11%
Delhi GTB Chest Clinic 38 88 57 57 203 14% 85% 70% 81% 66% 684 91% 748 100%
Delhi Gulabi Bagh 33 87 41 41 123 11% 90% 78% 83% 67% 464 89% 521 100%
Delhi Hedgewar Chest Clinic 18 58 34 34 72 12% 91% 66% 80% 60% 311 96% 324 100%
Delhi Jhandewalan 37 93 75 75 161 16% 86% 68% 84% 65% 428 90% 473 100%

State and District W
ise Annualized Performance 2013
96
State District No (%) of all cured Smear
Positive cases
having end of treatment follow- up
sputum done within 7 days of last dose
No (%) of cases (all
forms of TB) registered receiving
DOT through a community
volunteer
Proportion of all
registered TB cases
with known HIV
status
Proportion of TB
patients known
to be HIV infected among tested
Proportion of TB
patients known
to be HIV infected among
registered
Proportion of HIV
infected TB
patients put on CPT (RT report)
Proportion of HIV
infected TB
patients put on
ART (RT report)
Number of health facilities
registered (Laboratories - Private) in
2013
Number of health facilities
registered (Single clinic - Private) in 2013
Number of health facilities
registered (Multi-clicnic
- Private) in 2013
Number of patients
notified by (Laboratories - Private) in
2013
Number of
patients notified
by (Single clinic - Private) in 2013
Number of
patients notified
by (Multi-clinic - Private) in 2013
Total cases nofied
by private sector
in 2013
Notification rate per 1,00,000
population (private sector)
Chhattisgarh Korba 459 85% 1006 79% 46% 0% 0% 0% 100% 0 23 10 0 0 0 0 0.0
Chhattisgarh Koriya 129 91% 260 49% 41% 3% 0% 0 0 1 0 0 0 0 0.0
Chhattisgarh Mahasamund 292 70% 809 87% 51% 2% 1% 0% 90% 0 2 1 0 0 0 0 0.0
Chhattisgarh Mungeli 85 77% 198 86% 62% 1% 0% 0 0.0
Chhattisgarh Narayanpur 62 100% 173 70% 66% 4% 1% 0% 100% 0 0 3 0 0 0 0 0.0
Chhattisgarh Raigarh 432 69% 390 26% 67% 0% 0% 36 11 5 0 0 0 0 0.0
Chhattisgarh Raipur 936 60% 1052 37% 34% 3% 1% 7% 7% 0 67 21 0 7 0 7 0.3
Chhattisgarh Rajnandgaon 670 87% 1175 61% 90% 3% 1% 14% 73% 4 43 14 0 1 0 1 0.1
Chhattisgarh Sukma 36 73% 78 80% 14% 7% 0% 0 0.0
Chhattisgarh Surajpur 104 91% 317 83% 8% 0% 0% 0 0.0
Chhattisgarh Surguja 441 89% 1004 65% 44% 5% 0% 0 5 7 0 0 0 0 0.0
Dadar & Nagar Haveli
Dadra & Nagar Haveli 152 90% 60 39% 42% 3% 0% 50% 50% 0 0 0 0 0 0 0 0.0
Daman & Diu Daman 28 50% 114 43% 94% 1% 2% 100% 100% 0 0 0 0 0 0 0 0.0
Daman & Diu Diu 17 100% 20 42% 75% 0% 0% 100% 100% 0 8 0 0 0 0 0 0.0
Delhi Bijwasan 242 100% 10 1% 71% 1% 1% 100% 100% 42 110 19 0 0 1 1 0.2
Delhi BJRM Chest Clinic 487 100% 388 23% 88% 3% 2% 82% 82% 0 0 0 0 0 0 0 0.0
Delhi BSA Chest Clinic 331 99% 71% 3% 1% 94% 100% 0 59 25 0 2 5 7 1.4
Delhi CD Chest Clinic 234 100% 40% 1% 0% 0 20 36 0 0 0 0 0.0
Delhi DDU Chest Clinic 805 91% 426 15% 76% 2% 2% 90% 89% 16 72 103 0 0 33 33 3.6
Delhi DFIT Chest Clinic 166 77% 371 55% 81% 4% 5% 53% 75% 0 0 0 0 0 0 0 0.0
Delhi GTB Chest Clinic 649 91% 280 15% 66% 1% 2% 97% 97% 0 0 0 0 0 0 0 0.0
Delhi Gulabi Bagh 477 100% 0 0% 86% 3% 3% 100% 100% 0 0 0 0 0 0 0 0.0
Delhi Hedgewar Chest Clinic 326 97% 4 1% 99% 2% 2% 100% 100% 0 0 0 0 0 0 0 0.0
Delhi Jhandewalan 408 100% 19 1% 66% 3% 2% 96% 92% 0 0 0 0 0 0 0 0.0

TB Annual Report97
State District Population (in lakh)
covered by RNTCP1
No. of suspects examined
Suspects examined per lakh
population
Rate of change in suspects examined per lakh
population
No of Smear positive patients
diagnosed2
Suspects examined per smear
positive case diagnosed
Rate of change in suspects examined
per s+ case diagnosed
Annual Smear
positive case detection rate (from
PMR)
Annual smear
positive case notification rate [from CFR: sm + cases (NSP
+ Rel + TAD) / Pop]
Total patients
registered for
treatment3
Annual total case
notification rate
Annual new smear
positive case notification
rate
Delhi Karawal Nagar 7.6 4649 153 -13% 894 5 -4% 118 131 3034 400 93
Delhi Kingsway Camp 7.9 5148 163 -22% 706 7 -4% 90 86 1554 197 58
Delhi LN Chest Clinic 4.6 5865 321 3% 621 9 17% 136 57 886 194 39
Delhi LRS 10.1 5822 144 -30% 979 6 11% 97 84 2041 202 60
Delhi MNCH Chest Clinic 5.1 3058 151 -14% 587 5 -7% 116 171 2299 454 115
Delhi Moti Nagar 6.1 7964 327 4% 1084 7 -1% 178 146 2722 447 102
Delhi Narela 6.7 6529 242 -10% 850 8 10% 126 109 1817 270 76
Delhi NDMC 6.1 14195 583 -2% 1538 9 27% 253 82 1417 233 56
Delhi Nehru Nagar 10.9 10320 236 -1% 1939 5 -14% 178 154 4548 417 105
Delhi Patparganj 7.7 10499 339 9% 1608 7 6% 208 182 3555 459 125
Delhi R.K.Mission 7.1 3747 132 -39% 554 7 -3% 78 72 1186 167 52
Delhi RTRM Chest Clinic 5.1 6049 298 3% 757 8 0% 149 120 1463 288 84
Delhi SGM Chest Clinic 7.4 6496 220 -20% 866 8 -5% 117 103 2286 309 69
Delhi Shahdra 6.0 4505 187 -31% 760 6 0% 126 112 1915 318 75
Delhi SPM Marg 5.1 3531 174 -6% 460 8 -8% 91 65 887 175 39
Delhi SPMH Chest Clinic 6.2 6935 281 2% 1086 6 5% 176 167 2900 469 112
Goa North Goa 8.3 11281 341 5% 721 16 10% 87 61 1022 123 48
Goa South Goa 6.5 4293 166 -7% 461 9 8% 71 58 756 117 43
Gujarat Ahmadabad 16.9 13122 194 20% 1676 8 12% 99 77 1875 111 56
Gujarat Ahmadabad MC 57.6 36046 156 5% 6113 6 5% 106 74 8520 148 53
Gujarat Amreli 15.7 12723 203 9% 1279 10 9% 82 71 1403 90 59
Gujarat Anand 21.6 15306 177 1% 2288 7 4% 106 85 2893 134 58
Gujarat Banaskantha 32.2 21303 165 7% 3288 6 6% 102 80 3514 109 57
Gujarat Bharuch 16.0 11173 174 2% 1600 7 6% 100 84 1983 124 65
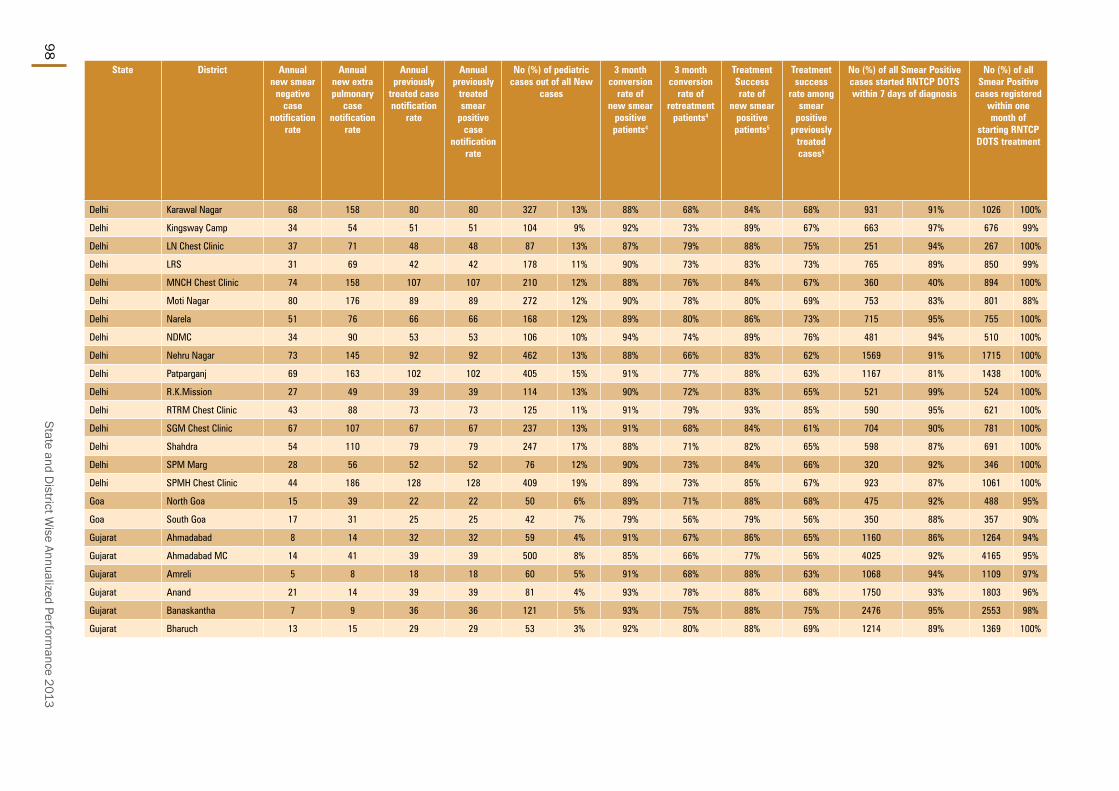
State and District W
ise Annualized Performance 2013
98
State District Annual new smear
negative case
notification rate
Annual new extra pulmonary
case notification
rate
Annual previously
treated case notification
rate
Annual previously
treated smear
positive case
notification rate
No (%) of pediatric cases out of all New
cases
3 month conversion
rate of new smear
positive patients4
3 month conversion
rate of retreatment
patients4
Treatment Success rate of
new smear positive patients5
Treatment success
rate among smear
positive previously
treated cases5
No (%) of all Smear Positive cases started RNTCP DOTS within 7 days of diagnosis
No (%) of all Smear Positive
cases registered within one month of
starting RNTCP DOTS treatment
Delhi Karawal Nagar 68 158 80 80 327 13% 88% 68% 84% 68% 931 91% 1026 100%
Delhi Kingsway Camp 34 54 51 51 104 9% 92% 73% 89% 67% 663 97% 676 99%
Delhi LN Chest Clinic 37 71 48 48 87 13% 87% 79% 88% 75% 251 94% 267 100%
Delhi LRS 31 69 42 42 178 11% 90% 73% 83% 73% 765 89% 850 99%
Delhi MNCH Chest Clinic 74 158 107 107 210 12% 88% 76% 84% 67% 360 40% 894 100%
Delhi Moti Nagar 80 176 89 89 272 12% 90% 78% 80% 69% 753 83% 801 88%
Delhi Narela 51 76 66 66 168 12% 89% 80% 86% 73% 715 95% 755 100%
Delhi NDMC 34 90 53 53 106 10% 94% 74% 89% 76% 481 94% 510 100%
Delhi Nehru Nagar 73 145 92 92 462 13% 88% 66% 83% 62% 1569 91% 1715 100%
Delhi Patparganj 69 163 102 102 405 15% 91% 77% 88% 63% 1167 81% 1438 100%
Delhi R.K.Mission 27 49 39 39 114 13% 90% 72% 83% 65% 521 99% 524 100%
Delhi RTRM Chest Clinic 43 88 73 73 125 11% 91% 79% 93% 85% 590 95% 621 100%
Delhi SGM Chest Clinic 67 107 67 67 237 13% 91% 68% 84% 61% 704 90% 781 100%
Delhi Shahdra 54 110 79 79 247 17% 88% 71% 82% 65% 598 87% 691 100%
Delhi SPM Marg 28 56 52 52 76 12% 90% 73% 84% 66% 320 92% 346 100%
Delhi SPMH Chest Clinic 44 186 128 128 409 19% 89% 73% 85% 67% 923 87% 1061 100%
Goa North Goa 15 39 22 22 50 6% 89% 71% 88% 68% 475 92% 488 95%
Goa South Goa 17 31 25 25 42 7% 79% 56% 79% 56% 350 88% 357 90%
Gujarat Ahmadabad 8 14 32 32 59 4% 91% 67% 86% 65% 1160 86% 1264 94%
Gujarat Ahmadabad MC 14 41 39 39 500 8% 85% 66% 77% 56% 4025 92% 4165 95%
Gujarat Amreli 5 8 18 18 60 5% 91% 68% 88% 63% 1068 94% 1109 97%
Gujarat Anand 21 14 39 39 81 4% 93% 78% 88% 68% 1750 93% 1803 96%
Gujarat Banaskantha 7 9 36 36 121 5% 93% 75% 88% 75% 2476 95% 2553 98%
Gujarat Bharuch 13 15 29 29 53 3% 92% 80% 88% 69% 1214 89% 1369 100%
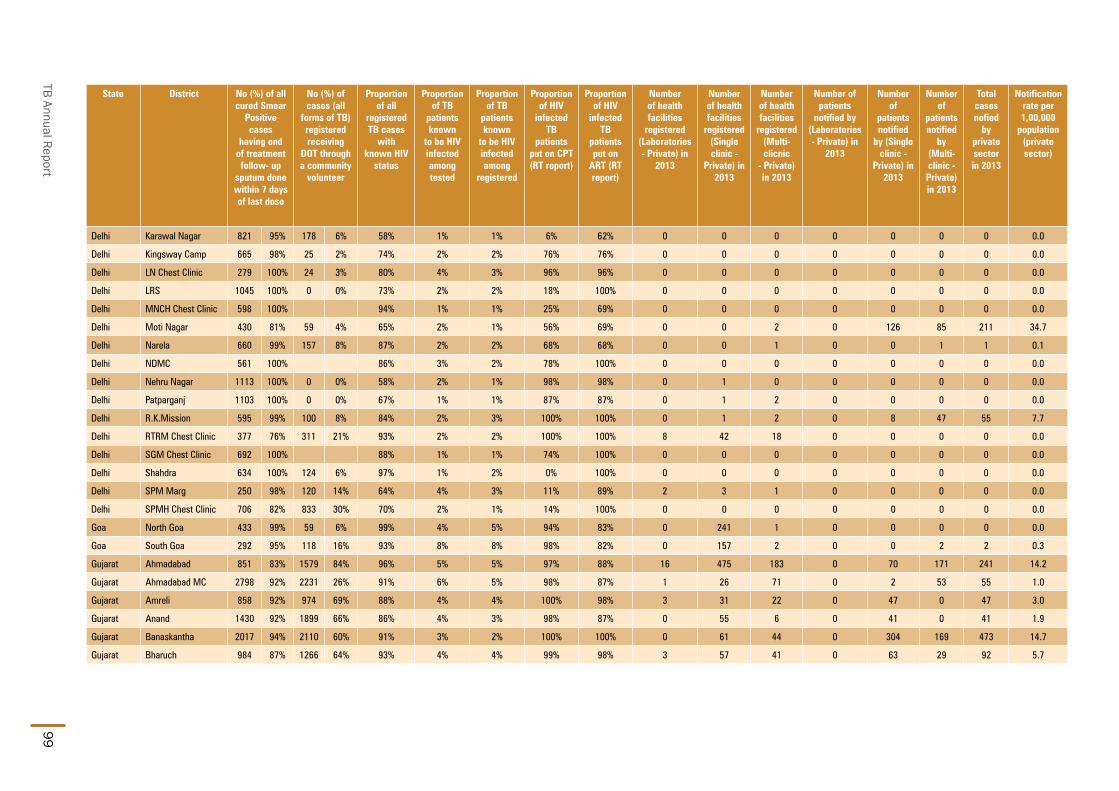
TB Annual Report99
State District No (%) of all cured Smear
Positive cases
having end of treatment follow- up
sputum done within 7 days of last dose
No (%) of cases (all
forms of TB) registered receiving
DOT through a community
volunteer
Proportion of all
registered TB cases
with known HIV
status
Proportion of TB
patients known
to be HIV infected among tested
Proportion of TB
patients known
to be HIV infected among
registered
Proportion of HIV
infected TB
patients put on CPT (RT report)
Proportion of HIV
infected TB
patients put on
ART (RT report)
Number of health facilities
registered (Laboratories - Private) in
2013
Number of health facilities
registered (Single clinic -
Private) in 2013
Number of health facilities
registered (Multi-clicnic
- Private) in 2013
Number of patients
notified by (Laboratories - Private) in
2013
Number of
patients notified
by (Single clinic -
Private) in 2013
Number of
patients notified
by (Multi-clinic - Private) in 2013
Total cases nofied
by private sector in 2013
Notification rate per 1,00,000
population (private sector)
Delhi Karawal Nagar 821 95% 178 6% 58% 1% 1% 6% 62% 0 0 0 0 0 0 0 0.0
Delhi Kingsway Camp 665 98% 25 2% 74% 2% 2% 76% 76% 0 0 0 0 0 0 0 0.0
Delhi LN Chest Clinic 279 100% 24 3% 80% 4% 3% 96% 96% 0 0 0 0 0 0 0 0.0
Delhi LRS 1045 100% 0 0% 73% 2% 2% 18% 100% 0 0 0 0 0 0 0 0.0
Delhi MNCH Chest Clinic 598 100% 94% 1% 1% 25% 69% 0 0 0 0 0 0 0 0.0
Delhi Moti Nagar 430 81% 59 4% 65% 2% 1% 56% 69% 0 0 2 0 126 85 211 34.7
Delhi Narela 660 99% 157 8% 87% 2% 2% 68% 68% 0 0 1 0 0 1 1 0.1
Delhi NDMC 561 100% 86% 3% 2% 78% 100% 0 0 0 0 0 0 0 0.0
Delhi Nehru Nagar 1113 100% 0 0% 58% 2% 1% 98% 98% 0 1 0 0 0 0 0 0.0
Delhi Patparganj 1103 100% 0 0% 67% 1% 1% 87% 87% 0 1 2 0 0 0 0 0.0
Delhi R.K.Mission 595 99% 100 8% 84% 2% 3% 100% 100% 0 1 2 0 8 47 55 7.7
Delhi RTRM Chest Clinic 377 76% 311 21% 93% 2% 2% 100% 100% 8 42 18 0 0 0 0 0.0
Delhi SGM Chest Clinic 692 100% 88% 1% 1% 74% 100% 0 0 0 0 0 0 0 0.0
Delhi Shahdra 634 100% 124 6% 97% 1% 2% 0% 100% 0 0 0 0 0 0 0 0.0
Delhi SPM Marg 250 98% 120 14% 64% 4% 3% 11% 89% 2 3 1 0 0 0 0 0.0
Delhi SPMH Chest Clinic 706 82% 833 30% 70% 2% 1% 14% 100% 0 0 0 0 0 0 0 0.0
Goa North Goa 433 99% 59 6% 99% 4% 5% 94% 83% 0 241 1 0 0 0 0 0.0
Goa South Goa 292 95% 118 16% 93% 8% 8% 98% 82% 0 157 2 0 0 2 2 0.3
Gujarat Ahmadabad 851 83% 1579 84% 96% 5% 5% 97% 88% 16 475 183 0 70 171 241 14.2
Gujarat Ahmadabad MC 2798 92% 2231 26% 91% 6% 5% 98% 87% 1 26 71 0 2 53 55 1.0
Gujarat Amreli 858 92% 974 69% 88% 4% 4% 100% 98% 3 31 22 0 47 0 47 3.0
Gujarat Anand 1430 92% 1899 66% 86% 4% 3% 98% 87% 0 55 6 0 41 0 41 1.9
Gujarat Banaskantha 2017 94% 2110 60% 91% 3% 2% 100% 100% 0 61 44 0 304 169 473 14.7
Gujarat Bharuch 984 87% 1266 64% 93% 4% 4% 99% 98% 3 57 41 0 63 29 92 5.7

State and District W
ise Annualized Performance 2013
100
State District Population (in lakh)
covered by RNTCP1
No. of suspects examined
Suspects examined per lakh
population
Rate of change in suspects examined per lakh
population
No of Smear positive patients
diagnosed2
Suspects examined per smear
positive case diagnosed
Rate of change in suspects examined
per s+ case diagnosed
Annual Smear
positive case detection rate (from
PMR)
Annual smear
positive case notification rate [from CFR: sm + cases (NSP
+ Rel + TAD) / Pop]
Total patients
registered for
treatment3
Annual total case
notification rate
Annual new smear
positive case notification
rate
Gujarat Bhavnagar 29.8 21398 180 7% 2577 8 3% 87 74 2963 100 57
Gujarat Chhota Udepur 10.3 7429 179 9% 1059 7 7% 102 96 1293 125 68
Gujarat Dahod 22.0 25680 292 24% 2612 10 13% 119 106 2949 134 69
Gujarat Gandhinagar 14.4 12630 220 16% 1300 10 12% 91 77 1699 118 58
Gujarat Jamnagar 22.3 16496 185 1% 1631 10 3% 73 68 2145 96 51
Gujarat Junagadh 28.4 19478 172 9% 2112 9 9% 74 71 2626 93 57
Gujarat Kachchh 21.6 14488 168 8% 1621 9 12% 75 64 1799 83 54
Gujarat Kheda 23.8 15644 164 2% 2670 6 -1% 112 85 2922 123 62
Gujarat Mahesana 21.0 17218 205 5% 1800 10 5% 86 71 2075 99 57
Gujarat Narmada 6.1 5853 240 2% 719 8 -6% 118 96 785 129 75
Gujarat Navsari 13.8 11247 204 16% 1287 9 16% 94 79 1643 119 59
Gujarat Panch Mahals 24.7 17507 177 6% 3123 6 -4% 126 106 3657 148 73
Gujarat Patan 13.9 13318 240 7% 1509 9 4% 109 84 1658 119 59
Gujarat Porbandar 6.1 3900 161 -2% 418 9 9% 69 69 712 117 60
Gujarat Rajkot 39.3 30384 193 2% 3187 10 2% 81 67 3709 94 55
Gujarat Sabarkantha 25.1 16245 162 -1% 2642 6 6% 105 82 3531 141 61
Gujarat Surat 16.7 15777 236 9% 2492 6 10% 149 92 2382 142 70
Gujarat Surat MC 46.1 37576 204 24% 3696 10 7% 80 74 5893 128 58
Gujarat Surendranagar 18.2 15205 209 6% 1858 8 6% 102 76 1903 105 56
Gujarat The Dangs 2.3 1885 201 2% 193 10 -2% 82 77 223 95 58
Gujarat Vadodara 15.4 18334 297 3% 2525 7 7% 164 98 2273 147 68
Gujarat Vadodara Corp 17.2 10041 146 -1% 1629 6 -12% 94 72 2129 124 53
Gujarat Valsad 17.6 11491 163 -5% 1356 8 -11% 77 71 1731 98 57
Gujarat Vyara (Surat) 8.3 6701 201 2% 869 8 7% 104 94 1198 144 71
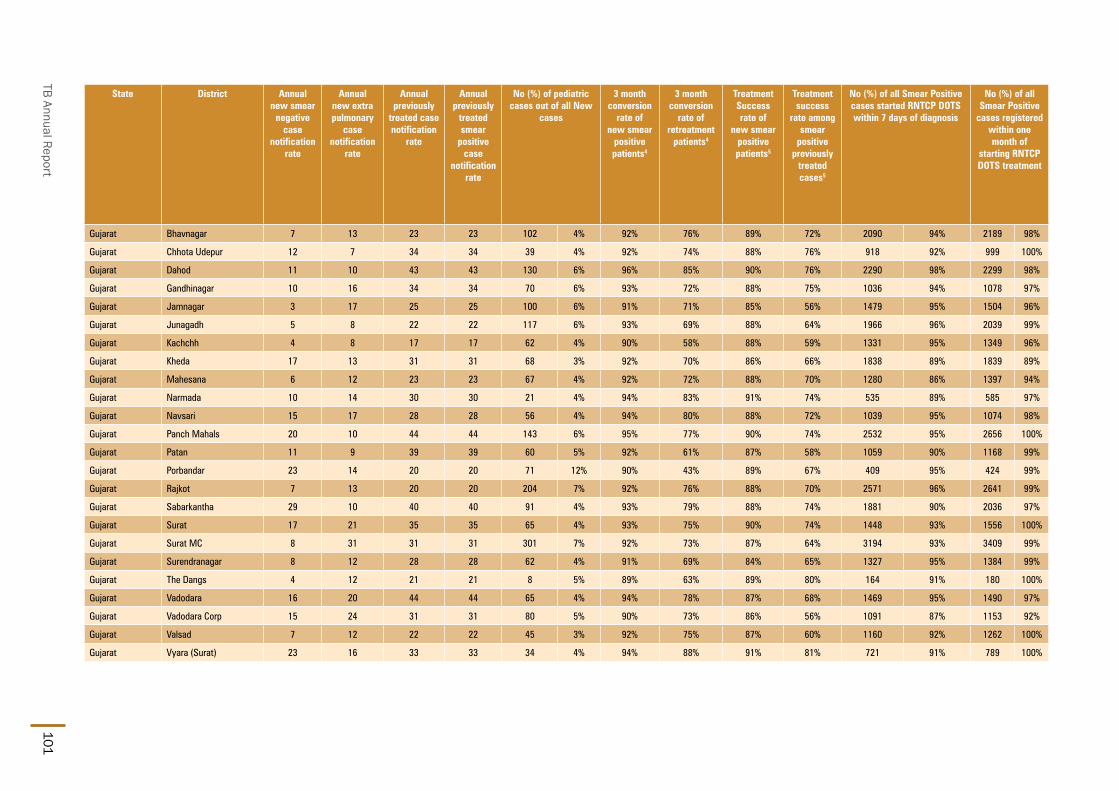
TB Annual Report101
State District Annual new smear
negative case
notification rate
Annual new extra pulmonary
case notification
rate
Annual previously
treated case notification
rate
Annual previously
treated smear
positive case
notification rate
No (%) of pediatric cases out of all New
cases
3 month conversion
rate of new smear
positive patients4
3 month conversion
rate of retreatment
patients4
Treatment Success rate of
new smear positive patients5
Treatment success
rate among smear
positive previously
treated cases5
No (%) of all Smear Positive cases started RNTCP DOTS within 7 days of diagnosis
No (%) of all Smear Positive
cases registered within one month of
starting RNTCP DOTS treatment
Gujarat Bhavnagar 7 13 23 23 102 4% 92% 76% 89% 72% 2090 94% 2189 98%
Gujarat Chhota Udepur 12 7 34 34 39 4% 92% 74% 88% 76% 918 92% 999 100%
Gujarat Dahod 11 10 43 43 130 6% 96% 85% 90% 76% 2290 98% 2299 98%
Gujarat Gandhinagar 10 16 34 34 70 6% 93% 72% 88% 75% 1036 94% 1078 97%
Gujarat Jamnagar 3 17 25 25 100 6% 91% 71% 85% 56% 1479 95% 1504 96%
Gujarat Junagadh 5 8 22 22 117 6% 93% 69% 88% 64% 1966 96% 2039 99%
Gujarat Kachchh 4 8 17 17 62 4% 90% 58% 88% 59% 1331 95% 1349 96%
Gujarat Kheda 17 13 31 31 68 3% 92% 70% 86% 66% 1838 89% 1839 89%
Gujarat Mahesana 6 12 23 23 67 4% 92% 72% 88% 70% 1280 86% 1397 94%
Gujarat Narmada 10 14 30 30 21 4% 94% 83% 91% 74% 535 89% 585 97%
Gujarat Navsari 15 17 28 28 56 4% 94% 80% 88% 72% 1039 95% 1074 98%
Gujarat Panch Mahals 20 10 44 44 143 6% 95% 77% 90% 74% 2532 95% 2656 100%
Gujarat Patan 11 9 39 39 60 5% 92% 61% 87% 58% 1059 90% 1168 99%
Gujarat Porbandar 23 14 20 20 71 12% 90% 43% 89% 67% 409 95% 424 99%
Gujarat Rajkot 7 13 20 20 204 7% 92% 76% 88% 70% 2571 96% 2641 99%
Gujarat Sabarkantha 29 10 40 40 91 4% 93% 79% 88% 74% 1881 90% 2036 97%
Gujarat Surat 17 21 35 35 65 4% 93% 75% 90% 74% 1448 93% 1556 100%
Gujarat Surat MC 8 31 31 31 301 7% 92% 73% 87% 64% 3194 93% 3409 99%
Gujarat Surendranagar 8 12 28 28 62 4% 91% 69% 84% 65% 1327 95% 1384 99%
Gujarat The Dangs 4 12 21 21 8 5% 89% 63% 89% 80% 164 91% 180 100%
Gujarat Vadodara 16 20 44 44 65 4% 94% 78% 87% 68% 1469 95% 1490 97%
Gujarat Vadodara Corp 15 24 31 31 80 5% 90% 73% 86% 56% 1091 87% 1153 92%
Gujarat Valsad 7 12 22 22 45 3% 92% 75% 87% 60% 1160 92% 1262 100%
Gujarat Vyara (Surat) 23 16 33 33 34 4% 94% 88% 91% 81% 721 91% 789 100%

State and District W
ise Annualized Performance 2013
102
State District No (%) of all cured Smear
Positive cases
having end of treatment follow- up
sputum done within 7 days of last dose
No (%) of cases (all
forms of TB) registered receiving
DOT through a community
volunteer
Proportion of all
registered TB cases
with known HIV
status
Proportion of TB
patients known
to be HIV infected among tested
Proportion of TB
patients known
to be HIV infected among
registered
Proportion of HIV
infected TB
patients put on CPT (RT report)
Proportion of HIV
infected TB
patients put on
ART (RT report)
Number of health facilities
registered (Laboratories - Private) in
2013
Number of health facilities
registered (Single clinic -
Private) in 2013
Number of health facilities
registered (Multi-clicnic
- Private) in 2013
Number of patients
notified by (Laboratories - Private) in
2013
Number of
patients notified
by (Single clinic -
Private) in 2013
Number of
patients notified
by (Multi-clinic - Private) in 2013
Total cases nofied
by private sector in 2013
Notification rate per 1,00,000
population (private sector)
Gujarat Bhavnagar 1686 92% 2151 73% 93% 3% 2% 99% 100% 0 65 16 0 183 41 224 7.5
Gujarat Chhota Udepur 703 89% 956 74% 97% 2% 1% 100% 100% 0 9 11 0 14 2 16 1.5
Gujarat Dahod 1763 96% 1780 60% 99% 2% 4% 100% 99% 1 37 31 0 227 179 406 18.5
Gujarat Gandhinagar 871 96% 1210 71% 99% 7% 6% 99% 95% 4 22 18 9 282 71 362 25.2
Gujarat Jamnagar 1037 85% 1605 75% 92% 5% 4% 100% 99% 0 58 9 0 36 5 41 1.8
Gujarat Junagadh 1550 93% 1976 75% 99% 2% 3% 100% 100% 0 157 1 0 505 0 505 17.8
Gujarat Kachchh 997 89% 1284 71% 97% 4% 7% 86% 83% 0 88 12 0 4 2 6 0.3
Gujarat Kheda 1460 87% 1791 61% 95% 3% 3% 99% 91% 0 24 12 0 1 3 4 0.2
Gujarat Mahesana 1078 88% 996 48% 90% 8% 9% 100% 96% 0 37 93 0 150 272 422 20.1
Gujarat Narmada 472 91% 676 86% 95% 2% 2% 100% 87% 0 7 4 0 4 247 251 41.1
Gujarat Navsari 884 97% 1233 75% 95% 4% 4% 100% 90% 0 85 3 0 15 27 42 3.1
Gujarat Panch Mahals 2033 95% 3031 83% 97% 2% 2% 100% 98% 0 23 1 0 110 12 122 4.9
Gujarat Patan 801 91% 1076 65% 96% 4% 6% 97% 96% 0 1 8 0 58 10 68 4.9
Gujarat Porbandar 351 90% 204 29% 98% 6% 6% 98% 95% 0 9 9 0 0 15 15 2.5
Gujarat Rajkot 2219 98% 1687 45% 94% 6% 6% 100% 100% 3 234 2 13 478 150 641 16.3
Gujarat Sabarkantha 1525 86% 2699 76% 95% 3% 3% 100% 99% 8 200 6 0 331 3 334 13.3
Gujarat Surat 1222 93% 1872 79% 96% 3% 5% 100% 92% 0 66 62 0 33 185 218 13.0
Gujarat Surat MC 2275 96% 2061 35% 100% 6% 8% 100% 87% 1 73 6 13 25 1493 1531 33.2
Gujarat Surendranagar 945 93% 1316 69% 98% 6% 7% 97% 95% 6 48 29 0 70 1 71 3.9
Gujarat The Dangs 134 89% 178 80% 98% 2% 3% 86% 43% 0 4 0 0 0 0 0 0.0
Gujarat Vadodara 1014 91% 1556 68% 97% 5% 3% 99% 84% 0 83 2 0 40 0 40 2.6
Gujarat Vadodara Corp 876 89% 462 22% 91% 8% 7% 98% 88% 0 6 2 0 6 16 22 1.3
Gujarat Valsad 922 93% 1419 82% 96% 3% 3% 96% 94% 5 108 14 0 45 112 157 8.9
Gujarat Vyara (Surat) 678 92% 971 81% 96% 2% 3% 100% 95% 0 26 22 0 0 2 2 0.2

TB Annual Report103
State District Population (in lakh)
covered by RNTCP1
No. of suspects examined
Suspects examined per lakh
population
Rate of change in suspects examined per lakh
population
No of Smear positive patients
diagnosed2
Suspects examined per smear
positive case diagnosed
Rate of change in suspects examined
per s+ case diagnosed
Annual Smear
positive case detection rate (from
PMR)
Annual smear
positive case notification rate [from CFR: sm + cases (NSP
+ Rel + TAD) / Pop]
Total patients
registered for
treatment3
Annual total case
notification rate
Annual new smear
positive case notification
rate
Haryana Ambala 11.8 14082 299 -2% 1553 9 -2% 132 81 1652 140 58
Haryana Bhiwani 16.9 8120 120 -12% 1249 7 0% 74 67 1954 116 43
Haryana Faridabad 18.6 13329 179 14% 1633 8 -6% 88 80 3803 204 53
Haryana Fatehabad 9.8 4971 127 -14% 767 6 -11% 79 67 1117 114 46
Haryana Gurgaon 15.7 12606 201 16% 1477 9 16% 94 68 2919 186 49
Haryana Hisar 18.1 12724 176 9% 1998 6 4% 111 72 2174 120 47
Haryana Jhajjar 9.9 5252 132 -27% 609 9 3% 61 68 1241 125 47
Haryana Jind 13.8 7203 130 -7% 1097 7 2% 79 74 1649 119 48
Haryana Kaithal 11.1 6164 139 5% 872 7 -6% 78 76 1274 115 52
Haryana Karnal 15.6 10099 162 -1% 1655 6 -2% 106 85 2533 162 61
Haryana Kurukshetra 10.0 7240 181 -1% 1049 7 -1% 105 89 1332 133 63
Haryana Mahendragarh 9.6 6152 161 -5% 852 7 6% 89 75 1230 129 50
Haryana Mewat 11.3 6957 154 39% 1120 6 7% 99 79 1453 129 49
Haryana Palwal 10.8 6085 141 5% 912 7 -4% 85 88 1562 145 57
Haryana Panchkula 5.8 7351 317 -8% 744 10 -9% 128 91 1111 192 63
Haryana Panipat 12.5 6560 132 -11% 947 7 -3% 76 69 1779 143 47
Haryana Rewari 9.3 3504 94 -31% 609 6 -22% 66 63 1157 125 41
Haryana Rohtak 11.0 14853 338 5% 2278 7 9% 208 97 1977 180 62
Haryana Sirsa 13.4 9128 170 1% 1264 7 6% 94 80 1674 125 52
Haryana Sonipat 15.3 10924 178 3% 1857 6 -6% 121 106 2873 187 75
Haryana Yamunanagar 12.6 8070 160 15% 1087 7 9% 86 72 1640 130 57
Himachal Pradesh Bilaspur (HP) 3.9 3599 231 -4% 379 9 -2% 97 108 649 166 74
Himachal Pradesh Chamba 5.3 6691 316 36% 698 10 32% 132 132 1156 218 91
Himachal Pradesh Hamirpur (HP) 4.6 4666 252 -4% 513 9 -6% 111 96 761 164 70
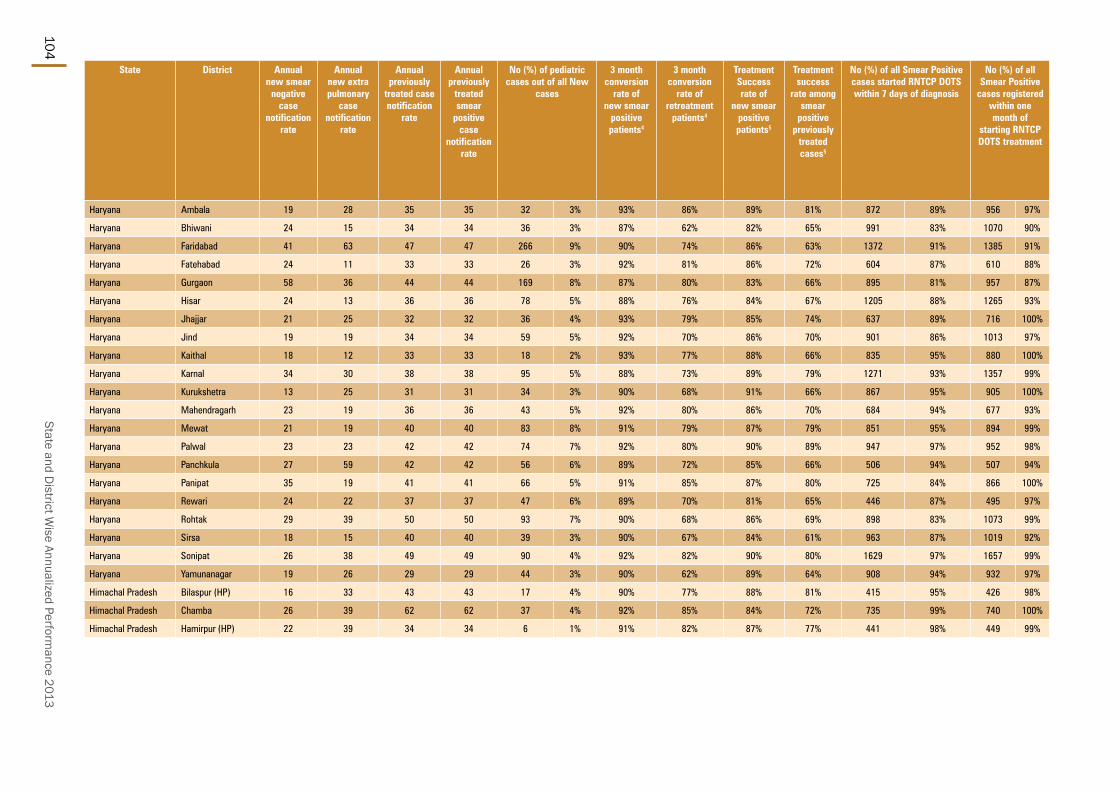
State and District W
ise Annualized Performance 2013
104
State District Annual new smear
negative case
notification rate
Annual new extra pulmonary
case notification
rate
Annual previously
treated case notification
rate
Annual previously
treated smear
positive case
notification rate
No (%) of pediatric cases out of all New
cases
3 month conversion
rate of new smear
positive patients4
3 month conversion
rate of retreatment
patients4
Treatment Success rate of
new smear positive patients5
Treatment success
rate among smear
positive previously
treated cases5
No (%) of all Smear Positive cases started RNTCP DOTS within 7 days of diagnosis
No (%) of all Smear Positive
cases registered within one month of
starting RNTCP DOTS treatment
Haryana Ambala 19 28 35 35 32 3% 93% 86% 89% 81% 872 89% 956 97%
Haryana Bhiwani 24 15 34 34 36 3% 87% 62% 82% 65% 991 83% 1070 90%
Haryana Faridabad 41 63 47 47 266 9% 90% 74% 86% 63% 1372 91% 1385 91%
Haryana Fatehabad 24 11 33 33 26 3% 92% 81% 86% 72% 604 87% 610 88%
Haryana Gurgaon 58 36 44 44 169 8% 87% 80% 83% 66% 895 81% 957 87%
Haryana Hisar 24 13 36 36 78 5% 88% 76% 84% 67% 1205 88% 1265 93%
Haryana Jhajjar 21 25 32 32 36 4% 93% 79% 85% 74% 637 89% 716 100%
Haryana Jind 19 19 34 34 59 5% 92% 70% 86% 70% 901 86% 1013 97%
Haryana Kaithal 18 12 33 33 18 2% 93% 77% 88% 66% 835 95% 880 100%
Haryana Karnal 34 30 38 38 95 5% 88% 73% 89% 79% 1271 93% 1357 99%
Haryana Kurukshetra 13 25 31 31 34 3% 90% 68% 91% 66% 867 95% 905 100%
Haryana Mahendragarh 23 19 36 36 43 5% 92% 80% 86% 70% 684 94% 677 93%
Haryana Mewat 21 19 40 40 83 8% 91% 79% 87% 79% 851 95% 894 99%
Haryana Palwal 23 23 42 42 74 7% 92% 80% 90% 89% 947 97% 952 98%
Haryana Panchkula 27 59 42 42 56 6% 89% 72% 85% 66% 506 94% 507 94%
Haryana Panipat 35 19 41 41 66 5% 91% 85% 87% 80% 725 84% 866 100%
Haryana Rewari 24 22 37 37 47 6% 89% 70% 81% 65% 446 87% 495 97%
Haryana Rohtak 29 39 50 50 93 7% 90% 68% 86% 69% 898 83% 1073 99%
Haryana Sirsa 18 15 40 40 39 3% 90% 67% 84% 61% 963 87% 1019 92%
Haryana Sonipat 26 38 49 49 90 4% 92% 82% 90% 80% 1629 97% 1657 99%
Haryana Yamunanagar 19 26 29 29 44 3% 90% 62% 89% 64% 908 94% 932 97%
Himachal Pradesh Bilaspur (HP) 16 33 43 43 17 4% 90% 77% 88% 81% 415 95% 426 98%
Himachal Pradesh Chamba 26 39 62 62 37 4% 92% 85% 84% 72% 735 99% 740 100%
Himachal Pradesh Hamirpur (HP) 22 39 34 34 6 1% 91% 82% 87% 77% 441 98% 449 99%

TB Annual Report105
State District No (%) of all cured Smear
Positive cases
having end of treatment follow- up
sputum done within 7 days of last dose
No (%) of cases (all
forms of TB) registered receiving
DOT through a community
volunteer
Proportion of all
registered TB cases
with known HIV
status
Proportion of TB
patients known
to be HIV infected among tested
Proportion of TB
patients known
to be HIV infected among
registered
Proportion of HIV
infected TB
patients put on CPT (RT report)
Proportion of HIV
infected TB
patients put on
ART (RT report)
Number of health facilities
registered (Laboratories - Private) in
2013
Number of health facilities
registered (Single clinic -
Private) in 2013
Number of health facilities
registered (Multi-clicnic
- Private) in 2013
Number of patients
notified by (Laboratories - Private) in
2013
Number of
patients notified
by (Single clinic - Private) in 2013
Number of
patients notified
by (Multi-clinic - Private) in 2013
Total cases nofied
by private sector
in 2013
Notification rate per 1,00,000
population (private sector)
Haryana Ambala 761 89% 120 10% 83% 1% 0% 67% 50% 1 16 17 0 0 60 60 5.1
Haryana Bhiwani 655 67% 80 6% 74% 3% 0% 86% 71% 0 0 0 0 0 426 426 25.2
Haryana Faridabad 853 90% 257 7% 69% 1% 0% 100% 100% 1 18 29 1 15 118 134 7.2
Haryana Fatehabad 439 81% 327 29% 69% 1% 0% 0% 0% 1 0 22 2 0 22 24 2.5
Haryana Gurgaon 747 92% 1265 51% 89% 1% 1% 56% 22% 19 6 30 0 0 0 0 0.0
Haryana Hisar 884 85% 304 14% 58% 2% 1% 67% 75% 0 2 8 0 52 293 345 19.1
Haryana Jhajjar 571 95% 344 28% 88% 2% 1% 40% 53% 1 5 2 13 26 50 89 9.0
Haryana Jind 778 89% 44 15% 72% 2% 0% 71% 57% 0 10 21 0 2 267 269 19.5
Haryana Kaithal 544 93% 267 87% 81% 1% 0% 0% 100% 0 0 0 0 0 0 0 0.0
Haryana Karnal 991 100% 1374 54% 91% 0% 0% 0% 50% 1 1 3 1 9 179 189 12.1
Haryana Kurukshetra 649 95% 419 32% 81% 1% 0% 25% 100% 2 1 9 0 0 65 65 6.5
Haryana Mahendragarh 529 89% 484 39% 88% 1% 1% 29% 29% 1 4 19 0 0 0 0 0.0
Haryana Mewat 537 74% 616 51% 70% 0% 0% 0 0 0 0 0 0 0 0.0
Haryana Palwal 718 97% 1532 98% 80% 1% 1% 42% 58% 0 12 6 0 85 143 228 21.1
Haryana Panchkula 381 93% 406 37% 81% 1% 1% 100% 92% 3 22 14 0 0 3 3 0.5
Haryana Panipat 659 84% 1132 64% 62% 2% 1% 93% 80% 0 0 24 0 0 228 228 18.3
Haryana Rewari 275 87% 577 57% 72% 12% 1% 88% 50% 1 6 8 0 64 52 116 12.5
Haryana Rohtak 614 69% 292 15% 67% 2% 1% 93% 89% 0 3 3 0 0 0 0 0.0
Haryana Sirsa 643 79% 1040 62% 76% 0% 1% 100% 64% 22 22 16 0 0 1 1 0.1
Haryana Sonipat 1330 94% 806 29% 100% 2% 1% 91% 47% 0 14 127 0 4 104 108 7.0
Haryana Yamunanagar 630 90% 1152 70% 67% 1% 0% 0% 100% 0 4 6 0 3 1 4 0.3
Himachal Pradesh Bilaspur (HP) 300 86% 38 8% 73% 0% 1% 50% 75% 0 0 1 0 0 0 0 0.0
Himachal Pradesh Chamba 439 83% 378 37% 68% 2% 0% 0% 0% 5 3 1 0 0 0 0 0.0
Himachal Pradesh Hamirpur (HP) 345 91% 88 12% 63% 3% 2% 71% 79% 0 1 3 0 0 0 0 0.0

State and District W
ise Annualized Performance 2013
106
State District Population (in lakh)
covered by RNTCP1
No. of suspects examined
Suspects examined per lakh
population
Rate of change in suspects examined per lakh
population
No of Smear positive patients
diagnosed2
Suspects examined per smear
positive case diagnosed
Rate of change in suspects examined
per s+ case diagnosed
Annual Smear
positive case detection rate (from
PMR)
Annual smear
positive case notification rate [from CFR: sm + cases (NSP
+ Rel + TAD) / Pop]
Total patients
registered for
treatment3
Annual total case
notification rate
Annual new smear
positive case notification
rate
Himachal Pradesh Kangra 15.4 16380 266 12% 1927 9 -1% 125 98 2613 170 72
Himachal Pradesh Kinnaur 0.9 974 283 -3% 69 14 43% 80 95 189 220 69
Himachal Pradesh Kullu 4.5 4254 238 -3% 489 9 -1% 110 120 1332 298 79
Himachal Pradesh Lahul & Spiti 0.3 433 336 -25% 6 72 127% 19 40 63 196 25
Himachal Pradesh Mandi 10.2 13673 335 4% 1084 13 6% 106 111 2157 211 74
Himachal Pradesh Shimla 8.3 2283 69 -78% 262 9 11% 32 100 1766 213 76
Himachal Pradesh Sirmaur 5.4 4728 218 5% 479 10 16% 89 92 1014 187 66
Himachal Pradesh Solan 5.9 1671 71 -80% 141 12 7% 24 87 1285 218 71
Himachal Pradesh Una 5.3 3755 177 -18% 467 8 -11% 88 87 706 133 70
Jammu & Kashmir Anantnag 15.5 11032 178 -10% 486 23 36% 31 31 787 51 27
Jammu & Kashmir Badgam 7.7 5173 169 -6% 329 16 16% 43 42 423 55 38
Jammu & Kashmir Baramula 14.6 8523 146 -4% 407 21 48% 28 25 591 41 22
Jammu & Kashmir Doda 9.6 3742 97 -13% 381 10 -13% 40 42 844 88 30
Jammu & Kashmir Jammu 19.2 17775 231 -4% 2678 7 -4% 140 95 2811 146 63
Jammu & Kashmir Kargil 1.5 1227 206 -6% 59 21 27% 40 40 165 111 34
Jammu & Kashmir Kathua 6.4 3748 146 -11% 508 7 -2% 79 78 838 131 54
Jammu & Kashmir Kupwara 9.1 6707 184 5% 426 16 15% 47 58 666 73 52
Jammu & Kashmir Leh (Ladakh) 1.5 1303 213 -17% 63 21 2% 41 41 189 123 27
Jammu & Kashmir Poonch 5.0 2851 144 7% 232 12 22% 47 46 462 93 40
Jammu & Kashmir Pulwama 8.7 5183 149 -7% 362 14 11% 42 47 567 65 44
Jammu & Kashmir Rajouri 6.4 3824 148 0% 304 13 15% 47 42 538 84 30
Jammu & Kashmir Srinagar 16.3 11532 177 -7% 583 20 15% 36 27 1078 66 23
Jammu & Kashmir Udhampur 9.1 6190 171 -13% 618 10 -7% 68 70 1079 119 45
Jharkhand Bokaro 21.5 12094 141 5% 1239 10 18% 58 39 1645 76 33

TB Annual Report107
State District Annual new smear
negative case
notification rate
Annual new extra pulmonary
case notification
rate
Annual previously
treated case notification
rate
Annual previously
treated smear
positive case
notification rate
No (%) of pediatric cases out of all New
cases
3 month conversion
rate of new smear
positive patients4
3 month conversion
rate of retreatment
patients4
Treatment Success rate of
new smear positive patients5
Treatment success
rate among smear
positive previously
treated cases5
No (%) of all Smear Positive cases started RNTCP DOTS within 7 days of diagnosis
No (%) of all Smear Positive
cases registered within one month of
starting RNTCP DOTS treatment
Himachal Pradesh Kangra 16 44 36 36 112 5% 92% 80% 92% 83% 1524 99% 1536 100%
Himachal Pradesh Kinnaur 13 72 60 60 4 3% 89% 81% 87% 83% 83 98% 85 100%
Himachal Pradesh Kullu 67 88 65 65 126 12% 96% 86% 91% 81% 526 96% 545 99%
Himachal Pradesh Lahul & Spiti 40 81 50 50 2 4% 100% 71% 80% 88% 13 100% 13 100%
Himachal Pradesh Mandi 30 56 52 52 59 4% 93% 79% 89% 76% 1108 95% 1143 98%
Himachal Pradesh Shimla 23 72 42 42 62 4% 95% 86% 93% 82% 182 97% 155 83%
Himachal Pradesh Sirmaur 35 41 44 44 35 5% 89% 75% 88% 81% 492 97% 492 97%
Himachal Pradesh Solan 59 47 42 42 34 3% 91% 74% 90% 77% 91 97% 89 95%
Himachal Pradesh Una 17 25 21 21 13 2% 95% 72% 92% 75% 458 98% 468 100%
Jammu & Kashmir Anantnag 6 12 5 5 85 12% 87% 68% 92% 81% 465 95% 467 97%
Jammu & Kashmir Badgam 4 8 5 5 27 7% 91% 78% 89% 79% 294 92% 320 100%
Jammu & Kashmir Baramula 4 10 5 5 41 8% 91% 85% 90% 87% 359 96% 369 99%
Jammu & Kashmir Doda 11 33 15 15 63 9% 86% 73% 88% 70% 409 100% 409 100%
Jammu & Kashmir Jammu 17 27 40 40 109 5% 85% 72% 85% 76% 1840 98% 1868 100%
Jammu & Kashmir Kargil 41 21 14 14 13 9% 97% 75% 95% 85% 59 100% 59 100%
Jammu & Kashmir Kathua 21 22 33 33 16 3% 82% 59% 88% 80% 488 96% 492 97%
Jammu & Kashmir Kupwara 5 10 7 7 29 5% 92% 79% 93% 83% 526 100% 526 100%
Jammu & Kashmir Leh (Ladakh) 19 54 24 24 3 2% 80% 65% 92% 94% 62 95% 62 95%
Jammu & Kashmir Poonch 21 22 10 10 21 5% 90% 80% 91% 75% 232 100% 232 100%
Jammu & Kashmir Pulwama 8 9 4 4 25 5% 93% 86% 91% 79% 409 100% 409 100%
Jammu & Kashmir Rajouri 10 29 14 14 33 7% 92% 82% 90% 81% 270 100% 271 100%
Jammu & Kashmir Srinagar 10 27 6 6 61 6% 87% 72% 88% 70% 449 100% 449 100%
Jammu & Kashmir Udhampur 12 31 29 29 37 5% 92% 74% 89% 80% 543 84% 576 90%
Jharkhand Bokaro 20 8 15 15 64 5% 91% 75% 89% 72% 1128 94% 1199 100%

State and District W
ise Annualized Performance 2013
108
State District No (%) of all cured Smear
Positive cases
having end of treatment follow- up
sputum done within 7 days of last dose
No (%) of cases (all
forms of TB) registered receiving
DOT through a community
volunteer
Proportion of all
registered TB cases
with known HIV
status
Proportion of TB
patients known
to be HIV infected among tested
Proportion of TB
patients known
to be HIV infected among
registered
Proportion of HIV
infected TB
patients put on CPT (RT report)
Proportion of HIV
infected TB
patients put on
ART (RT report)
Number of health facilities
registered (Laboratories - Private) in
2013
Number of health facilities
registered (Single clinic -
Private) in 2013
Number of health facilities
registered (Multi-clicnic
- Private) in 2013
Number of patients
notified by (Laboratories - Private) in
2013
Number of
patients notified
by (Single clinic -
Private) in 2013
Number of
patients notified
by (Multi-clinic
- Private) in 2013
Total cases nofied
by private sector in 2013
Notification rate per 1,00,000
population (private sector)
Himachal Pradesh Kangra 1072 84% 794 31% 90% 2% 1% 100% 97% 22 183 43 0 0 0 0 0.0
Himachal Pradesh Kinnaur 76 89% 21 12% 37% 0% 0% 0 0 1 0 0 5 5 5.8
Himachal Pradesh Kullu 382 89% 555 56% 33% 1% 0% 100% 0% 8 9 7 3 0 198 201 45.0
Himachal Pradesh Lahul & Spiti 7 37% 0% 0% 0 0 0 0 0 0 0 0.0
Himachal Pradesh Mandi 851 95% 409 19% 49% 1% 0% 100% 86% 6 1 12 0 0 45 45 4.4
Himachal Pradesh Shimla 127 95% 41 15% 63% 0% 0% 0 0 1 0 0 0 0 0.0
Himachal Pradesh Sirmaur 379 89% 297 30% 47% 1% 0% 100% 50% 11 8 5 0 1 0 1 0.2
Himachal Pradesh Solan 63 59% 94 40% 79% 0% 0% 2 35 18 0 58 0 58 9.9
Himachal Pradesh Una 444 99% 216 30% 88% 3% 2% 33% 67% 20 39 12 0 0 1 1 0.2
Jammu & Kashmir Anantnag 575 89% 155 18% 65% 0% 0% 37 12 6 0 30 0 30 1.9
Jammu & Kashmir Badgam 323 89% 45 11% 49% 0% 0% 14 4 3 0 1 1 2 0.3
Jammu & Kashmir Baramula 446 93% 88 11% 48% 0% 0% 35 12 5 0 31 0 31 2.1
Jammu & Kashmir Doda 298 100% 0% 0% 0% 0 0 0 0 0 0 0 0.0
Jammu & Kashmir Jammu 1298 94% 497 22% 61% 1% 1% 23% 64% 11 88 4 0 36 0 36 1.9
Jammu & Kashmir Kargil 70 96% 14 12% 19% 0% 0% 5 5 1 0 8 0 8 5.4
Jammu & Kashmir Kathua 274 90% 15 6% 0% 0% 16 3 10 0 0 0 0 0.0
Jammu & Kashmir Kupwara 502 100% 115 18% 97% 0% 0% 21 20 1 2 19 0 21 2.3
Jammu & Kashmir Leh (Ladakh) 47 100% 17 32% 44% 1% 0% 2 9 6 0 2 1 3 2.0
Jammu & Kashmir Poonch 185 86% 23% 0% 0% 0 0 0 0 0 0 0 0.0
Jammu & Kashmir Pulwama 442 98% 40 7% 77% 0% 0% 44 9 3 3 1 0 4 0.5
Jammu & Kashmir Rajouri 186 67% 0% 0% 0 0 0 0 0 0 0 0.0
Jammu & Kashmir Srinagar 505 100% 34 3% 42% 0% 0% 40 29 21 7 52 9 68 4.2
Jammu & Kashmir Udhampur 419 83% 91 8% 21% 0% 0% 0 0 0 0 0 0 0 0.0
Jharkhand Bokaro 921 83% 1898 83% 37% 2% 0% 100% 80% 11 40 32 2 205 21 228 10.6

TB Annual Report109
State District Population (in lakh)
covered by RNTCP1
No. of suspects examined
Suspects examined per lakh
population
Rate of change in suspects examined per lakh
population
No of Smear positive patients
diagnosed2
Suspects examined per smear
positive case diagnosed
Rate of change in suspects examined
per s+ case diagnosed
Annual Smear
positive case detection rate (from
PMR)
Annual smear
positive case notification rate [from CFR: sm + cases (NSP
+ Rel + TAD) / Pop]
Total patients
registered for
treatment3
Annual total case
notification rate
Annual new smear
positive case notification
rate
Jharkhand Chatra 10.9 3668 84 -6% 559 7 10% 51 51 853 78 46
Jharkhand Deoghar 15.6 8561 137 0% 970 9 4% 62 57 1094 70 53
Jharkhand Dhanbad 28.0 12745 114 0% 1552 8 8% 55 50 2662 95 46
Jharkhand Dumka 13.8 9572 174 18% 1114 9 27% 81 78 1999 145 68
Jharkhand Garhwa 13.8 5288 96 -1% 756 7 -3% 55 50 1490 108 43
Jharkhand Giridih 25.5 8544 84 3% 1493 6 -1% 59 56 1880 74 49
Jharkhand Godda 13.7 5129 94 -3% 796 6 -13% 58 54 1434 105 47
Jharkhand Gumla 10.7 3664 86 -3% 597 6 3% 56 56 862 81 50
Jharkhand Hazaribagh 18.1 9515 131 -5% 1076 9 4% 59 55 1561 86 48
Jharkhand Jamtara 8.2 3744 114 4% 605 6 -1% 73 72 936 114 61
Jharkhand Khunti 5.5 2059 93 43% 312 7 33% 56 53 492 89 47
Jharkhand Kodarma 7.5 2375 79 -6% 212 11 12% 28 25 322 43 19
Jharkhand Lathehar 7.6 5309 175 23% 558 10 16% 74 70 790 104 62
Jharkhand Lohardaga 4.8 1425 74 -13% 266 5 -11% 55 54 379 79 43
Jharkhand Pakaur 9.4 4723 126 -3% 875 5 0% 93 90 1317 140 83
Jharkhand Palamu 20.2 12110 150 7% 1565 8 5% 77 74 2763 137 64
Jharkhand Pashchimi Singhbhum 15.7 8161 130 24% 1465 6 14% 93 89 2532 162 81
Jharkhand Purbi Singhbhum 23.9 9698 101 -3% 1810 5 0% 76 66 2908 122 56
Jharkhand Ramgarh 9.9 4468 113 -7% 555 8 0% 56 54 854 86 47
Jharkhand Ranchi 30.4 14589 120 -2% 2096 7 -1% 69 50 2638 87 43
Jharkhand Sahibganj 12.0 6562 137 8% 868 8 -4% 72 66 1459 122 58
Jharkhand Saraikela-Kharsawan 11.1 6421 145 6% 718 9 4% 65 61 1393 126 55
Jharkhand Simdega 6.3 2709 108 4% 452 6 6% 72 72 678 108 63
Karnataka Bagalkot 19.4 12332 159 -14% 1144 11 -2% 59 47 1788 92 35

State and District W
ise Annualized Performance 2013
110
State District Annual new smear
negative case
notification rate
Annual new extra pulmonary
case notification
rate
Annual previously
treated case notification
rate
Annual previously
treated smear
positive case
notification rate
No (%) of pediatric cases out of all New
cases
3 month conversion
rate of new smear
positive patients4
3 month conversion
rate of retreatment
patients4
Treatment Success rate of
new smear positive patients5
Treatment success
rate among smear
positive previously
treated cases5
No (%) of all Smear Positive cases started RNTCP DOTS within 7 days of diagnosis
No (%) of all Smear Positive
cases registered within one month of starting RNTCP DOTS treatment
Jharkhand Chatra 20 2 10 10 23 3% 84% 61% 96% 90% 463 82% 563 100%
Jharkhand Deoghar 7 3 7 7 31 3% 95% 77% 96% 90% 796 90% 884 100%
Jharkhand Dhanbad 27 7 15 15 108 5% 94% 79% 90% 72% 1289 91% 1356 96%
Jharkhand Dumka 52 2 23 23 37 2% 93% 82% 88% 75% 892 82% 1089 100%
Jharkhand Garhwa 43 4 18 18 62 5% 88% 75% 91% 83% 547 79% 692 100%
Jharkhand Giridih 10 4 11 11 75 5% 91% 81% 91% 82% 1303 89% 1438 99%
Jharkhand Godda 37 3 18 18 43 4% 85% 77% 92% 80% 603 81% 739 99%
Jharkhand Gumla 13 6 12 12 30 4% 90% 79% 93% 83% 501 83% 606 100%
Jharkhand Hazaribagh 22 5 11 11 58 4% 92% 76% 91% 75% 967 97% 996 100%
Jharkhand Jamtara 22 2 29 29 10 1% 94% 76% 92% 72% 513 86% 596 100%
Jharkhand Khunti 20 12 9 9 23 5% 92% 72% 90% 59% 268 91% 295 100%
Jharkhand Kodarma 9 4 10 10 12 5% 85% 68% 84% 69% 177 92% 193 100%
Jharkhand Lathehar 25 5 12 12 36 5% 95% 90% 95% 79% 471 89% 531 100%
Jharkhand Lohardaga 11 9 16 16 14 5% 76% 61% 82% 67% 201 77% 255 97%
Jharkhand Pakaur 34 3 21 21 23 2% 90% 79% 88% 87% 626 74% 845 100%
Jharkhand Palamu 41 11 20 20 124 5% 94% 81% 94% 79% 1429 95% 1510 100%
Jharkhand Pashchimi Singhbhum 59 8 15 15 63 3% 93% 85% 89% 78% 1152 83% 1392 100%
Jharkhand Purbi Singhbhum 32 11 22 22 79 3% 93% 83% 89% 70% 1437 90% 1579 99%
Jharkhand Ramgarh 22 6 10 10 30 4% 86% 63% 90% 70% 515 97% 532 100%
Jharkhand Ranchi 19 10 15 15 103 5% 94% 71% 87% 59% 1445 94% 1534 99%
Jharkhand Sahibganj 39 8 17 17 73 6% 88% 75% 89% 81% 699 87% 797 100%
Jharkhand Saraikela-Kharsawan 48 6 17 17 36 3% 93% 78% 93% 92% 596 88% 680 100%
Jharkhand Simdega 30 4 12 12 15 2% 78% 52% 74% 59% 387 85% 447 98%
Karnataka Bagalkot 24 12 22 22 88 6% 89% 70% 83% 62% 766 82% 908 97%

TB Annual Report111
State District No (%) of all cured Smear
Positive cases
having end of treatment follow- up
sputum done within 7 days of last dose
No (%) of cases (all
forms of TB) registered receiving
DOT through a community
volunteer
Proportion of all
registered TB cases
with known HIV
status
Proportion of TB
patients known
to be HIV infected among tested
Proportion of TB
patients known
to be HIV infected among
registered
Proportion of HIV
infected TB
patients put on CPT (RT report)
Proportion of HIV
infected TB
patients put on
ART (RT report)
Number of health facilities
registered (Laboratories - Private) in
2013
Number of health facilities
registered (Single clinic -
Private) in 2013
Number of health facilities
registered (Multi-clicnic
- Private) in 2013
Number of patients
notified by (Laboratories - Private) in
2013
Number of
patients notified
by (Single clinic -
Private) in 2013
Number of
patients notified
by (Multi-clinic - Private) in 2013
Total cases nofied
by private sector
in 2013
Notification rate per 1,00,000
population (private sector)
Jharkhand Chatra 343 80% 746 87% 36% 1% 0% 0% 100% 0 0 0 0 0 0 0 0.0
Jharkhand Deoghar 729 86% 785 72% 90% 0% 0% 50% 25% 0 0 0 0 0 0 0 0.0
Jharkhand Dhanbad 1146 86% 1464 57% 24% 2% 0% 57% 57% 0 0 0 0 0 0 0 0.0
Jharkhand Dumka 576 69% 1917 96% 75% 0% 0% 0% 20% 0 9 0 0 288 0 288 20.9
Jharkhand Garhwa 323 57% 1211 80% 7% 7% 0% 0 0 0 0 0 0 0 0.0
Jharkhand Giridih 819 77% 1549 82% 22% 5% 0% 0% 100% 4 4 2 0 0 0 0 0.0
Jharkhand Godda 317 58% 1002 72% 41% 1% 0% 0 0 0 0 0 0 0 0.0
Jharkhand Gumla 285 60% 813 94% 87% 0% 0% 0 0 0 0 0 0 0 0.0
Jharkhand Hazaribagh 710 81% 1443 93% 56% 14% 4% 8% 92% 0 2 0 0 44 0 44 2.4
Jharkhand Jamtara 346 76% 779 83% 45% 0% 0% 0 5 1 0 3 0 3 0.4
Jharkhand Khunti 177 77% 490 100% 37% 0% 0% 0 0 0 0 0 0 0 0.0
Jharkhand Kodarma 137 91% 234 73% 35% 10% 7% 0% 90% 0 0 1 0 0 0 0 0.0
Jharkhand Lathehar 278 61% 602 81% 28% 0% 0% 0% 100% 0 0 0 0 0 0 0 0.0
Jharkhand Lohardaga 134 64% 379 100% 67% 0% 0% 0 1 8 0 0 0 0 0.0
Jharkhand Pakaur 304 43% 1243 95% 54% 0% 0% 0 0 0 0 0 0 0 0.0
Jharkhand Palamu 1104 89% 1736 63% 42% 1% 1% 0% 67% 0 0 1 0 0 0 0 0.0
Jharkhand Pashchimi Singhbhum 631 61% 2070 82% 83% 0% 0% 0% 0% 7 18 3 0 11 1 12 0.8
Jharkhand Purbi Singhbhum 1130 87% 2324 80% 51% 4% 1% 30% 80% 0 0 0 0 0 0 0 0.0
Jharkhand Ramgarh 266 66% 719 84% 51% 1% 0% 0% 100% 0 2 1 0 2 0 2 0.2
Jharkhand Ranchi 1085 87% 1801 68% 46% 1% 0% 33% 57% 8 2 35 0 0 287 287 9.4
Jharkhand Sahibganj 405 80% 1080 74% 87% 2% 2% 88% 96% 0 2 0 0 23 0 23 1.9
Jharkhand Saraikela-Kharsawan 358 59% 1020 73% 43% 0% 0% 0% 100% 0 0 0 0 0 0 0 0.0
Jharkhand Simdega 186 65% 614 91% 39% 0% 0% 100% 100% 0 0 0 0 0 0 0 0.0
Karnataka Bagalkot 626 82% 960 54% 97% 41% 50% 100% 89% 0 0 0 0 0 0 0 0.0
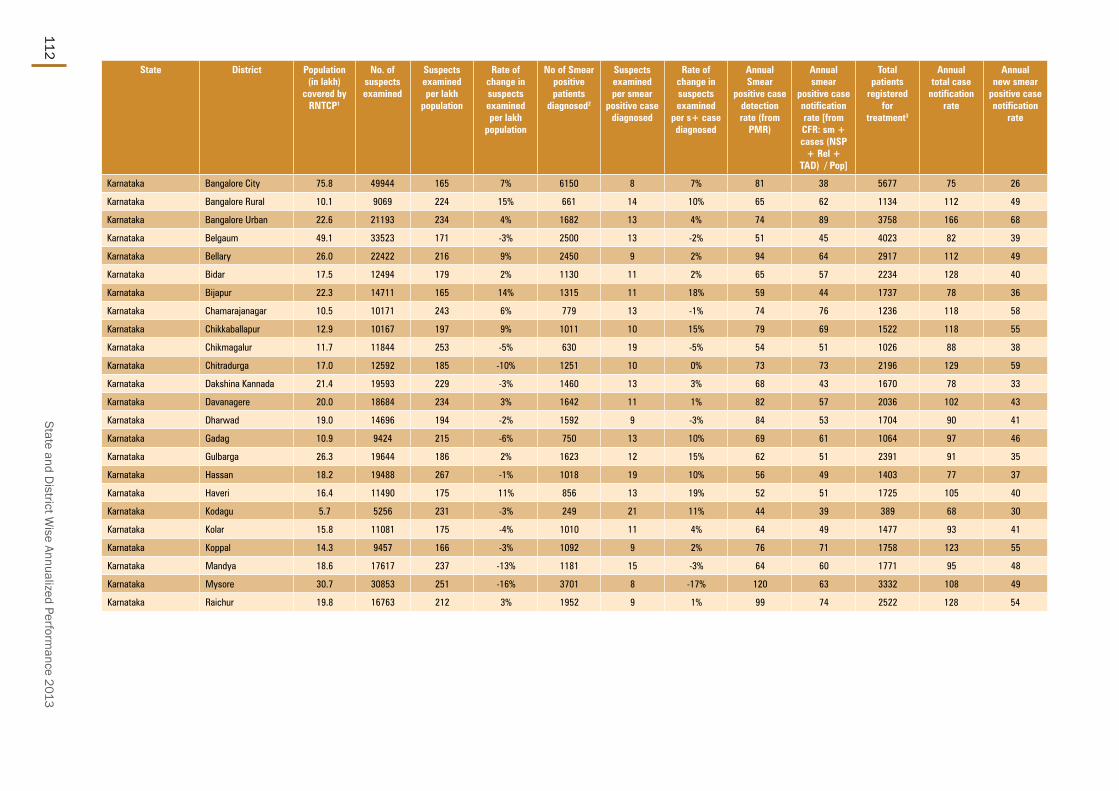
State and District W
ise Annualized Performance 2013
112
State District Population (in lakh)
covered by RNTCP1
No. of suspects examined
Suspects examined per lakh
population
Rate of change in suspects examined per lakh
population
No of Smear positive patients
diagnosed2
Suspects examined per smear
positive case diagnosed
Rate of change in suspects examined
per s+ case diagnosed
Annual Smear
positive case detection rate (from
PMR)
Annual smear
positive case notification rate [from CFR: sm + cases (NSP
+ Rel + TAD) / Pop]
Total patients
registered for
treatment3
Annual total case
notification rate
Annual new smear
positive case notification
rate
Karnataka Bangalore City 75.8 49944 165 7% 6150 8 7% 81 38 5677 75 26
Karnataka Bangalore Rural 10.1 9069 224 15% 661 14 10% 65 62 1134 112 49
Karnataka Bangalore Urban 22.6 21193 234 4% 1682 13 4% 74 89 3758 166 68
Karnataka Belgaum 49.1 33523 171 -3% 2500 13 -2% 51 45 4023 82 39
Karnataka Bellary 26.0 22422 216 9% 2450 9 2% 94 64 2917 112 49
Karnataka Bidar 17.5 12494 179 2% 1130 11 2% 65 57 2234 128 40
Karnataka Bijapur 22.3 14711 165 14% 1315 11 18% 59 44 1737 78 36
Karnataka Chamarajanagar 10.5 10171 243 6% 779 13 -1% 74 76 1236 118 58
Karnataka Chikkaballapur 12.9 10167 197 9% 1011 10 15% 79 69 1522 118 55
Karnataka Chikmagalur 11.7 11844 253 -5% 630 19 -5% 54 51 1026 88 38
Karnataka Chitradurga 17.0 12592 185 -10% 1251 10 0% 73 73 2196 129 59
Karnataka Dakshina Kannada 21.4 19593 229 -3% 1460 13 3% 68 43 1670 78 33
Karnataka Davanagere 20.0 18684 234 3% 1642 11 1% 82 57 2036 102 43
Karnataka Dharwad 19.0 14696 194 -2% 1592 9 -3% 84 53 1704 90 41
Karnataka Gadag 10.9 9424 215 -6% 750 13 10% 69 61 1064 97 46
Karnataka Gulbarga 26.3 19644 186 2% 1623 12 15% 62 51 2391 91 35
Karnataka Hassan 18.2 19488 267 -1% 1018 19 10% 56 49 1403 77 37
Karnataka Haveri 16.4 11490 175 11% 856 13 19% 52 51 1725 105 40
Karnataka Kodagu 5.7 5256 231 -3% 249 21 11% 44 39 389 68 30
Karnataka Kolar 15.8 11081 175 -4% 1010 11 4% 64 49 1477 93 41
Karnataka Koppal 14.3 9457 166 -3% 1092 9 2% 76 71 1758 123 55
Karnataka Mandya 18.6 17617 237 -13% 1181 15 -3% 64 60 1771 95 48
Karnataka Mysore 30.7 30853 251 -16% 3701 8 -17% 120 63 3332 108 49
Karnataka Raichur 19.8 16763 212 3% 1952 9 1% 99 74 2522 128 54

TB Annual Report113
State District Annual new smear
negative case
notification rate
Annual new extra pulmonary
case notification
rate
Annual previously
treated case notification
rate
Annual previously
treated smear
positive case
notification rate
No (%) of pediatric cases out of all New
cases
3 month conversion
rate of new smear
positive patients4
3 month conversion
rate of retreatment
patients4
Treatment Success rate of
new smear positive patients5
Treatment success
rate among smear
positive previously
treated cases5
No (%) of all Smear Positive cases started RNTCP DOTS within 7 days of diagnosis
No (%) of all Smear Positive
cases registered within one
month of starting RNTCP DOTS
treatment
Karnataka Bangalore City 9 23 17 17 323 7% 84% 50% 78% 46% 2500 85% 2905 99%
Karnataka Bangalore Rural 17 26 20 20 45 5% 87% 59% 85% 51% 570 88% 647 100%
Karnataka Bangalore Urban 21 46 30 30 169 6% 89% 68% 86% 64% 1714 84% 1989 97%
Karnataka Belgaum 20 10 13 13 303 9% 88% 71% 82% 68% 2028 90% 2186 97%
Karnataka Bellary 23 16 25 25 189 8% 92% 63% 84% 58% 1499 88% 1607 94%
Karnataka Bidar 43 14 31 31 86 5% 90% 68% 82% 49% 979 95% 1002 97%
Karnataka Bijapur 20 8 14 14 100 7% 91% 68% 81% 58% 815 80% 905 89%
Karnataka Chamarajanagar 12 23 24 24 36 4% 87% 65% 84% 60% 802 91% 857 97%
Karnataka Chikkaballapur 20 21 22 22 50 4% 89% 52% 82% 51% 706 77% 910 99%
Karnataka Chikmagalur 10 20 19 19 36 5% 86% 54% 83% 53% 549 89% 614 99%
Karnataka Chitradurga 27 19 25 25 57 3% 89% 58% 84% 57% 1115 88% 1220 96%
Karnataka Dakshina Kannada 10 17 18 18 86 7% 86% 65% 83% 54% 903 93% 898 92%
Karnataka Davanagere 16 19 24 24 54 3% 89% 77% 82% 55% 985 85% 1101 95%
Karnataka Dharwad 8 24 16 16 88 6% 86% 61% 82% 53% 939 91% 1029 100%
Karnataka Gadag 14 16 21 21 56 7% 88% 69% 83% 59% 578 85% 671 98%
Karnataka Gulbarga 14 14 28 28 99 6% 88% 57% 80% 45% 1151 82% 1285 91%
Karnataka Hassan 8 15 16 16 36 3% 92% 72% 83% 56% 787 87% 866 95%
Karnataka Haveri 27 18 20 20 120 9% 86% 70% 82% 66% 658 76% 822 95%
Karnataka Kodagu 9 16 13 13 15 5% 90% 74% 89% 60% 206 90% 223 97%
Karnataka Kolar 15 25 13 13 64 5% 89% 63% 87% 56% 678 86% 768 97%
Karnataka Koppal 28 12 28 28 69 5% 88% 53% 81% 54% 928 88% 1049 99%
Karnataka Mandya 9 19 19 19 56 4% 90% 64% 86% 58% 998 87% 1105 96%
Karnataka Mysore 18 22 20 20 176 6% 86% 57% 81% 53% 1807 91% 1860 94%
Karnataka Raichur 28 11 35 35 167 9% 85% 62% 82% 51% 1297 86% 1357 90%

State and District W
ise Annualized Performance 2013
114
State District No (%) of all cured Smear
Positive cases
having end of treatment follow- up
sputum done within 7 days of last dose
No (%) of cases (all
forms of TB) registered receiving
DOT through a community
volunteer
Proportion of all
registered TB cases
with known HIV
status
Proportion of TB
patients known
to be HIV infected among tested
Proportion of TB
patients known
to be HIV infected among
registered
Proportion of HIV
infected TB
patients put on CPT (RT report)
Proportion of HIV
infected TB
patients put on
ART (RT report)
Number of health facilities
registered (Laboratories - Private) in
2013
Number of health facilities
registered (Single clinic -
Private) in 2013
Number of health facilities
registered (Multi-clicnic
- Private) in 2013
Number of patients
notified by (Laboratories - Private) in
2013
Number of
patients notified
by (Single clinic -
Private) in 2013
Number of
patients notified
by (Multi-clinic - Private) in 2013
Total cases nofied
by private sector
in 2013
Notification rate per 1,00,000
population (private sector)
Karnataka Bangalore City 1524 81% 1907 34% 81% 7% 6% 98% 81% 55 554 81 0 0 0 0 0.0
Karnataka Bangalore Rural 425 91% 528 44% 98% 6% 7% 100% 93% 2 0 28 0 0 0 0 0.0
Karnataka Bangalore Urban 1392 83% 2594 69% 93% 8% 10% 99% 89% 41 246 105 0 11 4 15 0.7
Karnataka Belgaum 1382 76% 1884 47% 98% 24% 26% 100% 88% 5 239 13 0 28 2 30 0.6
Karnataka Bellary 989 80% 1085 37% 98% 14% 14% 100% 98% 5 34 45 0 0 0 0 0.0
Karnataka Bidar 598 80% 908 42% 97% 8% 9% 100% 85% 11 129 35 0 39 22 61 3.5
Karnataka Bijapur 583 73% 941 54% 93% 22% 35% 99% 87% 0 30 2 0 0 54 54 2.4
Karnataka Chamarajanagar 560 91% 796 59% 98% 8% 10% 100% 86% 8 41 12 0 0 0 0 0.0
Karnataka Chikkaballapur 556 77% 757 48% 96% 8% 7% 99% 89% 3 36 32 0 0 0 0 0.0
Karnataka Chikmagalur 323 75% 694 68% 96% 9% 10% 100% 91% 5 36 21 0 0 3 3 0.3
Karnataka Chitradurga 840 83% 1562 71% 98% 8% 9% 98% 86% 28 189 43 0 0 22 22 1.3
Karnataka Dakshina Kannada 674 83% 846 51% 98% 8% 9% 100% 99% 29 172 99 0 4 71 75 3.5
Karnataka Davanagere 714 85% 1413 69% 93% 14% 13% 99% 86% 6 95 16 0 6 0 6 0.3
Karnataka Dharwad 606 81% 531 31% 97% 15% 15% 100% 88% 11 680 7 5 26 1 32 1.7
Karnataka Gadag 510 84% 183 17% 100% 13% 19% 100% 88% 3 192 38 0 31 0 31 2.8
Karnataka Gulbarga 884 82% 1512 63% 93% 9% 15% 100% 99% 10 129 60 0 3 1 4 0.2
Karnataka Hassan 682 88% 787 56% 98% 13% 11% 100% 89% 5 116 19 0 0 0 0 0.0
Karnataka Haveri 517 75% 1375 80% 81% 10% 8% 99% 95% 13 154 28 0 0 0 0 0.0
Karnataka Kodagu 182 93% 247 63% 98% 7% 9% 97% 97% 3 43 11 0 0 0 0 0.0
Karnataka Kolar 557 79% 777 53% 99% 8% 10% 99% 92% 6 40 36 0 0 0 0 0.0
Karnataka Koppal 657 84% 1211 69% 99% 14% 17% 100% 94% 39 122 25 0 6 5 11 0.8
Karnataka Mandya 936 93% 1163 66% 99% 12% 14% 100% 95% 27 236 38 0 2 23 25 1.3
Karnataka Mysore 1193 84% 799 24% 95% 9% 10% 99% 91% 26 160 31 0 27 1 28 0.9
Karnataka Raichur 826 73% 2014 79% 95% 12% 14% 100% 87% 5 112 31 2 6 0 8 0.4

TB Annual Report115
State District Population (in lakh)
covered by RNTCP1
No. of suspects examined
Suspects examined per lakh
population
Rate of change in suspects examined per lakh
population
No of Smear positive patients
diagnosed2
Suspects examined per smear
positive case diagnosed
Rate of change in suspects examined
per s+ case diagnosed
Annual Smear
positive case detection rate (from
PMR)
Annual smear
positive case notification rate [from CFR: sm + cases (NSP
+ Rel + TAD) / Pop]
Total patients
registered for
treatment3
Annual total case
notification rate
Annual new smear
positive case notification
rate
Karnataka Ramanagara 11.1 10333 232 -12% 659 16 2% 59 60 1123 101 46
Karnataka Shimoga 18.0 15523 215 -5% 1099 14 0% 61 54 1640 91 44
Karnataka Tumkur 27.5 24806 225 -2% 2090 12 4% 76 64 3094 112 51
Karnataka Udupi 12.1 11772 243 3% 761 15 13% 63 46 929 77 36
Karnataka Uttara Kannada 14.8 12974 220 -4% 608 21 8% 41 38 1045 71 32
Karnataka Yadgiri 12.0 9389 195 24% 695 14 35% 58 55 1125 93 40
Kerala Alappuzha 21.4 20897 244 -8% 851 25 8% 40 42 1759 82 36
Kerala Ernakulam 33.0 30656 232 -2% 1796 17 -4% 54 42 2470 75 35
Kerala Idukki 11.2 15540 348 -4% 307 51 -1% 28 27 577 52 24
Kerala Kannur 25.4 25813 254 -6% 916 28 3% 36 30 1514 60 25
Kerala Kasaragod 13.1 12570 240 21% 497 25 14% 38 38 864 66 32
Kerala Kollam 26.5 29416 278 -10% 1268 23 -11% 48 46 2218 84 38
Kerala Kottayam 19.9 28718 360 -9% 1166 25 -3% 58 48 1715 86 42
Kerala Kozhikode 31.1 27340 220 5% 1259 22 2% 40 31 2174 70 27
Kerala Malappuram 41.4 38057 230 -1% 1221 31 -1% 29 27 2380 57 24
Kerala Palakkad 28.3 23692 209 9% 1413 17 3% 50 46 2147 76 40
Kerala Pathanamthitta 12.0 15453 321 7% 659 23 2% 55 49 1069 89 43
Kerala Thiruvananthapuram 33.3 52527 394 1% 1718 31 3% 52 39 2368 71 34
Kerala Thrissur 31.3 35780 286 0% 1703 21 2% 54 42 2330 74 35
Kerala Wayanad 8.2 8433 256 -8% 290 29 -5% 35 34 619 75 31
Lakshadweep Lakshadweep 0.6 1153 445 2% 16 72 -30% 25 19 23 35 19
Madhya Pradesh Alirajpur 7.5 3394 112 6% 391 9 0% 52 46 555 74 42
Madhya Pradesh Anuppur 7.8 5318 171 45% 550 10 23% 71 69 790 102 63
Madhya Pradesh Ashoknagar 8.8 4477 128 33% 761 6 -15% 87 73 1376 157 65
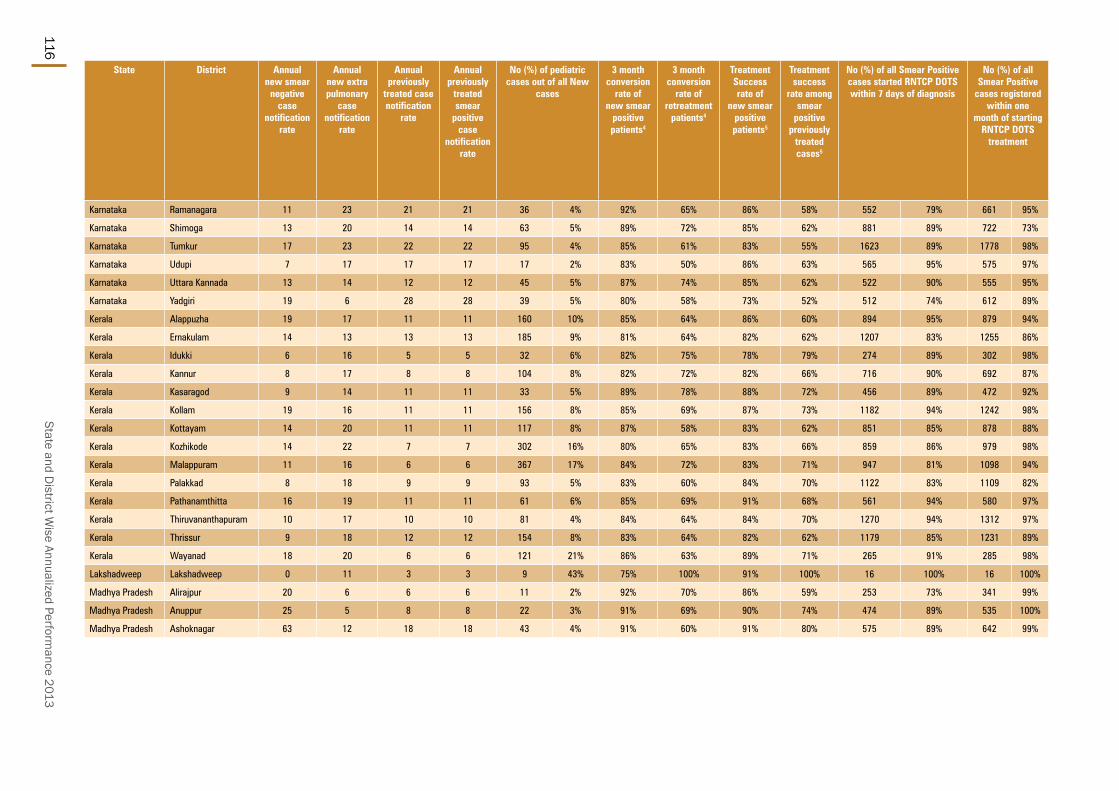
State and District W
ise Annualized Performance 2013
116
State District Annual new smear
negative case
notification rate
Annual new extra pulmonary
case notification
rate
Annual previously
treated case notification
rate
Annual previously
treated smear
positive case
notification rate
No (%) of pediatric cases out of all New
cases
3 month conversion
rate of new smear
positive patients4
3 month conversion
rate of retreatment
patients4
Treatment Success rate of
new smear positive patients5
Treatment success
rate among smear
positive previously
treated cases5
No (%) of all Smear Positive cases started RNTCP DOTS within 7 days of diagnosis
No (%) of all Smear Positive
cases registered within one
month of starting RNTCP DOTS
treatment
Karnataka Ramanagara 11 23 21 21 36 4% 92% 65% 86% 58% 552 79% 661 95%
Karnataka Shimoga 13 20 14 14 63 5% 89% 72% 85% 62% 881 89% 722 73%
Karnataka Tumkur 17 23 22 22 95 4% 85% 61% 83% 55% 1623 89% 1778 98%
Karnataka Udupi 7 17 17 17 17 2% 83% 50% 86% 63% 565 95% 575 97%
Karnataka Uttara Kannada 13 14 12 12 45 5% 87% 74% 85% 62% 522 90% 555 95%
Karnataka Yadgiri 19 6 28 28 39 5% 80% 58% 73% 52% 512 74% 612 89%
Kerala Alappuzha 19 17 11 11 160 10% 85% 64% 86% 60% 894 95% 879 94%
Kerala Ernakulam 14 13 13 13 185 9% 81% 64% 82% 62% 1207 83% 1255 86%
Kerala Idukki 6 16 5 5 32 6% 82% 75% 78% 79% 274 89% 302 98%
Kerala Kannur 8 17 8 8 104 8% 82% 72% 82% 66% 716 90% 692 87%
Kerala Kasaragod 9 14 11 11 33 5% 89% 78% 88% 72% 456 89% 472 92%
Kerala Kollam 19 16 11 11 156 8% 85% 69% 87% 73% 1182 94% 1242 98%
Kerala Kottayam 14 20 11 11 117 8% 87% 58% 83% 62% 851 85% 878 88%
Kerala Kozhikode 14 22 7 7 302 16% 80% 65% 83% 66% 859 86% 979 98%
Kerala Malappuram 11 16 6 6 367 17% 84% 72% 83% 71% 947 81% 1098 94%
Kerala Palakkad 8 18 9 9 93 5% 83% 60% 84% 70% 1122 83% 1109 82%
Kerala Pathanamthitta 16 19 11 11 61 6% 85% 69% 91% 68% 561 94% 580 97%
Kerala Thiruvananthapuram 10 17 10 10 81 4% 84% 64% 84% 70% 1270 94% 1312 97%
Kerala Thrissur 9 18 12 12 154 8% 83% 64% 82% 62% 1179 85% 1231 89%
Kerala Wayanad 18 20 6 6 121 21% 86% 63% 89% 71% 265 91% 285 98%
Lakshadweep Lakshadweep 0 11 3 3 9 43% 75% 100% 91% 100% 16 100% 16 100%
Madhya Pradesh Alirajpur 20 6 6 6 11 2% 92% 70% 86% 59% 253 73% 341 99%
Madhya Pradesh Anuppur 25 5 8 8 22 3% 91% 69% 90% 74% 474 89% 535 100%
Madhya Pradesh Ashoknagar 63 12 18 18 43 4% 91% 60% 91% 80% 575 89% 642 99%

TB Annual Report117
State District No (%) of all cured Smear
Positive cases
having end of treatment follow- up
sputum done within 7 days of last dose
No (%) of cases (all
forms of TB) registered receiving
DOT through a community
volunteer
Proportion of all
registered TB cases
with known
HIV status
Proportion of TB
patients known
to be HIV infected among tested
Proportion of TB
patients known
to be HIV infected among
registered
Proportion of HIV
infected TB
patients put on CPT (RT report)
Proportion of HIV
infected TB
patients put on
ART (RT report)
Number of health facilities
registered (Laboratories - Private) in
2013
Number of health facilities
registered (Single clinic - Private) in 2013
Number of health facilities
registered (Multi-clicnic
- Private) in 2013
Number of patients
notified by (Laboratories - Private) in
2013
Number of
patients notified
by (Single clinic -
Private) in 2013
Number of
patients notified
by (Multi-clinic - Private) in 2013
Total cases nofied
by private sector in 2013
Notification rate per 1,00,000
population (private sector)
Karnataka Ramanagara 487 79% 628 56% 97% 7% 7% 100% 91% 4 81 9 0 0 0 0 0.0
Karnataka Shimoga 600 68% 895 60% 94% 5% 8% 98% 92% 20 182 90 2 64 11 77 4.3
Karnataka Tumkur 1256 88% 1813 59% 98% 12% 12% 100% 83% 58 341 171 0 0 0 0 0.0
Karnataka Udupi 499 97% 551 59% 99% 15% 15% 100% 100% 13 128 62 0 0 5 5 0.4
Karnataka Uttara Kannada 442 88% 681 65% 93% 8% 10% 99% 94% 19 151 48 0 0 0 0 0.0
Karnataka Yadgiri 291 69% 835 72% 99% 9% 12% 99% 90% 9 126 27 0 5 2 7 0.6
Kerala Alappuzha 706 85% 1444 82% 82% 1% 2% 100% 100% 61 64 125 0 8 12 20 0.9
Kerala Ernakulam 885 84% 1330 62% 84% 1% 1% 89% 74% 0 14 72 0 0 123 123 3.7
Kerala Idukki 211 86% 436 72% 94% 2% 2% 50% 58% 12 39 45 0 2 1 3 0.3
Kerala Kannur 534 82% 895 59% 88% 1% 3% 55% 79% 6 33 37 0 0 51 51 2.0
Kerala Kasaragod 316 77% 636 75% 100% 3% 4% 100% 97% 4 141 32 0 10 2 12 0.9
Kerala Kollam 792 83% 1039 48% 100% 2% 2% 98% 95% 107 206 163 0 2 25 27 1.0
Kerala Kottayam 658 76% 800 47% 93% 1% 1% 100% 100% 31 189 102 0 0 2 2 0.1
Kerala Kozhikode 643 82% 1370 63% 82% 1% 2% 86% 79% 0 11 68 0 28 10 38 1.2
Kerala Malappuram 686 75% 2031 84% 99% 1% 1% 86% 95% 255 1232 38 11 107 75 193 4.7
Kerala Palakkad 720 74% 1302 66% 69% 4% 2% 60% 88% 1 58 75 0 7 46 53 1.9
Kerala Pathanamthitta 416 83% 758 70% 89% 1% 1% 82% 82% 27 67 69 0 0 13 13 1.1
Kerala Thiruvananthapuram 952 83% 1513 64% 97% 3% 3% 81% 92% 217 19 109 0 0 18 18 0.5
Kerala Thrissur 867 80% 1446 62% 90% 2% 2% 84% 100% 136 42 45 0 5 92 97 3.1
Kerala Wayanad 208 85% 440 72% 97% 1% 2% 60% 50% 23 14 32 0 1 1 2 0.2
Lakshadweep Lakshadweep 8 100% 13 100% 0% 0% 0 0 0 0 0 0 0 0.0
Madhya Pradesh Alirajpur 216 81% 304 63% 70% 0% 0% 0 0 0 0 0 0 0 0.0
Madhya Pradesh Anuppur 224 62% 162 32% 60% 0% 0% 0 0 0 0 0 0 0 0.0
Madhya Pradesh Ashoknagar 292 80% 997 72% 42% 0% 0% 0 0 0 0 0 0 0 0.0

State and District W
ise Annualized Performance 2013
118
State District Population (in lakh)
covered by RNTCP1
No. of suspects examined
Suspects examined per lakh
population
Rate of change in suspects examined per lakh
population
No of Smear positive patients
diagnosed2
Suspects examined per smear
positive case diagnosed
Rate of change in suspects examined
per s+ case diagnosed
Annual Smear
positive case detection rate (from
PMR)
Annual smear
positive case notification rate [from CFR: sm + cases (NSP
+ Rel + TAD) / Pop]
Total patients
registered for
treatment3
Annual total case
notification rate
Annual new smear
positive case notification
rate
Madhya Pradesh Balaghat 17.6 17421 247 221% 1036 17 176% 59 56 1723 98 50
Madhya Pradesh Barwani 14.4 8614 150 8% 899 10 11% 63 51 1197 83 46
Madhya Pradesh Betul 16.3 10296 158 3% 942 11 1% 58 40 1271 78 33
Madhya Pradesh Bhind 17.6 7663 109 8% 774 10 5% 44 38 1681 95 29
Madhya Pradesh Bhopal 24.5 20761 212 -1% 3032 7 3% 124 72 4479 183 56
Madhya Pradesh Burhanpur 7.8 6260 200 10% 500 13 28% 64 64 1079 138 56
Madhya Pradesh Chhatarpur 18.3 19434 266 2% 2182 9 9% 120 81 2356 129 65
Madhya Pradesh Chhindwara 21.7 12142 140 28% 1205 10 20% 56 48 2040 94 35
Madhya Pradesh Damoh 13.1 9111 174 22% 1649 6 7% 126 114 2443 187 83
Madhya Pradesh Datia 8.1 3310 102 17% 795 4 -8% 98 80 1274 156 59
Madhya Pradesh Dewas 16.2 9209 142 2% 885 10 9% 55 53 1583 98 48
Madhya Pradesh Dhar 22.6 12696 140 11% 1244 10 6% 55 54 2511 111 50
Madhya Pradesh Dindori 7.3 7436 255 -12% 448 17 -19% 61 59 706 97 50
Madhya Pradesh Guna 12.9 6791 132 55% 575 12 61% 45 41 1589 124 36
Madhya Pradesh Gwalior 21.0 21691 258 -33% 2389 9 -35% 114 94 3676 175 71
Madhya Pradesh Harda 5.9 4021 170 6% 333 12 6% 56 50 648 110 45
Madhya Pradesh Hoshangabad 12.9 11596 226 4% 1229 9 6% 96 87 2508 195 79
Madhya Pradesh Indore 33.9 32132 237 3% 3561 9 5% 105 75 5313 157 60
Madhya Pradesh Jabalpur 25.5 24370 239 8% 2363 10 11% 93 73 3522 138 58
Madhya Pradesh Jhabua 10.6 5363 126 10% 763 7 12% 72 67 1424 134 60
Madhya Pradesh Katni 13.4 5299 99 21% 847 6 28% 63 51 1741 130 43
Madhya Pradesh Khandwa 13.6 7883 145 -1% 856 9 -2% 63 60 1433 106 54
Madhya Pradesh Khargone 19.4 12350 159 16% 1567 8 8% 81 73 2678 138 65
Madhya Pradesh Mandla 10.9 6895 158 7% 894 8 3% 82 71 1583 145 62

TB Annual Report119
State District Annual new smear
negative case
notification rate
Annual new extra pulmonary
case notification
rate
Annual previously
treated case notification
rate
Annual previously
treated smear
positive case
notification rate
No (%) of pediatric cases out of all New
cases
3 month conversion
rate of new smear
positive patients4
3 month conversion
rate of retreatment
patients4
Treatment Success rate of
new smear positive patients5
Treatment success
rate among smear
positive previously
treated cases5
No (%) of all Smear Positive cases started RNTCP DOTS within 7 days of diagnosis
No (%) of all Smear Positive
cases registered within one
month of starting RNTCP DOTS
treatment
Madhya Pradesh Balaghat 30 6 12 12 55 4% 92% 67% 89% 63% 810 80% 966 96%
Madhya Pradesh Barwani 18 11 8 8 41 4% 90% 67% 91% 74% 691 93% 737 99%
Madhya Pradesh Betul 23 11 10 10 76 7% 92% 79% 86% 73% 572 86% 668 100%
Madhya Pradesh Bhind 40 9 17 17 135 10% 89% 70% 83% 62% 593 86% 682 99%
Madhya Pradesh Bhopal 50 39 37 37 523 15% 95% 71% 89% 60% 1521 84% 1785 99%
Madhya Pradesh Burhanpur 53 18 11 11 74 7% 91% 78% 90% 72% 473 94% 496 98%
Madhya Pradesh Chhatarpur 31 9 25 25 148 8% 94% 85% 94% 89% 1458 97% 1498 100%
Madhya Pradesh Chhindwara 30 8 20 20 53 3% 93% 79% 89% 77% 976 91% 1019 96%
Madhya Pradesh Damoh 36 28 39 39 94 5% 87% 60% 87% 67% 1446 96% 1513 100%
Madhya Pradesh Datia 47 13 37 37 152 16% 90% 43% 86% 58% 646 99% 639 98%
Madhya Pradesh Dewas 25 17 8 8 120 8% 92% 63% 89% 61% 803 93% 860 100%
Madhya Pradesh Dhar 40 13 8 8 227 10% 94% 83% 93% 86% 1028 83% 1124 91%
Madhya Pradesh Dindori 25 8 14 14 44 7% 92% 73% 88% 67% 392 89% 433 99%
Madhya Pradesh Guna 56 23 8 8 114 8% 89% 66% 88% 77% 475 89% 511 96%
Madhya Pradesh Gwalior 36 32 36 36 392 13% 93% 62% 90% 63% 1658 83% 1992 100%
Madhya Pradesh Harda 47 7 11 11 87 15% 89% 42% 90% 56% 259 85% 232 77%
Madhya Pradesh Hoshangabad 77 23 15 15 242 10% 93% 77% 92% 81% 1006 90% 1121 100%
Madhya Pradesh Indore 26 41 29 29 602 14% 96% 90% 93% 77% 2432 95% 2559 100%
Madhya Pradesh Jabalpur 30 22 28 28 218 8% 94% 68% 91% 60% 1757 93% 1859 99%
Madhya Pradesh Jhabua 56 4 14 14 67 5% 96% 76% 96% 78% 616 86% 711 99%
Madhya Pradesh Katni 71 5 11 11 94 6% 87% 65% 88% 69% 634 91% 691 99%
Madhya Pradesh Khandwa 31 12 9 9 125 10% 90% 63% 92% 65% 739 91% 806 99%
Madhya Pradesh Khargone 36 25 12 12 340 14% 93% 82% 89% 70% 1306 91% 1434 100%
Madhya Pradesh Mandla 47 22 14 14 103 7% 93% 74% 91% 82% 715 93% 753 98%
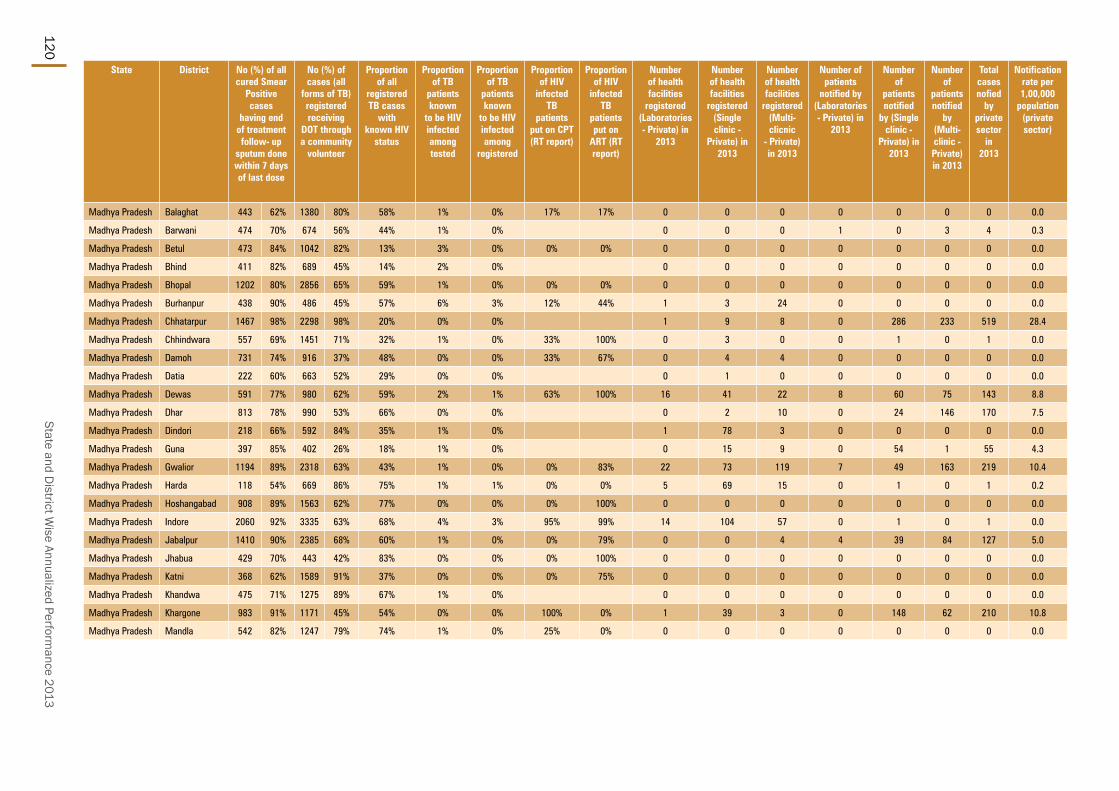
State and District W
ise Annualized Performance 2013
120
State District No (%) of all cured Smear
Positive cases
having end of treatment follow- up
sputum done within 7 days of last dose
No (%) of cases (all
forms of TB) registered receiving
DOT through a community
volunteer
Proportion of all
registered TB cases
with known HIV
status
Proportion of TB
patients known
to be HIV infected among tested
Proportion of TB
patients known
to be HIV infected among
registered
Proportion of HIV
infected TB
patients put on CPT (RT report)
Proportion of HIV
infected TB
patients put on
ART (RT report)
Number of health facilities
registered (Laboratories - Private) in
2013
Number of health facilities
registered (Single clinic -
Private) in 2013
Number of health facilities
registered (Multi-clicnic
- Private) in 2013
Number of patients
notified by (Laboratories - Private) in
2013
Number of
patients notified
by (Single clinic -
Private) in 2013
Number of
patients notified
by (Multi-clinic - Private) in 2013
Total cases nofied
by private sector
in 2013
Notification rate per 1,00,000
population (private sector)
Madhya Pradesh Balaghat 443 62% 1380 80% 58% 1% 0% 17% 17% 0 0 0 0 0 0 0 0.0
Madhya Pradesh Barwani 474 70% 674 56% 44% 1% 0% 0 0 0 1 0 3 4 0.3
Madhya Pradesh Betul 473 84% 1042 82% 13% 3% 0% 0% 0% 0 0 0 0 0 0 0 0.0
Madhya Pradesh Bhind 411 82% 689 45% 14% 2% 0% 0 0 0 0 0 0 0 0.0
Madhya Pradesh Bhopal 1202 80% 2856 65% 59% 1% 0% 0% 0% 0 0 0 0 0 0 0 0.0
Madhya Pradesh Burhanpur 438 90% 486 45% 57% 6% 3% 12% 44% 1 3 24 0 0 0 0 0.0
Madhya Pradesh Chhatarpur 1467 98% 2298 98% 20% 0% 0% 1 9 8 0 286 233 519 28.4
Madhya Pradesh Chhindwara 557 69% 1451 71% 32% 1% 0% 33% 100% 0 3 0 0 1 0 1 0.0
Madhya Pradesh Damoh 731 74% 916 37% 48% 0% 0% 33% 67% 0 4 4 0 0 0 0 0.0
Madhya Pradesh Datia 222 60% 663 52% 29% 0% 0% 0 1 0 0 0 0 0 0.0
Madhya Pradesh Dewas 591 77% 980 62% 59% 2% 1% 63% 100% 16 41 22 8 60 75 143 8.8
Madhya Pradesh Dhar 813 78% 990 53% 66% 0% 0% 0 2 10 0 24 146 170 7.5
Madhya Pradesh Dindori 218 66% 592 84% 35% 1% 0% 1 78 3 0 0 0 0 0.0
Madhya Pradesh Guna 397 85% 402 26% 18% 1% 0% 0 15 9 0 54 1 55 4.3
Madhya Pradesh Gwalior 1194 89% 2318 63% 43% 1% 0% 0% 83% 22 73 119 7 49 163 219 10.4
Madhya Pradesh Harda 118 54% 669 86% 75% 1% 1% 0% 0% 5 69 15 0 1 0 1 0.2
Madhya Pradesh Hoshangabad 908 89% 1563 62% 77% 0% 0% 0% 100% 0 0 0 0 0 0 0 0.0
Madhya Pradesh Indore 2060 92% 3335 63% 68% 4% 3% 95% 99% 14 104 57 0 1 0 1 0.0
Madhya Pradesh Jabalpur 1410 90% 2385 68% 60% 1% 0% 0% 79% 0 0 4 4 39 84 127 5.0
Madhya Pradesh Jhabua 429 70% 443 42% 83% 0% 0% 0% 100% 0 0 0 0 0 0 0 0.0
Madhya Pradesh Katni 368 62% 1589 91% 37% 0% 0% 0% 75% 0 0 0 0 0 0 0 0.0
Madhya Pradesh Khandwa 475 71% 1275 89% 67% 1% 0% 0 0 0 0 0 0 0 0.0
Madhya Pradesh Khargone 983 91% 1171 45% 54% 0% 0% 100% 0% 1 39 3 0 148 62 210 10.8
Madhya Pradesh Mandla 542 82% 1247 79% 74% 1% 0% 25% 0% 0 0 0 0 0 0 0 0.0

TB Annual Report121
State District Population (in lakh)
covered by RNTCP1
No. of suspects examined
Suspects examined per lakh
population
Rate of change in suspects examined per lakh
population
No of Smear positive patients
diagnosed2
Suspects examined per smear
positive case diagnosed
Rate of change in suspects examined
per s+ case diagnosed
Annual Smear
positive case detection rate (from
PMR)
Annual smear
positive case notification rate [from CFR: sm + cases (NSP
+ Rel + TAD) / Pop]
Total patients
registered for
treatment3
Annual total case
notification rate
Annual new smear
positive case notification
rate
Madhya Pradesh Mandsaur 13.9 9222 166 3% 1114 8 4% 80 74 2067 149 47
Madhya Pradesh Morena 20.4 10665 131 26% 1365 8 9% 67 58 2016 99 38
Madhya Pradesh Narsinghpur 11.3 4382 97 -18% 486 9 -12% 43 41 977 86 31
Madhya Pradesh Neemuch 8.6 6065 177 16% 581 10 30% 68 71 1291 151 55
Madhya Pradesh Panna 10.5 4483 106 29% 769 6 15% 73 66 1059 101 50
Madhya Pradesh Raisen 13.8 7720 140 14% 743 10 14% 54 54 1403 102 40
Madhya Pradesh Rajgarh 16.0 7266 113 11% 851 9 9% 53 45 1920 120 37
Madhya Pradesh Ratlam 15.1 7059 117 8% 1000 7 4% 66 56 2037 135 42
Madhya Pradesh Rewa 24.5 17122 175 -4% 1764 10 4% 72 64 3304 135 55
Madhya Pradesh Sagar 24.6 12744 129 15% 1881 7 17% 76 68 2721 110 56
Madhya Pradesh Satna 23.1 11547 125 -8% 1346 9 14% 58 49 3388 147 46
Madhya Pradesh Sehore 13.6 5144 95 18% 601 9 1% 44 40 1247 92 36
Madhya Pradesh Seoni 14.3 6125 107 4% 778 8 2% 54 51 1171 82 42
Madhya Pradesh Shahdol 11.0 4746 108 5% 648 7 2% 59 48 1069 97 42
Madhya Pradesh Shajapur 15.7 5804 93 -8% 841 7 3% 54 52 1516 97 46
Madhya Pradesh Sheopur 7.1 3254 114 -8% 642 5 25% 90 105 1097 154 82
Madhya Pradesh Shivpuri 17.9 12003 168 9% 1686 7 5% 94 102 2648 148 84
Madhya Pradesh Sidhi 11.7 5111 110 15% 690 7 20% 59 48 1317 113 42
Madhya Pradesh Singrauli 12.2 8797 180 55% 620 14 34% 51 46 1012 83 39
Madhya Pradesh Tikamgarh 15.0 2777 46 -31% 353 8 -1% 24 30 850 57 23
Madhya Pradesh Ujjain 20.6 14063 171 18% 1987 7 14% 97 60 2519 122 42
Madhya Pradesh Umaria 6.7 3837 144 12% 320 12 21% 48 46 544 82 41
Madhya Pradesh Vidisha 15.1 8464 140 11% 1034 8 9% 68 67 2068 137 50
Maharashtra Ahmadnagar 43.0 32020 186 7% 2419 13 -4% 56 56 4438 103 49

State and District W
ise Annualized Performance 2013
122
State District Annual new smear
negative case
notification rate
Annual new extra pulmonary
case notification
rate
Annual previously
treated case notification
rate
Annual previously
treated smear
positive case
notification rate
No (%) of pediatric cases out of all New
cases
3 month conversion
rate of new smear
positive patients4
3 month conversion
rate of retreatment
patients4
Treatment Success rate of
new smear positive patients5
Treatment success
rate among smear
positive previously
treated cases5
No (%) of all Smear Positive cases started RNTCP DOTS within 7 days of diagnosis
No (%) of all Smear Positive
cases registered within one month of starting RNTCP DOTS treatment
Madhya Pradesh Mandsaur 44 18 39 39 145 10% 90% 65% 90% 76% 934 89% 1049 100%
Madhya Pradesh Morena 13 13 36 36 97 8% 91% 74% 88% 67% 934 78% 1162 97%
Madhya Pradesh Narsinghpur 25 13 18 18 46 6% 89% 59% 86% 62% 379 79% 469 98%
Madhya Pradesh Neemuch 45 13 37 37 30 3% 91% 75% 90% 81% 555 91% 594 98%
Madhya Pradesh Panna 19 9 23 23 91 11% 91% 63% 89% 75% 634 90% 681 97%
Madhya Pradesh Raisen 29 10 22 22 52 5% 90% 80% 91% 84% 554 74% 694 93%
Madhya Pradesh Rajgarh 45 9 29 29 100 7% 89% 55% 87% 66% 694 95% 731 100%
Madhya Pradesh Ratlam 46 20 28 28 146 9% 93% 74% 83% 69% 710 83% 837 97%
Madhya Pradesh Rewa 39 19 21 21 193 7% 93% 74% 89% 70% 1531 96% 1198 75%
Madhya Pradesh Sagar 28 11 16 16 88 4% 89% 72% 89% 72% 1531 90% 1658 97%
Madhya Pradesh Satna 69 22 9 9 106 3% 87% 69% 90% 74% 1072 93% 1119 97%
Madhya Pradesh Sehore 32 12 13 13 54 5% 89% 73% 88% 77% 530 96% 548 99%
Madhya Pradesh Seoni 18 9 13 13 40 4% 94% 74% 91% 72% 658 89% 668 90%
Madhya Pradesh Shahdol 30 10 14 14 44 5% 92% 83% 90% 88% 486 91% 537 100%
Madhya Pradesh Shajapur 20 15 16 16 92 7% 93% 75% 89% 84% 783 95% 818 100%
Madhya Pradesh Sheopur 24 12 36 36 57 7% 84% 58% 91% 82% 461 84% 525 95%
Madhya Pradesh Shivpuri 31 6 27 27 118 5% 92% 69% 92% 74% 1664 90% 1802 98%
Madhya Pradesh Sidhi 36 11 23 23 108 10% 83% 50% 94% 90% 462 76% 576 94%
Madhya Pradesh Singrauli 20 10 14 14 58 7% 90% 71% 92% 83% 423 74% 562 99%
Madhya Pradesh Tikamgarh 18 6 10 10 12 2% 76% 58% 76% 62% 276 85% 323 100%
Madhya Pradesh Ujjain 34 22 24 24 268 13% 93% 72% 88% 70% 1173 94% 1210 97%
Madhya Pradesh Umaria 24 8 9 9 31 6% 91% 66% 90% 63% 255 83% 298 97%
Madhya Pradesh Vidisha 38 18 31 31 86 5% 89% 76% 88% 76% 953 94% 998 98%
Maharashtra Ahmadnagar 24 14 16 16 178 5% 91% 58% 87% 64% 2292 94% 2426 100%

TB Annual Report123
State District No (%) of all cured Smear
Positive cases
having end of treatment follow- up
sputum done within 7 days of last dose
No (%) of cases (all
forms of TB) registered receiving
DOT through a community
volunteer
Proportion of all
registered TB cases
with known HIV
status
Proportion of TB
patients known
to be HIV infected among tested
Proportion of TB
patients known
to be HIV infected among
registered
Proportion of HIV
infected TB
patients put on CPT (RT report)
Proportion of HIV
infected TB
patients put on
ART (RT report)
Number of health facilities
registered (Laboratories - Private) in
2013
Number of health facilities
registered (Single clinic -
Private) in 2013
Number of health facilities
registered (Multi-clicnic
- Private) in 2013
Number of patients
notified by (Laboratories - Private) in
2013
Number of
patients notified
by (Single clinic -
Private) in 2013
Number of
patients notified
by (Multi-clinic - Private) in 2013
Total cases nofied
by private sector in 2013
Notification rate per 1,00,000
population (private sector)
Madhya Pradesh Mandsaur 683 85% 1733 84% 63% 2% 1% 100% 100% 3 16 15 0 284 69 353 25.4
Madhya Pradesh Morena 355 47% 1712 85% 24% 1% 0% 0% 50% 1 7 8 0 4 40 44 2.2
Madhya Pradesh Narsinghpur 238 63% 739 76% 25% 1% 0% 0 0 0 0 0 0 0 0.0
Madhya Pradesh Neemuch 360 68% 897 69% 57% 4% 2% 91% 95% 2 1 2 38 744 12 794 92.8
Madhya Pradesh Panna 434 85% 48 86% 64% 0% 0% 0 0 0 0 0 0 0 0.0
Madhya Pradesh Raisen 401 68% 133 9% 61% 0% 0% 0 0 0 0 0 0 0 0.0
Madhya Pradesh Rajgarh 452 85% 1484 77% 39% 1% 0% 2 46 2 0 0 0 0 0.0
Madhya Pradesh Ratlam 384 65% 1628 80% 47% 2% 1% 0% 96% 0 1 0 0 832 146 978 64.9
Madhya Pradesh Rewa 1301 87% 2418 73% 82% 1% 1% 0% 100% 0 2 0 0 0 0 0 0.0
Madhya Pradesh Sagar 913 68% 1795 66% 19% 2% 0% 0 1 1 0 22 29 51 2.1
Madhya Pradesh Satna 931 78% 1860 55% 46% 0% 0% 0% 100% 0 21 9 0 94 22 116 5.0
Madhya Pradesh Sehore 358 86% 961 77% 34% 0% 0% 0% 0% 0 0 0 0 0 0 0 0.0
Madhya Pradesh Seoni 395 69% 1055 95% 54% 1% 2% 0% 100% 0 4 2 0 2 47 49 3.4
Madhya Pradesh Shahdol 282 65% 440 43% 42% 1% 0% 0 15 3 0 0 0 0 0.0
Madhya Pradesh Shajapur 741 91% 920 61% 55% 1% 0% 14% 57% 0 0 0 0 0 0 0 0.0
Madhya Pradesh Sheopur 189 60% 718 93% 42% 0% 0% 0 0 0 0 0 0 0 0.0
Madhya Pradesh Shivpuri 978 79% 2256 85% 27% 1% 0% 0% 56% 0 0 0 0 0 0 0 0.0
Madhya Pradesh Sidhi 338 74% 1241 95% 36% 1% 0% 0 0 2 0 0 0 0 0.0
Madhya Pradesh Singrauli 211 54% 631 62% 45% 1% 0% 0% 100% 0 9 6 0 1 0 1 0.1
Madhya Pradesh Tikamgarh 122 54% 471 73% 61% 0% 0% 0 0 0 0 0 0 0 0.0
Madhya Pradesh Ujjain 752 82% 1620 66% 67% 2% 1% 82% 95% 0 0 2 0 0 96 96 4.7
Madhya Pradesh Umaria 168 67% 476 88% 63% 0% 0% 0 7 0 0 0 2 2 0.3
Madhya Pradesh Vidisha 768 94% 787 38% 32% 0% 0% 0 0 0 0 0 1 1 0.1
Maharashtra Ahmadnagar 1576 90% 1164 26% 95% 8% 7% 98% 98% 33 833 478 11 57 163 231 5.4

State and District W
ise Annualized Performance 2013
124
State District Population (in lakh)
covered by RNTCP1
No. of suspects examined
Suspects examined per lakh
population
Rate of change in suspects examined per lakh
population
No of Smear positive patients
diagnosed2
Suspects examined per smear
positive case diagnosed
Rate of change in suspects examined
per s+ case diagnosed
Annual Smear
positive case detection rate (from
PMR)
Annual smear
positive case notification rate [from CFR: sm + cases (NSP
+ Rel + TAD) / Pop]
Total patients
registered for
treatment3
Annual total case
notification rate
Annual new smear
positive case notification
rate
Maharashtra Ahmednagar MC 3.6 2718 189 3% 278 10 7% 77 27 317 88 17
Maharashtra Akola 14.3 10724 188 25% 518 21 17% 36 47 1216 85 36
Maharashtra Akola Municipal Corporation
4.4 3410 194 1% 521 7 2% 119 48 430 98 33
Maharashtra Amravati MC 6.6 6073 229 12% 411 15 46% 62 41 644 97 27
Maharashtra Amravati Rural 23.0 19656 214 12% 1613 12 3% 70 56 2283 99 42
Maharashtra Andheri East 8.7 6038 174 583 10 67 70 1343 155 54
Maharashtra Andheri West 7.5 5526 185 616 9 83 81 1255 168 64
Maharashtra Aurangabad 25.9 17403 168 18% 1210 14 14% 47 55 1981 76 46
Maharashtra Aurangabad MC 12.0 7056 147 20% 1134 6 11% 94 53 1155 96 41
Maharashtra Bail Bazar Road 0.5 1971 930 274 7 517 729 1299 2453 519
Maharashtra Bandra East 6.2 3963 159 -40% 420 9 -47% 67 85 1472 236 60
Maharashtra Bandra West 3.6 3064 212 453 7 125 82 603 167 65
Maharashtra Bhandara 12.3 12206 248 743 16 60 53 1304 106 42
Maharashtra Bhiwandi Nizampur 7.3 7160 245 7% 767 9 7% 105 77 1651 226 56
Maharashtra Bid 26.5 20903 197 45% 1286 16 11% 48 43 1748 66 36
Maharashtra Borivali 5.5 3278 149 417 8 76 56 587 107 41
Maharashtra Buldana 26.6 21101 199 70% 2118 10 49% 80 52 2448 92 39
Maharashtra Byculla 4.7 12154 643 1031 12 218 87 1024 217 59
Maharashtra Centenary 3.0 6008 501 724 8 242 191 1668 557 121
Maharashtra Chandrapur 22.5 18148 201 25% 1625 11 15% 72 60 2381 106 49
Maharashtra Chembur 4.4 3438 196 486 7 111 98 1103 251 59
Maharashtra Colaba 5.8 4753 205 600 8 104 96 1398 241 63
Maharashtra Dadar 6.3 8246 325 1217 7 192 77 1663 262 55
Maharashtra Dahisar 3.9 3885 249 487 8 125 75 593 152 60

TB Annual Report125
State District Annual new smear
negative case
notification rate
Annual new extra pulmonary
case notification
rate
Annual previously
treated case notification
rate
Annual previously
treated smear
positive case
notification rate
No (%) of pediatric cases out of all New
cases
3 month conversion
rate of new smear
positive patients4
3 month conversion
rate of retreatment
patients4
Treatment Success rate of
new smear positive patients5
Treatment success
rate among smear
positive previously
treated cases5
No (%) of all Smear Positive cases started RNTCP DOTS within 7 days of diagnosis
No (%) of all Smear Positive
cases registered within one month of starting RNTCP DOTS treatment
Maharashtra Ahmednagar MC 21 24 26 26 16 7% 70% 45% 72% 48% 97 92% 69 65%
Maharashtra Akola 15 16 18 18 37 4% 86% 70% 80% 56% 557 80% 691 100%
Maharashtra Akola Municipal Corporation
16 22 26 26 14 4% 79% 54% 72% 53% 170 79% 214 99%
Maharashtra Amravati MC 22 23 25 25 22 5% 90% 74% 83% 60% 268 96% 274 98%
Maharashtra Amravati Rural 20 16 22 22 78 4% 88% 73% 83% 66% 1093 83% 1311 99%
Maharashtra Andheri East 26 39 36 36 81 8% 92% 60% 87% 56% 610 98% 625 100%
Maharashtra Andheri West 21 46 38 38 118 12% 93% 50% 552 99% 558 100%
Maharashtra Aurangabad 9 8 14 14 73 5% 93% 85% 91% 74% 1306 90% 1426 99%
Maharashtra Aurangabad MC 8 28 20 20 39 4% 87% 58% 88% 52% 586 90% 652 100%
Maharashtra Bail Bazar Road 593 568 772 772 94 11% 93% 58% 86% 41% 368 92% 370 93%
Maharashtra Bandra East 60 57 60 60 136 12% 91% 72% 92% 72% 546 95% 557 97%
Maharashtra Bandra West 22 30 50 50 33 8% 91% 61% 84% 57% 311 100% 311 100%
Maharashtra Bhandara 25 18 22 22 64 6% 90% 59% 86% 59% 567 85% 670 100%
Maharashtra Bhiwandi Nizampur 57 42 72 72 132 12% 89% 79% 87% 66% 470 82% 563 99%
Maharashtra Bid 7 10 12 12 53 4% 88% 62% 85% 59% 1103 96% 1141 99%
Maharashtra Borivali 23 14 29 29 33 8% 90% 51% 88% 48% 275 88% 313 100%
Maharashtra Buldana 19 13 21 21 67 4% 85% 55% 80% 56% 1188 83% 1351 95%
Maharashtra Byculla 32 61 65 65 48 7% 91% 51% 76% 38% 402 94% 422 99%
Maharashtra Centenary 136 121 178 178 167 15% 90% 60% 84% 67% 556 96% 578 100%
Maharashtra Chandrapur 21 15 21 21 68 4% 90% 68% 88% 63% 1204 87% 1307 95%
Maharashtra Chembur 48 60 84 84 103 14% 87% 52% 73% 32% 406 93% 435 99%
Maharashtra Colaba 48 63 67 67 35 3% 92% 70% 85% 66% 529 93% 550 97%
Maharashtra Dadar 55 78 74 74 179 15% 89% 73% 85% 42% 490 98% 499 100%
Maharashtra Dahisar 32 28 32 32 43 9% 90% 61% 86% 43% 275 92% 299 100%

State and District W
ise Annualized Performance 2013
126
State District No (%) of all cured Smear
Positive cases
having end of treatment follow- up
sputum done within 7 days of last dose
No (%) of cases (all
forms of TB) registered receiving
DOT through a community
volunteer
Proportion of all
registered TB cases
with known HIV
status
Proportion of TB
patients known
to be HIV infected among tested
Proportion of TB
patients known
to be HIV infected among
registered
Proportion of HIV
infected TB
patients put on CPT (RT report)
Proportion of HIV
infected TB
patients put on
ART (RT report)
Number of health facilities
registered (Laboratories - Private) in
2013
Number of health facilities
registered (Single clinic -
Private) in 2013
Number of health facilities
registered (Multi-clicnic
- Private) in 2013
Number of patients
notified by (Laboratories - Private) in
2013
Number of
patients notified
by (Single clinic -
Private) in 2013
Number of
patients notified
by (Multi-clinic - Private) in 2013
Total cases nofied
by private sector
in 2013
Notification rate per 1,00,000
population (private sector)
Maharashtra Ahmednagar MC 62 85% 2 1% 89% 17% 18% 100% 84% 40 190 117 6 17 122 145 40.3
Maharashtra Akola 352 77% 992 81% 94% 8% 7% 100% 100% 27 355 11 0 1 0 1 0.1
Maharashtra Akola Municipal Corporation
105 76% 260 60% 96% 12% 10% 95% 86% 34 98 106 16 13 97 126 28.7
Maharashtra Amravati MC 229 97% 330 51% 93% 7% 8% 100% 94% 20 266 182 2 5 64 71 10.7
Maharashtra Amravati Rural 682 71% 969 42% 78% 4% 4% 99% 99% 2 62 24 5 1 30 36 1.6
Maharashtra Andheri East 618 88% 263 22% 86% 6% 2% 96% 96% 9 195 44 1 110 108 219 25.3
Maharashtra Andheri West 369 89% 385 33% 88% 7% 0% 2 88 20 0 29 362 391 52.4
Maharashtra Aurangabad 1010 89% 1028 53% 89% 9% 4% 72% 76% 9 136 67 0 27 19 46 1.8
Maharashtra Aurangabad MC 453 93% 0 0% 92% 5% 6% 100% 100% 39 202 142 12 83 159 254 21.1
Maharashtra Bail Bazar Road 252 86% 483 37% 73% 5% 0% 100% 100% 3 149 2 0 4 41 45 85.0
Maharashtra Bandra East 612 92% 159 26% 88% 5% 2% 92% 72% 2 42 3 0 0 0 0 0.0
Maharashtra Bandra West 180 78% 90 15% 91% 5% 2% 100% 100% 7 107 28 1 9 37 47 13.0
Maharashtra Bhandara 373 72% 851 65% 96% 8% 7% 100% 100% 2 76 36 0 25 12 37 3.0
Maharashtra Bhiwandi Nizampur 432 94% 780 47% 93% 6% 7% 99% 94% 6 100 16 0 0 0 0 0.0
Maharashtra Bid 556 82% 939 54% 100% 15% 14% 99% 67% 14 357 112 0 8 17 25 0.9
Maharashtra Borivali 159 64% 123 21% 89% 8% 2% 100% 82% 7 132 42 1 51 96 148 26.9
Maharashtra Buldana 572 71% 791 32% 81% 4% 3% 99% 83% 8 113 12 0 194 64 258 9.7
Maharashtra Byculla 177 79% 151 15% 76% 14% 3% 100% 85% 8 75 3 4 31 70 105 22.2
Maharashtra Centenary 349 77% 444 35% 64% 7% 2% 100% 100% 0 71 0 0 0 0 0 0.0
Maharashtra Chandrapur 846 89% 1178 50% 92% 6% 6% 100% 95% 3 135 65 0 1 54 55 2.4
Maharashtra Chembur 258 83% 319 29% 80% 7% 4% 98% 67% 3 80 22 0 26 31 57 13.0
Maharashtra Colaba 483 86% 340 24% 89% 11% 2% 100% 82% 1 20 3 0 7 209 216 37.3
Maharashtra Dadar 307 98% 633 39% 87% 6% 1% 100% 100% 8 143 18 308 18 16 342 53.9
Maharashtra Dahisar 168 92% 187 32% 84% 10% 2% 100% 58% 2 79 19 84 9 53 146 37.5

TB Annual Report127
State District Population (in lakh)
covered by RNTCP1
No. of suspects examined
Suspects examined per lakh
population
Rate of change in suspects examined per lakh
population
No of Smear positive patients
diagnosed2
Suspects examined per smear
positive case diagnosed
Rate of change in suspects examined
per s+ case diagnosed
Annual Smear
positive case detection rate (from
PMR)
Annual smear
positive case notification rate [from CFR: sm + cases (NSP
+ Rel + TAD) / Pop]
Total patients
registered for
treatment3
Annual total case
notification rate
Annual new smear
positive case notification
rate
Maharashtra Dhule 17.2 12366 180 12% 1135 11 -1% 66 66 1772 103 58
Maharashtra Dhule MC 3.9 4449 288 3% 696 6 -1% 180 80 506 131 63
Maharashtra Gadchiroli 11.0 8005 182 4% 907 9 5% 82 71 1244 113 59
Maharashtra Ghatkopar 6.6 5395 204 640 8 97 86 1267 192 61
Maharashtra Gondiya 13.6 8098 149 2% 721 11 10% 53 45 1199 88 36
Maharashtra Goregaon 4.7 3759 200 385 10 82 70 912 194 49
Maharashtra Govandi 4.2 2401 142 226 11 53 122 1521 359 77
Maharashtra Grant Road 4.1 1457 90 212 7 52 67 527 129 54
Maharashtra Hingoli 12.1 5587 115 6% 617 9 2% 51 49 1054 87 36
Maharashtra Jalgaon 38.6 19206 124 20% 1643 12 18% 43 48 3877 100 38
Maharashtra Jalgaon MC 4.7 4879 258 -3% 661 7 -16% 140 55 498 105 44
Maharashtra Jalna 20.1 6649 83 37% 774 9 34% 39 37 1516 75 27
Maharashtra Kalyan Dombivli MC 12.8 6677 130 7% 919 7 12% 72 51 1776 139 33
Maharashtra Kandivali 6.2 3504 141 400 9 64 71 1051 169 55
Maharashtra Kolhapur 34.1 35680 261 41% 1927 19 39% 56 51 2725 80 46
Maharashtra Kolhapur MC 5.6 3287 146 19% 253 13 10% 45 40 484 86 31
Maharashtra Kurla 8.3 3610 108 281 13 34 35 823 99 24
Maharashtra Latur 25.2 21799 216 40% 1242 18 28% 49 41 1860 74 34
Maharashtra Malad 8.5 6687 197 783 9 92 90 1986 234 64
Maharashtra Malegoan Corporation 4.8 4489 232 6% 526 9 -2% 109 82 982 203 67
Maharashtra Mira Bhayander 8.4 4797 143 8% 616 8 19% 74 69 995 119 54
Maharashtra Mulund 3.5 4006 282 400 10 113 64 523 147 52
Maharashtra Nagpur MC 24.7 15550 157 6% 1941 8 -9% 79 58 2793 113 43
Maharashtra Nagpur Rural 23.1 15824 171 4% 1615 10 18% 70 64 2335 101 52
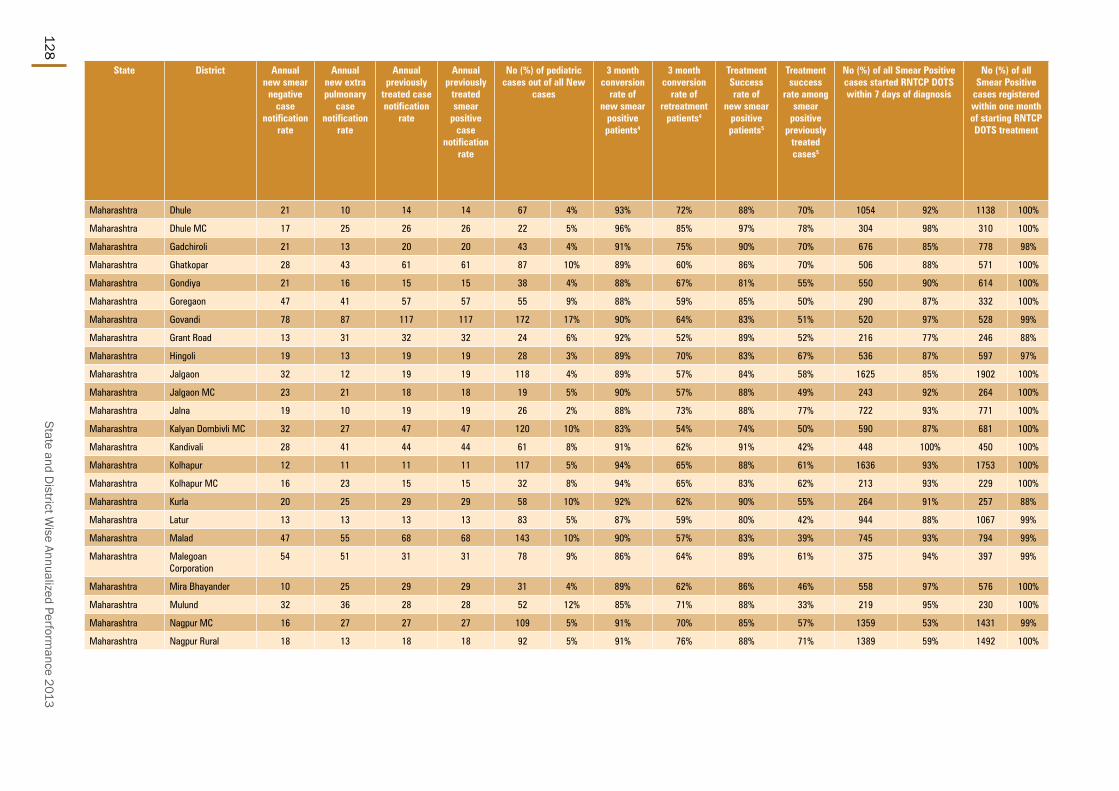
State and District W
ise Annualized Performance 2013
128
State District Annual new smear
negative case
notification rate
Annual new extra pulmonary
case notification
rate
Annual previously
treated case notification
rate
Annual previously
treated smear
positive case
notification rate
No (%) of pediatric cases out of all New
cases
3 month conversion
rate of new smear
positive patients4
3 month conversion
rate of retreatment
patients4
Treatment Success rate of
new smear positive patients5
Treatment success
rate among smear
positive previously
treated cases5
No (%) of all Smear Positive cases started RNTCP DOTS within 7 days of diagnosis
No (%) of all Smear Positive
cases registered within one month of starting RNTCP DOTS treatment
Maharashtra Dhule 21 10 14 14 67 4% 93% 72% 88% 70% 1054 92% 1138 100%
Maharashtra Dhule MC 17 25 26 26 22 5% 96% 85% 97% 78% 304 98% 310 100%
Maharashtra Gadchiroli 21 13 20 20 43 4% 91% 75% 90% 70% 676 85% 778 98%
Maharashtra Ghatkopar 28 43 61 61 87 10% 89% 60% 86% 70% 506 88% 571 100%
Maharashtra Gondiya 21 16 15 15 38 4% 88% 67% 81% 55% 550 90% 614 100%
Maharashtra Goregaon 47 41 57 57 55 9% 88% 59% 85% 50% 290 87% 332 100%
Maharashtra Govandi 78 87 117 117 172 17% 90% 64% 83% 51% 520 97% 528 99%
Maharashtra Grant Road 13 31 32 32 24 6% 92% 52% 89% 52% 216 77% 246 88%
Maharashtra Hingoli 19 13 19 19 28 3% 89% 70% 83% 67% 536 87% 597 97%
Maharashtra Jalgaon 32 12 19 19 118 4% 89% 57% 84% 58% 1625 85% 1902 100%
Maharashtra Jalgaon MC 23 21 18 18 19 5% 90% 57% 88% 49% 243 92% 264 100%
Maharashtra Jalna 19 10 19 19 26 2% 88% 73% 88% 77% 722 93% 771 100%
Maharashtra Kalyan Dombivli MC 32 27 47 47 120 10% 83% 54% 74% 50% 590 87% 681 100%
Maharashtra Kandivali 28 41 44 44 61 8% 91% 62% 91% 42% 448 100% 450 100%
Maharashtra Kolhapur 12 11 11 11 117 5% 94% 65% 88% 61% 1636 93% 1753 100%
Maharashtra Kolhapur MC 16 23 15 15 32 8% 94% 65% 83% 62% 213 93% 229 100%
Maharashtra Kurla 20 25 29 29 58 10% 92% 62% 90% 55% 264 91% 257 88%
Maharashtra Latur 13 13 13 13 83 5% 87% 59% 80% 42% 944 88% 1067 99%
Maharashtra Malad 47 55 68 68 143 10% 90% 57% 83% 39% 745 93% 794 99%
Maharashtra Malegoan Corporation
54 51 31 31 78 9% 86% 64% 89% 61% 375 94% 397 99%
Maharashtra Mira Bhayander 10 25 29 29 31 4% 89% 62% 86% 46% 558 97% 576 100%
Maharashtra Mulund 32 36 28 28 52 12% 85% 71% 88% 33% 219 95% 230 100%
Maharashtra Nagpur MC 16 27 27 27 109 5% 91% 70% 85% 57% 1359 53% 1431 99%
Maharashtra Nagpur Rural 18 13 18 18 92 5% 91% 76% 88% 71% 1389 59% 1492 100%

TB Annual Report129
State District No (%) of all cured Smear
Positive cases
having end of treatment follow- up
sputum done within 7 days of last dose
No (%) of cases (all
forms of TB) registered receiving
DOT through a community
volunteer
Proportion of all
registered TB cases
with known HIV
status
Proportion of TB
patients known
to be HIV infected among tested
Proportion of TB
patients known
to be HIV infected among
registered
Proportion of HIV
infected TB
patients put on CPT (RT report)
Proportion of HIV
infected TB
patients put on
ART (RT report)
Number of health facilities
registered (Laboratories - Private) in
2013
Number of health facilities
registered (Single clinic -
Private) in 2013
Number of health facilities
registered (Multi-clicnic
- Private) in 2013
Number of patients
notified by (Laboratories - Private) in
2013
Number of
patients notified
by (Single clinic -
Private) in 2013
Number of
patients notified
by (Multi-clinic - Private) in 2013
Total cases nofied
by private sector
in 2013
Notification rate per 1,00,000
population (private sector)
Maharashtra Dhule 810 87% 1286 73% 87% 8% 6% 100% 95% 10 194 41 0 56 4 60 3.5
Maharashtra Dhule MC 270 98% 128 25% 99% 8% 8% 100% 83% 11 48 29 0 25 7 32 8.3
Maharashtra Gadchiroli 550 87% 609 49% 92% 2% 2% 100% 100% 0 1 3 0 0 16 16 1.5
Maharashtra Ghatkopar 369 75% 407 38% 75% 7% 2% 100% 82% 6 129 2 0 124 61 185 28.0
Maharashtra Gondiya 387 80% 853 71% 92% 4% 5% 100% 98% 1 145 8 0 1 37 38 2.8
Maharashtra Goregaon 179 89% 353 39% 82% 8% 2% 71% 67% 1 149 4 0 77 0 77 16.4
Maharashtra Govandi 569 86% 733 48% 80% 5% 1% 100% 100% 0 43 3 0 0 0 0 0.0
Maharashtra Grant Road 142 64% 70 15% 84% 11% 6% 100% 53% 2 175 9 0 179 11 190 46.7
Maharashtra Hingoli 402 83% 668 64% 94% 6% 8% 100% 100% 1 56 3 0 61 0 61 5.0
Maharashtra Jalgaon 997 72% 2114 55% 88% 8% 9% 94% 88% 9 344 59 0 352 136 488 12.6
Maharashtra Jalgaon MC 189 96% 27 5% 98% 9% 13% 100% 91% 11 122 74 23 217 49 289 61.2
Maharashtra Jalna 567 91% 635 41% 87% 7% 8% 99% 92% 8 49 15 2 76 118 196 9.8
Maharashtra Kalyan Dombivli MC 434 93% 82 5% 93% 7% 7% 97% 83% 0 148 168 0 0 149 149 11.6
Maharashtra Kandivali 131 87% 462 48% 80% 8% 1% 92% 92% 8 209 44 13 194 47 254 40.7
Maharashtra Kolhapur 1213 86% 1706 65% 97% 11% 13% 100% 99% 3 1084 265 0 151 80 231 6.8
Maharashtra Kolhapur MC 166 92% 122 25% 99% 17% 22% 100% 97% 31 338 167 67 87 100 254 45.1
Maharashtra Kurla 182 85% 283 34% 80% 5% 1% 100% 71% 0 129 0 0 20 0 20 2.4
Maharashtra Latur 597 82% 1016 55% 86% 11% 14% 100% 83% 3 174 88 0 84 46 130 5.2
Maharashtra Malad 605 88% 1043 52% 86% 6% 1% 100% 100% 1 205 21 0 30 0 30 3.5
Maharashtra Malegoan Corporation
257 85% 240 24% 82% 7% 7% 100% 75% 2 162 8 0 14 14 28 5.8
Maharashtra Mira Bhayander 475 100% 606 60% 99% 8% 8% 100% 88% 47 446 127 0 65 62 127 15.2
Maharashtra Mulund 191 96% 190 39% 76% 10% 1% 100% 100% 10 112 24 4 128 6 138 38.9
Maharashtra Nagpur MC 1057 84% 607 22% 95% 12% 15% 100% 97% 4 519 96 0 40 373 413 16.7
Maharashtra Nagpur Rural 1137 89% 1298 56% 92% 5% 7% 100% 94% 7 236 24 1 24 199 224 9.7

State and District W
ise Annualized Performance 2013
130
State District Population (in lakh)
covered by RNTCP1
No. of suspects examined
Suspects examined per lakh
population
Rate of change in suspects examined per lakh
population
No of Smear positive patients
diagnosed2
Suspects examined per smear
positive case diagnosed
Rate of change in suspects examined
per s+ case diagnosed
Annual Smear
positive case detection rate (from
PMR)
Annual smear
positive case notification rate [from CFR: sm + cases (NSP
+ Rel + TAD) / Pop]
Total patients
registered for
treatment3
Annual total case
notification rate
Annual new smear
positive case notification
rate
Maharashtra Nanded 28.8 16243 141 4% 1437 11 58% 50 44 2553 89 35
Maharashtra Nanded Waghela MC 5.7 4094 181 7% 404 10 29% 71 45 561 99 35
Maharashtra Nandurbar 16.9 9326 138 8% 1093 9 -3% 65 58 1836 109 46
Maharashtra Nashik 42.6 28519 167 30% 2082 14 58% 49 49 3346 79 45
Maharashtra Nashik Corp 15.3 11718 192 11% 1017 12 69% 67 53 1389 91 47
Maharashtra Navi Mumbai 11.5 11895 259 6% 1416 8 -12% 123 84 2125 185 58
Maharashtra Osmanabad 17.0 11711 172 23% 687 17 67% 40 38 1218 71 33
Maharashtra Parbhani 18.8 7471 99 -1% 844 9 1% 45 42 1479 78 30
Maharashtra Parel 3.7 18642 1252 2844 7 -10% 764 549 4839 1300 224
Maharashtra Pimpri Chinchwad 17.7 12079 170 4% 1097 11 -10% 62 48 1982 112 38
Maharashtra Prabhadevi 4.9 2024 103 192 11 0% 39 72 808 164 51
Maharashtra Pune 32.0 21621 169 23% 1864 12 49% 58 62 3682 115 55
Maharashtra Pune Rural 47.0 39584 210 15% 3823 10 -32% 81 59 4263 91 51
Maharashtra Raigarh 27.0 20417 189 17% 2144 10 -1% 79 74 3892 144 59
Maharashtra Ratnagiri 16.6 16359 247 -2% 1231 13 74 73 2411 146 59
Maharashtra Sangli 23.8 26085 274 9% 1459 18 77% 61 51 2529 106 45
Maharashtra Sangli MC 5.2 2657 129 45% 254 10 49 45 530 103 34
Maharashtra Satara 30.8 26233 213 2% 1954 13 33% 63 59 3166 103 50
Maharashtra Sindhudurg 8.7 11286 324 8% 505 22 140% 58 54 1100 126 43
Maharashtra Sion 5.7 10132 447 1048 10 16% 185 95 2066 365 63
Maharashtra Solapur 34.5 18718 136 -4% 1209 15 27% 35 32 2316 67 27
Maharashtra Solapur MC 9.8 5521 141 -6% 853 6 -59% 87 55 1063 109 39
Maharashtra Thane 49.6 29274 147 24% 2871 10 -7% 58 62 6650 134 49
Maharashtra Thane MC 18.7 13013 174 20% 1818 7 -52% 97 67 3283 176 49

TB Annual Report131
State District Annual new smear
negative case
notification rate
Annual new extra pulmonary
case notification
rate
Annual previously
treated case notification
rate
Annual previously
treated smear
positive case
notification rate
No (%) of pediatric cases out of all New
cases
3 month conversion
rate of new smear
positive patients4
3 month conversion
rate of retreatment
patients4
Treatment Success rate of
new smear positive patients5
Treatment success
rate among smear
positive previously
treated cases5
No (%) of all Smear Positive cases started RNTCP DOTS within 7 days of diagnosis
No (%) of all Smear Positive
cases registered within one month of starting RNTCP DOTS treatment
Maharashtra Nanded 21 17 16 16 95 5% 83% 65% 88% 77% 1168 47% 1230 95%
Maharashtra Nanded Waghela MC 17 31 17 17 25 5% 90% 81% 85% 73% 192 277% 197 77%
Maharashtra Nandurbar 27 14 21 21 114 8% 86% 71% 84% 64% 889 198% 1020 100%
Maharashtra Nashik 16 8 10 10 206 7% 95% 81% 92% 67% 1956 40% 2100 99%
Maharashtra Nashik Corp 21 9 14 14 104 9% 93% 74% 86% 67% 764 37% 812 100%
Maharashtra Navi Mumbai 21 47 54 54 183 12% 87% 56% 80% 49% 889 196% 996 100%
Maharashtra Osmanabad 17 10 11 11 50 5% 92% 76% 84% 66% 601 381% 670 100%
Maharashtra Parbhani 17 13 19 19 57 5% 90% 63% 88% 60% 711 226% 801 99%
Maharashtra Parel 230 166 680 680 127 6% 82% 68% 76% 63% 2026 56% 1949 94%
Maharashtra Pimpri Chinchwad 15 35 22 22 98 6% 88% 62% 84% 51% 854 124% 876 98%
Maharashtra Prabhadevi 24 41 48 48 43 8% 90% 52% 84% 48% 304 57% 355 100%
Maharashtra Pune 13 27 20 20 141 5% 95% 70% 92% 57% 1949 88% 1986 98%
Maharashtra Pune Rural 14 10 16 16 145 4% 93% 71% 89% 62% 2550 15% 2759 98%
Maharashtra Raigarh 29 23 33 33 140 5% 87% 65% 84% 62% 1820 25% 2048 100%
Maharashtra Ratnagiri 41 15 31 31 58 3% 91% 57% 88% 51% 1152 78% 1206 98%
Maharashtra Sangli 24 16 22 22 84 4% 91% 70% 85% 55% 1109 41% 1237 100%
Maharashtra Sangli MC 17 25 21 21 17 4% 90% 70% 86% 71% 204 1097% 236 100%
Maharashtra Satara 15 19 19 19 97 4% 91% 65% 89% 54% 1775 57% 1862 100%
Maharashtra Sindhudurg 38 22 23 23 42 5% 89% 56% 81% 43% 428 95% 477 99%
Maharashtra Sion 56 144 102 102 168 11% 83% 50% 84% 38% 511 90% 549 99%
Maharashtra Solapur 17 10 13 13 78 4% 88% 65% 85% 55% 960 56% 1128 98%
Maharashtra Solapur MC 22 23 26 26 57 7% 88% 55% 76% 44% 507 80% 545 99%
Maharashtra Thane 31 23 31 31 403 8% 88% 64% 80% 55% 2588 46% 3078 98%
Maharashtra Thane MC 35 49 43 43 290 12% 83% 44% 80% 44% 1062 6% 1246 97%

State and District W
ise Annualized Performance 2013
132
State District No (%) of all cured Smear
Positive cases
having end of treatment follow- up
sputum done within 7 days of last dose
No (%) of cases (all
forms of TB) registered receiving
DOT through a community
volunteer
Proportion of all
registered TB cases
with known HIV
status
Proportion of TB
patients known
to be HIV infected among tested
Proportion of TB
patients known
to be HIV infected among
registered
Proportion of HIV
infected TB
patients put on CPT (RT report)
Proportion of HIV
infected TB
patients put on
ART (RT report)
Number of health facilities
registered (Laboratories - Private) in
2013
Number of health facilities
registered (Single clinic -
Private) in 2013
Number of health facilities
registered (Multi-clicnic
- Private) in 2013
Number of patients
notified by (Laboratories - Private) in
2013
Number of
patients notified
by (Single clinic -
Private) in 2013
Number of
patients notified
by (Multi-clinic - Private) in 2013
Total cases nofied
by private sector
in 2013
Notification rate per 1,00,000
population (private sector)
Maharashtra Nanded 773 80% 1754 69% 82% 7% 6% 92% 95% 2 183 32 1 96 70 167 5.8
Maharashtra Nanded Waghela MC
134 61% 340 61% 76% 14% 11% 100% 100% 0 73 11 0 163 6 169 29.9
Maharashtra Nandurbar 449 69% 1440 78% 75% 6% 6% 97% 73% 4 37 11 6 532 32 570 33.7
Maharashtra Nashik 1273 79% 1651 49% 92% 4% 4% 99% 98% 66 320 22 1 46 14 61 1.4
Maharashtra Nashik Corp 619 97% 347 25% 88% 6% 7% 100% 79% 2 175 104 0 17 10 27 1.8
Maharashtra Navi Mumbai 660 100% 1020 48% 98% 9% 10% 100% 92% 43 536 231 53 24 66 143 12.4
Maharashtra Osmanabad 413 79% 645 52% 93% 19% 26% 93% 91% 23 262 88 0 14 72 86 5.0
Maharashtra Parbhani 488 82% 685 46% 67% 13% 13% 99% 56% 1 103 2 0 148 3 151 8.0
Maharashtra Parel 802 79% 106 8% 69% 7% 1% 100% 58% 0 120 2 0 16 1 17 4.6
Maharashtra Pimpri Chinchwad 640 95% 162 10% 94% 10% 13% 99% 96% 18 453 219 6 110 72 188 10.6
Maharashtra Prabhadevi 252 86% 111 14% 69% 13% 2% 100% 81% 13 100 0 0 14 0 14 2.8
Maharashtra Pune 1670 97% 437 22% 95% 13% 16% 100% 88% 96 971 185 81 17 462 560 17.5
Maharashtra Pune Rural 1639 79% 1206 30% 96% 12% 13% 92% 80% 24 222 146 9 38 51 98 2.1
Maharashtra Raigarh 1293 83% 2827 73% 87% 7% 6% 96% 86% 9 387 134 0 31 29 60 2.2
Maharashtra Ratnagiri 940 88% 1781 74% 92% 5% 6% 100% 98% 7 413 68 0 0 16 16 1.0
Maharashtra Sangli 779 80% 806 32% 84% 16% 18% 100% 96% 14 96 45 41 247 126 414 17.4
Maharashtra Sangli MC 132 82% 55 90% 96% 31% 36% 100% 85% 4 277 30 0 0 34 34 6.6
Maharashtra Satara 1039 84% 2205 70% 93% 18% 15% 97% 72% 3 86 213 0 77 26 103 3.3
Maharashtra Sindhudurg 312 85% 805 73% 94% 4% 5% 88% 84% 5 37 64 0 7 54 61 7.0
Maharashtra Sion 239 54% 340 22% 81% 9% 2% 100% 100% 11 153 17 4 10 71 85 15.0
Maharashtra Solapur 706 79% 618 27% 81% 16% 16% 93% 87% 7 126 1 4 389 8 401 11.6
Maharashtra Solapur MC 309 94% 485 46% 95% 11% 13% 100% 94% 15 44 34 2 107 1 110 11.3
Maharashtra Thane 1845 86% 3925 54% 79% 5% 4% 94% 73% 52 135 168 2 41 90 133 2.7
Maharashtra Thane MC 735 88% 1787 55% 92% 7% 7% 100% 100% 71 808 220 0 36 140 176 9.4

TB Annual Report133
State District Population (in lakh)
covered by RNTCP1
No. of suspects examined
Suspects examined per lakh
population
Rate of change in suspects examined per lakh
population
No of Smear positive patients
diagnosed2
Suspects examined per smear
positive case diagnosed
Rate of change in suspects examined
per s+ case diagnosed
Annual Smear
positive case detection rate (from
PMR)
Annual smear
positive case notification rate [from CFR: sm + cases (NSP
+ Rel + TAD) / Pop]
Total patients
registered for
treatment3
Annual total case
notification rate
Annual new smear
positive case notification
rate
Maharashtra Ulhasnagar MC 5.2 3474 167 10% 637 5 -71% 122 95 976 188 67
Maharashtra Vikhroli 7.4 4504 152 548 8 74 81 1487 200 58
Maharashtra Wardha 13.3 19396 365 27% 999 19 13% 75 54 1348 101 41
Maharashtra Washim 12.3 6235 127 6% 517 12 73% 42 43 994 81 29
Maharashtra Yavatmal 28.5 21827 192 4% 1750 12 44% 61 59 3115 109 46
Manipur Bishnupur 2.5 589 59 -15% 85 7 7% 34 51 218 88 36
Manipur Chandel 1.5 551 93 -4% 31 18 213% 21 29 90 61 24
Manipur Churachandpur 2.8 1315 117 -42% 48 27 17 31 213 76 27
Manipur Imphal East 4.7 1477 79 -36% 209 7 -54% 45 42 544 116 34
Manipur Imphal West 5.3 2021 95 -40% 242 8 -19% 46 38 460 87 31
Manipur Senapati 3.7 525 36 -29% 89 6 -48% 24 31 244 67 22
Manipur Tamenglong 1.4 377 65 -20% 48 8 -14% 33 44 97 67 38
Manipur Thoubal 4.3 962 55 -24% 98 10 1% 23 26 345 79 22
Manipur Ukhrul 1.9 308 41 -38% 76 4 -83% 40 33 118 62 31
Meghalaya East Garo Hills 3.3 1372 103 10% 148 9 4% 44 40 213 64 34
Meghalaya East Khasi Hills 8.7 12501 361 -3% 1223 10 8% 141 92 2238 258 66
Meghalaya Jaintia Hills 4.1 2426 147 22% 242 10 53% 59 65 732 177 47
Meghalaya Ri Bhoi 2.7 1144 105 -30% 0 0 71 394 145 52
Meghalaya South Garo Hills 1.5 704 117 17% 73 10 -6% 49 65 128 85 61
Meghalaya West Garo Hills 6.8 4376 162 -2% 510 9 21% 75 64 685 101 58
Meghalaya West Khasi Hills 4.1 2115 130 -8% 170 12 45% 42 52 612 151 40
Mizoram Aizawl 4.2 3728 223 3% 359 10 7% 86 68 1011 242 52
Mizoram Champhai 1.3 840 162 6% 43 20 137% 33 33 132 102 26
Mizoram Kolasib 0.9 739 215 -9% 53 14 35% 62 57 168 196 42
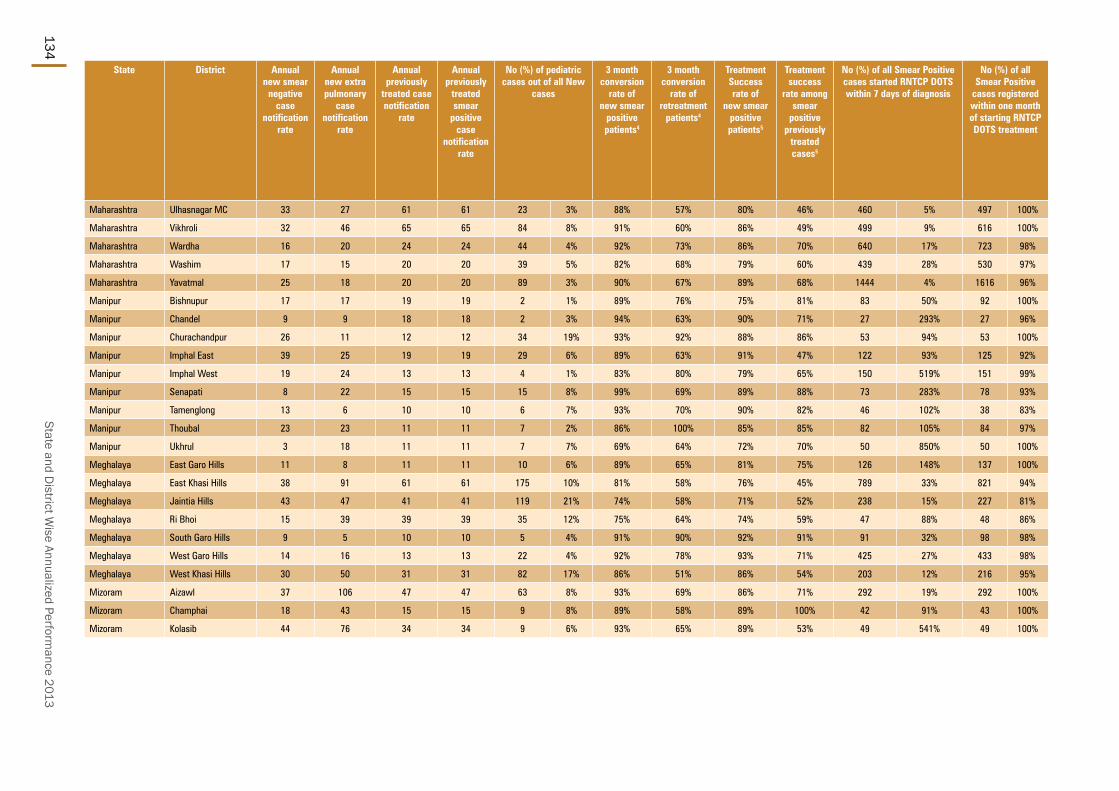
State and District W
ise Annualized Performance 2013
134
State District Annual new smear
negative case
notification rate
Annual new extra pulmonary
case notification
rate
Annual previously
treated case notification
rate
Annual previously
treated smear
positive case
notification rate
No (%) of pediatric cases out of all New
cases
3 month conversion
rate of new smear
positive patients4
3 month conversion
rate of retreatment
patients4
Treatment Success rate of
new smear positive patients5
Treatment success
rate among smear
positive previously
treated cases5
No (%) of all Smear Positive cases started RNTCP DOTS within 7 days of diagnosis
No (%) of all Smear Positive
cases registered within one month of starting RNTCP DOTS treatment
Maharashtra Ulhasnagar MC 33 27 61 61 23 3% 88% 57% 80% 46% 460 5% 497 100%
Maharashtra Vikhroli 32 46 65 65 84 8% 91% 60% 86% 49% 499 9% 616 100%
Maharashtra Wardha 16 20 24 24 44 4% 92% 73% 86% 70% 640 17% 723 98%
Maharashtra Washim 17 15 20 20 39 5% 82% 68% 79% 60% 439 28% 530 97%
Maharashtra Yavatmal 25 18 20 20 89 3% 90% 67% 89% 68% 1444 4% 1616 96%
Manipur Bishnupur 17 17 19 19 2 1% 89% 76% 75% 81% 83 50% 92 100%
Manipur Chandel 9 9 18 18 2 3% 94% 63% 90% 71% 27 293% 27 96%
Manipur Churachandpur 26 11 12 12 34 19% 93% 92% 88% 86% 53 94% 53 100%
Manipur Imphal East 39 25 19 19 29 6% 89% 63% 91% 47% 122 93% 125 92%
Manipur Imphal West 19 24 13 13 4 1% 83% 80% 79% 65% 150 519% 151 99%
Manipur Senapati 8 22 15 15 15 8% 99% 69% 89% 88% 73 283% 78 93%
Manipur Tamenglong 13 6 10 10 6 7% 93% 70% 90% 82% 46 102% 38 83%
Manipur Thoubal 23 23 11 11 7 2% 86% 100% 85% 85% 82 105% 84 97%
Manipur Ukhrul 3 18 11 11 7 7% 69% 64% 72% 70% 50 850% 50 100%
Meghalaya East Garo Hills 11 8 11 11 10 6% 89% 65% 81% 75% 126 148% 137 100%
Meghalaya East Khasi Hills 38 91 61 61 175 10% 81% 58% 76% 45% 789 33% 821 94%
Meghalaya Jaintia Hills 43 47 41 41 119 21% 74% 58% 71% 52% 238 15% 227 81%
Meghalaya Ri Bhoi 15 39 39 39 35 12% 75% 64% 74% 59% 47 88% 48 86%
Meghalaya South Garo Hills 9 5 10 10 5 4% 91% 90% 92% 91% 91 32% 98 98%
Meghalaya West Garo Hills 14 16 13 13 22 4% 92% 78% 93% 71% 425 27% 433 98%
Meghalaya West Khasi Hills 30 50 31 31 82 17% 86% 51% 86% 54% 203 12% 216 95%
Mizoram Aizawl 37 106 47 47 63 8% 93% 69% 86% 71% 292 19% 292 100%
Mizoram Champhai 18 43 15 15 9 8% 89% 58% 89% 100% 42 91% 43 100%
Mizoram Kolasib 44 76 34 34 9 6% 93% 65% 89% 53% 49 541% 49 100%

TB Annual Report135
State District No (%) of all cured Smear
Positive cases
having end of treatment follow- up
sputum done within 7 days of last dose
No (%) of cases (all
forms of TB) registered receiving
DOT through a community
volunteer
Proportion of all
registered TB cases
with known HIV
status
Proportion of TB
patients known
to be HIV infected among tested
Proportion of TB
patients known
to be HIV infected among
registered
Proportion of HIV
infected TB
patients put on CPT (RT report)
Proportion of HIV
infected TB
patients put on
ART (RT report)
Number of health facilities
registered (Laboratories - Private) in
2013
Number of health facilities
registered (Single clinic -
Private) in 2013
Number of health facilities
registered (Multi-clicnic
- Private) in 2013
Number of patients
notified by (Laboratories - Private) in
2013
Number of
patients notified
by (Single clinic -
Private) in 2013
Number of
patients notified
by (Multi-clinic - Private) in 2013
Total cases nofied
by private sector in 2013
Notification rate per 1,00,000
population (private sector)
Maharashtra Ulhasnagar MC 278 100% 38 4% 98% 8% 6% 97% 89% 9 84 106 0 11 106 117 22.5
Maharashtra Vikhroli 265 81% 869 58% 73% 8% 1% 80% 55% 23 171 16 0 6 46 52 7.0
Maharashtra Wardha 521 83% 1067 79% 94% 5% 7% 100% 95% 9 51 41 0 20 69 89 6.7
Maharashtra Washim 349 93% 707 69% 85% 7% 8% 96% 94% 9 40 57 5 57 172 234 19.1
Maharashtra Yavatmal 1146 86% 2069 69% 85% 10% 10% 99% 88% 9 91 18 5 56 35 96 3.4
Manipur Bishnupur 30 55% 132 86% 92% 8% 5% 18% 82% 0 0 0 0 0 0 0 0.0
Manipur Chandel 20 61% 30 57% 41% 16% 12% 55% 45% 0 0 0 0 0 0 0 0.0
Manipur Churachandpur 71 93% 86 57% 60% 16% 23% 96% 94% 0 0 0 0 0 0 0 0.0
Manipur Imphal East 107 86% 260 67% 72% 7% 6% 52% 52% 0 0 0 0 0 0 0 0.0
Manipur Imphal West 111 83% 176 51% 49% 11% 7% 0% 0% 0 0 0 0 0 0 0 0.0
Manipur Senapati 72 100% 90% 3% 4% 11% 11% 0 0 0 0 0 0 0 0.0
Manipur Tamenglong 24 86% 51 75% 84% 4% 1% 0% 0% 0 0 0 0 0 0 0 0.0
Manipur Thoubal 52 83% 234 99% 92% 5% 3% 40% 60% 0 0 0 0 0 0 0 0.0
Manipur Ukhrul 30 100% 46 57% 81% 13% 16% 26% 26% 0 0 1 0 0 0 0 0.0
Meghalaya East Garo Hills 88 81% 92 43% 21% 0% 0% 0 0 1 0 0 0 0 0.0
Meghalaya East Khasi Hills 435 81% 1158 55% 21% 2% 0% 100% 100% 1 18 9 0 340 600 940 108.5
Meghalaya Jaintia Hills 71 54% 216 30% 16% 2% 0% 0 0 1 0 0 0 0 0.0
Meghalaya Ri Bhoi 19 100% 70 78% 22% 0% 0% 0 0 0 0 0 0 0 0.0
Meghalaya South Garo Hills 52 68% 51 38% 31% 0% 0% 0 0 0 0 25 42 67 44.7
Meghalaya West Garo Hills 395 96% 278 40% 92% 0% 0% 100% 0% 0 1 0 0 0 0 0 0.0
Meghalaya West Khasi Hills 165 97% 389 64% 16% 0% 0% 0 0 0 0 0 0 0 0.0
Mizoram Aizawl 198 94% 60 6% 77% 19% 18% 100% 42% 2 1 8 0 0 9 9 2.2
Mizoram Champhai 43 98% 72 55% 93% 15% 14% 11% 89% 0 1 1 0 0 0 0 0.0
Mizoram Kolasib 24 53% 50 30% 76% 6% 5% 100% 56% 3 0 1 0 0 0 0 0.0

State and District W
ise Annualized Performance 2013
136
State District Population (in lakh)
covered by RNTCP1
No. of suspects examined
Suspects examined per lakh
population
Rate of change in suspects examined per lakh
population
No of Smear positive patients
diagnosed2
Suspects examined per smear
positive case diagnosed
Rate of change in suspects examined
per s+ case diagnosed
Annual Smear
positive case detection rate (from
PMR)
Annual smear
positive case notification rate [from CFR: sm + cases (NSP
+ Rel + TAD) / Pop]
Total patients
registered for
treatment3
Annual total case
notification rate
Annual new smear
positive case notification
rate
Mizoram Lawngtlai 1.2 483 99 10% 22 22 68% 18 27 111 91 21
Mizoram Lunglei 1.6 1476 231 2% 115 13 63% 72 71 262 164 55
Mizoram Mamit 0.9 342 96 -13% 30 11 0% 34 32 66 74 21
Mizoram Saiha 0.6 531 228 -10% 51 10 -3% 87 93 158 271 77
Mizoram Serchhip 0.7 450 168 17% 38 12 -30% 57 58 97 145 51
Nagaland Dimapur 3.8 2702 176 -22% 463 6 -55% 121 109 917 239 80
Nagaland Kiphire 0.7 567 190 5% 46 12 -17% 62 67 141 189 47
Nagaland Kohima 2.7 1381 127 9% 297 5 -33% 109 83 489 179 65
Nagaland Longleng 0.5 494 242 140% 48 10 -25% 94 98 85 166 72
Nagaland Mokokchung 2.0 1190 152 6% 132 9 -33% 68 66 256 131 51
Nagaland Mon 2.5 2831 280 -12% 205 14 25% 81 102 427 169 80
Nagaland Peren 1.0 452 118 -2% 34 13 151% 35 56 83 87 35
Nagaland Phek 1.6 167 25 -69% 13 13 38% 8 46 116 70 36
Nagaland Tuensang 2.0 2733 344 17% 172 16 174% 87 83 567 285 61
Nagaland Wokha 1.7 979 146 6% 82 12 34% 49 49 131 78 41
Nagaland Zunheboto 1.4 973 171 7% 74 13 97% 52 58 127 89 52
Orissa Anugul 13.0 7296 140 -8% 731 10 -47% 56 46 1000 77 40
Orissa Balangir 16.9 7371 109 -3% 947 8 -46% 56 47 1940 115 44
Orissa Baleshwar 23.7 10218 108 -18% 1356 8 0% 57 43 1711 72 36
Orissa Bargarh 15.1 5774 95 -8% 667 9 -36% 44 46 1635 108 40
Orissa Bhadrak 15.4 4713 76 -26% 432 11 12% 28 28 761 49 23
Orissa Bhubaneshwar MC 8.6 4762 139 5% 600 8 -17% 70 40 855 100 30
Orissa Boudh 4.5 1289 72 -15% 128 10 -1% 28 39 296 66 33
Orissa Cuttack 26.8 9592 90 -13% 1282 7 -3% 48 24 1488 56 20
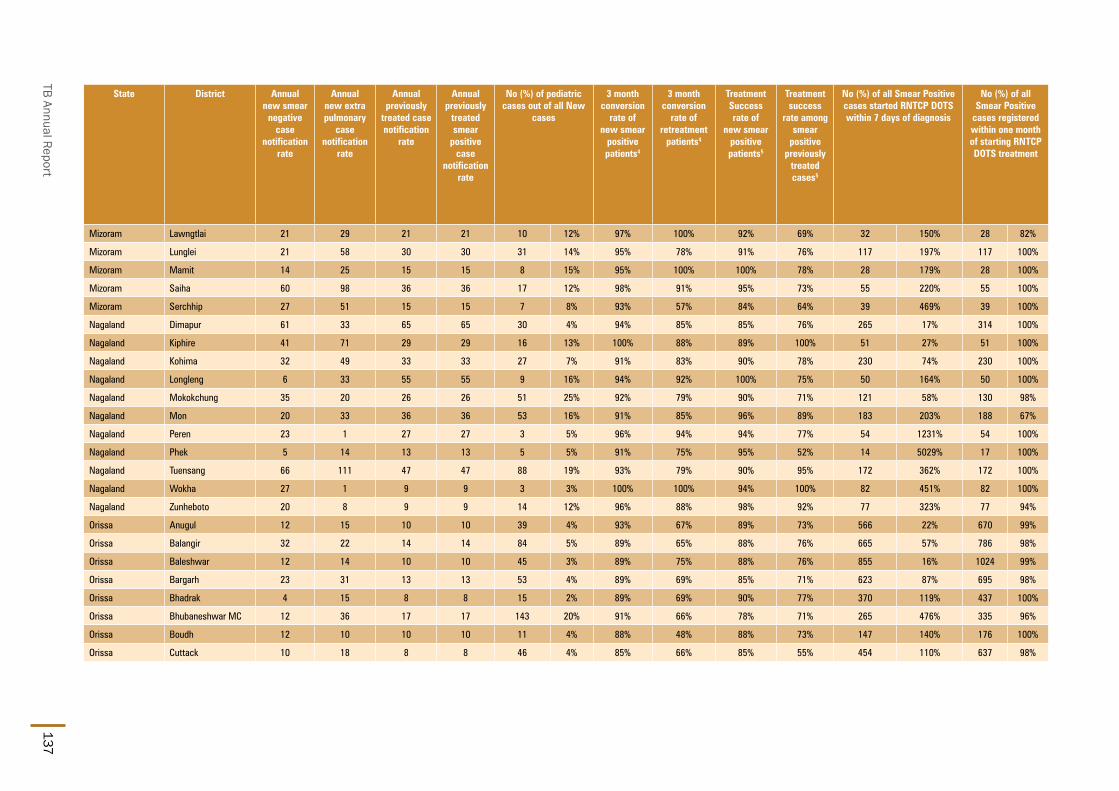
TB Annual Report137
State District Annual new smear
negative case
notification rate
Annual new extra pulmonary
case notification
rate
Annual previously
treated case notification
rate
Annual previously
treated smear
positive case
notification rate
No (%) of pediatric cases out of all New
cases
3 month conversion
rate of new smear
positive patients4
3 month conversion
rate of retreatment
patients4
Treatment Success rate of
new smear positive patients5
Treatment success
rate among smear
positive previously
treated cases5
No (%) of all Smear Positive cases started RNTCP DOTS within 7 days of diagnosis
No (%) of all Smear Positive
cases registered within one month of starting RNTCP DOTS treatment
Mizoram Lawngtlai 21 29 21 21 10 12% 97% 100% 92% 69% 32 150% 28 82%
Mizoram Lunglei 21 58 30 30 31 14% 95% 78% 91% 76% 117 197% 117 100%
Mizoram Mamit 14 25 15 15 8 15% 95% 100% 100% 78% 28 179% 28 100%
Mizoram Saiha 60 98 36 36 17 12% 98% 91% 95% 73% 55 220% 55 100%
Mizoram Serchhip 27 51 15 15 7 8% 93% 57% 84% 64% 39 469% 39 100%
Nagaland Dimapur 61 33 65 65 30 4% 94% 85% 85% 76% 265 17% 314 100%
Nagaland Kiphire 41 71 29 29 16 13% 100% 88% 89% 100% 51 27% 51 100%
Nagaland Kohima 32 49 33 33 27 7% 91% 83% 90% 78% 230 74% 230 100%
Nagaland Longleng 6 33 55 55 9 16% 94% 92% 100% 75% 50 164% 50 100%
Nagaland Mokokchung 35 20 26 26 51 25% 92% 79% 90% 71% 121 58% 130 98%
Nagaland Mon 20 33 36 36 53 16% 91% 85% 96% 89% 183 203% 188 67%
Nagaland Peren 23 1 27 27 3 5% 96% 94% 94% 77% 54 1231% 54 100%
Nagaland Phek 5 14 13 13 5 5% 91% 75% 95% 52% 14 5029% 17 100%
Nagaland Tuensang 66 111 47 47 88 19% 93% 79% 90% 95% 172 362% 172 100%
Nagaland Wokha 27 1 9 9 3 3% 100% 100% 94% 100% 82 451% 82 100%
Nagaland Zunheboto 20 8 9 9 14 12% 96% 88% 98% 92% 77 323% 77 94%
Orissa Anugul 12 15 10 10 39 4% 93% 67% 89% 73% 566 22% 670 99%
Orissa Balangir 32 22 14 14 84 5% 89% 65% 88% 76% 665 57% 786 98%
Orissa Baleshwar 12 14 10 10 45 3% 89% 75% 88% 76% 855 16% 1024 99%
Orissa Bargarh 23 31 13 13 53 4% 89% 69% 85% 71% 623 87% 695 98%
Orissa Bhadrak 4 15 8 8 15 2% 89% 69% 90% 77% 370 119% 437 100%
Orissa Bhubaneshwar MC 12 36 17 17 143 20% 91% 66% 78% 71% 265 476% 335 96%
Orissa Boudh 12 10 10 10 11 4% 88% 48% 88% 73% 147 140% 176 100%
Orissa Cuttack 10 18 8 8 46 4% 85% 66% 85% 55% 454 110% 637 98%
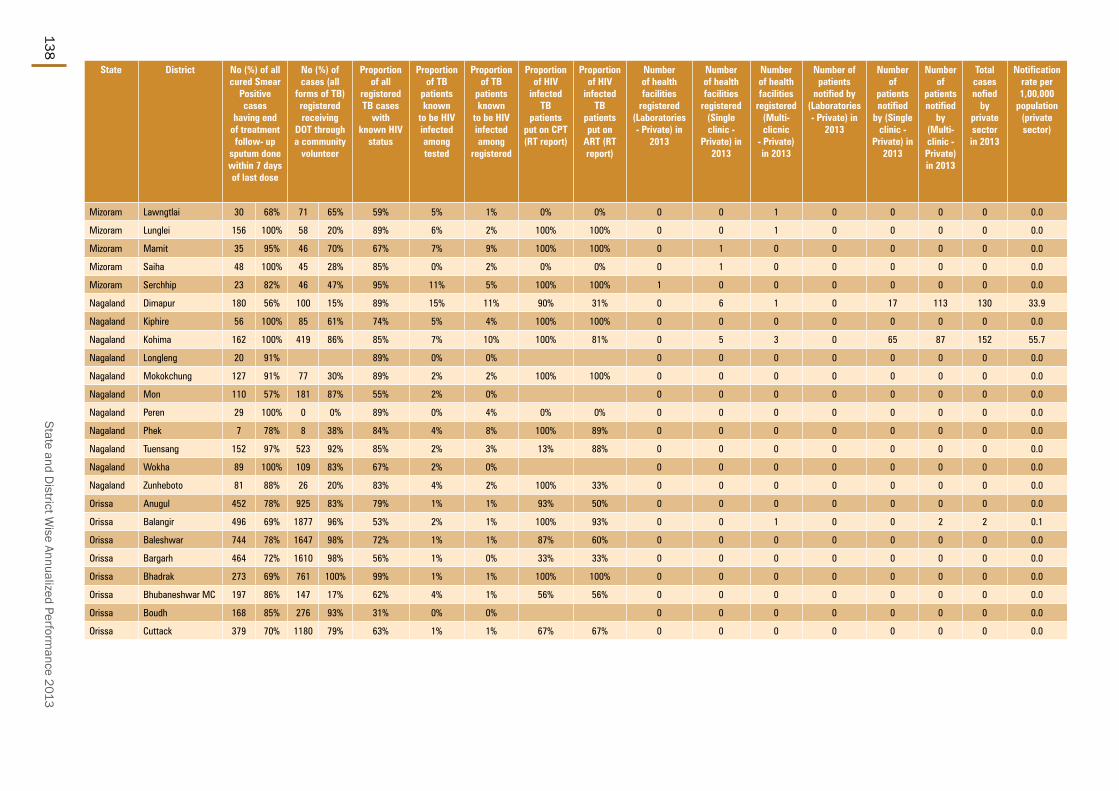
State and District W
ise Annualized Performance 2013
138
State District No (%) of all cured Smear
Positive cases
having end of treatment follow- up
sputum done within 7 days of last dose
No (%) of cases (all
forms of TB) registered receiving
DOT through a community
volunteer
Proportion of all
registered TB cases
with known HIV
status
Proportion of TB
patients known
to be HIV infected among tested
Proportion of TB
patients known
to be HIV infected among
registered
Proportion of HIV
infected TB
patients put on CPT (RT report)
Proportion of HIV
infected TB
patients put on
ART (RT report)
Number of health facilities
registered (Laboratories - Private) in
2013
Number of health facilities
registered (Single clinic -
Private) in 2013
Number of health facilities
registered (Multi-clicnic
- Private) in 2013
Number of patients
notified by (Laboratories - Private) in
2013
Number of
patients notified
by (Single clinic -
Private) in 2013
Number of
patients notified
by (Multi-clinic - Private) in 2013
Total cases nofied
by private sector in 2013
Notification rate per 1,00,000
population (private sector)
Mizoram Lawngtlai 30 68% 71 65% 59% 5% 1% 0% 0% 0 0 1 0 0 0 0 0.0
Mizoram Lunglei 156 100% 58 20% 89% 6% 2% 100% 100% 0 0 1 0 0 0 0 0.0
Mizoram Mamit 35 95% 46 70% 67% 7% 9% 100% 100% 0 1 0 0 0 0 0 0.0
Mizoram Saiha 48 100% 45 28% 85% 0% 2% 0% 0% 0 1 0 0 0 0 0 0.0
Mizoram Serchhip 23 82% 46 47% 95% 11% 5% 100% 100% 1 0 0 0 0 0 0 0.0
Nagaland Dimapur 180 56% 100 15% 89% 15% 11% 90% 31% 0 6 1 0 17 113 130 33.9
Nagaland Kiphire 56 100% 85 61% 74% 5% 4% 100% 100% 0 0 0 0 0 0 0 0.0
Nagaland Kohima 162 100% 419 86% 85% 7% 10% 100% 81% 0 5 3 0 65 87 152 55.7
Nagaland Longleng 20 91% 89% 0% 0% 0 0 0 0 0 0 0 0.0
Nagaland Mokokchung 127 91% 77 30% 89% 2% 2% 100% 100% 0 0 0 0 0 0 0 0.0
Nagaland Mon 110 57% 181 87% 55% 2% 0% 0 0 0 0 0 0 0 0.0
Nagaland Peren 29 100% 0 0% 89% 0% 4% 0% 0% 0 0 0 0 0 0 0 0.0
Nagaland Phek 7 78% 8 38% 84% 4% 8% 100% 89% 0 0 0 0 0 0 0 0.0
Nagaland Tuensang 152 97% 523 92% 85% 2% 3% 13% 88% 0 0 0 0 0 0 0 0.0
Nagaland Wokha 89 100% 109 83% 67% 2% 0% 0 0 0 0 0 0 0 0.0
Nagaland Zunheboto 81 88% 26 20% 83% 4% 2% 100% 33% 0 0 0 0 0 0 0 0.0
Orissa Anugul 452 78% 925 83% 79% 1% 1% 93% 50% 0 0 0 0 0 0 0 0.0
Orissa Balangir 496 69% 1877 96% 53% 2% 1% 100% 93% 0 0 1 0 0 2 2 0.1
Orissa Baleshwar 744 78% 1647 98% 72% 1% 1% 87% 60% 0 0 0 0 0 0 0 0.0
Orissa Bargarh 464 72% 1610 98% 56% 1% 0% 33% 33% 0 0 0 0 0 0 0 0.0
Orissa Bhadrak 273 69% 761 100% 99% 1% 1% 100% 100% 0 0 0 0 0 0 0 0.0
Orissa Bhubaneshwar MC 197 86% 147 17% 62% 4% 1% 56% 56% 0 0 0 0 0 0 0 0.0
Orissa Boudh 168 85% 276 93% 31% 0% 0% 0 0 0 0 0 0 0 0.0
Orissa Cuttack 379 70% 1180 79% 63% 1% 1% 67% 67% 0 0 0 0 0 0 0 0.0

TB Annual Report139
State District Population (in lakh)
covered by RNTCP1
No. of suspects examined
Suspects examined per lakh
population
Rate of change in suspects examined per lakh
population
No of Smear positive patients
diagnosed2
Suspects examined per smear
positive case diagnosed
Rate of change in suspects examined
per s+ case diagnosed
Annual Smear
positive case detection rate (from
PMR)
Annual smear
positive case notification rate [from CFR: sm + cases (NSP
+ Rel + TAD) / Pop]
Total patients
registered for
treatment3
Annual total case
notification rate
Annual new smear
positive case notification
rate
Orissa Debagarh 3.2 1134 89 -13% 170 7 -21% 53 53 263 82 44
Orissa Dhenkanal 12.2 6550 134 3% 730 9 17% 60 59 1151 94 50
Orissa Gajapati 5.9 3064 130 -9% 628 5 -61% 107 97 990 168 83
Orissa Ganjam 36.0 16478 114 -16% 2534 7 -17% 70 57 4513 125 47
Orissa Jagatsinghpur 11.6 4472 96 -15% 262 17 106% 23 23 518 45 20
Orissa Jajapur 18.7 5543 74 -4% 755 7 -9% 40 42 1567 84 36
Orissa Jharsuguda 5.9 4020 170 8% 474 8 20% 80 74 807 136 63
Orissa Kalahandi 16.1 6578 102 -7% 1147 6 -28% 71 65 1760 109 56
Orissa Kandhamal 7.5 4177 139 -11% 647 6 21% 86 77 937 125 67
Orissa Kendrapara 14.7 7503 127 9% 548 14 90% 37 36 795 54 30
Orissa Kendujhar 18.4 10087 137 -8% 1755 6 -74% 95 81 2938 159 69
Orissa Khordha 14.4 4565 79 -20% 502 9 15% 35 38 1016 71 30
Orissa Koraput 14.1 7077 126 -19% 1370 5 -31% 97 81 1775 126 70
Orissa Malkangiri 6.3 2501 100 -34% 522 5 -22% 83 119 1064 170 104
Orissa Mayurbhanj 25.7 16388 159 -16% 2883 6 -14% 112 106 4840 188 94
Orissa Nabarangapur 12.5 3609 72 -20% 590 6 -58% 47 46 912 73 41
Orissa Nayagarh 9.8 5335 135 -30% 785 7 21% 80 60 1038 105 45
Orissa Nuapada 6.2 3131 126 -19% 478 7 -37% 77 70 803 129 61
Orissa Puri 17.4 6523 94 -18% 592 11 92% 34 33 1130 65 27
Orissa Rayagada 9.8 6740 171 1% 1146 6 15% 116 108 1660 169 95
Orissa Sambalpur 10.7 7352 172 -17% 1043 7 12% 98 65 1550 145 55
Orissa Sonapur 6.7 2735 102 -9% 257 11 60% 39 39 534 80 34
Orissa Sundargarh 21.3 14387 169 -10% 1857 8 -15% 87 75 3022 142 63
Pondicherry Pondicherry 13.0 24192 465 4% 2727 9 20% 210 65 1458 112 53

State and District W
ise Annualized Performance 2013
140
State District Annual new smear
negative case
notification rate
Annual new extra pulmonary
case notification
rate
Annual previously
treated case notification
rate
Annual previously
treated smear
positive case
notification rate
No (%) of pediatric cases out of all New
cases
3 month conversion
rate of new smear
positive patients4
3 month conversion
rate of retreatment
patients4
Treatment Success rate of
new smear positive patients5
Treatment success
rate among smear
positive previously
treated cases5
No (%) of all Smear Positive cases started RNTCP DOTS within 7 days of diagnosis
No (%) of all Smear Positive
cases registered within one month of starting RNTCP DOTS treatment
Orissa Debagarh 17 11 11 11 3 1% 90% 80% 88% 78% 161 232% 169 99%
Orissa Dhenkanal 10 21 14 14 54 5% 94% 64% 90% 71% 619 110% 731 100%
Orissa Gajapati 24 34 28 28 82 10% 78% 53% 73% 48% 522 84% 514 88%
Orissa Ganjam 27 33 17 17 270 7% 88% 60% 85% 62% 1656 24% 2027 97%
Orissa Jagatsinghpur 6 13 5 5 16 3% 87% 80% 91% 77% 247 467% 272 98%
Orissa Jajapur 18 19 11 11 52 4% 93% 83% 92% 76% 716 60% 761 96%
Orissa Jharsuguda 26 23 23 23 20 3% 92% 73% 87% 72% 397 207% 442 98%
Orissa Kalahandi 20 17 16 16 89 6% 81% 64% 81% 63% 804 61% 1018 96%
Orissa Kandhamal 17 24 16 16 66 8% 89% 62% 89% 71% 490 388% 569 98%
Orissa Kendrapara 6 9 9 9 26 4% 95% 88% 95% 87% 496 98% 543 100%
Orissa Kendujhar 44 24 22 22 124 5% 86% 62% 85% 67% 1294 37% 1500 100%
Orissa Khordha 11 18 11 11 39 5% 88% 70% 87% 68% 476 61% 503 90%
Orissa Koraput 21 19 16 16 112 7% 91% 79% 87% 70% 930 47% 1139 99%
Orissa Malkangiri 27 21 17 17 46 5% 82% 71% 86% 78% 646 116% 653 95%
Orissa Mayurbhanj 50 22 22 22 101 2% 91% 71% 90% 76% 2252 23% 2729 100%
Orissa Nabarangapur 19 5 7 7 38 5% 88% 72% 91% 83% 530 41% 560 98%
Orissa Nayagarh 15 23 23 23 35 4% 72% 53% 69% 33% 558 212% 594 97%
Orissa Nuapada 39 16 13 13 32 4% 91% 66% 90% 84% 341 180% 436 100%
Orissa Puri 9 17 13 13 39 4% 87% 62% 86% 67% 544 291% 579 100%
Orissa Rayagada 32 23 19 19 103 7% 89% 73% 87% 78% 795 38% 1076 100%
Orissa Sambalpur 33 39 18 18 43 3% 87% 71% 86% 63% 639 110% 701 100%
Orissa Sonapur 18 20 8 8 12 3% 88% 75% 87% 62% 236 303% 264 99%
Orissa Sundargarh 32 25 22 22 63 2% 92% 75% 89% 72% 1299 36% 1550 96%
Pondicherry Pondicherry 12 30 17 17 90 7% 92% 81% 83% 66% 785 145% 774 88%

TB Annual Report141
State District No (%) of all cured Smear
Positive cases
having end of treatment follow- up
sputum done within 7 days of last dose
No (%) of cases (all
forms of TB) registered receiving
DOT through a community
volunteer
Proportion of all
registered TB cases
with known HIV
status
Proportion of TB
patients known
to be HIV infected among tested
Proportion of TB
patients known
to be HIV infected among
registered
Proportion of HIV
infected TB
patients put on CPT (RT report)
Proportion of HIV
infected TB
patients put on
ART (RT report)
Number of health facilities
registered (Laboratories - Private) in
2013
Number of health facilities
registered (Single clinic -
Private) in 2013
Number of health facilities
registered (Multi-clicnic
- Private) in 2013
Number of patients
notified by (Laboratories - Private) in
2013
Number of
patients notified
by (Single clinic -
Private) in 2013
Number of
patients notified
by (Multi-clinic -
Private) in 2013
Total cases nofied
by private sector in 2013
Notification rate per 1,00,000
population (private sector)
Orissa Debagarh 147 99% 266 100% 28% 3% 0% 0 0 0 0 0 0 0 0.0
Orissa Dhenkanal 461 71% 1045 91% 67% 1% 1% 100% 100% 0 0 0 0 0 0 0 0.0
Orissa Gajapati 278 75% 872 94% 31% 4% 2% 84% 84% 0 0 0 0 0 0 0 0.0
Orissa Ganjam 1123 70% 3638 81% 71% 8% 8% 28% 55% 0 0 0 0 0 0 0 0.0
Orissa Jagatsinghpur 187 86% 515 99% 40% 2% 1% 80% 80% 0 0 0 0 0 0 0 0.0
Orissa Jajapur 533 78% 1283 87% 74% 1% 0% 60% 40% 0 0 0 0 0 0 0 0.0
Orissa Jharsuguda 345 92% 778 96% 45% 1% 0% 100% 75% 0 0 0 0 0 0 0 0.0
Orissa Kalahandi 447 65% 1565 89% 29% 4% 1% 74% 79% 0 0 0 0 0 0 0 0.0
Orissa Kandhamal 224 49% 878 94% 55% 1% 0% 100% 100% 0 0 0 0 0 0 0 0.0
Orissa Kendrapara 426 93% 765 96% 85% 1% 1% 0% 100% 0 0 0 0 0 0 0 0.0
Orissa Kendujhar 1109 87% 30 1% 43% 0% 0% 100% 100% 0 0 0 0 0 0 0 0.0
Orissa Khordha 352 82% 58 5% 87% 2% 0% 0% 50% 0 0 0 0 0 0 0 0.0
Orissa Koraput 865 79% 1617 92% 80% 7% 0% 100% 60% 0 0 0 0 0 0 0 0.0
Orissa Malkangiri 306 54% 967 91% 43% 1% 0% 0% 0% 0 0 0 0 0 0 0 0.0
Orissa Mayurbhanj 1786 74% 4550 94% 58% 1% 1% 92% 92% 0 0 0 0 0 0 0 0.0
Orissa Nabarangapur 421 78% 852 93% 36% 1% 0% 0 0 0 0 0 0 0 0.0
Orissa Nayagarh 225 64% 26 3% 71% 1% 1% 11% 89% 0 0 0 0 0 0 0 0.0
Orissa Nuapada 246 72% 149 18% 73% 0% 0% 100% 100% 0 0 0 0 0 0 0 0.0
Orissa Puri 341 79% 1126 100% 86% 2% 0% 0 0 0 0 0 0 0 0.0
Orissa Rayagada 593 70% 1520 92% 34% 3% 1% 100% 100% 0 0 0 0 0 0 0 0.0
Orissa Sambalpur 364 70% 1549 100% 57% 1% 0% 0 0 0 0 0 0 0 0.0
Orissa Sonapur 202 82% 39 7% 49% 1% 0% 0% 100% 0 0 0 0 0 0 0 0.0
Orissa Sundargarh 1072 74% 2868 96% 42% 1% 0% 0 0 0 0 0 0 0 0.0
Pondicherry Pondicherry 633 96% 98% 3% 3% 95% 95% 0 0 0 0 0 0 0 0.0

State and District W
ise Annualized Performance 2013
142
State District Population (in lakh)
covered by RNTCP1
No. of suspects examined
Suspects examined per lakh
population
Rate of change in suspects examined per lakh
population
No of Smear positive patients
diagnosed2
Suspects examined per smear
positive case diagnosed
Rate of change in suspects examined
per s+ case diagnosed
Annual Smear
positive case detection rate (from
PMR)
Annual smear
positive case notification rate [from CFR: sm + cases (NSP
+ Rel + TAD) / Pop]
Total patients
registered for
treatment3
Annual total case
notification rate
Annual new smear
positive case notification
rate
Punjab Amritsar 25.5 16183 159 -20% 2339 7 -43% 92 74 4043 159 53
Punjab Barnala 6.1 3949 162 -10% 485 8 43% 79 62 631 103 50
Punjab Bathinda 14.2 7230 127 -25% 902 8 -3% 63 65 1738 122 46
Punjab Faridkot 6.3 6514 257 20% 948 7 -32% 150 105 1237 196 72
Punjab Fatehgarh Sahib 6.1 5923 241 55% 585 10 35% 95 60 664 108 47
Punjab Firozpur 20.7 11149 134 -13% 1365 8 -4% 66 70 2437 117 50
Punjab Gurdaspur 23.5 13456 143 -13% 1836 7 10% 78 70 2712 115 48
Punjab Hoshiarpur 16.2 8814 136 -18% 952 9 -11% 59 59 1752 108 40
Punjab Jalandhar 22.3 15569 174 1% 2391 7 -22% 107 86 3552 159 61
Punjab Kapurthala 8.4 5317 159 -20% 586 9 46% 70 65 944 113 48
Punjab Ludhiana 35.7 18669 131 -20% 2562 7 -29% 72 77 5339 150 57
Punjab Mansa 7.9 5847 186 -5% 687 9 1% 87 75 950 121 55
Punjab Moga 10.2 5561 137 -3% 700 8 -8% 69 66 1069 105 47
Punjab Mohali 10.1 5447 135 -17% 602 9 -1% 60 85 1630 161 66
Punjab Muktsar 9.2 7321 198 30% 1099 7 -4% 119 84 1123 122 63
Punjab Nawanshahr 6.3 4724 188 1% 565 8 -20% 90 77 768 122 58
Punjab Patiala 19.4 13444 174 -8% 1919 7 -5% 99 62 2287 118 47
Punjab Rupnagar 7.0 6421 229 -2% 662 10 -4% 95 82 910 130 56
Punjab Sangrur 16.9 15329 226 -9% 1479 10 24% 87 69 2305 136 48
Punjab Tarn Taran 11.5 9701 212 25% 1200 8 -22% 105 66 1167 102 46
Rajasthan Ajmer 26.8 16430 153 5% 2991 5 -14% 112 81 4512 168 57
Rajasthan Alwar 38.1 17531 115 -4% 2863 6 -27% 75 79 5892 155 71
Rajasthan Banswara 19.0 13524 178 29% 2396 6 -17% 126 119 3390 178 101
Rajasthan Baran 12.7 9629 190 25% 1583 6 -41% 125 106 2289 180 79

TB Annual Report143
State District Annual new smear
negative case
notification rate
Annual new extra pulmonary
case notification
rate
Annual previously
treated case notification
rate
Annual previously
treated smear
positive case
notification rate
No (%) of pediatric cases out of all New
cases
3 month conversion
rate of new smear
positive patients4
3 month conversion
rate of retreatment
patients4
Treatment Success rate of
new smear positive patients5
Treatment success
rate among smear
positive previously
treated cases5
No (%) of all Smear Positive cases started RNTCP DOTS within 7 days of diagnosis
No (%) of all Smear Positive
cases registered within one month of starting RNTCP DOTS treatment
Punjab Amritsar 27 43 33 33 224 7% 89% 75% 86% 76% 1688 89% 1746 100%
Punjab Barnala 11 19 19 19 27 5% 83% 75% 85% 72% 409 195% 415 96%
Punjab Bathinda 30 20 26 26 60 4% 91% 81% 86% 78% 772 235% 806 97%
Punjab Faridkot 42 34 47 47 49 5% 90% 78% 90% 78% 805 63% 826 96%
Punjab Fatehgarh Sahib 13 30 19 19 39 7% 72% 58% 72% 61% 587 349% 631 98%
Punjab Firozpur 22 15 30 30 87 5% 89% 69% 84% 66% 1271 44% 1351 99%
Punjab Gurdaspur 19 20 28 28 61 3% 91% 82% 88% 73% 1557 38% 1742 99%
Punjab Hoshiarpur 27 14 26 26 49 4% 90% 80% 86% 74% 845 74% 898 100%
Punjab Jalandhar 25 38 35 35 181 7% 89% 77% 87% 77% 1959 40% 2019 96%
Punjab Kapurthala 20 23 22 22 39 5% 91% 73% 85% 67% 538 88% 573 100%
Punjab Ludhiana 26 36 30 30 290 7% 91% 78% 87% 72% 2237 46% 2316 98%
Punjab Mansa 14 25 26 26 34 5% 87% 72% 89% 77% 606 83% 680 100%
Punjab Moga 12 16 30 30 37 5% 83% 71% 84% 72% 670 179% 677 96%
Punjab Mohali 18 47 31 31 73 6% 87% 62% 83% 63% 661 154% 749 100%
Punjab Muktsar 17 16 25 25 39 4% 93% 78% 91% 80% 833 198% 887 99%
Punjab Nawanshahr 21 18 25 25 24 4% 87% 68% 83% 70% 507 447% 539 100%
Punjab Patiala 13 34 22 22 76 4% 85% 72% 79% 67% 1091 169% 1177 97%
Punjab Rupnagar 17 27 31 31 26 4% 88% 71% 87% 73% 567 191% 612 100%
Punjab Sangrur 25 32 31 31 82 5% 90% 81% 87% 78% 1269 59% 1356 95%
Punjab Tarn Taran 13 15 27 27 44 5% 88% 76% 87% 74% 1154 84% 1292 99%
Rajasthan Ajmer 37 35 38 38 245 7% 91% 80% 88% 75% 1776 110% 2100 95%
Rajasthan Alwar 44 30 9 9 199 4% 92% 85% 92% 83% 2417 37% 2870 94%
Rajasthan Banswara 43 12 21 21 110 4% 92% 79% 92% 84% 2057 27% 2216 97%
Rajasthan Baran 37 24 40 40 74 4% 92% 81% 90% 83% 1175 84% 1333 96%

State and District W
ise Annualized Performance 2013
144
State District No (%) of all cured Smear
Positive cases
having end of treatment follow- up
sputum done within 7 days of last dose
No (%) of cases (all
forms of TB) registered receiving
DOT through a community
volunteer
Proportion of all
registered TB cases
with known HIV
status
Proportion of TB
patients known
to be HIV infected among tested
Proportion of TB
patients known
to be HIV infected among
registered
Proportion of HIV
infected TB
patients put on CPT (RT report)
Proportion of HIV
infected TB
patients put on
ART (RT report)
Number of health facilities
registered (Laboratories - Private) in
2013
Number of health facilities
registered (Single clinic -
Private) in 2013
Number of health facilities
registered (Multi-clicnic
- Private) in 2013
Number of patients
notified by (Laboratories - Private) in
2013
Number of
patients notified
by (Single clinic -
Private) in 2013
Number of
patients notified
by (Multi-clinic - Private) in 2013
Total cases nofied
by private sector in 2013
Notification rate per 1,00,000
population (private sector)
Punjab Amritsar 1405 100% 2530 69% 95% 2% 2% 90% 82% 5 18 18 0 3 42 45 1.8
Punjab Barnala 330 85% 70 28% 81% 1% 2% 100% 100% 11 60 35 0 5 0 5 0.8
Punjab Bathinda 762 99% 525 34% 87% 1% 2% 93% 81% 9 43 28 1 0 11 12 0.8
Punjab Faridkot 668 97% 475 32% 96% 2% 1% 94% 94% 14 15 20 0 0 0 0 0.0
Punjab Fatehgarh Sahib 397 85% 344 31% 83% 1% 3% 89% 89% 0 0 13 0 0 0 0 0.0
Punjab Firozpur 962 92% 800 34% 86% 1% 1% 84% 81% 0 15 30 0 0 5 5 0.2
Punjab Gurdaspur 1280 85% 794 28% 89% 1% 2% 90% 80% 0 18 66 0 34 2 36 1.5
Punjab Hoshiarpur 722 94% 521 33% 92% 1% 1% 86% 90% 0 1 6 0 0 0 0 0.0
Punjab Jalandhar 1522 92% 1677 43% 74% 1% 0% 88% 65% 1 35 33 0 12 20 32 1.4
Punjab Kapurthala 437 94% 256 27% 84% 3% 2% 71% 71% 18 39 39 0 0 4 4 0.5
Punjab Ludhiana 1931 96% 1415 32% 86% 1% 1% 94% 89% 2 114 25 0 1 147 148 4.1
Punjab Mansa 460 99% 339 30% 90% 1% 1% 100% 86% 6 13 12 0 24 5 29 3.7
Punjab Moga 464 93% 455 43% 88% 2% 2% 95% 95% 62 29 29 0 6 8 14 1.4
Punjab Mohali 514 93% 649 46% 70% 2% 1% 80% 80% 7 37 44 0 0 72 72 7.1
Punjab Muktsar 650 92% 480 35% 72% 0% 0% 0% 100% 0 7 33 0 0 5 5 0.5
Punjab Nawanshahr 383 88% 445 55% 92% 2% 1% 100% 83% 18 9 59 0 0 0 0 0.0
Punjab Patiala 924 89% 642 28% 78% 1% 1% 95% 100% 10 41 8 16 4 15 35 1.8
Punjab Rupnagar 496 95% 291 30% 91% 3% 3% 96% 96% 18 12 28 0 0 0 0 0.0
Punjab Sangrur 1194 95% 274 11% 92% 1% 1% 83% 83% 25 34 6 0 0 0 0 0.0
Punjab Tarn Taran 1010 88% 597 30% 87% 4% 4% 100% 100% 0 3 7 0 0 0 0 0.0
Rajasthan Ajmer 1636 87% 546 13% 68% 1% 1% 100% 92% 0 4 0 0 0 0 0 0.0
Rajasthan Alwar 2077 81% 1404 27% 78% 1% 0% 88% 88% 0 0 1 0 0 136 136 3.6
Rajasthan Banswara 1325 67% 895 26% 35% 1% 0% 75% 100% 0 5 4 0 0 0 0 0.0
Rajasthan Baran 1008 89% 893 40% 26% 0% 0% 0% 0% 0 3 7 0 0 0 0 0.0

TB Annual Report145
State District Population (in lakh)
covered by RNTCP1
No. of suspects examined
Suspects examined per lakh
population
Rate of change in suspects examined per lakh
population
No of Smear positive patients
diagnosed2
Suspects examined per smear
positive case diagnosed
Rate of change in suspects examined
per s+ case diagnosed
Annual Smear
positive case detection rate (from
PMR)
Annual smear
positive case notification rate [from CFR: sm + cases (NSP
+ Rel + TAD) / Pop]
Total patients
registered for
treatment3
Annual total case
notification rate
Annual new smear
positive case notification
rate
Rajasthan Barmer 27.0 10078 93 -4% 1042 10 -26% 39 36 1804 67 29
Rajasthan Bharatpur 26.4 11556 109 -5% 1487 8 -12% 56 51 3069 116 38
Rajasthan Bhilwara 25.0 18864 189 5% 3163 6 27% 127 110 4633 185 73
Rajasthan Bikaner 24.5 16624 169 2% 2261 7 22% 92 55 2337 95 36
Rajasthan Bundi 11.5 5238 113 -1% 699 7 75% 61 63 1450 126 49
Rajasthan Chittaurgarh 15.7 14533 231 29% 1423 10 96% 91 102 2775 177 67
Rajasthan Churu 21.2 7413 88 -5% 1440 5 -45% 68 61 2290 108 40
Rajasthan Dausa 17.0 9803 144 -10% 956 10 68% 56 52 2018 119 38
Rajasthan Dhaulpur 12.5 9574 191 8% 1322 7 42% 106 96 1951 156 70
Rajasthan Dungarpur 14.4 10451 182 48% 2029 5 -27% 141 135 3036 211 109
Rajasthan Ganganagar 20.4 11177 137 -1% 1350 8 45% 66 62 2501 123 47
Rajasthan Hanumangarh 18.4 14480 196 36% 1820 8 1% 99 84 2513 136 53
Rajasthan Jaipur 37.2 42719 287 -2% 5115 8 58% 137 62 4827 130 43
Rajasthan Jaipur DTC II 31.8 26330 207 15% 2604 10 6% 82 67 4262 134 46
Rajasthan Jaisalmer 7.0 3456 124 -18% 240 14 143% 34 32 351 50 23
Rajasthan Jalore 19.0 7396 97 21% 852 9 117% 45 51 2010 106 39
Rajasthan Jhalawar 14.6 7267 124 12% 1281 6 -23% 88 66 1787 122 44
Rajasthan Jhunjhunun 22.2 11495 130 -2% 1430 8 45% 64 61 2418 109 39
Rajasthan Jodhpur 38.2 19292 126 0% 2161 9 11% 57 40 4102 107 30
Rajasthan Karauli 15.1 10994 182 9% 1257 9 9% 83 71 2382 158 50
Rajasthan Kota 20.2 14541 180 17% 1839 8 -36% 91 62 2622 130 44
Rajasthan Nagaur 34.3 11928 87 -8% 1563 8 37% 46 40 2697 79 29
Rajasthan Pali 21.1 9908 117 25% 1275 8 54% 60 57 2091 99 43
Rajasthan Pratapgarh-RJ 8.9 3533 99 24% 827 4 -40% 93 100 1370 153 80
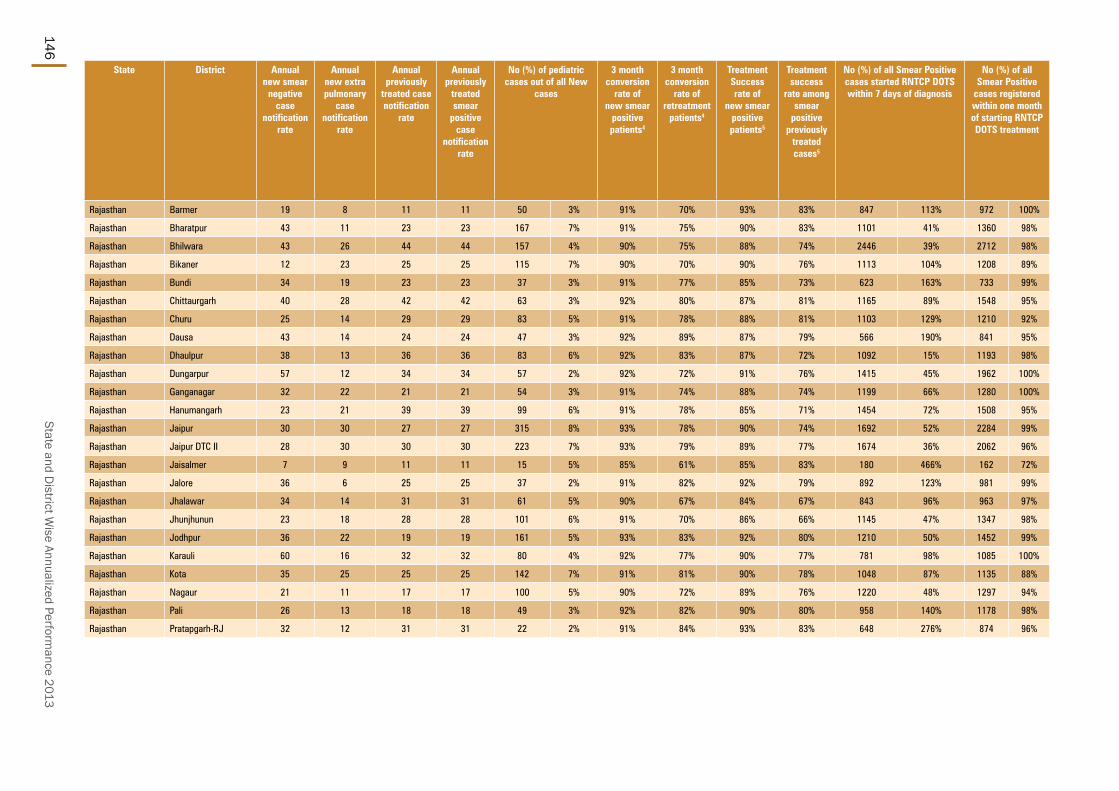
State and District W
ise Annualized Performance 2013
146
State District Annual new smear
negative case
notification rate
Annual new extra pulmonary
case notification
rate
Annual previously
treated case notification
rate
Annual previously
treated smear
positive case
notification rate
No (%) of pediatric cases out of all New
cases
3 month conversion
rate of new smear
positive patients4
3 month conversion
rate of retreatment
patients4
Treatment Success rate of
new smear positive patients5
Treatment success
rate among smear
positive previously
treated cases5
No (%) of all Smear Positive cases started RNTCP DOTS within 7 days of diagnosis
No (%) of all Smear Positive
cases registered within one month of starting RNTCP DOTS treatment
Rajasthan Barmer 19 8 11 11 50 3% 91% 70% 93% 83% 847 113% 972 100%
Rajasthan Bharatpur 43 11 23 23 167 7% 91% 75% 90% 83% 1101 41% 1360 98%
Rajasthan Bhilwara 43 26 44 44 157 4% 90% 75% 88% 74% 2446 39% 2712 98%
Rajasthan Bikaner 12 23 25 25 115 7% 90% 70% 90% 76% 1113 104% 1208 89%
Rajasthan Bundi 34 19 23 23 37 3% 91% 77% 85% 73% 623 163% 733 99%
Rajasthan Chittaurgarh 40 28 42 42 63 3% 92% 80% 87% 81% 1165 89% 1548 95%
Rajasthan Churu 25 14 29 29 83 5% 91% 78% 88% 81% 1103 129% 1210 92%
Rajasthan Dausa 43 14 24 24 47 3% 92% 89% 87% 79% 566 190% 841 95%
Rajasthan Dhaulpur 38 13 36 36 83 6% 92% 83% 87% 72% 1092 15% 1193 98%
Rajasthan Dungarpur 57 12 34 34 57 2% 92% 72% 91% 76% 1415 45% 1962 100%
Rajasthan Ganganagar 32 22 21 21 54 3% 91% 74% 88% 74% 1199 66% 1280 100%
Rajasthan Hanumangarh 23 21 39 39 99 6% 91% 78% 85% 71% 1454 72% 1508 95%
Rajasthan Jaipur 30 30 27 27 315 8% 93% 78% 90% 74% 1692 52% 2284 99%
Rajasthan Jaipur DTC II 28 30 30 30 223 7% 93% 79% 89% 77% 1674 36% 2062 96%
Rajasthan Jaisalmer 7 9 11 11 15 5% 85% 61% 85% 83% 180 466% 162 72%
Rajasthan Jalore 36 6 25 25 37 2% 91% 82% 92% 79% 892 123% 981 99%
Rajasthan Jhalawar 34 14 31 31 61 5% 90% 67% 84% 67% 843 96% 963 97%
Rajasthan Jhunjhunun 23 18 28 28 101 6% 91% 70% 86% 66% 1145 47% 1347 98%
Rajasthan Jodhpur 36 22 19 19 161 5% 93% 83% 92% 80% 1210 50% 1452 99%
Rajasthan Karauli 60 16 32 32 80 4% 92% 77% 90% 77% 781 98% 1085 100%
Rajasthan Kota 35 25 25 25 142 7% 91% 81% 90% 78% 1048 87% 1135 88%
Rajasthan Nagaur 21 11 17 17 100 5% 90% 72% 89% 76% 1220 48% 1297 94%
Rajasthan Pali 26 13 18 18 49 3% 92% 82% 90% 80% 958 140% 1178 98%
Rajasthan Pratapgarh-RJ 32 12 31 31 22 2% 91% 84% 93% 83% 648 276% 874 96%

TB Annual Report147
State District No (%) of all cured Smear
Positive cases
having end of treatment follow- up
sputum done within 7 days of last dose
No (%) of cases (all
forms of TB) registered receiving
DOT through a community
volunteer
Proportion of all
registered TB cases
with known HIV
status
Proportion of TB
patients known
to be HIV infected among tested
Proportion of TB
patients known
to be HIV infected among
registered
Proportion of HIV
infected TB
patients put on CPT (RT report)
Proportion of HIV
infected TB
patients put on
ART (RT report)
Number of health facilities
registered (Laboratories - Private) in
2013
Number of health facilities
registered (Single clinic -
Private) in 2013
Number of health facilities
registered (Multi-clicnic
- Private) in 2013
Number of patients
notified by (Laboratories - Private) in
2013
Number of
patients notified
by (Single clinic -
Private) in 2013
Number of
patients notified
by (Multi-clinic - Private) in 2013
Total cases nofied
by private sector
in 2013
Notification rate per 1,00,000
population (private sector)
Rajasthan Barmer 811 83% 63 4% 69% 1% 0% 0% 100% 0 0 0 0 0 0 0 0.0
Rajasthan Bharatpur 1023 67% 817 27% 15% 0% 0% 0 0 2 0 0 0 0 0.0
Rajasthan Bhilwara 2214 86% 387 8% 55% 3% 2% 99% 99% 0 10 1 0 8 0 8 0.3
Rajasthan Bikaner 1084 86% 384 17% 34% 0% 0% 100% 0% 0 0 0 0 0 0 0 0.0
Rajasthan Bundi 598 84% 200 14% 43% 1% 1% 67% 67% 0 1 0 0 15 0 15 1.3
Rajasthan Chittaurgarh 1159 82% 354 13% 78% 1% 1% 63% 33% 0 6 4 0 0 0 0 0.0
Rajasthan Churu 923 85% 400 18% 14% 1% 0% 0% 100% 0 0 0 0 0 0 0 0.0
Rajasthan Dausa 586 72% 584 29% 10% 1% 0% 0% 0% 0 0 18 0 0 0 0 0.0
Rajasthan Dhaulpur 866 83% 342 18% 55% 1% 0% 50% 100% 0 14 0 0 0 0 0 0.0
Rajasthan Dungarpur 1138 78% 484 16% 37% 1% 0% 67% 75% 0 0 0 0 0 0 0 0.0
Rajasthan Ganganagar 1142 93% 383 17% 60% 0% 0% 100% 100% 0 0 0 0 0 0 0 0.0
Rajasthan Hanumangarh 1102 88% 446 19% 77% 0% 0% 0 0 0 0 0 0 0 0.0
Rajasthan Jaipur 1771 84% 455 17% 83% 1% 1% 74% 95% 0 1 11 0 0 0 0 0.0
Rajasthan Jaipur DTC II 1791 87% 838 20% 82% 1% 1% 100% 100% 10 13 71 0 1 3 4 0.1
Rajasthan Jaisalmer 190 81% 45 13% 24% 1% 0% 0 0 0 0 0 0 0 0.0
Rajasthan Jalore 892 89% 206 10% 29% 6% 1% 37% 78% 0 0 0 0 0 0 0 0.0
Rajasthan Jhalawar 631 84% 216 12% 28% 0% 0% 0 0 4 0 0 156 156 10.7
Rajasthan Jhunjhunun 1115 99% 167 7% 32% 8% 1% 85% 85% 0 3 9 0 0 0 0 0.0
Rajasthan Jodhpur 1161 75% 297 8% 32% 3% 0% 87% 87% 0 31 58 0 0 0 0 0.0
Rajasthan Karauli 586 66% 565 24% 43% 0% 0% 0 16 0 0 0 0 0 0.0
Rajasthan Kota 884 73% 568 22% 18% 1% 0% 83% 83% 2 22 10 0 106 0 106 5.2
Rajasthan Nagaur 1133 86% 423 16% 7% 1% 0% 33% 33% 0 0 0 0 0 0 0 0.0
Rajasthan Pali 742 75% 161 8% 34% 1% 0% 9 43 32 0 0 0 0 0.0
Rajasthan Pratapgarh-RJ 434 55% 150 55% 36% 0% 0% 0% 100% 0 1 0 0 0 0 0 0.0

State and District W
ise Annualized Performance 2013
148
State District Population (in lakh)
covered by RNTCP1
No. of suspects examined
Suspects examined per lakh
population
Rate of change in suspects examined per lakh
population
No of Smear positive patients
diagnosed2
Suspects examined per smear
positive case diagnosed
Rate of change in suspects examined
per s+ case diagnosed
Annual Smear
positive case detection rate (from
PMR)
Annual smear
positive case notification rate [from CFR: sm + cases (NSP
+ Rel + TAD) / Pop]
Total patients
registered for
treatment3
Annual total case
notification rate
Annual new smear
positive case notification
rate
Rajasthan Rajsamand 12.0 5702 119 8% 1029 6 -29% 86 81 1631 136 58
Rajasthan Sawai Madhopur 13.9 10232 184 16% 1324 8 3% 95 85 2278 164 59
Rajasthan Sikar 27.8 19631 177 43% 1596 12 88% 58 43 2531 91 29
Rajasthan Sirohi 10.7 6796 158 3% 787 9 39% 73 67 1387 129 52
Rajasthan Tonk 14.7 9093 154 -10% 1696 5 -18% 115 122 3431 233 85
Rajasthan Udaipur 31.7 31676 249 11% 7327 4 37% 231 105 6061 191 82
Sikkim East Sikkim 2.9 4604 401 2% 481 10 119% 168 129 864 301 97
Sikkim North Sikkim 0.4 361 204 20% 34 11 79% 77 113 142 321 90
Sikkim South Sikkim 1.5 1620 271 -3% 162 10 29% 108 100 352 235 73
Sikkim West Sikkim 1.4 1100 198 -5% 119 9 42% 86 83 279 201 72
Tamil Nadu Chennai 48.1 63524 330 -7% 6059 10 94% 126 65 5853 122 49
Tamil Nadu Coimbatore 35.7 27157 190 15% 2304 12 217% 65 51 2739 77 40
Tamil Nadu Cuddalore 26.7 31752 297 -12% 1510 21 132% 56 63 3566 133 46
Tamil Nadu Dharmapuri 15.5 12038 195 3% 793 15 99% 51 47 1332 86 33
Tamil Nadu Dindigul 22.2 24614 277 9% 2378 10 -4% 107 71 3067 138 59
Tamil Nadu Erode 23.2 22040 237 -5% 2749 8 -33% 118 63 2587 111 48
Tamil Nadu Kanchipuram 41.0 38231 233 42% 3964 10 -10% 97 90 6727 164 66
Tamil Nadu Kanyakumari 19.2 21182 276 1% 1139 19 69% 59 48 1256 66 42
Tamil Nadu Karur 11.1 6956 157 35% 505 14 -33% 46 59 1234 111 49
Tamil Nadu Krishnagiri 19.4 11852 153 20% 746 16 8% 39 38 1423 73 31
Tamil Nadu Madurai 31.3 30491 244 14% 3060 10 8% 98 63 3248 104 47
Tamil Nadu Nagapattinam 16.6 11564 174 7% 818 14 70% 49 51 1524 92 43
Tamil Nadu Namakkal 17.7 13962 197 30% 842 17 64% 48 58 1616 91 50
Tamil Nadu Perambalur 13.5 13692 253 41% 753 18 1% 56 55 1330 98 44

TB Annual Report149
State District Annual new smear
negative case
notification rate
Annual new extra pulmonary
case notification
rate
Annual previously
treated case notification
rate
Annual previously
treated smear
positive case
notification rate
No (%) of pediatric cases out of all New
cases
3 month conversion
rate of new smear
positive patients4
3 month conversion
rate of retreatment
patients4
Treatment Success rate of
new smear positive patients5
Treatment success
rate among smear
positive previously
treated cases5
No (%) of all Smear Positive cases started RNTCP DOTS within 7 days of diagnosis
No (%) of all Smear Positive
cases registered within one month of starting RNTCP DOTS treatment
Rajasthan Rajsamand 30 19 27 27 61 5% 91% 80% 89% 86% 729 40% 966 99%
Rajasthan Sawai Madhopur 39 29 38 38 66 4% 91% 76% 91% 73% 1065 5% 1196 99%
Rajasthan Sikar 23 15 24 24 102 5% 89% 81% 86% 75% 1119 12% 1133 92%
Rajasthan Sirohi 35 14 28 28 42 4% 91% 84% 88% 74% 658 16% 698 95%
Rajasthan Tonk 65 36 47 47 153 6% 91% 77% 87% 70% 1691 141% 1777 97%
Rajasthan Udaipur 54 24 30 30 228 4% 92% 82% 92% 85% 2513 49% 3244 96%
Sikkim East Sikkim 49 90 66 66 57 8% 76% 59% 74% 49% 390 341% 392 99%
Sikkim North Sikkim 72 95 63 63 14 12% 77% 64% 75% 43% 55 1169% 55 100%
Sikkim South Sikkim 64 48 50 50 28 10% 89% 67% 86% 60% 144 864% 152 100%
Sikkim West Sikkim 30 76 22 22 18 7% 91% 82% 89% 70% 119 1129% 119 100%
Tamil Nadu Chennai 21 30 22 22 275 6% 89% 74% 86% 69% 2590 70% 3148 100%
Tamil Nadu Coimbatore 7 14 15 15 58 3% 91% 66% 83% 54% 1640 42% 1800 97%
Tamil Nadu Cuddalore 33 31 24 24 327 11% 90% 80% 90% 82% 1352 34% 1599 94%
Tamil Nadu Dharmapuri 16 19 19 19 40 4% 87% 67% 80% 62% 643 86% 724 99%
Tamil Nadu Dindigul 42 20 17 17 179 7% 91% 72% 87% 70% 1314 112% 1559 99%
Tamil Nadu Erode 27 14 22 22 51 2% 89% 52% 79% 42% 1343 47% 1452 96%
Tamil Nadu Kanchipuram 35 30 33 33 280 5% 84% 60% 87% 64% 2227 24% 3174 85%
Tamil Nadu Kanyakumari 6 9 9 9 46 4% 90% 76% 87% 64% 787 74% 908 99%
Tamil Nadu Karur 31 14 18 18 25 2% 93% 77% 88% 73% 570 96% 675 99%
Tamil Nadu Krishnagiri 16 15 12 12 63 5% 86% 71% 85% 66% 628 106% 716 96%
Tamil Nadu Madurai 19 18 20 20 161 6% 88% 71% 77% 54% 1771 89% 1760 88%
Tamil Nadu Nagapattinam 28 11 10 10 67 5% 90% 64% 88% 58% 712 61% 804 93%
Tamil Nadu Namakkal 15 14 12 12 35 2% 90% 76% 86% 59% 880 153% 1036 100%
Tamil Nadu Perambalur 19 20 16 16 75 7% 91% 68% 87% 62% 676 26% 726 96%
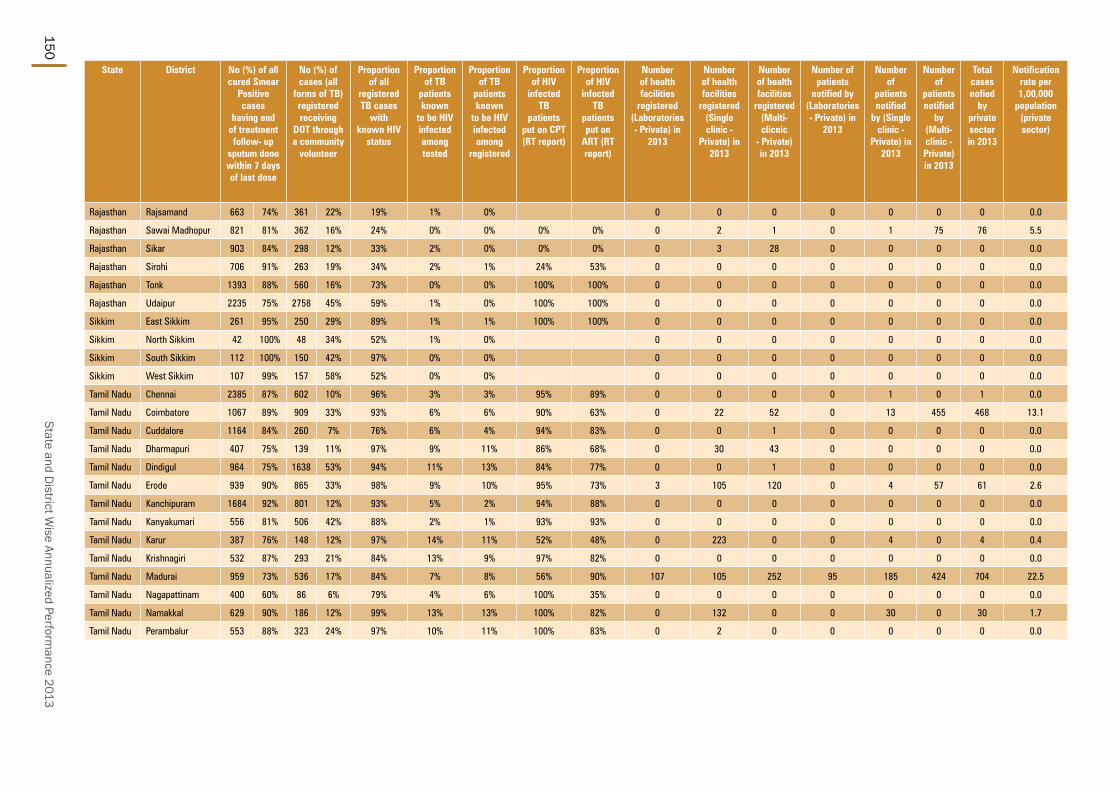
State and District W
ise Annualized Performance 2013
150
State District No (%) of all cured Smear
Positive cases
having end of treatment follow- up
sputum done within 7 days of last dose
No (%) of cases (all
forms of TB) registered receiving
DOT through a community
volunteer
Proportion of all
registered TB cases
with known HIV
status
Proportion of TB
patients known
to be HIV infected among tested
Proportion of TB
patients known
to be HIV infected among
registered
Proportion of HIV
infected TB
patients put on CPT (RT report)
Proportion of HIV
infected TB
patients put on
ART (RT report)
Number of health facilities
registered (Laboratories - Private) in
2013
Number of health facilities
registered (Single clinic -
Private) in 2013
Number of health facilities
registered (Multi-clicnic
- Private) in 2013
Number of patients
notified by (Laboratories - Private) in
2013
Number of
patients notified
by (Single clinic -
Private) in 2013
Number of
patients notified
by (Multi-clinic - Private) in 2013
Total cases nofied
by private sector in 2013
Notification rate per 1,00,000
population (private sector)
Rajasthan Rajsamand 663 74% 361 22% 19% 1% 0% 0 0 0 0 0 0 0 0.0
Rajasthan Sawai Madhopur 821 81% 362 16% 24% 0% 0% 0% 0% 0 2 1 0 1 75 76 5.5
Rajasthan Sikar 903 84% 298 12% 33% 2% 0% 0% 0% 0 3 28 0 0 0 0 0.0
Rajasthan Sirohi 706 91% 263 19% 34% 2% 1% 24% 53% 0 0 0 0 0 0 0 0.0
Rajasthan Tonk 1393 88% 560 16% 73% 0% 0% 100% 100% 0 0 0 0 0 0 0 0.0
Rajasthan Udaipur 2235 75% 2758 45% 59% 1% 0% 100% 100% 0 0 0 0 0 0 0 0.0
Sikkim East Sikkim 261 95% 250 29% 89% 1% 1% 100% 100% 0 0 0 0 0 0 0 0.0
Sikkim North Sikkim 42 100% 48 34% 52% 1% 0% 0 0 0 0 0 0 0 0.0
Sikkim South Sikkim 112 100% 150 42% 97% 0% 0% 0 0 0 0 0 0 0 0.0
Sikkim West Sikkim 107 99% 157 58% 52% 0% 0% 0 0 0 0 0 0 0 0.0
Tamil Nadu Chennai 2385 87% 602 10% 96% 3% 3% 95% 89% 0 0 0 0 1 0 1 0.0
Tamil Nadu Coimbatore 1067 89% 909 33% 93% 6% 6% 90% 63% 0 22 52 0 13 455 468 13.1
Tamil Nadu Cuddalore 1164 84% 260 7% 76% 6% 4% 94% 83% 0 0 1 0 0 0 0 0.0
Tamil Nadu Dharmapuri 407 75% 139 11% 97% 9% 11% 86% 68% 0 30 43 0 0 0 0 0.0
Tamil Nadu Dindigul 964 75% 1638 53% 94% 11% 13% 84% 77% 0 0 1 0 0 0 0 0.0
Tamil Nadu Erode 939 90% 865 33% 98% 9% 10% 95% 73% 3 105 120 0 4 57 61 2.6
Tamil Nadu Kanchipuram 1684 92% 801 12% 93% 5% 2% 94% 88% 0 0 0 0 0 0 0 0.0
Tamil Nadu Kanyakumari 556 81% 506 42% 88% 2% 1% 93% 93% 0 0 0 0 0 0 0 0.0
Tamil Nadu Karur 387 76% 148 12% 97% 14% 11% 52% 48% 0 223 0 0 4 0 4 0.4
Tamil Nadu Krishnagiri 532 87% 293 21% 84% 13% 9% 97% 82% 0 0 0 0 0 0 0 0.0
Tamil Nadu Madurai 959 73% 536 17% 84% 7% 8% 56% 90% 107 105 252 95 185 424 704 22.5
Tamil Nadu Nagapattinam 400 60% 86 6% 79% 4% 6% 100% 35% 0 0 0 0 0 0 0 0.0
Tamil Nadu Namakkal 629 90% 186 12% 99% 13% 13% 100% 82% 0 132 0 0 30 0 30 1.7
Tamil Nadu Perambalur 553 88% 323 24% 97% 10% 11% 100% 83% 0 2 0 0 0 0 0 0.0
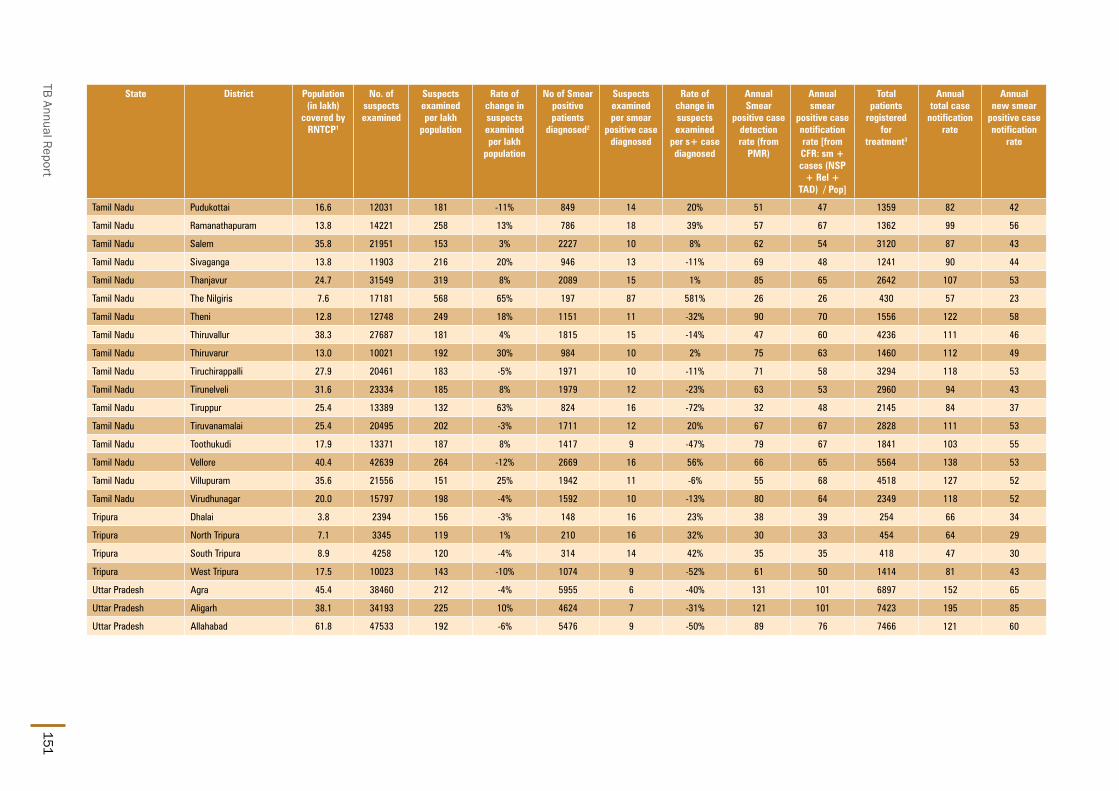
TB Annual Report151
State District Population (in lakh)
covered by RNTCP1
No. of suspects examined
Suspects examined per lakh
population
Rate of change in suspects examined per lakh
population
No of Smear positive patients
diagnosed2
Suspects examined per smear
positive case diagnosed
Rate of change in suspects examined
per s+ case diagnosed
Annual Smear
positive case detection rate (from
PMR)
Annual smear
positive case notification rate [from CFR: sm + cases (NSP
+ Rel + TAD) / Pop]
Total patients
registered for
treatment3
Annual total case
notification rate
Annual new smear
positive case notification
rate
Tamil Nadu Pudukottai 16.6 12031 181 -11% 849 14 20% 51 47 1359 82 42
Tamil Nadu Ramanathapuram 13.8 14221 258 13% 786 18 39% 57 67 1362 99 56
Tamil Nadu Salem 35.8 21951 153 3% 2227 10 8% 62 54 3120 87 43
Tamil Nadu Sivaganga 13.8 11903 216 20% 946 13 -11% 69 48 1241 90 44
Tamil Nadu Thanjavur 24.7 31549 319 8% 2089 15 1% 85 65 2642 107 53
Tamil Nadu The Nilgiris 7.6 17181 568 65% 197 87 581% 26 26 430 57 23
Tamil Nadu Theni 12.8 12748 249 18% 1151 11 -32% 90 70 1556 122 58
Tamil Nadu Thiruvallur 38.3 27687 181 4% 1815 15 -14% 47 60 4236 111 46
Tamil Nadu Thiruvarur 13.0 10021 192 30% 984 10 2% 75 63 1460 112 49
Tamil Nadu Tiruchirappalli 27.9 20461 183 -5% 1971 10 -11% 71 58 3294 118 53
Tamil Nadu Tirunelveli 31.6 23334 185 8% 1979 12 -23% 63 53 2960 94 43
Tamil Nadu Tiruppur 25.4 13389 132 63% 824 16 -72% 32 48 2145 84 37
Tamil Nadu Tiruvanamalai 25.4 20495 202 -3% 1711 12 20% 67 67 2828 111 53
Tamil Nadu Toothukudi 17.9 13371 187 8% 1417 9 -47% 79 67 1841 103 55
Tamil Nadu Vellore 40.4 42639 264 -12% 2669 16 56% 66 65 5564 138 53
Tamil Nadu Villupuram 35.6 21556 151 25% 1942 11 -6% 55 68 4518 127 52
Tamil Nadu Virudhunagar 20.0 15797 198 -4% 1592 10 -13% 80 64 2349 118 52
Tripura Dhalai 3.8 2394 156 -3% 148 16 23% 38 39 254 66 34
Tripura North Tripura 7.1 3345 119 1% 210 16 32% 30 33 454 64 29
Tripura South Tripura 8.9 4258 120 -4% 314 14 42% 35 35 418 47 30
Tripura West Tripura 17.5 10023 143 -10% 1074 9 -52% 61 50 1414 81 43
Uttar Pradesh Agra 45.4 38460 212 -4% 5955 6 -40% 131 101 6897 152 65
Uttar Pradesh Aligarh 38.1 34193 225 10% 4624 7 -31% 121 101 7423 195 85
Uttar Pradesh Allahabad 61.8 47533 192 -6% 5476 9 -50% 89 76 7466 121 60

State and District W
ise Annualized Performance 2013
152
State District Annual new smear
negative case
notification rate
Annual new extra pulmonary
case notification
rate
Annual previously
treated case notification
rate
Annual previously
treated smear
positive case
notification rate
No (%) of pediatric cases out of all New
cases
3 month conversion
rate of new smear
positive patients4
3 month conversion
rate of retreatment
patients4
Treatment Success rate of
new smear positive patients5
Treatment success
rate among smear
positive previously
treated cases5
No (%) of all Smear Positive cases started RNTCP DOTS within 7 days of diagnosis
No (%) of all Smear Positive
cases registered within one month of starting RNTCP DOTS treatment
Tamil Nadu Pudukottai 20 11 9 9 47 4% 91% 53% 88% 64% 651 89% 683 86%
Tamil Nadu Ramanathapuram 18 11 14 14 116 10% 94% 75% 88% 60% 787 206% 933 100%
Tamil Nadu Salem 14 15 15 15 130 5% 89% 66% 84% 52% 1765 38% 1906 99%
Tamil Nadu Sivaganga 26 14 7 7 54 5% 91% 74% 87% 62% 530 227% 591 89%
Tamil Nadu Thanjavur 21 16 18 18 116 5% 89% 67% 84% 56% 1585 80% 1631 99%
Tamil Nadu The Nilgiris 11 16 7 7 41 11% 90% 70% 85% 75% 196 508% 202 100%
Tamil Nadu Theni 25 17 21 21 52 4% 87% 68% 80% 51% 709 159% 850 94%
Tamil Nadu Thiruvallur 21 24 19 19 127 4% 93% 72% 87% 64% 1921 48% 2333 100%
Tamil Nadu Thiruvarur 28 13 22 22 51 4% 85% 65% 80% 58% 732 293% 839 99%
Tamil Nadu Tiruchirappalli 26 30 9 9 159 5% 92% 74% 88% 66% 1512 112% 1583 96%
Tamil Nadu Tirunelveli 21 16 14 14 110 4% 86% 63% 83% 54% 1312 52% 1687 99%
Tamil Nadu Tiruppur 18 13 16 16 45 3% 90% 69% 84% 58% 1026 11% 1232 99%
Tamil Nadu Tiruvanamalai 19 20 19 19 104 4% 94% 85% 92% 82% 1440 11% 1704 99%
Tamil Nadu Toothukudi 20 13 15 15 73 5% 87% 70% 83% 58% 1114 21% 1150 94%
Tamil Nadu Vellore 31 38 17 17 93 2% 90% 70% 91% 71% 2479 28% 2633 100%
Tamil Nadu Villupuram 29 23 23 23 181 5% 92% 80% 91% 79% 1839 162% 2297 95%
Tamil Nadu Virudhunagar 37 14 15 15 204 10% 92% 78% 86% 67% 890 283% 1286 100%
Tripura Dhalai 20 5 7 7 2 1% 90% 100% 92% 73% 133 2954% 149 99%
Tripura North Tripura 18 8 9 9 10 3% 86% 59% 83% 57% 198 541% 226 95%
Tripura South Tripura 4 6 6 6 11 3% 93% 67% 93% 81% 250 452% 300 95%
Tripura West Tripura 12 15 11 11 38 3% 91% 74% 88% 72% 748 143% 898 99%
Uttar Pradesh Agra 13 21 52 52 341 8% 89% 63% 90% 64% 3931 41% 4615 100%
Uttar Pradesh Aligarh 58 26 26 26 316 5% 93% 81% 91% 79% 3655 25% 3922 100%
Uttar Pradesh Allahabad 23 14 23 23 246 4% 91% 72% 89% 76% 4460 48% 4736 100%

TB Annual Report153
State District No (%) of all cured Smear
Positive cases
having end of treatment follow- up
sputum done within 7 days of last dose
No (%) of cases (all
forms of TB) registered receiving
DOT through a community
volunteer
Proportion of all
registered TB cases
with known HIV
status
Proportion of TB
patients known
to be HIV infected among tested
Proportion of TB
patients known
to be HIV infected among
registered
Proportion of HIV
infected TB
patients put on CPT (RT report)
Proportion of HIV
infected TB
patients put on
ART (RT report)
Number of health facilities
registered (Laboratories - Private) in
2013
Number of health facilities
registered (Single clinic -
Private) in 2013
Number of health facilities
registered (Multi-clicnic
- Private) in 2013
Number of patients
notified by (Laboratories - Private) in
2013
Number of
patients notified
by (Single clinic -
Private) in 2013
Number of
patients notified
by (Multi-clinic - Private) in 2013
Total cases nofied
by private sector
in 2013
Notification rate per 1,00,000
population (private sector)
Tamil Nadu Pudukottai 563 85% 565 35% 90% 6% 7% 91% 92% 1 15 0 0 0 0 0 0.0
Tamil Nadu Ramanathapuram 627 89% 578 42% 96% 5% 4% 78% 90% 0 0 0 0 0 0 0 0.0
Tamil Nadu Salem 951 66% 739 24% 98% 12% 15% 99% 95% 0 0 0 0 0 0 0 0.0
Tamil Nadu Sivaganga 455 79% 266 21% 91% 5% 6% 87% 84% 0 0 0 0 0 0 0 0.0
Tamil Nadu Thanjavur 1033 86% 900 34% 97% 6% 6% 97% 83% 0 0 5 0 0 0 0 0.0
Tamil Nadu The Nilgiris 144 99% 194 45% 99% 2% 5% 100% 96% 0 49 20 0 14 1 15 2.0
Tamil Nadu Theni 317 57% 204 14% 85% 9% 15% 100% 52% 0 0 0 0 0 0 0 0.0
Tamil Nadu Thiruvallur 1549 89% 870 21% 100% 5% 4% 100% 100% 0 438 40 0 31 52 83 2.2
Tamil Nadu Thiruvarur 420 83% 231 16% 87% 5% 3% 96% 96% 0 0 0 0 0 0 0 0.0
Tamil Nadu Tiruchirappalli 1327 95% 303 9% 84% 8% 8% 89% 70% 0 135 41 0 7 33 40 1.4
Tamil Nadu Tirunelveli 798 67% 1275 43% 83% 7% 6% 99% 99% 0 4 3 0 45 71 116 3.7
Tamil Nadu Tiruppur 624 72% 292 14% 97% 6% 7% 100% 75% 0 229 171 0 76 135 211 8.3
Tamil Nadu Tiruvanamalai 1389 89% 1161 41% 96% 4% 6% 97% 85% 0 0 3 0 0 0 0 0.0
Tamil Nadu Toothukudi 686 78% 412 22% 99% 5% 3% 98% 93% 6 104 91 0 25 59 84 4.7
Tamil Nadu Vellore 1937 91% 3816 69% 93% 4% 3% 53% 47% 27 414 23 1 14 3 18 0.4
Tamil Nadu Villupuram 1657 83% 1401 31% 87% 5% 4% 90% 80% 0 10 23 0 7 3 10 0.3
Tamil Nadu Virudhunagar 562 55% 373 16% 95% 5% 6% 90% 81% 0 17 0 0 0 0 0 0.0
Tripura Dhalai 109 84% 142 66% 69% 1% 0% 0 1 0 0 0 0 0 0.0
Tripura North Tripura 148 82% 281 62% 74% 2% 2% 57% 57% 0 0 0 0 0 0 0 0.0
Tripura South Tripura 223 78% 150 36% 55% 0% 0% 100% 0% 0 0 0 0 0 0 0 0.0
Tripura West Tripura 627 80% 489 35% 69% 1% 1% 100% 75% 0 2 5 0 0 1 1 0.1
Uttar Pradesh Agra 2895 83% 5695 83% 39% 2% 0% 0 0 0 0 0 0 0 0.0
Uttar Pradesh Aligarh 2920 93% 2533 88% 35% 1% 0% 100% 100% 0 0 0 0 0 0 0 0.0
Uttar Pradesh Allahabad 3212 79% 6415 88% 51% 2% 1% 3% 68% 0 0 0 0 0 0 0 0.0
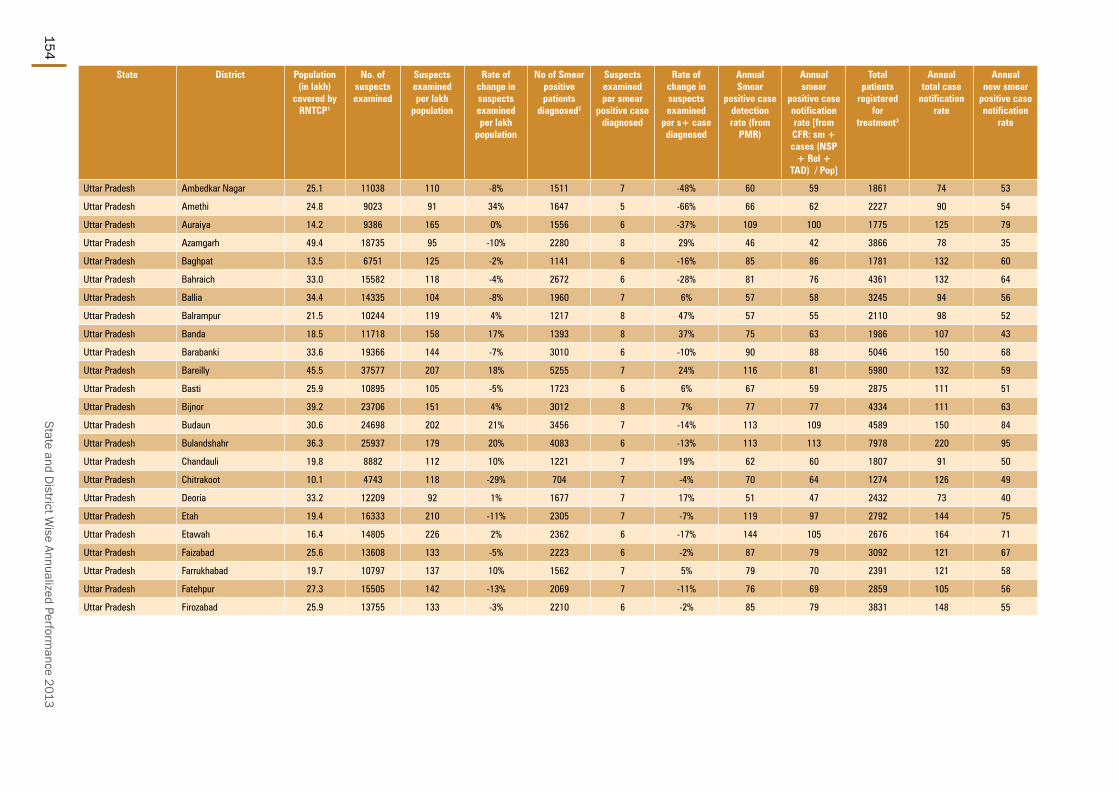
State and District W
ise Annualized Performance 2013
154
State District Population (in lakh)
covered by RNTCP1
No. of suspects examined
Suspects examined per lakh
population
Rate of change in suspects examined per lakh
population
No of Smear positive patients
diagnosed2
Suspects examined per smear
positive case diagnosed
Rate of change in suspects examined
per s+ case diagnosed
Annual Smear
positive case detection rate (from
PMR)
Annual smear
positive case notification rate [from CFR: sm + cases (NSP
+ Rel + TAD) / Pop]
Total patients
registered for
treatment3
Annual total case
notification rate
Annual new smear
positive case notification
rate
Uttar Pradesh Ambedkar Nagar 25.1 11038 110 -8% 1511 7 -48% 60 59 1861 74 53
Uttar Pradesh Amethi 24.8 9023 91 34% 1647 5 -66% 66 62 2227 90 54
Uttar Pradesh Auraiya 14.2 9386 165 0% 1556 6 -37% 109 100 1775 125 79
Uttar Pradesh Azamgarh 49.4 18735 95 -10% 2280 8 29% 46 42 3866 78 35
Uttar Pradesh Baghpat 13.5 6751 125 -2% 1141 6 -16% 85 86 1781 132 60
Uttar Pradesh Bahraich 33.0 15582 118 -4% 2672 6 -28% 81 76 4361 132 64
Uttar Pradesh Ballia 34.4 14335 104 -8% 1960 7 6% 57 58 3245 94 56
Uttar Pradesh Balrampur 21.5 10244 119 4% 1217 8 47% 57 55 2110 98 52
Uttar Pradesh Banda 18.5 11718 158 17% 1393 8 37% 75 63 1986 107 43
Uttar Pradesh Barabanki 33.6 19366 144 -7% 3010 6 -10% 90 88 5046 150 68
Uttar Pradesh Bareilly 45.5 37577 207 18% 5255 7 24% 116 81 5980 132 59
Uttar Pradesh Basti 25.9 10895 105 -5% 1723 6 6% 67 59 2875 111 51
Uttar Pradesh Bijnor 39.2 23706 151 4% 3012 8 7% 77 77 4334 111 63
Uttar Pradesh Budaun 30.6 24698 202 21% 3456 7 -14% 113 109 4589 150 84
Uttar Pradesh Bulandshahr 36.3 25937 179 20% 4083 6 -13% 113 113 7978 220 95
Uttar Pradesh Chandauli 19.8 8882 112 10% 1221 7 19% 62 60 1807 91 50
Uttar Pradesh Chitrakoot 10.1 4743 118 -29% 704 7 -4% 70 64 1274 126 49
Uttar Pradesh Deoria 33.2 12209 92 1% 1677 7 17% 51 47 2432 73 40
Uttar Pradesh Etah 19.4 16333 210 -11% 2305 7 -7% 119 97 2792 144 75
Uttar Pradesh Etawah 16.4 14805 226 2% 2362 6 -17% 144 105 2676 164 71
Uttar Pradesh Faizabad 25.6 13608 133 -5% 2223 6 -2% 87 79 3092 121 67
Uttar Pradesh Farrukhabad 19.7 10797 137 10% 1562 7 5% 79 70 2391 121 58
Uttar Pradesh Fatehpur 27.3 15505 142 -13% 2069 7 -11% 76 69 2859 105 56
Uttar Pradesh Firozabad 25.9 13755 133 -3% 2210 6 -2% 85 79 3831 148 55

TB Annual Report155
State District Annual new smear
negative case
notification rate
Annual new extra pulmonary
case notification
rate
Annual previously
treated case notification
rate
Annual previously
treated smear
positive case
notification rate
No (%) of pediatric cases out of all New
cases
3 month conversion
rate of new smear
positive patients4
3 month conversion
rate of retreatment
patients4
Treatment Success rate of
new smear positive patients5
Treatment success
rate among smear
positive previously
treated cases5
No (%) of all Smear Positive cases started RNTCP DOTS within 7 days of diagnosis
No (%) of all Smear Positive
cases registered within one month of starting RNTCP DOTS treatment
Uttar Pradesh Ambedkar Nagar 9 4 7 7 32 2% 91% 82% 94% 90% 1282 123% 1408 95%
Uttar Pradesh Amethi 18 7 11 11 43 2% 90% 80% 92% 79% 1425 77% 1549 100%
Uttar Pradesh Auraiya 13 8 26 26 48 3% 92% 79% 93% 82% 1293 76% 1448 100%
Uttar Pradesh Azamgarh 22 6 15 15 115 4% 89% 76% 86% 75% 1914 137% 2052 98%
Uttar Pradesh Baghpat 19 22 30 30 67 5% 90% 79% 89% 79% 964 277% 1168 100%
Uttar Pradesh Bahraich 45 11 12 12 127 3% 89% 75% 87% 74% 2270 54% 2476 99%
Uttar Pradesh Ballia 25 9 4 4 133 4% 96% 91% 93% 90% 1824 136% 1865 93%
Uttar Pradesh Balrampur 36 4 6 6 80 4% 90% 69% 85% 71% 1199 188% 1199 100%
Uttar Pradesh Banda 16 24 25 25 96 6% 92% 79% 91% 84% 1096 308% 1171 99%
Uttar Pradesh Barabanki 37 19 27 27 305 7% 93% 82% 91% 85% 2852 37% 2953 100%
Uttar Pradesh Bareilly 30 11 32 32 193 4% 90% 71% 86% 68% 3236 15% 3707 100%
Uttar Pradesh Basti 32 14 13 13 108 4% 89% 67% 88% 71% 1355 89% 1555 100%
Uttar Pradesh Bijnor 10 18 20 20 193 5% 91% 76% 90% 74% 2721 52% 2997 100%
Uttar Pradesh Budaun 27 4 35 35 147 4% 94% 86% 92% 84% 2259 65% 2408 99%
Uttar Pradesh Bulandshahr 68 27 30 30 291 4% 94% 82% 94% 88% 3646 44% 4077 99%
Uttar Pradesh Chandauli 16 8 18 18 73 5% 86% 74% 85% 74% 1091 100% 1201 100%
Uttar Pradesh Chitrakoot 29 25 24 24 13 1% 78% 62% 85% 73% 553 252% 665 99%
Uttar Pradesh Deoria 13 8 13 13 148 7% 87% 70% 90% 76% 1382 115% 1577 100%
Uttar Pradesh Etah 21 19 30 30 214 10% 91% 82% 94% 93% 1557 90% 1910 100%
Uttar Pradesh Etawah 23 29 40 40 108 5% 89% 68% 87% 65% 1566 210% 1741 100%
Uttar Pradesh Faizabad 26 11 16 16 113 4% 91% 77% 90% 74% 1834 102% 2026 100%
Uttar Pradesh Farrukhabad 26 19 18 18 113 6% 92% 79% 88% 76% 1203 133% 1402 100%
Uttar Pradesh Fatehpur 17 13 19 19 117 5% 91% 77% 92% 87% 1688 114% 1926 100%
Uttar Pradesh Firozabad 22 24 47 47 444 17% 91% 70% 91% 77% 1814 38% 2057 99%

State and District W
ise Annualized Performance 2013
156
State District No (%) of all cured Smear
Positive cases
having end of treatment follow- up
sputum done within 7 days of last dose
No (%) of cases (all
forms of TB) registered receiving
DOT through a community
volunteer
Proportion of all
registered TB cases
with known HIV
status
Proportion of TB
patients known
to be HIV infected among tested
Proportion of TB
patients known
to be HIV infected among
registered
Proportion of HIV
infected TB
patients put on CPT (RT report)
Proportion of HIV
infected TB
patients put on
ART (RT report)
Number of health facilities
registered (Laboratories - Private) in
2013
Number of health facilities
registered (Single clinic -
Private) in 2013
Number of health facilities
registered (Multi-clicnic
- Private) in 2013
Number of patients
notified by (Laboratories - Private) in
2013
Number of
patients notified
by (Single clinic -
Private) in 2013
Number of
patients notified
by (Multi-clinic - Private) in 2013
Total cases nofied
by private sector
in 2013
Notification rate per 1,00,000
population (private sector)
Uttar Pradesh Ambedkar Nagar 1164 82% 1307 70% 22% 2% 0% 0 0 0 0 0 0 0 0.0
Uttar Pradesh Amethi 1086 88% 738 77% 19% 3% 0% 0% 0% 0 0 0 0 0 0 0 0.0
Uttar Pradesh Auraiya 1061 88% 1577 89% 26% 2% 0% 0 0 0 0 0 0 0 0.0
Uttar Pradesh Azamgarh 1663 80% 1142 32% 4% 19% 0% 0% 0% 0 0 0 0 0 0 0 0.0
Uttar Pradesh Baghpat 720 74% 1321 74% 47% 3% 1% 14% 76% 0 0 0 0 0 0 0 0.0
Uttar Pradesh Bahraich 2111 90% 3166 77% 4% 13% 0% 31 32 21 0 0 0 0 0.0
Uttar Pradesh Ballia 1589 86% 1663 56% 15% 7% 1% 0% 96% 0 0 0 0 0 0 0 0.0
Uttar Pradesh Balrampur 936 93% 1298 62% 2% 19% 0% 0 0 0 0 0 0 0 0.0
Uttar Pradesh Banda 919 88% 1495 75% 54% 2% 0% 17% 83% 0 0 0 0 0 0 0 0.0
Uttar Pradesh Barabanki 2698 96% 3031 60% 21% 1% 0% 0 34 56 0 0 0 0 0.0
Uttar Pradesh Bareilly 2447 100% 4758 81% 3% 9% 0% 0 0 0 0 0 0 0 0.0
Uttar Pradesh Basti 1051 82% 2255 81% 17% 4% 0% 7 7 5 0 113 0 113 4.4
Uttar Pradesh Bijnor 2353 96% 3325 77% 10% 6% 0% 71% 71% 0 0 0 0 0 0 0 0.0
Uttar Pradesh Budaun 1900 92% 2594 78% 49% 1% 0% 0% 0% 0 0 0 0 0 0 0 0.0
Uttar Pradesh Bulandshahr 2613 89% 5276 66% 7% 6% 0% 0 0 0 0 0 0 0 0.0
Uttar Pradesh Chandauli 817 87% 1580 87% 46% 2% 1% 38% 54% 0 0 0 0 0 0 0 0.0
Uttar Pradesh Chitrakoot 317 89% 1237 100% 48% 0% 0% 0% 0% 0 0 0 0 0 0 0 0.0
Uttar Pradesh Deoria 1006 73% 2406 99% 36% 3% 2% 5% 84% 0 0 0 0 0 0 0 0.0
Uttar Pradesh Etah 1459 81% 2414 86% 16% 2% 0% 0% 100% 0 0 0 0 0 0 0 0.0
Uttar Pradesh Etawah 1135 85% 2206 82% 63% 1% 0% 8% 92% 0 0 0 0 0 0 0 0.0
Uttar Pradesh Faizabad 1530 91% 2474 80% 34% 3% 1% 0% 100% 0 0 0 0 0 0 0 0.0
Uttar Pradesh Farrukhabad 879 80% 1110 46% 20% 2% 0% 0% 100% 0 0 0 0 0 0 0 0.0
Uttar Pradesh Fatehpur 1600 87% 2199 78% 39% 1% 0% 0% 75% 0 0 0 0 0 0 0 0.0
Uttar Pradesh Firozabad 1410 79% 3446 90% 17% 1% 0% 0 0 0 0 0 0 0 0.0

TB Annual Report157
State District Population (in lakh)
covered by RNTCP1
No. of suspects examined
Suspects examined per lakh
population
Rate of change in suspects examined per lakh
population
No of Smear positive patients
diagnosed2
Suspects examined per smear
positive case diagnosed
Rate of change in suspects examined
per s+ case diagnosed
Annual Smear
positive case detection rate (from
PMR)
Annual smear
positive case notification rate [from CFR: sm + cases (NSP
+ Rel + TAD) / Pop]
Total patients
registered for
treatment3
Annual total case
notification rate
Annual new smear
positive case notification
rate
Uttar Pradesh Gautam Budh Nagar 17.0 13550 199 -4% 2106 6 -6% 124 111 3893 229 83
Uttar Pradesh Ghaziabad 33.1 23720 179 -5% 3403 7 23% 103 116 8536 258 91
Uttar Pradesh Ghazipur 38.1 13031 85 11% 2325 6 -14% 61 58 2936 77 53
Uttar Pradesh Gonda 35.6 15678 110 1% 2415 6 1% 68 60 4346 122 54
Uttar Pradesh Gorakhpur 47.3 19334 102 -18% 3071 6 -15% 65 53 3499 74 46
Uttar Pradesh Hamirpur 13.0 6273 120 -16% 1013 6 6% 78 66 1319 101 55
Uttar Pradesh Hapur 14.3 9270 162 47% 1343 7 4% 94 95 2530 177 81
Uttar Pradesh Hardoi 42.4 25489 150 -6% 4323 6 -7% 102 95 6813 161 82
Uttar Pradesh Hathras 16.2 9768 151 7% 1339 7 31% 83 77 1582 98 62
Uttar Pradesh Jalaun 17.0 10853 160 9% 1378 8 19% 81 79 2509 148 63
Uttar Pradesh Jaunpur 46.4 22615 122 12% 2859 8 19% 62 57 5555 120 50
Uttar Pradesh Jhansi 20.7 14477 175 35% 2338 6 -5% 113 82 2555 123 62
Uttar Pradesh Jyotiba Phule Nagar 19.1 17643 231 1% 1854 10 62% 97 96 2340 123 79
Uttar Pradesh Kannauj 17.3 10689 154 14% 1373 8 18% 79 75 1797 104 61
Uttar Pradesh Kanpur Dehat 19.2 10618 139 2% 1400 8 16% 73 69 1691 88 53
Uttar Pradesh Kanpur Nagar 45.7 32150 176 11% 5583 6 -19% 122 87 6221 136 64
Uttar Pradesh Kanshiram Nagar 14.6 7432 127 6% 1035 7 4% 71 70 1601 109 62
Uttar Pradesh Kaushambi 16.2 12067 186 1% 1376 9 71% 85 84 2351 145 68
Uttar Pradesh Kheri 40.9 25644 157 -4% 3575 7 -19% 87 82 5350 131 69
Uttar Pradesh Kushinagar 35.0 14111 101 -10% 2048 7 1% 59 57 2850 82 52
Uttar Pradesh Lalitpur 12.2 7803 160 -3% 1082 7 12% 88 84 1463 120 74
Uttar Pradesh Lucknow 48.0 42482 221 6% 6774 6 10% 141 85 6668 139 64
Uttar Pradesh Maharajganj 27.8 10045 90 5% 1172 9 34% 42 42 1721 62 37
Uttar Pradesh Mahoba 9.0 4919 136 -2% 698 7 -14% 77 71 762 85 48

State and District W
ise Annualized Performance 2013
158
State District Annual new smear
negative case
notification rate
Annual new extra pulmonary
case notification
rate
Annual previously
treated case notification
rate
Annual previously
treated smear
positive case
notification rate
No (%) of pediatric cases out of all New
cases
3 month conversion
rate of new smear
positive patients4
3 month conversion
rate of retreatment
patients4
Treatment Success rate of
new smear positive patients5
Treatment success
rate among smear
positive previously
treated cases5
No (%) of all Smear Positive cases started RNTCP DOTS within 7 days of diagnosis
No (%) of all Smear Positive
cases registered within one month of starting RNTCP DOTS treatment
Uttar Pradesh Gautam Budh Nagar 38 58 50 50 187 6% 92% 73% 91% 80% 1716 69% 1902 99%
Uttar Pradesh Ghaziabad 53 63 50 50 564 8% 94% 84% 91% 83% 3666 96% 3751 97%
Uttar Pradesh Ghazipur 11 4 9 9 103 4% 89% 69% 88% 79% 2058 51% 2221 100%
Uttar Pradesh Gonda 50 9 10 10 223 6% 91% 76% 94% 85% 1870 60% 2166 100%
Uttar Pradesh Gorakhpur 10 7 11 11 119 4% 82% 67% 83% 63% 2193 96% 2540 100%
Uttar Pradesh Hamirpur 22 10 14 14 44 4% 91% 77% 88% 71% 777 187% 855 99%
Uttar Pradesh Hapur 45 29 23 23 95 4% 94% 88% 92% 85% 1319 124% 1362 100%
Uttar Pradesh Hardoi 50 8 20 20 156 3% 92% 81% 90% 79% 3708 29% 4039 99%
Uttar Pradesh Hathras 8 7 21 21 55 4% 93% 84% 92% 83% 1127 98% 1252 100%
Uttar Pradesh Jalaun 42 13 29 29 58 3% 91% 77% 89% 76% 1293 263% 1399 100%
Uttar Pradesh Jaunpur 41 16 12 12 137 3% 91% 74% 88% 68% 2446 27% 2662 100%
Uttar Pradesh Jhansi 22 8 31 31 67 3% 91% 68% 89% 65% 1625 73% 1714 99%
Uttar Pradesh Jyotiba Phule Nagar 18 6 20 20 23 1% 95% 89% 92% 86% 1692 158% 1839 100%
Uttar Pradesh Kannauj 16 9 18 18 51 3% 94% 84% 93% 84% 1202 136% 1310 100%
Uttar Pradesh Kanpur Dehat 7 8 21 21 58 4% 92% 82% 92% 82% 1221 74% 1321 98%
Uttar Pradesh Kanpur Nagar 15 22 35 35 259 6% 89% 66% 83% 63% 3683 90% 3895 98%
Uttar Pradesh Kanshiram Nagar 25 11 11 11 89 6% 92% 78% 94% 96% 730 97% 1012 98%
Uttar Pradesh Kaushambi 38 10 29 29 97 5% 93% 89% 95% 93% 1264 42% 1361 100%
Uttar Pradesh Kheri 33 6 23 23 78 2% 89% 74% 92% 85% 2901 40% 3374 99%
Uttar Pradesh Kushinagar 16 5 8 8 90 4% 85% 72% 89% 78% 1783 82% 1917 95%
Uttar Pradesh Lalitpur 22 6 18 18 28 2% 89% 81% 94% 88% 996 105% 997 96%
Uttar Pradesh Lucknow 24 23 28 28 276 5% 87% 60% 82% 62% 3579 82% 4083 100%
Uttar Pradesh Maharajganj 13 4 8 8 48 3% 91% 86% 91% 85% 1002 163% 1081 92%
Uttar Pradesh Mahoba 4 7 26 26 21 4% 93% 83% 92% 88% 569 436% 636 99%

TB Annual Report159
State District No (%) of all cured Smear
Positive cases
having end of treatment follow- up
sputum done within 7 days of last dose
No (%) of cases (all
forms of TB) registered receiving
DOT through a community
volunteer
Proportion of all
registered TB cases
with known HIV
status
Proportion of TB
patients known
to be HIV infected among tested
Proportion of TB
patients known
to be HIV infected among
registered
Proportion of HIV
infected TB
patients put on CPT (RT report)
Proportion of HIV
infected TB
patients put on
ART (RT report)
Number of health facilities
registered (Laboratories - Private) in
2013
Number of health facilities
registered (Single clinic -
Private) in 2013
Number of health facilities
registered (Multi-clicnic
- Private) in 2013
Number of patients
notified by (Laboratories - Private) in
2013
Number of
patients notified
by (Single clinic -
Private) in 2013
Number of
patients notified
by (Multi-clinic - Private) in 2013
Total cases nofied
by private sector in 2013
Notification rate per 1,00,000
population (private sector)
Uttar Pradesh Gautam Budh Nagar 1385 86% 2734 70% 42% 0% 0% 0% 0% 0 0 0 0 0 0 0 0.0
Uttar Pradesh Ghaziabad 3387 86% 4599 54% 8% 3% 0% 0 1 4 0 1 27 28 0.8
Uttar Pradesh Ghazipur 1186 79% 2772 95% 14% 7% 0% 0% 57% 0 0 0 0 0 0 0 0.0
Uttar Pradesh Gonda 1598 87% 2547 58% 16% 2% 0% 0% 0% 0 0 32 0 0 0 0 0.0
Uttar Pradesh Gorakhpur 1639 77% 2362 67% 12% 10% 0% 11% 33% 0 0.0
Uttar Pradesh Hamirpur 499 69% 405 31% 11% 3% 0% 0 0 0 0 0 0 0 0.0
Uttar Pradesh Hapur 888 90% 1884 74% 3% 16% 0% 0 0 0 0 0 0 0 0.0
Uttar Pradesh Hardoi 2908 89% 4870 71% 27% 1% 0% 0% 0% 4 14 25 37 9 172 218 5.1
Uttar Pradesh Hathras 941 89% 1394 88% 57% 1% 0% 100% 0% 0 0 0 0 0 0 0 0.0
Uttar Pradesh Jalaun 1031 89% 1894 75% 26% 2% 0% 0 0 0 0 0 0 0 0.0
Uttar Pradesh Jaunpur 1965 86% 4369 79% 26% 4% 0% 55% 75% 0 0 0 0 0 0 0 0.0
Uttar Pradesh Jhansi 1151 90% 1951 76% 18% 2% 0% 0 0 6 0 0 6 6 0.3
Uttar Pradesh Jyotiba Phule Nagar 1415 84% 1340 57% 18% 4% 0% 0 0 0 0 0 0 0 0.0
Uttar Pradesh Kannauj 1112 93% 1396 78% 15% 4% 0% 0% 100% 0 0 0 0 0 0 0 0.0
Uttar Pradesh Kanpur Dehat 1193 94% 1248 74% 38% 0% 0% 0 0 0 0 0 0 0 0.0
Uttar Pradesh Kanpur Nagar 2325 85% 3746 63% 26% 2% 0% 0% 0% 13 257 38 0 0 0 0 0.0
Uttar Pradesh Kanshiram Nagar 659 78% 1117 70% 41% 2% 0% 0% 100% 0 0 2 0 0 2 2 0.1
Uttar Pradesh Kaushambi 1176 92% 2351 100% 24% 2% 0% 0% 67% 0 0 0 0 0 0 0 0.0
Uttar Pradesh Kheri 2454 79% 4371 86% 19% 2% 0% 0 0 2 0 0 2 2 0.0
Uttar Pradesh Kushinagar 1604 82% 2582 91% 9% 11% 0% 0 0 0 0 0 0 0 0.0
Uttar Pradesh Lalitpur 841 95% 1400 96% 43% 0% 0% 0 0 0 0 0 0 0 0.0
Uttar Pradesh Lucknow 2730 94% 2286 34% 52% 1% 0% 0% 33% 0 0 2 0 0 25 25 0.5
Uttar Pradesh Maharajganj 1039 82% 1112 64% 4% 22% 0% 0% 0% 0 0 0 0 0 0 0 0.0
Uttar Pradesh Mahoba 487 84% 587 78% 36% 1% 0% 0 0 0 0 0 0 0 0.0

State and District W
ise Annualized Performance 2013
160
State District Population (in lakh)
covered by RNTCP1
No. of suspects examined
Suspects examined per lakh
population
Rate of change in suspects examined per lakh
population
No of Smear positive patients
diagnosed2
Suspects examined per smear
positive case diagnosed
Rate of change in suspects examined
per s+ case diagnosed
Annual Smear
positive case detection rate (from
PMR)
Annual smear
positive case notification rate [from CFR: sm + cases (NSP
+ Rel + TAD) / Pop]
Total patients
registered for
treatment3
Annual total case
notification rate
Annual new smear
positive case notification
rate
Uttar Pradesh Mainpuri 19.1 11408 150 12% 1287 9 28% 67 70 1931 101 58
Uttar Pradesh Mathura 25.9 14365 139 3% 2116 7 13% 82 71 3104 120 57
Uttar Pradesh Mau 23.1 10688 115 -14% 1430 7 -3% 62 52 1877 81 47
Uttar Pradesh Meerut 35.7 29658 208 -5% 4236 7 11% 119 103 6349 178 83
Uttar Pradesh Mirzapur 25.6 18012 176 3% 2077 9 36% 81 80 3609 141 65
Uttar Pradesh Moradabad 31.1 20577 165 31% 3315 6 -10% 107 97 3958 127 79
Uttar Pradesh Muzaffarnagar 28.8 22202 193 -11% 2695 8 -15% 94 82 3969 138 64
Uttar Pradesh Pilibhit 21.1 14018 166 -8% 1855 8 12% 88 78 2529 120 57
Uttar Pradesh Pratapgarh 34.1 16665 122 -8% 2250 7 -2% 66 64 3368 99 55
Uttar Pradesh Rae Bareli 25.6 12851 125 -1% 2158 6 -18% 84 73 3367 132 62
Uttar Pradesh Rampur 24.1 20873 217 10% 2836 7 -4% 118 110 4068 169 86
Uttar Pradesh Saharanpur 35.3 19531 138 -9% 2852 7 17% 81 77 4628 131 57
Uttar Pradesh Sambhal 22.2 10792 122 1470 7 -10% 66 66 2028 91 54
Uttar Pradesh Sant Kabir Nagar 18.2 7593 104 -16% 952 8 10% 52 47 1546 85 40
Uttar Pradesh Sant Ravidas Nagar 16.3 13028 199 -5% 1329 10 31% 81 83 2353 144 69
Uttar Pradesh Shahjahanpur 32.0 18645 146 -12% 2567 7 10% 80 70 3700 116 60
Uttar Pradesh Shamli 13.1 7914 152 28% 1229 6 -15% 94 96 1922 147 70
Uttar Pradesh Shravasti 11.2 4638 103 3% 751 6 -8% 67 62 900 80 54
Uttar Pradesh Siddharthnagar 25.3 8414 83 -33% 1184 7 47 44 2018 80 39
Uttar Pradesh Sitapur 46.4 34253 185 2% 3959 9 14% 85 84 7019 151 70
Uttar Pradesh Sonbhadra 18.3 9822 134 17% 1453 7 -24% 79 75 1798 98 64
Uttar Pradesh Sultanpur 24.4 12245 126 -6% 1804 7 -6% 74 66 2262 93 56
Uttar Pradesh Unnao 32.2 15961 124 -8% 2712 6 -7% 84 83 4174 129 64
Uttar Pradesh Varanasi 38.2 25747 169 5% 3449 7 32% 90 62 4414 116 56

TB Annual Report161
State District Annual new smear
negative case
notification rate
Annual new extra pulmonary
case notification
rate
Annual previously
treated case notification
rate
Annual previously
treated smear
positive case
notification rate
No (%) of pediatric cases out of all New
cases
3 month conversion
rate of new smear
positive patients4
3 month conversion rate of retreatment
patients4
Treatment Success rate of
new smear positive patients5
Treatment success
rate among smear
positive previously
treated cases5
No (%) of all Smear Positive cases started RNTCP DOTS within 7 days of diagnosis
No (%) of all Smear Positive
cases registered within one month of starting RNTCP DOTS treatment
Uttar Pradesh Mainpuri 14 10 19 19 57 4% 90% 80% 93% 85% 1368 164% 1367 100%
Uttar Pradesh Mathura 29 14 20 20 112 4% 89% 69% 87% 66% 1659 86% 1866 100%
Uttar Pradesh Mau 21 6 7 7 67 4% 94% 81% 93% 85% 1092 171% 1203 99%
Uttar Pradesh Meerut 37 29 29 29 151 3% 93% 83% 92% 84% 3375 41% 3655 99%
Uttar Pradesh Mirzapur 44 8 25 25 179 6% 95% 84% 95% 93% 1912 123% 2028 99%
Uttar Pradesh Moradabad 13 13 22 22 140 4% 92% 74% 90% 74% 2811 82% 3026 100%
Uttar Pradesh Muzaffarnagar 23 25 26 26 136 4% 90% 70% 88% 69% 2250 56% 2512 100%
Uttar Pradesh Pilibhit 24 8 30 30 66 3% 88% 79% 84% 72% 1613 43% 1654 100%
Uttar Pradesh Pratapgarh 18 8 17 17 108 4% 92% 79% 95% 85% 2068 55% 2237 99%
Uttar Pradesh Rae Bareli 45 9 16 16 118 4% 89% 80% 88% 81% 1498 102% 1791 100%
Uttar Pradesh Rampur 36 18 29 29 163 5% 91% 75% 90% 74% 2501 42% 2659 100%
Uttar Pradesh Saharanpur 21 26 28 28 196 5% 91% 81% 91% 83% 2481 22% 2734 100%
Uttar Pradesh Sambhal 17 5 15 15 49 3% 90% 75% 87% 73% 1400 69% 1463 100%
Uttar Pradesh Sant Kabir Nagar 20 11 14 14 70 5% 85% 62% 88% 75% 708 397% 870 98%
Uttar Pradesh Sant Ravidas Nagar 44 8 22 22 88 4% 97% 89% 96% 94% 1232 94% 1325 98%
Uttar Pradesh Shahjahanpur 30 12 14 14 134 4% 90% 84% 89% 78% 1836 65% 2201 98%
Uttar Pradesh Shamli 25 19 33 33 39 3% 91% 77% 90% 77% 1118 190% 1223 97%
Uttar Pradesh Shravasti 10 7 9 9 35 4% 92% 80% 93% 80% 608 305% 700 100%
Uttar Pradesh Siddharthnagar 27 5 8 8 47 3% 90% 81% 90% 77% 1015 37% 1132 100%
Uttar Pradesh Sitapur 45 10 28 28 252 4% 91% 80% 94% 89% 3515 5% 3919 100%
Uttar Pradesh Sonbhadra 12 6 16 16 73 5% 93% 80% 92% 86% 1279 18% 1369 99%
Uttar Pradesh Sultanpur 16 5 16 16 49 3% 92% 81% 93% 85% 1464 10% 1564 96%
Uttar Pradesh Unnao 27 14 24 24 142 4% 92% 84% 89% 83% 2401 33% 2682 100%
Uttar Pradesh Varanasi 28 18 13 13 299 8% 92% 71% 89% 67% 2136 16% 2338 99%

State and District W
ise Annualized Performance 2013
162
State District No (%) of all cured Smear
Positive cases
having end of treatment follow- up
sputum done within 7 days of last dose
No (%) of cases (all
forms of TB) registered receiving
DOT through a community
volunteer
Proportion of all
registered TB cases
with known HIV
status
Proportion of TB
patients known
to be HIV infected among tested
Proportion of TB
patients known
to be HIV infected among
registered
Proportion of HIV
infected TB
patients put on CPT (RT report)
Proportion of HIV
infected TB
patients put on
ART (RT report)
Number of health facilities
registered (Laboratories - Private) in
2013
Number of health facilities
registered (Single clinic -
Private) in 2013
Number of health facilities
registered (Multi-clicnic
- Private) in 2013
Number of patients
notified by (Laboratories - Private) in
2013
Number of
patients notified
by (Single clinic -
Private) in 2013
Number of
patients notified
by (Multi-clinic
- Private) in 2013
Total cases nofied
by private sector
in 2013
Notification rate per 1,00,000
population (private sector)
Uttar Pradesh Mainpuri 864 80% 1924 100% 30% 3% 0% 14% 14% 0 0 0 0 0 0 0 0.0
Uttar Pradesh Mathura 1223 90% 2263 73% 10% 6% 0% 0% 0% 0 0 0 0 0 0 0 0.0
Uttar Pradesh Mau 1014 87% 1378 73% 53% 2% 2% 3% 72% 1 1 11 0 0 26 26 1.1
Uttar Pradesh Meerut 2958 89% 5375 85% 33% 2% 0% 0% 92% 0 0 0 0 0 0 0 0.0
Uttar Pradesh Mirzapur 1840 93% 2762 77% 30% 1% 0% 100% 100% 0 0 0 0 0 0 0 0.0
Uttar Pradesh Moradabad 2214 70% 3006 76% 26% 4% 0% 0 0 0 0 0 0 0 0.0
Uttar Pradesh Muzaffarnagar 1865 79% 3167 77% 34% 2% 0% 0% 40% 0 0 0 0 0 0 0 0.0
Uttar Pradesh Pilibhit 1216 87% 1950 77% 29% 2% 0% 0 0 0 0 0 0 0 0.0
Uttar Pradesh Pratapgarh 1465 75% 2905 85% 23% 3% 1% 85% 50% 0 0 0 0 0 0 0 0.0
Uttar Pradesh Rae Bareli 1134 85% 2696 85% 41% 1% 0% 67% 67% 15 87 41 0 16 0 16 0.6
Uttar Pradesh Rampur 1792 92% 3562 88% 50% 2% 0% 0% 83% 1 20 5 6 166 16 188 7.8
Uttar Pradesh Saharanpur 2330 89% 3819 83% 18% 2% 0% 33% 100% 0 0 0 0 0 0 0 0.0
Uttar Pradesh Sambhal 832 90% 1316 62% 4% 11% 0% 0 0 0 0 0 0 0 0.0
Uttar Pradesh Sant Kabir Nagar 540 63% 950 61% 12% 4% 0% 0% 29% 0 0 0 0 0 0 0 0.0
Uttar Pradesh Sant Ravidas Nagar 1336 100% 1393 59% 19% 7% 1% 0% 6% 0 0 0 0 0 0 0 0.0
Uttar Pradesh Shahjahanpur 1879 88% 2772 79% 25% 1% 0% 0 0 0 0 0 0 0 0.0
Uttar Pradesh Shamli 950 94% 1554 81% 24% 2% 0% 100% 100% 0 0 0 0 0 0 0 0.0
Uttar Pradesh Shravasti 572 90% 698 78% 11% 7% 0% 67% 67% 0 0 0 0 0 0 0 0.0
Uttar Pradesh Siddharthnagar 1263 88% 1405 70% 19% 20% 2% 94% 94% 0 0 0 0 0 0 0 0.0
Uttar Pradesh Sitapur 2871 91% 4865 69% 12% 2% 0% 50% 100% 0 0 0 0 0 0 0 0.0
Uttar Pradesh Sonbhadra 940 80% 1723 96% 42% 2% 0% 0% 100% 0 0 0 0 0 0 0 0.0
Uttar Pradesh Sultanpur 1266 78% 1058 69% 47% 1% 0% 0% 0% 0 0 0 0 0 0 0 0.0
Uttar Pradesh Unnao 2210 88% 3244 78% 21% 2% 0% 0 0 0 0 0 0 0 0.0
Uttar Pradesh Varanasi 1917 86% 3081 70% 16% 3% 0% 33% 33% 0 0 0 0 0 0 0 0.0

TB Annual Report163
State District Population (in lakh)
covered by RNTCP1
No. of suspects examined
Suspects examined per lakh
population
Rate of change in suspects examined per lakh
population
No of Smear positive patients
diagnosed2
Suspects examined per smear
positive case diagnosed
Rate of change in suspects examined
per s+ case diagnosed
Annual Smear
positive case detection rate (from
PMR)
Annual smear
positive case notification rate [from CFR: sm + cases (NSP
+ Rel + TAD) / Pop]
Total patients
registered for
treatment3
Annual total case
notification rate
Annual new smear
positive case notification
rate
Uttarakhand Almora 6.4 4093 159 -15% 519 8 6% 81 71 726 113 55
Uttarakhand Bageshwar 2.7 1616 151 -10% 176 9 10% 66 70 332 124 49
Uttarakhand Chamoli 4.0 1690 105 -21% 241 7 15% 60 78 581 144 54
Uttarakhand Champawat 2.7 1484 138 -18% 177 8 37% 66 74 277 103 56
Uttarakhand Dehradun 17.5 15585 222 -10% 2446 6 10% 139 60 2527 144 42
Uttarakhand Garhwal 7.1 5831 206 -12% 975 6 -12% 137 71 842 119 52
Uttarakhand Hardwar 19.9 8838 111 -10% 1432 6 -24% 72 63 2317 116 46
Uttarakhand Nainital 9.9 5346 135 -33% 1251 4 -51% 127 110 1837 186 68
Uttarakhand Pithoragarh 5.0 3083 154 -2% 378 8 -7% 75 72 543 108 51
Uttarakhand Rudraprayag 2.4 1083 111 -21% 111 10 -3% 45 73 311 127 57
Uttarakhand Tehri Garhwal 6.4 3525 138 -16% 359 10 48% 56 64 707 111 41
Uttarakhand Udhamsingh Nagar 17.0 9965 146 -3% 1386 7 1% 81 65 2181 128 45
Uttarakhand Uttarkashi 3.4 1963 144 -4% 260 8 20% 76 74 519 152 56
West Bengal Bankura 36.7 27952 190 6% 2812 10 105% 77 66 4146 113 57
West Bengal Barddhaman 78.8 51166 162 -3% 5641 9 16% 72 63 8284 105 51
West Bengal Birbhum 35.8 20063 140 -4% 2898 7 -33% 81 70 3850 108 59
West Bengal Dakshin Dinajpur 17.1 12107 177 -1% 1744 7 -22% 102 94 2500 147 80
West Bengal Darjiling 18.8 14771 196 -11% 2143 7 -5% 114 89 3236 172 67
West Bengal Haora 49.4 29293 148 5% 2946 10 43% 60 53 4630 94 37
West Bengal Hugli 56.3 26579 118 -2% 3314 8 -15% 59 55 5342 95 44
West Bengal Jalpaiguri 39.5 36138 229 3% 4047 9 -7% 102 97 6421 163 80
West Bengal Koch Bihar 28.8 18917 164 1% 1713 11 54% 59 50 2640 92 44
West Bengal Kolkata 45.8 38797 212 2% 4733 8 3% 103 67 5292 116 47
West Bengal Maldah 40.8 25023 153 -3% 3443 7 0% 84 72 4584 112 60

State and District W
ise Annualized Performance 2013
164
State District Annual new smear
negative case
notification rate
Annual new extra pulmonary
case notification
rate
Annual previously
treated case notification
rate
Annual previously
treated smear
positive case
notification rate
No (%) of pediatric cases out of all New
cases
3 month conversion
rate of new smear
positive patients4
3 month conversion
rate of retreatment
patients4
Treatment Success rate of
new smear positive patients5
Treatment success
rate among smear
positive previously
treated cases5
No (%) of all Smear Positive cases started RNTCP DOTS within 7 days of diagnosis
No (%) of all Smear Positive
cases registered within one month of starting RNTCP DOTS treatment
Uttarakhand Almora 10 25 22 22 29 5% 87% 81% 92% 81% 419 240% 453 98%
Uttarakhand Bageshwar 22 24 29 29 11 4% 89% 80% 86% 85% 189 415% 138 70%
Uttarakhand Chamoli 25 21 43 43 20 5% 92% 86% 90% 81% 250 105% 318 99%
Uttarakhand Champawat 7 16 24 24 13 6% 82% 71% 97% 86% 167 73% 199 100%
Uttarakhand Dehradun 41 33 28 28 150 7% 83% 66% 84% 63% 882 29% 994 93%
Uttarakhand Garhwal 20 19 27 27 15 2% 85% 73% 83% 72% 387 209% 468 90%
Uttarakhand Hardwar 21 24 25 25 139 8% 85% 73% 86% 72% 1104 17% 1253 98%
Uttarakhand Nainital 27 32 59 59 80 6% 77% 57% 73% 43% 814 239% 773 90%
Uttarakhand Pithoragarh 15 15 27 27 31 8% 78% 61% 84% 72% 335 1130% 377 100%
Uttarakhand Rudraprayag 25 27 18 18 12 5% 81% 84% 91% 67% 146 1139% 176 100%
Uttarakhand Tehri Garhwal 15 23 32 32 23 5% 90% 79% 94% 83% 310 230% 387 93%
Uttarakhand Udhamsingh Nagar 35 14 34 34 79 5% 91% 77% 86% 68% 1090 133% 1096 98%
Uttarakhand Uttarkashi 31 37 28 28 30 7% 97% 76% 91% 73% 219 906% 241 94%
West Bengal Bankura 18 24 13 13 135 4% 93% 80% 91% 77% 2043 96% 2367 96%
West Bengal Barddhaman 18 15 20 20 277 4% 88% 70% 86% 68% 4260 71% 5061 99%
West Bengal Birbhum 20 13 16 16 87 3% 88% 68% 84% 60% 2004 45% 2340 92%
West Bengal Dakshin Dinajpur 21 22 23 23 59 3% 86% 61% 81% 60% 953 175% 1329 81%
West Bengal Darjiling 21 45 39 39 166 7% 87% 67% 84% 58% 1496 125% 1673 95%
West Bengal Haora 12 19 26 26 231 7% 85% 68% 82% 62% 2319 38% 2673 98%
West Bengal Hugli 15 17 19 19 140 3% 86% 64% 84% 60% 2360 86% 3115 99%
West Bengal Jalpaiguri 23 30 30 30 309 6% 89% 73% 86% 64% 3615 102% 3883 97%
West Bengal Koch Bihar 14 22 12 12 57 2% 89% 68% 86% 60% 1139 170% 1402 93%
West Bengal Kolkata 9 28 31 31 390 10% 80% 58% 80% 60% 2865 151% 3201 100%
West Bengal Maldah 15 18 19 19 144 4% 88% 65% 85% 64% 2197 44% 2625 87%

TB Annual Report165
State District No (%) of all cured Smear
Positive cases
having end of treatment follow- up
sputum done within 7 days of last dose
No (%) of cases (all
forms of TB) registered receiving
DOT through a community
volunteer
Proportion of all
registered TB cases
with known HIV
status
Proportion of TB
patients known
to be HIV infected among tested
Proportion of TB
patients known
to be HIV infected among
registered
Proportion of HIV
infected TB
patients put on CPT (RT report)
Proportion of HIV
infected TB
patients put on
ART (RT report)
Number of health facilities
registered (Laboratories - Private) in
2013
Number of health facilities
registered (Single clinic -
Private) in 2013
Number of health facilities
registered (Multi-clicnic
- Private) in 2013
Number of patients
notified by (Laboratories - Private) in
2013
Number of
patients notified
by (Single clinic - Private) in 2013
Number of
patients notified
by (Multi-clinic - Private) in 2013
Total cases nofied
by private sector
in 2013
Notification rate per 1,00,000
population (private sector)
Uttarakhand Almora 415 90% 300 41% 57% 1% 0% 0% 100% 0 1 0 0 0 0 0 0.0
Uttarakhand Bageshwar 154 85% 90 33% 30% 1% 0% 0 0 0 0 0 0 0 0.0
Uttarakhand Chamoli 202 77% 233 71% 38% 4% 1% 100% 0% 0 0 0 0 0 0 0 0.0
Uttarakhand Champawat 164 93% 180 65% 83% 0% 0% 0 0 0 0 0 0 0 0.0
Uttarakhand Dehradun 719 86% 1921 76% 65% 2% 1% 88% 88% 1 0 1 19 0 16 35 2.0
Uttarakhand Garhwal 295 71% 527 62% 38% 0% 0% 0% 100% 0 0 0 0 0 0 0 0.0
Uttarakhand Hardwar 1024 88% 1326 63% 64% 1% 0% 55% 55% 0 0 0 0 0 0 0 0.0
Uttarakhand Nainital 408 95% 573 39% 49% 0% 0% 71% 57% 0 0 0 0 0 0 0 0.0
Uttarakhand Pithoragarh 237 82% 265 48% 57% 1% 0% 100% 100% 0 0 0 0 0 0 0 0.0
Uttarakhand Rudraprayag 106 89% 229 74% 68% 2% 0% 0 0 0 0 0 0 0 0.0
Uttarakhand Tehri Garhwal 324 74% 584 82% 52% 1% 1% 0% 80% 0 0 0 0 0 0 0 0.0
Uttarakhand Udhamsingh Nagar 891 98% 1067 49% 67% 1% 0% 100% 100% 0 0 0 0 0 0 0 0.0
Uttarakhand Uttarkashi 180 82% 424 82% 64% 0% 0% 100% 100% 0 0 0 0 0 0 0 0.0
West Bengal Bankura 1890 89% 1192 29% 48% 0% 0% 33% 45% 0 37 48 0 0 0 0 0.0
West Bengal Barddhaman 3149 79% 2767 34% 79% 1% 1% 88% 82% 53 38 134 26 69 41 136 1.7
West Bengal Birbhum 1634 81% 451 12% 37% 1% 0% 50% 50% 90 34 40 0 0 0 0 0.0
West Bengal Dakshin Dinajpur 1003 90% 463 19% 38% 2% 1% 60% 93% 0 0 0 0 0 0 0 0.0
West Bengal Darjiling 1242 91% 1755 54% 49% 4% 2% 92% 90% 14 3 7 0 0 0 0 0.0
West Bengal Haora 1882 91% 1891 41% 80% 2% 2% 88% 59% 0 308 290 0 5 12 17 0.3
West Bengal Hugli 1955 86% 1549 42% 59% 2% 1% 86% 84% 306 8 0 0 0 0 0 0.0
West Bengal Jalpaiguri 2848 94% 957 15% 63% 2% 1% 98% 69% 87 48 21 0 0 0 0 0.0
West Bengal Koch Bihar 1025 86% 343 13% 42% 1% 1% 96% 96% 17 7 20 0 0 0 0 0.0
West Bengal Kolkata 2323 98% 1282 24% 86% 6% 5% 99% 91% 68 260 85 0 19 5 24 0.5
West Bengal Maldah 1937 77% 588 13% 49% 2% 1% 100% 94% 10 30 20 1 0 0 1 0.0

State and District W
ise Annualized Performance 2013
166
State District Population (in lakh)
covered by RNTCP1
No. of suspects examined
Suspects examined per lakh
population
Rate of change in suspects examined per lakh
population
No of Smear positive patients
diagnosed2
Suspects examined per smear
positive case diagnosed
Rate of change in suspects examined
per s+ case diagnosed
Annual Smear
positive case detection rate (from
PMR)
Annual smear
positive case notification rate [from CFR: sm + cases (NSP
+ Rel + TAD) / Pop]
Total patients
registered for
treatment3
Annual total case
notification rate
Annual new smear
positive case notification
rate
West Bengal Medinipur East 52.0 23430 113 10% 1432 16 79% 28 25 2113 41 21
West Bengal Medinipur West 60.7 29259 121 -1% 4117 7 -12% 68 60 6168 102 50
West Bengal Murshidabad 72.5 49046 169 7% 5103 10 8% 70 65 7344 101 55
West Bengal Nadia 52.8 36166 171 0% 2957 12 13% 56 50 4281 81 41
West Bengal North 24 Parganas 102.9 51040 124 -1% 5260 10 25% 51 50 8360 81 40
West Bengal Puruliya 29.9 18778 157 -2% 1742 11 46% 58 55 3048 102 46
West Bengal South 24 Parganas 83.2 39889 120 4% 3888 10 -28% 47 43 5775 69 36
West Bengal Uttar Dinajpur 30.6 14205 116 -3% 1725 8 11% 56 50 2409 79 44
State District Annual new smear
negative case
notification rate
Annual new extra pulmonary
case notification
rate
Annual previously
treated case notification
rate
Annual previously
treated smear
positive case
notification rate
No (%) of pediatric cases out of all New
cases
3 month conversion
rate of new smear
positive patients4
3 month conversion
rate of retreatment
patients4
Treatment Success rate of
new smear positive patients5
Treatment success
rate among smear
positive previously
treated cases5
No (%) of all Smear Positive cases started RNTCP DOTS within 7 days of diagnosis
No (%) of all Smear Positive
cases registered within one month of starting RNTCP DOTS treatment
West Bengal Medinipur East 5 8 7 7 42 2% 86% 62% 81% 60% 1030 208% 1252 92%
West Bengal Medinipur West 17 17 17 17 107 2% 89% 70% 87% 68% 2715 35% 2867 77%
West Bengal Murshidabad 12 18 16 16 265 4% 90% 68% 88% 66% 4065 83% 4864 99%
West Bengal Nadia 9 16 15 15 101 3% 90% 71% 87% 64% 2561 95% 2679 100%
West Bengal North 24 Parganas 7 16 18 18 247 4% 82% 58% 83% 65% 4871 91% 5348 100%
West Bengal Puruliya 27 12 17 17 98 4% 91% 79% 89% 74% 1324 80% 1601 97%
West Bengal South 24 Parganas 8 14 12 12 170 4% 87% 64% 84% 60% 2830 76% 3695 99%
West Bengal Uttar Dinajpur 11 13 11 11 62 3% 86% 66% 84% 63% 1301 83% 1510 96%

TB Annual Report167
State District No (%) of all cured Smear
Positive cases
having end of treatment follow- up
sputum done within 7 days of last dose
No (%) of cases (all
forms of TB) registered receiving
DOT through a community
volunteer
Proportion of all
registered TB cases
with known HIV
status
Proportion of TB
patients known
to be HIV infected among tested
Proportion of TB
patients known
to be HIV infected among
registered
Proportion of HIV
infected TB
patients put on CPT (RT report)
Proportion of HIV
infected TB
patients put on
ART (RT report)
Number of health facilities
registered (Laboratories - Private) in
2013
Number of health facilities
registered (Single clinic -
Private) in 2013
Number of health facilities
registered (Multi-clicnic
- Private) in 2013
Number of patients
notified by (Laboratories - Private) in
2013
Number of
patients notified
by (Single clinic -
Private) in 2013
Number of
patients notified
by (Multi-clinic - Private) in 2013
Total cases nofied
by private sector in 2013
Notification rate per 1,00,000
population (private sector)
West Bengal Medinipur East 755 72% 455 22% 59% 2% 2% 86% 76% 0 0 106 0 0 0 0 0.0
West Bengal Medinipur West 1960 76% 760 14% 41% 1% 1% 72% 81% 0 129 124 0 0 0 0 0.0
West Bengal Murshidabad 3250 84% 1133 22% 73% 1% 1% 95% 87% 3 9 38 0 9 2 11 0.2
West Bengal Nadia 2061 95% 720 17% 83% 2% 1% 74% 56% 42 53 1 0 0 0 0 0.0
West Bengal North 24 Parganas 3995 96% 1961 23% 86% 3% 2% 94% 85% 112 723 173 0 31 0 31 0.3
West Bengal Puruliya 1251 82% 593 19% 61% 0% 0% 46 22 23 18 0 0 18 0.6
West Bengal South 24 Parganas 2583 88% 1577 27% 49% 2% 1% 94% 94% 5 29 35 0 0 0 0 0.0
West Bengal Uttar Dinajpur 1103 86% 345 14% 78% 3% 3% 76% 73% 0 0 0 0 0 0 0 0.0
Summary of performance of Poor & Backward districts 2752.2 1482814 539 5% 178178 8 5% 259 58 269953 98 48 23 10 17 17 10906
Summary of performance of Tribal Districts 566.1 337906 597 1% 44320 8 4% 313 72 73419 130 60 31 18 21 21 3568
Summary of performance of Poor & Backward districts 5% 89% 74% 89% 74% 142781 88% 158905 98% 105863 82% 184928 70% 44% 4% 1% 81% 82%
Summary of performance of Tribal Districts 6% 90% 74% 88% 71% 35701 88% 39640 98% 25482 79% 46652 67% 59% 3% 2% 87% 72%
North Zone 3103.1 1999044 161 -2% 274118 7 2% 88 77 424141 137 60 27 23 27 18 19967
South Zone 2578.0 2090957 203 1% 189478 11 2% 73 60 271245 105 47 21 18 19 14 11343
West Zone 3527.3 2419225 171 9% 273951 9 10% 78 65 427261 121 50 27 19 25 16 20720
East Zone 2793.7 1375010 123 -2% 159343 9 0% 57 50 238391 85 42 17 11 15 9 9196
North-East Zone 468.8 237278 127 -1% 31300 8 3% 67 58 54976 117 47 26 22 22 12 2693
North Zone 6% 90% 75% 89% 75% 217673 90% 237129 98% 177093 88% 225202 58% 44% 2% 1% 62% 79%
South Zone 5% 89% 69% 86% 65% 137483 88% 150704 96% 104461 84% 157357 59% 94% 9% 9% 94% 85%
West Zone 6% 91% 71% 88% 68% 204724 89% 224524 97% 154668 84% 194525 48% 69% 5% 4% 96% 87%
East Zone 5% 88% 69% 87% 69% 121053 85% 138915 97% 89278 81% 137971 59% 52% 2% 1% 64% 76%
North-East Zone 6% 88% 69% 85% 64% 24078 88% 25967 95% 17193 82% 21014 40% 46% 3% 1% 75% 55%
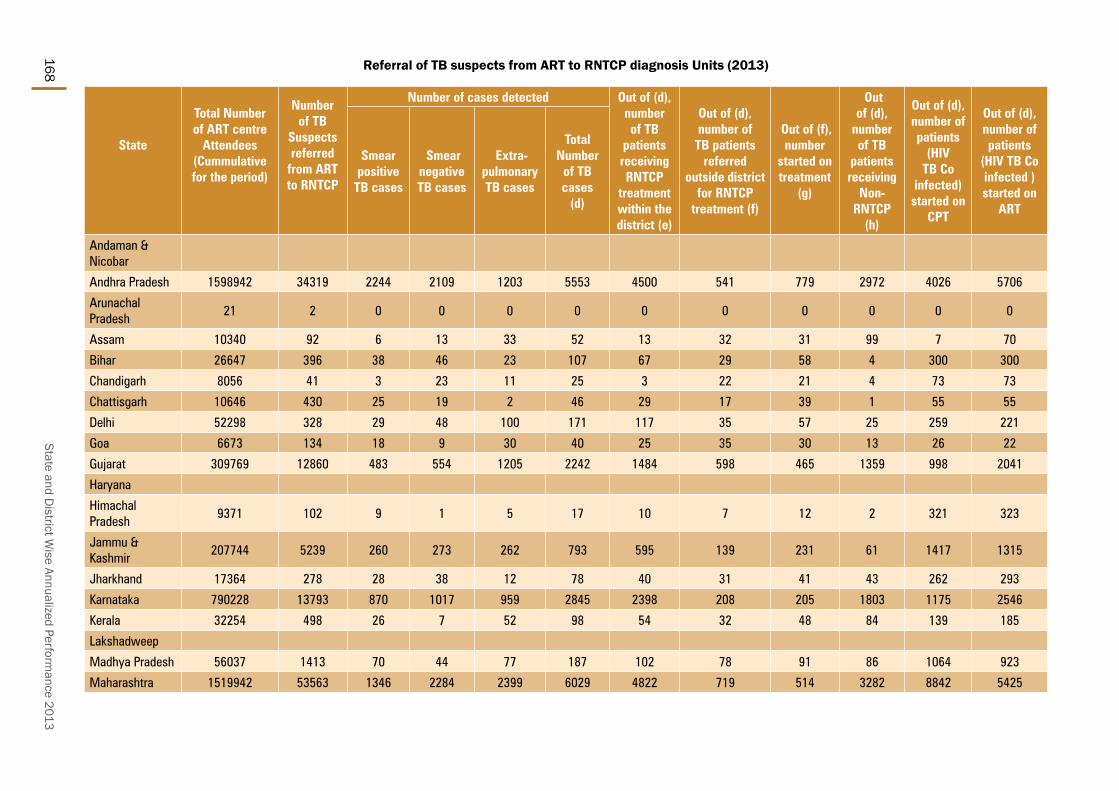
State and District W
ise Annualized Performance 2013
168
State
Total Number of ART centre
Attendees (Cummulative for the period)
Number of TB
Suspects referred
from ART to RNTCP
Number of cases detected Out of (d), number of TB
patients receiving RNTCP
treatment within the district (e)
Out of (d), number of
TB patients referred
outside district for RNTCP
treatment (f)
Out of (f), number
started on treatment
(g)
Out of (d),
number of TB
patients receiving
Non-RNTCP
(h)
Out of (d), number of patients
(HIV TB Co
infected) started on
CPT
Out of (d), number of patients
(HIV TB Co infected ) started on
ART
Smear positive
TB cases
Smear negative TB cases
Extra-pulmonary TB cases
Total Number
of TB cases
(d)
Andaman & Nicobar
Andhra Pradesh 1598942 34319 2244 2109 1203 5553 4500 541 779 2972 4026 5706
Arunachal Pradesh
21 2 0 0 0 0 0 0 0 0 0 0
Assam 10340 92 6 13 33 52 13 32 31 99 7 70
Bihar 26647 396 38 46 23 107 67 29 58 4 300 300
Chandigarh 8056 41 3 23 11 25 3 22 21 4 73 73
Chattisgarh 10646 430 25 19 2 46 29 17 39 1 55 55
Delhi 52298 328 29 48 100 171 117 35 57 25 259 221
Goa 6673 134 18 9 30 40 25 35 30 13 26 22
Gujarat 309769 12860 483 554 1205 2242 1484 598 465 1359 998 2041
Haryana
Himachal Pradesh
9371 102 9 1 5 17 10 7 12 2 321 323
Jammu & Kashmir
207744 5239 260 273 262 793 595 139 231 61 1417 1315
Jharkhand 17364 278 28 38 12 78 40 31 41 43 262 293
Karnataka 790228 13793 870 1017 959 2845 2398 208 205 1803 1175 2546
Kerala 32254 498 26 7 52 98 54 32 48 84 139 185
Lakshadweep
Madhya Pradesh 56037 1413 70 44 77 187 102 78 91 86 1064 923
Maharashtra 1519942 53563 1346 2284 2399 6029 4822 719 514 3282 8842 5425
Referral of TB suspects from ART to RNTCP diagnosis Units (2013)
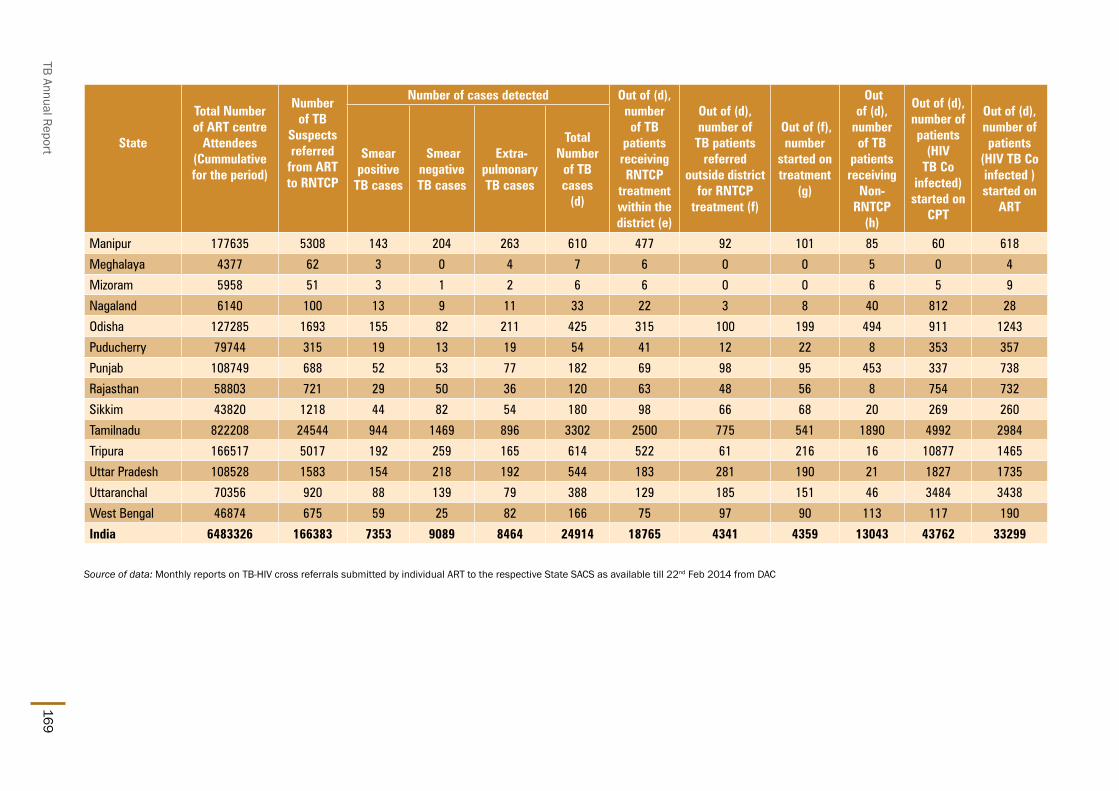
TB Annual Report169
State
Total Number of ART centre
Attendees (Cummulative for the period)
Number of TB
Suspects referred
from ART to RNTCP
Number of cases detected Out of (d), number of TB
patients receiving RNTCP
treatment within the district (e)
Out of (d), number of
TB patients referred
outside district for RNTCP
treatment (f)
Out of (f), number
started on treatment
(g)
Out of (d),
number of TB
patients receiving
Non-RNTCP
(h)
Out of (d), number of patients
(HIV TB Co
infected) started on
CPT
Out of (d), number of patients
(HIV TB Co infected ) started on
ART
Smear positive
TB cases
Smear negative TB cases
Extra-pulmonary TB cases
Total Number
of TB cases
(d)
Manipur 177635 5308 143 204 263 610 477 92 101 85 60 618
Meghalaya 4377 62 3 0 4 7 6 0 0 5 0 4
Mizoram 5958 51 3 1 2 6 6 0 0 6 5 9
Nagaland 6140 100 13 9 11 33 22 3 8 40 812 28
Odisha 127285 1693 155 82 211 425 315 100 199 494 911 1243
Puducherry 79744 315 19 13 19 54 41 12 22 8 353 357
Punjab 108749 688 52 53 77 182 69 98 95 453 337 738
Rajasthan 58803 721 29 50 36 120 63 48 56 8 754 732
Sikkim 43820 1218 44 82 54 180 98 66 68 20 269 260
Tamilnadu 822208 24544 944 1469 896 3302 2500 775 541 1890 4992 2984
Tripura 166517 5017 192 259 165 614 522 61 216 16 10877 1465
Uttar Pradesh 108528 1583 154 218 192 544 183 281 190 21 1827 1735
Uttaranchal 70356 920 88 139 79 388 129 185 151 46 3484 3438
West Bengal 46874 675 59 25 82 166 75 97 90 113 117 190
India 6483326 166383 7353 9089 8464 24914 18765 4341 4359 13043 43762 33299
Source of data:MonthlyreportsonTB-HIVcrossreferralssubmittedbyindividualARTtotherespectiveStateSACSasavailabletill22nd Feb 2014 from DAC

State and District W
ise Annualized Performance 2013
170
Treatment outcom
e among all H
IV infected New
TB cases
StateTotal N
ew Cases
Treatment
SuccessD
iedFailure
TAD
Transfer Out
Switch to
CAT 4
Andaman &
Nicobar
475%
25%0%
0%0%
0%
Andhra Pradesh7435
83%11%
1%4%
0%0%
Arunachal Pradesh1
100%0%
0%0%
0%0%
Assam50
70%14%
2%10%
2%2%
Bihar363
72%15%
2%7%
2%1%
Chandigarh18
72%17%
11%0%
0%0%
Chhattisgarh62
73%26%
0%0%
0%0%
Dadar & Nagar
Haveli1
0%100%
0%0%
0%0%
Daman & Diu
4100%
0%0%
0%0%
0%
Delhi392
83%7%
2%5%
4%0%
Goa79
76%15%
1%6%
0%1%
Gujarat2267
80%11%
1%6%
1%1%
Haryana129
80%12%
3%4%
1%0%
Himachal Pradesh
4180%
15%0%
2%2%
0%
Jamm
u & Kashmir
1567%
0%0%
0%33%
0%
Jharkhand114
78%14%
0%7%
1%0%
Karnataka6094
76%15%
1%7%
1%0%
Kerala307
73%13%
2%7%
5%0%
Lakshadweep
0
Madhya Pradesh
31580%
12%1%
5%3%
0%
Maharashtra
748078%
13%1%
6%1%
1%
Manipur
14181%
5%2%
6%0%
6%
Meghalaya
1100%
0%0%
0%0%
0%
Mizoram
13682%
10%3%
5%0%
0%
Nagaland
10383%
7%4%
4%1%
1%
Orissa355
79%8%
0%11%
1%0%
Pondicherry34
82%3%
0%12%
0%3%
Punjab278
69%15%
2%10%
2%1%
Rajasthan199
78%11%
2%7%
1%2%
Sikkim5
80%0%
20%0%
0%0%
Tamil N
adu3016
80%13%
1%6%
0%0%
Tripura12
92%0%
0%8%
0%0%
Uttar Pradesh404
77%12%
1%7%
1%1%
Uttarakhand36
89%6%
0%6%
0%0%
West Bengal
79077%
12%2%
7%3%
2%
Grand Total30681
79%13%
1%6%
1%0%

TB Annual Report171
Treatment outcom
e among all H
IV infected Re-treatm
ent TB cases
StatesTotal
Retreatment
Cases
Treatment
SuccessD
iedFailure
TAD
Transfer Out
Switch to
CAT 4
Andaman &
Nicobar
Andhra Pradesh2749
76%13%
2%6%
1%1%
Arunachal Pradesh2
0%0%
0%100%
0%0%
Assam15
80%0%
0%20%
0%0%
Bihar313
79%13%
0%5%
3%0%
Chandigarh13
77%23%
0%0%
0%0%
Chhattisgarh11
73%18%
9%0%
0%0%
Dadar & Nagar
Haveli1
100%0%
0%0%
0%0%
Daman & Diu
2100%
0%0%
0%0%
0%
Delhi346
84%7%
1%4%
2%1%
Goa26
58%23%
0%19%
0%0%
Gujarat1106
72%15%
2%10%
1%1%
Haryana98
76%13%
2%7%
1%1%
Himachal Pradesh
2879%
29%7%
7%4%
0%
Jamm
u & Kashmir
771%
0%0%
0%14%
14%
Jharkhand96
78%11%
0%7%
1%2%
Karnataka2293
67%18%
3%10%
2%1%
Kerala149
63%18%
3%9%
5%2%
Lakshadweep
Madhya Pradesh
14071%
13%1%
6%7%
2%
Maharashtra
438772%
15%1%
9%2%
1%
Manipur
4379%
7%2%
2%7%
2%
Meghalaya
30%
33%33%
33%0%
0%
Mizoram
9681%
10%2%
5%0%
1%
Nagaland
8877%
8%2%
5%6%
2%
Orissa199
67%14%
1%17%
1%2%
Pondicherry7
43%43%
0%0%
0%14%
Punjab226
70%16%
2%9%
3%0%
Rajasthan204
79%14%
0%5%
1%0%
Sikkim
Tamil N
adu1972
79%12%
1%8%
0%1%
Tripura4
25%25%
0%0%
0%50%
Uttar Pradesh218
71%15%
2%5%
6%2%
Uttarakhand21
67%19%
10%0%
0%5%
West Bengal
36769%
14%4%
10%2%
1%
Total15230
73%14%
2%8%
2%1%

State and District W
ise Annualized Performance 2013
172
Perfomance of the R
NTCP certified laboratories- January-Septem
ber 2013
Diagnostic Culture
Followup
culture Solid D
ST Processed
LPA D
ST done
Liquid D
ST Done
Total H+R
SensTotal H+
R Res
Total H only Res
Total R only Res
10131279023
95572362
72448392
107357259
3226
IndicatorN
umerator
Denom
inator Percentage
Specimens (all) received w
ithin 7 days of sputum collection (w
ith CPC)n/a
n/an/a
Specimens (all) received w
ithin 72 hours of sputum collection in 4-8 C (w
ithout CPC*)
174549222817
78.3
Num
ber of specimen rejected at the lab due to various reason(eg. Leakage,
inadequate quantity, etc)3911
1829852.1
Specimens (all) w
ith cultures reported as Mtb. com
plex 18780
10777417.4
Smear-positive diagnostic specim
ens reported as culture-positive 5077
1534033.1
Specimens (all) w
ith culture-contaminated results
624886754
7.2
Specimens (all) w
ith culture results reported as NTM
2677
813143.3
Patients (with diagnostic specim
ens) with DST com
pleted within the
benchmark turn-around tim
e 46811
5560284.2
Patients (all) with final culture results reported to providers w
ithin 1 days of declaration of result
6219370094
88.7
Patients with final DST results reported to providers w
ithin 1 days of declaration of result
4174645655
91.4
Num
ber and Percentage of invalid LPA results6685
4401815.2
Num
ber of events of LPA contamination in the quarter
10514022
0.7
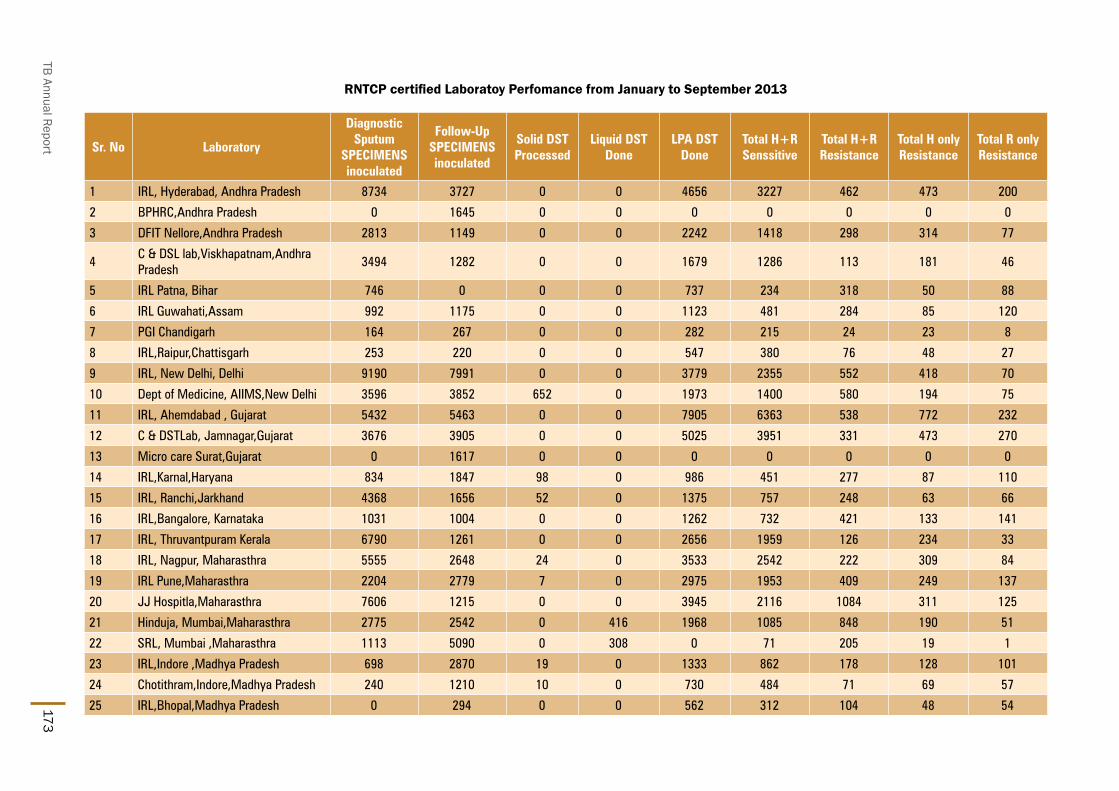
TB Annual Report173
RNTCP certified Laboratoy Perfomance from January to September 2013
Sr. No Laboratory
Diagnostic Sputum
SPECIMENS inoculated
Follow-Up SPECIMENS inoculated
Solid DST Processed
Liquid DST Done
LPA DST Done
Total H+R Senssitive
Total H+R Resistance
Total H only Resistance
Total R only Resistance
1 IRL, Hyderabad, Andhra Pradesh 8734 3727 0 0 4656 3227 462 473 200
2 BPHRC,Andhra Pradesh 0 1645 0 0 0 0 0 0 0
3 DFIT Nellore,Andhra Pradesh 2813 1149 0 0 2242 1418 298 314 77
4C & DSL lab,Viskhapatnam,Andhra Pradesh
3494 1282 0 0 1679 1286 113 181 46
5 IRL Patna, Bihar 746 0 0 0 737 234 318 50 88
6 IRL Guwahati,Assam 992 1175 0 0 1123 481 284 85 120
7 PGI Chandigarh 164 267 0 0 282 215 24 23 8
8 IRL,Raipur,Chattisgarh 253 220 0 0 547 380 76 48 27
9 IRL, New Delhi, Delhi 9190 7991 0 0 3779 2355 552 418 70
10 Dept of Medicine, AIIMS,New Delhi 3596 3852 652 0 1973 1400 580 194 75
11 IRL, Ahemdabad , Gujarat 5432 5463 0 0 7905 6363 538 772 232
12 C & DSTLab, Jamnagar,Gujarat 3676 3905 0 0 5025 3951 331 473 270
13 Micro care Surat,Gujarat 0 1617 0 0 0 0 0 0 0
14 IRL,Karnal,Haryana 834 1847 98 0 986 451 277 87 110
15 IRL, Ranchi,Jarkhand 4368 1656 52 0 1375 757 248 63 66
16 IRL,Bangalore, Karnataka 1031 1004 0 0 1262 732 421 133 141
17 IRL, Thruvantpuram Kerala 6790 1261 0 0 2656 1959 126 234 33
18 IRL, Nagpur, Maharasthra 5555 2648 24 0 3533 2542 222 309 84
19 IRL Pune,Maharasthra 2204 2779 7 0 2975 1953 409 249 137
20 JJ Hospitla,Maharasthra 7606 1215 0 0 3945 2116 1084 311 125
21 Hinduja, Mumbai,Maharasthra 2775 2542 0 416 1968 1085 848 190 51
22 SRL, Mumbai ,Maharasthra 1113 5090 0 308 0 71 205 19 1
23 IRL,Indore ,Madhya Pradesh 698 2870 19 0 1333 862 178 128 101
24 Chotithram,Indore,Madhya Pradesh 240 1210 10 0 730 484 71 69 57
25 IRL,Bhopal,Madhya Pradesh 0 294 0 0 562 312 104 48 54

State and District W
ise Annualized Performance 2013
174
Sr. No Laboratory
Diagnostic Sputum
SPECIMENS inoculated
Follow-Up SPECIMENS inoculated
Solid DST Processed
Liquid DST Done
LPA DST Done
Total H+R Senssitive
Total H+R Resistance
Total H only Resistance
Total R only Resistance
26 RMRC Jabalpur,Madhya Pradesh 74 526 28 0 513 321 115 46 59
27 IRL Cuttack, Odhisa 1061 634 0 0 1061 675 99 98 22
28 IRL Puducherry 1256 342 0 0 1009 784 69 123 16
29 RMRC, Port Blair 956 248 25 0 734 521 48 119 23
30 IRL Ajmer, Rajasthan 2458 4567 25 0 4275 3010 408 428 206
31 SMS,Jaipur,Rajasthan 10082 6559 15 0 6168 4579 546 614 301
32 IRL,Lucknow,Uttar Pradesh 6141 1413 0 0 2894 1614 595 547 138
33 IRL Dehradun,Uttarkhand 1097 818 0 0 1084 493 301 109 74
34 IRL,Chennai,Tamilnadu 2388 1533 0 0 990 723 93 100 44
35 CMC,Vellore, Tamilnadu 2072 1046 0 0 547 418 37 47 22
36 IRL, Kolkata West Bengal 770 1426 0 0 332 41 149 37 37
37 SRL,Kolkata, West Bengal 404 2687 0 0 1069 347 425 86 96
38 IRL Dharampur 249 311 0 0 350 202 61 27 21
39 Nazerath Hospital 0 0 0 0 63 30 20 7 4
Total 101312 78819 955 724 72362 48392 10735 7259 3236

TB Annual Report175
PMDT Implementation, Diagnosis, 6 months interim, 12 months Culture Conversion and Treatment Outcome of MDR TB Case (Reported by DR-TB Centres ofImplementing States-2013)
State
Indicators on Coverage of MDR TB Services Indicators on MDR TB Case Finding Indicators on 6 months interim report
Total Population (In lacs)
Total number
of districts
Number of districts
implementing PMDT
services
Population of districts
implementing PMDT
services (in lacs)
% population
with access to MDR TB services
under RNTCP
Number of DR TB Centres
functional in the state
Estimated number of MDRTB
suspects in Criteria
C
Number of MDR TB Suspects subjected to C-DST
Proportion of MDRTB suspects
as per Criteria C subjected
to DST
Number of MDR
TB Cases detected
Number of MDR
TB Cases detected that were registered
and initiated on treatment
#
Number of XDR
TB Cases detected that were registered
and initiated on treatment in 3Q12 #
Number of MDR TB Case
registered and
initiated on Cat IV in the 4 cohorts
6-9 months prior (2q12 to 1q13) (a)
Out of a, No. (%) who are alive, on
treatment and culture
negative
Out of a, No. (%)
who died
Out of a, No. (%) who
defaulted
Andaman & Nicobar
4 1 1 4 100% 1 210 75 36% 16 21 0 8 6 75% 1 13% 0 0%
Andhra Pradesh 853 24 24 853 100% 8 44566 23524 53% 1893 1625 11 1353 839 62% 163 12% 154 11%
Arunachal Pradesh
14 14 14 14 100% 2 916 707 77% 136 172 0 140 113 81% 3 2% 14 10%
Assam 316 24 24 316 100% 3 10075 1646 16% 362 384 3 274 152 55% 28 10% 27 10%
Bihar 1061 38 38 1061 100% 3 22665 1288 6% 530 508 0 226 151 67% 27 12% 11 5%
Chandigarh^ 11 1 1 11 100% 1 832 819 98% 56 41 0 68 47 69% 10 15% 0 0%
Chhattisgarh 260 18 18 260 100% 2 4630 890 19% 122 127 0 51 18 35% 3 6% 4 8%
Delhi^ 170 26 26 170 100% 4 18048 11688 65% 1456 1281 86 1629 999 61% 133 8% 217 13%
Goa 15 2 2 15 100% 1 684 471 69% 45 42 1 34 24 71% 2 6% 1 3%
Gujarat*^ (+DD&DNH)
620 33 33 620 100% 4 35133 26082 74% 1971 1660 91 1856 959 52% 212 11% 204 11%
Haryana 258 21 21 258 100% 1 17821 1494 8% 495 454 6 210 135 64% 22 10% 14 7%
Himachal Pradesh
69 12 12 69 100% 2 5315 1460 27% 257 248 1 125 56 45% 16 13% 4 3%
Jammu & Kashmir
128 14 14 128 100% 3 3634 933 26% 109 129 0 97 63 65% 10 10% 6 6%
Jharkhand 337 24 24 337 100% 2 8268 2509 30% 328 258 0 189 107 57% 17 9% 10 5%
Karnataka 619 31 31 619 100% 5 28936 2624 9% 780 708 5 288 151 52% 42 15% 19 7%
Kerala (+LK)^ 336 15 15 336 100% 2 5910 6899 117% 213 220 14 252 150 60% 26 10% 21 8%
Madhya Pradesh 739 50 50 739 100% 3 25219 5213 21% 938 827 0 456 297 65% 53 12% 43 9%
Maharashtra^ 1139 78 78 1139 100% 15 57892 32235 56% 5306 4690 114 4042 2054 51% 459 11% 403 10%
Manipur 28 9 9 28 100% 1 745 145 19% 66 56 0 35 29 83% 2 6% 2 6%
Meghalaya 30 7 7 30 100% 2 1703 497 29% 157 134 2 124 65 52% 11 9% 10 8%
Mizoram^ 11 8 8 11 100% 1 732 153 21% 31 29 0 51 36 71% 5 10% 5 10%

State and District W
ise Annualized Performance 2013
176
State
Indicators on 12 months Culture Conversion Report Indicators on Treatment Outcome of MDR TB Cases
Number of MDR
TB cases registered
in the 4 cohorts, 12-15 months prior (4q11 to 3q12) (b)
Out of b, No. (%) who are alive, on
treatment and culture
negative
Out of b, No. (%) who are alive, on
treatment and culture positive
Out of b, No. (%) who are alive, on
treatment and culture not
known
Out of b, No. (%) who
died
Out of b, No. (%) who
defaulted
Number of MDR
TB cases registered
in the 4 cohorts, 31-33 months prior (3q10 to 2q11) (c)
Out of c, No.
reported as Cured
Out of c, No. reported as Treatment Completed
Out of c, Success
Rate
Out of c, No. (%) who died
Out of c, No. (%) who
defaulted
Out of c, No. (%)
who failed treatment
Andaman & Nicobar 7 4 57% 0 0% 2 29% 0 0% 1 14%
Andhra Pradesh 954 503 53% 115 12% 65 7% 187 20% 152 16% 331 162 21 55% 67 20% 57 17% 17 5%
Arunachal Pradesh 79 60 76% 1 1% 2 3% 5 6% 9 11%
Assam 85 56 66% 6 7% 1 1% 9 11% 9 11%
Bihar 73 41 56% 10 14% 1 1% 15 21% 5 7%
Chandigarh^ 39 32 82% 2 5% 0 0% 6 15% 1 3%
Chhattisgarh 27 12 44% 2 7% 6 22% 2 7% 3 11%
Delhi^ 1546 876 57% 54 3% 88 6% 188 12% 262 17% 400 175 36 53% 66 17% 83 21% 12 3%
Goa 31 15 48% 6 19% 3 10% 5 16% 1 3%
Gujarat*^ (+DD&DNH) 1491 605 41% 144 10% 188 13% 279 19% 235 16% 614 201 43 40% 173 28% 114 19% 63 10%
Haryana 119 67 56% 5 4% 12 10% 23 19% 12 10% 55 19 8 49% 17 31% 2 4% 9 16%
Himachal Pradesh 76 36 47% 6 8% 23 30% 7 9% 2 3% 24 1 8 38% 7 29% 2 8% 0 0%
Jammu & Kashmir 41 26 63% 2 5% 3 7% 7 17% 1 2%
Jharkhand 86 28 33% 8 9% 25 29% 11 13% 10 12% 13 4 0 31% 4 31% 1 8% 4 31%
Karnataka 91 28 31% 3 3% 19 21% 18 20% 11 12%
Kerala (+LK)^ 295 163 55% 15 5% 43 15% 32 11% 31 11% 130 53 31 65% 16 12% 18 14% 5 4%
Madhya Pradesh 273 161 59% 26 10% 4 1% 47 17% 35 13%
Maharashtra^ 2495 1084 43% 223 9% 233 9% 422 17% 363 15% 334 95 40 40% 75 22% 79 24% 14 4%
Manipur 22 14 64% 1 5% 0 0% 2 9% 3 14%
Meghalaya 71 39 55% 8 11% 12 17% 6 8% 5 7%
Mizoram^ 28 15 54% 4 14% 0 0% 3 11% 4 14%

TB Annual Report177
State
Indicators on Coverage of MDR TB Services Indicators on MDR TB Case Finding Indicators on 6 months interim report
Total Population (In lacs)
Total number
of districts
Number of districts
implementing PMDT
services
Population of districts
implementing PMDT
services (in lacs)
% population
with access to MDR TB services
under RNTCP
Number of DR TB Centres
functional in the state
Estimated number of MDRTB
suspects in Criteria
C
Number of MDR TB Suspects subjected to C-DST
Proportion of MDRTB suspects
as per Criteria C subjected
to DST
Number of MDR
TB Cases detected
Number of MDR
TB Cases detected that were registered
and initiated on treatment
#
Number of XDR
TB Cases detected that were registered
and initiated on treatment in 3Q12 #
Number of MDR TB Case
registered and
initiated on Cat IV in the 4 cohorts
6-9 months prior (2q12 to 1q13) (a)
Out of a, No. (%) who are alive, on
treatment and culture
negative
Out of a, No. (%) who
died
Out of a, No. (%) who
defaulted
Nagaland 20 11 11 20 100% 1 1299 633 49% 75 76 0 57 43 75% 3 5% 1 2%
Orissa 424 31 31 424 100% 2 10706 1998 19% 250 206 7 147 72 49% 9 6% 5 3%
Puducherry^ 13 1 1 13 100% 1 449 498 111% 19 18 0 29 20 69% 5 17% 3 10%
Punjab 280 20 20 280 100% 3 14896 5095 34% 515 461 0 363 222 61% 42 12% 52 14%
Rajasthan^ 699 34 34 699 100% 7 33586 18943 56% 2131 1834 0 2197 1284 58% 197 9% 224 10%
Sikkim^ 6 4 4 6 100% 1 545 448 82% 211 185 2 111 87 78% 4 4% 9 8%
Tamil Nadu^ 732 31 31 732 100% 5 26985 21857 81% 1548 1224 0 978 554 57% 94 10% 86 9%
Tripura 37 4 4 37 100% 1 595 41 7% 15 17 0 19 14 74% 2 11% 2 11%
Uttar Pradesh 2032 74 74 2032 100% 6 77882 4046 5% 1781 1668 5 180 99 55% 30 17% 13 7%
Uttarakhand 103 13 13 103 100% 1 5543 795 14% 208 176 0 135 113 84% 3 2% 0 0%
West Bengal 923 19 19 923 100% 5 29688 5315 18% 1269 1284 16 1025 742 72% 70 7% 91 9%
India 12285 692 692 12285 100% 99 496108 181021 36% 23289 20763 364 16749 9701 58% 1704 10% 1655 10%

State and District W
ise Annualized Performance 2013
178
State
Indicators on 12 months Culture Conversion Report Indicators on Treatment Outcome of MDR TB Cases
Number of MDR
TB cases registered
in the 4 cohorts, 12-15 months prior (4q11 to 3q12) (b)
Out of b, No. (%) who are alive, on
treatment and culture
negative
Out of b, No. (%) who are alive, on
treatment and culture positive
Out of b, No. (%) who are alive, on
treatment and culture not
known
Out of b, No. (%) who
died
Out of b, No. (%) who
defaulted
Number of MDR
TB cases registered
in the 4 cohorts, 31-33 months prior (3q10 to 2q11) (c)
Out of c, No.
reported as Cured
Out of c, No. reported as Treatment Completed
Out of c, Success
Rate
Out of c, No. (%) who died
Out of c, No. (%) who
defaulted
Out of c, No. (%)
who failed treatment
Nagaland 22 17 77% 1 5% 0 0% 3 14% 1 5%
Orissa 110 58 53% 15 14% 17 15% 12 11% 3 3% 51 22 12 67% 7 14% 1 2% 5 10%
Puducherry^ 19 15 79% 1 5% 0 0% 3 16% 0 0% 1 0 0 0% 1 100% 0 0% 0 0%
Punjab 182 103 57% 15 8% 6 3% 24 13% 29 16%
Rajasthan^ 1659 780 47% 100 6% 227 14% 256 15% 254 15% 189 88 12 53% 44 23% 29 15% 12 6%
Sikkim^ 37 24 65% 2 5% 0 0% 0 0% 5 14%
Tamil Nadu^ 410 198 48% 29 7% 55 13% 66 16% 56 14% 143 42 10 36% 39 27% 28 20% 2 1%
Tripura 13 10 77% 1 8% 0 0% 2 15% 0 0%
Uttar Pradesh 67 29 43% 7 10% 7 10% 15 22% 8 12% 15 4 2 40% 7 47% 1 7% 1 7%
Uttarakhand 56 40 71% 6 11% 0 0% 8 14% 2 4%
West Bengal 526 351 67% 27 5% 21 4% 67 13% 53 10% 230 109 16 54% 46 20% 37 16% 17 7%
India 11030 5490 50% 845 8% 1063 10% 1730 16% 1566 14% 2530 975 239 48% 569 22% 452 18% 161 6%
* Data from Daman-Diu & Dadra Nagar Haveli is included in Gujarat; Data from Lakshadweep is included in Kerala# These numbers are NOT from the same cohort of patients from which MDR diagnosed are reported, but rather from treatment initiation registers only. The current PMDT information system does not allow for cohort-based reporting of MDR TB
suspects, hence this should not yet be taken as a proportion of MDR TB diagnosed and used as an indicator for efficiency of initiation on treatment. Future versions of the PMDT reporting system will be based on cohorts of patients tested in laboratories, and will be used for monitoring of timeliness and efficiency of diagnosis and initiation on treatment
^ numerator includes smear negative retreatment cases registered in the district

TB Annual Report179

State and District W
ise Annualized Performance 2013
180

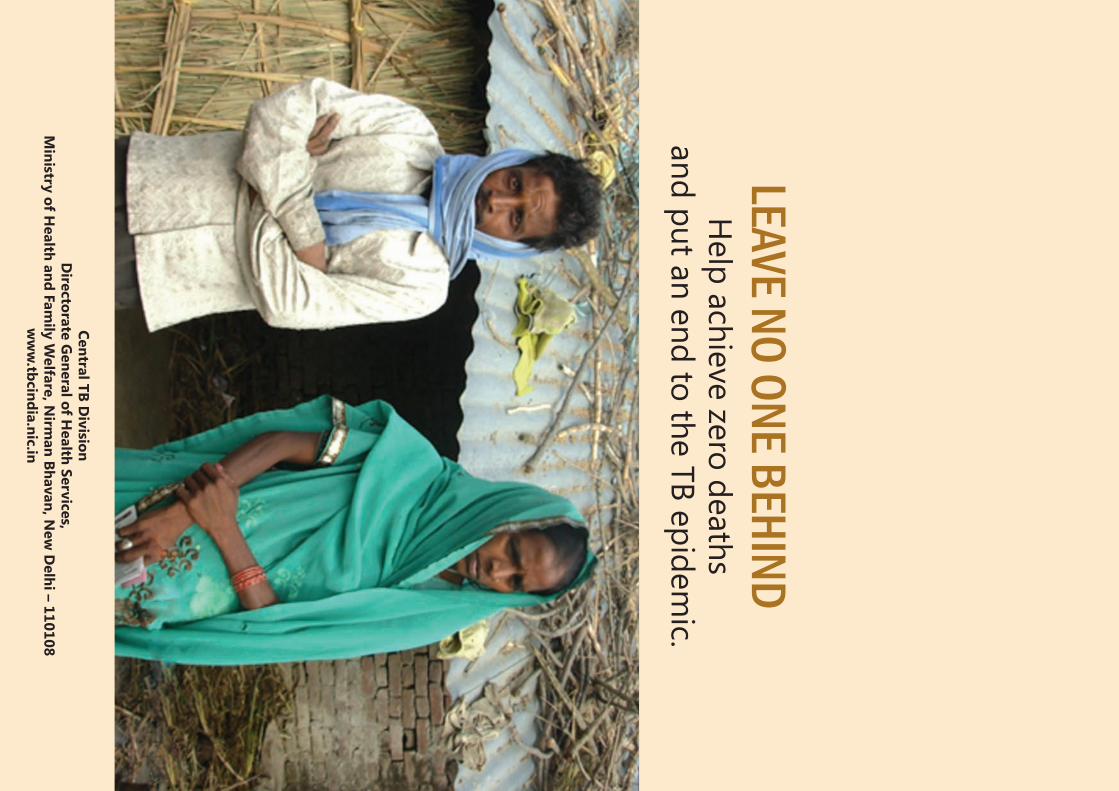
LEAVE NO
ON
E BEH
IND
Help
ach
ieve
zero
death
s an
d p
ut a
n e
nd
to th
e T
B e
pid
em
ic.
Cen
tral T
B D
ivisio
nD
irecto
rate
Gen
era
l of H
ealth
Serv
ices,
Min
istry o
f Health
an
d Fa
mily
Welfa
re, N
irman
Bh
avan
, New
Delh
i – 11
01
08
ww
w.tb
cind
ia.n
ic.in
Related Documents