National Institute for Health and Care Excellence Final Physical activity and the environment update Effectiveness and cost effectiveness Evidence review 1: public transport NICE guideline NG90 Evidence reviews March 2018 Final These evidence reviews were developed by NICE

Welcome message from author
This document is posted to help you gain knowledge. Please leave a comment to let me know what you think about it! Share it to your friends and learn new things together.
Transcript
National Institute for Health and Care Excellence
Final
Physical activity and the environment update Effectiveness and cost effectiveness Evidence review 1: public transport
NICE guideline NG90
Evidence reviews
March 2018
Final
These evidence reviews were developed by NICE

Error! No text of specified style in document.
Disclaimer
The recommendations in this guideline represent the view of NICE, arrived at after careful consideration of the evidence available. When exercising their judgement, professionals are expected to take this guideline fully into account, alongside the individual needs, preferences and values of their patients or service users. The recommendations in this guideline are not mandatory and the guideline does not override the responsibility of healthcare professionals to make decisions appropriate to the circumstances of the individual patient, in consultation with the patient and/or their carer or guardian.
Local commissioners and/or providers have a responsibility to enable the guideline to be applied when individual health professionals and their patients or service users wish to use it. They should do so in the context of local and national priorities for funding and developing services, and in light of their duties to have due regard to the need to eliminate unlawful discrimination, to advance equality of opportunity and to reduce health inequalities. Nothing in this guideline should be interpreted in a way that would be inconsistent with compliance with those duties.
NICE guidelines cover health and care in England. Decisions on how they apply in other UK countries are made by ministers in the Welsh Government, Scottish Government, and Northern Ireland Executive. All NICE guidance is subject to regular review and may be updated or withdrawn.
Copyright
© NICE 2018. All rights reserved. Subject to Notice of rights.
ISBN: 978-1-4731-2891-0
Evidence review 1
4
Contents
1. Introduction .................................................................................................................. 5
2. Methods ........................................................................................................................ 5
2.1. Review questions .................................................................................................. 5
2.2. Searching, screening, quality assessment and data extraction .............................. 6
3. Results .......................................................................................................................... 9
3.1. Flow of literature through the review ...................................................................... 9
Characteristics of the included studies ........................................................................... 11
3.2. Review findings ................................................................................................... 15
4. Discussion .................................................................................................................. 29
Strengths and limitations of the review ......................................................................... 29
Adverse effects ............................................................................................................. 29
Applicability .................................................................................................................. 30
Gaps in the evidence .................................................................................................... 30
5. Evidence Statements ................................................................................................. 31
6. References for Review 1 included studies ............................................................... 36
Evidence review 1
5
1. Introduction
A review of NICE guideline PH8 on physical activity and the environment identified that
some sections of the guideline were in need of update as new evidence was available (see
review decision). The update also has a particular focus on those who are less able to be
physically active (see scope).
The update focuses on interventions in the following environments:
“Built environment” including roads, pavements, the external areas of buildings and open
'grey' space, such as urban squares and pedestrianised areas.
“Natural environment”, including 'green' and 'blue' spaces. Green spaces include: urban
parks, open green areas, woods and forests, coastland and countryside, and paths and
routes connecting them. Blue spaces include: the sea, lakes, rivers and canals.
A series of evidence reviews was undertaken to support the guideline development. This
evidence review focuses on the effectiveness and cost effectiveness of public transport
interventions.
2. Methods
This review was conducted according to the methods guidance set out in ‘Developing NICE
guidelines: the manual’ (October 2014).
2.1. Review questions
1 Which interventions in the built or natural environment are effective and cost-
effective at increasing physical activity among the general population?
1.1 Which transport interventions are effective and cost effective?
1.2 Which interventions related to the design and accessibility of public open
spaces in the built and natural environment are effective and cost effective?
2 Does the effectiveness and cost effectiveness of these interventions vary for
different population groups (particularly those less able to be physically active)?
3 Are there any adverse or unintended effects?
3.1 How do these vary for different population groups (particularly those less
able to be physically active)?
3.2 How can they be minimised?
4 Who needs to be involved to ensure interventions are effective and cost effective
for everyone?
Evidence review 1
6
5 What factors ensure that interventions are acceptable to all groups?
Any available evidence relating to the cost effectiveness of interventions was also included
in this review. The full economic analysis is presented separately.
2.2. Searching, screening, quality assessment and data
extraction
Searching
Two systematic searches of relevant databases were conducted (one largely covering
transport interventions and the other open spaces) from 22 to 24 June 2016. Two separate
searches were carried out because although the two areas shared some outcomes, others
were specific to either transport interventions or open spaces. A search of websites was
conducted from 1 to 5 August 2016 to identify relevant evidence for this review (see
Appendix 3).
PH8 searches were conducted in 2006, and included all relevant publications up to that
point. For this update guideline, sources were searched from 2006 to June 2016. The
decision was made not to revisit evidence included in PH8 because public health is a fast-
moving area and the context in which recommendations are being implemented has
changed significantly since 2006. This was for several reasons;
The Surveillance report and update decision for PH8 stated that no evidence had been
identified suggesting that any of the existing recommendations should be reversed, but
that new evidence suggested that recommendations could be updated and strengthened.
The search strategies for PH8 did not exclude interventions targeted at people with
limited mobility. It is therefore expected that any interventions targeted at people with
limited mobility prior to 2006 would have been captured by PH8.
Review protocol
The protocol outlines the methods for the review, including the search protocols and
methods for data screening, quality assessment and synthesis (see Appendix 3). To note:
During title/abstract screening, two exclusion codes were used - ‘weed out’ and ‘non-
comparative studies’. Non comparative studies included cross-sectional surveys and
correlation studies.
Qualitative studies were only included if they were UK-based AND linked to an
intervention of interest as outlined in the review protocols. If few effectiveness or
Evidence review 1
7
intervention-linked qualitative studies were included the committee agreed to consider
UK-based qualitative studies that were not linked to an intervention of interest
Systematic reviews of interventions of interest were not included but the reference lists of
18 relevant systematic reviews were checked. Twenty three studies were identified via
this method and were screened at title and abstract. Full papers were ordered for 7
studies. Of these, 4 were included as evidence for this guideline.
Modelling studies (that were not economic modelling studies) were excluded.
Cost benefit studies which only included (or included majority) ‘prospective’ or
‘hypothetical’ costs were also excluded. Any studies of this type were forwarded to the
modelling team at the Economic and Methods Unit (EMU) for information.
As agreed at PHAC 0 the following were considered out of scope: interventions involving
school playgrounds and interventions involving “fitness zones” in parks. Interventions
involving school playgrounds were excluded as they were noted as being accessible
usually only by pupils at the school and during school hours, as opposed to being
accessible by the public in general. Fitness zones were excluded as they were
considered to be equipment that people may choose to use to change their behaviour at
an individual level, rather than an environmental intervention.
Screening
All references from the two database searches were screened on title and abstract by a
single reviewer against the criteria set out in the protocol. A random sample of 10% of titles
and abstracts was screened independently by a second reviewer, with differences resolved
by discussion. Agreement at this stage was 95% for the transport database and 94% for the
open space database. Full-text screening was carried out by a single reviewer and a second
reviewer independently screened 10% of all full-text papers. Agreement at this stage was
100% for the transport database papers. Agreement at this stage was 83% for the open
space papers – the 2 mismatched papers were resolved. Reasons for exclusion at full paper
stage were recorded (see below and Appendix 3).
In addition to the database search, a search of websites identified 259 documents or sites
containing potentially relevant information. Each of these documents or sites were
considered by one reviewer and potential includes checked by a second.
Data Extraction
Each included study was data extracted by one reviewer, with all data checked in detail by a
second reviewer. Any differences were resolved by discussion between the reviewers.
Evidence review 1
8
Where data are reported effect sizes, means, standard deviations and 95% confidence
intervals have been included. In all instances the most complete data available have been
presented in the review findings and evidence statements. For Evidence Statements, please
see below.
Quality Assessment
Included studies were rated individually to indicate their quality, based on assessment using
a checklist. Each included study was assessed by one reviewer and checked by another.
Any differences in quality rating were resolved by discussion. The tools used to assess the
quality of studies and summaries of the QA results of all included studies are documented in
Appendix 3. The quality ratings used were:
++ No risk of bias: All or most of the checklist criteria have been fulfilled, and where they have not been fulfilled the conclusions are very unlikely to alter.
+ Low risk of bias: Some of the checklist criteria have been fulfilled, and where they have not been fulfilled, or are not adequately described, the conclusions are unlikely to alter.
– High risk of bias: Few or no checklist criteria have been fulfilled and the conclusions are likely or very likely to alter.
Presentation of Evidence
Each included study is summarised in narrative format. This contains information on
research design, setting, quality assessment and results as relevant to each review.
In addition:
GRADE (Grading of Recommendations Assessment, Development and Evaluation) was
used to synthesise and present the outcomes from quantitative studies, of which there
were 17 for this Review. These are presented as Evidence Statements.
Qualitative evidence was considered disparate and sparse for this review, with only two
studies. Studies are therefore summarised by presentation of their key themes. These are
presented in Evidence Statements.
Cost effectiveness studies, of which there are none for this review, would have been
summarised by key findings, presented as Evidence Statements.
GRADE
Evidence review 1
9
GRADE was used to appraise and present the quality of the outcomes reported in included
studies – see Appendix 4 for full GRADE tables for Review 1 by outcome. This approach
considers the risk of bias, consistency, directness, and precision of the studies reporting on
a particular outcome. Critical outcomes for GRADE were the primary outcomes listed in the
scope. Important outcomes were the secondary outcomes listed in the scope. (For more
details about GRADE, see Appendix H of the NICE Methods Manual (2014) and the GRADE
working group website). The quality ratings used to assess the evidence base were: high,
moderate, low and very low. Appraisal of the evidence using GRADE methodology starts
from ‘Low’ for evidence derived from observational studies.
Evidence Statements for Review 1 are presented below. For studies of effectiveness, quality
of evidence was appraised using GRADE. Evidence statements for qualitative and economic
studies were constructed using quality appraisal tools in line with the NICE manual.
3. Results
3.1. Flow of literature through the review
A total of 71 studies met the inclusion criteria for the evidence reviews to support the
guideline on physical activity and the environment.
Of these 71, 60 studies were identified from two searches of databases for transport and
open space interventions. An additional 1 paper was provided to NICE on an academic in
confidence basis, 1 was identified through citation searching and 4 from systematic review
included studies. From the website search, 4 new studies were identified that met the review
inclusion criteria (one on public transport (included in this review), one on parks, one multi-
component, one on cycling infrastructure). One was identified during final searches after
development. Figures 1 and 2 below show the flow of literature through the review. [To note
that there are 16 final includes which are duplicated across the two databases, hence the
total number of studies from the two flow charts is more than 71].
Evidence review 1
10
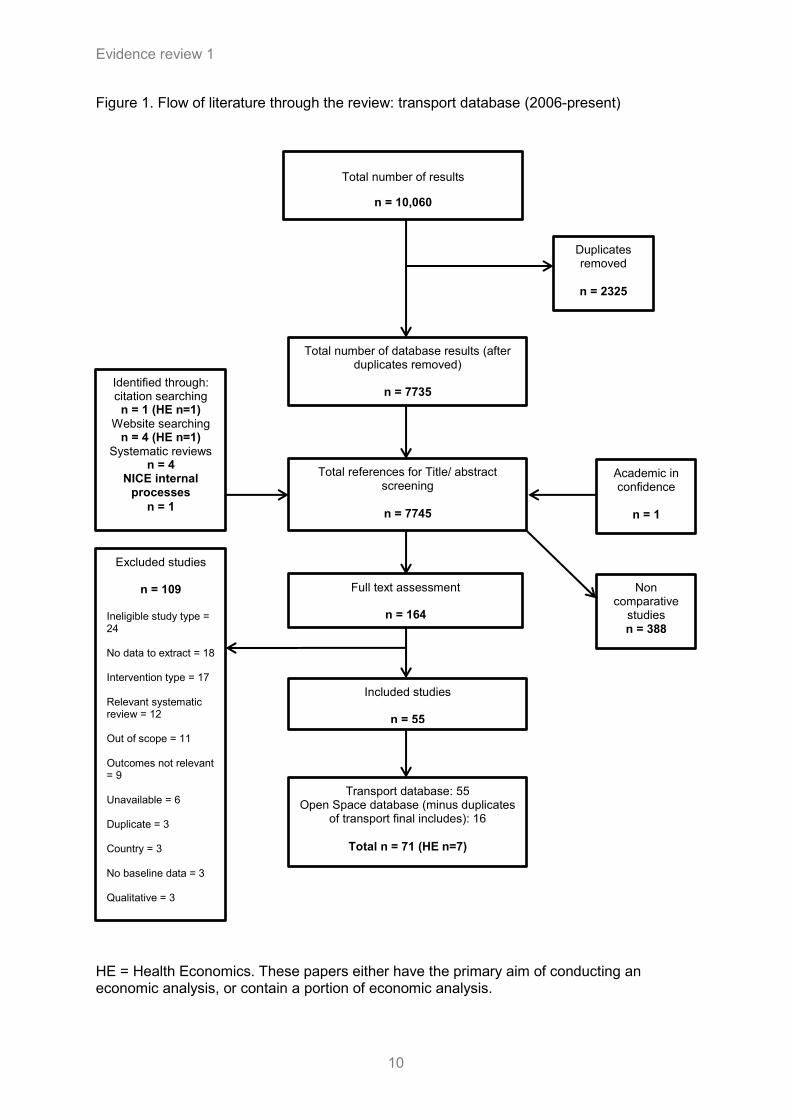
Figure 1. Flow of literature through the review: transport database (2006-present)
HE = Health Economics. These papers either have the primary aim of conducting an economic analysis, or contain a portion of economic analysis.
Total number of database results (after duplicates removed)
n = 7735
Academic in confidence
n = 1
Identified through: citation searching
n = 1 (HE n=1)
Website searching n = 4 (HE n=1)
Systematic reviews n = 4
NICE internal processes
n = 1
Full text assessment
n = 164
Total references for Title/ abstract screening
n = 7745
Non comparative
studies n = 388
Excluded studies
n = 109
Ineligible study type = 24 No data to extract = 18 Intervention type = 17 Relevant systematic review = 12 Out of scope = 11 Outcomes not relevant = 9 Unavailable = 6 Duplicate = 3 Country = 3 No baseline data = 3 Qualitative = 3
Included studies
n = 55
Transport database: 55 Open Space database (minus duplicates
of transport final includes): 16
Total n = 71 (HE n=7)
Duplicates removed
n = 2325
Total number of results
n = 10,060
Evidence review 1
11
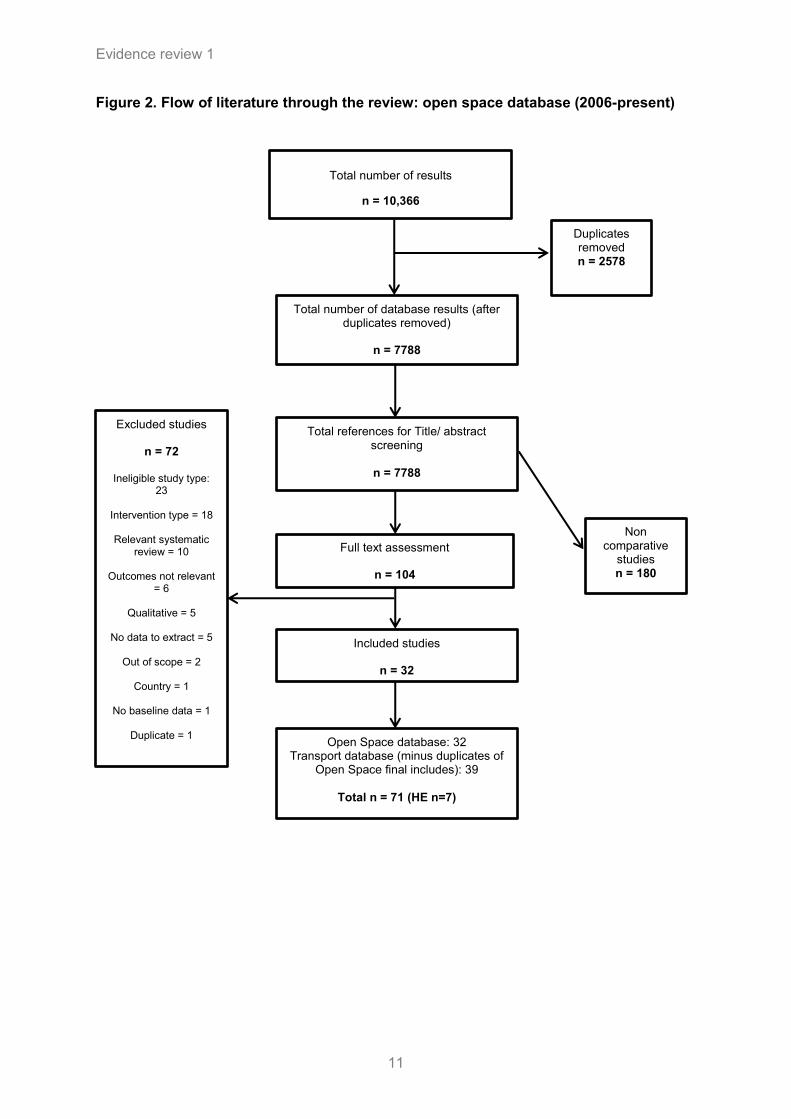
Figure 2. Flow of literature through the review: open space database (2006-present)
Total number of database results (after duplicates removed)
n = 7788
Full text assessment
n = 104
Total references for Title/ abstract screening
n = 7788
Non comparative
studies n = 180
Total number of results
n = 10,366
Duplicates removed n = 2578
Excluded studies
n = 72
Ineligible study type:
23
Intervention type = 18
Relevant systematic review = 10
Outcomes not relevant
= 6
Qualitative = 5
No data to extract = 5
Out of scope = 2
Country = 1
No baseline data = 1
Duplicate = 1
Included studies
n = 32
Open Space database: 32 Transport database (minus duplicates of
Open Space final includes): 39
Total n = 71 (HE n=7)

Evidence review 1
12
Characteristics of the included studies
The table below outlines the main themes of the 71 papers that met the inclusion criteria for
the evidence reviews.
Theme Number of papers
Review 1
Public Transport 19
Review 2
Ciclovia 3
Trail: trails and paths 14
Trail: Cycle Infrastructure 4
Trail: On-street cycle lanes 4
Safe Routes to School 5
Review 3
Neighbourhood 6
Parks 12
Multi-component 4
TOTAL 71
Characteristics of all 71 included transport and open space studies are given in Appendix 1.
All 19 Public Transport papers are covered in this review. Full details of the 19 studies
included in this review are given in the evidence tables in Appendix 2. The table below
shows the characteristics of the studies included in this review.
Evidence review 1
13
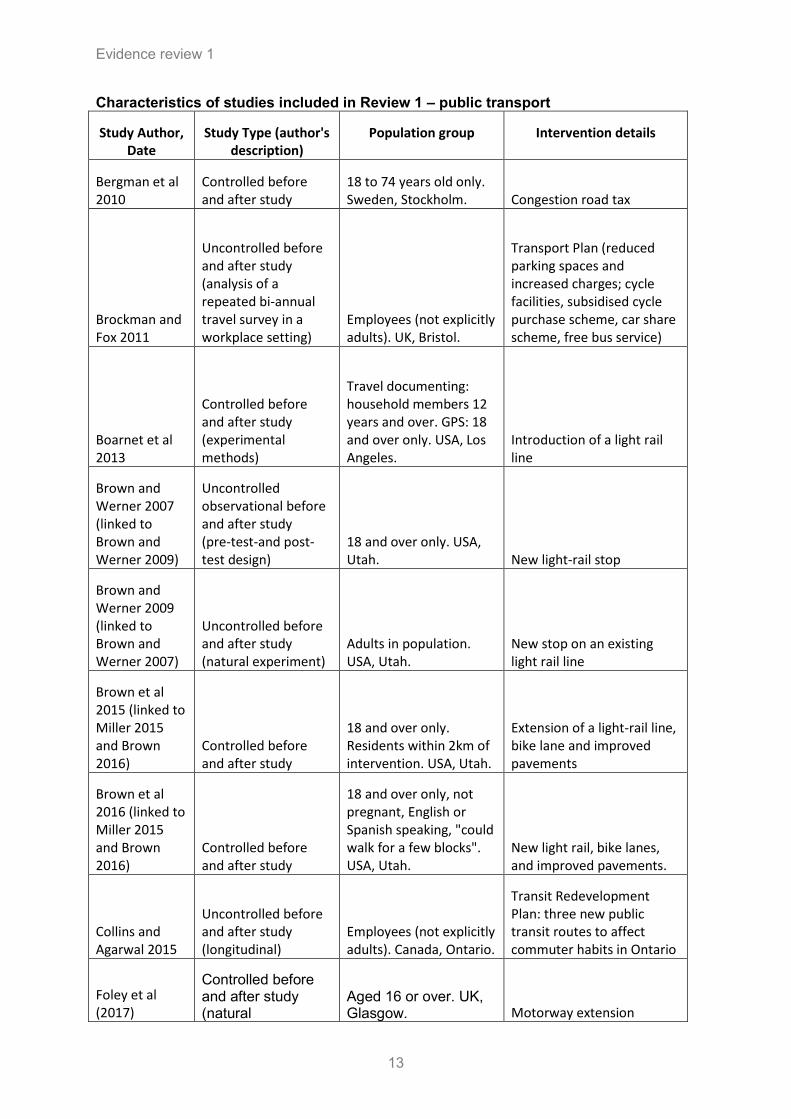
Characteristics of studies included in Review 1 – public transport
Study Author, Date
Study Type (author's description)
Population group Intervention details
Bergman et al 2010
Controlled before and after study
18 to 74 years old only. Sweden, Stockholm. Congestion road tax
Brockman and Fox 2011
Uncontrolled before and after study (analysis of a repeated bi-annual travel survey in a workplace setting)
Employees (not explicitly adults). UK, Bristol.
Transport Plan (reduced parking spaces and increased charges; cycle facilities, subsidised cycle purchase scheme, car share scheme, free bus service)
Boarnet et al 2013
Controlled before and after study (experimental methods)
Travel documenting: household members 12 years and over. GPS: 18 and over only. USA, Los Angeles.
Introduction of a light rail line
Brown and Werner 2007 (linked to Brown and Werner 2009)
Uncontrolled observational before and after study (pre-test-and post-test design)
18 and over only. USA, Utah. New light-rail stop
Brown and Werner 2009 (linked to Brown and Werner 2007)
Uncontrolled before and after study (natural experiment)
Adults in population. USA, Utah.
New stop on an existing light rail line
Brown et al 2015 (linked to Miller 2015 and Brown 2016)
Controlled before and after study
18 and over only. Residents within 2km of intervention. USA, Utah.
Extension of a light-rail line, bike lane and improved pavements
Brown et al 2016 (linked to Miller 2015 and Brown 2016)
Controlled before and after study
18 and over only, not pregnant, English or Spanish speaking, "could walk for a few blocks". USA, Utah.
New light rail, bike lanes, and improved pavements.
Collins and Agarwal 2015
Uncontrolled before and after study (longitudinal)
Employees (not explicitly adults). Canada, Ontario.
Transit Redevelopment Plan: three new public transit routes to affect commuter habits in Ontario
Foley et al (2017)
Controlled before and after study (natural
Aged 16 or over. UK, Glasgow. Motorway extension
Evidence review 1
14
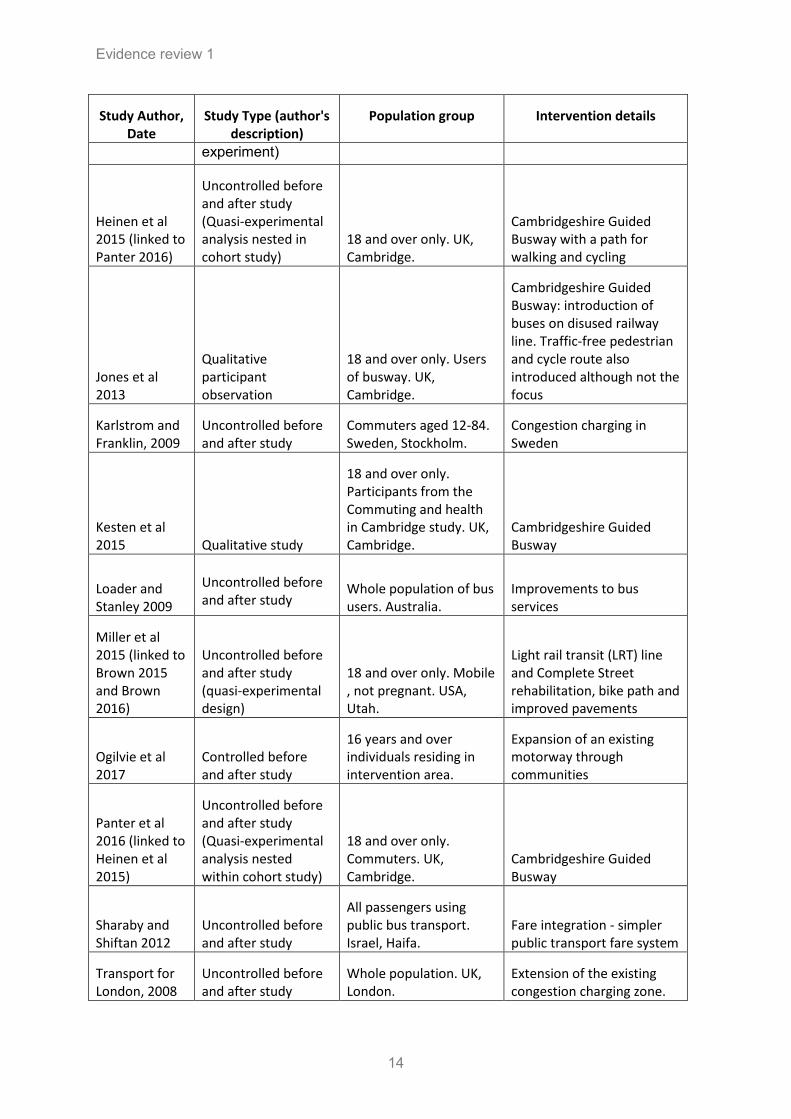
Study Author, Date
Study Type (author's description)
Population group Intervention details
experiment)
Heinen et al 2015 (linked to Panter 2016)
Uncontrolled before and after study (Quasi-experimental analysis nested in cohort study)
18 and over only. UK, Cambridge.
Cambridgeshire Guided Busway with a path for walking and cycling
Jones et al 2013
Qualitative participant observation
18 and over only. Users of busway. UK, Cambridge.
Cambridgeshire Guided Busway: introduction of buses on disused railway line. Traffic-free pedestrian and cycle route also introduced although not the focus
Karlstrom and Franklin, 2009
Uncontrolled before and after study
Commuters aged 12-84. Sweden, Stockholm.
Congestion charging in Sweden
Kesten et al 2015 Qualitative study
18 and over only. Participants from the Commuting and health in Cambridge study. UK, Cambridge.
Cambridgeshire Guided Busway
Loader and Stanley 2009
Uncontrolled before and after study
Whole population of bus users. Australia.
Improvements to bus services
Miller et al 2015 (linked to Brown 2015 and Brown 2016)
Uncontrolled before and after study (quasi-experimental design)
18 and over only. Mobile , not pregnant. USA, Utah.
Light rail transit (LRT) line and Complete Street rehabilitation, bike path and improved pavements
Ogilvie et al 2017
Controlled before and after study
16 years and over individuals residing in intervention area.
Expansion of an existing motorway through communities
Panter et al 2016 (linked to Heinen et al 2015)
Uncontrolled before and after study (Quasi-experimental analysis nested within cohort study)
18 and over only. Commuters. UK, Cambridge.
Cambridgeshire Guided Busway
Sharaby and Shiftan 2012
Uncontrolled before and after study
All passengers using public bus transport. Israel, Haifa.
Fare integration - simpler public transport fare system
Transport for London, 2008
Uncontrolled before and after study
Whole population. UK, London.
Extension of the existing congestion charging zone.
Evidence review 1
15
3.2. Review findings
Nineteen studies that addressed public transport interventions are considered here. No
economic evidence was identified for this review.
For GRADE profiles see Appendix 4, and for Evidence Statements, please see below.
Studies were grouped by the type of public transport intervention:
Congestion charging (3 studies)
Guided busway and improvement to bus services (5 studies)
Light rail interventions (3 studies)
Light rail intervention plus cycle lane and sidewalk improvements (3 studies)
Work Travel Plan (2 studies)
Integration of public transport fares (1 study)
Motorway extension (2 studies)
Congestion charging
Three studies reported on the effects of congestion charging. One uncontrolled before and
after study (TfL 2008 [+]) in London, UK; one uncontrolled before and after study in Sweden
(Karlstrom and Franklin 2009 [-]; and one cohort study (described by the authors as a quasi-
experimental natural study) (Bergman 2010 [+]) in Sweden.
One uncontrolled before and after study (Transport for London 2008 [+]) reported on
congestion charging in London. Measures of vehicle use 1 year after initiation of an
extension to the congestion charge zone were compared with baseline measures. The
extension resulted in substantial reductions in numbers of chargeable vehicles (cars, vans
and lorries) and an increase in non-chargeable vehicles (taxis, buses and two-wheeled
vehicles) entering the zone. Cars and minicabs decreased by 3% whereas licensed taxis
increased by 9%, buses and coaches by 5%, powered two-wheelers by 12% and pedal
cycles by 18%. 1 year following initiation of the extension zone, pedal cycles increased to
6% of all road vehicles (compared to 5% at baseline). The extension to the zone resulted in
increases in bus passengers throughout charging hours by 16% compared to baseline (bus
capacity had been increased in advance of the congestion scheme). A survey of residents
living outside the charging area found that in order to avoid the charge, around half would
not continue to drive to the extension zone and of these, 40% are estimated to have
changed travel mode. No information was provided on whether these changes are
Evidence review 1
16
statistically significant. The authors note that other changes occurring in London during this
period could have impacted on the outcomes, such as an existing trend of increasing use of
the underground.
Bergman et al (2010 [+]) studied a ‘congestion tax’ on 18 roads going into and out of
Stockholm for a 6-month trial period. The team collected data from 165 participants in
Stockholm and 138 control participants in Malmo and Göteborg using the short form of IPAQ
(International Physical Activity Questionnaire) to assess physical activity before and after the
trial. Participants were adults aged 18-74 who took part in the Physical Activity Prevalence
Study in 2003 and who agreed to take part in the follow-up questionnaire for this study.
Participants were only included if they had access to at least one vehicle.
At baseline, no differences in the sample characteristics between the Stockholm region and
the Göteborg/Malmö regions were observed, nor were there any differences in vigorous
physical activity (p =0.64); moderate physical activity (p =0.79); or walking (p =0.62),
including weighted overall physical activity (p =0.95) and sitting (p =0.14).
At follow-up, the subjects living in the Stockholm region reported more moderate physical
activity (p =0.036) and less time spent sitting (p =0.009) and an increase in weighted overall
physical activity (p =0.015) compared to baseline measurements. Among the subjects from
Göteborg/ Malmö, no changes in physical activity levels were observed. The effect sizes of
the changes were in general small, ranging from r =0.03 for walking to r =0.20 for sitting.
Karlstrom and Franklin (2009) [-] studied the impact of a pilot congestion charging on
roads in and out of Stockholm on commute mode of 1550 participants. In advance of the
congestion charge being introduced, substantial public bus service enhancements and new
park and ride lots were introduced. At 2 months after the initiation of the charge, 25% of car
drivers crossing the toll cordon switched to public transit, while only 10% did so in the control
group unaffected by the toll cordon. Initial car drivers crossing the toll cordon had a 15%
higher rate of switching to public transit compared with those car drivers not crossing the
cordon (significance not reported). The authors note that for all travellers there are about 8-
11% that switch modes even though their routes were unaffected by the toll, implying that
other factors also impact on choice to change mode.
Key limitations to these studies include the potential influence of other changes to public
transport. For example e.g. in the Swedish study a major road, not included in the
congestion charge, had opened and in London there was a background trend of increasing
use of the London underground.
Evidence review 1
17
Applicability: The evidence is only partially applicable as while one study was conducted in
the UK, the other two were conducted in Sweden.
1. TfL 2008 [+]
2. Bergman 2010 [+]
3. Karlstrom and Franklin 2009 [-]
Guided busway and improvement to bus services
Two uncontrolled before and after studies (Heinen et al 2015 [-] and Panter et al 2016 [-])
and two qualitative studies (Jones at al 2013 [++] and Kesten et al 2015 [++]) reported on
the Cambridgeshire Guided Busway (CGB) in the UK. One controlled before and after study
(Loader and Stanley 2009 [-]) reported on improvements to bus services in Melbourne,
Australia.
The CGB is a major transport infrastructure project comprising a new bus network and an
adjacent 22km traffic-free walking and cycling route in and around Cambridge. For the
majority of the route, the buses run on a guideway completely segregated from other traffic.
But in the city centre stretch (approx. 5km), the buses use the existing road network. The
path can be accessed at bus stops and other points along the route.
Heinen et al (2015)[-] investigated the effect of the Cambridgeshire Guided Busway on
changes in commuting transport mode share, based on baseline and follow up surveys, and
7 day travel diaries of participants
A measure of exposure to the busway was derived for each individual, based on the
proximity of their home postcode at baseline to the nearest bus stop or access point to the
pathway. The association between exposure to the CGB and changes in active travel mode
share were adjusted to account for sociodemographic characteristics, the type of settlement
participants lived in and whether they had moved home or workplace during the study.
Changes in active travel mode share were grouped as either: large decrease (30-100%);
small decrease (<30%); no change; large increase (30-100%); small increase (<30%).
Overall, proximity to the guided busway was significantly associated with the likelihood of a
large increase (>30%) in the share of commuting trips that involved active modes of travel
(relative risk ratio [RRR] 1.80, 95% CI 1.27, 2.55 p <0.05). It was also associated with less
likelihood of a small decrease (<30%) in trips involving active modes of travel (RRR 0.47
(95% CI 0.28, 0.81 p <0.05). Sub group analysis showed that living in villages or smaller
settlements rather than urban areas predicted an increase in public transport mode share
Evidence review 1
18
(RRR 2.53 (95% CI 1.06, 6.05 pp<0.05). Conversely, having a bicycle or higher self-rated
physical health reduced the likelihood of a decrease in public transport mode share (RRR
0.45 (95% CI 0.21, 0.98), p<0.05; and RRR 0.95 (95% CI 0.90, 0.99), p<0.05 respectively).
Panter et al (2016)[-] investigated the effect of the CGB on time spent walking and cycling
on the commute and overall levels of physical activity, based on baseline and follow up
surveys, 7 day travel diaries of participants and the Recent Physical Activity Questionnaire
(RPAQ).
There was no significant effect of the intervention on walking and cycling in combination for
commuting and recreation, but there was a significant effect on total time spent cycling for
commuting and recreation (RRR = 1.32, 95% CI = 1.04, 1.68, p<0.05). No significant effect
of the intervention on total time spent in either recreational or overall physical activity was
found.
The effect of the intervention on active commuting was moderated by baseline active
commuting levels (p=0.02 for interaction). There was a significant effect on total active
commuting only for those who reported the lowest levels of active commuting at baseline
(RRR = 1.76, 95% CI = 1.16, 2.67).
Loader and Stanley (2009) [-] reported on the effect of a city-wide bus service improvement
programme in Melbourne, compared with unchanged routes in the city. The study considers
Individuals using unchanged or changed bus services in Melbourne (in the 12 months before
the initiation of the new service in August 2006 or 12 months after initiation of the service in
August 2007). The new service included 30 new bus routes and 3 services with real-time
passenger information and increased route frequency. Follow-up data shows total bus
patronage growth of 4.6% between August 2006 and August 2007. Unchanged routes grew
by 1.3% in the same period (significance not reported). Of unchanged routes, it is reported
that those with more frequent service (higher service level) increased in patronage, while
those operating only 5 or 6 days a week decreased over the data collection period (no other
data provided).
Key limitations to the studies by Heinen et al (2015) and Panter et al (2016) include the
following: a large loss to follow up (59%); measures of physical activity were self- reported
and subject to potentially large measurement error; women and graduates were over-
represented in a sample of mostly healthy commuters compared to the local resident
population; and the sample reported higher levels of physical activity compared to
respondents of East England in the 2008 Health Survey (the authors stated this may be due
Evidence review 1
19
to differences in measurement). Key limitations to the study by Loader and Stanley (2009)
are unclear data collection methods and lack of significance testing.
Applicability: Two studies were conducted in the UK in relation to the same intervention
and one in Melbourne, therefore partially applicable.
1. Heinen et al 2015 [-]
2. Panter et al 2016 [-]
3. Loader and Stanley 2009 [-]
Two qualitative studies (Jones at al 2013 [++] and Kesten et al 2015 [++]) also reported on
the views and experience of users of the Cambridgeshire Guided Busway (CGB).
Jones et al (2013) [++] undertook a qualitative interview and participant observation study.
Participants were encouraged to discuss any aspect of their experience on the busway but
were asked to expand on their reasons for using the busway and how it fitted into their
everyday lives.
Three key themes emerged. Firstly, early experiences and the ease with which the busway
could be integrated into existing daily routines were important.
Secondly there was ‘collective learning; passengers perceived the busway to be a novel
feature and were observed to learn how to use it collectively (sometimes with information
sharing happening between strangers and bus drivers).
Thirdly, views differed between previous bus and car users. Previous bus users, whose
regular service had been discontinued, tended not to describe the busway positively and in
some cases perceived it to be worse than before:
‘‘It actually takes longer because it stops at more stops along the way’’; ‘‘the bus gets really
crowded and noisy’’.
‘‘For people like me, who used to have a good bus service, it’s frustrating that now it’s slower
and you can’t always get a seat’’.
For those that had previously travelled by car, the busway was described more positively:
‘‘It’s cheaper than driving to work’’; ‘‘I can sit on the bus and relax, not worry about the
traffic’’.
Evidence review 1
20
These passengers appeared to be experiencing the benefits of public transport in general for
the first time. Many of their positive remarks might have been applied to other forms of public
transport and were not specific to the busway; for example, not having to concentrate on
driving, and the reduced cost of travel.
Kesten et al (2015) [++] undertook qualitative semi-structured interviews with 38 of the
cohort participants between 18 and 22 months after the busway was introduced.
The findings suggest that the busway’s proximity, accessibility and convenience influenced
people’s use of, and views on, the busway. Some people were not affected by the busway
because they did not live near it or the feeder modes that linked to it. However for others the
busway was conveniently located on their commuting route and they were able to replace
previous options with the new infrastructure. For those that described the busway as
convenient, they appreciated that compared to other public transit, there were fewer stops,
so the route was more direct and quicker (before it reached the city centre). The
maintenance track was also praised for having fewer road junction stops, a smooth cycle
track and an easy to use route away from roads. For some, the stress of driving and parking
has been relieved by using the busway:
Over-crowding of the guided bus and ticket prices were considered to be a barrier. However
there were positive remarks about the cycleway in terms of safety as it is off-road. A lot of
participants expressed frustration however, that the busway was not lit and not sheltered,
impacting on safety of cyclists and pedestrians and increasing the potential for floods.
Novel aspects of the busway in particular, such as the ticketing procedure and two separate
bus operators, meant that planning - especially for those new to public transport - was
required:
“I have the utmost sympathy for anybody that’s not a regular bus user because it’s almost
like having to be inducted into some sort of secret society…..’’
The process of incorporating the busway into commuting patterns appeared to be influenced
by whether the anticipated benefits of changing were achieved or not over time. The authors
conclude that the busway interacted with participants’ circumstances in a complex manner
‘which is challenging to assimilate across many voices and lived experiences’.
Key limitations of these two qualitative studies include the generalisability of the findings
given the uniqueness of the intervention and the fact that Cambridge is a relatively affluent
and well-educated area. Reviewers noted that data collection in Jones et al 2013 took place
during autumn and winter and that attitudes may vary across the seasons. It was also noted
Evidence review 1
21
that there was a possible risk of context bias in that the attitude of the passenger will be
largely dependent on the performance of the busway on the day they are
observed/approached. In Kesten et al 2015 the authors note a higher proportion of cohort
members (71.9 %) than intercept survey participants (15.0 %) agreed to be interviewed. This
could reflect a greater investment and commitment already made to the study.
Applicability: Both studies were conducted in the UK in relation to the same intervention.
1. Jones et al 2013 [++]
2. Keston et al 2015 [++]
Light rail interventions
Three studies, 2 uncontrolled before and after studies (Brown and Werner 2007 [-] and
Brown and Werner 2009 [-]) and one controlled before and after study (Boarnet et al 2013
[+]) all conducted in the USA, reported on light rail interventions.
Brown and Werner 2007 and Brown and Werner 2009 investigated the effects of a new stop
between two existing stops on a light rail line in Salt Lake City, Utah.
Brown and Werner (2007) [-] report that the addition of the new rail stop significantly
increased ridership from 50% to 68.75% between baseline and follow up (between 7 and 11
months post implementation of the intervention (p=0.011, effect size not calculable). Authors
report a baseline average of 3.72 rail rides (SD= 6.46) increasing to 5.02 rail rides (SD 7.90)
at follow-up.’ Moderate’ bouts of physical activity per hour (defined as 8 minutes or more
than1952 accelerometer counts per minute) did not differ between baseline and follow up.
The proportion of the moderate bouts that were related to walking to the rail stop increased
from an average of 0.1 (SD=0.21) at baseline to 0.15 (SD=0.31) at follow up. However
statistical comparison was not calculable and authors note that the small sample size may
limit the power to detect effects.
Brown and Werner (2009) [-] assessed whether there were significant differences between
non-riders, new riders and continuing riders of the light rail after the new stop was added. 51
participants completed surveys at baseline (summer 2005) and follow up (summer 2006)
with the intervention being implemented in autumn 2005. 47 wore accelerometers which
gave an objective measure of physical activity.
Brown and Werner 2009 reported significant differences between rider groups in the mean
number of bouts of moderate physical activity at follow up. This was highest for continuing
riders and lowest for non-riders: non-riders 1.07 (SE 0.76); new riders (1.77 (SE 0.83);
Evidence review 1
22
continuing riders: 3.68 (SE 0.60) (p = 0.03). There were no significant differences in the
mean number of leisure walks taken by the different groups at follow up.
Boarnet at al (2013) [+] carried out a controlled before and after study in the USA, to
assess the effect on travel behaviour and physical activity of a new light rail (‘Expo’) line
which extends 8.7 miles south and west from downtown Los Angeles. Households in the
intervention group were within ½ mile of the newly opened Expo line, whereas matched
comparator households lived between ½ a mile to 2 miles away from the Expo line.
7 day travel behaviour data was collected from participants in the intervention and control
groups via online and paper surveys. Physical activity was measured using accelerometers
among a sub-sample of individuals in the control and intervention groups.
There was no difference in travel behaviour between the two groups at baseline (including
numbers of trips by bus, train, bicycle or walking and time spent walking or cycling). At follow
up (between 3 and 7 months post implementation of the intervention), although the
intervention group had significantly more train trips than at baseline, this change was not
significantly different from the control group, which had also seen an increase. There were
no significant differences between changes seen in the intervention group and changes
seen in the control group for walk trips, walk minutes, bus trips, bicycle trips or bicycle
minutes. In addition there was no difference in physical activity measured by accelerometer
between baseline and follow up for either group.
Key limitations include: In addition to the small sample sizes and the potential of this to limit
the power to detect effects, authors noted that the study may underestimate the effects of
light-rail introduction on both rail use and physical activity because of pre-existing rail use
and the neighbourhood’s lack of varied and attractive walking destinations (Brown and
Werner 2007; Brown and Werner 2009). The reviewers noted that the short follow-up period
post-intervention (7-11 months in Brown and Werner 2007; Brown and Werner 2009; 3-7
months in Boarnet et al 2013) may not have been long enough to detect any changes in
commuting decisions and physical activity behaviours.
Applicability: The evidence is only partially applicable to the UK because all three studies were conducted in the USA.
1. Brown and Werner 2007 [-]
2. Brown and Werner 2009 [-]
3. Boarnet et al 2013 [+]
Evidence review 1
23
Light rail intervention plus a cycle lane and sidewalk improvements (‘complete streets’ intervention)
Three uncontrolled before and after studies, Brown et al 2015 [-], Miller et al 2015 [-] and
Brown et al 2016 [-], all conducted in the USA, report on the effect of extending an existing
light rail line and adding 5 new rail stops and a cycle lane and sidewalk improvements in a
‘complete streets’ intervention in the same neighbourhood of Salt lake City, Utah.
Brown et al (2015) [-] reported on changes in total physical activity of 537 participants
surveyed at baseline and at follow up (between 1 and 7 months after the intervention was
implemented). Physical activity was measured by accelerometer as counts per minute
(±SE)) in four different ridership categories; never riders; continuing riders; former riders and
new riders.
At follow up, there was a significant decrease in the total physical activity of former rail riders
of -43.12 counts per minute (SE 20.44) p<0.01 Cohen’s d calculated by reviewer 0.252).
There was a significant difference between the total physical activity of former riders (who
decreased their total activity) versus never-riders (who increased their total physical activity
(p = 0.001, Cohen’s d calculated by reviewer -0.542). New riders accrued significantly more
physical activity than never-riders (p = 0.007, Cohen’s d calculated by reviewer 0.401). The
change in total physical activity between continuing riders compared to never-riders was not
significantly different.
Compared to the never riders and for each 10 hours of accelerometer wear, former riders
reduced their moderate to vigorous physical activity (MVPA) by 6.37 minutes p<0.01; 95%
CI = -10.31, and accrued 16.38 more minutes of sedentary time p<0.01; 95% CI = 4.41,
28.35, effect size not calculable). New riders accrued 4.16 more minutes MPVA p<0.05;
95% CI = 0.54, 7.78) and reduced their sedentary time by 12.83 minutes p<0.05; 95% CI = -
23.82, -1.85, effect size not calculable). There were no significant differences for time spent
in MVPA or sedentary time for continuing riders.
Miller et al (2015) [-] reported changes in transit related physical activity for the four
ridership categories between baseline and at follow-up (1 – 7 months after the intervention
was implemented). This reflected the results relating to total physical activity reported by
Brown et al 2015. New riders showed an average increase of 3.46 mins (95% CI 2.20, 4.72;
p<0.0001, effect sizes not calculable) in transit related physical activity whereas former
riders on average decreased their transit related physical activity by 2.34 mins (95% CI -
3.56, -1.08; p=0.0005, effect sizes not calculable). There was no significant change in
transit-related physical activity for never riders or continuing riders.
Evidence review 1
24
Brown et al 2016 [-] examined the effects of distance from the intervention on the number of
transit and non-transit trips before and after the intervention. Participants were categorised
as ‘near’ (those living <800m away from the intervention street) or ‘far’ (those living ≥801-
2000m away). Comparisons were made pre- and post- intervention as well as comparing
near and far participant groups.
Residents living <800m away from the intervention, were significantly more likely to make
transit trips (by commuter rail, light rail or bus) at follow-up compared to baseline (baseline
odds ratio when compared to follow-up 0.61 (95% CI 0.4 to 0.93), p≤0.02). They were more
likely to take transit trips than those living further away (odds ratio for far group 0.60 (95%
0.37 to 0.97), p≤0.04). In addition, they were significantly more likely at follow up to make
non-transit walk trips than at baseline (baseline odds ratio when compared to follow-up 0.55
(95% CI 0.39 to 0.78), p≤0.00) and to make non-transit walk trips than those living further
away (odds ratio for far group 0.27 (95% 0.18 to 0.4), p≤0.00). However, there was no
significant difference in number bike trips between baseline and follow-up for those living
<800m from the intervention (baseline odds ratio when compared to follow-up 0.86 (95% CI
0.49 to 1.53), p≤0.62), nor was there any significant difference in number of bike trips
between near and far groups (odds ratio for far group: 0.69 (95% 0.37 to 1.3), p≤0.25).
Limitations of these studies include the following: Data was not collected on reasons for
former riders stopping use of the light rail. It is therefore not clear whether there was an
unintended consequence of the intervention; Measurements of physical activity from the
accelerometers were taken from only 1 weeks’ worth of travel. And so the study does not
take into account any variations in ridership patterns (i.e. never-riders may have actually
been occasional riders outside of data collection periods). In Brown et al 2016, the authors
state that although a number of sociodemographic variables were controlled for, there may
have been some unmeasured variables that were influential. In addition the review team
noted the short follow-up period, with post-intervention data taken as little as 1 month after
intervention was implemented. Maximum follow-up time after intervention was 7 months.
This may not have been long enough to detect any changes in commuting decisions and
physical activity behaviours.
Applicability: The evidence is only partially applicable to the UK because all three
studies were conducted in the USA.
1 Brown et al 2015 [-]
2 Miller et al 2015 [-]
3 Brown et al 2016 [-]
Evidence review 1
25
Work Travel Plans
Two uncontrolled studies reported on this intervention type. Both were low quality [-]; one
from Canada (Collins and Agarwal, 2015) and one from the UK (Brockman and Fox, 2011).
Collins and Agarwal (2015 [-]) conducted an uncontrolled before and after study, and
reported on the effect of introducing an express transit route (unclear if train, tram or bus)
and an employer subsidised travel pass, on transit use and physical activity among non-
student employees at a university in Ontario.
The intervention consisted of the introduction of an express transit route with a more
frequent service to the university. 6 months after the express route opened the university
introduced an employer subsidised monthly transit pass. 656 participants completed surveys
at baseline (within a month of the express route opening) and follow up, 1 year later.
Participants were categorised according to their travel behaviour at baseline: exclusively
passive (drove, carpooled, or were dropped off); somewhat passive: as above, but parked
off-campus and walked to the university); public transit users; active (walk or cycled); varies
by season (did not use the same route all year round).
Public transit use was the only mode of transport for which there was a significant change
between baseline and follow up, with a 3% increase in transit ridership across the seasons
(reported as being significant at the 99% level but no further details given).
Participants were significantly more likely to ‘shift’ modes if they were female (p=0.036),
have a lower household income (<0.001), not have a drivers license (<0.001), have a transit
pass (p<0.001), and not have a permit to park at work (<0.001). They also responded more
favourably to the transit improvements and the subsidised transit pass (both p<0.001) and
were more willing to spend >30 mins on the commute (p<0.001).
Self-reported physical activity was recorded only at follow up. Physical activity relating to
commuting was significantly different between the groups (F = 276.38, p<0.001), with active
commuters showing the highest levels (140.3 mins ± 5.8 SE), transit users showing lower
(79.2 mins ± 6.4 SE) and entirely passive commuters showing the lowest (no PA took place).
When physical activity levels from the commute and recreational activities were combined,
there was still a significant difference between groups (F = 52.56, p<0.001), with active
commuters showing the highest levels (296.3 mins ± 10.9 SE), followed by somewhat
passive commuters (237.4 mins ± 23.9 SE), transit users (183.3 mins ± 15.5) and the lowest
levels being amongst entirely passive commuters (135.1 mins ± 7.8 SE).
Brockman and Fox (2011) [-] used an uncontrolled before and after study to assess the
impact of the Bristol (UK) University Transport Plan on car usage and employee levels of
Evidence review 1
26
walking and cycling to work. The Plan involved heavily limiting parking spaces and
conditions for permits, increased parking charges, improving changing facilities for walkers
and cyclists, new secure cycle storage, a subsidised cycle purchase scheme, a car-sharing
scheme, a free university bus service which served local train and bus stations, and
discounted season tickets on buses. University of Bristol employees completed self-
administered surveys 0, 2, 4, and 6 years after intervention completion. Overall there were 9
years between baseline survey (1998) and final follow-up survey (2007). The number of
survey respondents varied from 1,950 to 2,829.
Between baseline and final follow up: the percentage of people reporting that they usually
walk to work increased from 19% to 30% (P=<0.01); the percentage of people reporting that
they usually cycle increased from 7% to 12% (not statistically significant, P value not
reported); and the percentage of people who usually commuted by car decreased from 50%
to 33% (P=<0.001).
Limitations of these studies include: a large loss to follow up and low response rates;
possible risk of selection bias (those who shifted transport mode and wanted to report on
their experiences may have been more likely to complete the survey); long time frames in
one study could mean that outcomes are due to other changes occurring during this time;
study power was not reported; In Collins and Agarwal (2015), the baseline data was taken
one month after the express route opened so this is not strictly a before and after study.
Applicability: The evidence is partially applicable to the UK as one study was
conducted in the UK and one in Canada.
1. Collins and Agarwal 2015 [-]
2. Brockman and Fox 2011 [-]
Integrated public transport fares
One longitudinal cohort study (Sharaby and Shiftan (2012) [-]) reported on public transport
fare integration in the city of Haifa, Israel. The intervention meant that one ticket could be
used for a journey within a set period of time, allowing for transfers and therefore reducing
the cost of travel for many passengers, particularly those travelling from rural areas.
Baseline passenger surveys 6 years (baseline 1) and 3 years (baseline 2) in advance of the
intervention, and a survey 11 months post intervention were compared. The authors state
that there had been a downward trend in ridership between baseline 1 and baseline 2. Post
intervention the number of passengers per day using the public transport increased by 19%
between baseline 2 and 11 month follow up and by 7% between baseline 1 and 11 month
Evidence review 1
27
follow up. The average number of passenger trips increased by 9% between baseline 2 and
11 month follow up, but decreased by 9% between baseline 1 and 11 month follow up.
Limitations of the study include: 23% of those surveyed stated that without the reform, their
current journey would have been made up of a mixture of a bus ride and walking. 4% would
have travelled entirely by walking. Therefore fare integration could be seen to be reducing
opportunities for walking in some passengers.
Applicability: The evidence is only partially applicable to the UK as the study was
conducted in Israel.
1 Sharaby and Shiftan 2012 [-]
Motorway extension
One controlled before and after study, with a cross-sectional sample and a cohort sample,
(reported in Ogilvie et al (2017) and Foley et al (2017), jointly assessed as [+]) reported on
the impact of a motorway extension built through or close to deprived, residential area in
Glasgow, UK. Comparisons were made between baseline survey data of residents, collected
6 years prior to the opening of the motorway extension, and 2 years after the motorway
opened.
The cohort analysis of 365 residents found:
Compared to those in the North (no motorway) study area, cohort participants in the
South (new motorway) were significantly more likely to undertake travel by any mode
(bus, car, walking) at follow-up (odds ratio [OR] 2.1, 95% confidence interval [CI] 1.0 to
4.2), and those in the East (existing motorway) were significantly more likely to use the
bus at follow-up (OR 2.4, 95% CI 1.1 to 5.2). However, there were no differences
between study areas for either time spent travelling in general, or time spent using any
mode of transport in particular.
Within the South (new motorway) study area, participants living closer to a motorway
junction were more likely to use a car and to undertake travel by any mode at follow-up
than those living further away, but only the finding for any travel remained statistically
significant in the maximally adjusted model (OR 4.7, 95% CI 1.1 to 19.7).
Within the East (existing motorway) study area, a significant interaction was found by car
ownership. Stratified analysis indicated that in participants who owned a car, those living
closer to a motorway junction were more likely to use the bus at follow-up than those
Evidence review 1
28
living further away (OR 4.5, 95% CI 0.9 to 21.5), an effect not found in those without a
car.
The repeat cross sectional analysis (of just under 1000 residents at two time points) found:
There were no significant differences between study areas for either likelihood of, or time
spent using, any or all modes of travel. However within the South (new motorway) study
area, participants living closer to a motorway junction were more likely to use a car at
follow-up than those living further away (OR 3.4, 95% CI 1.1 to 10.7).
Accelerometer data showed no difference between intervention and control groups for light
(Incidence rate ratio 0.9, 95% CI 0.8, 1.0), or moderate to vigorous physical activity (IRR 1.0,
95% CI 0.8, 1.3), or sedentary activity (IRR 12.8, 95% CI -9.5, 35.0) at follow-up.
Participants living nearer to the motorway also had reduced mental well-being scores over
time compared with those living further away (coefficient -3.6; 95% CI -6.6 to -0.7).
Limitations of the study include: Collection of only one day of travel data, which raises the
possibility that travel on a given sampled day was not typical and increases the variability in
the data. Comparatively low response to the survey, which limits the external validity of the
findings.
Applicability: The study is directly applicable as was conducted in the UK.
1 Foley et al 2017 [+]
2 Ogilvie et al 2017 [+]
Evidence review 1
29
4. Discussion
Strengths and limitations of the review
Overall, the quality of the studies was poor. As noted in section 3.3, only 2 of the studies
were graded [++] and 5 studies were graded [+]. The remaining 12 studies were graded [-].
No economic evaluations were identified.
Consistent themes do emerge across the studies:
Improvements to public transport may increase opportunities for incidental physical
activity, particularly among those who have previously travelled by car or who are less
active at the outset.
Improvements to public transport are more likely to impact on people living close by.
Practical issues – such as increasing opportunities to access (e.g. ease of ticketing, bus
frequency, sufficient bus stops or access points to walkways and cycleways) may be
important for the success of interventions. While changes to provision may be welcomed
by those not currently using public transport, they may not always be welcomed by
existing users.
Several limitations are seen across many of the studies. Many of the studies were natural
experiments. Follow up times may have been too short to detect long term changes in
commuting decisions and physical activity behaviours and few used direct measures of
physical activity. Many of the studies did not report whether they were adequately powered
and the small sample sizes of some studies may suggest that they would not have had the
power to detect changes in physical activity behaviours. While some studies do report
findings for those who are the least active, none reported on the impact on those with
mobility problems or disabilities. Some studies only surveyed those using public transport
and therefore may be biased towards users.
Further detail of the strengths and weaknesses of individual studies can be found in the
evidence tables (Appendix 2).
Adverse effects
Few studies reported adverse effects. One study on public transport fares (Sharaby and
Shiftan 2012) found that without the reform 23% would have taken the bus and walked and
4% would have travelled entirely by walking. Therefore fare integration may have reduced
opportunities for walking in some passengers. One study on the Cambridge bus way found
Evidence review 1
30
that previous bus users, whose regular service had been discontinued, tended not to
describe the busway positively and in some cases perceived it to be worse than before
(Jones 2013).
Applicability
Six of the 19 studies were from the US with 8 from the UK, 1 from Canada, 2 from Sweden,
1 from Australia and 1 from Israel. The applicability of studies from other countries may be
limited if population acceptability and use of public transport, active modes of travel and car
ownership are very different to those in the UK.
Gaps in the evidence
Insufficient evidence was identified to answer the following questions:
Which transport interventions are cost effective (no cost effectiveness data identified)
Does effectiveness vary for different population groups (limited evidence on those less
able to be physically active and none on those with disabilities; limited evidence by
socioeconomic group; no evidence for children)
Are there any unintended or adverse events (few data reported)
Who needs to be involved to ensure intervention are effective for everyone (unclear from
evidence)
What factors ensure interventions are acceptable to all groups (some evidence on factors
that might ensure acceptability but not for all groups).
For more information on gaps in the evidence and Expert Testimony, see Appendix 7.
Evidence review 1
31
5. Evidence Statements
Evidence statements are summaries of the evidence presented in GRADE tables (Appendix
4). Evidence statements for evidence from Review 1 are presented below.
GRADE Evidence statement 1.1: Congestion charging
One Swedish1 study with 303 participants presented low quality evidence showing that
introducing congestion charging increased moderate and total physical activity, and reduced
time spent being sedentary from baseline at 5 months follow up.
Another Swedish3 study with 1550 participants presented very low quality evidence and one
UK2 study on all commuters in central London presented low quality evidence showing that
introducing congestion charging reduces the use of cars, at 5 month and one year follow up,
respectively. Data from the study in London indicated that bus passengers increased by 6-
9%, cycling increased by 18%, and taxi use increased by 9%. In addition it reported that
congestion charging may cause car drivers to switch transport method to public transport, or
not to undertake the charged journey at all.
1Bergman 2010
2Transport for London 2008
3Karlstrom and Franklin 2009
Grade Evidence statement 1.2: Guided Busway
One UK1 study with 364 participants presented very low quality evidence showing the
introduction of a guided busway decreased overall active travel, and had no effect on time
spent on physical activity in everyday life at 6 to 18 months follow up. However, living close
to the busway was associated with a greater likelihood of an increase in weekly cycle
commuting time (relative risk ratio [RRR] 1.34, 95% CI1.03, 1.76). The same study
presented very low quality evidence that active commuting increased only for those who
reported the lowest levels of active commuting at baseline (RRR = 1.76, 95% CI = 1.16,
2.67) at 6 to 18 months follow up.
One UK2 study with 470 participants presented low quality evidence showing that introducing
a guided busway predicted large increases in using active methods of travel in those living
nearer (within 4km) to the busway compared to those living further away at 3 years follow up
(relative risk ratio [RRR] 1.80, 95 % CI 1.27 to 2.55). The same study presented low quality
Evidence review 1
32
evidence that living in villages rather than urban areas predicted an increase in public
transport use as a proportion of all commuting trips (RRR 2.53 (1.06, 6.05), pp<0.05) at 3
years follow up.
1 Panter et al 2016
2 Heinen et al 2015
GRADE Evidence statement 1.3: Upgrading of bus routes
One study1 (in Melbourne) presented very low quality evidence showing upgrading bus
routes increased public transport use by 4.6% for upgraded routes compared to 1.3% in
those not upgraded routes at 1 year follow up.
1 Loader and Stanley 2009
GRADE Evidence Statement 1.4: New light rail transit service
One USA1 study with 204 households presented low quality evidence showing introducing a
new light rail service had no effect on train and walking trips. Low quality evidence from the
same study showed no impact on the amount of time spent in moderate and vigorous
physical activity, at 3-7 months follow up.
1 Boarnet et al 2013
GRADE Evidence Statement 1.5: New rail stop
One USA study reported in two publications1 with 51 participants presented low quality
evidence showing introducing a new rail stop increased public transport use (as measured
by rail ridership: 50% to 69%, p = 0.001), but had no impact on the mean number of rail rides
(mean difference 1.30 (95% CI-1.50, 4.10).
Low quality evidence from the same study showed no impact on the mean bouts of
moderate physical activity per hour (bouts remained at 0.06 bouts/hr at baseline and 7-11
months follow up: mean difference 0.00 [95% CI -0.03, 0.03]). However, total number of
bouts is significantly different between continuing riders (3.68, standard error 0.60), new
riders (1.77, standard error 0.83) and non-riders (1.07, standard error 0.76).
1 Brown and Werner 2007 & Brown and Werner 2009
Evidence review 1
33
GRADE Evidence Statement 1.6.: Complete Street Interventions
One USA study (reported in three publications1), with 537 participants presented low quality
evidence showing introducing new stops along a light rail extension, a new bike lane and
improved pedestrian sidewalks increased total time spent in physical activity, increased time
spent in public transport related physical activity, and reduced sedentary time at 7-11
months follow up in ‘new riders’. Very low quality evidence showed an increase to moderate
and vigorous physical activity which was not seen in other groups (continuing riders and
former riders), but no change to time spent in light physical activity between baseline and
follow-up for any group.
Moderate quality evidence from the same study showed residents living <800m away from
the intervention were significantly more likely to make public transport trips at follow-up
compared to baseline (baseline odds ratio when compared to follow-up 0.61 (95% CI 0.4 to
0.93), p≤0.02) and to take public transport trips than those living further away (odds ratio for
far group 0.60 (95% 0.37 to 0.97, p≤0.04).
The same study presented low quality evidence showing no difference in number of bike
trips between baseline and follow-up for any group.
1 Brown et al 2015, Miller et al 2015 & Brown et al 2016
GRADE Evidence Statement 1.7: Integrated public transport fare
One Israeli1 study with 253,200 participants presented very low quality evidence showing
that integrating public transport fares and simplifying paying systems increased public
transport use. The number of passengers per day using public transport increased by 19%
between baseline 2 (3 years pre intervention) and follow up (11 months post intervention).
The average number of passenger trips increased by 9% between baseline 2 and follow up.
1 Sharaby and Shiftan 2012
GRADE Evidence Statement 1.8: Motorway extension
Evidence review 1
34
One UK1 study with 253 (cohort) participants presented very low quality evidence that after a
motorway extension there was no significant change between intervention and control
groups1 for use of any mode of transport.
The same study, but considering 642 participants (repeat cross-sectional), also found no
differences between the intervention and control area. However, within the intervention area,
participants living closer to a motorway junction were more likely to use a car at follow-up
than those living further away (OR 3.4, 95% CI 1.1 to 10.7).
The same study in a separate publication2 considering 138 participants presented low
quality evidence that the intervention made no difference to light physical activity (Incidence
rate ratio [IRR] 0.9, 95% CI 0.8, 1.0), moderate to vigorous physical activity (IRR 1.0, 95% CI
0.8, 1.3), or sedentary activity (IRR 12.8, 95% CI -9.5, 35.0) between intervention and
control groups at follow-up.
1Foley et al 2017, 2Ogilvie et al 2017
GRADE Evidence Statement 1.9: Workplace Travel Plans
One Canadian1 study with 656 participants presented very low quality evidence that work-
based travel plans introducing a new express transit route to work with subsidised travel
pass increased public transport use by 3% at 1 year follow up. Participants were more likely
to shift modes if they were female, had lower household income, had no driver’s license or
transit pass, and had no work parking permit.
One UK2 study with 2,829 workers as participants presented very low quality evidence that
work-based travel plans increasing parking charges and decreasing parking spaces at the
workplace increased walking and decreased car driving as a self-reported usual form of
commute at 9-year follow-up. The intervention made no difference to cycling as a commute
method.
1 Collins and Agarwal 2015
2 Brockman and Fox 2011
Non – GRADE Evidence Statement 1.10: Views and experiences of users of a guided
busway
1 Intervention area had the new motorway extension. Main control area had with no motorway extension,
secondary control area already had a motorway extension previously completed.
Evidence review 1
35
Two studies with no risk of bias [++] considered the views and experiences of users of the
Cambridgeshire guided busway. One study used interviews and participant observation1
(participant numbers not provided – interviews conducted on 41 busway trips) and 1 study
used interviews2 with 38 participants. Both studies were based in the UK. These studies
indicated that the busway’s proximity, accessibility and convenience affected people’s use
of, and views on, the busway.
The process of incorporating the busway into commuting patterns appeared to be influenced
by whether the anticipated benefits of changing were achieved or not over time2. Early
experiences and the ease with which the busway could be integrated into existing daily
routines were important to users1. However, individuals’ use developed over time, with some
increasing their use of the busway and walking to the stops as they realised how feasible it
was.2
Both studies reported passengers’ concerns about the complexity of ticketing systems and
multiple providers, which caused confusion, delays, and frustration amongst passengers,
particularly new ones.1,2 Collective learning occurred as a result.
Views differed between previous car and bus users; those who had previously travelled by
car tended to describe the busway more positively1, and talked about reduced stress of
driving – a factor which might be common to all public transport2. Existing bus users by
contrast found the new system slower.1 Although participants were bus passengers, one
study reported people’s frustration that the busway and parallel cycle path was not lit or
sheltered, a safety concern for cyclists and pedestrians.2
1 Jones et al 2013 [++]
2 Kesten et al 2015 [++]
Evidence review 1
36
6. References for Review 1 included studies
Bergman Patrick, Grjibovski Andrej M, Hagstromer Maria, Patterson Emma, and Sjostrom
Michael. (2010). Congestion Road Tax and Physical Activity. American Journal of Preventive
Medicine, 38(2), pp.171-177.
Boarnet Marlon G , Hong Andy, Lee Jeongwoo, Wang Xize, Wang Weijie, Houston Doug,
and Spears Steven. (2013). The Exposition Light Rail Line Study: a Before and After Study
of the Impact of New Light Rail Transit Service. pp.vii-64.
Brockman R, and Fox K R. (2011). Physical activity by stealth? The potential health benefits
of a workplace transport plan. Public Health, 125(4), pp.210-216.
Brown B B, and Werner C M. (2009). Before and After a New Light Rail Stop: Resident
Attitudes, Travel Behavior, and Obesity. Journal of the American Planning Association,
75(1), pp.5-12.
Brown B B, and Werner C M. (2007). A New Rail Stop: Tracking Moderate Physical Activity
Bouts and Ridership. American Journal of Preventive Medicine, 33(4), pp.306-309.
Brown Barbara B, Smith Ken R, Tharp Doug, Werner Carol M, Tribby Calvin P, Miller Harvey
J, and Jensen Wyatt. (2016). Complete Street Intervention for Walking to Transit, Non-
Transit Walking, and Bicycling: A Quasi-Experimental Demonstration of Increased Use.
Journal of physical activity & health, no pagination.
Brown Barbara B, Werner Carol M, Tribby Calvin P, Miller Harvey J, and Smith Ken R.
(2015). Transit Use, Physical Activity, and Body Mass Index Changes: Objective Measures
Associated With Complete Street Light-Rail Construction. American journal of public health,
105(7), pp.1468-74.
Collins P A, and Agarwal A. (2015). Impacts of public transit improvements on ridership, and
implications for physical activity, in a low-density Canadian city. Preventive Medicine
Reports, 2, pp.874-879.
Foley, L., Prins, R., and Crawford, F., 2017. Effects of living near a new urban motorway on
the travel behaviour of local residents in deprived areas: evidence from a natural
experimental study. Health & Place, 43 (57-65).
Heinen E, Panter J, Mackett R, and Ogilvie D. (2015). Changes in mode of travel to work: A
natural experimental study of new transport infrastructure. International Journal of Behavioral
Nutrition and Physical Activity, 12(1), pp.no pagination.
Jones C H. D, Cohn S, and Ogilvie D. (2013). Making Sense of a New Transport System: An
Ethnographic Study of the Cambridgeshire Guided Busway. PLoS ONE, 8(7), no pagination.
Evidence review 1
37
Karlstrom, A., and Franklin, J. P., Behavioral adjustments and equity effects of congestion
pricing: Analysis of morning commutes during the Stockholm Trial. Transportation Research.
Part A, Policy and Practice. 283-296
Kesten J M, Guell C, Cohn S, and Ogilvie D. (2015). From the concrete to the intangible:
Understanding the diverse experiences and impacts of new transport infrastructure.
International Journal of Behavioral Nutrition and Physical Activity, 12(1), no pagination.
Kesten, J M, Guell C, Cohn S, and Ogilvie D. 2015. From the concrete to the intangible:
understanding to diverse experiences and impacts of new transport infrastructure.
International Journal of Behavioural Nutrition, 12 (72): DOI 10.1186/s12966-015-0230-4.
Loader, C., and Stanley,J., 2009. Growing bus patronage and addressing transport
disadvantage – The Melbourne Experience. Transport Policy, 16: 106-114Miller H J, Tribby
C P, Brown B B, Smith K R, Werner C M, Wolf J, Wilson L, and Oliveira M G. S. (2015).
Public transit generates new physical activity: Evidence from individual GPS and
accelerometer data before and after light rail construction in a neighborhood of Salt Lake
City, Utah, USA. Health and Place, 36, pp.8-17.
Miller, H. J., Tribby, C. P., Brown, B. B., Smith, K. R., Werner, C. M., Wolf, J., Wilson, L.,
Simas Oliveira, M. G., 2015. Public transit generates new physical activity: Evidence from
individual GPS and accelerometer data before and after light rail construction in a
neighbourhood of Salt Lake City, Utah, USA. Health & Place, 36: 8-17.Panter J, Heinen E,
Mackett R, and Ogilvie D. (2016). Impact of New Transport Infrastructure on Walking,
Cycling, and Physical Activity. American Journal of Preventive Medicine, 50(2), pp.45-53.
Ogilvie D, Foley L, Nimegeer A, Olsen JR, Mitchell R, Thomson H, et al. Health impacts of
the M74 urban motorway extension: a mixed-method natural experimental study. Public
Health Res 2017;5(3).
Sharaby Nir, and Shiftan Yoram. (2012). The impact of fare integration on travel behavior
and transit ridership. Transport Policy, 21, pp.63-70.
Transport for London, 2008. Central London Congestion Charging: Impacts Monitoring. Sixth
Annual Report, July 2008. Transport for London.
Related Documents