arXiv:astro-ph/0109152v1 10 Sep 2001 Mon. Not. R. Astron. Soc. 000, 000–000 (0000) Printed 1 February 2008 (MN L A T E X style file v1.4) Evidence for a non-zero Λ and a low matter density from a combined analysis of the 2dF Galaxy Redshift Survey and Cosmic Microwave Background Anisotropies G. Efstathiou 1,2 , Stephen Moody 1 , John A. Peacock 3 , Will J. Percival 3 , Carlton Baugh 4 , Joss Bland-Hawthorn 5 , Terry Bridges 5 , Russell Cannon 5 , Shaun Cole 4 , Matthew Colless 6 , Chris Collins 7 , Warrick Couch 8 , Gavin Dalton 9 , Roberto De Propis 8 , Simon P. Driver 10 , Richard S. Ellis 11 , Carlos S. Frenk 4 , Karl Glazebrook 12 , Carole Jackson 6 , Ofer Lahav 1 , Ian Lewis 5 , Stuart Lumsden 13 , Steve Maddox 14 , Peder Norberg 4 , Bruce A. Peterson 6 , Will Sutherland 3 , Keith Taylor 11 (The 2dFGRS Team) 1. Institute of Astronomy, Madingley Road, Cambridge CB3 OHA. UK. 2. Theoretical Astrophysics, Caltech, Pasadena, CA 91125, USA. 3. Institute for Astronomy, University of Edinburgh, Royal Observatory, Blackford Hill, Edinburgh, EH9 3HJ, UK. 4. Department of Physics, University of Durham, South Road, Durham DH1 3LE, UK. 5. Anglo-Australian Observatory, P.O. Box 296, Epping, NSW 2121, Australia. 6. Research School of Astronomy and Astrophysics, The Australian National University, Weston Creek, ACT 2611, Australia 7. Astrophysics Research Institute, Liverpool John Moores University, Twelve Quays House, Birkenhead, L14 1LD, UK 8. Department of Astrophysics, University of New South Wales, Sydney, NSW 2052, Australia. 9. Astrophysics, Nuclear and Astrophysics Laboratory, University of Oxford, Keble Road, Oxford OX1 3RH, UK. 10. School of Physics and Astronomy, University of St Andrews, North Haugh, St Andrews, Fife, KY6 9SS, UK. 11. Department of Astronomy, Caltech, Pasadena, CA 91125, USA. 12. Department of Physics and Astronomy, Johns Hopkins University, Baltimore, MD 21218-2686, USA. 13. Department of Physics, University of Leeds, Woodhouse Lane, Leeds, LS2 9JT, UK. 14. School of Physics and Astronomy, University of Nottingham, Nottingham, NG7 2RD, UK. 1 February 2008 ABSTRACT We perform a joint likelihood analysis of the power spectra of the 2dF Galaxy Red- shift Survey (2dFGRS) and the cosmic microwave background (CMB) anisotropies under the assumptions that the initial fluctuations were adiabatic, Gaussian and well described by power laws with scalar and tensor indices of n s and n t . On its own, the 2dFGRS sets tight limits on the parameter combination Ω m h ⋆ , but relatively weak limits on the fraction of the cosmic matter density in baryons Ω b /Ω m . The CMB anisotropy data alone set poor constraints on the cosmological constant and Hubble constant because of a ‘geometrical degeneracy’ among parameters. Furthermore, if tensor modes are allowed, the CMB data allow a wide range of values for the physical densities in baryons and cold dark matter (ω b =Ω b h 2 and ω c =Ω c h 2 ). Combin- ing the CMB and 2dFGRS data sets helps to break both the geometrical and tensor mode degeneracies. The values of the parameters derived here are consistent with the predictions of the simplest models of inflation, with the baryon density derived from primordial nucleosynthesis and with direct measurements of the Hubble parameter. In particular, we find strong evidence for a positive cosmological constant with a ±2σ range of 0.65 < Ω Λ < 0.85, completely independently of constraints on Ω Λ derived from Type Ia supernovae. Key words: Galaxy clustering, large-scale structure, cosmic microwave background- cosmology: miscellaneous. ⋆ Here h is Hubble’s constant H 0 in units of 100kms -1 Mpc -1 . The cosmic densities in baryons, cold dark matter and vacuum c 0000 RAS

Welcome message from author
This document is posted to help you gain knowledge. Please leave a comment to let me know what you think about it! Share it to your friends and learn new things together.
Transcript
arX
iv:a
stro
-ph/
0109
152v
1 1
0 Se
p 20
01Mon. Not. R. Astron. Soc. 000, 000–000 (0000) Printed 1 February 2008 (MN LATEX style file v1.4)
Evidence for a non-zero Λ and a low matter density from a
combined analysis of the 2dF Galaxy Redshift Survey and
Cosmic Microwave Background Anisotropies
G. Efstathiou1,2, Stephen Moody1, John A. Peacock3, Will J. Percival3,Carlton Baugh4, Joss Bland-Hawthorn5, Terry Bridges5, Russell Cannon5,Shaun Cole4, Matthew Colless6, Chris Collins7, Warrick Couch8, Gavin Dalton9,Roberto De Propis8, Simon P. Driver10, Richard S. Ellis11, Carlos S. Frenk4,Karl Glazebrook12, Carole Jackson6, Ofer Lahav1, Ian Lewis5, Stuart Lumsden13,Steve Maddox14, Peder Norberg4, Bruce A. Peterson6, Will Sutherland3,Keith Taylor11 (The 2dFGRS Team)1. Institute of Astronomy, Madingley Road, Cambridge CB3 OHA. UK.
2. Theoretical Astrophysics, Caltech, Pasadena, CA 91125, USA.
3. Institute for Astronomy, University of Edinburgh, Royal Observatory, Blackford Hill, Edinburgh, EH9 3HJ, UK.
4. Department of Physics, University of Durham, South Road, Durham DH1 3LE, UK.
5. Anglo-Australian Observatory, P.O. Box 296, Epping, NSW 2121, Australia.
6. Research School of Astronomy and Astrophysics, The Australian National University, Weston Creek, ACT 2611, Australia
7. Astrophysics Research Institute, Liverpool John Moores University, Twelve Quays House, Birkenhead, L14 1LD, UK
8. Department of Astrophysics, University of New South Wales, Sydney, NSW 2052, Australia.
9. Astrophysics, Nuclear and Astrophysics Laboratory, University of Oxford, Keble Road, Oxford OX1 3RH, UK.
10. School of Physics and Astronomy, University of St Andrews, North Haugh, St Andrews, Fife, KY6 9SS, UK.
11. Department of Astronomy, Caltech, Pasadena, CA 91125, USA.
12. Department of Physics and Astronomy, Johns Hopkins University, Baltimore, MD 21218-2686, USA.
13. Department of Physics, University of Leeds, Woodhouse Lane, Leeds, LS2 9JT, UK.
14. School of Physics and Astronomy, University of Nottingham, Nottingham, NG7 2RD, UK.
1 February 2008
ABSTRACT
We perform a joint likelihood analysis of the power spectra of the 2dF Galaxy Red-shift Survey (2dFGRS) and the cosmic microwave background (CMB) anisotropiesunder the assumptions that the initial fluctuations were adiabatic, Gaussian and welldescribed by power laws with scalar and tensor indices of ns and nt. On its own, the2dFGRS sets tight limits on the parameter combination Ωmh⋆, but relatively weaklimits on the fraction of the cosmic matter density in baryons Ωb/Ωm. The CMBanisotropy data alone set poor constraints on the cosmological constant and Hubbleconstant because of a ‘geometrical degeneracy’ among parameters. Furthermore, iftensor modes are allowed, the CMB data allow a wide range of values for the physicaldensities in baryons and cold dark matter (ωb = Ωbh
2 and ωc = Ωch2). Combin-
ing the CMB and 2dFGRS data sets helps to break both the geometrical and tensormode degeneracies. The values of the parameters derived here are consistent with thepredictions of the simplest models of inflation, with the baryon density derived fromprimordial nucleosynthesis and with direct measurements of the Hubble parameter.In particular, we find strong evidence for a positive cosmological constant with a ±2σrange of 0.65 < ΩΛ < 0.85, completely independently of constraints on ΩΛ derivedfrom Type Ia supernovae.
Key words: Galaxy clustering, large-scale structure, cosmic microwave background-cosmology: miscellaneous.
⋆ Here h is Hubble’s constant H0 in units of 100kms−1Mpc−1. The cosmic densities in baryons, cold dark matter and vacuum
c© 0000 RAS
2 G. Efstathiou et al.
1 INTRODUCTION
Until recently, cosmology was a subject starved of data, withpoor or non-existent constraints on fundamental quantitiessuch as the curvature of the Universe, the power spectrumof density irregularities. and the cosmic densities in baryons,cold dark matter and vacuum energy. The situation haschanged dramatically over the last few years. Following thediscovery of the CMB anisotropies (Smoot et al. 1992) itwas realized that many of the fundamental parameters ofour Universe could be determined via accurate, high resolu-tion measurments of the CMB (e.g. Bond et al. 1994, Jung-man et al. 1996). This has now become a reality through anumber of exquisite ground based and balloon experiments(see Halverson et al. 2001; Lee et al. 2001; Netterfield etal. 2001). Constraints on cosmological parameters derivedfrom these experiments are described in several recent pa-pers (de Bernadis et al. 2001; Pryke et al. 2001; Stompor etal. 2001; Wang, Tegmark & Zaldarriaga 2001).
Significant advances have also been made in survey-ing large scale structure in the Universe. The developmentof wide-field correctors and multi-fibre spectroscopy meansthat it is now possible to measure redshifts of hundreds ofthousands of galaxies. Two such redshift surveys are under-way. The 2dF Galaxy Redshift Survey (2dFGRS) utilisesthe 2dF instrument at the Anglo-Australian Telescope andis based on a revised version of the APM Galaxy Survey(Maddox et al. 1990) limited at bJ = 19.45. Redshifts havenow been measured for over 175 000 galaxies (see Colless etal. 2001, for a description of this survey). The Sloan Dig-ital Sky Survey (SDSS, York et al. 2000) is a CCD imag-ing and spectroscopic survey that aims to measure redshiftsfor a sample of 900 000 galaxies. An analysis of the galaxypower spectrum from the 2dFGRS is described by Percivalet al. (2001, hereafter P01). First results on galaxy cluster-ing from a subsample of the SDSS are presented by Zehaviet al. (2001).
In addition, a number of other investigations havegreatly improved the accuracy of various cosmological pa-rameters. For example, surveys of high redshift Type Ia su-pernovae have revealed tantalizing evidence for an acceler-ating Universe (Perlmutter et al. 1999, Riess et al. 1999);the HST Hubble key project has concluded that H0 =72 ± 8 km s−1Mpc−1 (Freedman et al. 2001); primor-dial nucleosythesis and deuterium abundance measurementsfrom quasar absorption lines imply a baryon density ωb =0.020 ± 0.002 (Burles & Tytler 1998ab; Burles, Nollett &Turner 2001). With these and many other ambitious projectsat various stages of development (e.g. weak shear lensing sur-veys, CMB interferometers, CMB polarization experiments,
the MAP, Planck and SNAP satellites†) it is clear that theera of quantitative cosmology has arrived.
In this paper, we perform a combined likelihood analy-sis of the CMB anisotropy data and of the 2dFGRS galaxypower spectrum measured by P01. We assume that the ini-tial fluctuations were Gaussian, adiabatic and described by
energy are denoted by Ωb, Ωc and ΩΛ. The total matter densityis Ωm = Ωb +Ωc and the curvature is fixed by Ωk = 1−Ωm−ΩΛ.† Descriptions of these satellites can be found on the follow-ing web pages: http://snap.lbl.gov/, http://map.gsfc.nasa.gov,http://astro.estec.esa.nl/SA-general/Projects/Planck.
power-law fluctuation spectra. Matter is assumed to consistof baryons and cold dark matter (CDM) and neutrinos areassumed to have negligible rest masses. We allow tensor andscalar modes and place no constraints on their respectivespectral indices and relative amplitudes. Almost all previ-ous analyses of the CMB anisotropies have neglected tensormodes. However, including tensor modes introduces a ma-jor new degeneracy (referred to as the tensor degeneracy inthis paper) that significantly widens the range of allowedparameters (see Efstathiou & Bond 1999, Wang et al. 2001,Efstathiou 2001). The tensor degeneracy can be broken byinvoking additional data sets. Wang et al. 2001 combine theCMB data with measurements of the galaxy power spectrumfrom the IRAS PSCz survey (Hamilton, Tegmark & Pad-manabahn 2000), estimates of the power spectrum on smallscales from observations of the Lyα forest (Croft et al. 2001)and limits on the Hubble constant from HST Hubble KeyProject. Here we investigate how the major parameter de-generacies can be broken by combining the CMB data withthe 2dFGRS power spectrum. The 2dFGRS power spectrumis based on a large survey, with well controlled errors, and asdemonstrated by P01 already sets interesting limits on thematter content of the Universe. Our expectation (see Efs-tathiou 2001) is that a joint analysis of the CMB and 2dF-GRS will produce accurate estimates of the baryonic andmatter densities of the Universe and set useful limits on acosmological constant. This expectation is borne out by theresults described in the rest of this paper.
2 LIKELIHOOD ANALYSIS
2.1 Analysis of the 2dFGRS power spectrum
We use the estimates of the galaxy power spectrum and as-sociated covariance matrix computed by P01. As in P01, wefit these estimates to theoretical models of the linear matterpower spectrum of CDM models using the fitting formulaeof Eisenstein & Hu (1998). The fits are restricted to thewavenumber range 0.02 < k/(h Mpc−1) < 0.15. Redshift-space distortions (see Peacock et al. 2001) and non-linearevolution of the power spectrum have negligible effect onthe shape of the power spectrum at these wavenumbers.We will assume that the galaxy power spectrum within thiswavenumber range is directly proportional to the linear mat-ter power spectrum. This is a key assumption in the analysispresented in this paper. The lower wavenumber limit is im-posed (conservatively) to reduce the sensitivity of the anal-ysis to fits to the redshift distribution of galaxies, which arecomputed independently for different zones of the survey.Since the 2dFGRS has a complex geometry, the theoreticalpower spectra must be convolved with the spherical averageover wavenumber of the survey ‘window function’. Theseconvolved theoretical estimates are used together with thespherically averaged estimates of the power spectrum of thedata and the covariance matrix (computed from Gaussianrealizations of the 2dFGRS) to form a likelihood function.We refer the reader to P01 for a full discussion of each ofthese steps in the analysis.
In general, the linear power spectrum with wavenum-ber measured in inverse Mpc depends on the baryonic andCDM physical densities (ωb and ωc), the scalar spectral in-dex ns and an overall amplitude A (the amplitude is treated
c© 0000 RAS, MNRAS 000, 000–000
CMB and the 2dF Galaxy Redshift Survey 3
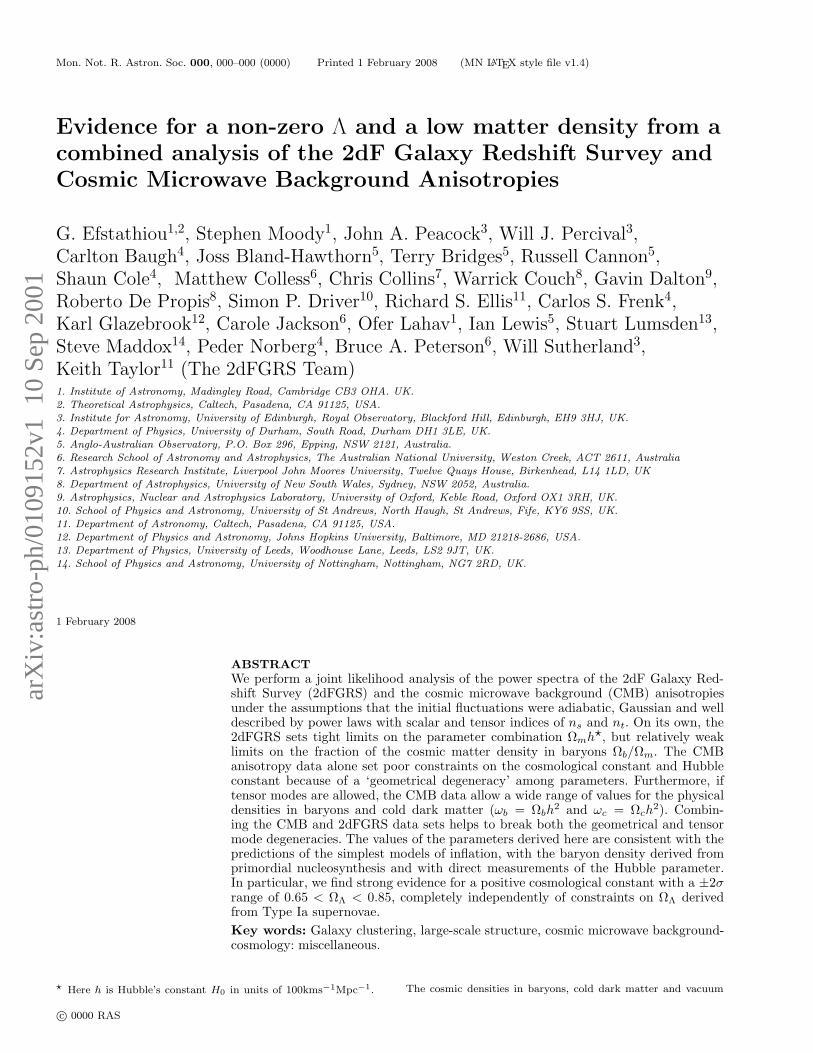
Figure 1. Contours (1, 2 and 3σ) of the pseudo-marginalizedlikelihood functions (see text for details) for various pairs of pa-rameters computed by fitting to the galaxy power spectrum of the2dFGRS. These contours correspond to changes in the likelihoodof 2∆ln(L) of 2.3, 6.0 and 9.2. The crosses show the position of
maximum likelihood.
as an ‘ignorable’ parameter in this paper and so its precisedefinition is unimportant). However since we use redshiftto measure distances, the wavenumber of the observationsscales as h Mpc−1. The comparison of theory with obser-vations therefore requires the introduction of the parame-ter h. In fact, the set of variables A, ns, Ωmh, ωb/ωm andh are natural variables for an analysis of large-scale struc-ture: the combination Ωmh defines the overall shape of theCDM transfer function ( and for negligible baryon densityis sometimes denoted by the shape parameter Γ), while theratio ωb/ωm determines the amplitude of baryonic oscilla-tory features in the transfer function (Eisenstein & Hu 1998;Meiksin, Peacock & White 1999).
Fig. 1 shows various two-dimensional projections of the‘pseudo-marginalized’ 2dFGRS likelihood function. Whenusing a large number of parameters (as in the CMB andCMB+2dFGRS analyses described in the next two subsec-tions), it is impractical to compute marginalized likelihoodcontours by numerically integrating over the likelihood dis-tribution. Instead, a ‘pseudo-marginalized’ likelihood func-tion in p out of M parameters is computed by setting theremaining M − p parameters at the values which maximisethe likelihood. For a multivariate Gaussian distribution, thisis equivalent to integrating over the M − p parameters as-suming uniform prior distributions (see Tegmark, Zaldar-riaga & Hamilton 2001). However, the actual likelihood dis-tributions are not exactly Gaussian (as is evident from theasymmetrical contours in Figs 1 and 3) and so confidencelimits assigned to pseudo-marginalized distributions are ap-proximate. The contours in the (ωb/ωm, Ωmh) plane can becompared with Fig. 5 of P01 where the spectral index was as-
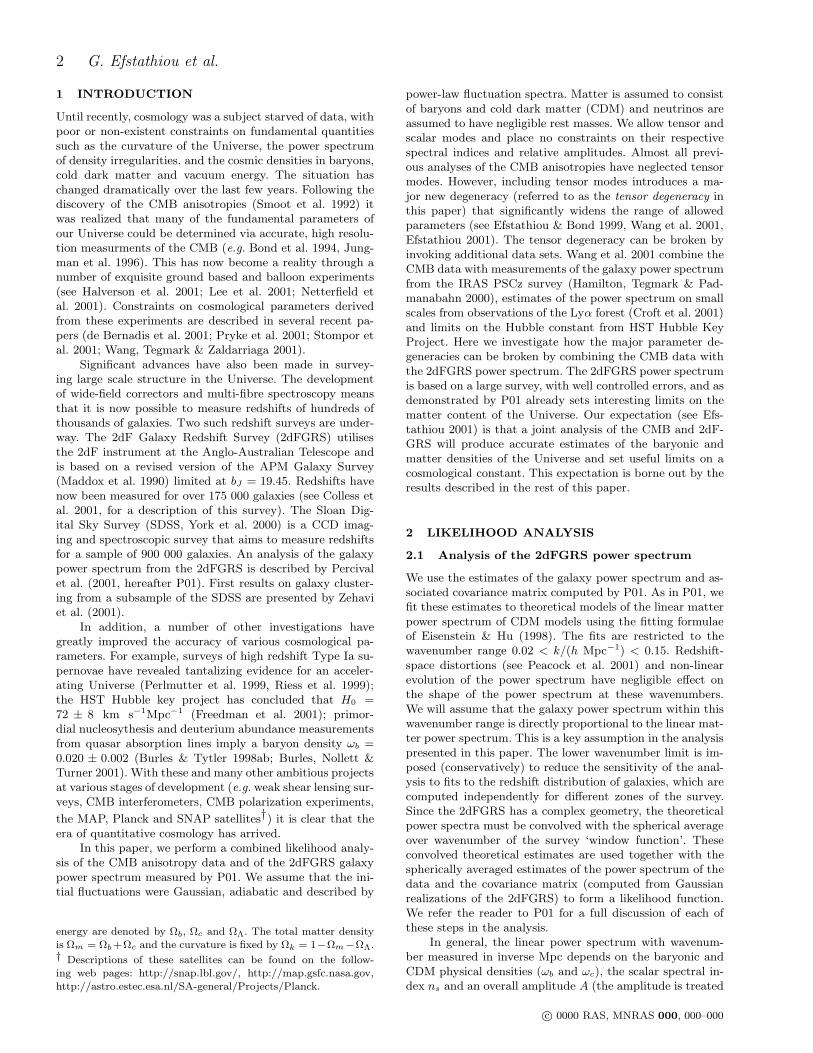
Figure 2. The points show band-averaged observational esti-mates of the CMB power spectrum from Wang et al. (2001) to-gether with ±1σ errors. The lines shows the CMB power spectrafor the adiabatic fiducial inflationary models that provide the bestfit to the CMB and 2dFGRS power spectra. The parameters ofthese model are listed in Table 1. The solid line shows the bestfit without a tensor component (fit B). The dashed line showsthe best fit (fit C) including a tensor component (shown by thedotted line).
sumed to be scale invariant. Relaxing the constraint on thespectral index clearly widens the allowed range of ωb/ωm,but the data still place a tight constraint on the ‘shape’ pa-rameter Ωmh. As we will see below, the constraints on Ωmhand ns prove particularly important in breaking degenera-cies among parameters inherent in the analysis of CMB data.
2.2 Analysis of the CMB anisotropies
The likelihood analysis presented here uses the compilationof band power estimates ∆T 2
B and their covariance matrixCBB′ (including a a model for calibration and beam errors)computed by Wang et al. (2001) from 105 CMB anisotropymeasurements. Each band power estimate is related to thepower spectrum Cℓ of the CMB anisotropies by
∆T 2B =
T 20
2π
∑
ℓ
ℓ(ℓ + 1)CℓWB(ℓ) (1)
where WB is the window function for each band power com-puted by Wang et al. These band-power estimates are plot-ted in Fig. 2.
The likelihood analysis of the CMB data uses nine pa-rameters. These are: ωb and ωc; ΩΛ and Ωk; the scalar andtensor spectral indices ns and nt; the optical depth to Thom-son scattering τopt, assuming that the inter-galactic mediumwas abruptly reionized some time after recombination; theamplitude Q2 of the scalar component and the ratio of rof the tensor to scalar amplitudes. Note that definitions ofthe scalar and tensor amplitudes differ from paper to paper.
c© 0000 RAS, MNRAS 000, 000–000
4 G. Efstathiou et al.
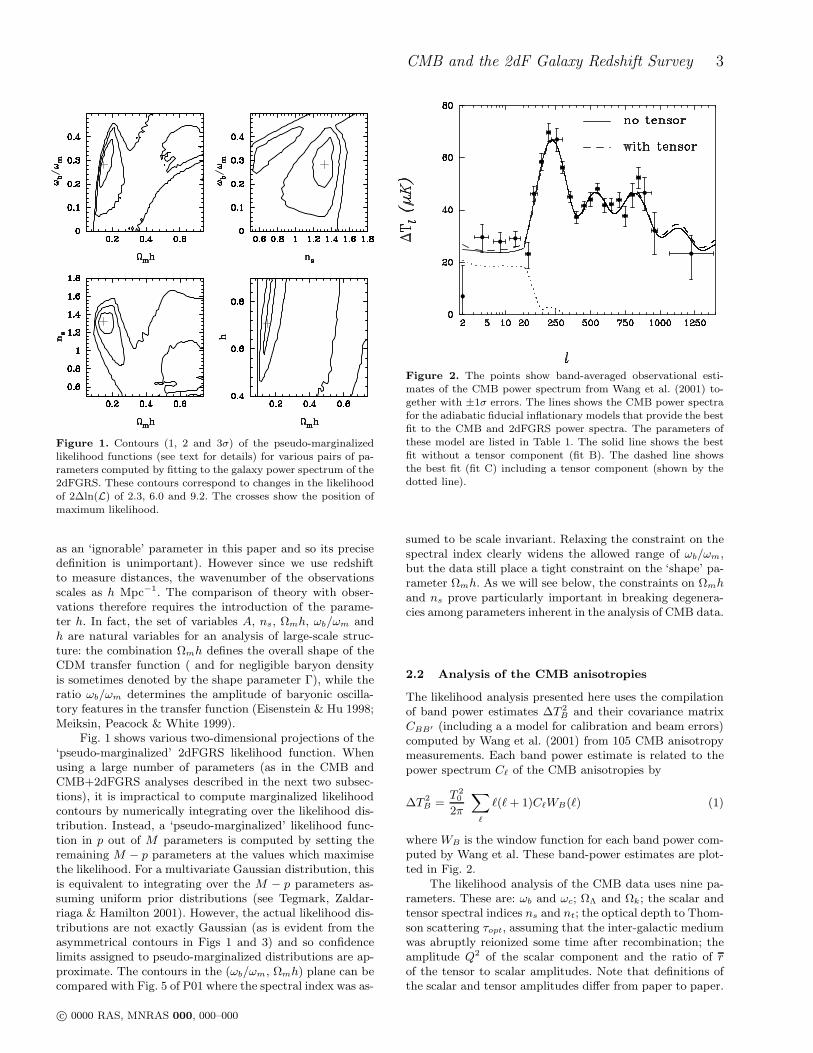
Figure 3. Results of the nine parameter likelihood analysis. Figs 3a and 3b show approximate 1, 2 and 3σ likelihood contours for variousparameter pair combinations computed from an analysis of the CMB data alone. Figs 3a use variables natural to the CMB analysis andillustrate the geometrical and tensor degeneracies. Figs 3b use the variables natural to the analysis of the galaxy power spectrum (asused in Fig. 1). Figs 3c and 3d show the likelihood contours of CMB and 2dFGRS data combined. The crosses in each panel show theposition of the maximum likelihood.
c© 0000 RAS, MNRAS 000, 000–000
CMB and the 2dF Galaxy Redshift Survey 5
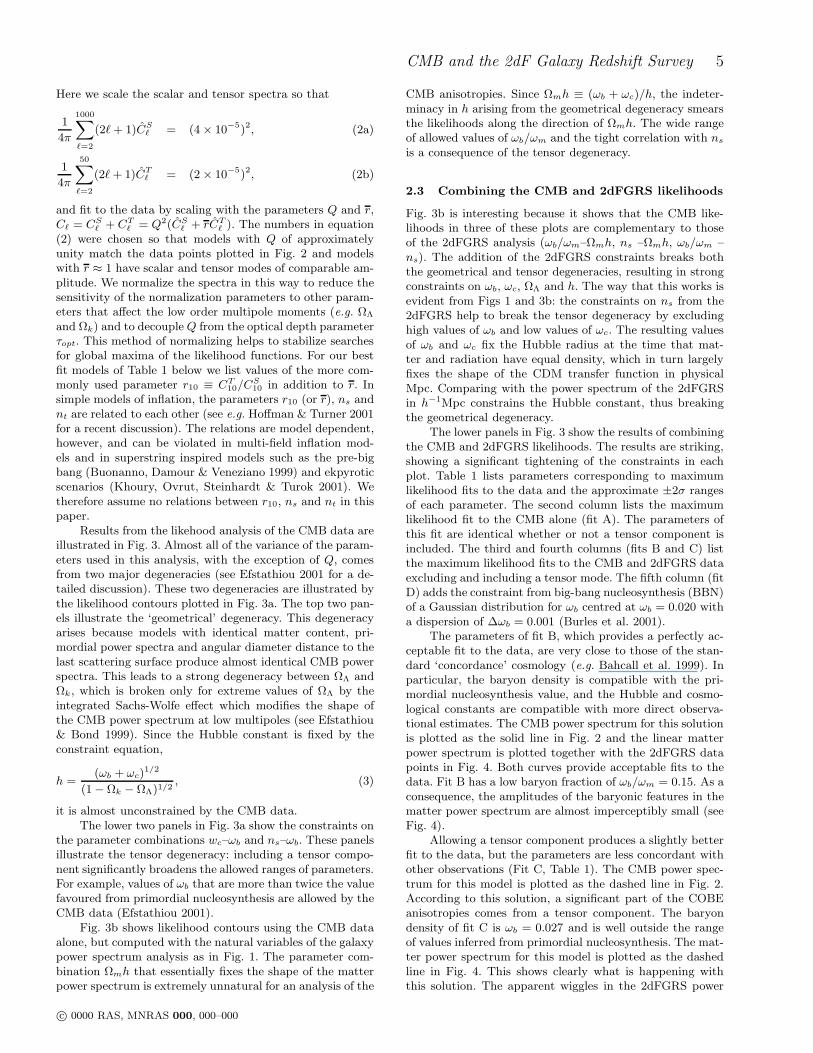
Here we scale the scalar and tensor spectra so that
1
4π
1000∑
ℓ=2
(2ℓ + 1)CSℓ = (4 × 10⁻⁵)2, (2a)
1
4π
50∑
ℓ=2
(2ℓ + 1)CTℓ = (2 × 10⁻⁵)2, (2b)
and fit to the data by scaling with the parameters Q and r,Cℓ = CS
ℓ + CTℓ = Q2(CS
ℓ + rCTℓ ). The numbers in equation
(2) were chosen so that models with Q of approximatelyunity match the data points plotted in Fig. 2 and modelswith r ≈ 1 have scalar and tensor modes of comparable am-plitude. We normalize the spectra in this way to reduce thesensitivity of the normalization parameters to other param-eters that affect the low order multipole moments (e.g. ΩΛ
and Ωk) and to decouple Q from the optical depth parameterτopt. This method of normalizing helps to stabilize searchesfor global maxima of the likelihood functions. For our bestfit models of Table 1 below we list values of the more com-monly used parameter r10 ≡ CT
10/CS10 in addition to r. In
simple models of inflation, the parameters r10 (or r), ns andnt are related to each other (see e.g. Hoffman & Turner 2001for a recent discussion). The relations are model dependent,however, and can be violated in multi-field inflation mod-els and in superstring inspired models such as the pre-bigbang (Buonanno, Damour & Veneziano 1999) and ekpyroticscenarios (Khoury, Ovrut, Steinhardt & Turok 2001). Wetherefore assume no relations between r10, ns and nt in thispaper.
Results from the likehood analysis of the CMB data areillustrated in Fig. 3. Almost all of the variance of the param-eters used in this analysis, with the exception of Q, comesfrom two major degeneracies (see Efstathiou 2001 for a de-tailed discussion). These two degeneracies are illustrated bythe likelihood contours plotted in Fig. 3a. The top two pan-els illustrate the ‘geometrical’ degeneracy. This degeneracyarises because models with identical matter content, pri-mordial power spectra and angular diameter distance to thelast scattering surface produce almost identical CMB powerspectra. This leads to a strong degeneracy between ΩΛ andΩk, which is broken only for extreme values of ΩΛ by theintegrated Sachs-Wolfe effect which modifies the shape ofthe CMB power spectrum at low multipoles (see Efstathiou& Bond 1999). Since the Hubble constant is fixed by theconstraint equation,
h =(ωb + ωc)
1/2
(1 − Ωk − ΩΛ)1/2, (3)
it is almost unconstrained by the CMB data.The lower two panels in Fig. 3a show the constraints on
the parameter combinations wc–ωb and ns–ωb. These panelsillustrate the tensor degeneracy: including a tensor compo-nent significantly broadens the allowed ranges of parameters.For example, values of ωb that are more than twice the valuefavoured from primordial nucleosynthesis are allowed by theCMB data (Efstathiou 2001).
Fig. 3b shows likelihood contours using the CMB dataalone, but computed with the natural variables of the galaxypower spectrum analysis as in Fig. 1. The parameter com-bination Ωmh that essentially fixes the shape of the matterpower spectrum is extremely unnatural for an analysis of the
CMB anisotropies. Since Ωmh ≡ (ωb + ωc)/h, the indeter-minacy in h arising from the geometrical degeneracy smearsthe likelihoods along the direction of Ωmh. The wide rangeof allowed values of ωb/ωm and the tight correlation with ns
is a consequence of the tensor degeneracy.
2.3 Combining the CMB and 2dFGRS likelihoods
Fig. 3b is interesting because it shows that the CMB like-lihoods in three of these plots are complementary to thoseof the 2dFGRS analysis (ωb/ωm–Ωmh, ns –Ωmh, ωb/ωm –ns). The addition of the 2dFGRS constraints breaks boththe geometrical and tensor degeneracies, resulting in strongconstraints on ωb, ωc, ΩΛ and h. The way that this works isevident from Figs 1 and 3b: the constraints on ns from the2dFGRS help to break the tensor degeneracy by excludinghigh values of ωb and low values of ωc. The resulting valuesof ωb and ωc fix the Hubble radius at the time that mat-ter and radiation have equal density, which in turn largelyfixes the shape of the CDM transfer function in physicalMpc. Comparing with the power spectrum of the 2dFGRSin h−1Mpc constrains the Hubble constant, thus breakingthe geometrical degeneracy.
The lower panels in Fig. 3 show the results of combiningthe CMB and 2dFGRS likelihoods. The results are striking,showing a significant tightening of the constraints in eachplot. Table 1 lists parameters corresponding to maximumlikelihood fits to the data and the approximate ±2σ rangesof each parameter. The second column lists the maximumlikelihood fit to the CMB alone (fit A). The parameters ofthis fit are identical whether or not a tensor component isincluded. The third and fourth columns (fits B and C) listthe maximum likelihood fits to the CMB and 2dFGRS dataexcluding and including a tensor mode. The fifth column (fitD) adds the constraint from big-bang nucleosynthesis (BBN)of a Gaussian distribution for ωb centred at ωb = 0.020 witha dispersion of ∆ωb = 0.001 (Burles et al. 2001).
The parameters of fit B, which provides a perfectly ac-ceptable fit to the data, are very close to those of the stan-dard ‘concordance’ cosmology (e.g. Bahcall et al. 1999). Inparticular, the baryon density is compatible with the pri-mordial nucleosynthesis value, and the Hubble and cosmo-logical constants are compatible with more direct observa-tional estimates. The CMB power spectrum for this solutionis plotted as the solid line in Fig. 2 and the linear matterpower spectrum is plotted together with the 2dFGRS datapoints in Fig. 4. Both curves provide acceptable fits to thedata. Fit B has a low baryon fraction of ωb/ωm = 0.15. As aconsequence, the amplitudes of the baryonic features in thematter power spectrum are almost imperceptibly small (seeFig. 4).
Allowing a tensor component produces a slightly betterfit to the data, but the parameters are less concordant withother observations (Fit C, Table 1). The CMB power spec-trum for this model is plotted as the dashed line in Fig. 2.According to this solution, a significant part of the COBEanisotropies comes from a tensor component. The baryondensity of fit C is ωb = 0.027 and is well outside the rangeof values inferred from primordial nucleosynthesis. The mat-ter power spectrum for this model is plotted as the dashedline in Fig. 4. This shows clearly what is happening withthis solution. The apparent wiggles in the 2dFGRS power
c© 0000 RAS, MNRAS 000, 000–000
6 G. Efstathiou et al.
Table 1: Parameters values and errors
approximate ±2σ parameter ranges
Fit A Fit B Fit C Fit D Fit A Fit C Fit D
CMB alone CMB+2dFGRS CMB+2dFGRS CMB+2dFGRS+BBN CMB alone CMB+2dFGRS CMB+2dFGRS+BBN
+ tensor no tensor + tensor + tensor + tensor + tensor + tensor
ωb 0.020 0.021 0.027 0.020 0.016–0.045 0.018–0.034 0.018–0.022
ωc 0.13 0.12 0.085 0.10 0.03–0.18 0.07–0.13 0.08–0.13
ns 0.96 1.00 1.20 1.04 0.89–1.49 0.95–1.31 0.95–1.16
Ωk −0.04 0.001 −0.030 −0.013 −0.68–0.06 −0.05–0.04 −0.05–0.04
ΩΛ 0.43 0.71 0.80 0.73 < 0.88 0.65–0.85 0.65–0.80
τopt 0 0 0 0 < 0.5 < 0.5 < 0.5
nt - −0.10 0.13
r 0 - 0.60 0.20 < 0.98 < 0.87 < 0.82
r10 0 - 1.24 0.26
ωb/ωm 0.14 0.15 0.24 0.17 0.10-0.40 0.13–0.28 0.13–0.22
Ωmh 0.21 0.16 0.19 0.12–0.22 0.16–0.21
h 0.69 0.71 0.66 0.60–0.86 0.61–0.84
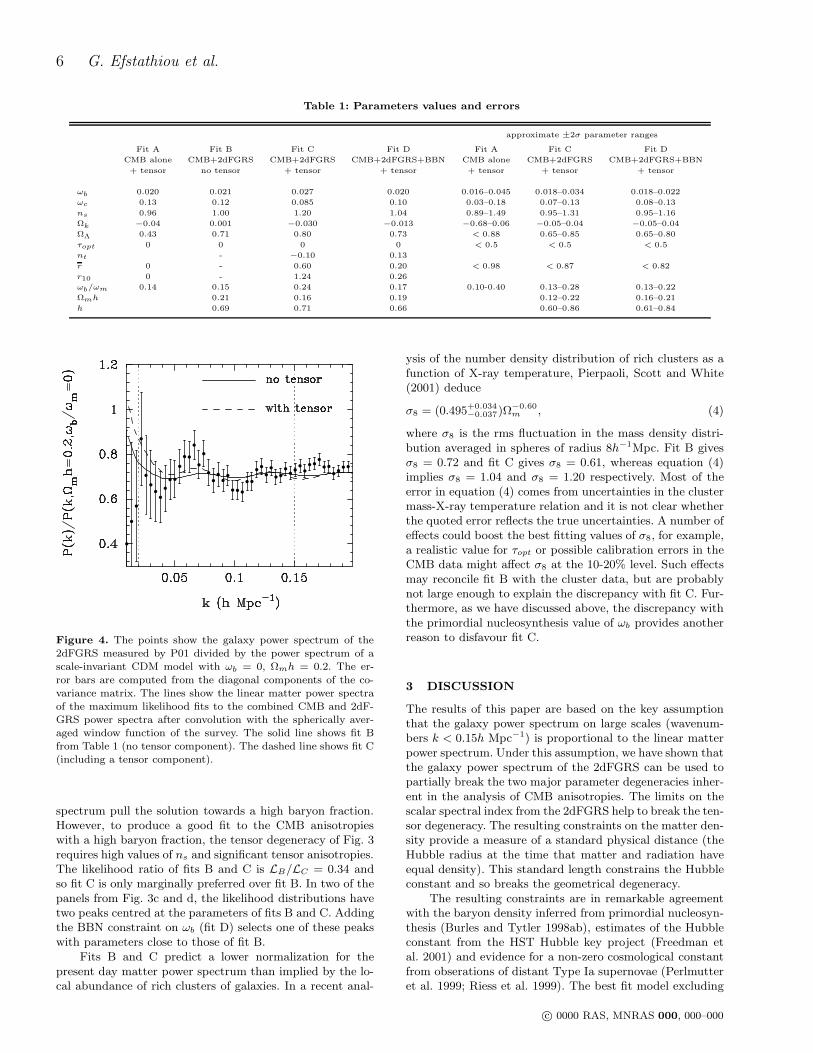
Figure 4. The points show the galaxy power spectrum of the2dFGRS measured by P01 divided by the power spectrum of ascale-invariant CDM model with ωb = 0, Ωmh = 0.2. The er-
ror bars are computed from the diagonal components of the co-variance matrix. The lines show the linear matter power spectraof the maximum likelihood fits to the combined CMB and 2dF-GRS power spectra after convolution with the spherically aver-aged window function of the survey. The solid line shows fit Bfrom Table 1 (no tensor component). The dashed line shows fit C(including a tensor component).
spectrum pull the solution towards a high baryon fraction.However, to produce a good fit to the CMB anisotropieswith a high baryon fraction, the tensor degeneracy of Fig. 3requires high values of ns and significant tensor anisotropies.The likelihood ratio of fits B and C is LB/LC = 0.34 andso fit C is only marginally preferred over fit B. In two of thepanels from Fig. 3c and d, the likelihood distributions havetwo peaks centred at the parameters of fits B and C. Addingthe BBN constraint on ωb (fit D) selects one of these peakswith parameters close to those of fit B.
Fits B and C predict a lower normalization for thepresent day matter power spectrum than implied by the lo-cal abundance of rich clusters of galaxies. In a recent anal-
ysis of the number density distribution of rich clusters as afunction of X-ray temperature, Pierpaoli, Scott and White(2001) deduce
σ8 = (0.495+0.034−0.037)Ω
−0.60m , (4)
where σ8 is the rms fluctuation in the mass density distri-bution averaged in spheres of radius 8h−1Mpc. Fit B givesσ8 = 0.72 and fit C gives σ8 = 0.61, whereas equation (4)implies σ8 = 1.04 and σ8 = 1.20 respectively. Most of theerror in equation (4) comes from uncertainties in the clustermass-X-ray temperature relation and it is not clear whetherthe quoted error reflects the true uncertainties. A number ofeffects could boost the best fitting values of σ8, for example,a realistic value for τopt or possible calibration errors in theCMB data might affect σ8 at the 10-20% level. Such effectsmay reconcile fit B with the cluster data, but are probablynot large enough to explain the discrepancy with fit C. Fur-thermore, as we have discussed above, the discrepancy withthe primordial nucleosynthesis value of ωb provides anotherreason to disfavour fit C.
3 DISCUSSION
The results of this paper are based on the key assumptionthat the galaxy power spectrum on large scales (wavenum-bers k < 0.15h Mpc−1) is proportional to the linear matterpower spectrum. Under this assumption, we have shown thatthe galaxy power spectrum of the 2dFGRS can be used topartially break the two major parameter degeneracies inher-ent in the analysis of CMB anisotropies. The limits on thescalar spectral index from the 2dFGRS help to break the ten-sor degeneracy. The resulting constraints on the matter den-sity provide a measure of a standard physical distance (theHubble radius at the time that matter and radiation haveequal density). This standard length constrains the Hubbleconstant and so breaks the geometrical degeneracy.
The resulting constraints are in remarkable agreementwith the baryon density inferred from primordial nucleosyn-thesis (Burles and Tytler 1998ab), estimates of the Hubbleconstant from the HST Hubble key project (Freedman etal. 2001) and evidence for a non-zero cosmological constantfrom obserations of distant Type Ia supernovae (Perlmutteret al. 1999; Riess et al. 1999). The best fit model excluding
c© 0000 RAS, MNRAS 000, 000–000
CMB and the 2dF Galaxy Redshift Survey 7
a tensor component has parameters that are very close tothose of the standard ‘concordance’ cosmology (Bahcall etal. 1999). However, the combined CMB+2dFGRS data pro-vide weak upper limits on a tensor component (Table 1) andother solutions are possible which have a higher baryon den-sity and baryon fraction. These solutions conflict with thelimits on ωb from primordial nucleosynthesis and require ascalar spectral index ns > 1. The model with high ns andhigh ωb provides a somewhat closer match to the appar-ent ‘wiggles’ in the galaxy power spectrum at wavenumbersk ∼ 0.08h Mpc−1 and k ∼ 0.12h Mpc−1 than is achieved bythe scalar only model (Fig. 4). Neither model fully matchesthe data points, however, and it is plausible that the ap-parent features are enhanced by the noise. New power spec-trum data from the 2dFGRS and the SDSS will soon al-low us to test this hypothesis. It is particularly encourag-ing that the combination of the 2dFGRS and CMB datayields strong evidence for a cosmological constant in therange 0.65 <
∼ ΩΛ<∼ 0.85 based on completely different argu-
ments to those applied to distant Type Ia supernovae. Thissignificantly strengthens the case in favour of an acceleratinguniverse.
Aknowledgments: GE thanks Caltech for the award of aMoore Scholarship. The CMB power spectra in this paperwere computed using the CMBFAST code of Seljak & Zal-darriaga (1996).
REFERENCES
Bahcall N.A., Ostriker J.P., Perlmutter S., Steinhardt P.J., 1999,Science, 284, 1481.
Bond J.R., Efstathiou G., Tegmark M., 1997, MNRAS, 291, L33.
Bond J.R., Crittenden R., Davis R.L., Efstathiou G., SteinhardtP.J., 1994, PRL, 72, 13.
Burles S., Tytler D., 1998a, ApJ, 499, 699.
Buonnano, A., Damour T., Veneziano G., 1999, Nucl. Phys. B.,543, 275.
Burles S., Tytler D., 1998b, ApJ, 507, 732.Burles S., Nollett K.M., Turner M.S., 2001, ApJL. astro-
ph/0010171.
Colless M. et al., 2001, submitted to MNRAS. astro-ph/0106498.Croft R.A.C., Weinberg D.H., Bolte M., Burles S., Hernquist L.,
Katz K., Kirkman D., Tytler D., 2001, ApJ, in press. astro-ph/0012324.
de Bernardis et al., 2001, astro-ph/0012324.Efstathiou G., Bond J.R., 1999, MNRAS, 304, 75.Efstathiou G., 2001, astro-ph/0109151.
Eisenstein D.J., Hu W., 1998, ApJ, 496, 605.Freedman W.L. et al., 2001, ApJ., 553, 47.Halverston N.W. et al. 2001, astro-ph/0104489.
Hamilton A.J.S., Tegmark M., Padmanabhan N., 2000, MNRAS,317, L23.
Hoffman M.B., Turner M.S., 2001, Phs. Rev. D., 64, 023506.
Jungman, G., Kamionkowski M., Kosowsky A., Spergel D.N.,1996, Phys. Rev. D., 54, 1332.
Khoury J., Ovrut B.A., Steinhardt, P.J., Turok N., 2001, hep-th/0103239.
Lee A.T. et al., 2001, astro-ph/0104459 .
Maddox S.J., Efstathiou G., Sutherland W.J., Loveday J., 1990,MNRAS, 242, 43p.
Meiksin A., Peacock J.A., White M., 1999, MNRAS, 304, 851.Netterfield C.B., et al. 2001, astro-ph/0104460.
Peacock J.A. et al., 2001, Nature, 410, 169.
Percival W.J. et al., 2001, MNRAS, in press. astro-ph/0105252.
Perlmutter S. et al., 1999, ApJ, 517, 565.Pierpaoli E., Scott D., White M., 2001, MNRAS, 325, 77.Pryke C., Halverson N.W., Leitch E.M., Kovac J., Carlstrom
J.E., Holzapfel W.L., Dragovan M, submitted to ApJ, astro-ph/0104490.
Riess A.G. et al., 1999, AJ, 117, 707.Seljak U., Zaldarriaga M., 1996, ApJ, 3469, 437.Smoot G.F. et al. 1992, ApJ, 396, L1.Stompor R. et al., submitted to ApJL, astro-ph/0106451.Tegmark M., Zaldarriaga M., Hamilton A.J.S., 2001, Phys. Rev.
D., 63, 043007.Wang X., Tegmark M., Zaldarriaga M., 2001, astro-ph/0105091.York D.G. et al., 2000, AJ, 120, 1579.Zaldarriaga, M., Spergel D.N., Seljak U., 1997 ApJ, 488, 1.Zehavi I. et al., 2001, astro-ph/0106476.
c© 0000 RAS, MNRAS 000, 000–000
Related Documents