Welcome message from author
This document is posted to help you gain knowledge. Please leave a comment to let me know what you think about it! Share it to your friends and learn new things together.
Transcript

i
Evidence-Based Policy Planning for the Leon County Detention Center:
Population Trends and Forecasts
Prepared for the Leon County Sheriff’s Office
January 2018
Authors J.W. Andrew Ranson
William D. Bales Thomas G. Blomberg
William Casey Jennifer Copp
George B. Pesta
Center for Criminology and Public Policy Research College of Criminology and Criminal Justice
Florida State University Tallahassee, Florida

ii
Table of Contents
1. Introduction ................................................................................................................................. 1
1.1 Purpose .................................................................................................................................. 1
1.2 Data Sources .......................................................................................................................... 2
1.3 Forecasting Methods ............................................................................................................. 4
1.4 Limitations in Detention Center Forecasts ............................................................................ 5
2. Trends in Detention Center Bookings......................................................................................... 6
2.1 Detention Center Bookings ................................................................................................... 7
2.2 Bookings by Gender .............................................................................................................. 9
2.3 Bookings by Race ................................................................................................................ 10
2.4 Bookings of Military Veterans ............................................................................................ 11
2.5 Homeless at Time of Booking ............................................................................................. 13
3. Trends in Detention Center Releases ........................................................................................ 14
3.1 Detention Center Releases .................................................................................................. 15
3.2 Releases by Gender ............................................................................................................. 16
3.3 Releases by Race ................................................................................................................. 17
3.4 Releases of Military Veterans ............................................................................................. 18
4. Comparison of Bookings and Releases..................................................................................... 19
4.1 Average Number of Days in the Leon County Detention Center ....................................... 20
5. Leon County Detention Center Population Forecasts ............................................................... 24
5.1 Trends in Pretrial and Total ADP ........................................................................................ 24
5.2 Forecasts of the Average Daily Detention Center Population ............................................ 26
6. Detention Center and County Demographics ........................................................................... 28
6.1 Status Population ................................................................................................................. 28
6.2 Detention Center and County Demographic Projections .................................................... 29
7. Proposed Research Projects ..................................................................................................... 32
Appendix ....................................................................................................................................... 35
References ..................................................................................................................................... 43

1
1. Introduction
This report provides forecasts of the inmate population for the Leon County Detention
Center from October 2017 to October 2023. The Center for Criminology and Public Policy
Research within the College of Criminology and Criminal Justice at Florida State University
(FSU), entered into a cooperative agreement with the Leon County Sheriff’s Office (LCSO) on
June 23, 2017. FSU then determined the availability of existing LCSO data that could be used to
enable forecasts of the Detention Center’s population, collected data on county population trends
and projections, and developed forecasts using Leon County Detention Center, Florida
Department of Corrections (FDOC), and Leon County demographic data. This report presents
forecasts of the average total daily population (ADP), and the daily population awaiting trial.
We use an established method, namely Autoregressive Integrated Moving Average (ARIMA) to
develop our forecasts. Overall, the results provide specific identification of the Leon County
Detention Center’s past, current, and future populations that can be used to inform policies and
programs that affect the Detention Center’s population. In addition, the forecast findings will be
used to guide future research partnerships involving the Leon County Sheriff’s Office and
Florida State University.
1.1 Purpose
The purpose of this project is to (1) conduct forecasting analyses using Detention Center,
arrest, and county data; (2) provide the Leon County Sheriff’s Office with a report of forecasts of
the Leon County Detention Center’s population from October 2017 to October 2022; and (3) to
guide the development of a long-term research agenda between FSU and the LCSO.

2
These forecasts provide reliable estimates of the future population of the Leon County
Detention Center. The report describes the trends in bookings and releases in the Leon County
Detention Center and presents an in-depth examination of the results of the ARIMA analysis
used to forecast the total Detention Center population, and the pretrial population by year and
month through 2022.
1.2 Data Sources
Data were compiled from a variety of sources to conduct the analyses and gain insight
into the trends and characteristics of individuals booked, released, and detained in the Leon
County Detention Center on a given day. The datasets gathered includes Detention Center
bookings, releases, and information on the active population from the LCSO, average daily
Detention Center population from the Florida Department of Corrections (FDOC) (Florida
Department of Corrections, 2017), and detailed information on past and future demographic
characteristics of Leon County residents from the Office of Economic & Demographic Research
of the Florida Legislature (EDR). This section provides a brief description of each dataset.
The LCSO provided FSU with data containing all bookings between January 2012 and
July 2017. These data included the individual’s unique identification number (SPN), date of
booking, date of crime, date of birth, race, sex, citizenship, marital status, county of residence,
employment status, arrest reason, most serious charge, charge level (i.e., felony or
misdemeanor), arresting agency, bond amount, and bond type (i.e., through a professional bail
agent or cash). Each individual booked can have more than one charge and, as a result, more
than one booking entry for each arrest. Furthermore, the same individual may be arrested and
booked multiple times within the period under review. As a result, FSU retained only the first

3
charge for each booking event. After retaining only the first charge, there were 59,570 unique
booking events between January 2012 and July 2017.
FSU also requested a separate dataset containing individual releases between January
2012 and July 2017. These data included the following variables: the individual’s unique
identification number, date of birth, sex, race, date of booking, date of release, type of release,
and reason for release. The average number of days spent in the Detention Center was calculated
from the date of booking and the date of release. As with the booking data, there is a record for
each charge and for each release. Once again, FSU retained only the first charge for each
release, which resulted in 64,365 releases from the Leon County Detention Center in the period
reviewed.
Data on the average daily population (ADP) of the Leon County Detention Center was
obtained from the monthly “Florida County Detention Facilities Average Inmate Population”
reports (Florida Department of Corrections, 2017). These publicly available reports are
published by the FDOC and provide information on all of the county detention facilities in the
State of Florida. This information includes the ADP, the incarceration rate, the number of
individuals being held prior to trial with a felony charge, the number of individuals being held
prior to trial with a misdemeanor charge, and the total percentage of each detention center’s
population consisting of individuals being held prior to trial.
To provide insight into the composition of the Leon County Detention Center on a given
day, FSU received data from the LCSO on the status population. This data included information
on the sex, race, date of birth, bond amount, date of booking, and charge. The file contained
status population information on August 27, 2017 and was comprised of 1,045 individuals.

4
The county demographic data used by FSU was obtained from the EDR. These data
include past and forecasted county populations by sex, race, ethnicity, and age. FSU used these
data to develop demographic-based projections of the Detention Center and county populations
between 2017 and 2022.
The report begins with the Leon County Detention Center’s annual booking and release
trends from January 2012 through December 2016 and monthly trends from January 2012
through July 2017. This section discusses the descriptive statistics on the Detention Center’s
bookings and releases. This discussion includes a comparison between males and females as
well as by race. In addition, it briefly examines special populations within the Detention Center
such as military veterans, and those who were homeless at the time of booking. This is followed
by an examination of the forecasts of the Leon County Detention Center’s population from
October 2017 to October 2022. Finally, the findings of these forecasts are discussed and
suggestions for future research projects based upon the forecasts are identified.
1.3 Forecasting Methods
This section includes a brief examination of the methods used to forecast the Leon
County Detention Center’s population from October 2017 to October 2022. The method used to
forecast the population of the Leon County Detention Center is an Autoregressive Integrated
Moving Average (ARIMA), also known as time-series analysis. ARIMA modeling techniques
are often used to forecast the populations of state prisons and local detention centers. This
method relies upon the use of historical trends in a prison or detention center’s population.
These historical trends are then used to predict the future populations of a prison, detention
center, etc. This method involves a number of steps to provide the most accurate forecast
possible. First, it gives the greatest weight to cases that are closest to the time-period being

5
forecasted. For example, data from September of 2016 is given more weight than data from
September of 2012. Second, this technique considers the seasonal patterns in populations such
as the varying number of releases at different months in the year. This allows for more accurate
forecasts from month to month.
1.4 Limitations in Detention Center Forecasts
There are several issues that must be considered when forecasting detention center
populations. Surette, Applegate, McCarthy, and Jablonski (2006) identified several difficulties
in forecasting detention center populations. These difficulties include the volatility of local
detention center populations, issues with detention center forecasting data, and policy changes
throughout the criminal justice system (Surette et al., 2006).
First, in comparison to state prisons, detention centers house a diverse, volatile
population of inmates. For example, individuals incarcerated in county detention centers
include: pretrial detainees, individuals awaiting transport to state prisons, people serving
sentences in detention, probation violators, and people awaiting transfer to other counties, to
name just a few. This variation in the inmate population makes it more difficult to create a
reliable long-term forecast of a detention center’s population relative to state prisons. This is
partially true because these different groups are often housed in a detention center for varying
amounts of time as well.
Second, when considering data needed accurately provide long-term forecasts for a
detention center, there is often a difference in the data needed versus the data available (Surette
et al., 2006). When forecasting the population of county detention centers, it is critical to have
enough data to provide accurate forecasts of future populations. If there are not enough data it

6
becomes very difficult to make reliable forecasts. For many detention centers, the data needed to
produce accurate forecasts are often not available.
Finally, the population of a county detention center can be severely impacted by the
activities of criminal justice officials (Surette et al., 2006). Law enforcement officers, judges,
prosecutors, and others affect the populations of local detention centers based upon these daily
decisions and actions. For example, decisions to arrest an individual rather than issuing a ticket
can affect the average daily population of a county detention center if it occurs at a high
frequency. The courts can also significantly affect future detention center populations by
increasing or decreasing the amount of bond arrestees are assigned to pay in order to be released
pretrial. Judges can also, alter the detention center populations by increasing and/or decreasing
the number of offenders sentenced to the local detention center and/or by giving longer or shorter
sentences. In addition, larger criminal justice policy decisions can lead to fluctuations in a
detention center’s population. For example, if criminal justice officials decide to intensify the
enforcement of drug offenses, it may lead to larger increases in detention center populations.
When major policy changes occur after a forecast has been produced it may affect the accuracy
of the forecast. Therefore, it is important to consider, when examining forecasts of detention
center populations, the underlying assumption that no major policy changes will occur that will
lead to major changes in a detention center’s population. Additionally, it is important that a new
jail population forecast is monitored on a regular basis to ensure accuracy. If the accuracy
decreases appreciably, generating a new forecast should be considered.
2. Trends in Detention Center Bookings
This section focuses on monthly and annual trends in bookings in the Leon County
Detention Center between January 2012 and July 2017 and begins by illustrating the booking
7
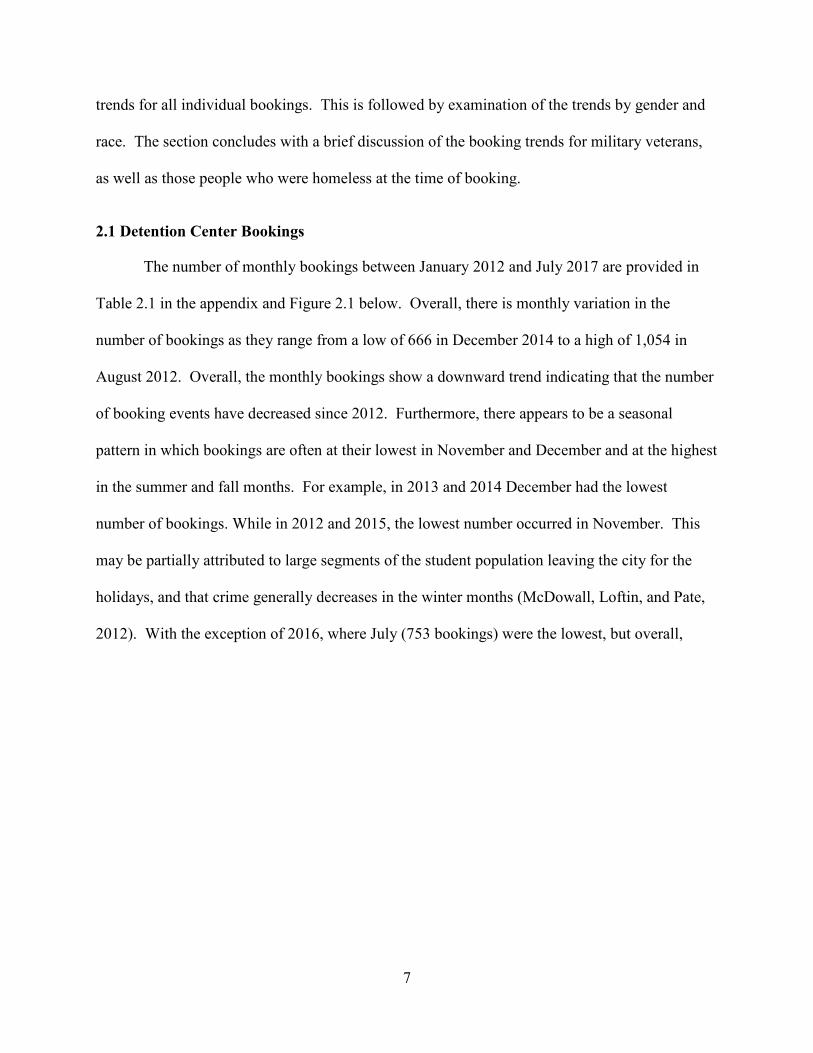
trends for all individual bookings. This is followed by examination of the trends by gender and
race. The section concludes with a brief discussion of the booking trends for military veterans,
as well as those people who were homeless at the time of booking.
2.1 Detention Center Bookings
The number of monthly bookings between January 2012 and July 2017 are provided in
Table 2.1 in the appendix and Figure 2.1 below. Overall, there is monthly variation in the
number of bookings as they range from a low of 666 in December 2014 to a high of 1,054 in
August 2012. Overall, the monthly bookings show a downward trend indicating that the number
of booking events have decreased since 2012. Furthermore, there appears to be a seasonal
pattern in which bookings are often at their lowest in November and December and at the highest
in the summer and fall months. For example, in 2013 and 2014 December had the lowest
number of bookings. While in 2012 and 2015, the lowest number occurred in November. This
may be partially attributed to large segments of the student population leaving the city for the
holidays, and that crime generally decreases in the winter months (McDowall, Loftin, and Pate,
2012). With the exception of 2016, where July (753 bookings) were the lowest, but overall,

8
November and December have the fewest bookings in each year.
Figure 2.2 displays the annual trends in the total number of bookings between 2012 and
2016 (only, years with complete data). This figure illustrates that bookings were at their highest
in 2012 with 11,312. Further, this figure displays the same downward trend in bookings during
the examination period that was discussed when examining the monthly booking trends.
Overall, there was a decline from 11,312 bookings in 2012 to 10,146 bookings in 2016. The
total decline was 1,166 booking events or 10.3%.
0
500
1,000
1,500
2012 2013 2014 2015 2016 2017
Boo
king
s
Year
Figure 2.1 Total Detention Center Bookings by Month 2012- July, 2017

9
2.2 Bookings by Gender
Figure 2.2 also presents the trends in the annual number of bookings from 2012-2016 for
males and females. As with the results from the overall sample, there is a downward trend for
both groups. From 2012-2016 the number of males who were booked dropped from a high of
8,728 in 2012 to a low of 7,839 in 2016. This is a decline of 889 bookings or 10.2% between
2012 and 2016. There was some variation in the annual number of bookings for males.
However, the general trend is a gradual decline in the annual number of bookings with the
exception of 2015, when there was an increase of 255 from 2014.
The number of females booked during this timeframe is significantly lower than the
number of males. The gap between male and female bookings is apparent when examining
Figure 2.2. Although the number of females booked between 2012 and 2016 did decrease, this
8,7288,362
7,893 8,1487,839
2,584 2,632 2,345 2,380 2,307
11,312 10,99410,238 10,528
10,146
2,000
4,000
6,000
8,000
10,000
12,000
2012 2013 2014 2015 2016
Boo
king
s
Year
Figure 2.2: Bookings Per Year for Males, Females, and Total Detention Center Population 2012-2016
Male Female Total
10
decrease was not as large in number as the decrease in the males booked and there was less
variation in the annual bookings for the female population. The total decline between 2012 and
2016 in the number of females booked was 277. However, because the number of female
bookings was already low, the total percentage decrease was similar to that of the male
population namely 10.7%. For detailed examination of the male and female bookings by month,
see Tables 2.2 and 2.3 in the appendix. Table 2.2 contains the monthly bookings for males from
January 2012 through July 2017. While, Table 2.3 contains the monthly bookings for females
from January 2012 through July 2017.
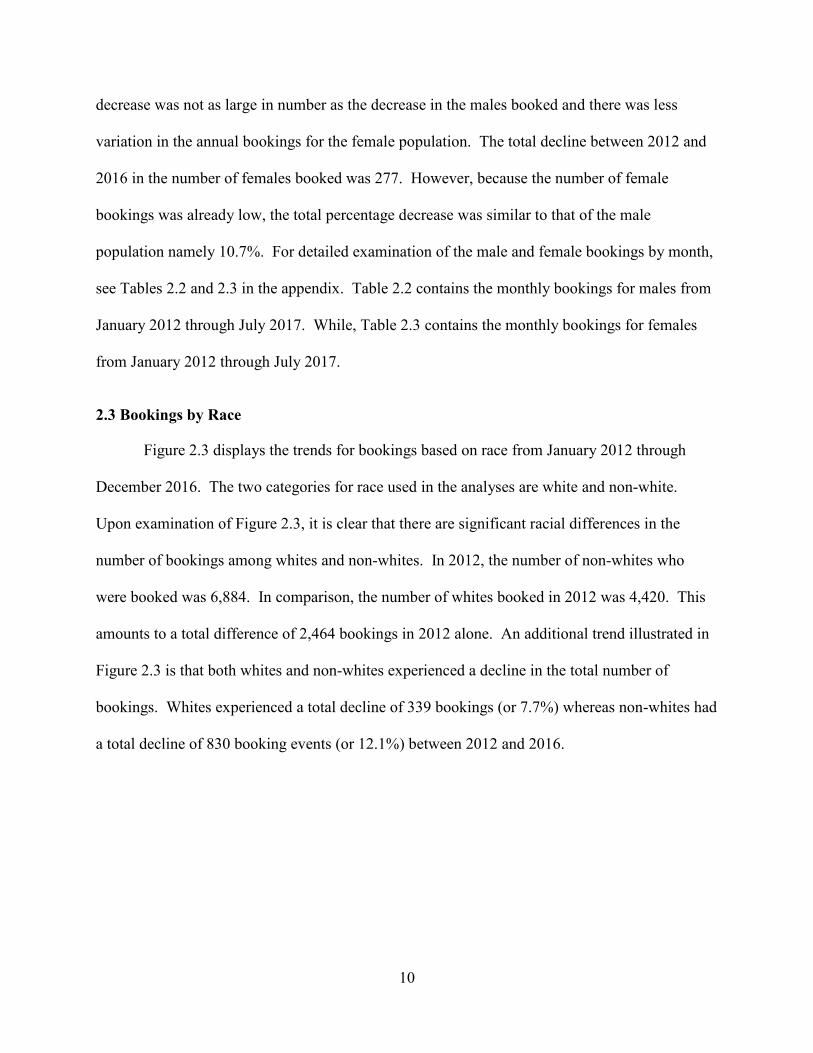
2.3 Bookings by Race
Figure 2.3 displays the trends for bookings based on race from January 2012 through
December 2016. The two categories for race used in the analyses are white and non-white.
Upon examination of Figure 2.3, it is clear that there are significant racial differences in the
number of bookings among whites and non-whites. In 2012, the number of non-whites who
were booked was 6,884. In comparison, the number of whites booked in 2012 was 4,420. This
amounts to a total difference of 2,464 bookings in 2012 alone. An additional trend illustrated in
Figure 2.3 is that both whites and non-whites experienced a decline in the total number of
bookings. Whites experienced a total decline of 339 bookings (or 7.7%) whereas non-whites had
a total decline of 830 booking events (or 12.1%) between 2012 and 2016.

11
2.4 Bookings of Military Veterans
Data were collected and analyzed in relation to two distinct populations incarcerated in
the Leon County Detention Center. These distinct populations are those individuals who are
military veterans and those who were homeless upon booking. Figures 2.4 and 2.5 illustrate the
annual trends in bookings of military veterans and compares bookings of military veterans to
those who were booked but were not military veterans. Upon examination of Figure 2.4, it is
apparent that the number of bookings involving military veterans has increased between 2012
and 2016. However, this increase is minimal. In 2012, 205 military veterans were booked. This
number steadily increased until 2015 and 2016 when the numbers of military veterans who were
booked stabilized at 271 and 270 annually.
6,8846,732
6,286 6,3016,054
4,420 4,2463,936
4,217 4,081
3,000
4,000
5,000
6,000
7,000
8,000
2012 2013 2014 2015 2016
Boo
king
s
Year
Figure 2.3: Bookings by Race 2012-2016
Non-White White

12
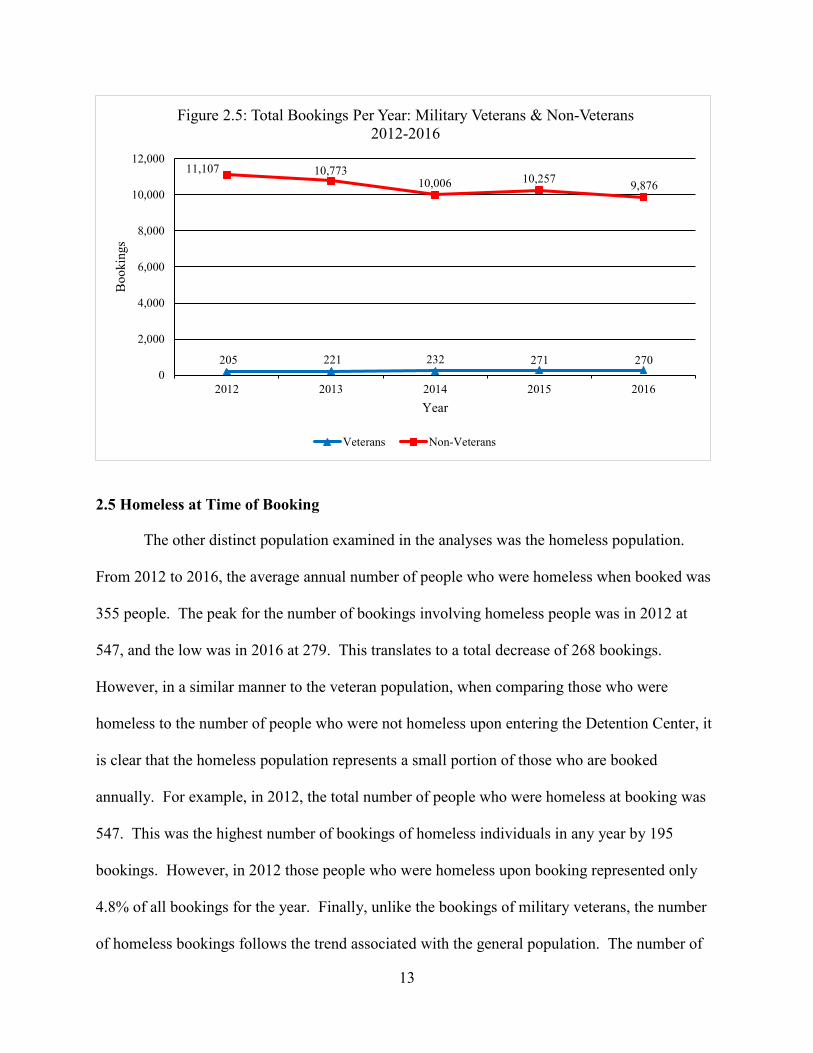
The increase in the booking of military veterans is in contrast to the trends in the general
population. However, this increase is small when compared to the total number of bookings.
Figure 2.5 illustrates this comparison. From 2012 to 2016 the average number of bookings of
non-veterans annually was 10,404. In comparison, the average number of military veterans who
were booked from 2012 to 2016 was 240. In sum, although there was a 31.7% increase in the
number of military veterans who were booked during this time period. This increase made up a
relatively small number of the total bookings.
205
221 232
271270
100
140
180
220
260
300
2012 2013 2014 2015 2016
Boo
king
s
Year
Figure 2.4: Total Military Veterans Bookings Per Year 2012-2016
13
2.5 Homeless at Time of Booking
The other distinct population examined in the analyses was the homeless population.
From 2012 to 2016, the average annual number of people who were homeless when booked was
355 people. The peak for the number of bookings involving homeless people was in 2012 at
547, and the low was in 2016 at 279. This translates to a total decrease of 268 bookings.
However, in a similar manner to the veteran population, when comparing those who were
homeless to the number of people who were not homeless upon entering the Detention Center, it
is clear that the homeless population represents a small portion of those who are booked
annually. For example, in 2012, the total number of people who were homeless at booking was
547. This was the highest number of bookings of homeless individuals in any year by 195
bookings. However, in 2012 those people who were homeless upon booking represented only
4.8% of all bookings for the year. Finally, unlike the bookings of military veterans, the number
of homeless bookings follows the trend associated with the general population. The number of
205 221 232 271 270
11,107 10,77310,006 10,257 9,876
0
2,000
4,000
6,000
8,000
10,000
12,000
2012 2013 2014 2015 2016
Boo
king
s
Year
Figure 2.5: Total Bookings Per Year: Military Veterans & Non-Veterans 2012-2016
Veterans Non-Veterans

14
people who were homeless upon entering the Detention Center decreased by 268 bookings
events between 2012 and 2016.
Overall, we see a decline in the total number of Detention Center bookings of 1,166
between the years of 2012 and 2016. This is an overall decline of 10.3%. Declines in the
number of bookings were found for all populations examined (sex, race, and homelessness)
except for those who were military veterans, with a slight increase in bookings.
3. Trends in Detention Center Releases
This section reports trends in releases from the Leon County Detention Center between
January 2012 and July 2017. In a similar manner to the exploration of booking trends, this
section includes discussion of all releases and releases by gender, race, and the number of
military veterans released from the Leon County Detention Center.
547 352 285 310 279
10,765 10,6429,953 10,218 9,867
0
2,000
4,000
6,000
8,000
10,000
12,000
2012 2013 2014 2015 2016
Boo
king
s
Year
Figure 2.6: Number of Homeless Upon Booking Per Year 2012-2016
Homeless Not Homeless

15
3.1 Detention Center Releases
The total number of monthly releases from the Leon County Detention Center between
January 2012 and July 2017 are displayed in Table 3.1 in the appendix and Figure 3.1 below.
The number of releases ranges from a low of 714 in January 2012 to a high of 1,158 in October
2012 a difference of 444 releases. In a similar manner to bookings, there appears to be some
degree of seasonality in the pattern of releases. Releases tend to be at their highest in the late
summer and early fall, and lower during the months of December and January. For example,
October was the month with either the highest or tied for the highest number of releases in 2012,
2013, and 2015. Figure 3.1 illustrates that although there is considerable variation monthly in
the number of releases, overtime, the average number of releases has remained relatively stable
with a slight decrease between 2012 and 2017.
The annual trends in releases from 2012 to 2016 are displayed in Figure 3.2. The number
of releases increased from 11,633 in 2012 to 12,285 in 2013. This is an increase of 655 or 5.6%.
0
500
1,000
1,500
2012 2013 2014 2015 2016 2017
Rel
ease
s
Year
Figure 3.1: Total Detention Center Releases by Month 2012-July, 2017

16
It was the largest annual increase in releases during the time period examined. Following this
initial increase, the number of releases decreased by 778 to 11,507 in 2014 and declined further
to 11,103 in 2016. This results in a total drop in releases between 2012 and 2016 of 503 or 4.5%.
3.2 Releases by Gender
Tables 3.2 and 3.3 in the appendix display the monthly trends in releases for males and
females from 2012 to July 2017. Much like total releases, there is significant variation in the
number of monthly releases for males and females. For example, the monthly releases of males
range from a low of 547 in January 2012 to a high of 892 in October 2012. The trend in annual
male releases is displayed in Figure 3.2. As with overall releases, there is an increase in releases
between 2012 from 8,967 to 9,408 in 2013. The releases reach their lowest in 2015 at 8,586
before increasing slightly in 2016 to 8,621. Between 2012 and 2016 the total number of releases
of males decreased by 346 or 3.9%.
8,9679,408
8,930 8,586 8,621
2,666 2,8772,577 2,488 2,482
11,633 12,28511,507
11,074 11,103
1,000
3,000
5,000
7,000
9,000
11,000
13,000
2012 2013 2014 2015 2016
Rel
ease
s
Year
Figure 3.2: Releases Per Year by Male, Female, and Total Detention Center Population 2012-2016
Male Female Total

17
Table 3.3 in the appendix displays the monthly Detention Center releases for females
between 2012 and July 2017. The number of releases range from a low of 167 in January 2012
to a high of 266 in October 2012. Figure 3.2 displays trends in the annual number of releases
between 2012 and 2016. As with male releases, the number of female releases increased from
2,666 in 2012 to 2,877 in 2013. However, unlike the male sample, the number of female releases
declined each year from that point forward. Overall, the number of females released declined
from 2,666 in 2012 to 2,482 in 2016. This is a total decrease of 184 releases or 6.9%.
3.3 Releases by Race
When examining trends in releases by race large disparities are apparent. Overall, both
the white and non-white populations experienced decreases in the total number of releases
overtime and this trend generally followed the trend in the total population. The number of non-
white releases decreased by 350 during the time period being examined. In comparison, the
number of white releases decreased by 169 during this same time period. In a similar manner to
bookings, large differences across racial groups exist in the number of releases. Figure 3.3
provides an excellent illustration of the differences in the number of releases. The non-white
population had a considerably higher number of people annually released compared to the white
population. Between 2012 and 2016, the average number of releases of non-whites was 6,994.
In comparison, the average number of releases for whites was 4,470. This resulted in an average
difference of 2,524 annually. Further data and resources are required to determine why racial

18
disparities exist in both bookings and releases.
3.4 Releases of Military Veterans
Figure 3.4 shows the number of military veterans released between 2012 and 2015. The
number of military veterans released increased each year. However, these increases were
relatively small. For example, the largest increase in releases from one year to the next was 34
between 2014 and 2015. In total, the number of military veterans released increased from 220 in
2012 to 307 in 2016, a total increase of 87 releases. One distinguishing aspect regarding the
release of military veterans in comparison to the general population is that military veterans were
the only group that had an increase in releases rather than a decrease. This trend in releases for
veterans aligns closely with the pattern of veteran bookings.
4,5424,697
4,357 4,379 4,373
7,0307,528
7,091
6,6406,680
3,000
4,000
5,000
6,000
7,000
8,000
2012 2013 2014 2015 2016
Rel
ease
s
Year
Figure 3.3: Total Releases Per Year by Race 2012-2016
White Non-White

19
In summary, there was a decline in the number of releases from the Leon County
Detention Facility between 2012 and 2016. From 2012 to 2016 there was a total decrease of 530
releases. For all populations examined, except for military veterans, this same trend was
observed. The number of military veterans who were released from the Detention Center
increased slightly during the period under observation. Finally, large racial disparities exist in
the number of releases between the white and non-white groups, with the number of non-whites
who were released being much larger than whites.
4. Comparison of Bookings and Releases
Figure 4.1 illustrates bookings and releases from 2012 to 2016. In general, the trends in
bookings and releases follow similar patterns. Both decreased in total between 2012 and 2016.
However, the number of bookings saw a larger decrease. One of the major differences between
bookings and releases is that they diverged from one another between 2012 and 2013. Both
started at a very similar level in 2012, but by 2013 the number of releases had increased by 652
220 237 251 285 307
11,41312,048
11,25610,789 10,796
0
2,000
4,000
6,000
8,000
10,000
12,000
2012 2013 2014 2015 2016
Rel
ease
s
Year
Figure 3.4: Total Releases Per Year for Military Veterans & Non-Veterans 2012-2016
Veteran Non-Veteran

20
whereas the number of bookings had decreased by 318. By 2015 the gap between releases and
bookings became smaller before diverging again in 2016.
4.1 Average Number of Days in the Leon County Detention Center
Figure 4.2 provides an illustration of the average number of days released inmates spent
in the Detention Center annually between 2013 and 2016.1 The major trend illustrated by Figure
4.2 is the annual increase in the average number of days in confinement. In total, the average
number of days spent in confinement increased by 13 days between 2013 and 2016. The largest
increase from year to year occurred between 2015 and 2016 when the average number of days in
confinement increased by 6.9 days. In addition, the increase in the average number of days spent
in confinement is associated with an increased average cost of incarceration per inmate. The
1 We omit 2012 because we lack data on bookings prior to 2012. Thus, the amount of time spent in Detention Center for releases in that year would be biased downwards (i.e., the most time any individual could serve would be one year).
11,312 10,994
10,23810,528
10,146
11,63312,285
11,507 11,074 11,103
5,000
6,000
7,000
8,000
9,000
10,000
11,000
12,000
13,000
2012 2013 2014 2015 2016
Boo
king
s and
Rel
ease
s
Year
Figure 4.1: Total Bookings and Releases Per Year 2012-2016
Number of Bookings Number of Releases

21
2017/2018 average daily cost per inmate in the Leon County Detention Center was $74.752.
Using this daily cost rate, the average cost of incarceration per inmate, based on their length of
stay, in 2013 was $2,399.48. In comparison, the average cost of incarceration per inmate, based
on their length of stay, in 2016 was $3,371.23. This translates into an average increase in the
cost of incarceration per inmate between 2013 and 2016 of $971.75.
Figure 4.3 provides an illustration of the average number of days spent in confinement
broken down by month between 2015 and 2016 among released inmates. Much like Figure 4.2,
Figure 4.3 illustrates that the overall trend is an increase in the average number of days spent in
confinement. However, Figure 4.3 shows that there is significant variation in the average
number of days spent in confinement from month to month. For example, in August of 2015 the
average number of days served was 32.3, which was the lowest level between 2015 and 2016. In
2 The daily cost of a Detention Center bed was found in the Leon County Annual Budget & Capital Improvement Program Fiscal Year 2017/2018.
32.1
37.5 38.2
45.1
15
20
25
30
35
40
45
50
2013 2014 2015 2016
Ave
rage
Tim
e Sp
ent i
n D
eten
tion
Cen
ter
Year
Figure 4.2: Average Number of Days Spent in Detention Center 2013-2016

22
July of 2016, the average number of days served was 55 days, the highest level between 2015
and 2016. This is a total difference of 22.7 days served.
Figure 4.4 displays the percentage of releases by the number of days spent in
confinement between 2013 and July 2017. The figure illustrates that 28.9% of individuals
released spent less than 1 day in the Detention Center. A relatively small amount (1%) of
releases spent over one year in the Leon County Detention Center. As a result, while some
individuals spend a significant amount of time incarcerated, these individuals make up a very
small segment of the population.
30
35
40
45
50
55
60
Ave
rage
Len
gth
of S
tay
(In
Day
s)
2015 Month/Year 2016
Figure 4.3: Average Number of Days Spent in the Leon County Detention Center by Month 2015-2016

23
In examining the descriptive statistics regarding the Detention Center’s bookings,
releases, and the average number of days spent in confinement, several trends were identified.
First, the number of bookings and releases both decreased between 2012 and 2016 for all
populations examined, except for military veterans. The number of military veterans booked and
released in the Leon County Detention Center increased slightly between 2012 and 2016.
However, military veterans still represent a very small portion of all bookings and releases, only
2.25% for both between 2012 and 2016. In addition, large racial disparities exist in the number
of bookings and releases. The number of bookings and releases are significantly larger for non-
whites than for whites. The main trends, when examining the average number of days spent in
confinement, were (1) the average increased by a large amount between 2013 and 2016, and (2)
there is large monthly variation in the average number of days spent in confinement. Finally, the
increase in the average number of days spent in confinement results in a large increase in the per
inmate cost of incarceration.
0
5
10
15
20
25
30
35
Perc
ent o
f Det
entio
n C
ente
r Rel
ease
s
Time Spent Category
Figure 4.4: Percent of Releases by Categories of Days Spent in the Leon County Detention Center 2012-July, 2017

24
5. Leon County Detention Center Population Forecasts
This section focuses on the results of the forecasting model created using data from Leon
County and the Florida Department of Corrections. The results of the forecasts can be used to
guide policy implementation and to direct future research partnerships between the Leon County
Sheriff’s Office and Florida State University.
5.1 Trends in Pretrial and Total ADP
Utilizing data from the FDOC’s “Florida County Detention Facilities Average Inmate
Population” monthly reports (Florida Department of Corrections, 2017), FSU evaluated patterns
in Leon County’s inmate population between January 2012 and September 2017 (the latest
publicly available report). These reports provide information on Leon County’s incarceration
rate, the average daily population (ADP) for each month, as well as the percentage of the
Detention Center population that is awaiting trial, the average number of individuals who are
awaiting trial for misdemeanors, and the ADP who are awaiting trial for felonies.
The monthly ADPs between January 2012 and September 2017 are provided in Figure
5.1 below and Table 5.1 in the appendix. In the line representing the total ADP by month, we
see fluctuations with a low of 913 in December 2014 and a peak of 1,113 in June 2015. Table
3.1 in the appendix displays the ADP by year and shows a slight increase in the annual ADP
between 2012 and 2016. While the population declines from 1,040 in 2012 to 1,018 in 2014, it
increases to 1,077 in 2016. Overall, this represents an increase of 3.6% in average annual ADP
between 2012 and 2016.
It is also evident from Figure 5.1, that the majority of the population in the Leon County
Detention Center is comprised of individuals awaiting trial, while those who have been
sentenced or are being held for other reasons (e.g., being held for another jurisdiction) comprise

25
less than half of the population. Overall, the pretrial population ranges from 568 in December of
2014 to 737 in June 2015. Annually, there is a decline among those classified as sentenced/other
from an average of 414 in 2012 to 389 in 2016, a decline of 6%, which is illustrated in Figure
5.1. In contrast, the average annual ADP of individuals awaiting trial increases from 625 in 2012
to 688 in 2016, an increase of 10.1%. Therefore, the annual increase in the total ADP is driven
primarily by an increase in the number of individuals awaiting trial. While we do not display
these totals, this appears to be a function of the number of individuals awaiting trial for felony
charges as it increases from 554 in 2012 to 615 in 2016 (or an increase of 11%). Meanwhile, the
increase in the average number of individuals awaiting trial for misdemeanors is negligible over
the period, increasing from 71 in 2012 to 73 in 2016.
0
200
400
600
800
1,000
1,200
1,400
2012 2013 2014 2015 2016 2017
Ave
rage
Dai
ly P
opul
atio
n
Year
Figure 5.1: Monthly Average Daily Population 2012-September, 2017
Total Population Pretrial Sentenced/Other

26
5.2 Forecasts of the Average Daily Detention Center Population
Based upon data compiled from the DOC monthly reports, a monthly average daily Leon
County Detention Center forecast was developed from October 2017 to December 2022. To
construct these forecasts, as mentioned earlier, we followed a commonly used approach in
correctional forecasting by using Autoregressive Integrated Moving Average (ARIMA). As a
check to ensure the validity of the forecasts, test forecasts were conducted predicting the monthly
levels of the total and the pretrial ADP between January 2016 and September 2017. These
forecasts were then compared to the observed ADP and the pretrial population during this period.
These results demonstrate the forecasting models are accurate.3 To produce the forecasts from
October 2017 to December 2022 the total and pretrial ADP were used from December 2012 to
September 2017.
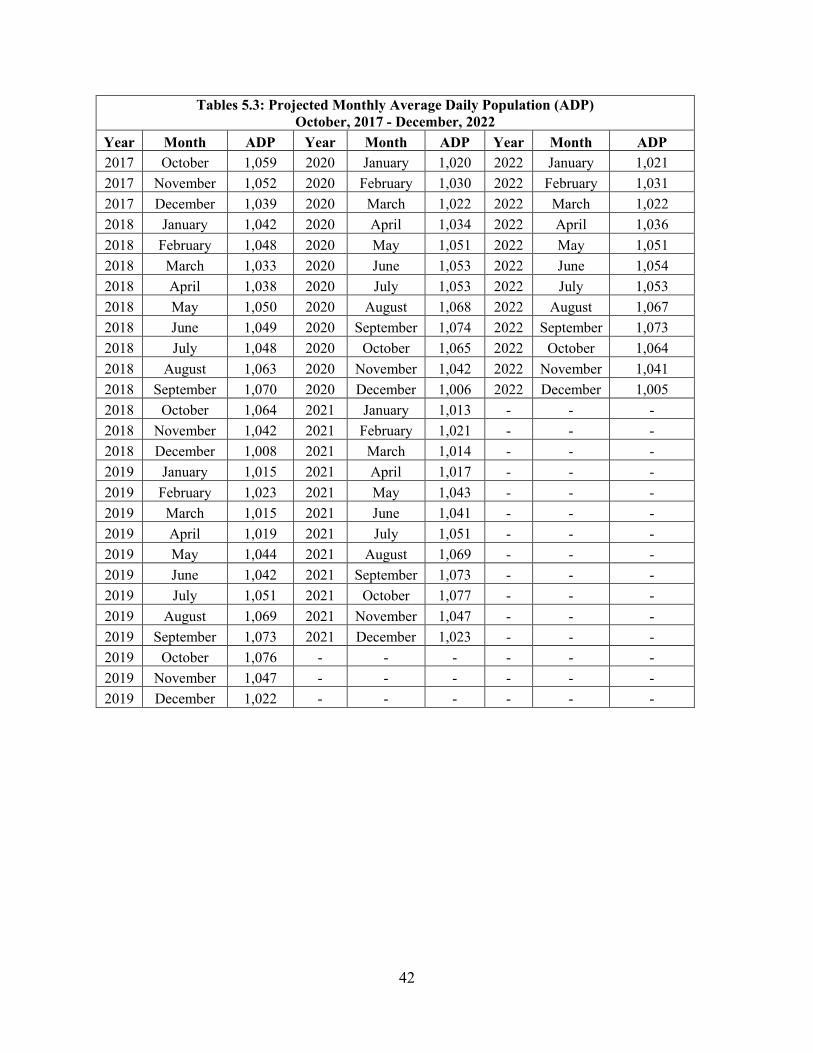
Table 5.2 and Figure 5.2 below display the results of the historical and projected annual
total and pretrial ADP for the Leon County Detention Center. Although the ARIMA models
produce monthly estimates, we display the average ADP for each year. The values for 2017
contain the observed ADPs from the DOC reports from January through September and the
forecasted totals for October through December. The forecast indicates that the ADP will peak
in 2017 at 1,126 and decline to 1,043 in 2022. This is a projected decline of 7.4% in the annual
total ADP. The pretrial ADP peaks in 2016 at 688 and is forecast to decline to 645 by 2020.
The forecast predicts stability in the pretrial population from 2020 to 2022. This is a decline of
6.25% in the annual pretrial ADP from 2016 to 2020. In summary, based on the ARIMA model
both the pretrial and total populations are forecast to remain stable from 2018 to 2022.
3 Result available upon request.

27
Table 5.2: Historical and Projected ADP 2012-2022 Year Total Pretrial
Historical 2012 1,040 625 2013 1,022 624 2014 1,018 612 2015 1,055 661 2016 1,077 688
Projected 2017 1,126 658 2018 1,046 653 2019 1,041 647 2020 1,043 645 2021 1,041 645 2022 1,043 645
625 624 612661
688
658 653 647 645 645 645
1,040 1,022 1,0181,055
1,0771,126
1,046 1,041 1,043 1,041 1,043
400
500
600
700
800
900
1,000
1,100
1,200
2012 2013 2014 2015 2016 2017 2018 2019 2020 2021 2022
Ave
rage
Dai
ly P
opul
atio
n
Year
Figure 5.2: Historical and Projected ADP 2012-2022
Pretrial Total

28
6. Detention Center and County Demographics
This section briefly examines the characteristics of the individuals housed in the Leon
County Detention Center. In addition, this section provides county demographic projections of
populations within the Detention Center and Leon County in general.
6.1 Status Population
The results of the analysis of the status population are displayed in Tables 6.1-6.5. Table
6.1 displays the average bond amount, age, and time spent in the Detention Center as of August
27, 2017. For those who received a bond the average amount was $25,198.15. However, as is
detailed in Table 6.2 below, roughly 42% of individuals in the Detention Center on August 27,
2017 did not have a bond set. The average age of those in the Detention Center was 34.31 years
and the average amount of time in the Detention Center was 169.65 days. However, there was
large variance in the number of days spent in the Detention Center as they ranged from one to
2,148.
Table 6.1: Descriptive Statistics of Status Population Mean Standard Deviation Minimum Maximum
Age 34.31 11.49 17 78 Bond Amount $25,198.15 43,031.13 100 $265,000 Days in Detention Center 169.56 236.48 1 2,148
Table 6.2: Bond Amount by Categories of Status Population
Amount Categories Total Percent $1 - $199 5 0.48%
$200 - $499 15 1.44% $500 - $999 46 4.40%
$1,000 - $1,999 63 6.03% $2,000 - $4,999 83 7.94% $5,000 - $9,999 89 8.52%
$10,000 - $14,999 71 6.79% $15,000+ 237 22.68%
No Bond Set 436 41.72% Total 1045 100%

29
Table 6.3 displays the racial composition of the status population. Six hundred and
seventy-two or 64.31% were black while 369 or 35.31% were white. A small percentage of
individuals (.38% of the population) were either Asian or of unknown racial background. The
composition of the population on August 27, 2017 was 85.59% male and 14.41% female. These
figures are contained in Table 6.4. Also, as documented by the booking data, veterans made up a
relatively small segment of the population of the Detention Center as only 24 individuals or
2.30% were veterans (these results are displayed in Table 6.5).
Table 6.3: Racial Composition of Status Population Race Total Percent Black 672 64.31% White 369 35.31% Other 4 0.38% Total 1,045 100%
Table 6.4: Sex Composition of Status Population
Sex Total Percent Female 150 14.35% Male 891 85.26%
Unknown 4 0.38% Total 1,045 100%
Table 6.5: Veteran Status of Status Population
Status Total Percent Non-Veteran 1,021 97.70%
Veteran 24 2.30% Total 1,045 100%
Overall, the results from the status population suggest that the majority of the population
were male and black. In addition, a small proportion of the population were veterans.
6.2 Detention Center and County Demographic Projections
Table 6.6 provides a breakdown of the number and percentage of each adult demographic
group in the Leon County Detention Center on August 27, 2017. In addition, the table includes a

30
breakdown of the same demographic groups among the general Leon County population.
Overall, blacks were the majority in the Detention Center population on this day. In total, 62.3%
of the Detention Center population were black males. Several other trends emerge when
examining these tables. First, black males ages 25 to 29 comprised a large portion (20.4%) of
the Detention Center’s population on August 27, 2017. This same group in 2017 made up only
1.7% of the adult population in Leon County. In contrast, white males ages 25 to 29 made up
4.2% of the jail population and a similar 3.2% of the adult resident population in Leon County.
When examining the percentage of inmates ages 18 to 24 who are black, data shows that they
make up 14.7% of the Detention Center population but only 3.9% of the adult resident county
population. However, whites in the same age group comprise 3.6% of the Detention Center
population and 7.7% of the adult resident county adult population.

31
Table 6.6: Count and Percentage of Demographic Groups in Leon County & Leon County Detention Center
Demographic Category
Leon County Detention Center
Population on August 27th 2017
Detention Center Population
August 27th 2017
Residents in Leon County
2017
Adult Population
2017
Male Black: 25 to 29 1,070 20.4% 3,938 1.7% Male Black: 18 to 24 772 14.7% 9,213 3.9% Male Black: 30 to 34 625 11.9% 3,117 1.3% Male Black: 35 to 39 330 6.3% 2,606 1.1% Male White: 30 to 34 272 5.2% 5,442 2.3% Male Black: 45 to 54 242 4.6% 4,100 1.7% Male White: 25 to 29 219 4.2% 7,423 3.2% Male White: 18 to 24 190 3.6% 18,118 7.7% Male White: 35 to 39 168 3.2% 5,077 2.2% Male White: 55 to 99 162 3.1% 23673 10.1% Male White: 40 to 44 146 2.8% 4735 2.0% Male Black: 40 to 44 139 2.7% 2,261 1.0% Male White: 45 to 54 135 2.6% 9,894 4.2% Female Black: 25 to 29 106 2.0% 4,574 1.9% Female Black: 30 to 34 106 2.0% 3,568 1.5% Male Black: 55 to 99 89 1.7% 6,368 2.7% Female White: 30 to 34 69 1.3% 5,397 2.3% Female White: 35 to 39 69 1.3% 4,880 2.1% Female Black: 18 to 24 56 1.1% 11,666 5.0% Other Demographic Groups 273 5.2% 99,073 42.1%
TOTAL 5,238 100.0% 235,123 100.0%
Table 6.7 provides the projected Leon County population in 2022, both the overall
change from 2017 to 2022, and the percent change from 2017 to 2022. Overall, all demographic
groups are projected to grow, except for white males ages 45 to 54 who are expected to decrease
by 285 residents in the Leon County population. The populations that are expected to experience
the largest increases are black males age 35 to 39, white males age 55 to 99, black males age 40
to 44, and black males age 55 to 99. Each of these demographic groups are expected to grow by
more than 10% over the next 5 years. Of particular interest to the Leon County Detention

32
Center, is that some of the most at-risk groups for incarceration in the Detention Center are
projected to increase. However, these increases are not large. For instance, black males aged 25
to 29, who make up the largest portion of the Leon County Detention Center, are only expected
to grow by 3.38% over the next five years.
Table 6.7: Projected Change in Leon County Demographics: 2017-2022
Demographic Category Residents in Leon County 2017
Projected Residents in Leon
County 2022 Raw Change Percent
Change
Male Black: 25 to 29 3,938 4,071 133 3.38% Male Black: 18 to 24 9,213 9,732 519 5.63% Male Black: 30 to 34 3,117 3,326 209 6.71% Male Black: 35 to 39 2,606 3,082 476 18.27% Male White: 30 to 34 5,442 5,692 250 4.59% Male Black: 45 to 54 4,100 4,476 376 9.17% Male White: 25 to 29 7,423 7,475 52 0.70% Male White: 18 to 24 18,118 18,220 102 0.56% Male White: 35 to 39 5,077 5,498 421 8.29% Male White: 55 to 99 23,673 26,192 2519 10.64% Male White: 40 to 44 4,735 5,107 372 7.86% Male Black: 40 to 44 2,261 2,690 429 18.97% Male White: 45 to 54 9,894 9,609 -285 -2.88%
Female Black: 25 to 29 4,574 4,797 223 4.88% Female Black: 30 to 34 3,568 3,729 161 4.51% Male Black: 55 to 99 6,368 7,404 1036 16.27%
Female White: 30 to 34 5,397 5,512 115 2.13% Female White: 35 to 39 4,880 5,273 393 8.05% Female Black: 18 to 24 11,666 12,148 482 4.13%
Other Demographic Groups 103,539 105,602 2063 1.99%
TOTAL 235,123 249,635 14512 6.17%
7. Proposed Research Projects
Based upon the results of the forecasts, as well as a review of the data available in the
LCSO data systems, FSU proposes to continue monitoring trends in the population of the Leon
County Detention Center. A number of factors can contribute to changes in the future Detention

33
Center population, including shifts in the resident population, as well as policy changes not only
by the LCSO but by the State Legislature, the Tallahassee Police Department, the City of
Tallahassee, the local county and circuit courts, among others. However, the forecasts detailed
in this report assume stability in these areas. As a result, it is important to continue to monitor
and adjust the forecasts if necessary to ensure that they remain valid and can be used by the
LCSO to effectively plan and budget.
Other projects with the LCSO could include evaluations of various programs and services
provided to inmates, such as pre-trial release programs, visitation, mental health services, reentry
services, probation, and inmate work crew and work camp programs. Evaluation projects are
important because they provide insight into the effectiveness of the programs in achieving their
goals. Furthermore, if a program is determined to be ineffective in reducing recidivism, it may
be advisable to redirect the resources expended on that program to other more effective
programs. It is equally important to simultaneously assess why these programs might be
ineffective. For example, a program may not be effective due to implementation issues as
opposed to program design. Thus, we propose a two-pronged approach focusing on whether a
program is able to achieve its goals and whether it is implemented with integrity and in accord
with the program’s original design. In addition, programs found to be effective at reducing
recidivism or achieving other goals should be considered for additional funding and expansion.
For example, a proposed study on visitation would identify the impact of visitation while
in the Leon County Detention Center on recidivism among offenders released from the Detention
Center. A number of studies have been conducted focusing on the impact of visitation on
recidivism in state prisons and have shown that visitation significantly reduces the likelihood of
recidivism. However, there have been no studies focusing on visitation at local jails or detention

34
centers. The LCSO has particularly rich visitation data that indicates the relationship of visitors
to the inmate, the number of visits as well as the amount of time visiting. As a result, a visitation
study would allow LCSO to be on the cutting edge of this area of research and provide it with
greater information on visitation at the Leon County Detention Center and the potential benefits
of visitation.
We hope to meet soon and jointly agree upon future steps.

35
Appendix
Table 2.1: Total Detention Center Bookings by Month 2012-July, 2017 Year Month Bookings Year Month Bookings Year Month Bookings 2012 January 951 2014 January 796 2016 January 827 2012 February 1,000 2014 February 795 2016 February 847 2012 March 993 2014 March 897 2016 March 857 2012 April 945 2014 April 890 2016 April 908 2012 May 958 2014 May 889 2016 May 844 2012 June 942 2014 June 914 2016 June 858 2012 July 937 2014 July 951 2016 July 753 2012 August 1,054 2014 August 950 2016 August 915 2012 September 899 2014 September 887 2016 September 905 2012 October 1,010 2014 October 878 2016 October 840 2012 November 781 2014 November 725 2016 November 804 2012 December 842 2014 December 666 2016 December 788 2013 January 993 2015 January 859 2017 January 952 2013 February 856 2015 February 843 2017 February 942 2013 March 983 2015 March 886 2017 March 975 2013 April 1,027 2015 April 901 2017 April 887 2013 May 1,029 2015 May 903 2017 May 919 2013 June 926 2015 June 869 2017 June 821 2013 July 976 2015 July 945 2017 July 856 2013 August 984 2015 August 937 - - - 2013 September 815 2015 September 869 - - - 2013 October 917 2015 October 965 - - - 2013 November 759 2015 November 773 - - - 2013 December 729 2015 December 778 - - -

36
Table 2.2: Detention Center Bookings by Month 2012-July, 2017 (Males Only) Year Month Bookings Year Month Bookings Year Month Bookings 2012 January 745 2014 January 602 2016 January 624 2012 February 789 2014 February 594 2016 February 672 2012 March 764 2014 March 694 2016 March 653 2012 April 751 2014 April 698 2016 April 718 2012 May 725 2014 May 704 2016 May 652 2012 June 718 2014 June 694 2016 June 691 2012 July 700 2014 July 746 2016 July 591 2012 August 802 2014 August 713 2016 August 708 2012 September 697 2014 September 679 2016 September 657 2012 October 773 2014 October 680 2016 October 625 2012 November 605 2014 November 577 2016 November 625 2012 December 659 2014 December 512 2016 December 623 2013 January 749 2015 January 672 2017 January 729 2013 February 657 2015 February 652 2017 February 722 2013 March 740 2015 March 696 2017 March 761 2013 April 784 2015 April 709 2017 April 682 2013 May 782 2015 May 700 2017 May 731 2013 June 688 2015 June 670 2017 June 645 2013 July 742 2015 July 719 2017 July 680 2013 August 739 2015 August 720 - - - 2013 September 628 2015 September 651 - - - 2013 October 714 2015 October 759 - - - 2013 November 581 2015 November 591 - - - 2013 December 558 2015 December 609 - - -

37
Table 2.3: Detention Center Bookings by Month 2012-July, 2017 (Females Only) Year Month Bookings Year Month Bookings Year Month Bookings 2012 January 206 2014 January 194 2016 January 203 2012 February 211 2014 February 201 2016 February 175 2012 March 229 2014 March 203 2016 March 204 2012 April 194 2014 April 192 2016 April 190 2012 May 233 2014 May 185 2016 May 192 2012 June 224 2014 June 220 2016 June 167 2012 July 237 2014 July 205 2016 July 162 2012 August 252 2014 August 237 2016 August 207 2012 September 202 2014 September 208 2016 September 248 2012 October 237 2014 October 198 2016 October 215 2012 November 176 2014 November 148 2016 November 179 2012 December 183 2014 December 154 2016 December 165 2013 January 244 2015 January 187 2017 January 223 2013 February 199 2015 February 191 2017 February 220 2013 March 243 2015 March 190 2017 March 214 2013 April 243 2015 April 192 2017 April 205 2013 May 247 2015 May 203 2017 May 188 2013 June 238 2015 June 199 2017 June 176 2013 July 234 2015 July 226 2017 July 176 2013 August 245 2015 August 217 - - - 2013 September 187 2015 September 218 - - - 2013 October 203 2015 October 206 - - - 2013 November 178 2015 November 182 - - - 2013 December 171 2015 December 169 - - -

38
Table 3.1: Total Detention Center Releases by Month 2012-July, 2017 Year Month Releases Year Month Releases Year Month Releases 2012 January 714 2014 January 900 2016 January 902 2012 February 928 2014 February 962 2016 February 934 2012 March 964 2014 March 952 2016 March 934 2012 April 948 2014 April 957 2016 April 974 2012 May 1,004 2014 May 973 2016 May 877 2012 June 975 2014 June 1,039 2016 June 910 2012 July 997 2014 July 999 2016 July 822 2012 August 1091 2014 August 1,018 2016 August 1,000 2012 September 998 2014 September 1,034 2016 September 1,014 2012 October 1,158 2014 October 971 2016 October 911 2012 November 890 2014 November 855 2016 November 928 2012 December 966 2014 December 847 2016 December 897 2013 January 1,057 2015 January 809 2017 January 936 2013 February 954 2015 February 934 2017 February 1,012 2013 March 1,108 2015 March 960 2017 March 1,102 2013 April 1,108 2015 April 904 2017 April 937 2013 May 1,115 2015 May 884 2017 May 1,023 2013 June 1,021 2015 June 954 2017 June 937 2013 July 1,050 2015 July 932 2017 July 816 2013 August 1,045 2015 August 950 - - - 2013 September 955 2015 September 914 - - - 2013 October 1,108 2015 October 1,038 - - - 2013 November 902 2015 November 908 - - - 2013 December 862 2015 December 887 - - -

39
Table 3.2: Total Detention Center Releases by Month 2012-July, 2017 (Males Only) Year Month Releases Year Month Releases Year Month Releases 2012 January 547 2014 January 700 2016 January 679 2012 February 719 2014 February 716 2016 February 734 2012 March 743 2014 March 737 2016 March 725 2012 April 749 2014 April 760 2016 April 763 2012 May 775 2014 May 767 2016 May 689 2012 June 749 2014 June 805 2016 June 706 2012 July 725 2014 July 780 2016 July 644 2012 August 838 2014 August 787 2016 August 801 2012 September 771 2014 September 800 2016 September 750 2012 October 892 2014 October 739 2016 October 676 2012 November 691 2014 November 672 2016 November 741 2012 December 768 2014 December 667 2016 December 713 2013 January 795 2015 January 614 2017 January 710 2013 February 741 2015 February 720 2017 February 771 2013 March 848 2015 March 748 2017 March 867 2013 April 852 2015 April 713 2017 April 739 2013 May 851 2015 May 705 2017 May 826 2013 June 770 2015 June 754 2017 June 729 2013 July 810 2015 July 707 2017 July 629 2013 August 786 2015 August 708 - - - 2013 September 709 2015 September 696 - - - 2013 October 872 2015 October 830 - - - 2013 November 705 2015 November 705 - - - 2013 December 669 2015 December 686 - - -

40
Table 3.3: Total Detention Center Releases by Month 2012-July, 2017 (Female Only) Year Month Releases Year Month Releases Year Month Releases 2012 January 167 2014 January 200 2016 January 223 2012 February 209 2014 February 246 2016 February 200 2012 March 221 2014 March 215 2016 March 209 2012 April 199 2014 April 197 2016 April 211 2012 May 229 2014 May 206 2016 May 188 2012 June 226 2014 June 234 2016 June 204 2012 July 272 2014 July 219 2016 July 178 2012 August 253 2014 August 231 2016 August 199 2012 September 227 2014 September 234 2016 September 264 2012 October 266 2014 October 232 2016 October 235 2012 November 199 2014 November 183 2016 November 187 2012 December 198 2014 December 180 2016 December 184 2013 January 262 2015 January 195 2017 January 226 2013 February 213 2015 February 214 2017 February 241 2013 March 260 2015 March 212 2017 March 235 2013 April 256 2015 April 191 2017 April 198 2013 May 264 2015 May 179 2017 May 197 2013 June 251 2015 June 200 2017 June 208 2013 July 240 2015 July 225 2017 July 187 2013 August 259 2015 August 242 - - - 2013 September 246 2015 September 218 - - - 2013 October 236 2015 October 208 - - - 2013 November 197 2015 November 203 - - - 2013 December 193 2015 December 201 - - -

41
Table 5.1: Monthly Average Daily Population (ADP) January, 2012 - September, 2017 Year Month ADP Year Month ADP Year Month ADP 2012 January 1,010 2014 January 960 2016 January 1,074 2012 February 1,038 2014 February 954 2016 February 1,090 2012 March 1,018 2014 March 971 2016 March 1,060 2012 April 1,026 2014 April 1,027 2016 April 1,089 2012 May 1,039 2014 May 1,043 2016 May 1,097 2012 June 1,037 2014 June 1,074 2016 June 1,113 2012 July 1,034 2014 July 1,071 2016 July 1,088 2012 August 1,049 2014 August 1,097 2016 August 1,092 2012 September 1,090 2014 September 1,078 2016 September 1,092 2012 October 1,070 2014 October 1,044 2016 October 1,066 2012 November 1,051 2014 November 986 2016 November 1,063 2012 December 1,015 2014 December 913 2016 December 998 2013 January 1,000 2015 January 936 2017 January 1,043 2013 February 986 2015 February 942 2017 February 1,084 2013 March 978 2015 March 937 2017 March 1,075 2013 April 975 2015 April 985 2017 April 1,013 2013 May 1,015 2015 May 1,021 2017 May 1,073 2013 June 1,045 2015 June 1,050 2017 June 984 2013 July 1,053 2015 July 1,107 2017 July 991 2013 August 1,083 2015 August 1,134 2017 August 1,020 2013 September 1,097 2015 September 1,127 2017 September 1,035 2013 October 1,072 2015 October 1,184 2017 October - 2013 November 996 2015 November 1,131 2017 November - 2013 December 965 2015 December 1,103 2017 December -
42
Tables 5.3: Projected Monthly Average Daily Population (ADP) October, 2017 - December, 2022
Year Month ADP Year Month ADP Year Month ADP 2017 October 1,059 2020 January 1,020 2022 January 1,021 2017 November 1,052 2020 February 1,030 2022 February 1,031 2017 December 1,039 2020 March 1,022 2022 March 1,022 2018 January 1,042 2020 April 1,034 2022 April 1,036 2018 February 1,048 2020 May 1,051 2022 May 1,051 2018 March 1,033 2020 June 1,053 2022 June 1,054 2018 April 1,038 2020 July 1,053 2022 July 1,053 2018 May 1,050 2020 August 1,068 2022 August 1,067 2018 June 1,049 2020 September 1,074 2022 September 1,073 2018 July 1,048 2020 October 1,065 2022 October 1,064 2018 August 1,063 2020 November 1,042 2022 November 1,041 2018 September 1,070 2020 December 1,006 2022 December 1,005 2018 October 1,064 2021 January 1,013 - - - 2018 November 1,042 2021 February 1,021 - - - 2018 December 1,008 2021 March 1,014 - - - 2019 January 1,015 2021 April 1,017 - - - 2019 February 1,023 2021 May 1,043 - - - 2019 March 1,015 2021 June 1,041 - - - 2019 April 1,019 2021 July 1,051 - - - 2019 May 1,044 2021 August 1,069 - - - 2019 June 1,042 2021 September 1,073 - - - 2019 July 1,051 2021 October 1,077 - - - 2019 August 1,069 2021 November 1,047 - - - 2019 September 1,073 2021 December 1,023 - - - 2019 October 1,076 - - - - - - 2019 November 1,047 - - - - - - 2019 December 1,022 - - - - - -

43
References
Florida Department of Corrections. (2017, September). Florida County Detention Facilities’ Average Inmate Population. Retrieved from Florida Department of Correction: http://www.dc.state.fl.us/pub/Detention Centers/ McDowall, D., Loftin, C., & Pate, M. (2012). Seasonal cycles in crime, and their variability. Journal of Quantitative Criminology, 28, 389-410. Surrette, R., Applegate, B., McCarthy, B., & Jablonski, P. (2006). Self-destructing prophecies: Long-term forecasting of municipal correctional bed need. Journal of Criminal Justice, 34, 57-72.
Related Documents