Evaporites and the salinity of the ocean during the Phanerozoic: Implications for climate, ocean circulation and life William W. Hay a, ⁎ , Areg Migdisov b, ✠ , Alexander N. Balukhovsky b , Christopher N. Wold c , Sascha Flögel d , Emanuel Söding e a 2045 Windcliff Dr., Estes Park, CO 80517, USA b VI Vernadski Institute of Geochemistry and Analytical Chemistry, Russian Academy of Sciences, Kosygin 19, Moscow 119991, Russia c Platte River Associates, 2790 Valmont Road, Boulder, CO 80304, USA d Leibniz-Institute of Marine Sciences (IFM-GEOMAR), Wischhofstrasse 1-3, D-24148 Kiel, Germany e Integrated Ocean Drilling Program Management International, Inc., Sapporo Office, Creative Research Initiative “Sousei” (CRIS), Hokkaido University, N21W10 Kitaku, Sapporo 001-0021, Japan Received 23 March 2005; accepted 24 March 2006 Abstract A compilation of data on volumes and masses of evaporite deposits is used as the basis for reconstruction of the salinity of the ocean in the past. Chloride is tracked as the only ion essentially restricted to the ocean, and past salinities are calculated from reconstructed chlorine content of the ocean. Models for ocean salinity through the Phanerozoic are developed using maximal and minimal estimates of the volumes of existing evaporite deposits, and using constant and declining volumes of ocean water through the Phanerozoic. We conclude that there have been significant changes in the mean salinity of the ocean accompanying a general decline throughout the Phanerozoic. The greatest changes are related to major extractions of salt into the young ocean basins which developed during the Mesozoic as Pangaea broke apart. Unfortunately, the sizes of these salt deposits are also the least well known. The last major extractions of salt from the ocean occurred during the Miocene, shortly after the large scale extraction of water from the ocean to form the ice cap of Antarctica. However, these two modifications of the masses of H 2 O and salt in the ocean followed in sequence and did not cancel each other out. Accordingly, salinities during the Early Miocene were between 37‰ and 39‰. The Mesozoic was a time of generally declining salinity associated with the deep sea salt extractions of the North Atlantic and Gulf of Mexico (Middle to Late Jurassic) and South Atlantic (Early Cretaceous). The earliest of the major extractions of the Phanerozoic occurred during the Permian. There were few large extractions of salt during the earlier Palaeozoic. The models suggest that this was a time of relatively stable but slowly increasing salinities ranging through the upper 40‰'s into the lower 50‰'s. Higher salinities for the world ocean have profound consequences for the thermohaline circulation of the ocean in the past. In the modern ocean, with an average salinity of about 34.7‰, the density of water is only very slightly affected by cooling as it approaches the freezing point. Consequently, salinization through sea-ice formation or evaporation is usually required to make water dense enough to sink into the ocean interior. At salinities above about 40‰ water continues to become more dense as it approaches the freezing point, and salinization is not required. The energy-consuming phase changes involved in sea-ice formation and evaporation would not be required for vertical circulation in the ocean. The hypothesized major declines in salinity correspond closely to the evolution of both planktonic foraminifera and calcareous nannoplankton. Both groups were restricted to shelf regions in the Jurassic and early Cretaceous, but spread into the open ocean in Palaeogeography, Palaeoclimatology, Palaeoecology 240 (2006) 3 – 46 www.elsevier.com/locate/palaeo ⁎ Corresponding author. E-mail address: [email protected] (W.W. Hay). ✠ April 3, 2003. 0031-0182/$ - see front matter © 2006 Elsevier B.V. All rights reserved. doi:10.1016/j.palaeo.2006.03.044

Welcome message from author
This document is posted to help you gain knowledge. Please leave a comment to let me know what you think about it! Share it to your friends and learn new things together.
Transcript

Palaeoecology 240 (2006) 3–46www.elsevier.com/locate/palaeo
Palaeogeography, Palaeoclimatology,
Evaporites and the salinity of the ocean during the Phanerozoic:Implications for climate, ocean circulation and life
William W. Hay a,⁎, Areg Migdisov b,✠, Alexander N. Balukhovsky b,Christopher N. Wold c, Sascha Flögel d, Emanuel Söding e
a 2045 Windcliff Dr., Estes Park, CO 80517, USAb VI Vernadski Institute of Geochemistry and Analytical Chemistry, Russian Academy of Sciences, Kosygin 19, Moscow 119991, Russia
c Platte River Associates, 2790 Valmont Road, Boulder, CO 80304, USAd Leibniz-Institute of Marine Sciences (IFM-GEOMAR), Wischhofstrasse 1-3, D-24148 Kiel, Germany
e Integrated Ocean Drilling Program Management International, Inc., Sapporo Office, Creative Research Initiative “Sousei” (CRIS),Hokkaido University, N21W10 Kitaku, Sapporo 001-0021, Japan
Received 23 March 2005; accepted 24 March 2006
Abstract
A compilation of data on volumes and masses of evaporite deposits is used as the basis for reconstruction of the salinity of theocean in the past. Chloride is tracked as the only ion essentially restricted to the ocean, and past salinities are calculated fromreconstructed chlorine content of the ocean. Models for ocean salinity through the Phanerozoic are developed using maximal andminimal estimates of the volumes of existing evaporite deposits, and using constant and declining volumes of ocean water throughthe Phanerozoic. We conclude that there have been significant changes in the mean salinity of the ocean accompanying a generaldecline throughout the Phanerozoic. The greatest changes are related to major extractions of salt into the young ocean basins whichdeveloped during the Mesozoic as Pangaea broke apart. Unfortunately, the sizes of these salt deposits are also the least well known.The last major extractions of salt from the ocean occurred during the Miocene, shortly after the large scale extraction of water fromthe ocean to form the ice cap of Antarctica. However, these two modifications of the masses of H2O and salt in the ocean followedin sequence and did not cancel each other out. Accordingly, salinities during the Early Miocene were between 37‰ and 39‰. TheMesozoic was a time of generally declining salinity associated with the deep sea salt extractions of the North Atlantic and Gulf ofMexico (Middle to Late Jurassic) and South Atlantic (Early Cretaceous). The earliest of the major extractions of the Phanerozoicoccurred during the Permian. There were few large extractions of salt during the earlier Palaeozoic. The models suggest that thiswas a time of relatively stable but slowly increasing salinities ranging through the upper 40‰'s into the lower 50‰'s.
Higher salinities for the world ocean have profound consequences for the thermohaline circulation of the ocean in the past. Inthe modern ocean, with an average salinity of about 34.7‰, the density of water is only very slightly affected by cooling as itapproaches the freezing point. Consequently, salinization through sea-ice formation or evaporation is usually required to makewater dense enough to sink into the ocean interior. At salinities above about 40‰ water continues to become more dense as itapproaches the freezing point, and salinization is not required. The energy-consuming phase changes involved in sea-ice formationand evaporation would not be required for vertical circulation in the ocean.
The hypothesized major declines in salinity correspond closely to the evolution of both planktonic foraminifera and calcareousnannoplankton. Both groups were restricted to shelf regions in the Jurassic and early Cretaceous, but spread into the open ocean in
⁎ Corresponding author.E-mail address: [email protected] (W.W. Hay).
✠ April 3, 2003.
0031-0182/$ - see front matter © 2006 Elsevier B.V. All rights reserved.doi:10.1016/j.palaeo.2006.03.044
4 W.W. Hay et al. / Palaeogeography, Palaeoclimatology, Palaeoecology 240 (2006) 3–46
the mid-Cretaceous. Their availability to inhabit the open ocean may be directly related to the decline in salinity. The Permianextraction may have created stress for marine organisms and may have been a factor contributing to the end-Permian extinction.The modeling also suggests that there was a major salinity decline from the Late Precambrian to the Cambrian, and it is tempting tospeculate that this may have been a factor in the Cambrian explosion of life.© 2006 Elsevier B.V. All rights reserved.
Keywords: Salinity; Salt; Palaeoceanography; Phanerozoic; Sedimentary cycling
1. Introduction
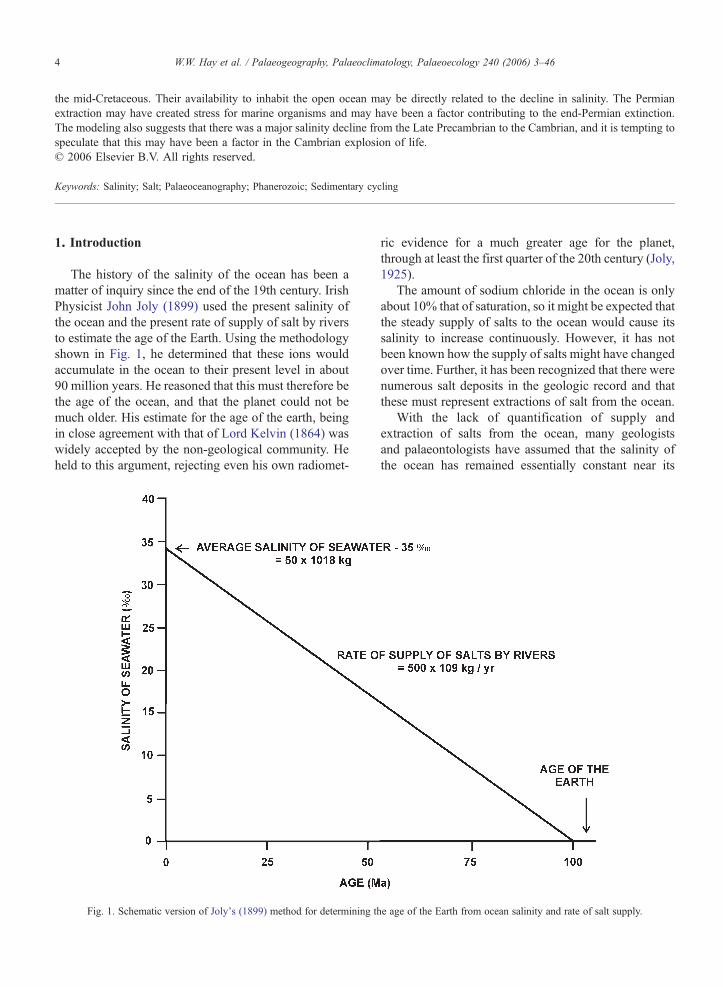
The history of the salinity of the ocean has been amatter of inquiry since the end of the 19th century. IrishPhysicist John Joly (1899) used the present salinity ofthe ocean and the present rate of supply of salt by riversto estimate the age of the Earth. Using the methodologyshown in Fig. 1, he determined that these ions wouldaccumulate in the ocean to their present level in about90 million years. He reasoned that this must therefore bethe age of the ocean, and that the planet could not bemuch older. His estimate for the age of the earth, beingin close agreement with that of Lord Kelvin (1864) waswidely accepted by the non-geological community. Heheld to this argument, rejecting even his own radiomet-
Fig. 1. Schematic version of Joly's (1899) method for determining t
ric evidence for a much greater age for the planet,through at least the first quarter of the 20th century (Joly,1925).
The amount of sodium chloride in the ocean is onlyabout 10% that of saturation, so it might be expected thatthe steady supply of salts to the ocean would cause itssalinity to increase continuously. However, it has notbeen known how the supply of salts might have changedover time. Further, it has been recognized that there werenumerous salt deposits in the geologic record and thatthese must represent extractions of salt from the ocean.
With the lack of quantification of supply andextraction of salts from the ocean, many geologistsand palaeontologists have assumed that the salinity ofthe ocean has remained essentially constant near its
he age of the Earth from ocean salinity and rate of salt supply.
5W.W. Hay et al. / Palaeogeography, Palaeoclimatology, Palaeoecology 240 (2006) 3–46
present value of 34.7‰ through the Phanerozoic(Railsback et al., 1989). Others have made a correctionfor the present mass of fresh water in glacial ice onAntarctica and Greenland (Shackleton and Kennett,1975; Shackleton, 1987; Duplessy et al., 1991, 1993),assuming a global mean salinity of 34.03‰ during ice-free times. Others have constructed more complexschemes taking into account the gradual buildup ofAntarctic ice (Zachos et al., 1994). However, theextractions of salt from the ocean to form evaporitedeposits have been generally disregarded, although ithas been recognized that they must have a significanteffect on ocean salinity (Southam and Hay, 1981).
In this paper we attempt a quantitative reconstructionof the salinity of the ocean through the Phanerozoic,based solely on deposition and sedimentary cycling ofevaporite deposits. However, this may be only part ofthe salinity history of the ocean because there is anotherpotentially large reservoir of salt stored in brines in thepore space of deeply buried sediments on the continentalblocks.
2. Evaporite deposits
2.1. Early estimates of the size of evaporite deposits
The first detailed data on the volumes of evaporitedeposits was Zharkov's (1974, 1981) compilation ofPalaeozoic salt deposits. It fueled speculation that theremight have been changes in salinity of the oceanthrough time, although it was thought that these couldnot have been more than a few per parts per thousand(Holland, 1974, 1978). The then known inventory ofPalaeozoic salt deposits did not allow for a change insalinity of more than about 10%.
When Sigsbee Knoll was drilled on Leg 1 of theDeep Sea Drilling Project in 1967, a very majordiscovery was made: much of the Gulf of Mexico wasunderlain by a vast layer of salt (Ewing et al., 1969).This was soon realized to be the offshore extension ofthe Jurassic Louann salt known from petroleum drillingin Louisiana and east Texas. The idea that salt could bedeposited in basins of oceanic depth was new, and theprojected volume of the salt deposit was far larger thanany known until then on land. This discovery was soonfollowed by the discovery that large areas of theMediterranean and Red Seas were also underlain by salt.
Holland (1974) reported on a series of calculations todetermine whether the relative proportions of major ionsof seawater might have changed sufficiently to bereflected in an alteration of the sequence and mineralogyof salts deposited as seawater evaporates. He reckoned
that the mass of evaporites deposited during thePhanerozoic might be equal to the amount in seawaterand so concluded that any salinity changes could notpossibly have been greater than a factor of two. He alsofound it unlikely that the relative proportions of majorions in seawater could have varied by more than a factorof two.
From other compilations of evaporite deposits itbecame evident that so much salt has been extractedfrom seawater during the Phanerozoic that the salinity ofthe ocean during the Palaeozoic must have been higherthan it is today (Ronov, 1968; Holser et al., 1980), but aquantitative estimate remained elusive. Holland (1984)discussed the problem of salinity and relative ratios ofmajor ions. He cited a personal communication fromHolser in 1981 to the effect that the inventory of halite insedimentary rocks today amounts to about 30% of theNaCl in the ocean, so that the maximum salinity thatmight be expected would be about 45‰.
Since Zharkhov's compilation of Palaeozoic saltdeposits, a number of other Phanerozoic salt depositshave been described. These include not only newdiscoveries on land, but very large deposits ofMesozoic salt in the Gulf of Mexico and in theNorth, Central and South Atlantic, and extensiveMiocene salt underlying broad areas of the Mediterra-nean and Red Seas and Persian Gulf. The present totalinventory amounts to a minimum of 9.1×10⁶ km3 ofhalite, equal to about 19.6×10¹⁸ kg or more than 50%of the total of halite dissolved in the ocean today(36.8×10¹⁸ kg); the maximum estimate is about16.3×106 km3 of halite, equal to 35.2×10¹⁸ kg, or95% of the present total in the ocean. If all this saltwere in the ocean at one time, the salinity would havebeen 57‰ to 73‰, but as Holland (1984) noted thereis no evidence that the total inventory of halite wasdissolved in the sea at any one time.
The first comprehensive compilation of evaporitevolumes was published by Ronov (1980: Table 13) whoextracted the data from the compilations of sedimentvolumes and masses for the major geologic intervals ofthe Phanerozoic that had been published in a series ofpapers by Ronov, Khain, Balukhovsky and Seslavins-kiy. The 25 stratigraphic intervals they recognizedincluded subunits of most of the 9 geologic systems ofthe Palaeozoic and Mesozoic, and the 5 units of theTertiary. The compilations were made in terms of threetectonic regimes which had distinct erosion–sedimen-tation histories — (1) platform (cratonic), (2) geosyn-clinal, and (3) orogenic regions. These tectonic regimesare recognized in the lithologic–palaeogeographic mapsfor the same time intervals published by Ronov et al.,
6 W.W. Hay et al. / Palaeogeography, Palaeoclimatology, Palaeoecology 240 (2006) 3–46
1984, 1989). It was recognized that some areas have atransition in time from one tectonic regime to another.
The evaporite data were presented as total volumes ofhalite, gypsum and anhydrite lumped together. Inmodern seawater the components of halite (Na+, Cl−)and anhydrite/gypsum (Ca2+, SO4
2−) together make upslightly over 80% of the total salts and are at present inthe ratio of 1:0.04. However, in evaporite deposits theirratio is more often in the order of 1:0.25. Thus the totalevaporite volumes which include all three phases are oflimited value in reconstructing ocean salinity in the past.
Holser (1985, Fig. 1) presented an inventory ofPhanerozoic evaporite deposits showing volumes ofboth NaCl and CaSO4. This compilation was based onZharkov (1981) for the Palaeozoic, and Holser et al.(1980) for the Mesozoic and Cenozoic. He did notspeculate on the specifics of changes in ocean salinitythrough time, but noted that the relative changes inCaSO4 induced by evaporite deposition were muchgreater than those for NaCl, and are reflected in thetemporal distribution of sulfur isotopes.
Continental margin and ocean floor sediments wereincluded in the compilation of Budyko et al. (1987).However, as the purpose of their study was to establishthe history of the atmosphere, only the data for totalsediment, carbonates, and organic carbon were pub-lished. However, it was this landmark compilation thatshowed clearly the exponential decay of total sedimentvolumes and masses on a global scale.
Berner and Berner (1987) noted that extractions ofsalt into evaporite deposits would have resulted in rapidlowerings of salinity, and gradual return of the salt fromdissolution of the deposits would have produced longer-term gentle rises in salinity. They suggested thatalthough salinity must have varied through time, thevariations were probably about a mean not greatlydifferent from that observed today. Their reason forassuming that salinity must have remained close to itspresent level throughout the Phanerozoic is based on thefossil record and its diversity since the Early Cambrian.
A more complete compilation was presented byRonov (1993: Tables 20 and 21). Table 20 presenteddata for pre-Quaternary Phanerozoic except for Antarc-tica, recognizing 28 stratigraphic units in the Phanero-zoic and 3 in the Late Precambrian. Sedimentarymaterials are broken down into 18 different deposittypes, 12 sediments and 6 volcanics. The amounts ofevaporites, broken down into halite and gypsum–anhydrite for the Early Palaeozoic and combined foryounger deposits, are expressed as a percent of the totalvolume of sedimentary and volcanic deposits on thecontinents. Table 21 presented the information for the
Late Jurassic through Pliocene intervals for thecontinents, offshore regions, and ocean floor in termsof volumes and masses of 32 different kinds of deposit,26 sediments and 6 volcanics. Ronov made veryconservative estimates of the volumes of salt in thedeep sea, and also assumed that the majority of theoffshore deposits are gypsum/anhydrite. It should benoted that the volumes of the deep sea deposits wereestimated at a time when data were still ratherincomplete. According to Ronov (1993), the Phanero-zoic–Late Precambrian total for all evaporites is23.77×1018 kg. The halite mass was estimated to be18.39×1018 kg.
Land (1995) explored the potential role of saline porewaters in the history of ocean salinity. Using themaximum values of the Holser (1985) evaporiteinventory, and adding his own estimate of the volumeof halite in the Jurassic Louann Formation (3500×103
km3), he estimated the known inventory of Phanerozoichalite to be approximately 9600×103 km3 or 12.6×10¹⁸ kg Cl−. This is almost half the amount of Cl−
dissolved in the ocean today. He noted that the presentriver flux of Cl−, given by Drever et al. (1988) as115×109 kg/yr, implies a residence time of Cl− in theocean of 220×106 years. Further, he noted that if thisrate of delivery had been sustained over the entirePhanerozoic (550 my) it would imply dissolution of fivetimes the existing inventory of halite, which seemedunreasonable. He suggested that the deficit could bemade up by Cl− in the pore waters of sedimentary rocks.Using Garrels and Mackenzie's (1971) estimate of thevolume of pore water (330×1018 kg), and assuming ahigh pore water salinity with 100,000 mg Cl−/l, the Cl−
in pore water would contain 30×1018 kg of Cl−, almostthree times the amount in halite deposits. This implies acrustal residence time for Cl− of 420×106 years.However, he argued that this still does not solve theproblem that the present riverine flux is apparently toolarge, and he presented evidence that over the long termit may have been about 1/3 of the modern value. Thiswould increase the crustal residence time for Cl to about1.3×109 years, and its oceanic residence time to680×106 years. These calculations were made in acontext of assuming that ocean salinity has remainedessentially constant as Cl− is cycled between oceanicand crustal reservoirs.
Knauth (1998) used the same data to speculate on thepossibility that more salt has been removed from theocean into the crustal reservoirs over the course ofgeologic time. He concluded that the ocean may havehad very high salinities (>70‰) in the Precambrian.These projected high salinities have been used by
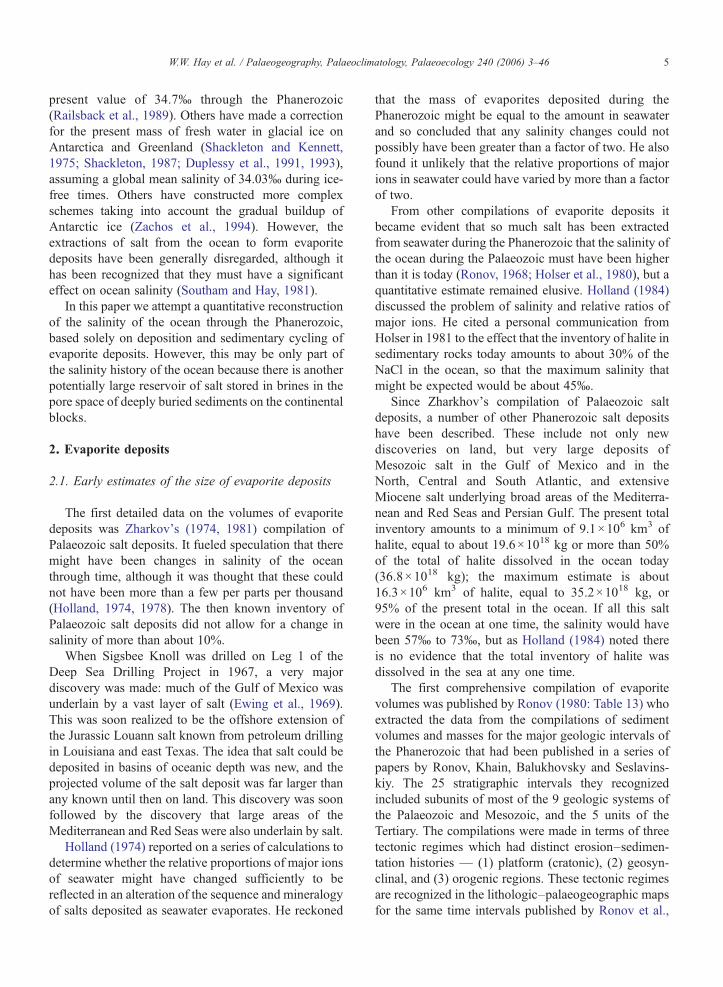
Table 1Volumes and masses of halite compiled by Areg Migdisov and Alexander Balukhovsky (Pliocene–Late Devonian, Early Devonian) and from Ronov (1993) (Middle Devonian, older Palaeozoic and Neoproterozoic
Stratigraphic units Age oftopafterRonov(1993)
Volumes of halite Masses of halite — calculated as 2.16�volume
Platforms Geosynclines Orogenicregions
Shelf andslope ofplatforms
Shelf andslope ofgeosynclines
Shelfandslope oforogenicregions
Oceanfloor
Globaltotal
Platforms Geosynclines Orogenicregions
Shelf andslope ofplatforms
Shelf andslope ofgeosynclines
Shelfandslope oforogenicregions
Oceanfloor
Globaltotal
Ma 103 km3 103 km3 103 km3 103 km3 103 km3 103 km3 103 km3 103 km3 1015 kg 1015 kg 1015 kg 1015 kg 1015 kg 1015 kg 1015 kg 1015 kg
Pliocene 1.8 0.00 0.00 4.00 0.00 0.00 0.00 0.00 4.00 0.00 0.00 8.64 0.00 0.00 0.00 0.00 8.64Miocene 5.3 1.00 0.00 241.00 435.00 0.00 183.00 0.00 860.00 2.16 0.00 520.56 939.60 0.00 395.28 0.00 1857.60Oligocene 23.7 4.00 0.00 9.00 13.00 1.00 0.00 2.00 29.00 8.64 0.00 19.44 28.08 2.16 0.00 4.32 62.64Eocene 36.6 0.00 2.00 6.00 8.00 0.00 0.00 0.00 16.00 0.00 4.32 12.96 17.28 0.00 0.00 0.00 34.56Paleocene 57.8 0.00 0.00 0.00 0.00 0.00 0.00 0.00 0.00 0.00 0.00 0.00 0.00 0.00 0.00 0.00 0.00Late Cretaceous 66.4 41.00 0.00 0.00 0.00 0.00 0.00 0.00 41.00 88.56 0.00 0.00 0.00 0.00 0.00 0.00 88.56Early Cretaceous 97.5 182.00 46.00 2.00 231.00 0.00 0.00 300.00 761.00 393.12 99.36 4.32 498.96 0.00 0.00 648.00 1643.76Late Jurassic 144.0 428.00 49.00 0.00 354.00 12.00 0.00 0.00 843.00 924.48 105.84 0.00 764.64 25.92 0.00 0.00 1820.88Middle Jurassic 169.0 138.00 0.00 1.00 0.00 0.00 0.00 0.00 139.00 298.08 0.00 2.16 0.00 0.00 0.00 0.00 300.24Early Jurassic 187.0 42.00 0.00 0.00 0.00 0.00 0.00 0.00 42.00 90.72 0.00 0.00 0.00 0.00 0.00 0.00 90.72Late Triassic 208.0 384.00 8.00 0.00 0.00 0.00 0.00 0.00 392.00 829.44 17.28 0.00 0.00 0.00 0.00 0.00 846.72Middle Triassic 230.0 23.50 0.00 0.00 0.00 0.00 0.00 0.00 23.50 50.76 0.00 0.00 0.00 0.00 0.00 0.00 50.76Early Triassic 240.0 42.50 0.00 0.00 0.00 0.00 0.00 0.00 42.50 91.80 0.00 0.00 0.00 0.00 0.00 0.00 91.80Late Permian 245.0 180.00 0.00 1.00 0.00 0.00 0.00 0.00 181.00 388.80 0.00 2.16 0.00 0.00 0.00 0.00 390.96Early Permian 258.0 1046.00 0.00 55.00 0.00 0.00 0.00 0.00 1101.00 2259.36 0.00 118.80 0.00 0.00 0.00 0.00 2378.16M and L
Carboniferous286.0 129.00 0.00 0.00 0.00 0.00 0.00 0.00 129.00 278.64 0.00 0.00 0.00 0.00 0.00 0.00 278.64
Early Carboniferous 320.0 37.00 0.00 6.30 0.00 0.00 0.00 0.00 43.30 79.92 0.00 13.61 0.00 0.00 0.00 0.00 93.53Late Devonian 360.0 121.60 2.74 0.00 0.00 0.00 0.00 0.00 124.34 262.66 5.92 0.00 0.00 0.00 0.00 0.00 268.58Middle Devonian 374.0 168.33 14.58 2.55 0.00 0.00 0.00 0.00 185.46 363.59 31.49 5.52 0.00 0.00 0.00 0.00 400.60Early Devonian 387.0 1.00 0.00 0.00 0.00 0.00 0.00 0.00 1.00 2.16 0.00 0.00 0.00 0.00 0.00 0.00 2.16Late Silurian 408.0 27.44 0.00 0.00 0.00 0.00 0.00 0.00 27.44 59.27 0.00 0.00 0.00 0.00 0.00 0.00 59.27Early Silurian 421.0 0.00 0.00 0.00 0.00 0.00 0.00 0.00 0.00 0.00 0.00 0.00 0.00 0.00 0.00 0.00 0.00Late Ordovician 438.0 0.00 0.00 0.00 0.00 0.00 0.00 0.00 0.00 0.00 0.00 0.00 0.00 0.00 0.00 0.00 0.00Middle Ordovician 458.0 17.67 9.41 0.00 0.00 0.00 0.00 0.00 27.08 38.16 20.33 0.00 0.00 0.00 0.00 0.00 58.49Early Ordovician 478.0 0.00 0.00 0.00 0.00 0.00 0.00 0.00 0.00 0.00 0.00 0.00 0.00 0.00 0.00 0.00 0.00Late Cambrian 505.0 6.32 0.00 0.00 0.00 0.00 0.00 0.00 6.32 13.65 0.00 0.00 0.00 0.00 0.00 0.00 13.65Middle Cambrian 523.0 130.59 0.00 0.00 0.00 0.00 0.00 0.00 130.59 282.07 0.00 0.00 0.00 0.00 0.00 0.00 282.07Early Cambrian 540.0 1155.75 0.00 0.00 0.00 0.00 0.00 0.00 1155.75 2496.42 0.00 0.00 0.00 0.00 0.00 0.00 2496.42Vendian 570.0 423.09 0.00 0.00 0.00 0.00 0.00 0.00 423.09 913.88 0.00 0.00 0.00 0.00 0.00 0.00 913.88Late Riphean 680.0 0.00 0.00 0.00 0.00 0.00 0.00 0.00 0.00 0.00 0.00 0.00 0.00 0.00 0.00 0.00 0.00M and E Riphean 1050.0 0.00 0.00 0.00 0.00 0.00 0.00 0.00 0.00 0.00 0.00 0.00 0.00 0.00 0.00 0.00 0.00
7W.W.Hay
etal.
/Palaeogeography,
Palaeoclim
atology,Palaeoecology
240(2006)
3–46

Table 2Volumes and masses of halite compiled by William Holser and Christopher Wold
Stratiraphicunits
Age oftop —timescale ofGradsteinand Ogg(1996)
Volumes of halite Masses of halite — calculated as 2.16*volume
Platforms Geosynclines Orogenicregions
Shelf andslope ofplatforms
Shelf and slopeof geosynclines
Shelf and slopeof orogenicregions
Oceanfloor
Globaltotal
Platforms Geosynclines Orogenicregions
Shelf andslope ofplatforms
Shelf and slopeof geosynclines
Shelf and slopeof orogenicregions
Oceanfloor
Globaltotal
Ma 103 km3 103 km3 103 km3 103 km3 103 km3 103 km3 103 km3 103 km3 1015 kg 1015 kg 1015 kg 1015 kg 1015 kg 1015 kg 1015 kg 1015 kg
Pliocene 1.8 0.00 0.00 0.00 0.00 0.00 0.00 0.00 0.00 0.00 0.00 0.00 0.00 0.00 0.00 0.00 0.00Miocene 5.3 0.00 0.00 1000.00 0.00 0.00 0.00 1100.00 2100.00 0.00 0.00 2160.00 0.00 0.00 0.00 2376.00 4536.00Oligocene 23.8 0.00 0.00 0.00 0.00 0.00 0.00 0.00 0.00 0.00 0.00 0.00 0.00 0.00 0.00 0.00 0.00Eocene 33.7 0.00 0.00 0.00 0.00 0.00 0.00 0.00 0.00 0.00 0.00 0.00 0.00 0.00 0.00 0.00 0.00Paleocene 54.8 0.00 0.00 0.00 0.00 0.00 0.00 0.00 0.00 0.00 0.00 0.00 0.00 0.00 0.00 0.00 0.00Late Cretaceous 65.0 54.50 0.00 0.00 0.00 0.00 0.00 0.00 54.50 117.72 0.00 0.00 0.00 0.00 0.00 0.00 117.72Early
Cretaceous98.9 0.00 0.00 0.00 0.00 0.00 0.00 2500.00 2500.00 0.00 0.00 0.00 0.00 0.00 0.00 5400.00 5400.00
Late Jurassic 142.0 0.00 0.00 0.00 0.00 0.00 0.00 2100.00 2100.00 0.00 0.00 0.00 0.00 0.00 0.00 4536.00 4536.00Middle Jurassic 159.4 0.00 0.00 0.00 0.00 0.00 0.00 0.00 0.00 0.00 0.00 0.00 0.00 0.00 0.00 0.00 0.00Early Jurassic 180.1 0.00 0.00 0.00 0.00 0.00 0.00 1800.00 1800.00 0.00 0.00 0.00 0.00 0.00 0.00 3888.00 3888.00Late Triassic 205.7 0.00 0.00 0.00 0.00 0.00 0.00 0.00 0.00 0.00 0.00 0.00 0.00 0.00 0.00 0.00 0.00Middle Triassic 227.4 115.00 0.00 0.00 0.00 0.00 0.00 0.00 115.00 248.40 0.00 0.00 0.00 0.00 0.00 0.00 248.40Early Triassic 241.7 0.00 0.00 0.00 0.00 0.00 0.00 0.00 0.00 0.00 0.00 0.00 0.00 0.00 0.00 0.00 0.00Late Permian 248.2 485.00 50.00 0.00 0.00 0.00 560.00 0.00 1095.00 1047.60 108.00 0.00 0.00 0.00 1209.60 0.00 2365.20Early Permian 256.0 0.00 0.00 0.00 0.00 0.00 0.00 0.00 0.00 0.00 0.00 0.00 0.00 0.00 0.00 0.00 0.00Pennsylvanian 290.0 69.00 0.00 0.00 0.00 0.00 0.00 0.00 69.00 149.04 0.00 0.00 0.00 0.00 0.00 0.00 149.04Mississippian 323.0 0.00 0.00 0.00 0.00 0.00 0.00 0.00 0.00 0.00 0.00 0.00 0.00 0.00 0.00 0.00 0.00Late Devonian 354.0 98.80 62.00 0.00 0.00 0.00 0.00 0.00 160.80 213.41 133.92 0.00 0.00 0.00 0.00 0.00 347.33Middle
Devonian370.0 0.00 0.00 0.00 0.00 0.00 0.00 0.00 0.00 0.00 0.00 0.00 0.00 0.00 0.00 0.00 0.00
Early Devonian 391.0 2.32 0.00 0.00 0.00 0.00 0.00 0.00 2.32 5.02 0.00 0.00 0.00 0.00 0.00 0.00 5.02Late Silurian 417.0 26.00 0.00 0.00 0.00 0.00 0.00 0.00 26.00 56.16 0.00 0.00 0.00 0.00 0.00 0.00 56.16Early Silurian 423.0 0.00 0.00 0.00 0.00 0.00 0.00 0.00 0.00 0.00 0.00 0.00 0.00 0.00 0.00 0.00 0.00Late Ordovician 443.0 0.00 0.00 0.00 0.00 0.00 0.00 0.00 0.00 0.00 0.00 0.00 0.00 0.00 0.00 0.00 0.00Middle
Ordovician458.0 0.00 0.00 0.00 0.00 0.00 0.00 0.00 0.00 0.00 0.00 0.00 0.00 0.00 0.00 0.00 0.00
EarlyOrdovician
880.0 0.00 0.00 0.00 0.00 0.00 0.00 0.00 0.00 0.00 0.00 0.00 0.00 0.00 0.00 0.00 0.00
Late Cambrian 495.0 0.00 0.00 0.00 0.00 0.00 0.00 0.00 0.00 0.00 0.00 0.00 0.00 0.00 0.00 0.00 0.00Middle
Cambrian505.0 0.00 0.00 0.00 0.00 0.00 0.00 0.00 0.00 0.00 0.00 0.00 0.00 0.00 0.00 0.00 0.00
Early Cambrian 518.0 675.00 0.00 0.00 0.00 0.00 0.00 0.00 675.00 1458.00 0.00 0.00 0.00 0.00 0.00 0.00 1458.00Vendian 545.0 600.00 0.00 0.00 0.00 0.00 0.00 0.00 600.00 1296.00 0.00 0.00 0.00 0.00 0.00 0.00 1296.00Late Riphean 680.0 0.00 0.00 0.00 0.00 0.00 0.00 0.00 0.00 0.00 0.00 0.00 0.00 0.00 0.00 0.00 0.00M and E
Riphean1050.0 0.00 0.00 0.00 0.00 0.00 0.00 0.00 0.00 0.00 0.00 0.00 0.00 0.00 0.00 0.00 0.00
8W.W.Hay
etal.
/Palaeogeography,
Palaeoclim
atology,Palaeoecology
240(2006)
3–46
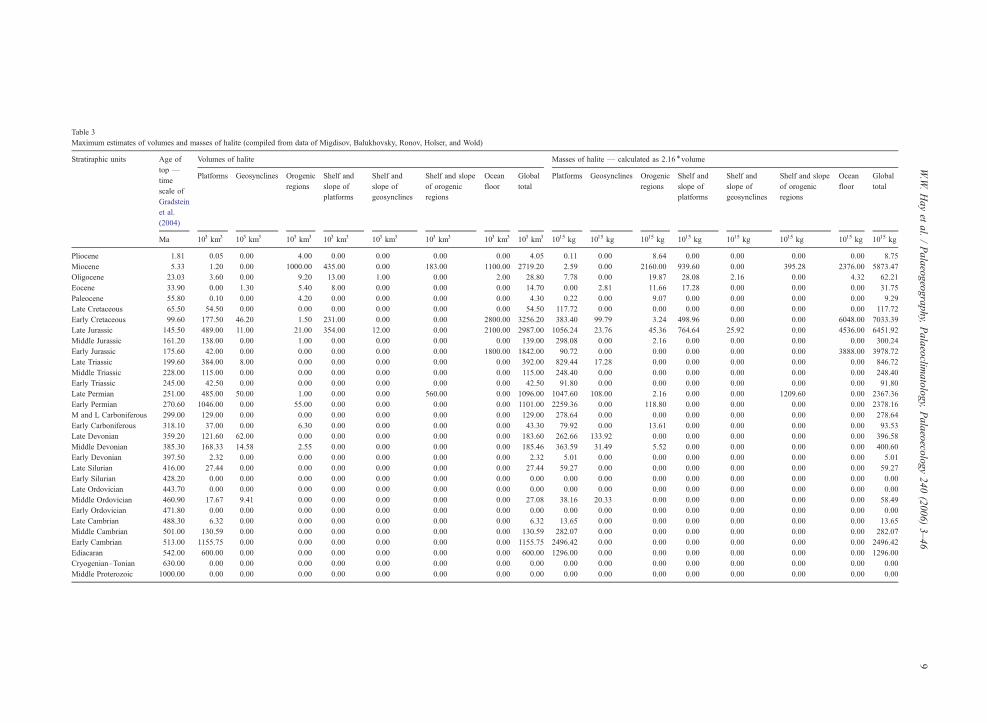
Table 3Maximum estimates of volumes and masses of halite (compiled from data of Migdisov, Balukhovsky, Ronov, Holser, and Wold)
Stratiraphic units Age oftop —timescale ofGradsteinet al.(2004)
Volumes of halite Masses of halite — calculated as 2.16⁎volume
Platforms Geosynclines Orogenicregions
Shelf andslope ofplatforms
Shelf andslope ofgeosynclines
Shelf and slopeof orogenicregions
Oceanfloor
Globaltotal
Platforms Geosynclines Orogenicregions
Shelf andslope ofplatforms
Shelf andslope ofgeosynclines
Shelf and slopeof orogenicregions
Oceanfloor
Globaltotal
Ma 103 km3 103 km3 103 km3 103 km3 103 km3 103 km3 103 km3 103 km3 1015 kg 1015 kg 1015 kg 1015 kg 1015 kg 1015 kg 1015 kg 1015 kg
Pliocene 1.81 0.05 0.00 4.00 0.00 0.00 0.00 0.00 4.05 0.11 0.00 8.64 0.00 0.00 0.00 0.00 8.75Miocene 5.33 1.20 0.00 1000.00 435.00 0.00 183.00 1100.00 2719.20 2.59 0.00 2160.00 939.60 0.00 395.28 2376.00 5873.47Oligocene 23.03 3.60 0.00 9.20 13.00 1.00 0.00 2.00 28.80 7.78 0.00 19.87 28.08 2.16 0.00 4.32 62.21Eocene 33.90 0.00 1.30 5.40 8.00 0.00 0.00 0.00 14.70 0.00 2.81 11.66 17.28 0.00 0.00 0.00 31.75Paleocene 55.80 0.10 0.00 4.20 0.00 0.00 0.00 0.00 4.30 0.22 0.00 9.07 0.00 0.00 0.00 0.00 9.29Late Cretaceous 65.50 54.50 0.00 0.00 0.00 0.00 0.00 0.00 54.50 117.72 0.00 0.00 0.00 0.00 0.00 0.00 117.72Early Cretaceous 99.60 177.50 46.20 1.50 231.00 0.00 0.00 2800.00 3256.20 383.40 99.79 3.24 498.96 0.00 0.00 6048.00 7033.39Late Jurassic 145.50 489.00 11.00 21.00 354.00 12.00 0.00 2100.00 2987.00 1056.24 23.76 45.36 764.64 25.92 0.00 4536.00 6451.92Middle Jurassic 161.20 138.00 0.00 1.00 0.00 0.00 0.00 0.00 139.00 298.08 0.00 2.16 0.00 0.00 0.00 0.00 300.24Early Jurassic 175.60 42.00 0.00 0.00 0.00 0.00 0.00 1800.00 1842.00 90.72 0.00 0.00 0.00 0.00 0.00 3888.00 3978.72Late Triassic 199.60 384.00 8.00 0.00 0.00 0.00 0.00 0.00 392.00 829.44 17.28 0.00 0.00 0.00 0.00 0.00 846.72Middle Triassic 228.00 115.00 0.00 0.00 0.00 0.00 0.00 0.00 115.00 248.40 0.00 0.00 0.00 0.00 0.00 0.00 248.40Early Triassic 245.00 42.50 0.00 0.00 0.00 0.00 0.00 0.00 42.50 91.80 0.00 0.00 0.00 0.00 0.00 0.00 91.80Late Permian 251.00 485.00 50.00 1.00 0.00 0.00 560.00 0.00 1096.00 1047.60 108.00 2.16 0.00 0.00 1209.60 0.00 2367.36Early Permian 270.60 1046.00 0.00 55.00 0.00 0.00 0.00 0.00 1101.00 2259.36 0.00 118.80 0.00 0.00 0.00 0.00 2378.16M and L Carboniferous 299.00 129.00 0.00 0.00 0.00 0.00 0.00 0.00 129.00 278.64 0.00 0.00 0.00 0.00 0.00 0.00 278.64Early Carboniferous 318.10 37.00 0.00 6.30 0.00 0.00 0.00 0.00 43.30 79.92 0.00 13.61 0.00 0.00 0.00 0.00 93.53Late Devonian 359.20 121.60 62.00 0.00 0.00 0.00 0.00 0.00 183.60 262.66 133.92 0.00 0.00 0.00 0.00 0.00 396.58Middle Devonian 385.30 168.33 14.58 2.55 0.00 0.00 0.00 0.00 185.46 363.59 31.49 5.52 0.00 0.00 0.00 0.00 400.60Early Devonian 397.50 2.32 0.00 0.00 0.00 0.00 0.00 0.00 2.32 5.01 0.00 0.00 0.00 0.00 0.00 0.00 5.01Late Silurian 416.00 27.44 0.00 0.00 0.00 0.00 0.00 0.00 27.44 59.27 0.00 0.00 0.00 0.00 0.00 0.00 59.27Early Silurian 428.20 0.00 0.00 0.00 0.00 0.00 0.00 0.00 0.00 0.00 0.00 0.00 0.00 0.00 0.00 0.00 0.00Late Ordovician 443.70 0.00 0.00 0.00 0.00 0.00 0.00 0.00 0.00 0.00 0.00 0.00 0.00 0.00 0.00 0.00 0.00Middle Ordovician 460.90 17.67 9.41 0.00 0.00 0.00 0.00 0.00 27.08 38.16 20.33 0.00 0.00 0.00 0.00 0.00 58.49Early Ordovician 471.80 0.00 0.00 0.00 0.00 0.00 0.00 0.00 0.00 0.00 0.00 0.00 0.00 0.00 0.00 0.00 0.00Late Cambrian 488.30 6.32 0.00 0.00 0.00 0.00 0.00 0.00 6.32 13.65 0.00 0.00 0.00 0.00 0.00 0.00 13.65Middle Cambrian 501.00 130.59 0.00 0.00 0.00 0.00 0.00 0.00 130.59 282.07 0.00 0.00 0.00 0.00 0.00 0.00 282.07Early Cambrian 513.00 1155.75 0.00 0.00 0.00 0.00 0.00 0.00 1155.75 2496.42 0.00 0.00 0.00 0.00 0.00 0.00 2496.42Ediacaran 542.00 600.00 0.00 0.00 0.00 0.00 0.00 0.00 600.00 1296.00 0.00 0.00 0.00 0.00 0.00 0.00 1296.00Cryogenian–Tonian 630.00 0.00 0.00 0.00 0.00 0.00 0.00 0.00 0.00 0.00 0.00 0.00 0.00 0.00 0.00 0.00 0.00Middle Proterozoic 1000.00 0.00 0.00 0.00 0.00 0.00 0.00 0.00 0.00 0.00 0.00 0.00 0.00 0.00 0.00 0.00 0.00
9W.W.Hay
etal.
/Palaeogeography,
Palaeoclim
atology,Palaeoecology
240(2006)
3–46

Table 4Minimum estimates of volumes and masses of halite (compiled from data of Migdisov, Balukhovsky, Ronov, Holser, and Wold)
Stratiraphic units Age oftop —timescale ofGradsteinet al.(2004)
Volumes of halite Masses of halite — calculated as 2.16⁎volume
Platforms Geosynclines Orogenicregions
Shelf andslope ofplatforms
Shelf andslope ofgeosynclines
Shelf and slopeof orogenicregions
Oceanfloor
Globaltotal
Platforms Geosynclines Orogenicregions
Shelf andslope ofplatforms
Shelf andslope ofgeosynclines
Shelf and slopeof orogenicregions
Oceanfloor
Globaltotal
Ma 103 km3 103 km3 103 km3 103 km3 103 km3 103 km3 103 km3 103 km3 1015 kg 1015 kg 1015 kg 1015 kg 1015 kg 1015 kg 1015 kg 1015 kg
Pliocene 1.81 0.05 0.00 4.00 0.00 0.00 0.00 0.00 4.05 0.11 0.00 8.64 0.00 0.00 0.00 0.00 8.75Miocene 5.33 1.20 0.00 240.80 435.00 0.00 183.00 1100.00 1960.00 2.59 0.00 520.13 939.60 0.00 395.28 2376.00 4233.60Oligocene 23.03 3.60 0.00 9.20 13.00 1.00 0.00 2.00 28.80 7.78 0.00 19.87 28.08 2.16 0.00 4.32 62.21Eocene 33.90 0.00 1.30 5.40 8.00 0.00 0.00 0.00 14.70 0.00 2.81 11.66 17.28 0.00 0.00 0.00 31.75Paleocene 55.80 0.10 0.00 4.20 0.00 0.00 0.00 0.00 4.30 0.22 0.00 9.07 0.00 0.00 0.00 0.00 9.29Late Cretaceous 65.50 44.40 0.00 0.00 0.00 0.00 0.00 0.00 44.40 95.90 0.00 0.00 0.00 0.00 0.00 0.00 95.90Early Cretaceous 99.60 177.50 46.20 1.50 231.00 0.00 0.00 300.00 756.20 383.40 99.79 3.24 498.96 0.00 0.00 648.00 1633.39Late Jurassic 145.50 489.00 11.00 21.00 354.00 12.00 0.00 2100.00 2987.00 1056.24 23.76 45.36 764.64 25.92 0.00 4536.00 6451.92Middle Jurassic 161.20 138.00 0.00 1.00 0.00 0.00 0.00 0.00 139.00 298.08 0.00 2.16 0.00 0.00 0.00 0.00 300.24Early Jurassic 175.60 42.00 0.00 0.00 0.00 0.00 0.00 1800.00 1842.00 90.72 0.00 0.00 0.00 0.00 0.00 3888.00 3978.72Late Triassic 199.60 384.00 8.00 0.00 0.00 0.00 0.00 0.00 392.00 829.44 17.28 0.00 0.00 0.00 0.00 0.00 846.72Middle Triassic 228.00 23.50 0.00 0.00 0.00 0.00 0.00 0.00 23.50 50.76 0.00 0.00 0.00 0.00 0.00 0.00 50.76Early Triassic 245.00 42.50 0.00 0.00 0.00 0.00 0.00 0.00 42.50 91.80 0.00 0.00 0.00 0.00 0.00 0.00 91.80Late Permian 251.00 180.00 50.00 1.00 0.00 0.00 560.00 0.00 791.00 388.80 108.00 2.16 0.00 0.00 1209.60 0.00 1708.56Early Permian 270.60 1046.00 0.00 55.00 0.00 0.00 0.00 0.00 1101.00 2259.36 0.00 118.80 0.00 0.00 0.00 0.00 2378.16M and L Carboniferous 299.00 129.00 0.00 0.00 0.00 0.00 0.00 0.00 129.00 278.64 0.00 0.00 0.00 0.00 0.00 0.00 278.64Early Carboniferous 318.10 37.00 0.00 6.30 0.00 0.00 0.00 0.00 43.30 79.92 0.00 13.61 0.00 0.00 0.00 0.00 93.53Late Devonian 359.20 121.60 2.74 0.00 0.00 0.00 0.00 0.00 124.34 262.66 5.92 0.00 0.00 0.00 0.00 0.00 268.57Middle Devonian 385.30 168.33 14.58 2.55 0.00 0.00 0.00 0.00 185.46 363.59 31.49 5.52 0.00 0.00 0.00 0.00 400.60Early Devonian 397.50 1.00 0.00 0.00 0.00 0.00 0.00 0.00 1.00 2.16 0.00 0.00 0.00 0.00 0.00 0.00 2.16Late Silurian 416.00 27.44 0.00 0.00 0.00 0.00 0.00 0.00 27.44 59.27 0.00 0.00 0.00 0.00 0.00 0.00 59.27Early Silurian 428.20 0.00 0.00 0.00 0.00 0.00 0.00 0.00 0.00 0.00 0.00 0.00 0.00 0.00 0.00 0.00 0.00Late Ordovician 443.70 0.00 0.00 0.00 0.00 0.00 0.00 0.00 0.00 0.00 0.00 0.00 0.00 0.00 0.00 0.00 0.00Middle Ordovician 460.90 17.67 9.41 0.00 0.00 0.00 0.00 0.00 27.08 38.16 20.33 0.00 0.00 0.00 0.00 0.00 58.49Early Ordovician 471.80 0.00 0.00 0.00 0.00 0.00 0.00 0.00 0.00 0.00 0.00 0.00 0.00 0.00 0.00 0.00 0.00Late Cambrian 488.30 6.32 0.00 0.00 0.00 0.00 0.00 0.00 6.32 13.65 0.00 0.00 0.00 0.00 0.00 0.00 13.65Middle Cambrian 501.00 130.59 0.00 0.00 0.00 0.00 0.00 0.00 130.59 282.07 0.00 0.00 0.00 0.00 0.00 0.00 282.07Early Cambrian 513.00 1155.75 0.00 0.00 0.00 0.00 0.00 0.00 1155.75 2496.42 0.00 0.00 0.00 0.00 0.00 0.00 2496.42Ediacaran 542.00 600.00 0.00 0.00 0.00 0.00 0.00 0.00 600.00 1296.00 0.00 0.00 0.00 0.00 0.00 0.00 1296.00Cryogenian–Tonian 630.00 0.00 0.00 0.00 0.00 0.00 0.00 0.00 0.00 0.00 0.00 0.00 0.00 0.00 0.00 0.00 0.00Middle Proterozoic 1000.00 0.00 0.00 0.00 0.00 0.00 0.00 0.00 0.00 0.00 0.00 0.00 0.00 0.00 0.00 0.00 0.00
10W.W.Hay
etal.
/Palaeogeography,
Palaeoclim
atology,Palaeoecology
240(2006)
3–46
11W.W. Hay et al. / Palaeogeography, Palaeoclimatology, Palaeoecology 240 (2006) 3–46
Knauth (2005) in discussing the possible early history oflife on Earth.
All of these studies, whether suggesting that thegeneral trend is toward higher ocean salinities with age,or more simply, variations about a mean recognize thatocean salinity must have changed with time. However,quantification of the salinity of the ocean in the past hasbeen elusive because there was no agreement on how toreconstruct the original extractions and the subsequentdelivery of dissolved evaporite and pore water salt to theocean in the past.
2.2. Recent compilations of evaporite deposits
More recently, William Holser and ChristopherWold compiled a list of major evaporite deposits thatincluded several large accumulations that had escapedearlier attention. Estimates of the size of some of thedeposits in the deep sea vary significantly. For theSouth Atlantic, volume estimates range from 4000 km3
(Southam and Hay, 1981) to 1000 km3 (Burke, 1975;Burke and Sengor, 1988), and Holser and Wold chosean intermediate value. They were also able to includesome recently discovered deposits, such as those inThailand (Japakasetr and Workman, 1981). This listhas been published in terms of masses of NaCl andCaSO4 as Table 1 in Floegel et al. (2000). They foundthe total mass of evaporite deposits existing today tobe 32.02×10¹⁸ kg and the mass of halite to be24.40×1018 kg.
Areg Migdisov and Alexander Balukhovsky, havegone back to the original data on areas, thicknesses, andvolumes of sediment which they worked on as part ofthe group led by Alexander Ronov and Victor Khain atthe Vernadski Institute in the 1960s and ’70s. Theyrecompiled the information for the Pliocene thoughCarboniferous and for the Early Devonian in terms ofthe original geographical areas defined for the globalcompilation. The evaporites have been divided intohalite and gypsum–anhydrite. These data have beenplaced in the GERM (Geochemical Earth ReferenceModel) data bank. The Ronov data for evaporites differfrom those of Zharkov (1974, 1981) because they useddifferent maps and also included the additional amountsof halite in diapirs and other salt tectonic features. Forthis reason estimates from the Ronov database aregenerally larger than those of Zharkov.
The results of these recent compilations are presentedhere as four data sets, Tables 1–4. Table 1 shows theRonov data for halite as revised by Migdisov andBalukhovsky; it still lacks some of the deep sea deposits;Table 2 shows the Holser and Wold data on major
evaporite deposits recast into the same format. Itincludes the deep sea deposits (previously published inFloegel et al., 2000). Table 3 is a combination of Tables1 and 2 using the smaller number when there aredifferences between the Ronov/Migdisov/Balukhovskyand Holser/Wold data sets. Table 4 is a combination ofTables 1 and 2, using the larger number whenever thereare differences between the data sets, and Table 3 can beregarded as a minimum estimate and Table 4 as amaximum estimate of the size of known halite deposits.It should be noted that these are not the maximumestimates of evaporite volumes proposed; Southam andHay (1981) gave the volume of the Early CretaceousSouth Atlantic halite as 4000 km3, and Land (1995)cited the volume of the Jurassic Louann salt of the Gulfof Mexico to be 3500 km3.
We do not know whether these data represent acomplete inventory of the world's evaporite deposits.There are no data from Antarctica, and many areas of theocean basins and marginal seas have not beensufficiently explored to be sure that there are not moredeposits to be found. Furthermore, many of theestimates on volumes and masses of halite in the deepsea are based on seismic data, some of which show onlydiapirs or the top of the salt layer, and none of whichhave been drilled though except near their edges.However, future discoveries and corrections are notlikely to be so large as to invalidate the results presentedhere.
3. Factors affecting ocean salinity
Two factors are important in determining the salinityof the ocean in the past: 1) the amount of salt, and 2) theamount of water. The salinity of seawater is a measure ofthe amount of dissolved solids in terms of weight. Todaythe ocean contains about 1322.746×1018 kg H2O, andabout 47.578×10¹⁸ kg of salts, for a mean salinity of34.72.The four major anions, Cl−, SO4
2−, HCO3?−, Br−,
and four major cations Na+, Mg2+, Ca2+, K+, make up99.8% by weight of the dissolved solids. The two mostabundant ions, Cl− and Na+, comprise 85.1% by weightof the salt in present day seawater. Chloride alone makesup 55% by weight and, as shown in Table 5, there are17% more moles of Cl− than Na+. Of the major ions inseawater, Cl− is unique in that it is incompatible withalmost all minerals and resides almost entirely inseawater, in the pore space of sediments, and inevaporite deposits derived from seawater. Because allof the other major ions can enter into and be exchangedwith counterparts in minerals, the only element that canbe used as a proxy for salinity in the past is Cl−.
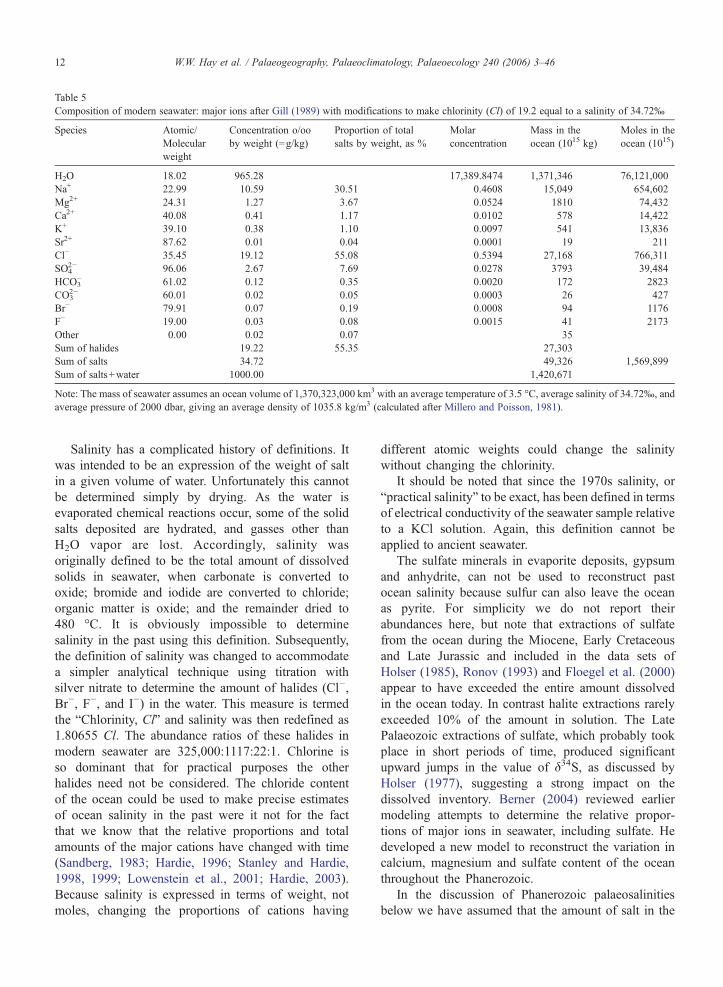
Table 5Composition of modern seawater: major ions after Gill (1989) with modifications to make chlorinity (Cl) of 19.2 equal to a salinity of 34.72‰
Species Atomic/Molecularweight
Concentration o/ooby weight (=g/kg)
Proportion of totalsalts by weight, as %
Molarconcentration
Mass in theocean (1015 kg)
Moles in theocean (1015)
H2O 18.02 965.28 17,389.8474 1,371,346 76,121,000Na+ 22.99 10.59 30.51 0.4608 15,049 654,602Mg2+ 24.31 1.27 3.67 0.0524 1810 74,432Ca2+ 40.08 0.41 1.17 0.0102 578 14,422K+ 39.10 0.38 1.10 0.0097 541 13,836Sr2+ 87.62 0.01 0.04 0.0001 19 211Cl− 35.45 19.12 55.08 0.5394 27,168 766,311SO4
2− 96.06 2.67 7.69 0.0278 3793 39,484HCO3
− 61.02 0.12 0.35 0.0020 172 2823CO3
2− 60.01 0.02 0.05 0.0003 26 427Br− 79.91 0.07 0.19 0.0008 94 1176F− 19.00 0.03 0.08 0.0015 41 2173Other 0.00 0.02 0.07 35Sum of halides 19.22 55.35 27,303Sum of salts 34.72 49,326 1,569,899Sum of salts+water 1000.00 1,420,671
Note: The mass of seawater assumes an ocean volume of 1,370,323,000 km3 with an average temperature of 3.5 °C, average salinity of 34.72‰, andaverage pressure of 2000 dbar, giving an average density of 1035.8 kg/m3 (calculated after Millero and Poisson, 1981).
12 W.W. Hay et al. / Palaeogeography, Palaeoclimatology, Palaeoecology 240 (2006) 3–46
Salinity has a complicated history of definitions. Itwas intended to be an expression of the weight of saltin a given volume of water. Unfortunately this cannotbe determined simply by drying. As the water isevaporated chemical reactions occur, some of the solidsalts deposited are hydrated, and gasses other thanH2O vapor are lost. Accordingly, salinity wasoriginally defined to be the total amount of dissolvedsolids in seawater, when carbonate is converted tooxide; bromide and iodide are converted to chloride;organic matter is oxide; and the remainder dried to480 °C. It is obviously impossible to determinesalinity in the past using this definition. Subsequently,the definition of salinity was changed to accommodatea simpler analytical technique using titration withsilver nitrate to determine the amount of halides (Cl−,Br−, F−, and I−) in the water. This measure is termedthe “Chlorinity, Cl” and salinity was then redefined as1.80655 Cl. The abundance ratios of these halides inmodern seawater are 325,000:1117:22:1. Chlorine isso dominant that for practical purposes the otherhalides need not be considered. The chloride contentof the ocean could be used to make precise estimatesof ocean salinity in the past were it not for the factthat we know that the relative proportions and totalamounts of the major cations have changed with time(Sandberg, 1983; Hardie, 1996; Stanley and Hardie,1998, 1999; Lowenstein et al., 2001; Hardie, 2003).Because salinity is expressed in terms of weight, notmoles, changing the proportions of cations having
different atomic weights could change the salinitywithout changing the chlorinity.
It should be noted that since the 1970s salinity, or“practical salinity” to be exact, has been defined in termsof electrical conductivity of the seawater sample relativeto a KCl solution. Again, this definition cannot beapplied to ancient seawater.
The sulfate minerals in evaporite deposits, gypsumand anhydrite, can not be used to reconstruct pastocean salinity because sulfur can also leave the oceanas pyrite. For simplicity we do not report theirabundances here, but note that extractions of sulfatefrom the ocean during the Miocene, Early Cretaceousand Late Jurassic and included in the data sets ofHolser (1985), Ronov (1993) and Floegel et al. (2000)appear to have exceeded the entire amount dissolvedin the ocean today. In contrast halite extractions rarelyexceeded 10% of the amount in solution. The LatePalaeozoic extractions of sulfate, which probably tookplace in short periods of time, produced significantupward jumps in the value of δ34S, as discussed byHolser (1977), suggesting a strong impact on thedissolved inventory. Berner (2004) reviewed earliermodeling attempts to determine the relative propor-tions of major ions in seawater, including sulfate. Hedeveloped a new model to reconstruct the variation incalcium, magnesium and sulfate content of the oceanthroughout the Phanerozoic.
In the discussion of Phanerozoic palaeosalinitiesbelow we have assumed that the amount of salt in the

13W.W. Hay et al. / Palaeogeography, Palaeoclimatology, Palaeoecology 240 (2006) 3–46
ocean retains its present proportionality of 1.81558times the amount of the chloride ion. The periodicremoval of salts other than NaCl, most importantlyCaCO3, CaMg(CO3)2, CaSO4, MgSO4, KCl, etc.,implies that chloride is not an exact but only anapproximate proxy for the salinity of seawater.
4. Delivery of salts to the ocean today
Salts can be brought to the ocean by rivers,groundwater, glaciers, and through the atmosphere. Ofthese potential transport mechanisms, the dissolved loadof rivers and groundwater dominate. The dissolved loadof rivers is relatively well known (Meybeck, 1979).River water is essentially a bicarbonate solution, withmore than 80% of the solutes consisting of HCO3
−, SO42−,
Ca2+ and H4SiO4 (Allen, 1997), but it also contains theother anions and cations that are common is seawater,including Cl−.
Chlorine is the classic “excess volatile” and is veryrare in silicate minerals. Chlorine occurs regularly onlyin chlorapatite, cerargyrite, lazurite, sodalite, vanadinite,and in the evaporite salts halite, sylvite, kainite, andboracite (Emiliani, 1992). It is not a regular constituentof chlorite or chloritoid although in these and some otherminerals it may substitute for OH−. Cl− is released in theweathering of shales (Meybeck, 1987), it is presumablybound with the interlayer water. NaCl must be containedin magmas because NaCl brine is present in fluidinclusions in silicate minerals, but it must be a relativelyminor constituent because there is no record of NaCl asa primary magmatic precipitate (Mueller and Saxena,1977).
Determining the global average concentration of Cl−
in river waters, [Cl−], is difficult because concentrationsvary through three (Meybeck, 1979) and possibly evenfive orders of magnitude (Feth, 1981). Essentially therehave only been two attempts to determine an averagevalue, that of Livingston (1963): 7.8 mg/l=0.220 mmol;subsequently cited by Garrels and Mackenzie (1971),Lisitzin (1974), Holland (1978), and Brown et al. (1989)among others, and that of Meybeck (1979): 8.3 mg/l=0.233 mmol, subsequently cited by Drever et al.(1988), Berner and Berner (1987) and others. Theestimates of average values were determined byaveraging the [Cl−] in major rivers. Meybeck (1979)averaged data from 61 rivers or regional groups ofrivers, having a total discharge of 23,413 km3/yr. Thisvalue for the concentration is then multiplied byestimates of the total water discharge from land toextrapolate the total amount of Cl− delivered from landto the sea each year.
Estimates of the total discharge of rivers to the oceanrange between 32,500 km3/yr (Garrels and Mackenzie,1971) and 37,500 km3/yr (Marcinek and Rosenkranz,1989); Berner and Berner (1987) use a value of37,400 km3/yr. From the values for concentration anddischarge, the total flux of Cl− from land to sea via riversmay range between 254×109 kg and 311×109 kg;Berner and Berner (1987) give the flux as 308×109 kg.Meybeck's (1979) global average for [Cl−] in rivers isdominated by those rivers which drain areas with largeevaporite deposits in the continental interior (see Fig. 1in Feth, 1981). The total discharge of the rivers forwhich he had reliable data is only about 60% of theglobal discharge from land to sea, and the assumptionthat Cl− has the same average concentration in the other40% of the world's rivers, which drain more coastalareas mostly lacking evaporite deposits, may not bejustified.
The origin of the Cl− in river and groundwater iscontroversial. There are four potential sources ofriverine Cl−: 1) recycled directly from the ocean viathe atmosphere, 2) from volcanic emissions, includingjuvenile chloride outgassed from the mantle, 3) fromhuman activities, 4) from introduction of saline ground-waters, and 5) from dissolution of evaporites.
4.1. The atmospheric recycling correction for chloridein rivers
The bursting of bubbles generated by breaking wavesinjects droplets of seawater from the sea surface into theair. Evaporation of the water leaves the salt as anaerosol. Sea salt aerosol is concentrated below 1 to 2 kmabove the ocean surface and decreases exponentiallywith height (Ryan and Mukherjee, 1975). The salt ishygroscopic, and serves as a nucleus for raindrops.Hence rainwater has a small content of sea salt, theamount decreasing away from its source. The [Cl−]ranges from >8 mg/l over the ocean to 1 mg/l in coastalregions, to 0.1 mg/l or less in the continental interiors(Junge and Werby, 1958; Stallard and Edmond, 1981;Drever, 1982; Berner and Berner, 1987). Becauseconcentrations of Cl− in rainwater vary through two ormore orders of magnitude (Feth, 1981), a global averageis difficult to determine. Garrels and Mackenzie (1971)give a [Cl−] of 3.8 mg/l in rainwater as a global average;this seems to be generally accepted (Brown et al., 1989).
Estimates of the proportion of riverine Cl− due toatmospheric recycling vary greatly. Sverdrup et al.(1942) made a first attempt to separate salts atmospher-ically recycled from the ocean from those derived fromweathering on land. As a simplification they assumed
14 W.W. Hay et al. / Palaeogeography, Palaeoclimatology, Palaeoecology 240 (2006) 3–46
that all of the Cl− in rivers is atmospherically recycled.Using this assumption, the amount of non-atmospher-ically recycled solutes in river water can be determinedby setting [Cl−] equal to 0 and subtracting the amountsof the other ions proportional to their abundance inseawater. Feth (1981) noted that subsequent authorshave sometimes dropped the modifying statements andstated assumptions of Sverdrup et al. (1942), with theresult that the idea that all Cl− in river water is recycledfrom the sea has appeared in some textbooks (e.g.Rankama and Sahama, 1950; Brown et al., 1989).
Garrels and Mackenzie (1971) cited the amount ofatmospherically recycled Cl− in river water to be 55%.Holland (1978) presented a more detailed argument. Heconcluded that if the Cl− in North American rivers werederived solely from atmospheric precipitation, [Cl−]would be 1–4 ppm depending on the distance from thecoast rather than the average of 8 ppm observed. Heinterpreted this to mean that at present about 27% of thesalt in rivers comes from the sea through atmosphericcycling. Meybeck (1983) estimated the proportion ofCl− dissolved in rivers that is atmospherically recycledfrom the ocean is 72%. However Berner and Berner(1987) argue that most of the rivers on whichMeybeck'sestimate is based are short and strongly affected byprecipitation coming directly from the ocean. Incontrast, Berner and Berner (1987) use a value of 13%for atmospherically recycled salt, based on studies of theAmazon by Stallard and Edmond (1981). It can also beargued that this is too small because very little of theAmazon Basin is close to the coast. It is important torecall that the 100 largest rivers deliver about 60% of thewater entering the ocean. The remaining 40% comesfrom smaller rivers that are shorter and closer to thecoast.
Using maximum and minimum estimates for theatmospherically recycled component of river water andthe total Cl− flux of rivers, the short-term atmospher-ically recycled flux ranges between 183×109 kg/yr and40×109 kg/yr. The flux from other sources would thenbe between 71×109 kg/yr and 271×109 kg/yr, a verylarge uncertainty.
4.2. Chloride from volcanic emissions
The chloride emitted from volcanoes comes fromtwo possible sources: subducted seawater, and out-gassing from the Earth's mantle. The total amount ofCl− in the oceans, pore waters in sediments, and saltdeposits is probably between 55 and 65×1018 kg or 1.25and 1.60×10²¹ mol. It is not known whether this hasbeen at the surface of the Earth since early in its history,
or has been gradually added through time. If addedsteadily since the accretion of the Earth, this wouldrequire a flux of 12 to 14×109 kg Cl−/yr.
HCl is emitted by volcanoes, but many of these aresituated along subduction zones and it can be arguedthat the emissions are simply returning the saltdissolved in subducted seawater. Present volcanicemissions of Cl− into the troposphere and stratosphereare thought to be about 500 times smaller than the inputof Cl− into the ocean from rivers. Prior to the advent ofplate tectonics, Correns (1956) evaluated the role ofmagmatic sources, and concluded that they wereinadequate to maintain the balance observed today.Subsequently, Bartels (1972) estimated annual volcanicemissions of 7.6×10⁹ kg Cl−/yr from chlorine mea-surements for the Greenland icecap. This is half the rateexpected if the rate of outgassing were constant overgeologic time. Over the Phanerozoic this amounts to4142×1015 kg, or almost 16% of the present amount inthe ocean. Anderson (1974) arrived at a much lowerestimate of 1.7×10⁹ kg Cl−/yr in total volcanicemissions, which over the course of the Phanerozoicwould amount to only 3.5% of the oceans' Cl−.Unfortunately, the rate of addition of juvenile Cl− tothe total inventory remains an open question.
4.3. Chloride from human activities
The amount of Cl− introduced into rivers andgroundwater is also difficult to estimate. Meybeck(1979) proposed that the amount of Cl− “pollution” ofrivers is about 30%. This estimate was based on acomparison of Cl− concentrations in river in the earlyand late 20th century. Applying this value to theestimate of non-atmospherically recycled Cl−, theresidual “natural” Cl− flux might range between50×109 kg/yr and 190×109 kg/yr. However, salt hasbeen an important commodity since prehistoric times(Kurlansky, 2002). Originally salt was used in foodpreparation and storage (e.g. salt cod, in which the saltused for preservation may outweigh the fish!), and morerecently for the chlorination of water supplies anddeicing of roads. According to the Salt Institute (www.saltinstitute.org) global salt production increased duringthe 20th century from 10×109 kg/yr early in the centuryto 183×109 kg/yr in 1990 and reached 225×109 kg/yrin 2002. These correspond to Cl− masses of 6×10⁹ kg/yr, 110×109 kg/yr, and 135×109 kg/yr. Only a fractionof this salt is extracted from evaporite deposits. Themajor portion comes from coastal salt evaporation pans.Wold et al. (1999) give the locations of 690 solar saltproduction facilities located in low and mid-latitude

Table 6Water at or near the surface of the Earth (from various sources)
Mass (1015 kg) Moles (1015)
Free waterIce 27,820.0 1,544,269Rivers and lakes 225.0 12,490Oceans 1,371,345.7 76,122,437Pore water 58,613.0 3,253,566Fissures in crystalline rocks 75.0 4163Atmosphere 13.0 722Biosphere 0.6 33
Bound water (speculative values)in Gypsum 600 33,306in clays 7500 416,320
15W.W. Hay et al. / Palaeogeography, Palaeoclimatology, Palaeoecology 240 (2006) 3–46
coastal regions of all continents except Antarctica.Human recycling of salt from the ocean is probablygreater than atmospheric recycling. Because of itssolubility and ways in which it is used, the humanrecycling begins to approach the residual “natural”fluxes cited above. Wilkinson (2005, p. 161) stated that“Humans are now an order of magnitude moreimportant at moving sediment than the sum of allother natural processes operating on the surface of theplanet.” It appears that the human effect on salt may bejust as great as or greater than it is on sedimentarymaterials generally.
4.4. Chloride from of saline groundwaters
It is well known that the salinity of pore waterstends to increase with depth (Feth, 1981; Land, 1995).On the continental blocks, deeper groundwaters mayhave [Cl−] as high as 100 g/l, 5 times the concentrationin seawater. The source of this Cl− is uncertain, part ofit may be from dissolution of evaporite deposits, butsuch saline waters also occur in basins that are notknown to contain halite as a solid phase. Speculation isthat clay minerals may act as osmotic membranesallowing escape of water but retaining Cl− ascompaction occurs (Feth, 1981). As noted above,Land (1995) suggested that the amount of Cl− in brinescould equal that in evaporite deposits.
Although the brines may approach the land surface inarid regions, they are ordinarily overlain by fresh,circulating groundwater. Because of the density differ-ences the two water masses do not readily mix, but it isthought that upward diffusion gradually introduces saltinto the fresher layer from which it eventually entersrivers. The rates of these processes are unknown.
4.5. Chloride from evaporite deposits
Holland (1978) was the first geochemist to recognizethe importance of evaporites in river water chemistry.He noted that there is an obvious relation betweenelevated chloride and sulfate in rivers and the presenceof evaporites in the drainage basin. He estimated theaverage chloride [Cl−] in North American rivers to be8 ppm. He estimated that 75% of this comes from theerosion of evaporites. On a global scale this implies anannual delivery of about 225×109 kg/yr from theerosion of evaporites. Berner and Berner (1987)concluded that, after correcting for atmosphericallyrecycled salt and pollution (using the value of 30% fromMeybeck, 1979), the delivery from evaporites would beabout 188×109 kg/yr.
Allen (1997), working from the Oxford GlobalSediment Flux Database, concluded that evaporitescontribute 18% of the total solute load of rivers,although they are only 1% of the outcrop area.
5. Water
Critical to evaluation ocean salinity in the past isinformation on the amounts of water in the ocean andother reservoirs.
5.1. The total amount of free water on Earth
Free water is H2O that is not incorporated into thesolid phases of minerals. It occurs on the surface of theEarth as a solid: ice; as a liquid: fresh water in rivers andlakes, seawater, pore water in sediments on land and inthe ocean, water in fissure and cracks in igneous andmetamorphic rocks, water in the biosphere; and as a gas,vapor (Table 6). Three of these reservoirs, ice, seawater,and pore water, are large; all of the others are small andcan be neglected. The possible exception is that theArctic Ocean basin may have been isolated from theworld ocean and filled with fresh or brackish water attimes during the Late Cretaceous and Palaeogeneforming by far the largest “lake” on Earth. Its presentvolume is about 16.7×10⁶ km3, and its volume at thebeginning of the Late Cretaceous would have beenabout 15.6×10⁶ km3. Both values are smaller than thepresent volume of ice on Antarctica (23.56×10⁶ km3=21.6×10⁶ km3 water).
Some water is bound in sedimentary minerals, suchas gypsum (−600×1015 kg), and in hydrated clays. Theamount in clay is unknown but probably small.Potentially very large amounts of water, possibly severalocean equivalents, are incorporated into the mineralwadsleyite which is stable in the Earth's mantle.
16 W.W. Hay et al. / Palaeogeography, Palaeoclimatology, Palaeoecology 240 (2006) 3–46
There are two ultimate sources for water beingsupplied to the surface of the earth: outgassing from theearth's interior, “juvenile water”, and water carried byincoming extraterrestrial objects, particularly comets.Based on consideration of ‘excess volatiles,’ Rubey(1951) estimated the rate of outgassing of water from theearth's interior at 0.370×10¹² kg/yr, making theassumption that it had occurred at the same ratethroughout geologic time and that the oceans had beengenerated through this process. However, in the contextof plate tectonics most of the “outgassed” H2O,especially that of volcanic arc systems, is now thoughtto be the result of recycling of seawater throughsubduction zones.
Turekian (1968) proposed that the oceans originatedas saline water condensed in the last phases of Earthaccretion and hence have always had roughly theirpresent volume. Others have argued that bombardmentof the early Earth by asteroids would have vaporized anyearly ocean, and that the water accumulated later fromcomets colliding with the Earth.
Wallmann (2001) has estimated the outgassing rate ofjuvenile water from the mantle to be 0.11×10¹² kg/yrinto ocean crustal rocks, and about 0.04×10¹² kg/yr intothe atmosphere, mostly through intraplate volcanoes.
Geologists had generally assumed that cometarydelivery of water would occur as rare events largelyrestricted to the early history of the Earth, but Frank etal. (1986) suggested that the Earth might becontinuously bombarded by cosmic snowballs. Onthe basis of observations from satellites they estimatedthat small comets could bring in water at a rate ofabout 1×10¹² kg; this would fill the oceans in about1.3 billion years. At first their idea was ridiculed asbeing a misinterpretation of the instrumental data, butmore recently there seems to be additional evidencefrom ground-based telescopes that this might be thecase (Frank and Sigwarth, 2001). However, even ifthere is an influx of water from space, the rate ofsupply remains highly controversial. Where it hasbeen possible to make measurements, the water incomets has about twice as much Deuterium as oceanwater, suggesting that the cometary contribution issmall.
The other side of the equation is losses of free water;there are three possibilities: subduction into the mantle,loss into space, and incorporation into minerals.
Southam and Hay (1981) estimated the water lost tosubduction to be 0.26×10¹² kg/yr but suggested thatmost, if not all, of this is returned as volcanic wateremissions. Von Huene and Scholl (1991) estimated theglobal long-term rate of subduction of sediment to be
1 km3 solid per year. If the pore space is 30%, the massof subducted water is 0.30×10¹² kg/yr. These numbersfor subducted water so closely balance estimates ofoutgassing that it is evident that the contribution of trulyjuvenile water must be small or negligible. Thus untilrecently it seemed likely that the volume of the oceanswas essentially in a steady state.
Another method of estimating the amount of porewater subducted is to assume that the amount ofsediment on the ocean floor is in a steady state, i.e.what is delivered from the continents is ultimatelysubducted. The age–area distribution of the ocean flooris not an exponential decay, as might be expected, but ismore nearly linear. It can be fit by a second orderpolynomial equation
A ¼ 0:077t2−2:98t þ 281:54 ð1Þ
where A is the area of ocean floor older than age t (my)still in existence today. Using the data of Hay et al.(1988), on the modern mass–age distribution ofsediment on the ocean floor, and making the correctionfor the loss of ocean floor with age, it works out that thelong-term average mass of sediment delivered to theocean floor is 3.08×10¹² kg/yr. For the sediment massto be in steady state, this amount must be subductedeach year. Assuming an average density of the solidphase to be 2700 kg/m3, the volume subducted would be1.14 km3 solid/yr, very close to the estimate of VonHuene and Scholl (1991).
Wallmann (2001) has reevaluated the data onsubduction, taking into account not only pore water,which he estimates to be between 1.08 and 1.80×10¹² kg/yr, but also the structurally bound water in thesediments, 0.09×10¹² kg/yr, pore water in the upper-most 0.5 km of ocean crust, 0.07×10¹² kg/yr, water inthe upper ocean crustal rocks, 0.11×10¹² kg/yr, water inthe deeper ocean crust and peridotites from 0.5 to 7 km,between 0.36 and 1.26×10¹² kg/yr, and water from themantle trapped in the ocean crust 0.11×10¹² kg/yr.These total between 1.82 and 3.33×10¹² kg/yr as anestimate of water subducted. The difference between hisestimate of pore water subducted and those given aboveis largely related to differences in the assumed porosityof the sediment being subducted.
Wallmann (2001) estimates the amounts returned atsubduction zones: cool submarine water reflux, 1.08 to1.80×1012 kg/yr, and recycling through arc volcanoes,0.14 to 1.21×10¹² kg/yr, for a total between 1.22 and2.90×1012 kg/yr. He estimates that the net amount ofwater subducted into the deeper mantle (>250 km) isbetween 0.16 and 0.41×10¹² kg/yr.
17W.W. Hay et al. / Palaeogeography, Palaeoclimatology, Palaeoecology 240 (2006) 3–46
In addition to the water subducted, there is flowthrough the mid-ocean ridge basalts and older oceancrust, estimated to be of the order of 130×1012 kg/yr(Humphris and McCollom, 1998). Although this wateris altered chemically, it is returned to the ocean and Cl−
is not affected.The loss of water to space comes from dissociation of
H2O into its components by radiation at the top of theatmosphere, and subsequent loss of the hydrogen intospace. This may have been an important process in theEarth's early history, but today the presence of ozone inthe atmosphere makes an effective cold trap, thestratosphere, through which H2O vapor from the surfacecannot pass. The presence of significant quantities offree oxygen in the atmosphere, a prerequisite to makingozone, was essential to ending the loss of water to space,and in this respect the present oceans may owe theirexistence to the development of life on this planet.
It is possible that water brought by small cometstoday is dissociated and the hydrogen escapes back intospace.
It is obvious that the uncertainties concerning supplyand loss of free water from the surface of the Earth are so
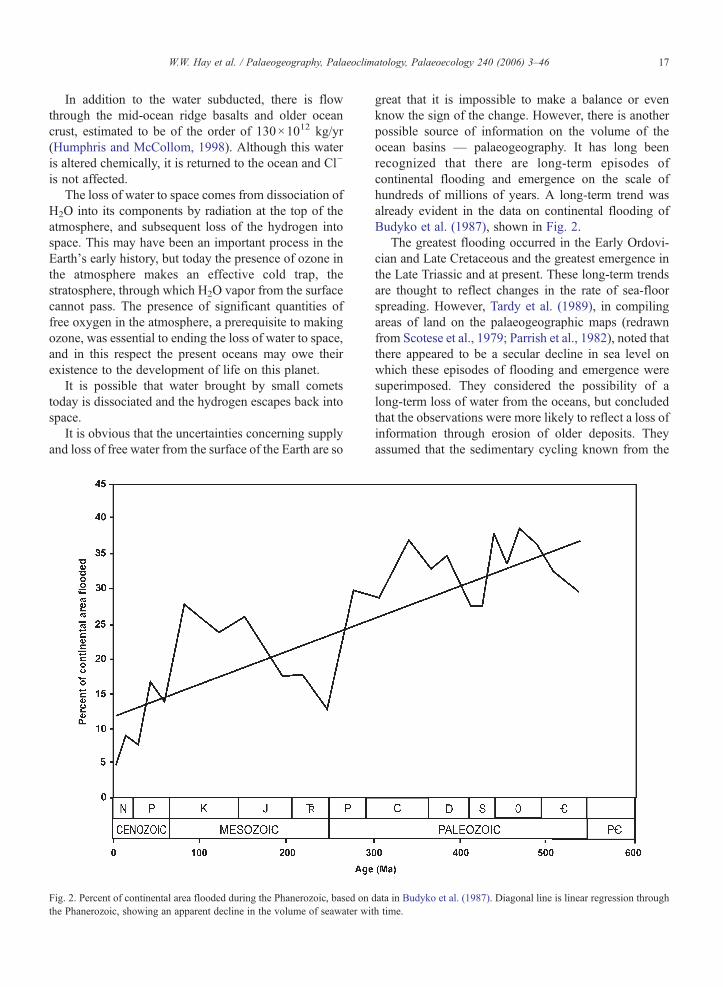
Fig. 2. Percent of continental area flooded during the Phanerozoic, based onthe Phanerozoic, showing an apparent decline in the volume of seawater wit
great that it is impossible to make a balance or evenknow the sign of the change. However, there is anotherpossible source of information on the volume of theocean basins — palaeogeography. It has long beenrecognized that there are long-term episodes ofcontinental flooding and emergence on the scale ofhundreds of millions of years. A long-term trend wasalready evident in the data on continental flooding ofBudyko et al. (1987), shown in Fig. 2.
The greatest flooding occurred in the Early Ordovi-cian and Late Cretaceous and the greatest emergence inthe Late Triassic and at present. These long-term trendsare thought to reflect changes in the rate of sea-floorspreading. However, Tardy et al. (1989), in compilingareas of land on the palaeogeographic maps (redrawnfrom Scotese et al., 1979; Parrish et al., 1982), noted thatthere appeared to be a secular decline in sea level onwhich these episodes of flooding and emergence weresuperimposed. They considered the possibility of along-term loss of water from the oceans, but concludedthat the observations were more likely to reflect a loss ofinformation through erosion of older deposits. Theyassumed that the sedimentary cycling known from the
data in Budyko et al. (1987). Diagonal line is linear regression throughh time.
18 W.W. Hay et al. / Palaeogeography, Palaeoclimatology, Palaeoecology 240 (2006) 3–46
mass–age distribution of sediments also applied to theapparent areas of the continents on palaeogeographicmaps. They calculated the palaeoland area A (in103 km2) to decrease exponentially as a function oftime t (in my) following the formula
A ¼ EXPð−0:00122t þ 11:941Þ ð2ÞHallam (1992) assumed that the observed secular
decline is not an artifact of the loss of information withage. He estimated that the oceans had lost about 10% oftheir water over the course of the Phanerozoic. Thisamounts to 0.25×10¹² kg seawater/yr, in the middle ofthe range of Wallmann's (2001) estimates of the netwater subducted into the deep mantle.
There is a problem in the quantitative evaluation ofthe long-term trend, noted by Ronov (1994). From thepalaeogeographic maps one can measure the area ofcontinent flooded, but any assumption about theabsolute magnitude of the sea level change requiresknowledge of the hypsography of the continents at thetime. The assumption usually made is that the
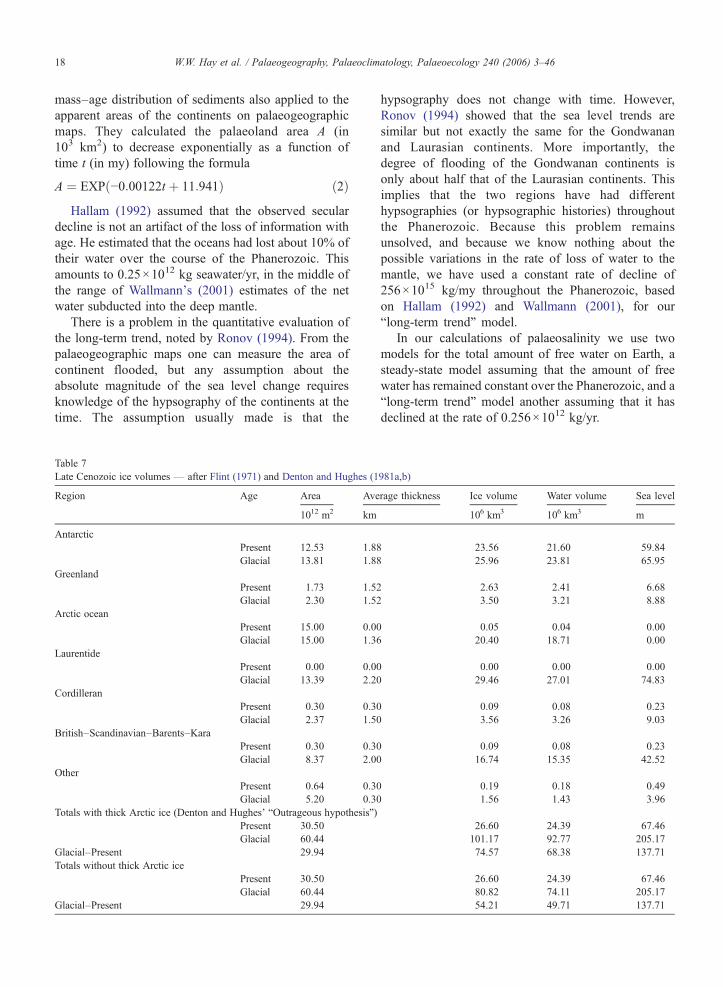
Table 7Late Cenozoic ice volumes — after Flint (1971) and Denton and Hughes (1
Region Age Area Ave
1012 m2 km
AntarcticPresent 12.53 1.88Glacial 13.81 1.88
GreenlandPresent 1.73 1.52Glacial 2.30 1.52
Arctic oceanPresent 15.00 0.00Glacial 15.00 1.36
LaurentidePresent 0.00 0.00Glacial 13.39 2.20
CordilleranPresent 0.30 0.30Glacial 2.37 1.50
British–Scandinavian–Barents–KaraPresent 0.30 0.30Glacial 8.37 2.00
OtherPresent 0.64 0.30Glacial 5.20 0.30
Totals with thick Arctic ice (Denton and Hughes' “Outrageous hypothesis”)Present 30.50Glacial 60.44
Glacial–Present 29.94Totals without thick Arctic ice
Present 30.50Glacial 60.44
Glacial–Present 29.94
hypsography does not change with time. However,Ronov (1994) showed that the sea level trends aresimilar but not exactly the same for the Gondwananand Laurasian continents. More importantly, thedegree of flooding of the Gondwanan continents isonly about half that of the Laurasian continents. Thisimplies that the two regions have had differenthypsographies (or hypsographic histories) throughoutthe Phanerozoic. Because this problem remainsunsolved, and because we know nothing about thepossible variations in the rate of loss of water to themantle, we have used a constant rate of decline of256×1015 kg/my throughout the Phanerozoic, basedon Hallam (1992) and Wallmann (2001), for our“long-term trend” model.
In our calculations of palaeosalinity we use twomodels for the total amount of free water on Earth, asteady-state model assuming that the amount of freewater has remained constant over the Phanerozoic, and a“long-term trend” model another assuming that it hasdeclined at the rate of 0.256×10¹² kg/yr.
981a,b)
rage thickness Ice volume Water volume Sea level
106 km3 106 km3 m
23.56 21.60 59.8425.96 23.81 65.95
2.63 2.41 6.683.50 3.21 8.88
0.05 0.04 0.0020.40 18.71 0.00
0.00 0.00 0.0029.46 27.01 74.83
0.09 0.08 0.233.56 3.26 9.03
0.09 0.08 0.2316.74 15.35 42.52
0.19 0.18 0.491.56 1.43 3.96
26.60 24.39 67.46101.17 92.77 205.1774.57 68.38 137.71
26.60 24.39 67.4680.82 74.11 205.1754.21 49.71 137.71
19W.W. Hay et al. / Palaeogeography, Palaeoclimatology, Palaeoecology 240 (2006) 3–46
5.2. The amount of water in the ocean
There are two reservoirs of free water outside theocean large enough to significantly affect the oceanvolume: ice and groundwater. The volumes of ice atpresent and during the last glacial maximum are shownin Table 7. The estimates are from Flint (1971), partiallyrevised by Denton and Hughes (1981a). The amount ofwater currently present as ice is about 24.4×10⁶ km3. Itis mostly in the Antarctic and Greenland ice sheets, butthere are also lesser amounts in the Cordillera of NorthAmerica, the mountains of Scandinavia, and elsewhere.
During the Quaternary as much as 2% of the totalocean volume may have been incorporated into icesheets. During the Last Glacial Maximum the meansalinity of the ocean was probably about 36.0‰, but ifthe Denton and Hughes (1981b) “outrageous hypothe-sis” of a thick sheet of ice floating on the Arctic Ocean istrue, the ocean salinity could have been as high as37.6‰.
The amount of water stored in the pore space ofsediments is larger that the amount in ice sheets, butvaries on a much longer time scale (106 years) and onlyas the total mass of sedimentary rocks increases or
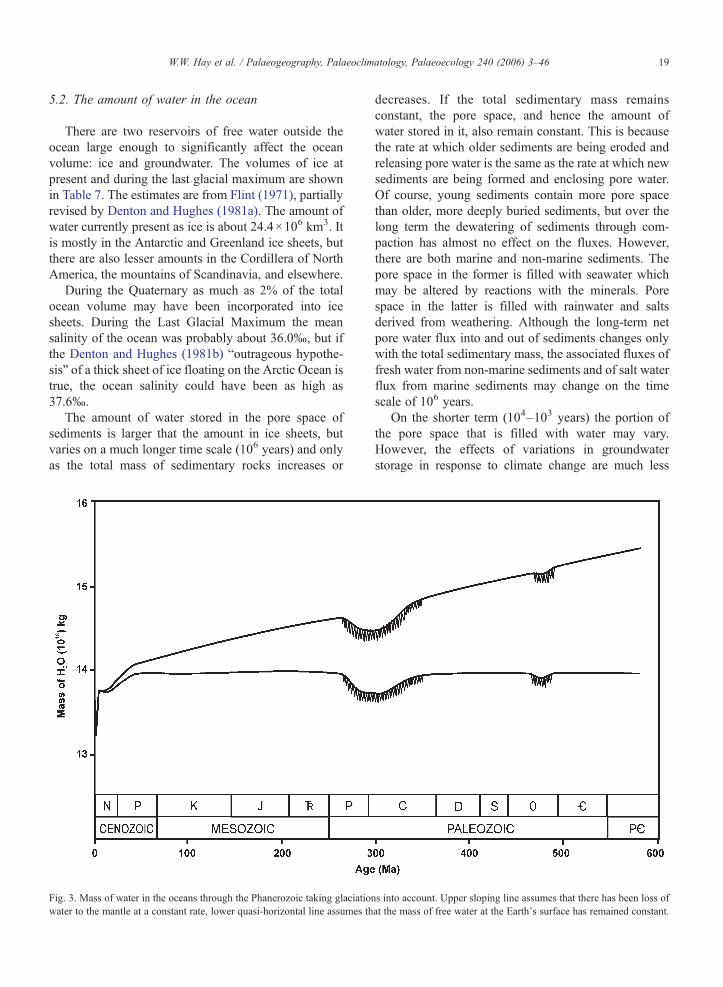
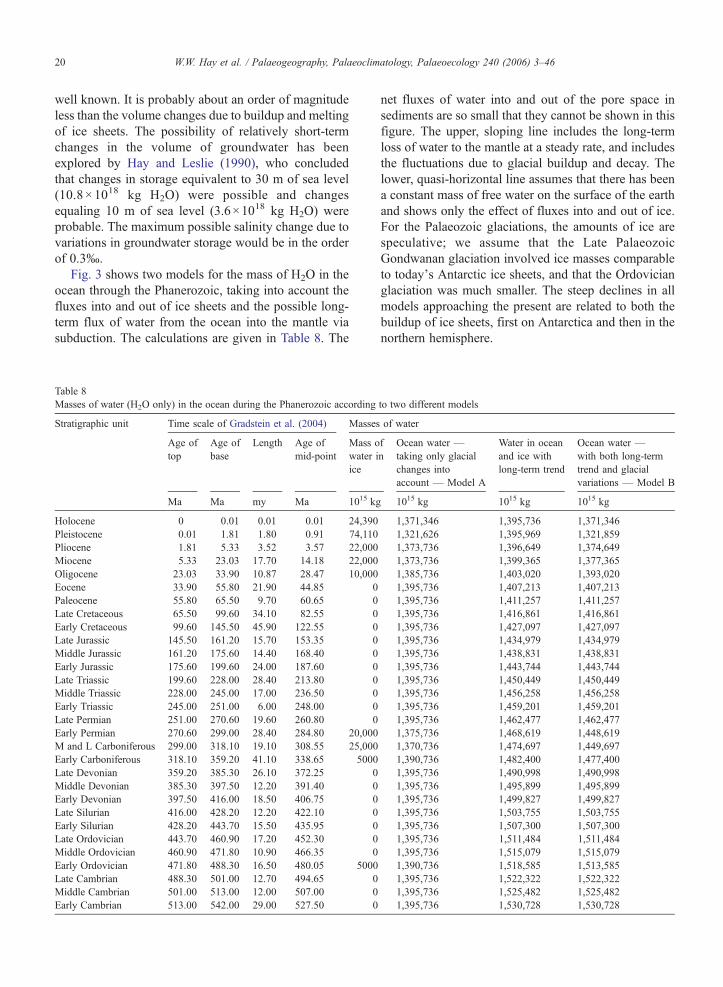
Fig. 3. Mass of water in the oceans through the Phanerozoic taking glaciationwater to the mantle at a constant rate, lower quasi-horizontal line assumes th
decreases. If the total sedimentary mass remainsconstant, the pore space, and hence the amount ofwater stored in it, also remain constant. This is becausethe rate at which older sediments are being eroded andreleasing pore water is the same as the rate at which newsediments are being formed and enclosing pore water.Of course, young sediments contain more pore spacethan older, more deeply buried sediments, but over thelong term the dewatering of sediments through com-paction has almost no effect on the fluxes. However,there are both marine and non-marine sediments. Thepore space in the former is filled with seawater whichmay be altered by reactions with the minerals. Porespace in the latter is filled with rainwater and saltsderived from weathering. Although the long-term netpore water flux into and out of sediments changes onlywith the total sedimentary mass, the associated fluxes offresh water from non-marine sediments and of salt waterflux from marine sediments may change on the timescale of 106 years.
On the shorter term (104–103 years) the portion ofthe pore space that is filled with water may vary.However, the effects of variations in groundwaterstorage in response to climate change are much less
s into account. Upper sloping line assumes that there has been loss ofat the mass of free water at the Earth's surface has remained constant.
20 W.W. Hay et al. / Palaeogeography, Palaeoclimatology, Palaeoecology 240 (2006) 3–46
well known. It is probably about an order of magnitudeless than the volume changes due to buildup and meltingof ice sheets. The possibility of relatively short-termchanges in the volume of groundwater has beenexplored by Hay and Leslie (1990), who concludedthat changes in storage equivalent to 30 m of sea level(10.8×10¹⁸ kg H2O) were possible and changesequaling 10 m of sea level (3.6×10¹⁸ kg H2O) wereprobable. The maximum possible salinity change due tovariations in groundwater storage would be in the orderof 0.3‰.
Fig. 3 shows two models for the mass of H2O in theocean through the Phanerozoic, taking into account thefluxes into and out of ice sheets and the possible long-term flux of water from the ocean into the mantle viasubduction. The calculations are given in Table 8. The
Table 8Masses of water (H2O only) in the ocean during the Phanerozoic according
Stratigraphic unit Time scale of Gradstein et al. (2004) Masses
Age oftop
Age ofbase
Length Age ofmid-point
Mass owater iice
Ma Ma my Ma 1015 kg
Holocene 0 0.01 0.01 0.01 24,390Pleistocene 0.01 1.81 1.80 0.91 74,110Pliocene 1.81 5.33 3.52 3.57 22,000Miocene 5.33 23.03 17.70 14.18 22,000Oligocene 23.03 33.90 10.87 28.47 10,000Eocene 33.90 55.80 21.90 44.85 0Paleocene 55.80 65.50 9.70 60.65 0Late Cretaceous 65.50 99.60 34.10 82.55 0Early Cretaceous 99.60 145.50 45.90 122.55 0Late Jurassic 145.50 161.20 15.70 153.35 0Middle Jurassic 161.20 175.60 14.40 168.40 0Early Jurassic 175.60 199.60 24.00 187.60 0Late Triassic 199.60 228.00 28.40 213.80 0Middle Triassic 228.00 245.00 17.00 236.50 0Early Triassic 245.00 251.00 6.00 248.00 0Late Permian 251.00 270.60 19.60 260.80 0Early Permian 270.60 299.00 28.40 284.80 20,000M and L Carboniferous 299.00 318.10 19.10 308.55 25,000Early Carboniferous 318.10 359.20 41.10 338.65 5000Late Devonian 359.20 385.30 26.10 372.25 0Middle Devonian 385.30 397.50 12.20 391.40 0Early Devonian 397.50 416.00 18.50 406.75 0Late Silurian 416.00 428.20 12.20 422.10 0Early Silurian 428.20 443.70 15.50 435.95 0Late Ordovician 443.70 460.90 17.20 452.30 0Middle Ordovician 460.90 471.80 10.90 466.35 0Early Ordovician 471.80 488.30 16.50 480.05 5000Late Cambrian 488.30 501.00 12.70 494.65 0Middle Cambrian 501.00 513.00 12.00 507.00 0Early Cambrian 513.00 542.00 29.00 527.50 0
net fluxes of water into and out of the pore space insediments are so small that they cannot be shown in thisfigure. The upper, sloping line includes the long-termloss of water to the mantle at a steady rate, and includesthe fluctuations due to glacial buildup and decay. Thelower, quasi-horizontal line assumes that there has beena constant mass of free water on the surface of the earthand shows only the effect of fluxes into and out of ice.For the Palaeozoic glaciations, the amounts of ice arespeculative; we assume that the Late PalaeozoicGondwanan glaciation involved ice masses comparableto today's Antarctic ice sheets, and that the Ordovicianglaciation was much smaller. The steep declines in allmodels approaching the present are related to both thebuildup of ice sheets, first on Antarctica and then in thenorthern hemisphere.
to two different models
of water
fn
Ocean water —taking only glacialchanges intoaccount — Model A
Water in oceanand ice withlong-term trend
Ocean water —with both long-termtrend and glacialvariations — Model B
1015 kg 1015 kg 1015 kg
1,371,346 1,395,736 1,371,3461,321,626 1,395,969 1,321,8591,373,736 1,396,649 1,374,6491,373,736 1,399,365 1,377,3651,385,736 1,403,020 1,393,0201,395,736 1,407,213 1,407,2131,395,736 1,411,257 1,411,2571,395,736 1,416,861 1,416,8611,395,736 1,427,097 1,427,0971,395,736 1,434,979 1,434,9791,395,736 1,438,831 1,438,8311,395,736 1,443,744 1,443,7441,395,736 1,450,449 1,450,4491,395,736 1,456,258 1,456,2581,395,736 1,459,201 1,459,2011,395,736 1,462,477 1,462,4771,375,736 1,468,619 1,448,6191,370,736 1,474,697 1,449,6971,390,736 1,482,400 1,477,4001,395,736 1,490,998 1,490,9981,395,736 1,495,899 1,495,8991,395,736 1,499,827 1,499,8271,395,736 1,503,755 1,503,7551,395,736 1,507,300 1,507,3001,395,736 1,511,484 1,511,4841,395,736 1,515,079 1,515,0791,390,736 1,518,585 1,513,5851,395,736 1,522,322 1,522,3221,395,736 1,525,482 1,525,4821,395,736 1,530,728 1,530,728
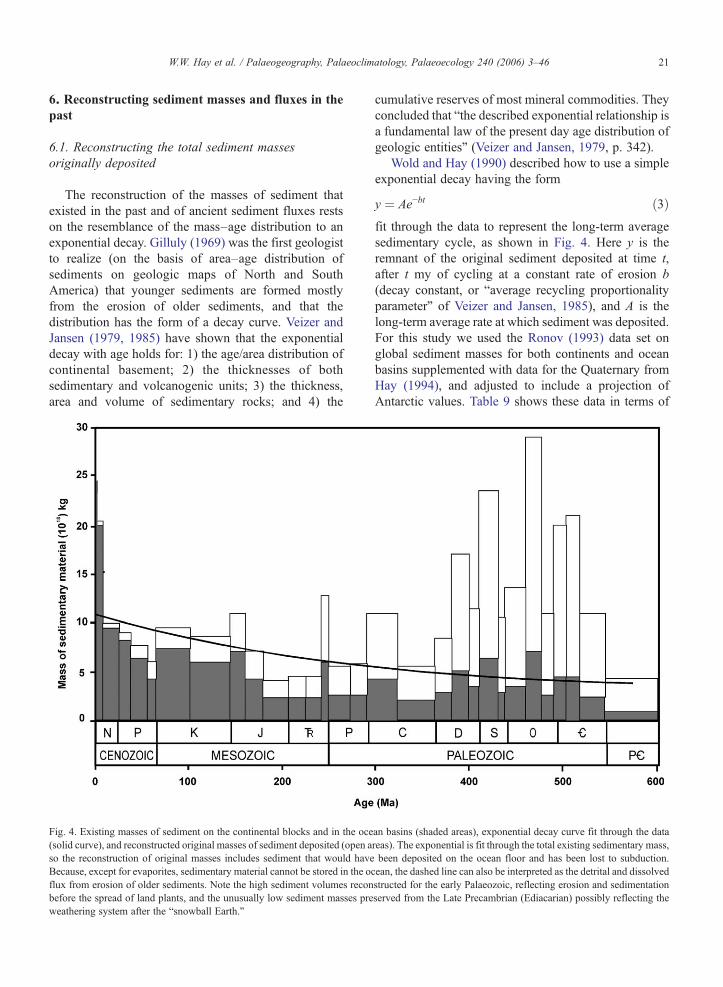
21W.W. Hay et al. / Palaeogeography, Palaeoclimatology, Palaeoecology 240 (2006) 3–46
6. Reconstructing sediment masses and fluxes in thepast
6.1. Reconstructing the total sediment massesoriginally deposited
The reconstruction of the masses of sediment thatexisted in the past and of ancient sediment fluxes restson the resemblance of the mass–age distribution to anexponential decay. Gilluly (1969) was the first geologistto realize (on the basis of area–age distribution ofsediments on geologic maps of North and SouthAmerica) that younger sediments are formed mostlyfrom the erosion of older sediments, and that thedistribution has the form of a decay curve. Veizer andJansen (1979, 1985) have shown that the exponentialdecay with age holds for: 1) the age/area distribution ofcontinental basement; 2) the thicknesses of bothsedimentary and volcanogenic units; 3) the thickness,area and volume of sedimentary rocks; and 4) the
Fig. 4. Existing masses of sediment on the continental blocks and in the oce(solid curve), and reconstructed original masses of sediment deposited (open aso the reconstruction of original masses includes sediment that would haveBecause, except for evaporites, sedimentary material cannot be stored in the ocflux from erosion of older sediments. Note the high sediment volumes reconbefore the spread of land plants, and the unusually low sediment masses preweathering system after the “snowball Earth.”
cumulative reserves of most mineral commodities. Theyconcluded that “the described exponential relationship isa fundamental law of the present day age distribution ofgeologic entities” (Veizer and Jansen, 1979, p. 342).
Wold and Hay (1990) described how to use a simpleexponential decay having the form
y ¼ Ae−bt ð3Þfit through the data to represent the long-term averagesedimentary cycle, as shown in Fig. 4. Here y is theremnant of the original sediment deposited at time t,after t my of cycling at a constant rate of erosion b(decay constant, or “average recycling proportionalityparameter” of Veizer and Jansen, 1985), and A is thelong-term average rate at which sediment was deposited.For this study we used the Ronov (1993) data set onglobal sediment masses for both continents and oceanbasins supplemented with data for the Quaternary fromHay (1994), and adjusted to include a projection ofAntarctic values. Table 9 shows these data in terms of
an basins (shaded areas), exponential decay curve fit through the datareas). The exponential is fit through the total existing sedimentary mass,been deposited on the ocean floor and has been lost to subduction.ean, the dashed line can also be interpreted as the detrital and dissolvedstructed for the early Palaeozoic, reflecting erosion and sedimentationserved from the Late Precambrian (Ediacarian) possibly reflecting the
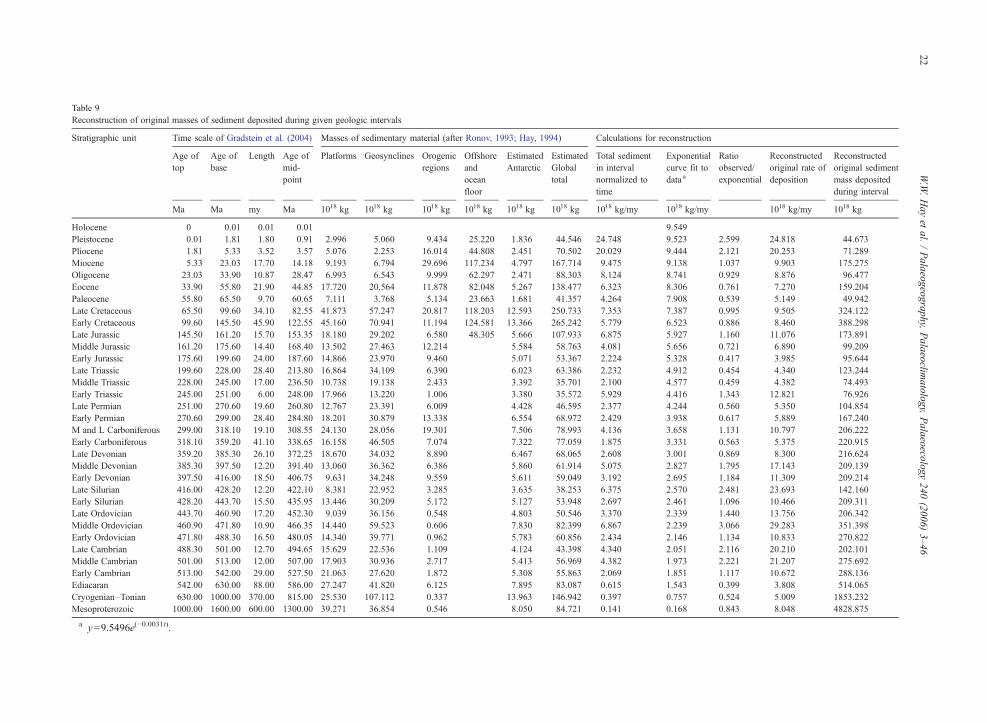
Table 9Reconstruction of original masses of sediment deposited during given geologic intervals
Stratigraphic unit Time scale of Gradstein et al. (2004) Masses of sedimentary material (after Ronov, 1993; Hay, 1994) Calculations for reconstruction
Age oftop
Age ofbase
Length Age ofmid-point
Platforms Geosynclines Orogenicregions
Offshoreandoceanfloor
EstimatedAntarctic
EstimatedGlobaltotal
Total sedimentin intervalnormalized totime
Exponentialcurve fit todata a
Ratioobserved/exponential
Reconstructedoriginal rate ofdeposition
Reconstructedoriginal sedimentmass depositedduring interval
Ma Ma my Ma 1018 kg 1018 kg 1018 kg 1018 kg 1018 kg 1018 kg 1018 kg/my 1018 kg/my 1018 kg/my 1018 kg
Holocene 0 0.01 0.01 0.01 9.549Pleistocene 0.01 1.81 1.80 0.91 2.996 5.060 9.434 25.220 1.836 44.546 24.748 9.523 2.599 24.818 44.673Pliocene 1.81 5.33 3.52 3.57 5.076 2.253 16.014 44.808 2.451 70.502 20.029 9.444 2.121 20.253 71.289Miocene 5.33 23.03 17.70 14.18 9.193 6.794 29.696 117.234 4.797 167.714 9.475 9.138 1.037 9.903 175.275Oligocene 23.03 33.90 10.87 28.47 6.993 6.543 9.999 62.297 2.471 88.303 8.124 8.741 0.929 8.876 96.477Eocene 33.90 55.80 21.90 44.85 17.720 20.564 11.878 82.048 5.267 138.477 6.323 8.306 0.761 7.270 159.204Paleocene 55.80 65.50 9.70 60.65 7.111 3.768 5.134 23.663 1.681 41.357 4.264 7.908 0.539 5.149 49.942Late Cretaceous 65.50 99.60 34.10 82.55 41.873 57.247 20.817 118.203 12.593 250.733 7.353 7.387 0.995 9.505 324.122Early Cretaceous 99.60 145.50 45.90 122.55 45.160 70.941 11.194 124.581 13.366 265.242 5.779 6.523 0.886 8.460 388.298Late Jurassic 145.50 161.20 15.70 153.35 18.180 29.202 6.580 48.305 5.666 107.933 6.875 5.927 1.160 11.076 173.891Middle Jurassic 161.20 175.60 14.40 168.40 13.502 27.463 12.214 5.584 58.763 4.081 5.656 0.721 6.890 99.209Early Jurassic 175.60 199.60 24.00 187.60 14.866 23.970 9.460 5.071 53.367 2.224 5.328 0.417 3.985 95.644Late Triassic 199.60 228.00 28.40 213.80 16.864 34.109 6.390 6.023 63.386 2.232 4.912 0.454 4.340 123.244Middle Triassic 228.00 245.00 17.00 236.50 10.738 19.138 2.433 3.392 35.701 2.100 4.577 0.459 4.382 74.493Early Triassic 245.00 251.00 6.00 248.00 17.966 13.220 1.006 3.380 35.572 5.929 4.416 1.343 12.821 76.926Late Permian 251.00 270.60 19.60 260.80 12.767 23.391 6.009 4.428 46.595 2.377 4.244 0.560 5.350 104.854Early Permian 270.60 299.00 28.40 284.80 18.201 30.879 13.338 6.554 68.972 2.429 3.938 0.617 5.889 167.240M and L Carboniferous 299.00 318.10 19.10 308.55 24.130 28.056 19.301 7.506 78.993 4.136 3.658 1.131 10.797 206.222Early Carboniferous 318.10 359.20 41.10 338.65 16.158 46.505 7.074 7.322 77.059 1.875 3.331 0.563 5.375 220.915Late Devonian 359.20 385.30 26.10 372.25 18.670 34.032 8.890 6.467 68.065 2.608 3.001 0.869 8.300 216.624Middle Devonian 385.30 397.50 12.20 391.40 13.060 36.362 6.386 5.860 61.914 5.075 2.827 1.795 17.143 209.139Early Devonian 397.50 416.00 18.50 406.75 9.631 34.248 9.559 5.611 59.049 3.192 2.695 1.184 11.309 209.214Late Silurian 416.00 428.20 12.20 422.10 8.381 22.952 3.285 3.635 38.253 6.375 2.570 2.481 23.693 142.160Early Silurian 428.20 443.70 15.50 435.95 13.446 30.209 5.172 5.127 53.948 2.697 2.461 1.096 10.466 209.311Late Ordovician 443.70 460.90 17.20 452.30 9.039 36.156 0.548 4.803 50.546 3.370 2.339 1.440 13.756 206.342Middle Ordovician 460.90 471.80 10.90 466.35 14.440 59.523 0.606 7.830 82.399 6.867 2.239 3.066 29.283 351.398Early Ordovician 471.80 488.30 16.50 480.05 14.340 39.771 0.962 5.783 60.856 2.434 2.146 1.134 10.833 270.822Late Cambrian 488.30 501.00 12.70 494.65 15.629 22.536 1.109 4.124 43.398 4.340 2.051 2.116 20.210 202.101Middle Cambrian 501.00 513.00 12.00 507.00 17.903 30.936 2.717 5.413 56.969 4.382 1.973 2.221 21.207 275.692Early Cambrian 513.00 542.00 29.00 527.50 21.063 27.620 1.872 5.308 55.863 2.069 1.851 1.117 10.672 288.136Ediacaran 542.00 630.00 88.00 586.00 27.247 41.820 6.125 7.895 83.087 0.615 1.543 0.399 3.808 514.065Cryogenian–Tonian 630.00 1000.00 370.00 815.00 25.530 107.112 0.337 13.963 146.942 0.397 0.757 0.524 5.009 1853.232Mesoproterozoic 1000.00 1600.00 600.00 1300.00 39.271 36.854 0.546 8.050 84.721 0.141 0.168 0.843 8.048 4828.875
a y=9.5496e(−0.0031t).
22W.W.Hay
etal.
/Palaeogeography,
Palaeoclim
atology,Palaeoecology
240(2006)
3–46
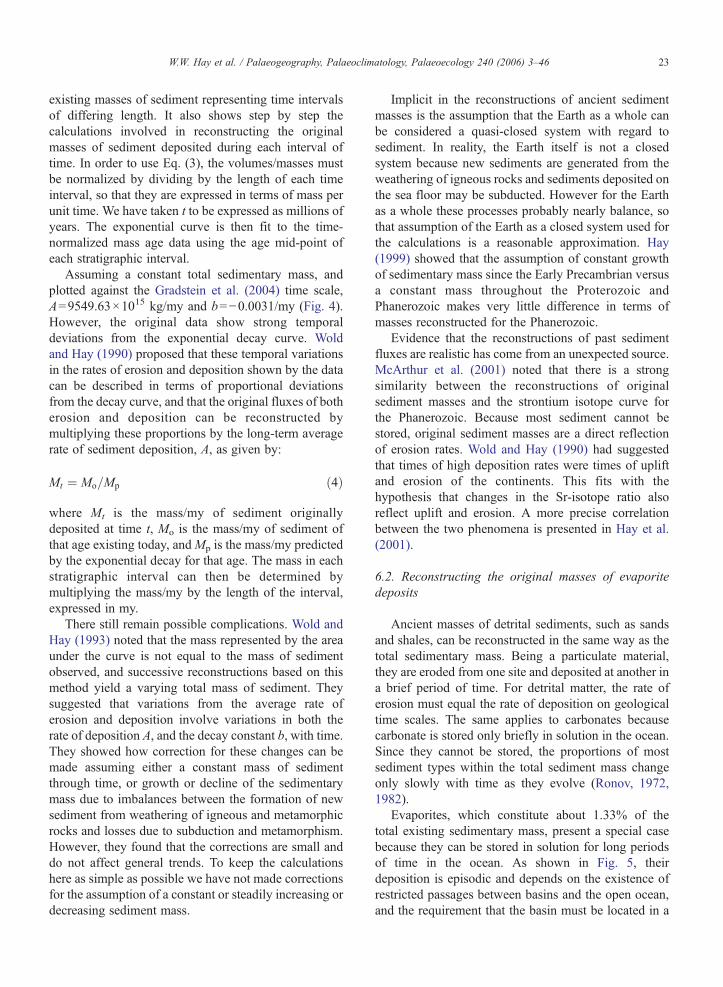
23W.W. Hay et al. / Palaeogeography, Palaeoclimatology, Palaeoecology 240 (2006) 3–46
existing masses of sediment representing time intervalsof differing length. It also shows step by step thecalculations involved in reconstructing the originalmasses of sediment deposited during each interval oftime. In order to use Eq. (3), the volumes/masses mustbe normalized by dividing by the length of each timeinterval, so that they are expressed in terms of mass perunit time. We have taken t to be expressed as millions ofyears. The exponential curve is then fit to the time-normalized mass age data using the age mid-point ofeach stratigraphic interval.
Assuming a constant total sedimentary mass, andplotted against the Gradstein et al. (2004) time scale,A=9549.63×1015 kg/my and b=−0.0031/my (Fig. 4).However, the original data show strong temporaldeviations from the exponential decay curve. Woldand Hay (1990) proposed that these temporal variationsin the rates of erosion and deposition shown by the datacan be described in terms of proportional deviationsfrom the decay curve, and that the original fluxes of botherosion and deposition can be reconstructed bymultiplying these proportions by the long-term averagerate of sediment deposition, A, as given by:
Mt ¼ Mo=Mp ð4Þ
where Mt is the mass/my of sediment originallydeposited at time t, Mo is the mass/my of sediment ofthat age existing today, andMp is the mass/my predictedby the exponential decay for that age. The mass in eachstratigraphic interval can then be determined bymultiplying the mass/my by the length of the interval,expressed in my.
There still remain possible complications. Wold andHay (1993) noted that the mass represented by the areaunder the curve is not equal to the mass of sedimentobserved, and successive reconstructions based on thismethod yield a varying total mass of sediment. Theysuggested that variations from the average rate oferosion and deposition involve variations in both therate of deposition A, and the decay constant b, with time.They showed how correction for these changes can bemade assuming either a constant mass of sedimentthrough time, or growth or decline of the sedimentarymass due to imbalances between the formation of newsediment from weathering of igneous and metamorphicrocks and losses due to subduction and metamorphism.However, they found that the corrections are small anddo not affect general trends. To keep the calculationshere as simple as possible we have not made correctionsfor the assumption of a constant or steadily increasing ordecreasing sediment mass.
Implicit in the reconstructions of ancient sedimentmasses is the assumption that the Earth as a whole canbe considered a quasi-closed system with regard tosediment. In reality, the Earth itself is not a closedsystem because new sediments are generated from theweathering of igneous rocks and sediments deposited onthe sea floor may be subducted. However for the Earthas a whole these processes probably nearly balance, sothat assumption of the Earth as a closed system used forthe calculations is a reasonable approximation. Hay(1999) showed that the assumption of constant growthof sedimentary mass since the Early Precambrian versusa constant mass throughout the Proterozoic andPhanerozoic makes very little difference in terms ofmasses reconstructed for the Phanerozoic.
Evidence that the reconstructions of past sedimentfluxes are realistic has come from an unexpected source.McArthur et al. (2001) noted that there is a strongsimilarity between the reconstructions of originalsediment masses and the strontium isotope curve forthe Phanerozoic. Because most sediment cannot bestored, original sediment masses are a direct reflectionof erosion rates. Wold and Hay (1990) had suggestedthat times of high deposition rates were times of upliftand erosion of the continents. This fits with thehypothesis that changes in the Sr-isotope ratio alsoreflect uplift and erosion. A more precise correlationbetween the two phenomena is presented in Hay et al.(2001).
6.2. Reconstructing the original masses of evaporitedeposits
Ancient masses of detrital sediments, such as sandsand shales, can be reconstructed in the same way as thetotal sedimentary mass. Being a particulate material,they are eroded from one site and deposited at another ina brief period of time. For detrital matter, the rate oferosion must equal the rate of deposition on geologicaltime scales. The same applies to carbonates becausecarbonate is stored only briefly in solution in the ocean.Since they cannot be stored, the proportions of mostsediment types within the total sediment mass changeonly slowly with time as they evolve (Ronov, 1972,1982).
Evaporites, which constitute about 1.33% of thetotal existing sedimentary mass, present a special casebecause they can be stored in solution for long periodsof time in the ocean. As shown in Fig. 5, theirdeposition is episodic and depends on the existence ofrestricted passages between basins and the open ocean,and the requirement that the basin must be located in a
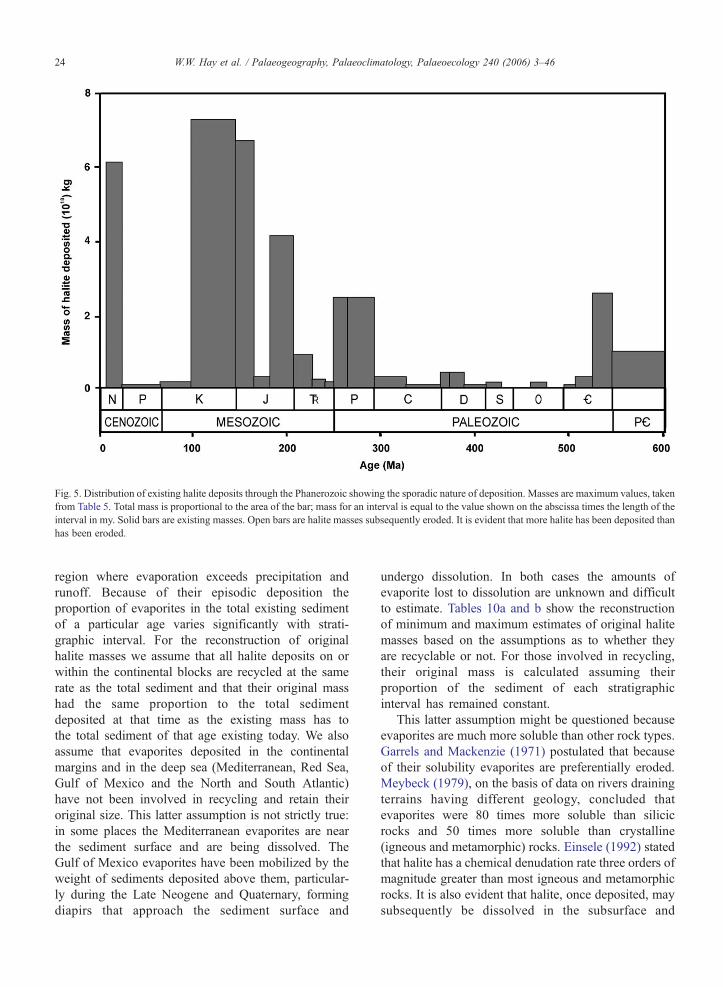
Fig. 5. Distribution of existing halite deposits through the Phanerozoic showing the sporadic nature of deposition. Masses are maximum values, takenfrom Table 5. Total mass is proportional to the area of the bar; mass for an interval is equal to the value shown on the abscissa times the length of theinterval in my. Solid bars are existing masses. Open bars are halite masses subsequently eroded. It is evident that more halite has been deposited thanhas been eroded.
24 W.W. Hay et al. / Palaeogeography, Palaeoclimatology, Palaeoecology 240 (2006) 3–46
region where evaporation exceeds precipitation andrunoff. Because of their episodic deposition theproportion of evaporites in the total existing sedimentof a particular age varies significantly with strati-graphic interval. For the reconstruction of originalhalite masses we assume that all halite deposits on orwithin the continental blocks are recycled at the samerate as the total sediment and that their original masshad the same proportion to the total sedimentdeposited at that time as the existing mass has tothe total sediment of that age existing today. We alsoassume that evaporites deposited in the continentalmargins and in the deep sea (Mediterranean, Red Sea,Gulf of Mexico and the North and South Atlantic)have not been involved in recycling and retain theiroriginal size. This latter assumption is not strictly true:in some places the Mediterranean evaporites are nearthe sediment surface and are being dissolved. TheGulf of Mexico evaporites have been mobilized by theweight of sediments deposited above them, particular-ly during the Late Neogene and Quaternary, formingdiapirs that approach the sediment surface and
undergo dissolution. In both cases the amounts ofevaporite lost to dissolution are unknown and difficultto estimate. Tables 10a and b show the reconstructionof minimum and maximum estimates of original halitemasses based on the assumptions as to whether theyare recyclable or not. For those involved in recycling,their original mass is calculated assuming theirproportion of the sediment of each stratigraphicinterval has remained constant.
This latter assumption might be questioned becauseevaporites are much more soluble than other rock types.Garrels and Mackenzie (1971) postulated that becauseof their solubility evaporites are preferentially eroded.Meybeck (1979), on the basis of data on rivers drainingterrains having different geology, concluded thatevaporites were 80 times more soluble than silicicrocks and 50 times more soluble than crystalline(igneous and metamorphic) rocks. Einsele (1992) statedthat halite has a chemical denudation rate three orders ofmagnitude greater than most igneous and metamorphicrocks. It is also evident that halite, once deposited, maysubsequently be dissolved in the subsurface and

Table 10aReconstruction of original masses of halite and amounts eroded since deposition — minimum estimates
Age Time scale of Gradstein et al. (2004) Minimum halite masses
Age oftop
Length Age ofmid-point
Lengthbetweenmid-points
Totalexistinghalitemass
Halite onocean floor— notrecyclable
Totalrecyclablehalitemass
Recyclable halitemass as proportionof total existingsediment
Reconstructedoriginalrecyclablehalite mass
Mass ofhaiteerodedsincedeposition
Ma my Ma my 1015 kg 1015 kg 1015 kg 1015 kg 1018 kg
Holocene 0 0.01 0.005Pleistocene 0.01 1.80 0.91 0.905 0.000 0.000 0.000 0.000000 0.000 0.000Pliocene 1.81 3.52 3.57 2.66 8.748 0.000 8.748 0.000124 8.846 0.098Miocene 5.33 17.70 14.18 10.61 4233.600 2376.000 1857.600 0.011076 1941.353 83.753Oligocene 23.03 10.87 28.47 14.29 62.208 4.320 57.888 0.000656 63.246 5.358Eocene 33.90 21.90 44.85 16.39 31.752 0.000 31.752 0.000229 36.505 4.753Paleocene 55.80 9.70 60.65 15.80 9.288 0.000 9.288 0.000225 11.216 1.928Late Cretaceous 65.50 34.10 82.55 21.90 95.904 0.000 95.904 0.000382 123.975 28.071Early
Cretaceous99.60 45.90 122.55 40.00 1633.392 648.000 985.392 0.003715 1442.553 457.161
Late Jurassic 145.50 15.70 153.35 30.80 6451.920 4536.000 1915.920 0.017751 3086.743 1170.823Middle Jurassic 161.20 14.40 168.40 15.05 300.240 0.000 300.240 0.005109 506.896 206.656Early Jurassic 175.60 24.00 187.60 19.20 3978.720 3888.000 90.720 0.001700 162.587 71.867Late Triassic 199.60 28.40 213.80 26.20 846.720 0.000 846.720 0.013358 1646.304 799.584Middle Triassic 228.00 17.00 236.50 22.70 50.760 0.000 50.760 0.001422 105.914 55.154Early Triassic 245.00 6.00 248.00 11.50 91.800 0.000 91.800 0.002581 198.520 106.720Late Permian 251.00 19.60 260.80 12.80 1708.560 0.000 1708.560 0.036669 3844.867 2136.307Early Permian 270.60 28.40 284.80 24.00 2378.160 0.000 2378.160 0.034480 5766.441 3388.281M and L
Carboniferous299.00 19.10 308.55 23.75 278.640 0.000 278.640 0.003527 727.425 448.785
EarlyCarboniferous
318.10 41.10 338.65 30.10 93.528 0.000 93.528 0.001214 268.127 174.599
Late Devonian 359.20 26.10 372.25 33.60 268.574 0.000 268.574 0.003946 854.764 586.190Middle
Devonian385.30 12.20 391.40 19.15 400.602 0.000 400.602 0.006470 1353.194 952.592
Early Devonian 397.50 18.50 406.75 15.35 2.160 0.000 2.160 0.000037 7.653 5.493Late Silurian 416.00 12.20 422.10 15.35 59.270 0.000 59.270 0.001549 220.267 160.997Early Silurian 428.20 15.50 435.95 13.85 0.000 0.000 0.000 0.000000 0.000 0.000Late Ordovician 443.70 17.20 452.30 16.35 0.000 0.000 0.000 0.000000 0.000 0.000Middle
Ordovician460.90 10.90 466.35 14.05 58.492 0.000 58.492 0.000710 249.447 190.954
EarlyOrdovician
471.80 16.50 480.05 13.70 0.000 0.000 0.000 0.000000 0.000 0.000
Late Cambrian 488.30 12.70 494.65 14.60 13.647 0.000 13.647 0.000314 63.553 49.906Middle
Cambrian501.00 12.00 507.00 12.35 282.074 0.000 282.074 0.004951 1365.043 1082.968
Early Cambrian 513.00 29.00 527.50 20.50 2496.420 0.000 2496.420 0.044688 12,876.227 10,379.807Ediacaran 542.00 88.00 586.00 58.50 1296.000 0.000 1296.000 0.015598 8018.430 6722.430Cryogenian–
Tonian630.00 370.00 815.00 229.00 0.000 0.000 0.000 0.000000 0.000 0.000
Mesoproterozoic 1000.00 600.00 1300.00 485.00 0.0000 0.000 0.000 0.000000 0.000 0.000
25W.W. Hay et al. / Palaeogeography, Palaeoclimatology, Palaeoecology 240 (2006) 3–46
contribute to the saline brines found in most sedimen-tary basins. Land (1995) cited abundance evidence fordissolution of halite at depth, including collapsebreccias.
However, Wold and Hay (1993) argued that theamount of evaporites dissolved and eroded must beclosely related to the general rate of sedimentary
cycling. For them to be selectively eroded they mustbe close enough to the surface so that the groundwaterscirculate. We assume that on the time scale of the majorstratigraphic units in the Ronov database (averagelength 18.7 my) little selective erosion of older depositstakes place. Interestingly, the half-life of all sediment,calculated from the equation and values given above, is
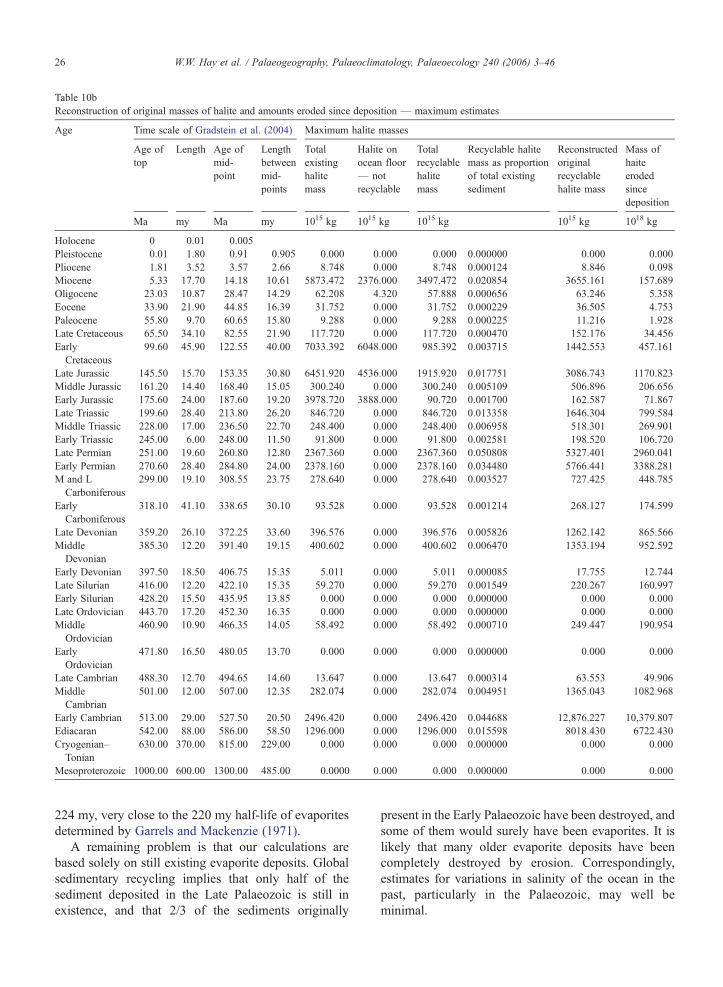
Table 10bReconstruction of original masses of halite and amounts eroded since deposition — maximum estimates
Age Time scale of Gradstein et al. (2004) Maximum halite masses
Age oftop
Length Age ofmid-point
Lengthbetweenmid-points
Totalexistinghalitemass
Halite onocean floor— notrecyclable
Totalrecyclablehalitemass
Recyclable halitemass as proportionof total existingsediment
Reconstructedoriginalrecyclablehalite mass
Mass ofhaiteerodedsincedeposition
Ma my Ma my 1015 kg 1015 kg 1015 kg 1015 kg 1018 kg
Holocene 0 0.01 0.005Pleistocene 0.01 1.80 0.91 0.905 0.000 0.000 0.000 0.000000 0.000 0.000Pliocene 1.81 3.52 3.57 2.66 8.748 0.000 8.748 0.000124 8.846 0.098Miocene 5.33 17.70 14.18 10.61 5873.472 2376.000 3497.472 0.020854 3655.161 157.689Oligocene 23.03 10.87 28.47 14.29 62.208 4.320 57.888 0.000656 63.246 5.358Eocene 33.90 21.90 44.85 16.39 31.752 0.000 31.752 0.000229 36.505 4.753Paleocene 55.80 9.70 60.65 15.80 9.288 0.000 9.288 0.000225 11.216 1.928Late Cretaceous 65.50 34.10 82.55 21.90 117.720 0.000 117.720 0.000470 152.176 34.456EarlyCretaceous
99.60 45.90 122.55 40.00 7033.392 6048.000 985.392 0.003715 1442.553 457.161
Late Jurassic 145.50 15.70 153.35 30.80 6451.920 4536.000 1915.920 0.017751 3086.743 1170.823Middle Jurassic 161.20 14.40 168.40 15.05 300.240 0.000 300.240 0.005109 506.896 206.656Early Jurassic 175.60 24.00 187.60 19.20 3978.720 3888.000 90.720 0.001700 162.587 71.867Late Triassic 199.60 28.40 213.80 26.20 846.720 0.000 846.720 0.013358 1646.304 799.584Middle Triassic 228.00 17.00 236.50 22.70 248.400 0.000 248.400 0.006958 518.301 269.901Early Triassic 245.00 6.00 248.00 11.50 91.800 0.000 91.800 0.002581 198.520 106.720Late Permian 251.00 19.60 260.80 12.80 2367.360 0.000 2367.360 0.050808 5327.401 2960.041Early Permian 270.60 28.40 284.80 24.00 2378.160 0.000 2378.160 0.034480 5766.441 3388.281M and LCarboniferous
299.00 19.10 308.55 23.75 278.640 0.000 278.640 0.003527 727.425 448.785
EarlyCarboniferous
318.10 41.10 338.65 30.10 93.528 0.000 93.528 0.001214 268.127 174.599
Late Devonian 359.20 26.10 372.25 33.60 396.576 0.000 396.576 0.005826 1262.142 865.566MiddleDevonian
385.30 12.20 391.40 19.15 400.602 0.000 400.602 0.006470 1353.194 952.592
Early Devonian 397.50 18.50 406.75 15.35 5.011 0.000 5.011 0.000085 17.755 12.744Late Silurian 416.00 12.20 422.10 15.35 59.270 0.000 59.270 0.001549 220.267 160.997Early Silurian 428.20 15.50 435.95 13.85 0.000 0.000 0.000 0.000000 0.000 0.000Late Ordovician 443.70 17.20 452.30 16.35 0.000 0.000 0.000 0.000000 0.000 0.000MiddleOrdovician
460.90 10.90 466.35 14.05 58.492 0.000 58.492 0.000710 249.447 190.954
EarlyOrdovician
471.80 16.50 480.05 13.70 0.000 0.000 0.000 0.000000 0.000 0.000
Late Cambrian 488.30 12.70 494.65 14.60 13.647 0.000 13.647 0.000314 63.553 49.906MiddleCambrian
501.00 12.00 507.00 12.35 282.074 0.000 282.074 0.004951 1365.043 1082.968
Early Cambrian 513.00 29.00 527.50 20.50 2496.420 0.000 2496.420 0.044688 12,876.227 10,379.807Ediacaran 542.00 88.00 586.00 58.50 1296.000 0.000 1296.000 0.015598 8018.430 6722.430Cryogenian–Tonian
630.00 370.00 815.00 229.00 0.000 0.000 0.000 0.000000 0.000 0.000
Mesoproterozoic 1000.00 600.00 1300.00 485.00 0.0000 0.000 0.000 0.000000 0.000 0.000
26 W.W. Hay et al. / Palaeogeography, Palaeoclimatology, Palaeoecology 240 (2006) 3–46
224 my, very close to the 220 my half-life of evaporitesdetermined by Garrels and Mackenzie (1971).
A remaining problem is that our calculations arebased solely on still existing evaporite deposits. Globalsedimentary recycling implies that only half of thesediment deposited in the Late Palaeozoic is still inexistence, and that 2/3 of the sediments originally
present in the Early Palaeozoic have been destroyed, andsome of them would surely have been evaporites. It islikely that many older evaporite deposits have beencompletely destroyed by erosion. Correspondingly,estimates for variations in salinity of the ocean in thepast, particularly in the Palaeozoic, may well beminimal.
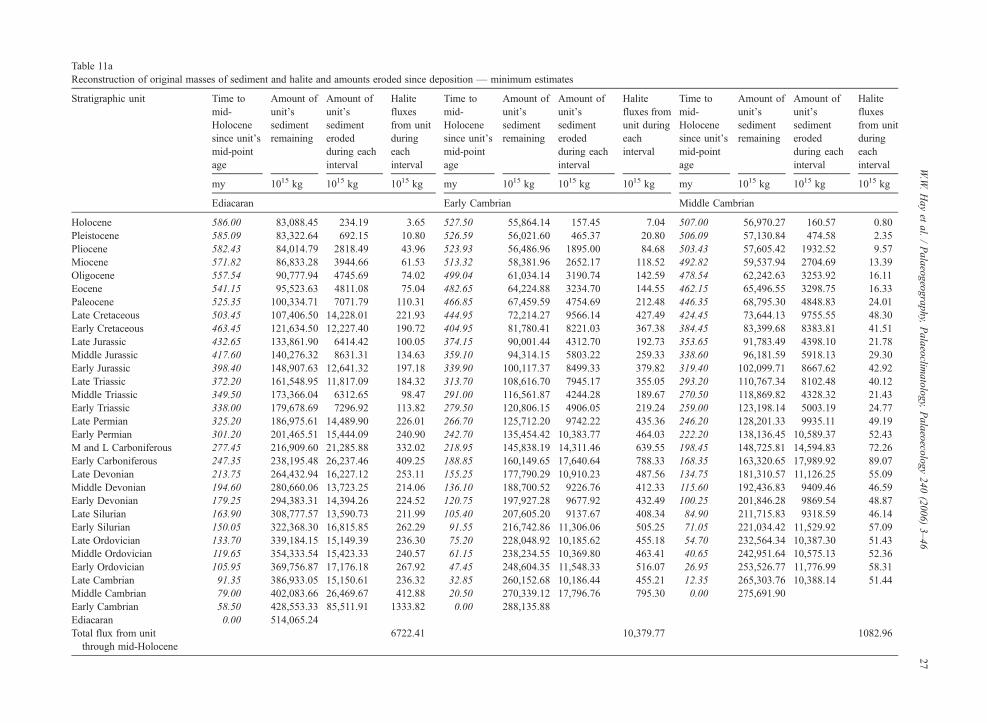
Table 11aReconstruction of original masses of sediment and halite and amounts eroded since deposition — minimum estimates
Stratigraphic unit Time tomid-Holocenesince unit'smid-pointage
Amount ofunit'ssedimentremaining
Amount ofunit'ssedimenterodedduring eachinterval
Halitefluxesfrom unitduringeachinterval
Time tomid-Holocenesince unit'smid-pointage
Amount ofunit'ssedimentremaining
Amount ofunit'ssedimenterodedduring eachinterval
Halitefluxes fromunit duringeachinterval
Time tomid-Holocenesince unit'smid-pointage
Amount ofunit'ssedimentremaining
Amount ofunit'ssedimenterodedduring eachinterval
Halitefluxesfrom unitduringeachinterval
my 1015 kg 1015 kg 1015 kg my 1015 kg 1015 kg 1015 kg my 1015 kg 1015 kg 1015 kg
Ediacaran Early Cambrian Middle Cambrian
Holocene 586.00 83,088.45 234.19 3.65 527.50 55,864.14 157.45 7.04 507.00 56,970.27 160.57 0.80Pleistocene 585.09 83,322.64 692.15 10.80 526.59 56,021.60 465.37 20.80 506.09 57,130.84 474.58 2.35Pliocene 582.43 84,014.79 2818.49 43.96 523.93 56,486.96 1895.00 84.68 503.43 57,605.42 1932.52 9.57Miocene 571.82 86,833.28 3944.66 61.53 513.32 58,381.96 2652.17 118.52 492.82 59,537.94 2704.69 13.39Oligocene 557.54 90,777.94 4745.69 74.02 499.04 61,034.14 3190.74 142.59 478.54 62,242.63 3253.92 16.11Eocene 541.15 95,523.63 4811.08 75.04 482.65 64,224.88 3234.70 144.55 462.15 65,496.55 3298.75 16.33Paleocene 525.35 100,334.71 7071.79 110.31 466.85 67,459.59 4754.69 212.48 446.35 68,795.30 4848.83 24.01Late Cretaceous 503.45 107,406.50 14,228.01 221.93 444.95 72,214.27 9566.14 427.49 424.45 73,644.13 9755.55 48.30Early Cretaceous 463.45 121,634.50 12,227.40 190.72 404.95 81,780.41 8221.03 367.38 384.45 83,399.68 8383.81 41.51Late Jurassic 432.65 133,861.90 6414.42 100.05 374.15 90,001.44 4312.70 192.73 353.65 91,783.49 4398.10 21.78Middle Jurassic 417.60 140,276.32 8631.31 134.63 359.10 94,314.15 5803.22 259.33 338.60 96,181.59 5918.13 29.30Early Jurassic 398.40 148,907.63 12,641.32 197.18 339.90 100,117.37 8499.33 379.82 319.40 102,099.71 8667.62 42.92Late Triassic 372.20 161,548.95 11,817.09 184.32 313.70 108,616.70 7945.17 355.05 293.20 110,767.34 8102.48 40.12Middle Triassic 349.50 173,366.04 6312.65 98.47 291.00 116,561.87 4244.28 189.67 270.50 118,869.82 4328.32 21.43Early Triassic 338.00 179,678.69 7296.92 113.82 279.50 120,806.15 4906.05 219.24 259.00 123,198.14 5003.19 24.77Late Permian 325.20 186,975.61 14,489.90 226.01 266.70 125,712.20 9742.22 435.36 246.20 128,201.33 9935.11 49.19Early Permian 301.20 201,465.51 15,444.09 240.90 242.70 135,454.42 10,383.77 464.03 222.20 138,136.45 10,589.37 52.43M and L Carboniferous 277.45 216,909.60 21,285.88 332.02 218.95 145,838.19 14,311.46 639.55 198.45 148,725.81 14,594.83 72.26Early Carboniferous 247.35 238,195.48 26,237.46 409.25 188.85 160,149.65 17,640.64 788.33 168.35 163,320.65 17,989.92 89.07Late Devonian 213.75 264,432.94 16,227.12 253.11 155.25 177,790.29 10,910.23 487.56 134.75 181,310.57 11,126.25 55.09Middle Devonian 194.60 280,660.06 13,723.25 214.06 136.10 188,700.52 9226.76 412.33 115.60 192,436.83 9409.46 46.59Early Devonian 179.25 294,383.31 14,394.26 224.52 120.75 197,927.28 9677.92 432.49 100.25 201,846.28 9869.54 48.87Late Silurian 163.90 308,777.57 13,590.73 211.99 105.40 207,605.20 9137.67 408.34 84.90 211,715.83 9318.59 46.14Early Silurian 150.05 322,368.30 16,815.85 262.29 91.55 216,742.86 11,306.06 505.25 71.05 221,034.42 11,529.92 57.09Late Ordovician 133.70 339,184.15 15,149.39 236.30 75.20 228,048.92 10,185.62 455.18 54.70 232,564.34 10,387.30 51.43Middle Ordovician 119.65 354,333.54 15,423.33 240.57 61.15 238,234.55 10,369.80 463.41 40.65 242,951.64 10,575.13 52.36Early Ordovician 105.95 369,756.87 17,176.18 267.92 47.45 248,604.35 11,548.33 516.07 26.95 253,526.77 11,776.99 58.31Late Cambrian 91.35 386,933.05 15,150.61 236.32 32.85 260,152.68 10,186.44 455.21 12.35 265,303.76 10,388.14 51.44Middle Cambrian 79.00 402,083.66 26,469.67 412.88 20.50 270,339.12 17,796.76 795.30 0.00 275,691.90Early Cambrian 58.50 428,553.33 85,511.91 1333.82 0.00 288,135.88Ediacaran 0.00 514,065.24Total flux from unit
through mid-Holocene6722.41 10,379.77 1082.96
27W.W.Hay
etal.
/Palaeogeography,
Palaeoclim
atology,Palaeoecology
240(2006)
3–46
28 W.W. Hay et al. / Palaeogeography, Palaeoclimatology, Palaeoecology 240 (2006) 3–46
6.3. Reconstructing chlorine fluxes to the ocean in thepast
As discussed above, the long-term chlorine fluxes tothe ocean in the past have four possible sources: 1) fromvolcanic emissions, 2) from the weathering of crystal-line rocks, 3) from release of saline pore waters througherosion of sediments and 4) from erosion of evaporitedeposits. As noted above, the Cl− from volcanicemissions is mostly, if not entirely, recycled fromsubducted ocean water, and any contribution of juvenileCl− from the mantle is probably negligible. Further, weneglect the contribution of the weathering of crystallinerocks which contain little Cl, most of which is probablyalso derived from subduction processes. The effect ofsaline waters both as a sink and source for Cl− is morespeculative, but as a first approximation we will assumethat the total sedimentary mass and its contained porespace have remained almost constant during theProterozoic and Phanerozoic (cf. Hay, 1999). We alsoassume that the proportions of saline brine and freshwater in the pore space have remained approximatelyconstant. Hence the fluxes into and out of this reservoirwould remain equal and have little effect on oceanicsalinity, so we assume here that they can also beneglected. Consequently we base our calculations solelyon the removal of halite into evaporite deposits and itssubsequent recycling.
6.4. Flux of chlorine from the erosion of halite deposits
To determine the amount of halite eroded during eachinterval of time a series of exponential decays arerecalculated starting with the mid-point age of theinterval ta− tb during which deposition occurred andcalculating the flux rate at the mid-points of eachsubsequent stratigraphic interval. As discussed above,the total amount of sediment originally deposited duringthe interval ta− tb is calculated using Eq. (3) (Table 9).The original amount of halite deposited is assumed tohave the same proportional relation to the total sedimentas exists today (Tables 10a–b). For each successiveinterval after deposition, the amount of sediment ofinterval remaining is determined with Eq. (3) using thetime since deposition as t. The detailed calculations forthe interval by interval erosion of sediment originallydeposited during ta− tb are shown in Tables 11a–g. Thedifference between the amounts remaining in successivestratigraphic intervals is the amount of sediment erodedfrom ta− tb during that time. Analogous to thereconstruction of the amount of halite originallydeposited, the amount of halite eroded during each of
the successive intervals is determined by multiplying theamount of ta− tb sediment eroded by the proportion ofhalite originally deposited in interval ta− tb. Tables 11a–g are based on the minimum estimates of recyclablehalite. Table 12 shows the fluxes for those intervals forwhich the maximum estimates of recyclable halite differfrom the minimum estimates. The total fluxes from eachstratigraphic unit shown at the bottom of Tables 11a–gand 12 are slightly smaller than the masses of haliteshown to be eroded since deposition in Tables 10a–bbecause they are calculated for the mid-Holocene(0.005 Ma) rather than for present as in Tables 10a–b.
As is evident from Tables 9 and 10a–b, at any timethe youngest sediments are most likely to be eroded. Thegreatest amount of erosion will occur immediately afterdeposition, before the deposits are protected by burial,and in each successive time interval less and less will beeroded. We assume this to be true not only for detritalsediment, but for evaporites as well. The erosionalfluxes from halite deposits in each stratigraphic intervalare then summed to obtain the flux of halite and Cl−
(0.607×NaCl) returned to the ocean, and are shown inTable 13 and Fig. 6. While the removal of salt from theocean into evaporites is sporadic, the return iscontinuous but varies by a factor of three with time.The possible rates of Cl− delivery by rivers during thePhanerozoic are hindcast by our calculations to varybetween 13 and 42×109 kg/yr. For the Quaternary/Holocene the minimum and maximum flux estimatesare 29.6×10⁹ kg/yr and 34.6×10⁹ kg/yr. Although onlyabout 10% of the present Cl− flux of rivers, these valuesare appropriate for the range of uncertainties for the“natural” Cl− flux in rivers discussed above.
7. Reconstructing ocean salinity in the past
As discussed above, the salinity of the ocean dependson two variables, the amount of water in the ocean, andthe amount of salts dissolved in the water. Althoughchanges in any of the reservoirs of water shown in Table6 would affect the mass of water in the ocean, only threeof the reservoirs are potentially large enough to affectocean salinity: ice, pore water, and fresh water lakes.Buildup and decay of the mostly northern hemisphereice sheets during the Quaternary can cause an oscillationof ocean salinity from 34.7‰ to 36‰, almost a 4%increase. In contrast, although the pore water reservoir islarge, it cannot change rapidly and its effect on oceansalinity has been neglected in our calculations. Theamount of water in lakes is trivial throughout most ofgeologic time, but if the Arctic ocean were a fresh waterlake in the Eocene, with a mass of 16.5×10¹⁸ kg it

Table 11bReconstruction of original masses of sediment and halite and amounts eroded since deposition — minimum estimates
Stratigraphic unit Time tomid-Holocenesince unit'smid-pointage
Amount ofunit'ssedimentremaining
Amount ofunit'ssedimenterodedduring eachinterval
Halitefluxesfrom unitduringeachinterval
Time tomid-Holocenesince unit'smid-pointage
Amount ofunit'ssedimentremaining
Amount ofunit'ssedimenterodedduring eachinterval
Halitefluxesfrom unitduringeachinterval
Time tomid-Holocenesince unit'smid-pointage
Amount ofunit'ssedimentremaining
Amount ofunit'ssedimenterodedduring eachinterval
Halitefluxesfrom unitduringeachinterval
my 1015 kg 1015 kg 1015 kg my 1015 kg 1015 kg 1015 kg my 1015 kg 1015 kg 1015 kg
Late Cambrian Middle Ordovician Late Silurian
Holocene 494.65 43,398.44 122.32 0.04 466.35 82,400.03 232.25 0.16 422.10 38,253.48 107.82 0.17Pleistocene 493.74 43,520.76 361.52 0.11 465.44 82,632.27 686.42 0.49 421.19 38,361.30 318.66 0.49Pliocene 491.08 43,882.29 1472.14 0.46 462.78 83,318.69 2795.14 1.98 418.53 38,679.97 1297.62 2.01Miocene 480.47 45,354.43 2060.36 0.65 452.17 86,113.83 3911.98 2.78 407.92 39,977.58 1816.10 2.81Oligocene 466.19 47,414.79 2478.75 0.78 437.89 90,025.81 4706.37 3.34 393.64 41,793.69 2184.89 3.39Eocene 449.80 49,893.54 2512.90 0.79 421.50 94,732.18 4771.21 3.39 377.25 43,978.58 2214.99 3.43Paleocene 434.00 52,406.44 3693.71 1.16 405.70 99,503.39 7013.20 4.98 361.45 46,193.57 3255.81 5.04Late Cretaceous 412.10 56,100.15 7431.52 2.34 383.80 106,516.59 14,110.12 10.02 339.55 49,449.38 6550.50 10.15Early Cretaceous 372.10 63,531.67 6386.57 2.01 343.80 120,626.71 12,126.09 8.61 299.55 55,999.88 5629.43 8.72Late Jurassic 341.30 69,918.24 3350.35 1.05 313.00 132,752.79 6361.27 4.52 268.75 61,629.31 2953.16 4.58Middle Jurassic 326.25 73,268.59 4508.27 1.42 297.95 139,114.06 8559.80 6.08 253.70 64,582.48 3973.81 6.16Early Jurassic 307.05 77,776.87 6602.77 2.08 278.75 147,673.86 12,536.58 8.90 234.50 68,556.29 5820.00 9.02Late Triassic 280.85 84,379.63 6172.26 1.94 252.55 160,210.44 11,719.18 8.32 208.30 74,376.28 5440.53 8.43Middle Triassic 258.15 90,551.89 3297.20 1.04 229.85 171,929.62 6260.35 4.44 185.60 79,816.81 2906.31 4.50Early Triassic 246.65 93,849.09 3811.30 1.20 218.35 178,189.97 7236.47 5.14 174.10 82,723.12 3359.47 5.21Late Permian 233.85 97,660.39 7568.31 2.38 205.55 185,426.43 14,369.84 10.20 161.30 86,082.58 6671.07 10.34Early Permian 209.85 105,228.70 8066.70 2.54 181.55 199,796.27 15,316.13 10.87 137.30 92,753.66 7110.38 11.02M and L Carboniferous 186.10 113,295.40 11,117.96 3.50 157.80 215,112.41 21,109.52 14.99 113.55 99,864.04 9799.91 15.18Early Carboniferous 156.00 124,413.36 13,704.25 4.31 127.70 236,221.92 26,020.07 18.47 83.45 109,663.94 12,079.59 18.72Late Devonian 122.40 138,117.61 8475.69 2.67 94.10 262,241.99 16,092.67 11.42 49.85 121,743.53 7470.88 11.58Middle Devonian 103.25 146,593.30 7167.87 2.25 74.95 278,334.66 13,609.54 9.66 30.70 129,214.41 6318.11 9.79Early Devonian 87.90 153,761.17 7518.36 2.36 59.60 291,944.21 14,275.00 10.13 15.35 135,532.52 6627.04 10.27Late Silurian 72.55 161,279.53 7098.66 2.23 44.25 306,219.21 13,478.12 9.57 0.00 142,159.56Early Silurian 58.70 168,378.19 8783.19 2.76 30.40 319,697.33 16,676.52 11.84Late Ordovician 42.35 177,161.38 7912.77 2.49 14.05 336,373.86 15,023.87 10.66Middle Ordovician 28.30 185,074.15 8055.85 2.53 0.00 351,397.73Early Ordovician 14.60 193,130.00 8971.40 2.82Late Cambrian 0.00 202,101.40Total flux from unitthrough mid-Holocene
49.91 190.95 161.00
29W.W.Hay
etal.
/Palaeogeography,
Palaeoclim
atology,Palaeoecology
240(2006)
3–46
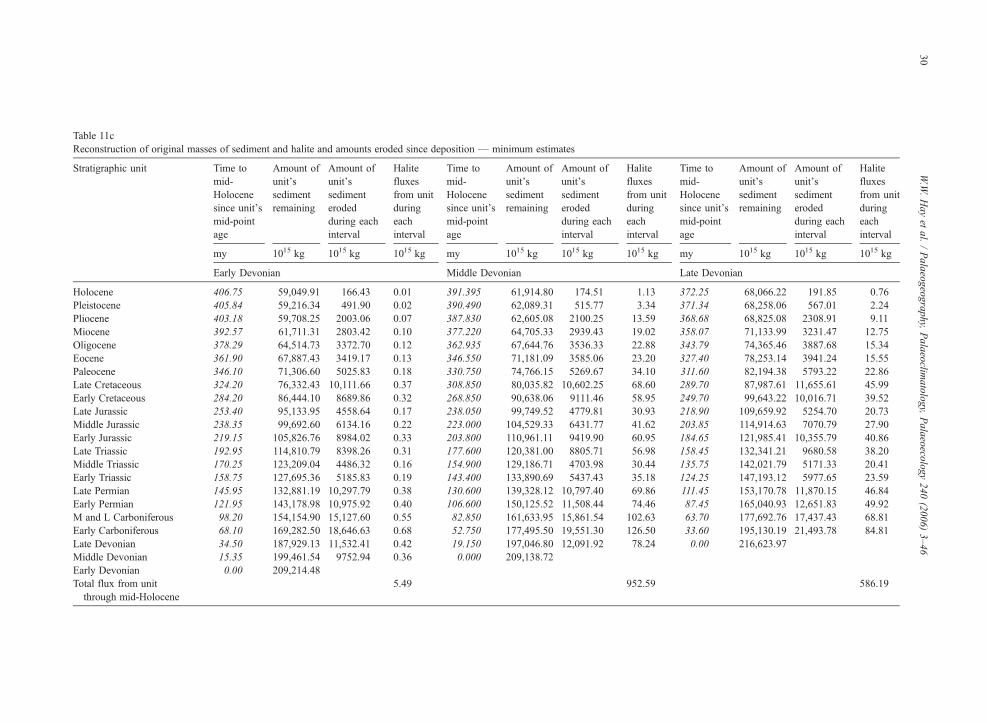
Table 11cReconstruction of original masses of sediment and halite and amounts eroded since deposition — minimum estimates
Stratigraphic unit Time tomid-Holocenesince unit'smid-pointage
Amount ofunit'ssedimentremaining
Amount ofunit'ssedimenterodedduring eachinterval
Halitefluxesfrom unitduringeachinterval
Time tomid-Holocenesince unit'smid-pointage
Amount ofunit'ssedimentremaining
Amount ofunit'ssedimenterodedduring eachinterval
Halitefluxesfrom unitduringeachinterval
Time tomid-Holocenesince unit'smid-pointage
Amount ofunit'ssedimentremaining
Amount ofunit'ssedimenterodedduring eachinterval
Halitefluxesfrom unitduringeachinterval
my 1015 kg 1015 kg 1015 kg my 1015 kg 1015 kg 1015 kg my 1015 kg 1015 kg 1015 kg
Early Devonian Middle Devonian Late Devonian
Holocene 406.75 59,049.91 166.43 0.01 391.395 61,914.80 174.51 1.13 372.25 68,066.22 191.85 0.76Pleistocene 405.84 59,216.34 491.90 0.02 390.490 62,089.31 515.77 3.34 371.34 68,258.06 567.01 2.24Pliocene 403.18 59,708.25 2003.06 0.07 387.830 62,605.08 2100.25 13.59 368.68 68,825.08 2308.91 9.11Miocene 392.57 61,711.31 2803.42 0.10 377.220 64,705.33 2939.43 19.02 358.07 71,133.99 3231.47 12.75Oligocene 378.29 64,514.73 3372.70 0.12 362.935 67,644.76 3536.33 22.88 343.79 74,365.46 3887.68 15.34Eocene 361.90 67,887.43 3419.17 0.13 346.550 71,181.09 3585.06 23.20 327.40 78,253.14 3941.24 15.55Paleocene 346.10 71,306.60 5025.83 0.18 330.750 74,766.15 5269.67 34.10 311.60 82,194.38 5793.22 22.86Late Cretaceous 324.20 76,332.43 10,111.66 0.37 308.850 80,035.82 10,602.25 68.60 289.70 87,987.61 11,655.61 45.99Early Cretaceous 284.20 86,444.10 8689.86 0.32 268.850 90,638.06 9111.46 58.95 249.70 99,643.22 10,016.71 39.52Late Jurassic 253.40 95,133.95 4558.64 0.17 238.050 99,749.52 4779.81 30.93 218.90 109,659.92 5254.70 20.73Middle Jurassic 238.35 99,692.60 6134.16 0.22 223.000 104,529.33 6431.77 41.62 203.85 114,914.63 7070.79 27.90Early Jurassic 219.15 105,826.76 8984.02 0.33 203.800 110,961.11 9419.90 60.95 184.65 121,985.41 10,355.79 40.86Late Triassic 192.95 114,810.79 8398.26 0.31 177.600 120,381.00 8805.71 56.98 158.45 132,341.21 9680.58 38.20Middle Triassic 170.25 123,209.04 4486.32 0.16 154.900 129,186.71 4703.98 30.44 135.75 142,021.79 5171.33 20.41Early Triassic 158.75 127,695.36 5185.83 0.19 143.400 133,890.69 5437.43 35.18 124.25 147,193.12 5977.65 23.59Late Permian 145.95 132,881.19 10,297.79 0.38 130.600 139,328.12 10,797.40 69.86 111.45 153,170.78 11,870.15 46.84Early Permian 121.95 143,178.98 10,975.92 0.40 106.600 150,125.52 11,508.44 74.46 87.45 165,040.93 12,651.83 49.92M and L Carboniferous 98.20 154,154.90 15,127.60 0.55 82.850 161,633.95 15,861.54 102.63 63.70 177,692.76 17,437.43 68.81Early Carboniferous 68.10 169,282.50 18,646.63 0.68 52.750 177,495.50 19,551.30 126.50 33.60 195,130.19 21,493.78 84.81Late Devonian 34.50 187,929.13 11,532.41 0.42 19.150 197,046.80 12,091.92 78.24 0.00 216,623.97Middle Devonian 15.35 199,461.54 9752.94 0.36 0.000 209,138.72Early Devonian 0.00 209,214.48Total flux from unitthrough mid-Holocene
5.49 952.59 586.19
30W.W.Hay
etal.
/Palaeogeography,
Palaeoclim
atology,Palaeoecology
240(2006)
3–46
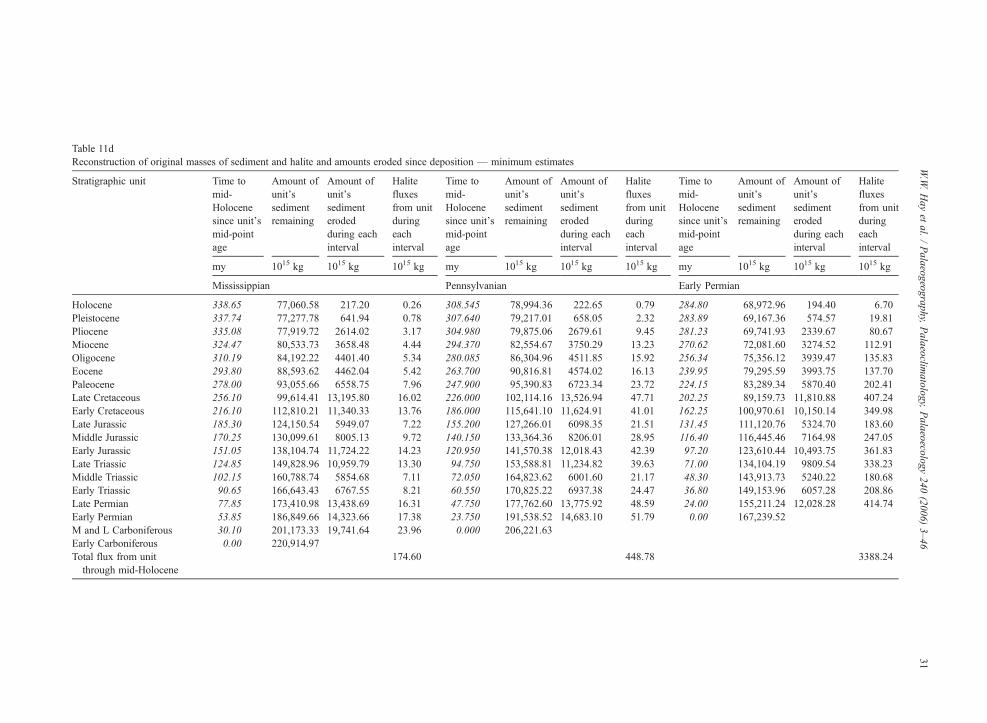
Table 11dReconstruction of original masses of sediment and halite and amounts eroded since deposition — minimum estimates
Stratigraphic unit Time tomid-Holocenesince unit'smid-pointage
Amount ofunit'ssedimentremaining
Amount ofunit'ssedimenterodedduring eachinterval
Halitefluxesfrom unitduringeachinterval
Time tomid-Holocenesince unit'smid-pointage
Amount ofunit'ssedimentremaining
Amount ofunit'ssedimenterodedduring eachinterval
Halitefluxesfrom unitduringeachinterval
Time tomid-Holocenesince unit'smid-pointage
Amount ofunit'ssedimentremaining
Amount ofunit'ssedimenterodedduring eachinterval
Halitefluxesfrom unitduringeachinterval
my 1015 kg 1015 kg 1015 kg my 1015 kg 1015 kg 1015 kg my 1015 kg 1015 kg 1015 kg
Mississippian Pennsylvanian Early Permian
Holocene 338.65 77,060.58 217.20 0.26 308.545 78,994.36 222.65 0.79 284.80 68,972.96 194.40 6.70Pleistocene 337.74 77,277.78 641.94 0.78 307.640 79,217.01 658.05 2.32 283.89 69,167.36 574.57 19.81Pliocene 335.08 77,919.72 2614.02 3.17 304.980 79,875.06 2679.61 9.45 281.23 69,741.93 2339.67 80.67Miocene 324.47 80,533.73 3658.48 4.44 294.370 82,554.67 3750.29 13.23 270.62 72,081.60 3274.52 112.91Oligocene 310.19 84,192.22 4401.40 5.34 280.085 86,304.96 4511.85 15.92 256.34 75,356.12 3939.47 135.83Eocene 293.80 88,593.62 4462.04 5.42 263.700 90,816.81 4574.02 16.13 239.95 79,295.59 3993.75 137.70Paleocene 278.00 93,055.66 6558.75 7.96 247.900 95,390.83 6723.34 23.72 224.15 83,289.34 5870.40 202.41Late Cretaceous 256.10 99,614.41 13,195.80 16.02 226.000 102,114.16 13,526.94 47.71 202.25 89,159.73 11,810.88 407.24Early Cretaceous 216.10 112,810.21 11,340.33 13.76 186.000 115,641.10 11,624.91 41.01 162.25 100,970.61 10,150.14 349.98Late Jurassic 185.30 124,150.54 5949.07 7.22 155.200 127,266.01 6098.35 21.51 131.45 111,120.76 5324.70 183.60Middle Jurassic 170.25 130,099.61 8005.13 9.72 140.150 133,364.36 8206.01 28.95 116.40 116,445.46 7164.98 247.05Early Jurassic 151.05 138,104.74 11,724.22 14.23 120.950 141,570.38 12,018.43 42.39 97.20 123,610.44 10,493.75 361.83Late Triassic 124.85 149,828.96 10,959.79 13.30 94.750 153,588.81 11,234.82 39.63 71.00 134,104.19 9809.54 338.23Middle Triassic 102.15 160,788.74 5854.68 7.11 72.050 164,823.62 6001.60 21.17 48.30 143,913.73 5240.22 180.68Early Triassic 90.65 166,643.43 6767.55 8.21 60.550 170,825.22 6937.38 24.47 36.80 149,153.96 6057.28 208.86Late Permian 77.85 173,410.98 13,438.69 16.31 47.750 177,762.60 13,775.92 48.59 24.00 155,211.24 12,028.28 414.74Early Permian 53.85 186,849.66 14,323.66 17.38 23.750 191,538.52 14,683.10 51.79 0.00 167,239.52M and L Carboniferous 30.10 201,173.33 19,741.64 23.96 0.000 206,221.63Early Carboniferous 0.00 220,914.97Total flux from unitthrough mid-Holocene
174.60 448.78 3388.24
31W.W.Hay
etal.
/Palaeogeography,
Palaeoclim
atology,Palaeoecology
240(2006)
3–46
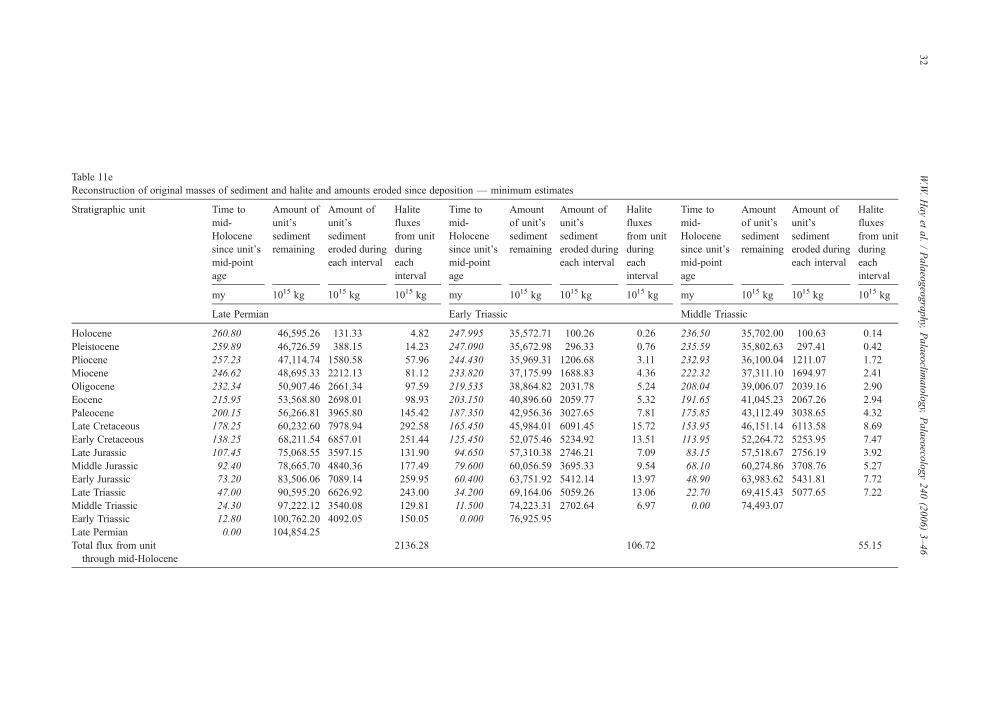
Table 11eReconstruction of original masses of sediment and halite and amounts eroded since deposition — minimum estimates
Stratigraphic unit Time tomid-Holocenesince unit'smid-pointage
Amount ofunit'ssedimentremaining
Amount ofunit'ssedimenteroded duringeach interval
Halitefluxesfrom unitduringeachinterval
Time tomid-Holocenesince unit'smid-pointage
Amountof unit'ssedimentremaining
Amount ofunit'ssedimenteroded duringeach interval
Halitefluxesfrom unitduringeachinterval
Time tomid-Holocenesince unit'smid-pointage
Amountof unit'ssedimentremaining
Amount ofunit'ssedimenteroded duringeach interval
Halitefluxesfrom unitduringeachinterval
my 1015 kg 1015 kg 1015 kg my 1015 kg 1015 kg 1015 kg my 1015 kg 1015 kg 1015 kg
Late Permian Early Triassic Middle Triassic
Holocene 260.80 46,595.26 131.33 4.82 247.995 35,572.71 100.26 0.26 236.50 35,702.00 100.63 0.14Pleistocene 259.89 46,726.59 388.15 14.23 247.090 35,672.98 296.33 0.76 235.59 35,802.63 297.41 0.42Pliocene 257.23 47,114.74 1580.58 57.96 244.430 35,969.31 1206.68 3.11 232.93 36,100.04 1211.07 1.72Miocene 246.62 48,695.33 2212.13 81.12 233.820 37,175.99 1688.83 4.36 222.32 37,311.10 1694.97 2.41Oligocene 232.34 50,907.46 2661.34 97.59 219.535 38,864.82 2031.78 5.24 208.04 39,006.07 2039.16 2.90Eocene 215.95 53,568.80 2698.01 98.93 203.150 40,896.60 2059.77 5.32 191.65 41,045.23 2067.26 2.94Paleocene 200.15 56,266.81 3965.80 145.42 187.350 42,956.36 3027.65 7.81 175.85 43,112.49 3038.65 4.32Late Cretaceous 178.25 60,232.60 7978.94 292.58 165.450 45,984.01 6091.45 15.72 153.95 46,151.14 6113.58 8.69Early Cretaceous 138.25 68,211.54 6857.01 251.44 125.450 52,075.46 5234.92 13.51 113.95 52,264.72 5253.95 7.47Late Jurassic 107.45 75,068.55 3597.15 131.90 94.650 57,310.38 2746.21 7.09 83.15 57,518.67 2756.19 3.92Middle Jurassic 92.40 78,665.70 4840.36 177.49 79.600 60,056.59 3695.33 9.54 68.10 60,274.86 3708.76 5.27Early Jurassic 73.20 83,506.06 7089.14 259.95 60.400 63,751.92 5412.14 13.97 48.90 63,983.62 5431.81 7.72Late Triassic 47.00 90,595.20 6626.92 243.00 34.200 69,164.06 5059.26 13.06 22.70 69,415.43 5077.65 7.22Middle Triassic 24.30 97,222.12 3540.08 129.81 11.500 74,223.31 2702.64 6.97 0.00 74,493.07Early Triassic 12.80 100,762.20 4092.05 150.05 0.000 76,925.95Late Permian 0.00 104,854.25Total flux from unitthrough mid-Holocene
2136.28 106.72 55.15
32W.W.Hay
etal.
/Palaeogeography,
Palaeoclim
atology,Palaeoecology
240(2006)
3–46
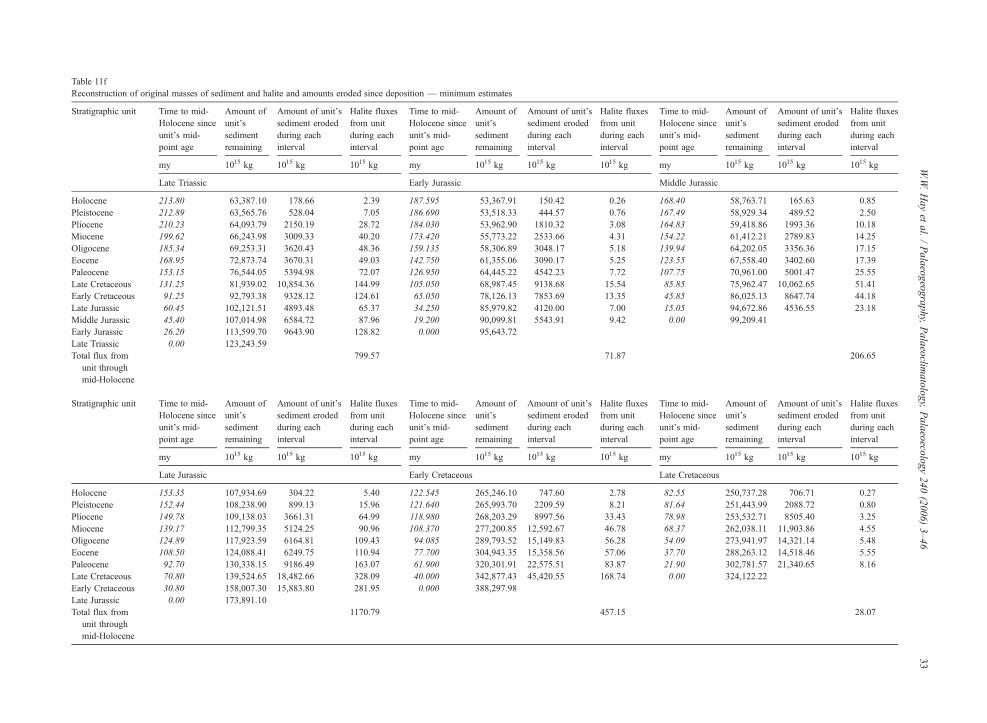
Table 11fReconstruction of original masses of sediment and halite and amounts eroded since deposition — minimum estimates
Stratigraphic unit Time to mid-Holocene sinceunit's mid-point age
Amount ofunit'ssedimentremaining
Amount of unit'ssediment erodedduring eachinterval
Halite fluxesfrom unitduring eachinterval
Time to mid-Holocene sinceunit's mid-point age
Amount ofunit'ssedimentremaining
Amount of unit'ssediment erodedduring eachinterval
Halite fluxesfrom unitduring eachinterval
e to mid-ocene since's mid-t age
Amount ofunit'ssedimentremaining
Amount of unit'ssediment erodedduring eachinterval
Halite fluxesfrom unitduring eachinterval
my 1015 kg 1015 kg 1015 kg my 1015 kg 1015 kg 1015 kg 1015 kg 1015 kg 1015 kg
Late Triassic Early Jurassic dle Jurassic
Holocene 213.80 63,387.10 178.66 2.39 187.595 53,367.91 150.42 0.26 .40 58,763.71 165.63 0.85Pleistocene 212.89 63,565.76 528.04 7.05 186.690 53,518.33 444.57 0.76 .49 58,929.34 489.52 2.50Pliocene 210.23 64,093.79 2150.19 28.72 184.030 53,962.90 1810.32 3.08 .83 59,418.86 1993.36 10.18Miocene 199.62 66,243.98 3009.33 40.20 173.420 55,773.22 2533.66 4.31 .22 61,412.21 2789.83 14.25Oligocene 185.34 69,253.31 3620.43 48.36 159.135 58,306.89 3048.17 5.18 .94 64,202.05 3356.36 17.15Eocene 168.95 72,873.74 3670.31 49.03 142.750 61,355.06 3090.17 5.25 .55 67,558.40 3402.60 17.39Paleocene 153.15 76,544.05 5394.98 72.07 126.950 64,445.22 4542.23 7.72 .75 70,961.00 5001.47 25.55Late Cretaceous 131.25 81,939.02 10,854.36 144.99 105.050 68,987.45 9138.68 15.54 .85 75,962.47 10,062.65 51.41Early Cretaceous 91.25 92,793.38 9328.12 124.61 65.050 78,126.13 7853.69 13.35 .85 86,025.13 8647.74 44.18Late Jurassic 60.45 102,121.51 4893.48 65.37 34.250 85,979.82 4120.00 7.00 .05 94,672.86 4536.55 23.18Middle Jurassic 45.40 107,014.98 6584.72 87.96 19.200 90,099.81 5543.91 9.42 .00 99,209.41Early Jurassic 26.20 113,599.70 9643.90 128.82 0.000 95,643.72Late Triassic 0.00 123,243.59Total flux from
unit throughmid-Holocene
799.57 71.87 206.65
Stratigraphic unit Time to mid-Holocene sinceunit's mid-point age
Amount ofunit'ssedimentremaining
Amount of unit'ssediment erodedduring eachinterval
Halite fluxesfrom unitduring eachinterval
Time to mid-Holocene sinceunit's mid-point age
Amount ofunit'ssedimentremaining
Amount of unit'ssediment erodedduring eachinterval
Halite fluxesfrom unitduring eachinterval
e to mid-ocene since's mid-t age
Amount ofunit'ssedimentremaining
Amount of unit'ssediment erodedduring eachinterval
Halite fluxesfrom unitduring eachinterval
my 1015 kg 1015 kg 1015 kg my 1015 kg 1015 kg 1015 kg 1015 kg 1015 kg 1015 kg
Late Jurassic Early Cretaceous Cretaceous
Holocene 153.35 107,934.69 304.22 5.40 122.545 265,246.10 747.60 2.78 .55 250,737.28 706.71 0.27Pleistocene 152.44 108,238.90 899.13 15.96 121.640 265,993.70 2209.59 8.21 .64 251,443.99 2088.72 0.80Pliocene 149.78 109,138.03 3661.31 64.99 118.980 268,203.29 8997.56 33.43 .98 253,532.71 8505.40 3.25Miocene 139.17 112,799.35 5124.25 90.96 108.370 277,200.85 12,592.67 46.78 .37 262,038.11 11,903.86 4.55Oligocene 124.89 117,923.59 6164.81 109.43 94.085 289,793.52 15,149.83 56.28 .09 273,941.97 14,321.14 5.48Eocene 108.50 124,088.41 6249.75 110.94 77.700 304,943.35 15,358.56 57.06 .70 288,263.12 14,518.46 5.55Paleocene 92.70 130,338.15 9186.49 163.07 61.900 320,301.91 22,575.51 83.87 .90 302,781.57 21,340.65 8.16Late Cretaceous 70.80 139,524.65 18,482.66 328.09 40.000 342,877.43 45,420.55 168.74 .00 324,122.22Early Cretaceous 30.80 158,007.30 15,883.80 281.95 0.000 388,297.98Late Jurassic 0.00 173,891.10Total flux from
unit throughmid-Holocene
1170.79 457.15 28.07
33W.W.Hay
etal.
/Palaeogeography,
Palaeoclim
atology,Palaeoecology
240(2006)
3–46
TimHolunitpoin
my
Mid
1681671641541391231078545150
TimHolunitpoin
my
Late
828178685437210
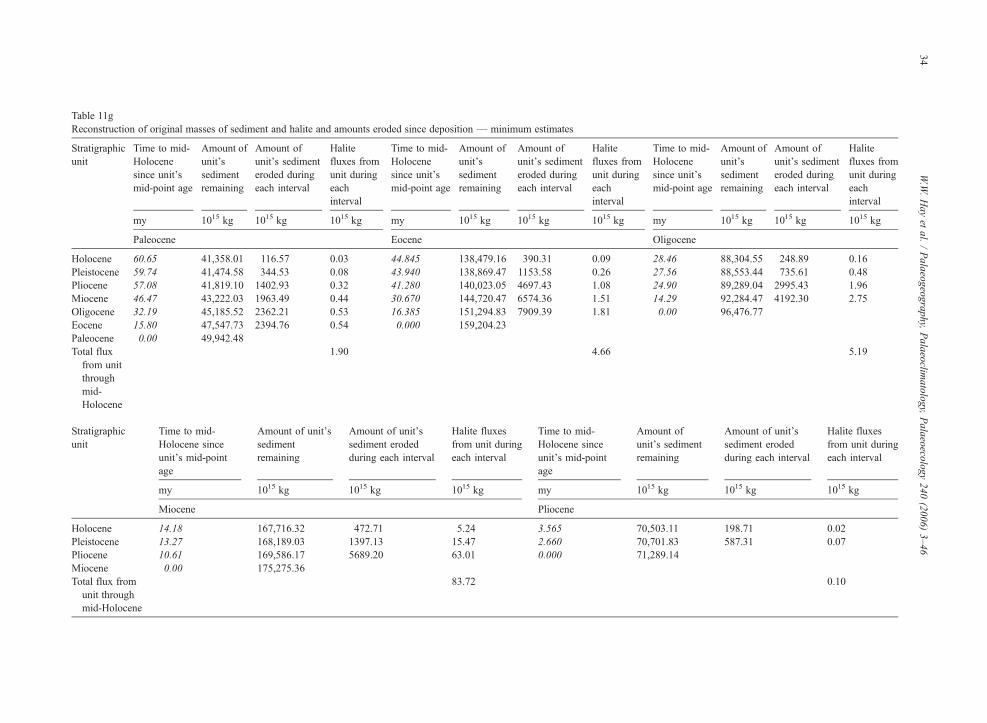
Table 11gReconstruction of original masses of sediment and halite and amounts eroded since deposition — minimum estimates
Stratigraphicunit
Time to mid-Holocenesince unit'smid-point age
Amount ofunit'ssedimentremaining
Amount ofunit's sedimenteroded duringeach interval
Halitefluxes fromunit duringeachinterval
Time to mid-Holocenesince unit'smid-point age
Amount ofunit'ssedimentremaining
Amount ofunit's sedimenteroded duringeach interval
Halitefluxes fromunit duringeachinterval
Time to mid-Holocenesince unit'smid-point age
Amount ofunit'ssedimentremaining
Amount ofunit's sedimenteroded duringeach interval
Halitefluxes fromunit duringeachinterval
my 1015 kg 1015 kg 1015 kg my 1015 kg 1015 kg 1015 kg my 1015 kg 1015 kg 1015 kg
Paleocene Eocene Oligocene
Holocene 60.65 41,358.01 116.57 0.03 44.845 138,479.16 390.31 0.09 28.46 88,304.55 248.89 0.16Pleistocene 59.74 41,474.58 344.53 0.08 43.940 138,869.47 1153.58 0.26 27.56 88,553.44 735.61 0.48Pliocene 57.08 41,819.10 1402.93 0.32 41.280 140,023.05 4697.43 1.08 24.90 89,289.04 2995.43 1.96Miocene 46.47 43,222.03 1963.49 0.44 30.670 144,720.47 6574.36 1.51 14.29 92,284.47 4192.30 2.75Oligocene 32.19 45,185.52 2362.21 0.53 16.385 151,294.83 7909.39 1.81 0.00 96,476.77Eocene 15.80 47,547.73 2394.76 0.54 0.000 159,204.23Paleocene 0.00 49,942.48Total fluxfrom unitthroughmid-Holocene
1.90 4.66 5.19
Stratigraphicunit
Time to mid-Holocene sinceunit's mid-pointage
Amount of unit'ssedimentremaining
Amount of unit'ssediment erodedduring each interval
Halite fluxesfrom unit duringeach interval
Time to mid-Holocene sinceunit's mid-pointage
Amount ofunit's sedimentremaining
Amount of unit'ssediment erodedduring each interval
Halite fluxesfrom unit duringeach interval
my 1015 kg 1015 kg 1015 kg my 1015 kg 1015 kg 1015 kg
Miocene Pliocene
Holocene 14.18 167,716.32 472.71 5.24 3.565 70,503.11 198.71 0.02Pleistocene 13.27 168,189.03 1397.13 15.47 2.660 70,701.83 587.31 0.07Pliocene 10.61 169,586.17 5689.20 63.01 0.000 71,289.14Miocene 0.00 175,275.36Total flux fromunit throughmid-Holocene
83.72 0.10
34W.W.Hay
etal.
/Palaeogeography,
Palaeoclim
atology,Palaeoecology
240(2006)
3–46
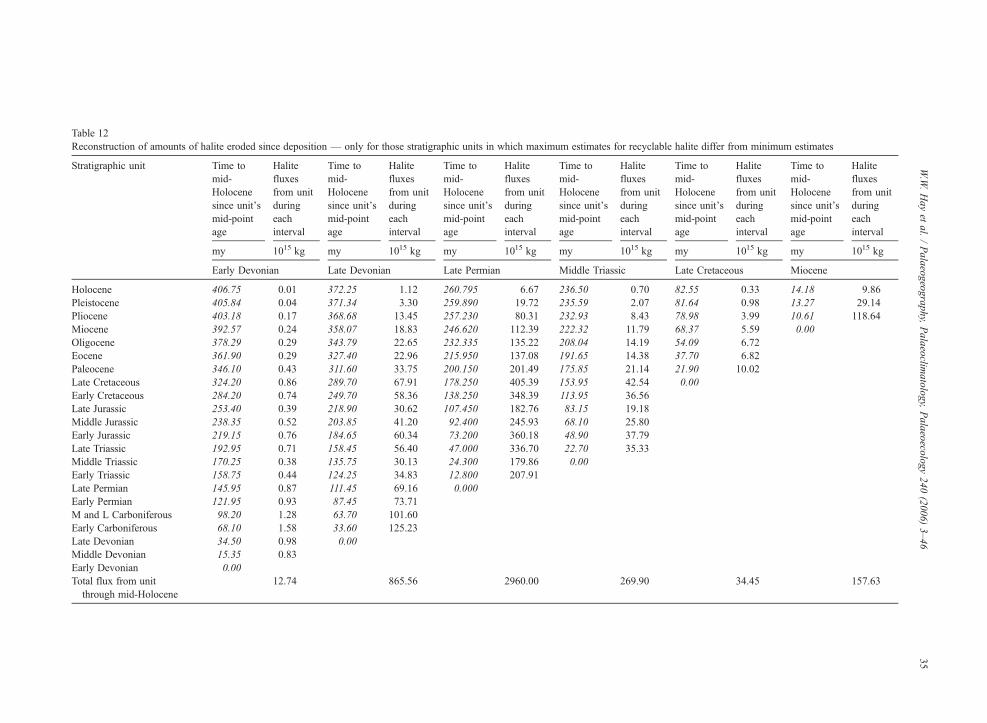
Table 12Reconstruction of amounts of halite eroded since deposition — only for those stratigraphic units in which maximum estimates for recyclable halite differ from minimum estimates
Stratigraphic unit Time tomid-Holocenesince unit'smid-pointage
Halitefluxesfrom unitduringeachinterval
Time tomid-Holocenesince unit'smid-pointage
Halitefluxesfrom unitduringeachinterval
Time tomid-Holocenesince unit'smid-pointage
Halitefluxesfrom unitduringeachinterval
Time tomid-Holocenesince unit'smid-pointage
Halitefluxesfrom unitduringeachinterval
Time tomid-Holocenesince unit'smid-pointage
Halitefluxesfrom unitduringeachinterval
Time tomid-Holocenesince unit'smid-pointage
Halitefluxesfrom unitduringeachinterval
my 1015 kg my 1015 kg my 1015 kg my 1015 kg my 1015 kg my 1015 kg
Early Devonian Late Devonian Late Permian Middle Triassic Late Cretaceous Miocene
Holocene 406.75 0.01 372.25 1.12 260.795 6.67 236.50 0.70 82.55 0.33 14.18 9.86Pleistocene 405.84 0.04 371.34 3.30 259.890 19.72 235.59 2.07 81.64 0.98 13.27 29.14Pliocene 403.18 0.17 368.68 13.45 257.230 80.31 232.93 8.43 78.98 3.99 10.61 118.64Miocene 392.57 0.24 358.07 18.83 246.620 112.39 222.32 11.79 68.37 5.59 0.00Oligocene 378.29 0.29 343.79 22.65 232.335 135.22 208.04 14.19 54.09 6.72Eocene 361.90 0.29 327.40 22.96 215.950 137.08 191.65 14.38 37.70 6.82Paleocene 346.10 0.43 311.60 33.75 200.150 201.49 175.85 21.14 21.90 10.02Late Cretaceous 324.20 0.86 289.70 67.91 178.250 405.39 153.95 42.54 0.00Early Cretaceous 284.20 0.74 249.70 58.36 138.250 348.39 113.95 36.56Late Jurassic 253.40 0.39 218.90 30.62 107.450 182.76 83.15 19.18Middle Jurassic 238.35 0.52 203.85 41.20 92.400 245.93 68.10 25.80Early Jurassic 219.15 0.76 184.65 60.34 73.200 360.18 48.90 37.79Late Triassic 192.95 0.71 158.45 56.40 47.000 336.70 22.70 35.33Middle Triassic 170.25 0.38 135.75 30.13 24.300 179.86 0.00Early Triassic 158.75 0.44 124.25 34.83 12.800 207.91Late Permian 145.95 0.87 111.45 69.16 0.000Early Permian 121.95 0.93 87.45 73.71M and L Carboniferous 98.20 1.28 63.70 101.60Early Carboniferous 68.10 1.58 33.60 125.23Late Devonian 34.50 0.98 0.00Middle Devonian 15.35 0.83Early Devonian 0.00Total flux from unit
through mid-Holocene12.74 865.56 2960.00 269.90 34.45 157.63
35W.W.Hay
etal.
/Palaeogeography,
Palaeoclim
atology,Palaeoecology
240(2006)
3–46
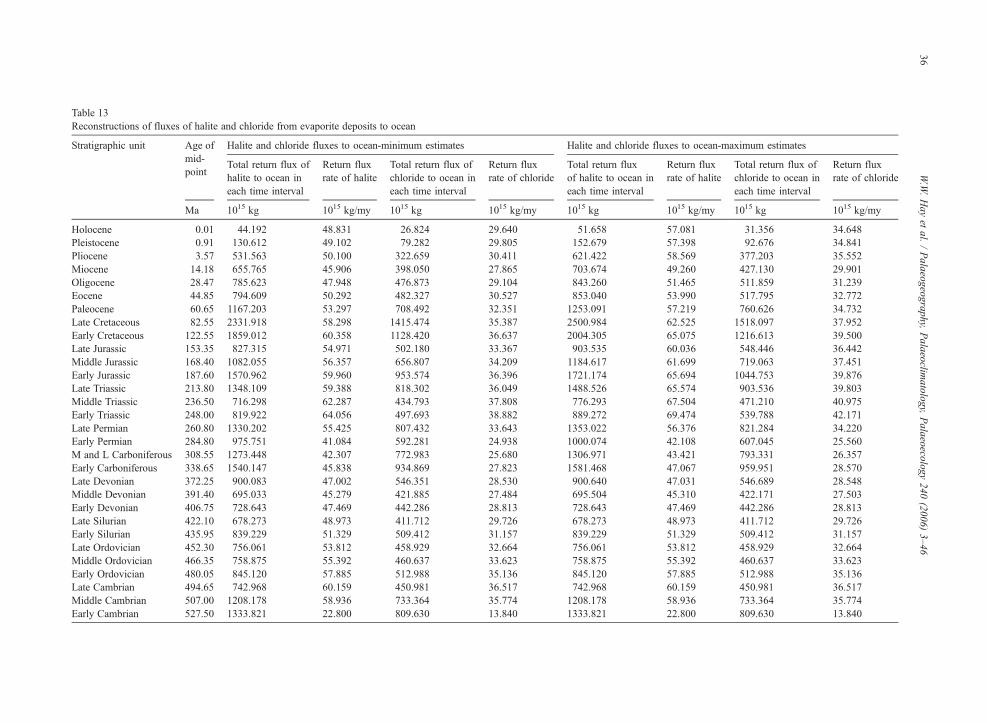
Table 13Reconstructions of fluxes of halite and chloride from evaporite deposits to ocean
Stratigraphic unit Age ofmid-point
Halite and chloride fluxes to ocean-minimum estimates Halite and chloride fluxes to ocean-maximum estimates
Total return flux ofhalite to ocean ineach time interval
Return fluxrate of halite
Total return flux ofchloride to ocean ineach time interval
Return fluxrate of chloride
Total return fluxof halite to ocean ineach time interval
Return fluxrate of halite
Total return flux ofchloride to ocean ineach time interval
Return fluxrate of chloride
Ma 1015 kg 1015 kg/my 1015 kg 1015 kg/my 1015 kg 1015 kg/my 1015 kg 1015 kg/my
Holocene 0.01 44.192 48.831 26.824 29.640 51.658 57.081 31.356 34.648Pleistocene 0.91 130.612 49.102 79.282 29.805 152.679 57.398 92.676 34.841Pliocene 3.57 531.563 50.100 322.659 30.411 621.422 58.569 377.203 35.552Miocene 14.18 655.765 45.906 398.050 27.865 703.674 49.260 427.130 29.901Oligocene 28.47 785.623 47.948 476.873 29.104 843.260 51.465 511.859 31.239Eocene 44.85 794.609 50.292 482.327 30.527 853.040 53.990 517.795 32.772Paleocene 60.65 1167.203 53.297 708.492 32.351 1253.091 57.219 760.626 34.732Late Cretaceous 82.55 2331.918 58.298 1415.474 35.387 2500.984 62.525 1518.097 37.952Early Cretaceous 122.55 1859.012 60.358 1128.420 36.637 2004.305 65.075 1216.613 39.500Late Jurassic 153.35 827.315 54.971 502.180 33.367 903.535 60.036 548.446 36.442Middle Jurassic 168.40 1082.055 56.357 656.807 34.209 1184.617 61.699 719.063 37.451Early Jurassic 187.60 1570.962 59.960 953.574 36.396 1721.174 65.694 1044.753 39.876Late Triassic 213.80 1348.109 59.388 818.302 36.049 1488.526 65.574 903.536 39.803Middle Triassic 236.50 716.298 62.287 434.793 37.808 776.293 67.504 471.210 40.975Early Triassic 248.00 819.922 64.056 497.693 38.882 889.272 69.474 539.788 42.171Late Permian 260.80 1330.202 55.425 807.432 33.643 1353.022 56.376 821.284 34.220Early Permian 284.80 975.751 41.084 592.281 24.938 1000.074 42.108 607.045 25.560M and L Carboniferous 308.55 1273.448 42.307 772.983 25.680 1306.971 43.421 793.331 26.357Early Carboniferous 338.65 1540.147 45.838 934.869 27.823 1581.468 47.067 959.951 28.570Late Devonian 372.25 900.083 47.002 546.351 28.530 900.640 47.031 546.689 28.548Middle Devonian 391.40 695.033 45.279 421.885 27.484 695.504 45.310 422.171 27.503Early Devonian 406.75 728.643 47.469 442.286 28.813 728.643 47.469 442.286 28.813Late Silurian 422.10 678.273 48.973 411.712 29.726 678.273 48.973 411.712 29.726Early Silurian 435.95 839.229 51.329 509.412 31.157 839.229 51.329 509.412 31.157Late Ordovician 452.30 756.061 53.812 458.929 32.664 756.061 53.812 458.929 32.664Middle Ordovician 466.35 758.875 55.392 460.637 33.623 758.875 55.392 460.637 33.623Early Ordovician 480.05 845.120 57.885 512.988 35.136 845.120 57.885 512.988 35.136Late Cambrian 494.65 742.968 60.159 450.981 36.517 742.968 60.159 450.981 36.517Middle Cambrian 507.00 1208.178 58.936 733.364 35.774 1208.178 58.936 733.364 35.774Early Cambrian 527.50 1333.821 22.800 809.630 13.840 1333.821 22.800 809.630 13.840
36W.W.Hay
etal.
/Palaeogeography,
Palaeoclim
atology,Palaeoecology
240(2006)
3–46
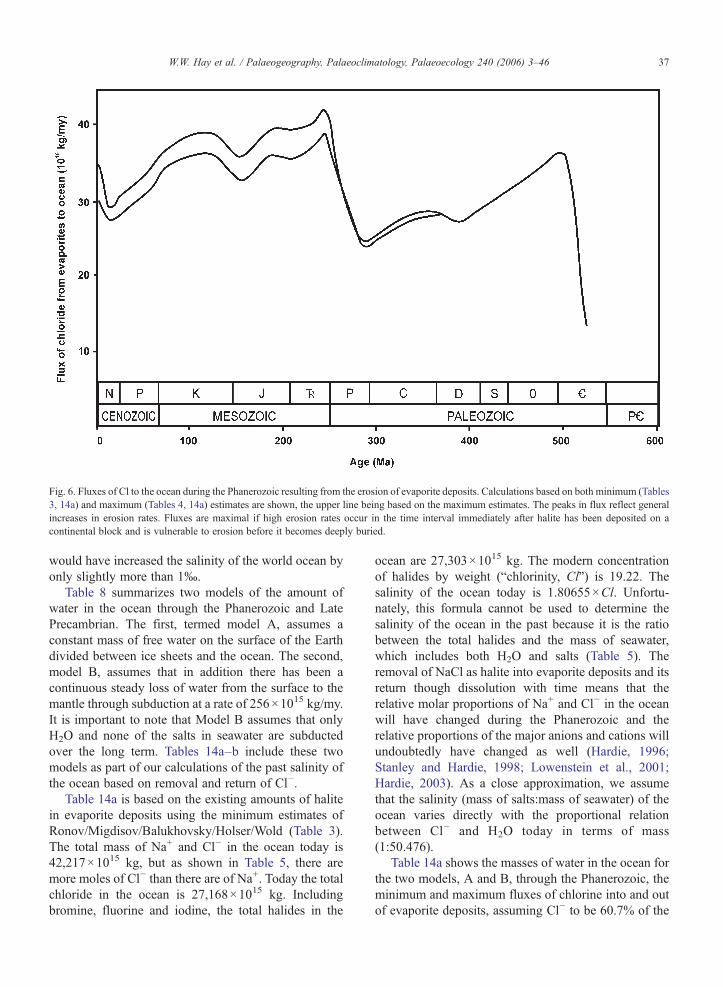
Fig. 6. Fluxes of Cl to the ocean during the Phanerozoic resulting from the erosion of evaporite deposits. Calculations based on both minimum (Tables3, 14a) and maximum (Tables 4, 14a) estimates are shown, the upper line being based on the maximum estimates. The peaks in flux reflect generalincreases in erosion rates. Fluxes are maximal if high erosion rates occur in the time interval immediately after halite has been deposited on acontinental block and is vulnerable to erosion before it becomes deeply buried.
37W.W. Hay et al. / Palaeogeography, Palaeoclimatology, Palaeoecology 240 (2006) 3–46
would have increased the salinity of the world ocean byonly slightly more than 1‰.
Table 8 summarizes two models of the amount ofwater in the ocean through the Phanerozoic and LatePrecambrian. The first, termed model A, assumes aconstant mass of free water on the surface of the Earthdivided between ice sheets and the ocean. The second,model B, assumes that in addition there has been acontinuous steady loss of water from the surface to themantle through subduction at a rate of 256×1015 kg/my.It is important to note that Model B assumes that onlyH2O and none of the salts in seawater are subductedover the long term. Tables 14a–b include these twomodels as part of our calculations of the past salinity ofthe ocean based on removal and return of Cl−.
Table 14a is based on the existing amounts of halitein evaporite deposits using the minimum estimates ofRonov/Migdisov/Balukhovsky/Holser/Wold (Table 3).The total mass of Na+ and Cl− in the ocean today is42,217×1015 kg, but as shown in Table 5, there aremore moles of Cl− than there are of Na+. Today the totalchloride in the ocean is 27,168×1015 kg. Includingbromine, fluorine and iodine, the total halides in the
ocean are 27,303×1015 kg. The modern concentrationof halides by weight (“chlorinity, Cl”) is 19.22. Thesalinity of the ocean today is 1.80655×Cl. Unfortu-nately, this formula cannot be used to determine thesalinity of the ocean in the past because it is the ratiobetween the total halides and the mass of seawater,which includes both H2O and salts (Table 5). Theremoval of NaCl as halite into evaporite deposits and itsreturn though dissolution with time means that therelative molar proportions of Na+ and Cl− in the oceanwill have changed during the Phanerozoic and therelative proportions of the major anions and cations willundoubtedly have changed as well (Hardie, 1996;Stanley and Hardie, 1998; Lowenstein et al., 2001;Hardie, 2003). As a close approximation, we assumethat the salinity (mass of salts:mass of seawater) of theocean varies directly with the proportional relationbetween Cl− and H2O today in terms of mass(1:50.476).
Table 14a shows the masses of water in the ocean forthe two models, A and B, through the Phanerozoic, theminimum and maximum fluxes of chlorine into and outof evaporite deposits, assuming Cl− to be 60.7% of the

Table 14aMasses of ocean water—models A and B a, minimum and maximum chloride fluxes from and to the ocean, and minimum andmaximum estimates ofmass of chloride in the ocean
Stratigraphic unit Age ofmid-point
Length Mass ofocean water— takingonly glacialchanges intoaccount —Model A
Mass ofocean water— with bothlong-termtrend andglacialvariations —Model B
Chlorideflux fromocean intoevaporitedeposits—minimumrate
Chlorideflux fromocean intoevaporitedeposits—maximumrate
Chlorideflux fromevaporitedepositsto ocean—minimumrate
Chlorideflux fromevaporitedepositsto ocean—maximumrate
Mass ofchloridein theocean —minimumestimate
Mass ofchloridein theocean —maximumestimate
Ma my 1015 kg 1015 kg 1015 kg/my
1015 kg/my
1015 kg/my
1015 kg/my
1015 kg 1015 kg
Recent 0.000 0.00 1,371,346 1,371,346 0.00 0.00 29.64 34.65 27,168 27,168Holocene 0.005 0.01 1,371,346 1,371,346 0.00 0.00 29.64 34.65 27,168 27,168Pleistocene 0.910 1.80 1,321,626 1,321,859 0.00 0.00 29.81 34.84 27,114 27,105Pliocene 3.570 3.52 1,373,736 1,374,649 1.53 1.53 30.41 35.55 27,012 26,985Miocene 14.180 17.70 1,373,736 1,377,365 148.06 206.83 27.86 29.90 29,140 30,117Oligocene 28.465 10.87 1,385,736 1,393,020 3.77 3.77 29.10 31.24 28,864 29,818Eocene 44.850 21.90 1,395,736 1,407,213 1.01 1.01 30.53 32.77 28,218 29,123Paleocene 60.650 9.70 1,395,736 1,411,257 0.70 0.70 32.35 34.73 27,911 28,793Late Cretaceous 82.550 34.10 1,395,736 1,416,861 2.21 2.71 35.39 37.95 26,780 27,591Early Cretaceous 122.550 45.90 1,395,736 1,427,097 27.65 99.06 36.64 39.50 26,367 30,325Late Jurassic 153.350 15.70 1,395,736 1,434,979 294.71 294.71 33.37 36.44 30,470 34,379Middle Jurassic 168.400 14.40 1,395,736 1,438,831 21.37 21.37 34.21 37.45 30,285 34,148Early Jurassic 187.600 24.00 1,395,736 1,443,744 102.45 102.45 36.40 39.88 31,870 35,649Late Triassic 213.800 28.40 1,395,736 1,450,449 35.19 35.19 36.05 39.80 31,846 35,518Middle Triassic 236.500 17.00 1,395,736 1,456,258 3.78 18.51 37.81 40.97 31,267 35,136Early Triassic 248.000 6.00 1,395,736 1,459,201 20.08 20.08 38.88 42.17 31,155 35,004Late Permian 260.800 19.60 1,395,736 1,462,477 119.07 164.99 33.64 34.22 32,829 37,567Early Permian 284.800 28.40 1,375,736 1,448,619 123.25 123.25 24.94 25.56 35,621 40,341M and L Carboniferous 308.550 19.10 1,370,736 1,449,697 23.12 23.12 25.68 26.36 35,572 40,279Early Carboniferous 338.650 41.10 1,390,736 1,477,400 3.96 3.96 27.82 28.57 34,591 39,268Late Devonian 372.250 26.10 1,395,736 1,490,998 19.88 29.35 28.53 28.55 34,366 39,289Middle Devonian 391.400 12.20 1,395,736 1,495,899 67.33 67.33 27.48 27.50 34,852 39,775Early Devonian 406.750 18.50 1,395,736 1,499,827 0.25 0.58 28.81 28.81 34,323 39,253Late Silurian 422.100 12.20 1,395,736 1,503,755 10.96 10.96 29.73 29.73 34,094 39,024Early Silurian 435.950 15.50 1,395,736 1,507,300 0.00 0.00 31.16 31.16 33,611 38,541Late Ordovician 452.300 17.20 1,395,736 1,511,484 0.00 0.00 32.66 32.66 33,050 37,979Middle Ordovician 466.350 10.90 1,395,736 1,515,079 13.89 13.89 33.62 33.62 32,834 37,764Early Ordovician 480.050 16.50 1,390,736 1,513,585 0.00 0.00 35.14 35.14 32,255 37,184Late Cambrian 494.650 12.70 1,395,736 1,522,322 3.04 3.04 36.52 36.52 31,830 36,759Middle Cambrian 507.000 12.00 1,395,736 1,525,482 69.05 69.05 35.77 35.77 32,229 37,158Early Cambrian 527.500 29.00 1,395,736 1,530,728 269.51 269.51 13.84 13.84 39,643 44,573a From Table 8.
38 W.W. Hay et al. / Palaeogeography, Palaeoclimatology, Palaeoecology 240 (2006) 3–46
weight of the halite, and minimum and maximumestimates of the mass of chloride in the ocean. Table 14bshows the minimum and maximum estimates of the totalmass of salts in the ocean assuming the total mass ofsalts to be 1.81558 times the mass of chloride, theminimum and maximum estimates of the mass ofseawater, and minimum and maximum estimates ofsalinity for water models A and B.
Fig. 7 summarizes these results for both theminimum and maximum models. The short-dash linesare the minimum and maximum estimates of salinity
assuming water model A, with no loss of water to themantle. The upper solid line is the average of thesevalues. The long-dash lines are the minimum andmaximum estimates of salinity assuming water model B,with loss only of water to the mantle. The lines slopesharply downward toward the present as extractionsoccurred, and slope gently upward toward present asevaporite deposits are eroded and salts returned to theocean. Glaciations have little effect except for the LatePalaeozoic where they cause a broad depression in thelines, and for the Neogene. There were significantly
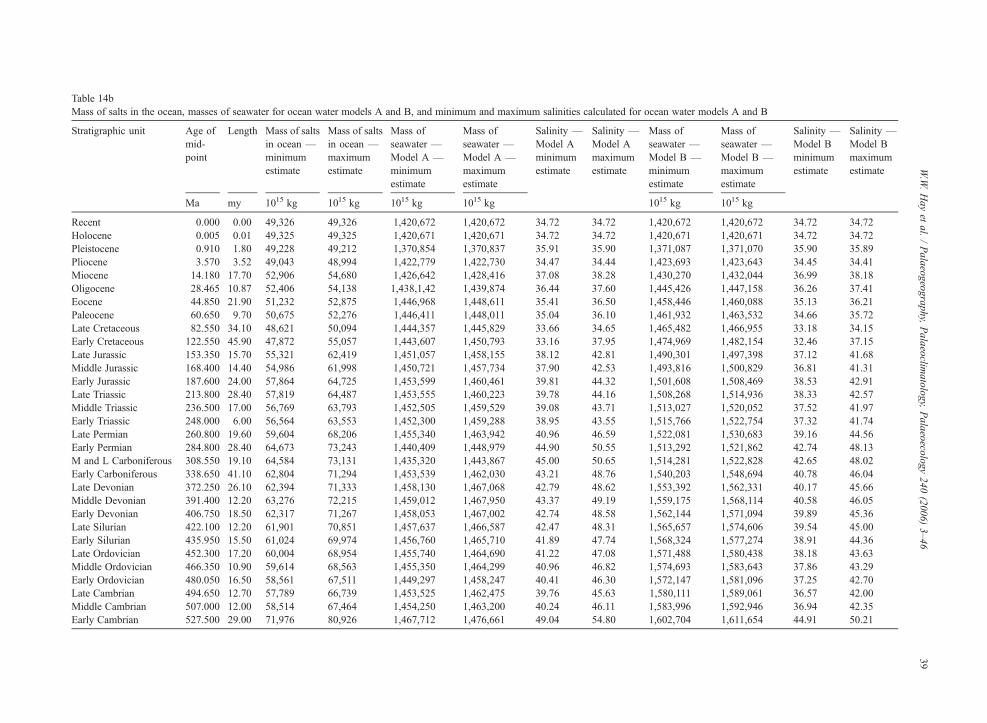
Table 14bMass of salts in the ocean, masses of seawater for ocean water models A and B, and minimum and maximum salinities calculated for ocean water models A and B
Stratigraphic unit Age ofmid-point
Length Mass of saltsin ocean —minimumestimate
Mass of saltsin ocean —maximumestimate
Mass ofseawater —Model A —minimumestimate
Mass ofseawater —Model A —maximumestimate
Salinity —Model Aminimumestimate
Salinity —Model Amaximumestimate
Mass ofseawater —Model B —minimumestimate
Mass ofseawater —Model B —maximumestimate
Salinity —Model Bminimumestimate
Salinity —Model Bmaximumestimate
Ma my 1015 kg 1015 kg 1015 kg 1015 kg 1015 kg 1015 kg
Recent 0.000 0.00 49,326 49,326 1,420,672 1,420,672 34.72 34.72 1,420,672 1,420,672 34.72 34.72Holocene 0.005 0.01 49,325 49,325 1,420,671 1,420,671 34.72 34.72 1,420,671 1,420,671 34.72 34.72Pleistocene 0.910 1.80 49,228 49,212 1,370,854 1,370,837 35.91 35.90 1,371,087 1,371,070 35.90 35.89Pliocene 3.570 3.52 49,043 48,994 1,422,779 1,422,730 34.47 34.44 1,423,693 1,423,643 34.45 34.41Miocene 14.180 17.70 52,906 54,680 1,426,642 1,428,416 37.08 38.28 1,430,270 1,432,044 36.99 38.18Oligocene 28.465 10.87 52,406 54,138 1,438,1,42 1,439,874 36.44 37.60 1,445,426 1,447,158 36.26 37.41Eocene 44.850 21.90 51,232 52,875 1,446,968 1,448,611 35.41 36.50 1,458,446 1,460,088 35.13 36.21Paleocene 60.650 9.70 50,675 52,276 1,446,411 1,448,011 35.04 36.10 1,461,932 1,463,532 34.66 35.72Late Cretaceous 82.550 34.10 48,621 50,094 1,444,357 1,445,829 33.66 34.65 1,465,482 1,466,955 33.18 34.15Early Cretaceous 122.550 45.90 47,872 55,057 1,443,607 1,450,793 33.16 37.95 1,474,969 1,482,154 32.46 37.15Late Jurassic 153.350 15.70 55,321 62,419 1,451,057 1,458,155 38.12 42.81 1,490,301 1,497,398 37.12 41.68Middle Jurassic 168.400 14.40 54,986 61,998 1,450,721 1,457,734 37.90 42.53 1,493,816 1,500,829 36.81 41.31Early Jurassic 187.600 24.00 57,864 64,725 1,453,599 1,460,461 39.81 44.32 1,501,608 1,508,469 38.53 42.91Late Triassic 213.800 28.40 57,819 64,487 1,453,555 1,460,223 39.78 44.16 1,508,268 1,514,936 38.33 42.57Middle Triassic 236.500 17.00 56,769 63,793 1,452,505 1,459,529 39.08 43.71 1,513,027 1,520,052 37.52 41.97Early Triassic 248.000 6.00 56,564 63,553 1,452,300 1,459,288 38.95 43.55 1,515,766 1,522,754 37.32 41.74Late Permian 260.800 19.60 59,604 68,206 1,455,340 1,463,942 40.96 46.59 1,522,081 1,530,683 39.16 44.56Early Permian 284.800 28.40 64,673 73,243 1,440,409 1,448,979 44.90 50.55 1,513,292 1,521,862 42.74 48.13M and L Carboniferous 308.550 19.10 64,584 73,131 1,435,320 1,443,867 45.00 50.65 1,514,281 1,522,828 42.65 48.02Early Carboniferous 338.650 41.10 62,804 71,294 1,453,539 1,462,030 43.21 48.76 1,540,203 1,548,694 40.78 46.04Late Devonian 372.250 26.10 62,394 71,333 1,458,130 1,467,068 42.79 48.62 1,553,392 1,562,331 40.17 45.66Middle Devonian 391.400 12.20 63,276 72,215 1,459,012 1,467,950 43.37 49.19 1,559,175 1,568,114 40.58 46.05Early Devonian 406.750 18.50 62,317 71,267 1,458,053 1,467,002 42.74 48.58 1,562,144 1,571,094 39.89 45.36Late Silurian 422.100 12.20 61,901 70,851 1,457,637 1,466,587 42.47 48.31 1,565,657 1,574,606 39.54 45.00Early Silurian 435.950 15.50 61,024 69,974 1,456,760 1,465,710 41.89 47.74 1,568,324 1,577,274 38.91 44.36Late Ordovician 452.300 17.20 60,004 68,954 1,455,740 1,464,690 41.22 47.08 1,571,488 1,580,438 38.18 43.63Middle Ordovician 466.350 10.90 59,614 68,563 1,455,350 1,464,299 40.96 46.82 1,574,693 1,583,643 37.86 43.29Early Ordovician 480.050 16.50 58,561 67,511 1,449,297 1,458,247 40.41 46.30 1,572,147 1,581,096 37.25 42.70Late Cambrian 494.650 12.70 57,789 66,739 1,453,525 1,462,475 39.76 45.63 1,580,111 1,589,061 36.57 42.00Middle Cambrian 507.000 12.00 58,514 67,464 1,454,250 1,463,200 40.24 46.11 1,583,996 1,592,946 36.94 42.35Early Cambrian 527.500 29.00 71,976 80,926 1,467,712 1,476,661 49.04 54.80 1,602,704 1,611,654 44.91 50.21
39W.W.Hay
etal.
/Palaeogeography,
Palaeoclim
atology,Palaeoecology
240(2006)
3–46

Fig. 7. Four models reconstructing the mean salinity of the ocean during the Phanerozoic. The short-dashed lines are the maximum and minimumestimates based on water Model A (no loss of water through subduction); the upper solid line is the average for Model A. The long-dashed lines arethe maximum and minimum estimates based on water Model B (water steadily lost through subduction); the lower solid line is the average for ModelB. In the Palaeozoic, the average for Model A nearly coincides with the maximum for Model B, and the average for Model B nearly coincides with theminimum for Model A.
40 W.W. Hay et al. / Palaeogeography, Palaeoclimatology, Palaeoecology 240 (2006) 3–46
higher salinities in the early Neogene after initiation ofthe glaciation of Antarctica and before the extractionsinto the Persian Gulf, Red Sea, Mediterranean andCarpathian regions. The maximum and minimumevaporite models diverge in the Mesozoic, primarilybecause of the uncertainties involved in estimating thesize of the salt deposits in young ocean basins. The largedecline in ocean salinity through the Mesozoic is relatedto the major salt extractions into the Gulf of Mexico andAtlantic, and indicate that in the early Mesozoicsalinities would have been in the high 30's to low40's (‰) depending on the minimum or maximumevaporite model. Palaeozoic salinities were in the low tohigh 40's and reached the 50's (‰) in the EarlyCambrian, depending on the evaporite data. Water massmodel B reduces the salinities by about 5‰ for bothmaximum and minimum evaporite models. Assumingthat salts were subducted along with the water wouldbring the salinities back up almost to the level of theconstant water mass model A, implying only a change inthe mass of seawater. There would be a small differencebecause the seawater subducted early in the Phanerozoic
would have been somewhat more saline than that in thelater Phanerozoic.
8. Implications
Salinity and temperature affect a number of thephysical properties of seawater, including its density,specific heat, saturation vapor pressure, and osmoticpressure. The largest effects are related to the densitywhere there is a complex interplay between temperatureand salinity. These relationships are described by theequation of state for seawater (Millero et al., 1980;Millero and Poisson, 1981), which is highly non-linear.The Millero et al. (1980) and Millero and Poisson(1981) equation of state is a polynomial with 17 terms,one of which is the bulk modulus. The bulk modulus isdescribed by another polynomial with 25 terms. Thisequation of state is thought to be valid for the range T=−7 °C–50 °C and S=0–60‰ (Millero, personalcommunication). Salinity causes only a minor effecton specific heat which decreases by about 9% from asalinity of 0‰ to 60‰. This is unlikely to have any

41W.W. Hay et al. / Palaeogeography, Palaeoclimatology, Palaeoecology 240 (2006) 3–46
detectable influence on climate. Similarly, saturationvapor pressure is overwhelmingly dominated by theeffect of temperature. Increased salinity lowers thesaturation vapor pressure but only very slightly, so that itis unlikely to have any effect on climate. Osmoticpressure varies directly with salinity and might beexpected to have a major effect on organisms.
8.1. The effect of ocean salinity differences oncirculation
Rooth (1982) called attention to the fact that themean salinity of the ocean has profound implications forthe behavior of the ocean. To understand the implica-tions of differences in mean ocean salinity for thethermohaline circulation, one needs to only considerwhat would happen if the salinity of the ocean weresignificantly lower than it is today. Fig. 8 is a graphicalrepresentation of the equation of state for seawater(Millero and Poisson, 1981). Below a salinity of 27.4‰,the maximum density of seawater lies above the freezingpoint, and it behaves like fresh water in that the coldestwater will float. This in fact occurs today along theArctic shelf off Siberia, so that region has become the“ice factory” from the Arctic Ocean. In geologicperspective polar regions with lower than averagesalinities could become excluded as major sites ofdeep water formation even if they are very cold. Thissituation has existed periodically in the Arctic since the
Fig. 8. Graphical representation of the equation of state of seawater showinglines are density at the surface beneath one atmosphere of pressure. Long-dash2 km). Short-dashes lines are density at a pressure of 4000 dbar (=depth of ap(1981). See text for discussion.
Arctic Ocean Basin became isolated from the Pacific inthe Cretaceous (see palaeogeographic maps of Kazminand Napatov, 1998). By contrast, for seawater withsalinities greater than 27.4‰, the maximum density liesbelow the freezing point. It might be expected that iceformation could not occur unless the entire ocean waschilled to the freezing point, but near the freezing pointsalinity plays a critical role. It is thought that sea-iceformation in the open ocean requires freshening of aminute surface layer, probably through precipitation inthe form of snowflakes. The snowflakes themselves canserve as nuclei for ice formation.
With present day ocean salinities, density changesdue to temperature become very small as the freezingpoint is approached. At salinities of 30–35‰ themaximum density of seawater is just below the freezingpoint. The temperature change as the seawater coolsfrom 0EC to the freezing point (about −2EC) hasalmost no effect on its density. As a result of thispeculiar situation the formation of sea ice becomes animportant factor in increasing the density of sea water.Sea ice initially has a salinity of about 7‰, so that as itfreezes salt is expelled into the surrounding water,increasing its density. For this reason, most of the highlatitude sites where deep water is generated involve sea-ice formation.
The temperature–salinity–density relation becomessignificantly different when ocean salinities are signif-icantly higher than at present. When the salinity reaches
the relation between temperature, salinity, pressure, and density. Solided lines are density at a pressure of 2000 dbar (=depth of approximatelyproximately 4 km). After Millero et al. (1980), and Millero and Poisson
42 W.W. Hay et al. / Palaeogeography, Palaeoclimatology, Palaeoecology 240 (2006) 3–46
40‰, the density curve never approaches the vertical,but slopes down to the freezing point. This means thatthe densest water in the ocean will be the coldest water.As the salinity increases, temperature becomes more andmore dominant in controlling the density of seawater.This has profound implications for formation of high-latitude bottom waters in the past.
Another factor that plays an important role in deepwater formation is the way in which its volume changesin response to pressure changes, sometimes termedcompressivity. This is described by its bulk modulus,which is a strongly non-linear function (Millero andPoisson, 1981) that is required for the equation of stateto determine the density of seawater below the seasurface. Like the density, the bulk modulus changes withboth temperature and salinity. Fig. 8 shows theisopycnals (density lines) for the surface, 2000 dbarand 4000 dbar, corresponding approximately to depthsof 2 and 4 km. The isopycnals are almost parallel attemperatures above 20EC. However, they converge atcooler temperatures. The convergence is the expressionof the fact that colder water is more compressible thanwarmer water even if the temperature differences arevery small. This phenomenon is very important in deepwater formation in the ocean today. As two surfacewaters having the same density but slightly differenttemperatures begin to sink, the cooler water will becompressed more rapidly. Hence its density will becomegreater and it will “win the race” to the bottom, and willbecome the bottom water. The warmer water will stopsinking at an intermediate level. The compressibilityalso changes with salinity; as shown in Fig. 8 the salinityincreases, the surface, 2000 dbar and 4000 dbar linesbecome more parallel as they approach the freezingpoint. At higher salinities the difference in compress-ibility of colder water becomes less important in deepwater formation.
Today the thermohaline circulation is driven bysmall density differences (Hay, 1993) and this hasundoubtedly been true in the past. Today, formation ofthe deep waters that drive thermohaline circulationrequires a density increase through salinization, andthis involves phase changes. At high latitudes thissalinization results from the phase change fromseawater to sea ice, and involves about 0.34×10⁶ J/kg.Dense water can also form at low latitudes, as in theMediterranean today. There it involves salinizationthrough evaporation; the phase change is from waterto vapor and involves about 2.5×10⁶ J/kg. At highersalinities deep water formation can be achievedsimply by cooling the water, which requires only0.0042×106 J/kg.
Changing mean ocean salinity implies significantchanges in the thermohaline circulation. If salinization isnot required to produce deep water, the energy requiredby the phase changes at the atmosphere–ocean surface iseliminated. The phase changes required to increaseseawater density today act as a flywheel on the ocean–atmosphere system, consuming energy and therebyslowing down the rate at which deep water formationcan take place. At higher ocean salinities these phasechanges are not required, and much less energy isneeded to drive the thermohaline circulation. A moresaline ocean could convect much more readily than itdoes today.
8.2. The effect of salinity on marine life
Many palaeontologists assume that conditions in theocean have remained much as they are today, but someobvious changes have occurred. Stanley and Hardie(1998, 1999) have described the alternations betweencalcite and aragonite secreting organisms through thePhanerozoic, attributed to changing relative proportionsof Ca2+ and Mg2+ in seawater. However, it has generallybeen assumed that most marine organisms cannottolerate salinities much higher that those of the openocean today. Interestingly, coral reefs in the northernpart of the Red Sea are among the most diverse on Earthin terms of both corals and fish (Schuhmacher, 1991).Today they thrive in salinities ranging between 41‰ and43‰, and their ancestors must have survived evenhigher salinities during the Last Glacial Maximum. Itmay be that at present many marine animals and plantsare living nearer their low salinity tolerance limit ratherthan their high limit.
Palaeozoic fossils present a special opportunity toexplore the hypothesis that ocean salinities then weresignificantly higher than today. There are very fewPalaeozoic fossils, such as inarticulate brachiopodLingula, that have modern counterparts, and those arealmost always found in peculiar environments. It mustbe recalled that the fossil record prior to the Jurassic isalmost exclusively from epeiric and shelf seas. Theseareas are fundamentally different from open ocean inthat their salinity depends on local fresh water balance.The fresh water balance is an expression of the supply offresh water through precipitation and runoff and loss ofwater to evaporation. Fresh water balance is negative inmid-latitudes where it is reflected in deserts on land andhigher salinity marginal seas such as the Mediterranean.Fresh water balance is positive at high latitudes wheremarginal seas such as the Baltic and Hudson Bay havelow salinities. The epeiric seas of the geologic past,
43W.W. Hay et al. / Palaeogeography, Palaeoclimatology, Palaeoecology 240 (2006) 3–46
some of which have very diverse assemblages of fossilsprobably reflect abnormal conditions, having salinitieseither higher or lower than the mean of the world oceanat the time.
The best record of oceanic salinity would be inpelagic deposits, but these are almost unknown for theearly Mesozoic and Palaeozoic. As far as is known,acritarchs were a major constituent of the Palaeozoicocean plankton, but are rare in younger deposits(Mendelson, 1993). The evolution of the calcareousnannoplankton (Brown et al., 2004) fits well with thehypothesized decline in ocean salinity during theMesozoic. Jurassic calcareous nannoplankton are most-ly found in shelf deposits, and the invasion of the oceanproper seems to have occurred in mid- and LateCretaceous. The planktonic foraminifera have a similarhistory (Culver, 1993). One peculiar group is theRadiolaria, which are known from the Cambrian on.Curiously Palaeozoic radiolaria are known from shallowwater deposits (Casey, 1993), whereas today they arestrictly inhabitants of the open ocean.
There is a question why the organic carbon-richdeposits of the Late Jurassic and Early Cretaceous aresuch prolific producers of petroleum. The coincidenceof petroleum-prone organic carbon-rich deposits andsharply declining ocean salinity may not be unrelated.In many instances Cyanobacteria are importantcontributors of organic carbon in these deposits. Itmay be that the rapidly declining salinities of thesetimes, when very large salt extractions were occurringin the Gulf of Mexico and South Atlantic, wereinstrumental in favoring an abundance of theseorganisms.
9. Summary and conclusions
The reconstructions presented here closely resemblethose that have been published previously based on lesscomplete data (Holser et al., 1980; Hay and Wold, 1997;Hay et al., 1998; Floegel et al., 2000; Hay et al., 2001).The data suggest that there have been significantchanges in the mean salinity of the ocean during thePhanerozoic. The biggest changes are related to majorextractions of salt into the young ocean basins whichdeveloped as Pangaea broke apart. Unfortunately, thesesalt deposits are the least well known. The last bigextractions were those of the Miocene, and theyoccurred just after there had been a large scale extractionof water from the ocean to form the ice cap ofAntarctica. However, these two modifications of themasses of H2O and salt in the ocean followed insequence and did not cancel each other out. Accord-
ingly, salinities during the Early Miocene were between37‰ and 39‰.
The Mesozoic was a time of generally decliningsalinity associated with the deep sea salt extractions ofthe North Atlantic and Gulf of Mexico (Middle to LateJurassic) and South Atlantic (Early Cretaceous). Al-though none of these salt layers have been penetrated bydrilling, the extent and thickness of salt in the Gulf ofMexico is relatively well known. The thin edge of that inthe South Atlantic has been drilled along the Brazilianmargin, but is known to thicken offshore. The NorthAtlantic salt deposits are known only though seismicinterpretation. The decline in salinity correspondsclosely to the evolution of both planktonic foraminiferaand calcareous nannoplankton. Both groups wererestricted to shelf regions and in the Jurassic and earlyCretaceous, but spread into the open ocean in the mid-Cretaceous. Their availability to inhabit the open oceanmay be directly related to the decline in salinity.
The earliest of the major extractions of thePhanerozoic occurred during the Permian and involvedboth halite and unusually large amounts of gypsum/anhydrite. These may have created stress for marineorganisms and may have been a factor contributing tothe end-Permian extinction. There were few majorextractions of salt during the Palaeozoic. The modelssuggest that this was a time of relatively stable butslowly increasing salinities ranging through the upper30 and low 40‰ range into the lower 50‰ concentra-tions in the Early Cambrian.
The modeling suggests that there was a major salinitydecline from the Late Precambrian to the Cambrian, andit is tempting to speculate that this may have been afactor in the Cambrian explosion of life. However, theLate Precambrian salt deposits of the Hormuz regioncannot be precisely dated, and the apparent sharpdecline before the Cambrian may be an artifact of thelack of better information.
The largest uncertainties in the reconstruction of pastocean salinities lie first in the knowledge of the historyof water on Earth. Has the mass of free water remainednearly constant or has it grown or decreased with time?Is the recycling of saline basin waters significant? Howmuch of the salt in subducted seawater is returned to theocean? Is there a steady flux of juvenile chlorine fromthe mantle, or a steady loss to the mantle? Are the deepsea deposits of salt as large as we think, or are therepossible other deep sea deposits that remain undiscov-ered? Is there an unknown mechanism for regulating thesalinity of the ocean? The answers to these questionsmust lie in innovative new approaches to understandingthe history of seawater.
44 W.W. Hay et al. / Palaeogeography, Palaeoclimatology, Palaeoecology 240 (2006) 3–46
Acknowledgements
This work was carried out with the support from theDeutsche Forschungsgemeinschaft through grant HA2891/1-2. We thank Robert Berner and Klaus Wallmannfor thoughtful reviews and helpful suggestions.
References
Allen, P.A., 1997. Earth Surface Processes. Blackwell Science,Oxford.
Anderson, A.T., 1974. Chlorine, sulfur, and water in magmas andoceans. Geological Society of America Bulletin 85, 1485–1492.
Bartels, O.G., 1972. An estimate of volcanic contributions to theatmosphere and volcanic gases and sublimates as the source ofradioisotopes 10Be, 35S, 32P, and 23Na. Health Physics 22,387–392.
Berner, R.A., 2004. A model for calcium, magnesium and sulfate inseawater over Phanerozoic time. American Journal of Science 304,438–453.
Berner, E.K., Berner, R.A., 1987. The Global Water Cycle:Geochemistry and Environment. Prentice-Hall, Englewood Cliffs,N.J.
Brown, J., Colling, A., Park, D., Phillips, J., Rothery, D., Wright, J.,1989. Seawater: Its Composition, Properties and Behaviour. OpenUniversity, Pergamon Press, Oxford.
Brown, P.R., Lees, J.A., Young, J.R., 2004. Calcareous nannoplanktonevolution and diversity through time. In: Thierstein, H.R., Young,J.R. (Eds.), Coccolithophores — from Molecular Processes toGlobal Impact. Springer Verlag, Berlin, pp. 481–508.
Budyko, M.I., Ronov, A.B., Yanshin, A.L., 1987. History of theEarth's Atmosphere. Springer-Verlag, New York.
Burke, K., 1975. Atlantic evaporites formed by evaporation of waterspilled from Pacific, Tethyan, and Southern Oceans. Geology 3,613–616.
Burke, K., Sengor, A.M., 1988. Ten metre sea-level change associatedwith South Atlantic Aptian salt deposition. Marine Geology 83,309–312.
Casey, R.E., 1993. Radiolaria. In: Lipps, J.H. (Ed.), FossilProkaryotes and Protists. Blackwell Scientific Publications,Oxford, pp. 249–284.
Correns, C.W., 1956. The geochemistry of the halogens. In:Ahrens, L.H., Rankama, K., Runcorn, S.K. (Eds.), Physicsand Chemistry of the Earth, vol. 1. Pergamon Press, London,pp. 181–233.
Culver, S.J., 1993. Foraminifera. In: Lipps, J.H. (Ed.), FossilProkaryotes and Protists. Blackwell Scientific Publications,Oxford, UK, pp. 203–247.
Denton, G.H., Hughes, T.J., 1981a. The Last Great Ice Sheets. WileyInterscience, New York.
Denton, G.H., Hughes, T.J., 1981b. The Arctic ice sheet: an outrageoushypothesis. In: Denton, G.H., Hughes, T.J. (Eds.), The Last GreatIce Sheets. Wiley Interscience, New York, pp. 437–467.
Drever, J.I., 1982. The Geochemistry of Natural Waters. Prentice-Hall,Englewood Cliffs, NJ.
Drever, J.I., Li, Y.-H., Maynard, J.B., 1988. Geochemical cycles:the continental crust and the oceans. In: Gregor, C.B., Garrels,R.M., Mackenzie, F.T., Maynard, J.B. (Eds.), Chemical Cyclesin the Evolution of the Earth. John Wiley & Sons, New York,pp. 17–53.
Duplessy, J.C., Labeyrie, L., Juillet-Leclerc, A., Maitre, F., Duprat, J.,Sarnthein, M., 1991. Surface salinity reconstruction of the NorthAtlantic Ocean during the last glacial maximum. OceanologicaActa 14, 311–324.
Duplessy, J.C., Bard, E., Labeyrie, L., Duprat, J., Moyes, J., 1993.Oxygen isotope records and salinity changes in the northeasternAtlantic Ocean during the last 18,000 years. Paleoceanography 8,341–350.
Einsele, G., 1992. Sedimentary Basins: Evolution, Facies, andSediment Budget. Springer-Verlag, New York.
Emiliani, C., 1992. Planet Earth. Cambridge University Press,Cambridge, UK.
Ewing, W.M., Worzel, J.L., Burk, C.A., 1969. Regional aspects ofdeep water drilling in the Gulf of Mexico, east of the BahamaPlatform, and on the Bermuda Rise. In: Ewing,W.M., Worzel, J.L.,Beall, A.O., Berggren, W.A., Bukry, J.D., Burk, C.A., Fischer, A.G., Pessagno Jr., E.A. (Eds.), Initial Reports of the Deep SeaDrilling Project, vol. 1, pp. 624–640.
Feth, J.H., 1981. Chloride in natural continental water — a review. U.S. Geological Survey Water-Supply Paper 2176, 1–30.
Flint, R.F., 1971. Glacial and Quaternary Geology. John Wiley &Sons, New York.
Floegel, S., Wold, C.N., Hay, W.W., 2000. Evolution of sediments andocean salinity. Abstracts Volume, 31st International GeologicalCongress, Rio de Janeiro— Brazil, August 6–17, 2000. 4 pp., CD-ROM.
Frank, L.A., Sigwarth, J.B., 2001.Detection of small cometswith a ground-based telescope. Journal of Geophysical Research 106, 3665–3683.
Frank, L.A., Sigwarth, J.B., Craven, J.D., 1986. On the influx of smallcomets into the Earth's upper atmosphere: I. Observations.Geophysical Research Letters 13, 303–306.
Garrels, R.M., Mackenzie, F., 1971. Evolution of Sedimentary Rocks.W. W. Norton, New York.
Gill, R., 1989. Chemical Fundamentals of Geology. Unwin Hyman,London.
Gilluly, J., 1969. Geological perspective and the completeness of thegeologic record. Geological Society of America Bulletin 80,2303–2312.
Gradstein, F.M., Ogg, J., 1996. A Phanerozoic time scale. Episodes 19,3–5.
Gradstein, F.M., Ogg, J.G., Smith, A.G., Agterberg, F.P., Bleeker, W.,Cooper, R.A., Davydov, V., Gibbard, P., Hinnov, L., House, M.R.,Lourens, L., Luterbacher, H.-P., McArthur, J., Melchin, M.J.,Robb, L.J., Shergold, J., Villeneuve, M., Wardlaw, B.R., Ali, J.,Brinkhuis, H., Hilgen, F.J., Hooker, J., Howarth, R.J., Knoll, A.H.,Laskar, J., Monechi, S., Powell, J., Plumb, K.A., Raffi, I., Röhl, U.,Sanfilippo, A., Schmitz, B., Shackleton, N.J., Shields, G.A.,Strauss, H., Van Dam, J., Veizer, J., van Kolfschoten, Th., Wilson,D., 2004. A Geologic Time Scale 2004. Cambridge UniversityPress, Cambridge, UK.
Hallam, A., 1992. Phanerozoic Sea-level Changes. ColumbiaUniversity Press, New York.
Hardie, L.A., 1996. Secular variation in seawater chemistry: anexplanation for the coupled secular variation in the mineralogies ofmarine limestones and potash evaporites over the past 600 m.y.Geology 24, 279–283.
Hardie, L.A., 2003. Secular variations in Precambrian seawaterchemistry and the timing of Precambrian aragonite seas andcalcite seas. Geology 31, 785–788.
Hay, W.W., 1993. The role of polar deep water formation in globalclimate change. Annual Review of Earth and Planetary Sciences21, 227–254.
45W.W. Hay et al. / Palaeogeography, Palaeoclimatology, Palaeoecology 240 (2006) 3–46
Hay, W.W., 1994. Pleistocene–Holocene fluxes are not the Earth'snorm. In: Hay, W.W. (Ed.), Material Fluxes on the Surface of theEarth. National Academy Press, Washington, D.C., pp. 15–27.
Hay, W.W., 1999. Carbonate sedimentation through the late Precam-brian and Phanerozoic. Zentralblatt für Geologie und Paläontolo-gie, Teil I, 1998, Heft 5–6, 435–445.
Hay, W.W., Leslie, M.A., 1990. Could possible changes in globalgroundwater reservoir cause eustatic sea-level fluctuations. In:Revelle, R. (Ed.), Sea-Level Change. National Academy Press,Washington, D.C., pp. 161–170.
Hay, W.W., Wold, C.N., 1997. Preliminary reconstruction of thesalinity of the ocean in the Cenozoic and Mesozoic. FreibergerForschungshefte, C 468 Geowissenschaften-Paläontologie,Paläontologie, Stratigraphie, Fazies, Heft 5, Karl-Armin-Tröger-Festschrift, 119–127.
Hay, W.W., Sloan II, J.L., Wold, C.N., 1988. The mass/age distributionof sediments on the ocean floor and the global rate of loss ofsediment. Journal of Geophysical Research 93, 14933–14940.
Hay, W.W., Wold, C.N., DeConto, R.M., 1998. The role of salinity incirculation of the Cretaceous ocean. Zentralblatt für Geologie undPaläontologie 1996 (11/12), 1445–1454.
Hay, W.W., Wold, C.N., Söding, E., Flögel, S., 2001. Evolution ofsediment fluxes and ocean salinity. In: Merriam, D.F., Davis, J.C.(Eds.), Geologic Modeling and Simulation: Sedimentary Systems.Kluwer Academic/Plenum Publishers, Dordrecht, The Nether-lands, pp. 153–167.
Holland, H.D., 1974. Marine evaporites and the composition ofsea water during the Phanerozoic. In: Hay, W.W. (Ed.), Studiesin Paleo-Oceanography. Society of Economic Paleontologistsand Mineralogists Special Publication, vol. 20. Society ofEconomic Paleontologists and Mineralogists, Tulsa, Oklahoma,pp. 187–192.
Holland, H.D., 1978. The Chemistry of the Atmosphere and Oceans.Wiley, New York.
Holland, H.D., 1984. The Chemical Evolution of the Atmosphere andOceans. Princeton University Press, Princeton, NJ.
Holser, W.T., 1977. Catastrophic chemical events in the history of theocean. Nature 267, 403–498.
Holser, W.T., 1985. Gradual and abrupt shift in ocean chemistry duringPhanerozoic time. In: Holland, H.D., Trendall, A.F. (Eds.), Patternsof Change in Earth Evolution. Dahlem Konferenzen 1984.Springer Verlag, Berlin, Germany, pp. 123–143.
Holser, W.T., Hay, W.W., Jory, D.E., O'Connell, W.J., 1980. A censusof evaporites and its implications for oceanic geochemistry.Abstracts with Programs - Geological Society of America 12/7,449.
Humphris, S.E., McCollom, T., 1998. The cauldron beneath the seafloor. Oceanus 18/2, 18–21.
Japakasetr, T., Workman, D.R., 1981. Evaporite deposits of Thailand.In: Halbouty, M.T. (Ed.), Energy Resources of the Pacific Region.American Association of Petroleum Geologists, Tulsa, Oklahoma,pp. 179–187.
Joly, J., 1899. An estimate of the geological age of the Earth.Transactions of the Royal Society of Dublin 2 (7), 23–66.
Joly, J., 1925. The Surface History of the Earth. Clarendon Press,Oxford, UK.
Junge, C.E., Werby, R.T., 1958. The concentration of chloride, sodium,potassium, calcium, and sulfate in rain water over the UnitedStates. Journal of Meteorology 15, 417–425.
Kazmin, V.G., Napatov, L.M. (Eds.), 1998. The Paleogeographic Atlasof Northern Eurasia. Institute of Tectonics of the LithosphericPlates, Russian Academy of Natural Sciences, Moscow, Russia.
Knauth, L.P., 1998. Salinity history of the Earth's early ocean. Nature395, 554–555.
Knauth, L.P., 2005. Temperature and salinity history of thePrecambrian ocean: implications for the course of microbialevolution. Palaeogeography, Palaeoclimatology, Palaeoecology219, 53–69.
Kurlansky, M., 2002. Salt — AWorld History. Walker and Company,New York.
Land, L.S., 1995. The role of saline formation water in crustal cycling.Aquatic Geochemistry 1, 137–145.
Lisitzin, A.P., 1974. Osadkovrazovanie v Okeanach. Izdatelstvo“Nauka”, USSR, Moscow.
Livingston, D.A., 1963. Chemical composition of rivers andlakes, Chapter G. In: Fleischer, M. (Ed.), Data of Geochem-istry. U.S. Geological Survey Professional Paper, vol. 440-G.64 pp.
Lord Kelvin, W.T., 1864. On the secular cooling of the earth.Transactions of the Royal Society of Edinburgh 23,157–170.
Lowenstein, T.K., Timofeeff, M.N., Brennan, S.T., Hardie, L.A.,Demicco, R.V., 2001. Oscillations in Phanerozoic seawaterchemistry: evidence from fluid inclusions. Science 294,1086–1088.
Marcinek, J., Rosenkranz, E., 1989. Das Wasser der Erde: Lehrbuchder geographischen Meeres- und Gewässerkunde. Verlag HarriDeutsch, Thun, Switzerland.
McArthur, J.M., Howarth, R.J., Bailey, T.R., 2001. Strontium isotopestratigraphy: LOWESS Version 3: best fit to the marine Sr-isotopecurve for 0–509 Ma and accompanying look-up table for derivingnumerical age. Journal of Geology 109, 155–170.
Mendelson, C.V., 1993. Acritarchs and prasinophytes. In: Lipps, J.H.(Ed.), Fossil Prokaryotes and Protists. Blackwell ScientificPublications, Oxford, UK, pp. 77–104.
Meybeck, M., 1979. Concentrations des eaux fluviales en élémentsmajeurs et apports en solution aux océans. Revue de GéologieDynamique et de Géographie Physique 21, 215–246.
Meybeck, M., 1983. Atmospheric inputs and river transport ofdissolved substances. International Association of HydrologicalSciences Special Publication 141, 173–192.
Meybeck, M., 1987. Global chemical weathering from surficial rocksestimated from river dissolved loads. American Journal of Science287, 401–428.
Millero, F.J., Poisson, A., 1981. International one-atmosphere equationof state for sea water. Deep-Sea Research 28A, 625–629.
Millero, F.J., Chen, C.T., Bradshaw, A., Schleicher, K., 1980. A newhigh pressure equation of state for seawater. Deep-Sea Research27A, 255–264.
Mueller, R.F., Saxena, S.K., 1977. Chemical Petrology: withApplications to Terrestrial Planets and Meteorites. Springer-Verlag, New York.
Parrish, T.J., Ziegler, A.M., Scotese, C.R., 1982. Rainfall patterns andthe distribution of coals and evaporites in the Mesozoic andCenozoic. Palaeogeography, Palaeoclimatology, Palaeoecology40, 67–101.
Railsback, L.B., Anderson, T.F., Ackerly, S.C., Cisne, J.L., 1989.Paleoceanographic modeling of temperature–salinity profiles fromstable isotopic data. Paleoceanography 4, 585–591.
Rankama, K., Sahama, Th.G., 1950. Geochemistry. Chicago Univer-sity Press, Chicago, Illinois, USA.
Ronov, A.B., 1968. Probable changes in the composition ofseawater during the course of geologic time. Sedimentology 10,25–43.
46 W.W. Hay et al. / Palaeogeography, Palaeoclimatology, Palaeoecology 240 (2006) 3–46
Ronov, A.B., 1972. Evolution of rock composition and geochemicalprocesses in the sedimentary shell of the earth. Sedimentology 19,157–172.
Ronov, A.B., 1980. Osadochnaya Obolochka Zemli (KolichestvennoeZakonomernosti Stroeniya, Sostava y Evoliutsii. Izdatelstvo“Nauka”, USSR, Moskva. 78 pp.
Ronov, A.B., 1982. The earth's sedimentary shell (Quantitativepatterns of its structure, compositions, and evolution). InternationalGeology Review 24, 1365–1388.
Ronov, A.B., 1993. In: Yaroshevskii, A.A. (Ed.), Stratisfera — IliOsadochnaya Obolochka Zemli (Kolichestvennoe Issledovanie).Nauka, Moskva. 144 pp.
Ronov, A.B., 1994. Phanerozoic transgressions and regressions on thecontinents: a quantitative approach based on areas flooded by thesea and areas of marine and continental deposition. AmericanJournal of Science 294, 777–801.
Ronov, A.B., Khain, V.Y., Seslavinsky, K.B., 1984. Atlas ofLithological–Paleogeographical Maps of the World: Late Precam-brian and Paleozoic of the Continents. U.S.S.R. Academy ofScience Press, Leningrad.
Ronov, A.B., Khain, V.E., Balukhovsky, A.N., 1989. In: Barsukhov, V.L., Laviorov, N.P. (Eds.), Atlas of Lithological–PaleogeographicalMaps of the World: Mesozoic and Cenozoic of Continents andOceans. Editorial Publishing Group, Moscow.
Rooth, C., 1982. Hydrology and ocean circulation. Progress inOceanography 11, 131–149.
Rubey, W.W., 1951. Geologic history of sea water. Geological Societyof America Bulletin 62, 1111–1148.
Ryan, J.A., Mukherjee, N.R., 1975. Sources of atmospheric gaseouschlorine. Reviews of Geophysics and Space Physics 11, 650–658.
Sandberg, P.A., 1983. An oscillating trend in Phanerozoic nonskeletalcarbonate mineralogy. Nature 305, 19–22.
Scotese, C.R., Bambach, R.K., Barton, C., Van der Voo, R., Ziegler,A., 1979. Paleozoic base maps. Journal of Geology 87, 217–277.
Shackleton, N.J., 1987. Oxygen isotopes, ice volume and sea level.Quaternary Science Reviews 6, 183–190.
Shackleton, N.J., Kennett, J.P., 1975. Paleotemperature history of theCenozoic and the initiation of Antarctic glaciation: oxygen andcarbon isotope analyses on DSDP sites 277, 279, and 281. In:Kennett, J.P., Houtz, R.E., et al. (Eds.), Initial Reports of the DeepSea Drilling Project, vol. 29. U.S. Government Printing Office,Washington, D.C., pp. 743–755.
Schuhmacher, H., 1991. Korallenriffe — Verbreitung, Tierwelt,Ökologie. BLV Verlagsgesellschaft mbH, München, Germany.
Southam, J.R., Hay, W.W., 1981. Global sedimentary massbalance and sea level changes. In: Emiliani, C. (Ed.), TheSea, v. 7, the Oceanic Lithosphere. Wiley-Interscience, NewYork, pp. 1617–1684.
Stallard, R.F., Edmond, J.M., 1981. Chemistry of the Amazon,precipitation chemistry and the marine contribution to thedissolved load at the time of peak discharge. Journal ofGeophysical Research 86, 9844–9858.
Stanley, S.M., Hardie, L.A., 1998. Secular oscillations in the carbonatemineralogy of reef-building and sediment-producing organismsdriven by tectonically forced shifts in seawater chemistry.Palaeogeography, Palaeoclimatology, Palaeoecology 144, 3–19.
Stanley, S.M., Hardie, L.A., 1999. Hypercalcification: paleontologylinks plate tectonics and geochemistry to sedimentology. GSAToday 9 (2), 1–7.
Sverdrup, H.U., Johnson, M.W., Fleming, R.H., 1942. The Oceans,Their Physics, Chemistry, and General Biology. Prentice-Hall,New York.
Tardy, Y., N'kounkou, R., Probst, J.-L., 1989. The global water cycleand continental erosion during Phanerozoic time (570 my).American Journal of Science 289, 455–485.
Turekian, K.K., 1968. Oceans. Prentice-Hall, Englewood Cliffs, NJ.Veizer, J., Jansen, S.L., 1979. Basement and sedimentary recycling and
continental evolution. Journal of Geology 87, 341–370.Veizer, J., Jansen, S.L., 1985. Basement and sedimentary cycling— 2:
Time dimension to global tectonics. Journal of Geology 93,625–664.
Von Huene, R., Scholl, D.W., 1991. Observations at convergentmargins concerning sediment subduction, subduction erosion, andthe growth of continental crust. Reviews of Geophysics 29,279–316.
Wallmann, K., 2001. The geological water cycle and the evolution ofmarine δ18O values. Geochimica et Cosmochimica Acta 65,2469–2485.
Wilkinson, B., 2005. Humans as geologic agents: a deep-timeperspective. Geology 33, 161–164.
Wold, C.N., Hay, W.W., 1990. Estimating ancient sediment fluxes.American Journal of Science 290, 1069–1089.
Wold, C.N., Hay, W.W., 1993. Reconstructing the age and lithology oferoded sediment. Geoinformatics 4, 137–144.
Wold, C.N., Schwartz, G.J., Morrill, C., 1999. Digital database ofmodern evaporites and their predicted distribution based on resultsfrom an atmospheric general circulation model simulation. In:Harff, J., Lemke, W., Stattegger, K. (Eds.), ComputerizedModeling of Sedimentary Systems. Springer, Berlin, pp. 149–167.
Zachos, J.C., Stott, L.D., Lohmann, K.C., 1994. Evolution of earlyCenozoic marine temperatures. Paleoceanography 9, 353–387.
Zharkov, M.A., 1974. Paleozoickie Solenosn'ie Formatsii Mira.Nedra, Moscow, USSR.
Zharkov, M.A., 1981. History of Paleozoic salt Accumulation.Springer Verlag, New York.
Related Documents


