feb.un Evaluation Performance P The Case of LQ Ema Sari 1 PT. Indu 2 Faculty of Economics an 3 Faculty of Economics * Corre Abstract This study aims to determine the differ methods, which are Sharpe, Treynor, sampling technique with certain criter sample is measured by all conditions or that is the Kruskal-Wallish test. It is th similar rank or not if measured by di three methods obtained X2 = 0.004 wit there is no significant difference be Interestingly, Treynor shows consistent Keywords : Sharpe; Treynor; Jensen; INTRODUCTION Investment analysis often investors. Financial theory explains required by investors (high risk-hi Returns can be in the form of reali occurred but are expected to occur i unsystematic risk. These two risks a Measuring portfolio perform risks that will be borne by investor used to evaluate the relative perfor does not mention how and why finan There are 3 parameters tha William Sharpe, Jack Treynor, and performance measure, Treynor pe assume a linear relationship betwee three models base their analysis on p HJBS Volume 4 No DOI: http://doi.org/10.2 nhas.ac.id/jurnal/index.php/HJBS/index e of Stock Portfolio Using The Ris Performance Methods Q 45 Index in Indonesia Stock Exchange i 1 *, Syamsu Alam 2 , Muhammad Sobarsyah 3, ustrial Estate of Makassar; [email protected] nd Business, Hasanuddin University; [email protected] and Business, Hasanuddin University; [email protected] espondence author: [email protected] erences in performances of the LQ 45 stock portfoli , and Jensen from 2016 until 2020. The study ap ria. Portfolio formation in this study uses a single r periods, a one-way analysis of variance by rank w hen tested whether the portfolio performance in each ifferent methods. The test results with the Kruskal- th a probability of 0.998. With, this evaluation, the r etween the tests using the Sharpe, Treynor, and t measurement than the other two methods. portfolio performance; LQ 45 faces problems, namely about assessing the s that the investment risk increases, the higher t igh return). Return is the result obtained from ized returns that have occurred or expected retu in the future. Meanwhile, portfolio risk consists are often referred to as total risk. mance can not only be seen from the return bu rs. In the 1960s several single index measuring rmance of financial managers. This performanc ncial managers can perform better or worse than at can be used to measure portfolio performan Michael Jensen. These three measurements are erformance, and Jensen performance. The thr en portfolio returns and returns from several ma past returns to predict future returns and risks. o 1 February 2022 26487/hjbs.v4i2.514 42 sk Adjusted om m io using 3 different pplied a purposive index model. Each with the method used h period will have a -Wallish test on the results indicate that d Jensen methods. e risks faced by the level of profit m the investment. urns that have not of systematic and ut also shows the instruments were ce evaluation tool n the benchmark. nce developed by called the Sharpe ree measurements arket indices. The

Welcome message from author
This document is posted to help you gain knowledge. Please leave a comment to let me know what you think about it! Share it to your friends and learn new things together.
Transcript

feb.unhas.ac.id/jurnal/index.php/HJBS/index
Evaluation Performance of Stock Portfolio Using The Risk Adjusted Performance Methods
The Case of LQ 45 Index in Indonesia Stock Exchange
Ema Sari
1 PT. Industrial Estate of Makassar2 Faculty of Economics and Business, Hasanuddin University
3 Faculty of Economics and Business, Hasanuddin University
* Correspondence author:
Abstract
This study aims to determine the differences in performances of the LQ 45 stock portfolio using 3 different methods, which are Sharpe, Treynor, and Jensen from 2016 until 2020. The study applied a purposive sampling technique with certain criteria. Portfolio formation in this study uses a single index model. Each sample is measured by all conditions or periods, a onethat is the Kruskal-Wallish test. It is then testsimilar rank or not if measured by different methods. The test results with the Kruskalthree methods obtained X2 = 0.004 with a probability of 0.998. With, this evaluationthere is no significant difference between the tests using the Sharpe, Treynor, and Jensen methods.Interestingly, Treynor shows consistent
Keywords : Sharpe; Treynor; Jensen; portfolio performance; LQ
INTRODUCTION
Investment analysis often faces problems, namely about assessing the risks faced by investors. Financial theory explains that the investment risk increases, the higher the level of prorequired by investors (high risk-high return). Return is the result obtained from the investment. Returns can be in the form of realized returns that have occurred or expected returns that have not occurred but are expected to occur in the future. Meanunsystematic risk. These two risks are often referred to as total risk.
Measuring portfolio performance can not only be seen from the return but also shows the risks that will be borne by investors. In the 1used to evaluate the relative performance of financial managers. This performance evaluation tool does not mention how and why financial managers can perform better or worse than the benchmark.
There are 3 parameters that can be used to measure portfolio performance developed by William Sharpe, Jack Treynor, and Michael Jensen. These three measurements are called the Sharpe performance measure, Treynor performance, and Jensen performance. The three measurassume a linear relationship between portfolio returns and returns from several market indices. The three models base their analysis on past returns to predict future returns and risks.
HJBS Volume 4 No 1
DOI: http://doi.org/10.26487/hjbs.v4i2
feb.unhas.ac.id/jurnal/index.php/HJBS/index
Evaluation Performance of Stock Portfolio Using The Risk Adjusted Performance Methods
The Case of LQ 45 Index in Indonesia Stock Exchange
Ema Sari1*, Syamsu Alam2, Muhammad Sobarsyah3,
PT. Industrial Estate of Makassar; [email protected]
Faculty of Economics and Business, Hasanuddin University; [email protected] of Economics and Business, Hasanuddin University; [email protected]
Correspondence author: [email protected]
This study aims to determine the differences in performances of the LQ 45 stock portfolio using 3 different methods, which are Sharpe, Treynor, and Jensen from 2016 until 2020. The study applied a purposive
echnique with certain criteria. Portfolio formation in this study uses a single index model. Each sample is measured by all conditions or periods, a one-way analysis of variance by rank with the method used
Wallish test. It is then tested whether the portfolio performance in each period will have a similar rank or not if measured by different methods. The test results with the Kruskal-three methods obtained X2 = 0.004 with a probability of 0.998. With, this evaluation, the results indicate that there is no significant difference between the tests using the Sharpe, Treynor, and Jensen methods.
t measurement than the other two methods.
Sharpe; Treynor; Jensen; portfolio performance; LQ 45
Investment analysis often faces problems, namely about assessing the risks faced by investors. Financial theory explains that the investment risk increases, the higher the level of pro
high return). Return is the result obtained from the investment. Returns can be in the form of realized returns that have occurred or expected returns that have not occurred but are expected to occur in the future. Meanwhile, portfolio risk consists of systematic and unsystematic risk. These two risks are often referred to as total risk.
Measuring portfolio performance can not only be seen from the return but also shows the risks that will be borne by investors. In the 1960s several single index measuring instruments were used to evaluate the relative performance of financial managers. This performance evaluation tool does not mention how and why financial managers can perform better or worse than the benchmark.
3 parameters that can be used to measure portfolio performance developed by William Sharpe, Jack Treynor, and Michael Jensen. These three measurements are called the Sharpe performance measure, Treynor performance, and Jensen performance. The three measurassume a linear relationship between portfolio returns and returns from several market indices. The three models base their analysis on past returns to predict future returns and risks.
Volume 4 No 1 February 2022
10.26487/hjbs.v4i2.514
42
Evaluation Performance of Stock Portfolio Using The Risk Adjusted
[email protected] [email protected]
This study aims to determine the differences in performances of the LQ 45 stock portfolio using 3 different methods, which are Sharpe, Treynor, and Jensen from 2016 until 2020. The study applied a purposive
echnique with certain criteria. Portfolio formation in this study uses a single index model. Each way analysis of variance by rank with the method used
ed whether the portfolio performance in each period will have a -Wallish test on the
, the results indicate that there is no significant difference between the tests using the Sharpe, Treynor, and Jensen methods.
Investment analysis often faces problems, namely about assessing the risks faced by investors. Financial theory explains that the investment risk increases, the higher the level of profit
high return). Return is the result obtained from the investment. Returns can be in the form of realized returns that have occurred or expected returns that have not
while, portfolio risk consists of systematic and
Measuring portfolio performance can not only be seen from the return but also shows the 960s several single index measuring instruments were
used to evaluate the relative performance of financial managers. This performance evaluation tool does not mention how and why financial managers can perform better or worse than the benchmark.
3 parameters that can be used to measure portfolio performance developed by William Sharpe, Jack Treynor, and Michael Jensen. These three measurements are called the Sharpe performance measure, Treynor performance, and Jensen performance. The three measurements assume a linear relationship between portfolio returns and returns from several market indices. The

feb.unhas.ac.id/jurnal/index.php/HJBS/index
The Sharpe Index method bases its calculation on the concept ofbenchmark, namely by dividing the portfolio risk premium by its standard deviation (total risk). The higher the Sharpe index value, the better the portfolio performance. The Treynor method based its calculations on the concept of a security market line as a benchmark, namely by dividing the risk premium by the portfolio beta. The higher the Treynor index value, the better the portfolio performance. The Jensen Index method also uses the securities market line as the basis for maequations. However, the Treynor index method is the same as the slope of the line connecting the portfolio position with the risk-free return, while the Jensen index method is the difference between the portfolio's actual return and the portfolio's exThe higher the Jensen index value, the better the portfolio performance.
In this study, the investment portfolios that will be analyzed using the Sharpe, Treynor, and Jensen methods belong to companies that index consists of 45 companies on the IDX with high liquidity and high market capitalization. large and passed the selection according to several selection criteria
There are several studies that have been done before, regarding portfolio performance measurement using the Risk Adjusted Performance method. One of them is a study conducted by Rissa and Azib (2017) with the title Analysis of Stock Portfolio Performance Using the ShaTerynor, and Jensen Index (LQ 45 Shares listed on the Indonesia Stock Exchange for the period 2012-2015). The test results with the Kruskal Walish test on the four methods obtained statisticacalculations (0.019 < 0.05). Another research was also conaims to measure the performance of JII's stock portfolio from 2015 to 2019 using the Sharpe, Treynor, Jensen, Sortino, and information ratio methods and to find out whether there are differences in stock portfolio performance measurements between the five methods. The test results with the Kruskall Wallish test on the five methods obtained test probabilities 0.369 > 0.05 and 2 counts (4,287) < 2 tables (9,488). These results indicate that there is no difference in portfolio performance between the Sharpe, Treynor, Jensen, Sortino, and information ratio methods. Another test by looking at the difference in Mean Rank shows that the Sharpe method is the method that most consistently shows indifference bproduces the lowest difference in mean rank compared to other methods.
Atik and Sri Lestari (2016) who conducted research on stock portfolio performance appraisal analysis using the Sharpe measure and Treynorthe Indonesia Stock Exchange (IDX) for the 2008average difference test (independent sample tand the probability value (Sig) of 0.021 (<0.05), it can be concluded that there is a difference between the two portfolio performances evaluated. using the Sharpe measure and Treynor measure methods during the study period. 285).
Based on the differences in the resulconduct research on stock portfolio performance analysis using the Risk Adjusted Performance method. The objects that will be used in this research are companies listed on the LQ 45 Index where this index is an index consisting of 45 companies with high liquidity levels and large market capitalization. Based on this background, the authors take the title of the thesis: "Evaluation of Stock Portfolio Performance using the Risk Adjusted Performance methAlpha) Case study of the LQ 45 Index on the Indonesia Stock Exchange for the 2016
LITERATURE REVIEW
Investment
Kaptan (2001:1) stated that investment is the employment of funds with the aim of achieving additional income growth in value. Investing is the process of managing an asset that can provide a
HJBS Volume 4 No 1
DOI: http://doi.org/10.26487/hjbs.v4i2
feb.unhas.ac.id/jurnal/index.php/HJBS/index
The Sharpe Index method bases its calculation on the concept of the Capital Market line as a benchmark, namely by dividing the portfolio risk premium by its standard deviation (total risk). The higher the Sharpe index value, the better the portfolio performance. The Treynor method based its
of a security market line as a benchmark, namely by dividing the risk premium by the portfolio beta. The higher the Treynor index value, the better the portfolio performance. The Jensen Index method also uses the securities market line as the basis for maequations. However, the Treynor index method is the same as the slope of the line connecting the
free return, while the Jensen index method is the difference between the portfolio's actual return and the portfolio's expected return which is not managed specifically. The higher the Jensen index value, the better the portfolio performance.
In this study, the investment portfolios that will be analyzed using the Sharpe, Treynor, and Jensen methods belong to companies that are included in the LQ 45 index. This is because the LQ 45 index consists of 45 companies on the IDX with high liquidity and high market capitalization. large and passed the selection according to several selection criteria (Tandelilin, 2010).
veral studies that have been done before, regarding portfolio performance measurement using the Risk Adjusted Performance method. One of them is a study conducted by
with the title Analysis of Stock Portfolio Performance Using the ShaTerynor, and Jensen Index (LQ 45 Shares listed on the Indonesia Stock Exchange for the period
2015). The test results with the Kruskal Walish test on the four methods obtained statisticather research was also conducted by Krisna et al. (2021)
aims to measure the performance of JII's stock portfolio from 2015 to 2019 using the Sharpe, Treynor, Jensen, Sortino, and information ratio methods and to find out whether there are differences
performance measurements between the five methods. The test results with the Kruskall Wallish test on the five methods obtained test probabilities 0.369 > 0.05 and 2 counts (4,287) < 2 tables (9,488). These results indicate that there is no difference in portfolio performance between the Sharpe, Treynor, Jensen, Sortino, and information ratio methods. Another test by looking at the difference in Mean Rank shows that the Sharpe method is the method that most consistently shows indifference between the five measurement methods, because it produces the lowest difference in mean rank compared to other methods.
who conducted research on stock portfolio performance appraisal analysis using the Sharpe measure and Treynor Measure methods on sectoral index stocks listed on the Indonesia Stock Exchange (IDX) for the 2008-2010 period. Based on the results of the twoaverage difference test (independent sample t-test) can be explained by the t-count value of 3.230
ability value (Sig) of 0.021 (<0.05), it can be concluded that there is a difference between the two portfolio performances evaluated. using the Sharpe measure and Treynor measure methods during the study period. 285).
Based on the differences in the results from previous research, the authors are encouraged to conduct research on stock portfolio performance analysis using the Risk Adjusted Performance method. The objects that will be used in this research are companies listed on the LQ 45 Index where
index is an index consisting of 45 companies with high liquidity levels and large market capitalization. Based on this background, the authors take the title of the thesis: "Evaluation of Stock Portfolio Performance using the Risk Adjusted Performance method (Sharpe, Treynor, and Jensen Alpha) Case study of the LQ 45 Index on the Indonesia Stock Exchange for the 2016
stated that investment is the employment of funds with the aim of achieving tional income growth in value. Investing is the process of managing an asset that can provide a
Volume 4 No 1 February 2022
10.26487/hjbs.v4i2.514
43
the Capital Market line as a benchmark, namely by dividing the portfolio risk premium by its standard deviation (total risk). The higher the Sharpe index value, the better the portfolio performance. The Treynor method based its
of a security market line as a benchmark, namely by dividing the risk premium by the portfolio beta. The higher the Treynor index value, the better the portfolio performance. The Jensen Index method also uses the securities market line as the basis for making equations. However, the Treynor index method is the same as the slope of the line connecting the
free return, while the Jensen index method is the difference between pected return which is not managed specifically.
In this study, the investment portfolios that will be analyzed using the Sharpe, Treynor, and are included in the LQ 45 index. This is because the LQ 45
index consists of 45 companies on the IDX with high liquidity and high market capitalization. large
veral studies that have been done before, regarding portfolio performance measurement using the Risk Adjusted Performance method. One of them is a study conducted by
with the title Analysis of Stock Portfolio Performance Using the Sharpe, Terynor, and Jensen Index (LQ 45 Shares listed on the Indonesia Stock Exchange for the period
2015). The test results with the Kruskal Walish test on the four methods obtained statistical Krisna et al. (2021). This study
aims to measure the performance of JII's stock portfolio from 2015 to 2019 using the Sharpe, Treynor, Jensen, Sortino, and information ratio methods and to find out whether there are differences
performance measurements between the five methods. The test results with the Kruskall Wallish test on the five methods obtained test probabilities 0.369 > 0.05 and 2 counts (4,287) < 2 tables (9,488). These results indicate that there is no difference in measuring stock portfolio performance between the Sharpe, Treynor, Jensen, Sortino, and information ratio methods. Another test by looking at the difference in Mean Rank shows that the Sharpe method is the method
etween the five measurement methods, because it
who conducted research on stock portfolio performance appraisal Measure methods on sectoral index stocks listed on
2010 period. Based on the results of the two-count value of 3.230
ability value (Sig) of 0.021 (<0.05), it can be concluded that there is a difference between the two portfolio performances evaluated. using the Sharpe measure and Treynor measure
ts from previous research, the authors are encouraged to conduct research on stock portfolio performance analysis using the Risk Adjusted Performance method. The objects that will be used in this research are companies listed on the LQ 45 Index where
index is an index consisting of 45 companies with high liquidity levels and large market capitalization. Based on this background, the authors take the title of the thesis: "Evaluation of Stock
od (Sharpe, Treynor, and Jensen Alpha) Case study of the LQ 45 Index on the Indonesia Stock Exchange for the 2016-2020 periods.
stated that investment is the employment of funds with the aim of achieving tional income growth in value. Investing is the process of managing an asset that can provide a
feb.unhas.ac.id/jurnal/index.php/HJBS/index
return in the future. Investment also implies a current commitment to money or other resources with the hope of getting a profit in the future. So it can be conallocating an asset in the form of money or other resources with the hope and calculation of getting positive growth results in the future.
Investment Process To achieve the objectives of investment, requires a decisioprocess, so that the decision has takenbasis for investment decisions is the level of expected return, the level of risk, and the relationship between return and risk.
Portfolio Theory
Portfolio theory was first introduced by Markowitz in 1952. Portfolio is defined as a series of combinations of several assets that are invested and held by investors, both individuals and institutions (Sunariyah, 2006). Portfoliomeasurement for investors, showing how to choose one alternative asset to diversify and reduce portfolio risk (Utami, 2010:111).
Portfolio describes ownership of investment instruments that are prepared with careful planning to achieve optimal results through risk distribution. The portfolio has several alternative variations with the consideration that investors must see the risk and rate of return that moves positively in the portfolio. Portfolio is a collection of instocks which will be selected and determining the proportion of funds invested in each of these shares. Y Evaluation of Portfolio Performance
According to Tandelilin (2010),whether the portfolio that has been formed has been able to increase the possibility of achieving investment objectives from the rate of return and risk. In other words, is the portfolio return that has been formed able to compensate for the level of risk that must be borne by investors.
Furthermore, Tandelilin (2010),in two ways, namely: evaluating whether the return portfolio that has been formed is able to provide returns that exceed (above) other portfolio returns that are used as benchmarks and evaluate whether the returns obtained are is in accordance with the level of risk borne.
Risk Adjusted Performance
The development of the concept of portfolio performance measu1960s, which was pioneered by William Sharpe, Treynor, and Michael Jensen. This concept is based on the theory of the Capital Market. These three measures are known as Composite (Riskmeasures of portfolio performance because they combine return and risk in a 2003). The three sizes are as follows:
Index Sharpe
The Sharpe index was developed by William Sharpe and is often referred to as the reward to variability ratio. This index bases its calculabenchmark. In this method, portfolio performance is measured by comparing the portfolio risk premium and the portfolio risk expressed by the standard deviation (total risk)
The sharpe index presented as :
Where, is Sharpe Index, average return, Average Risk Free Rate of Return, .
TR
PP
FRRS
PS
HJBS Volume 4 No 1
DOI: http://doi.org/10.26487/hjbs.v4i2
feb.unhas.ac.id/jurnal/index.php/HJBS/index
return in the future. Investment also implies a current commitment to money or other resources with the hope of getting a profit in the future. So it can be concluded, investment is a commitment in allocating an asset in the form of money or other resources with the hope and calculation of getting positive growth results in the future.
Investment Process To achieve the objectives of investment, requires a decisioprocess, so that the decision has taken into account the expected return and also the risks faced. The basis for investment decisions is the level of expected return, the level of risk, and the relationship
Portfolio theory was first introduced by Markowitz in 1952. Portfolio is defined as a series of combinations of several assets that are invested and held by investors, both individuals and
). Portfolio theory developed by Markowitz presents an appropriate risk measurement for investors, showing how to choose one alternative asset to diversify and reduce
Portfolio describes ownership of investment instruments that are prepared with careful anning to achieve optimal results through risk distribution. The portfolio has several alternative
variations with the consideration that investors must see the risk and rate of return that moves positively in the portfolio. Portfolio is a collection of investments involving the identification of stocks which will be selected and determining the proportion of funds invested in each of these
Evaluation of Portfolio Performance
to Tandelilin (2010), portfolio performance assessment is to find out and analyze whether the portfolio that has been formed has been able to increase the possibility of achieving investment objectives from the rate of return and risk. In other words, is the portfolio return that has
for the level of risk that must be borne by investors.
Furthermore, Tandelilin (2010), explains that portfolio performance evaluation is carried out in two ways, namely: evaluating whether the return portfolio that has been formed is able to provide
s that exceed (above) other portfolio returns that are used as benchmarks and evaluate whether the returns obtained are is in accordance with the level of risk borne.
The development of the concept of portfolio performance measurement occurred in the late 1960s, which was pioneered by William Sharpe, Treynor, and Michael Jensen. This concept is based on the theory of the Capital Market. These three measures are known as Composite (Risk
because they combine return and risk in a calculation (Jogiyanto, e three sizes are as follows:
The Sharpe index was developed by William Sharpe and is often referred to as the reward to variability ratio. This index bases its calculation on the concept of the capital market line as a benchmark. In this method, portfolio performance is measured by comparing the portfolio risk premium and the portfolio risk expressed by the standard deviation (total risk)
The sharpe index presented as :
, is Sharpe Index, average return, Average Risk Free Rate of Return, . PR FR
Volume 4 No 1 February 2022
10.26487/hjbs.v4i2.514
44
return in the future. Investment also implies a current commitment to money or other resources with cluded, investment is a commitment in
allocating an asset in the form of money or other resources with the hope and calculation of getting
Investment Process To achieve the objectives of investment, requires a decision-making expected return and also the risks faced. The
basis for investment decisions is the level of expected return, the level of risk, and the relationship
Portfolio theory was first introduced by Markowitz in 1952. Portfolio is defined as a series of combinations of several assets that are invested and held by investors, both individuals and
arkowitz presents an appropriate risk measurement for investors, showing how to choose one alternative asset to diversify and reduce
Portfolio describes ownership of investment instruments that are prepared with careful anning to achieve optimal results through risk distribution. The portfolio has several alternative
variations with the consideration that investors must see the risk and rate of return that moves vestments involving the identification of
stocks which will be selected and determining the proportion of funds invested in each of these
find out and analyze whether the portfolio that has been formed has been able to increase the possibility of achieving investment objectives from the rate of return and risk. In other words, is the portfolio return that has
for the level of risk that must be borne by investors.
explains that portfolio performance evaluation is carried out in two ways, namely: evaluating whether the return portfolio that has been formed is able to provide
s that exceed (above) other portfolio returns that are used as benchmarks and evaluate whether
rement occurred in the late 1960s, which was pioneered by William Sharpe, Treynor, and Michael Jensen. This concept is based on the theory of the Capital Market. These three measures are known as Composite (Risk-adjusted)
calculation (Jogiyanto,
The Sharpe index was developed by William Sharpe and is often referred to as the reward to tion on the concept of the capital market line as a
benchmark. In this method, portfolio performance is measured by comparing the portfolio risk
, is Sharpe Index, average return, Average Risk Free Rate of Return, . TR
feb.unhas.ac.id/jurnal/index.php/HJBS/index
Standard Deviation. The Sharpe index can be used to rank several portfoli
higher the Sharpe index of a portfolio compared to other portfolios, the better the performance of the portfolio.
Treynor Index The Treynor index is a portfolio performance measure developed by Jack Treynor and this
index is often referred to as the reward to volatility ratio. Like the Sharpe index, portfolio performance on the Treynor index is seen by linking the level of portfolio return with the magnitude of the risk of the portfolio. The assumption used that the portfothat is considered relevant is systematic risk (measured by beta)
The treynor index is presented as : Where , is Treynor Index, is Average Return, is Average Risk Free Rate of Return,
and is Beta. The lower the value of Treynor Index, the lower of the performance.
Jensen Index This method is based on the concept of a securities market line which is a line connecting the
market portfolio with risk-free investment opportunities. The Jensedifference between the actual rate of return obtained by the portfolio and the expected rate of return if the portfolio is on the capital market line.
The similarity between the Jensen Index and the Treynor index is that performance measure indices use the securities market line as the basis for making equations. Meanwhile, the difference is that the Treynor index is the same as the slope of the line connecting the portfolio position with risk-free returnportfolio returns and portfolio returns that are not manage in a special way (only following market returns) basis. The formula of Jensen is :
Where , is Jensen Index, is Average Return,
and is Beta Portfolio.
LQ 45 The LQ45 index consists of 45 stocks on the Indonesia Stock Exchange (IDX) with high
liquidity and large market capitalization and passed the selection according to severacriteria. The following criteria were used to select the 45 stocks included in the LQ45 index as follows: 1. Included in the top 60 of the total stock transactions in the regular market (average transaction
value over the last 12 months). 2. Order by market capitalization (average of market capitalization value over the last 12 months).3. Has been listed on the IDX for at least 3 months.4. Financial condition and growth prospects of the company, frequency and number of trading days
in the regular market.
The LQ45 Index was first launched on February 24, 1997. The base day for its calculation is July 13, 1994 with a base value of 100. Furthermore, the Stock Exchange regularly monitors the progress of the performance of each of the 45 stocks included in the Exchange of shares is carried out every 6 months, namely at the beginning of February and August. If there are shares that do not meet the selection criteria, those shares are removed from the index
P
PP ˆ
FRRT
PTP
pp FRR FR RJ M
PJ
P
HJBS Volume 4 No 1
DOI: http://doi.org/10.26487/hjbs.v4i2
feb.unhas.ac.id/jurnal/index.php/HJBS/index
he Sharpe index can be used to rank several portfolios based on their performance. The higher the Sharpe index of a portfolio compared to other portfolios, the better the performance of the
The Treynor index is a portfolio performance measure developed by Jack Treynor and this is often referred to as the reward to volatility ratio. Like the Sharpe index, portfolio
performance on the Treynor index is seen by linking the level of portfolio return with the magnitude of the risk of the portfolio. The assumption used that the portfolio is well diversified so that the risk that is considered relevant is systematic risk (measured by beta)
The treynor index is presented as :
Where , is Treynor Index, is Average Return, is Average Risk Free Rate of Return, is Beta. The lower the value of Treynor Index, the lower of the performance.
This method is based on the concept of a securities market line which is a line connecting the free investment opportunities. The Jensen Index is an index that shows the
difference between the actual rate of return obtained by the portfolio and the expected rate of return ortfolio is on the capital market line. The similarity between the Jensen Index and the Treynor index is that
performance measure indices use the securities market line as the basis for making equations. Meanwhile, the difference is that the Treynor index is the same as the slope of the line connecting
free returns, while the Jensen index is the difference between portfolio returns and portfolio returns that are not manage in a special way (only following market returns) basis. The formula of Jensen is :
Where , is Jensen Index, is Average Return, is Average Risk Free Rate of Return,
The LQ45 index consists of 45 stocks on the Indonesia Stock Exchange (IDX) with high liquidity and large market capitalization and passed the selection according to severacriteria. The following criteria were used to select the 45 stocks included in the LQ45 index as
Included in the top 60 of the total stock transactions in the regular market (average transaction
market capitalization (average of market capitalization value over the last 12 months).Has been listed on the IDX for at least 3 months. Financial condition and growth prospects of the company, frequency and number of trading days
The LQ45 Index was first launched on February 24, 1997. The base day for its calculation is July 13, 1994 with a base value of 100. Furthermore, the Stock Exchange regularly monitors the progress of the performance of each of the 45 stocks included in the calculation of the LQ45 Index. Exchange of shares is carried out every 6 months, namely at the beginning of February and August. If there are shares that do not meet the selection criteria, those shares are removed from the index
PRFR
p
PR FR
Volume 4 No 1 February 2022
10.26487/hjbs.v4i2.514
45
os based on their performance. The higher the Sharpe index of a portfolio compared to other portfolios, the better the performance of the
The Treynor index is a portfolio performance measure developed by Jack Treynor and this is often referred to as the reward to volatility ratio. Like the Sharpe index, portfolio
performance on the Treynor index is seen by linking the level of portfolio return with the magnitude lio is well diversified so that the risk
Where , is Treynor Index, is Average Return, is Average Risk Free Rate of Return, is Beta. The lower the value of Treynor Index, the lower of the performance.
This method is based on the concept of a securities market line which is a line connecting the n Index is an index that shows the
difference between the actual rate of return obtained by the portfolio and the expected rate of return
The similarity between the Jensen Index and the Treynor index is that the two portfolio performance measure indices use the securities market line as the basis for making equations. Meanwhile, the difference is that the Treynor index is the same as the slope of the line connecting
s, while the Jensen index is the difference between portfolio returns and portfolio returns that are not manage in a special way (only following market
is Average Risk Free Rate of Return,
The LQ45 index consists of 45 stocks on the Indonesia Stock Exchange (IDX) with high liquidity and large market capitalization and passed the selection according to several selection criteria. The following criteria were used to select the 45 stocks included in the LQ45 index as
Included in the top 60 of the total stock transactions in the regular market (average transaction
market capitalization (average of market capitalization value over the last 12 months).
Financial condition and growth prospects of the company, frequency and number of trading days
The LQ45 Index was first launched on February 24, 1997. The base day for its calculation is July 13, 1994 with a base value of 100. Furthermore, the Stock Exchange regularly monitors the
calculation of the LQ45 Index. Exchange of shares is carried out every 6 months, namely at the beginning of February and August. If there are shares that do not meet the selection criteria, those shares are removed from the index

feb.unhas.ac.id/jurnal/index.php/HJBS/index
calculation and replaced with other shares that meet the criteria.
Conceptual Model
Figure 1
This study will analyze the performance of the stock portfolio included in the LQ 45 stock using the Risk Adjusted Performance technique. This techniqa portfolio with its return. However, in this technique, portfolio performance is analyzed by considering risk factors. The Risk adjusted performance technique consists of 3 techniques, namely the Sharpe, Treynor, and Jensen indexes. risk factors, it is necessary to standardize performance measures in the form of Ztransformation before it can be tested whether there are differences in stock portfolio performbetween the three models.
The detail of H0 and H1 as the two main possible hypotheses describe below:H0 : There is no difference in the performance of stock portfolio
analyzed using the Sharpe, Treynor, and Jensen methoH1 : There are differences in the performance of stock portfolio
analyzed using the Sharpe, Treynor, and Jensen methods
RESEARCH METHOD
Location and Research Design This research was conducted in Indonesia Stock Excha
quantitative. The time need in this research was from November to
Population or Samples The population in this study is all companies listed on the LQ 45 Index in the period 2016
until 2020. The sample of this population is determined by using purposive sampling. According to Tashakkor et al. (2020) purposive sampling is a sampling technique that the researcher first identifies the subgroups of the population of interest and then selects cases from each submanner. This allows the researcher to discover and describe in detail characteristics that are similar or different across the strata or subgroups. Refers to this point the researcher create a specific criteria such as: 1. The samples only the stocks included in LQ 45 in 2016 until 2020.2. Companies that are consistently listed on the LQ45 stock list during the periods3. Companies that consistently publish audited annual financial reports in 2016
Sharpe
Theoretical Review
HJBS Volume 4 No 1
DOI: http://doi.org/10.26487/hjbs.v4i2
feb.unhas.ac.id/jurnal/index.php/HJBS/index
ith other shares that meet the criteria.
Figure 1: The Conceptual Model
This study will analyze the performance of the stock portfolio included in the LQ 45 stock using the Risk Adjusted Performance technique. This technique not only assesses the performance of a portfolio with its return. However, in this technique, portfolio performance is analyzed by considering risk factors. The Risk adjusted performance technique consists of 3 techniques, namely
d Jensen indexes. Although the three forms of measurement both consider risk factors, it is necessary to standardize performance measures in the form of Ztransformation before it can be tested whether there are differences in stock portfolio perform
The detail of H0 and H1 as the two main possible hypotheses describe below:There is no difference in the performance of stock portfolio listed in the LQ 45analyzed using the Sharpe, Treynor, and Jensen methods.
There are differences in the performance of stock portfolio listed in the LQ 45analyzed using the Sharpe, Treynor, and Jensen methods
This research was conducted in Indonesia Stock Exchange. This type of Research is the quantitative. The time need in this research was from November to December 2021.
The population in this study is all companies listed on the LQ 45 Index in the period 2016 this population is determined by using purposive sampling. According to
sampling is a sampling technique that the researcher first identifies the subgroups of the population of interest and then selects cases from each subgroup in a purposive manner. This allows the researcher to discover and describe in detail characteristics that are similar or different across the strata or subgroups. Refers to this point the researcher create a specific criteria
y the stocks included in LQ 45 in 2016 until 2020. ompanies that are consistently listed on the LQ45 stock list during the periods
Companies that consistently publish audited annual financial reports in 2016- 2020.
Jensen
Research Result
Stock LQ 45
Empirical Review
Stock Performance Analysis
Treynor
Volume 4 No 1 February 2022
10.26487/hjbs.v4i2.514
46
This study will analyze the performance of the stock portfolio included in the LQ 45 stock ue not only assesses the performance of
a portfolio with its return. However, in this technique, portfolio performance is analyzed by considering risk factors. The Risk adjusted performance technique consists of 3 techniques, namely
Although the three forms of measurement both consider risk factors, it is necessary to standardize performance measures in the form of Z-Score transformation before it can be tested whether there are differences in stock portfolio performance
The detail of H0 and H1 as the two main possible hypotheses describe below: listed in the LQ 45 which was
listed in the LQ 45 which were
nge. This type of Research is the 2021.
The population in this study is all companies listed on the LQ 45 Index in the period 2016 this population is determined by using purposive sampling. According to
sampling is a sampling technique that the researcher first identifies group in a purposive
manner. This allows the researcher to discover and describe in detail characteristics that are similar or different across the strata or subgroups. Refers to this point the researcher create a specific criteria
ompanies that are consistently listed on the LQ45 stock list during the periods. 2020.
Empirical Review

feb.unhas.ac.id/jurnal/index.php/HJBS/index
Data Collection Method
The type of data collected in this research is secondary data. The secondary data were gathered from books, literature, articles, journals, an all relevant literature from the library and internet. the main data that is used in this research is the financial data fromand reported from the company listed in LQ 45. Source of the data in this research based on the financial data from closing price of stock in Yahoo Finance and also level of interest rate from SBI Bank Indonesia.
Data Analysis Method Formation of a Portfolio Using the Single I
Before being able to determine the optimal level of return and risk level of a portfolio based on a single index model, the stock portfolio must be compiled first. The data needed to compileoptimal stock portfolio based on the single index model in this study are riskmonthly closing price data for the stocks sampled in the 2016
Measurement of Stock Portfolio Performance with Sharpe, Treynor, a1. Sharpe Index
Sharpe index is the average comparison between the difference in average portfolio return and risk free rate of return with total risk of portfolio.
2. Treynor Index Treynor index is the average between the difference in averagfree rate of return with portfolio beta.
3. Jensen Alpha Jensen alpha is the difference between portfolio rates of return with risk free rate of return plus portfolio excess return that has been multiplied with beta
4. Portfolio Comparison Using Statistical TestsConsidering that the performance measures for each method have different characteristics, in this case each method does not have the same maximum performance limit, it is necessary to transform to standardize the performance measure by using the Z(standardized). Z-score is a way of converting data values into standardized scores which have a mean value equal to zero and a standard deviation equal to one. After all the data is in the form the data can be tested differently using One Way of Variance by Rank with Kruskalusing a non-parametric test because the data in this study has been standardized with the Ztransformation. parametric. This test is carried out tand standard deviation due to the Z
EMPIRICAL RESULTS
Descriptive Statistics
Sharpe Index
Table 1. Optimal portfolio formation using single Index model
ISSUER CODE 2016 BBCA -0.8866 BBNI -0.6864 BBRI -0.9244 BBTN -0.2877 INCO 0.0269 PTBA 0.3449 UNTR -1.3174 WIKA -0.5550
HJBS Volume 4 No 1
DOI: http://doi.org/10.26487/hjbs.v4i2
feb.unhas.ac.id/jurnal/index.php/HJBS/index
ata collected in this research is secondary data. The secondary data were gathered from books, literature, articles, journals, an all relevant literature from the library and internet. the main data that is used in this research is the financial data from IDX which is described and reported from the company listed in LQ 45. Source of the data in this research based on the financial data from closing price of stock in Yahoo Finance and also level of interest rate from SBI
f a Portfolio Using the Single Index Model Method Before being able to determine the optimal level of return and risk level of a portfolio based
on a single index model, the stock portfolio must be compiled first. The data needed to compileoptimal stock portfolio based on the single index model in this study are risk-free return rate data and monthly closing price data for the stocks sampled in the 2016-2020 study period.
Measurement of Stock Portfolio Performance with Sharpe, Treynor, and Jensen Indices.
Sharpe index is the average comparison between the difference in average portfolio return and risk free rate of return with total risk of portfolio.
Treynor index is the average between the difference in average return of the portfolio and risk free rate of return with portfolio beta.
Jensen alpha is the difference between portfolio rates of return with risk free rate of return plus portfolio excess return that has been multiplied with beta portfolio. Portfolio Comparison Using Statistical Tests Considering that the performance measures for each method have different characteristics, in this case each method does not have the same maximum performance limit, it is necessary to
the performance measure by using the Z-score transformation
score is a way of converting data values into standardized scores which have a mean value equal to zero and a standard deviation equal to one. After all the data is in the form the data can be tested differently using One Way of Variance by Rank with Kruskal
parametric test because the data in this study has been standardized with the Ztransformation. parametric. This test is carried out to avoid any similarity in the mean (mean) and standard deviation due to the Z-Score transformation when using the one-way Anova test
Optimal portfolio formation using single Index model
2017 2018 2019 2020 -0.6096 -0.7861 -1.0271 -0.6192-0.0266 -0.7029 -0.9197 -0.3120-0.3024 -0.7707 -0.7780 -0.39510.1463 -0.5554 -0.8062 -0.1213-0.2916 -0.2161 -0.2799 -0.1148-0.4866 0.0116 -1.0335 -0.4188-0.2011 -0.8385 -0.9743 -0.2587-1.2972 -0.1749 -0.2936 -0.1103
Volume 4 No 1 February 2022
10.26487/hjbs.v4i2.514
47
ata collected in this research is secondary data. The secondary data were gathered from books, literature, articles, journals, an all relevant literature from the library and
IDX which is described and reported from the company listed in LQ 45. Source of the data in this research based on the financial data from closing price of stock in Yahoo Finance and also level of interest rate from SBI
Before being able to determine the optimal level of return and risk level of a portfolio based on a single index model, the stock portfolio must be compiled first. The data needed to compile an
free return rate data and
nd Jensen Indices.
Sharpe index is the average comparison between the difference in average portfolio return and
e return of the portfolio and risk
Jensen alpha is the difference between portfolio rates of return with risk free rate of return plus
Considering that the performance measures for each method have different characteristics, in this case each method does not have the same maximum performance limit, it is necessary to
score transformation
score is a way of converting data values into standardized scores which have a mean value equal to zero and a standard deviation equal to one. After all the data is in the form of a Z-score, the data can be tested differently using One Way of Variance by Rank with Kruskal-Wallish
parametric test because the data in this study has been standardized with the Z-Score o avoid any similarity in the mean (mean)
way Anova test.
Average 0.6192 -0.7857 0.3120 -0.5295 0.3951 -0.6341 0.1213 -0.3248 0.1148 -0.1751 0.4188 -0.3165 0.2587 -0.7180 0.1103 -0.4862
feb.unhas.ac.id/jurnal/index.php/HJBS/index
Source: Data Processed, 2021
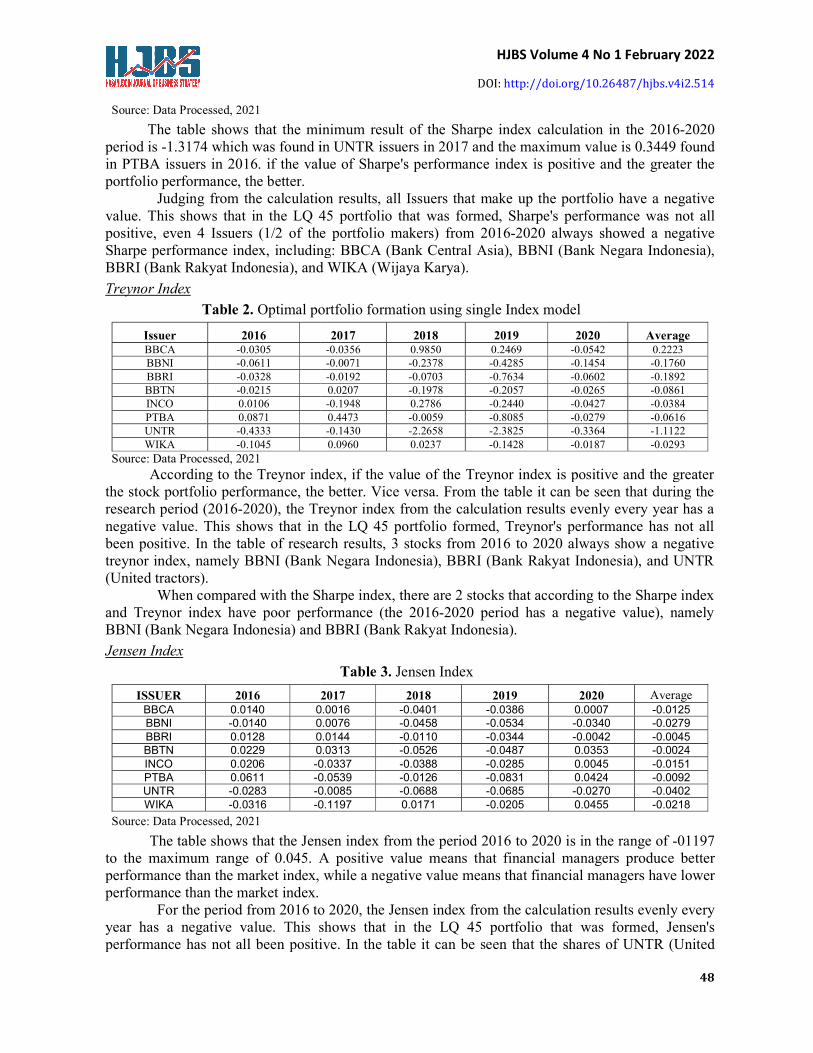
The table shows that the minimum result of the Sharpe index calculation in the 2016period is -1.3174 which was found in UNTR issuers in 2017 and the maximum value is 0.3449 found in PTBA issuers in 2016. if the value of Sharpe's performance index is positive aportfolio performance, the better.
Judging from the calculation results, all Issuers that make up the portfolio have a negative value. This shows that in the LQ 45 portfolio that was formed, Sharpe's performance was not all positive, even 4 Issuers (1/2 of the portfolio makers) from 2016Sharpe performance index, including: BBCA (Bank Central AsiaBBRI (Bank Rakyat Indonesia), and WIKA (Wijaya Karya).
Treynor Index
Table 2. Optimal portfolio formation using single Index model
Issuer 2016 BBCA -0.0305 BBNI -0.0611 BBRI -0.0328 BBTN -0.0215 INCO 0.0106 PTBA 0.0871 UNTR -0.4333 WIKA -0.1045
Source: Data Processed, 2021 According to the Treynor index, if the value of the Treynor index is positive and the greater
the stock portfolio performance, the better. Vice versa. From the table it can be seen that during the research period (2016-2020), the Treynor index from the calculation results evenly every year has a negative value. This shows that in the LQ 45 portfolio formed, Treynor's performance has not all been positive. In the table of research results, 3 stocks from 2016 to 2020 always treynor index, namely BBNI (Bank Negara Indonesia), BBRI (Bank Rakyat Indonesia), (United tractors).
When compared with the Sharpe index, there are 2 stocks that according to the Sharpe index and Treynor index have poor performancBBNI (Bank Negara Indonesia) and BBRI (Bank Rakyat Indonesia
Jensen Index
ISSUER 2016 2017BBCA 0.0140 0.0016BBNI -0.0140 0.0076BBRI 0.0128 0.0144BBTN 0.0229 0.0313INCO 0.0206 -0.0337PTBA 0.0611 -0.0539UNTR -0.0283 -0.0085WIKA -0.0316 -0.1197
Source: Data Processed, 2021 The table shows that the Jensen index from the period 2016 to 2020 is in the range of
to the maximum range of 0.045. A pperformance than the market index, while a negative value means that financial managers have lower performance than the market index.
For the period from 2016 to 2020, the Jensen index from the cayear has a negative value. This shows that in the LQ 45 portfolio that was formed, Jensen's performance has not all been positive. In the table it can be seen that the sha
HJBS Volume 4 No 1
DOI: http://doi.org/10.26487/hjbs.v4i2
feb.unhas.ac.id/jurnal/index.php/HJBS/index
shows that the minimum result of the Sharpe index calculation in the 20161.3174 which was found in UNTR issuers in 2017 and the maximum value is 0.3449 found
in PTBA issuers in 2016. if the value of Sharpe's performance index is positive a
Judging from the calculation results, all Issuers that make up the portfolio have a negative value. This shows that in the LQ 45 portfolio that was formed, Sharpe's performance was not all
en 4 Issuers (1/2 of the portfolio makers) from 2016-2020 always showed a negative ing: BBCA (Bank Central Asia), BBNI (Bank Negara Indonesia
BBRI (Bank Rakyat Indonesia), and WIKA (Wijaya Karya).
timal portfolio formation using single Index model
2017 2018 2019 2020 -0.0356 0.9850 0.2469 -0.0542 -0.0071 -0.2378 -0.4285 -0.1454 -0.0192 -0.0703 -0.7634 -0.0602 0.0207 -0.1978 -0.2057 -0.0265 -0.1948 0.2786 -0.2440 -0.0427 0.4473 -0.0059 -0.8085 -0.0279 -0.1430 -2.2658 -2.3825 -0.3364 0.0960 0.0237 -0.1428 -0.0187
According to the Treynor index, if the value of the Treynor index is positive and the greater the stock portfolio performance, the better. Vice versa. From the table it can be seen that during the
20), the Treynor index from the calculation results evenly every year has a negative value. This shows that in the LQ 45 portfolio formed, Treynor's performance has not all been positive. In the table of research results, 3 stocks from 2016 to 2020 always treynor index, namely BBNI (Bank Negara Indonesia), BBRI (Bank Rakyat Indonesia),
When compared with the Sharpe index, there are 2 stocks that according to the Sharpe index and Treynor index have poor performance (the 2016-2020 period has a negative value), namely BBNI (Bank Negara Indonesia) and BBRI (Bank Rakyat Indonesia).
Table 3. Jensen Index
2017 2018 2019 2020 0.0016 -0.0401 -0.0386 0.00070.0076 -0.0458 -0.0534 -0.03400.0144 -0.0110 -0.0344 -0.00420.0313 -0.0526 -0.0487 0.03530.0337 -0.0388 -0.0285 0.00450.0539 -0.0126 -0.0831 0.04240.0085 -0.0688 -0.0685 -0.02700.1197 0.0171 -0.0205 0.0455
The table shows that the Jensen index from the period 2016 to 2020 is in the range of to the maximum range of 0.045. A positive value means that financial managers produce better performance than the market index, while a negative value means that financial managers have lower
For the period from 2016 to 2020, the Jensen index from the calculation results evenly every
year has a negative value. This shows that in the LQ 45 portfolio that was formed, Jensen's performance has not all been positive. In the table it can be seen that the shares of UNTR (United
Volume 4 No 1 February 2022
10.26487/hjbs.v4i2.514
48
shows that the minimum result of the Sharpe index calculation in the 2016-2020 1.3174 which was found in UNTR issuers in 2017 and the maximum value is 0.3449 found
in PTBA issuers in 2016. if the value of Sharpe's performance index is positive and the greater the
Judging from the calculation results, all Issuers that make up the portfolio have a negative value. This shows that in the LQ 45 portfolio that was formed, Sharpe's performance was not all
2020 always showed a negative BBNI (Bank Negara Indonesia),
Average 0.2223 -0.1760 -0.1892 -0.0861 -0.0384 -0.0616 -1.1122 -0.0293
According to the Treynor index, if the value of the Treynor index is positive and the greater the stock portfolio performance, the better. Vice versa. From the table it can be seen that during the
20), the Treynor index from the calculation results evenly every year has a negative value. This shows that in the LQ 45 portfolio formed, Treynor's performance has not all been positive. In the table of research results, 3 stocks from 2016 to 2020 always show a negative treynor index, namely BBNI (Bank Negara Indonesia), BBRI (Bank Rakyat Indonesia), and UNTR
When compared with the Sharpe index, there are 2 stocks that according to the Sharpe index 2020 period has a negative value), namely
Average 0.0007 -0.0125 0.0340 -0.0279 0.0042 -0.0045 0.0353 -0.0024 0.0045 -0.0151 0.0424 -0.0092 0.0270 -0.0402 0.0455 -0.0218
The table shows that the Jensen index from the period 2016 to 2020 is in the range of -01197 ositive value means that financial managers produce better
performance than the market index, while a negative value means that financial managers have lower
lculation results evenly every year has a negative value. This shows that in the LQ 45 portfolio that was formed, Jensen's
res of UNTR (United

feb.unhas.ac.id/jurnal/index.php/HJBS/index
Tractors) during the observation period from 2016 to 2020 showed negative results.
Statistical Test a. Z-score Transformation
The purpose of this research is to find out whether the three performance measurement models are different or there is no difference for the same group, so first looof each performance measurement. The standard value will be calculated using each relative number with the standardized model (Z-Score transformation). Zinto standardized scores which have deviation equal to 1 (one) .
Portfolio performance measurement using the Sharpe, Treynor, and Jensen methods will have different index number characteristics from each other so that they cannot be ceach other directly, so it is necessary to standardize performance measures that can be used to compare portfolio performance measurements using the Sharpe, Treynor, and Jensen with Ztransformation (standardized). The Zcalculated by different methods.
The portfolio performance measurement using the Shape method has a minimum performance score with a Z-Score of While the maximum performance score with a Z2017. The highest Z-Score value is the first rank, namely INCO and the lowest Znamely WIKA, is the last rank.
For the Treynor method, it has a minimum perfestablished by BBRI issuers in 2019 and a maximum performance score of 1.7171 formed by BBCA issuers in 2018. Thus, the BBCA portfolio is ranked 1 and the BBRI Portfolio is in on the last rank.
The portfolio performance measurement using the Jensen method has a minimum performance score with a Z-Score of While the maximum score with a Z-BBNI portfolio what happened in 2017 will be ranked 1st and WIKA's portfolio that occurred in 2017 will be the last rank.
b. Kruskal Wallish Test
Table
Chi-Square Df
Asymp. Sig. a. Kruskal Wallis Test b. Grouping Variable: METODE
Source: Data Processed, 2021 c. Mean Rank
Method Performance SHARPE
TREYNORJENSEN
Total
Source: Data Processed, 2021
DISCUSSION
The optimal portfolio will contaratios will not be included in the optimal portfolio.
HJBS Volume 4 No 1
DOI: http://doi.org/10.26487/hjbs.v4i2
feb.unhas.ac.id/jurnal/index.php/HJBS/index
eriod from 2016 to 2020 showed negative results.
The purpose of this research is to find out whether the three performance measurement models are different or there is no difference for the same group, so first look for the standard value of each performance measurement. The standard value will be calculated using each relative number
Score transformation). Z-score is a way of converting data values into standardized scores which have a means (average) value equal to 0 (zero) and a standard
Portfolio performance measurement using the Sharpe, Treynor, and Jensen methods will have different index number characteristics from each other so that they cannot be ceach other directly, so it is necessary to standardize performance measures that can be used to compare portfolio performance measurements using the Sharpe, Treynor, and Jensen with Ztransformation (standardized). The Z-Score values will show the range of each performance measure
The portfolio performance measurement using the Shape method has a minimum Score of -1.7529 formed by the issuer WIKA which occurred in 2017.
e maximum performance score with a Z-Score of 1.5197 was formed by the issuer INCO in Score value is the first rank, namely INCO and the lowest Z
For the Treynor method, it has a minimum performance score with a Zestablished by BBRI issuers in 2019 and a maximum performance score of 1.7171 formed by BBCA issuers in 2018. Thus, the BBCA portfolio is ranked 1 and the BBRI Portfolio is in on the last rank.
ance measurement using the Jensen method has a minimum Score of -1.7049 formed by the issuer WIKA which occurred in 2017.
-Score of 1.4319 formed by the issuer of BBNI in 2017. Then the lio what happened in 2017 will be ranked 1st and WIKA's portfolio that occurred in
Table 4. Kruskal Wallish Uji test Performance
Table 5. Mean Rank N
SHARPE 40 TREYNOR 40
JENSEN 40 Total 120
The optimal portfolio will contain stocks that have a high ERB ratio value. Stocks with low ratios will not be included in the optimal portfolio.
Volume 4 No 1 February 2022
10.26487/hjbs.v4i2.514
49
eriod from 2016 to 2020 showed negative results.
The purpose of this research is to find out whether the three performance measurement k for the standard value
of each performance measurement. The standard value will be calculated using each relative number score is a way of converting data values
a means (average) value equal to 0 (zero) and a standard
Portfolio performance measurement using the Sharpe, Treynor, and Jensen methods will have different index number characteristics from each other so that they cannot be compared with each other directly, so it is necessary to standardize performance measures that can be used to compare portfolio performance measurements using the Sharpe, Treynor, and Jensen with Z-Score
l show the range of each performance measure
The portfolio performance measurement using the Shape method has a minimum 1.7529 formed by the issuer WIKA which occurred in 2017.
Score of 1.5197 was formed by the issuer INCO in Score value is the first rank, namely INCO and the lowest Z-Score value,
ormance score with a Z-Score of -1.7852 established by BBRI issuers in 2019 and a maximum performance score of 1.7171 formed by BBCA issuers in 2018. Thus, the BBCA portfolio is ranked 1 and the BBRI Portfolio is in on the last rank.
ance measurement using the Jensen method has a minimum 1.7049 formed by the issuer WIKA which occurred in 2017.
Score of 1.4319 formed by the issuer of BBNI in 2017. Then the lio what happened in 2017 will be ranked 1st and WIKA's portfolio that occurred in
.004 2
.998
Mean Rank 60.23 60.63 60.65
in stocks that have a high ERB ratio value. Stocks with low

feb.unhas.ac.id/jurnal/index.php/HJBS/index
Based on the data analysis that has been done, 8 stocks are included in the optimal portfolio category in the research sample for the 2016BBTN, INCO, PTBA, UNTR, and WIKA. This result is mainly supported by the calculation of the cutoff point (C*) of 0.0039 which is the limiting level. The 8 companies are included in the optimal portfolio because the ERB of the shares is greater than the
The purpose of investing in stocks is to make a profit. In order to provide the expected or maximum profit, the selected stock must have a positive expected return and the 8 selected stocks have a positive expected return value which means that it will produce the expected profit in the form of capital gains (the difference in profit from the current stock investment price with stock price of the previous period) so that the 8 shares are profi
On the other hand, investing in stocks is a risky investment. Stock prices can go up but they can also go down. This shows that investment is faced with uncertainty. From this description, risk can be interpreted as the possibility that the expected profit.
Judging from the calculation results, all Issuers that make up the portfolio have a negative value. This shows that in the LQ 45 portfolio that was formed, Sharpe's performance was not apositive, even 4 Issuers (1/2 of the portfolio makers) from 2016Sharpe performance index, including: BBCA (Bank Central Asia),BBRI (Bank Rakyat Indonesia), and WIKA (Wijaya Karya
Meanwhile, in the table of research resultsalways shows a negative Treynor index, namelyRakyat Indonesia), and UNTR (United tractorsstocks that according to the Sharpe index and Treynor index have poor performance (the 2016period has a negative value), namelyIndonesia).
Finally, the Jensen index from the results of cavalue. This shows that in the LQ 45 portfolio that was formed, Jensen's performance has not all been positive. In the table it can be seen that the shaperiod from 2016 to 2020 showed negative results.
The test results with the Kruskalwith a probability of 0.998. So, it can be seen that the test probability 0.05. These results indicate that there is no significant difference between the tests using the Sharpe, Treynor, and Jensen methods. Thus the hypothesis H0 is accepted and H1 in this study is rejected.
By looking at the difference between the three mean ranks, the Treynor method is the one that shows the most consistency in the differences between the three measurements because Treynor has the lowest difference in mean rank against Sharpe and Jensen. The difference between the mean ranks is shown not to exceed the critical value of 30.124 so this shows thin measuring portfolio performance are relatively consistent in measuring stock portfolio performance, especially when used in measuring stock portfolio performance on the IDX.
CONCLUSION This study aims to determine whether or not there are differences in the performance of the LQ 45 stock portfolio which were analyzed using 3 different methods, namely Sharpe, Treynor, and Jensen. The results concluded that there is no significant difference between the test evaluated. However, Treynor's shows the consistent result from performance measurement than that of the othmethods.
REFERENCE Atik, B. P., & Sri, L., (2016)., Analisis Penilaian Kinerja Portofoli
HJBS Volume 4 No 1
DOI: http://doi.org/10.26487/hjbs.v4i2
feb.unhas.ac.id/jurnal/index.php/HJBS/index
Based on the data analysis that has been done, 8 stocks are included in the optimal portfolio category in the research sample for the 2016-2020 period. These stocks are: BBCA, BBNI, BBRI, BBTN, INCO, PTBA, UNTR, and WIKA. This result is mainly supported by the calculation of the
point (C*) of 0.0039 which is the limiting level. The 8 companies are included in the optimal e the ERB of the shares is greater than the cutoff point value.
The purpose of investing in stocks is to make a profit. In order to provide the expected or maximum profit, the selected stock must have a positive expected return and the 8 selected stocks
ave a positive expected return value which means that it will produce the expected profit in the form of capital gains (the difference in profit from the current stock investment price with stock price of the previous period) so that the 8 shares are profitable to buy.
On the other hand, investing in stocks is a risky investment. Stock prices can go up but they can also go down. This shows that investment is faced with uncertainty. From this description, risk can be interpreted as the possibility that the level of profit obtained deviates from the level of
Judging from the calculation results, all Issuers that make up the portfolio have a negative value. This shows that in the LQ 45 portfolio that was formed, Sharpe's performance was not apositive, even 4 Issuers (1/2 of the portfolio makers) from 2016-2020 always showed a negative Sharpe performance index, including: BBCA (Bank Central Asia), BBNI (Bank Negara IndonesiaBBRI (Bank Rakyat Indonesia), and WIKA (Wijaya Karya).
, in the table of research results, the Treynor index of 3 stocks from 2016 treynor index, namely BBNI (Bank Negara Indonesia
Rakyat Indonesia), and UNTR (United tractors). When compared with the Sharpe index, thstocks that according to the Sharpe index and Treynor index have poor performance (the 2016period has a negative value), namely BBNI (Bank Negara Indonesia) and BBRI (Bank Rakyat
Finally, the Jensen index from the results of calculations evenly every year has a negative value. This shows that in the LQ 45 portfolio that was formed, Jensen's performance has not all been positive. In the table it can be seen that the shares of UNTR (United Tractors) during the observation
rom 2016 to 2020 showed negative results. e test results with the Kruskal-Wallish test on the three methods obtained X2 = 0.004
with a probability of 0.998. So, it can be seen that the test probability 0.05. These results indicate that ficant difference between the tests using the Sharpe, Treynor, and Jensen methods.
Thus the hypothesis H0 is accepted and H1 in this study is rejected. By looking at the difference between the three mean ranks, the Treynor method is the one
most consistency in the differences between the three measurements because Treynor has the lowest difference in mean rank against Sharpe and Jensen. The difference between the mean ranks is shown not to exceed the critical value of 30.124 so this shows that the 3 measurements used in measuring portfolio performance are relatively consistent in measuring stock portfolio performance, especially when used in measuring stock portfolio performance on the IDX.
This study aims to determine whether or not there are differences in the performance of the LQ 45 alyzed using 3 different methods, namely Sharpe, Treynor, and Jensen.
The results concluded that there is no significant difference between the test evaluated. However, Treynor's shows the consistent result from performance measurement than that of the oth
Analisis Penilaian Kinerja Portofolio Saham Dengan Menggunakan
Volume 4 No 1 February 2022
10.26487/hjbs.v4i2.514
50
Based on the data analysis that has been done, 8 stocks are included in the optimal portfolio 20 period. These stocks are: BBCA, BBNI, BBRI,
BBTN, INCO, PTBA, UNTR, and WIKA. This result is mainly supported by the calculation of the point (C*) of 0.0039 which is the limiting level. The 8 companies are included in the optimal
The purpose of investing in stocks is to make a profit. In order to provide the expected or maximum profit, the selected stock must have a positive expected return and the 8 selected stocks
ave a positive expected return value which means that it will produce the expected profit in the form of capital gains (the difference in profit from the current stock investment price with stock price
On the other hand, investing in stocks is a risky investment. Stock prices can go up but they can also go down. This shows that investment is faced with uncertainty. From this description, risk
level of profit obtained deviates from the level of
Judging from the calculation results, all Issuers that make up the portfolio have a negative value. This shows that in the LQ 45 portfolio that was formed, Sharpe's performance was not all
2020 always showed a negative BBNI (Bank Negara Indonesia),
reynor index of 3 stocks from 2016 to 2020 BBNI (Bank Negara Indonesia), BBRI (Bank
). When compared with the Sharpe index, there are 2 stocks that according to the Sharpe index and Treynor index have poor performance (the 2016-2020
BBRI (Bank Rakyat
lculations evenly every year has a negative value. This shows that in the LQ 45 portfolio that was formed, Jensen's performance has not all been
) during the observation
Wallish test on the three methods obtained X2 = 0.004 with a probability of 0.998. So, it can be seen that the test probability 0.05. These results indicate that
ficant difference between the tests using the Sharpe, Treynor, and Jensen methods.
By looking at the difference between the three mean ranks, the Treynor method is the one most consistency in the differences between the three measurements because Treynor
has the lowest difference in mean rank against Sharpe and Jensen. The difference between the mean at the 3 measurements used
in measuring portfolio performance are relatively consistent in measuring stock portfolio performance, especially when used in measuring stock portfolio performance on the IDX.
This study aims to determine whether or not there are differences in the performance of the LQ 45 alyzed using 3 different methods, namely Sharpe, Treynor, and Jensen.
The results concluded that there is no significant difference between the test evaluated. However, Treynor's shows the consistent result from performance measurement than that of the other two
o Saham Dengan Menggunakan
feb.unhas.ac.id/jurnal/index.php/HJBS/index
Metode Sharpe Measure Dan Treynor Measure Pada SahamYang Terdaftar Di Bursa Efek Indonesia (Bei) Periode 2008SPOT., Vol. 9, No. 1
Jogiyanto., (2003)., Teori Portofolio dan Analisis InveKaptan, S. S., (2001)., Investment ManagementKrisna, B., Febrian., & Azib.,
menggunakan Metode Sharpe, Treynor, dan Jensen, Sortino, dan R(Studi Kasus pada Saham JII di Bursa Efek Indonesia Tahun 2015
Rissa, Y., N., & Azib. A., (2017)., Sharpe, Treynor, dan Jensen
Sunariyah., (2006)., Pengantar Pengetahuan PasaTandelilin., (2010)., Portofolio Dan Investasi Teori Dan Aplikasi
Kanisius. Tashakkori, A., Johnson, R. B., & Teddlie, C.
Integrating quantitative and qualitative approaches in the social and behavioral sciences. Sage publications.
Utami, E., T., (2010)., Cara Cerdas Berinvestasi via Online Trading, Cetakan PertamaTransmedia Pustaka.
HJBS Volume 4 No 1
DOI: http://doi.org/10.26487/hjbs.v4i2
feb.unhas.ac.id/jurnal/index.php/HJBS/index
Metode Sharpe Measure Dan Treynor Measure Pada Saham-Saham Indeks Sektoral Yang Terdaftar Di Bursa Efek Indonesia (Bei) Periode 2008-2010.
Teori Portofolio dan Analisis Investasi. Yogyakarta: BPFE Yogyakarta.Investment Management. Sarup & Son, New Delhi.
(2021)., Analisis Perbandingan Kinerja Portofolio Saham menggunakan Metode Sharpe, Treynor, dan Jensen, Sortino, dan R(Studi Kasus pada Saham JII di Bursa Efek Indonesia Tahun 2015-2019)
Analisis Kinerja portofolio Saham dengan menggunakan Indeks Sharpe, Treynor, dan Jensen.
Pengantar Pengetahuan Pasar Modal. Yogyakarta: UPP AMP YKPN.Portofolio Dan Investasi Teori Dan Aplikasi. Edisi Pertama. Yogyakarta :
Tashakkori, A., Johnson, R. B., & Teddlie, C., (2020)., Foundations of mixed methods research: ive and qualitative approaches in the social and behavioral
. Sage publications. Cara Cerdas Berinvestasi via Online Trading, Cetakan Pertama
Volume 4 No 1 February 2022
10.26487/hjbs.v4i2.514
51
Saham Indeks Sektoral 2010. Jurnal CKI On
. Yogyakarta: BPFE Yogyakarta.
Analisis Perbandingan Kinerja Portofolio Saham menggunakan Metode Sharpe, Treynor, dan Jensen, Sortino, dan Rasio Informasi
2019). Analisis Kinerja portofolio Saham dengan menggunakan Indeks
. Yogyakarta: UPP AMP YKPN. . Edisi Pertama. Yogyakarta :
Foundations of mixed methods research: ive and qualitative approaches in the social and behavioral
Cara Cerdas Berinvestasi via Online Trading, Cetakan Pertama. Jakarta:
Related Documents