HAL Id: tel-01692151 https://tel.archives-ouvertes.fr/tel-01692151 Submitted on 24 Jan 2018 HAL is a multi-disciplinary open access archive for the deposit and dissemination of sci- entific research documents, whether they are pub- lished or not. The documents may come from teaching and research institutions in France or abroad, or from public or private research centers. L’archive ouverte pluridisciplinaire HAL, est destinée au dépôt et à la diffusion de documents scientifiques de niveau recherche, publiés ou non, émanant des établissements d’enseignement et de recherche français ou étrangers, des laboratoires publics ou privés. Evaluation of voxel-based analysis in stroke using multiparametric MR imaging Rui He To cite this version: Rui He. Evaluation of voxel-based analysis in stroke using multiparametric MR imaging. Human health and pathology. Université Grenoble Alpes, 2016. English. NNT : 2016GREAS026. tel- 01692151

Welcome message from author
This document is posted to help you gain knowledge. Please leave a comment to let me know what you think about it! Share it to your friends and learn new things together.
Transcript
HAL Id: tel-01692151https://tel.archives-ouvertes.fr/tel-01692151
Submitted on 24 Jan 2018
HAL is a multi-disciplinary open accessarchive for the deposit and dissemination of sci-entific research documents, whether they are pub-lished or not. The documents may come fromteaching and research institutions in France orabroad, or from public or private research centers.
L’archive ouverte pluridisciplinaire HAL, estdestinée au dépôt et à la diffusion de documentsscientifiques de niveau recherche, publiés ou non,émanant des établissements d’enseignement et derecherche français ou étrangers, des laboratoirespublics ou privés.
Evaluation of voxel-based analysis in stroke usingmultiparametric MR imaging
Rui He
To cite this version:Rui He. Evaluation of voxel-based analysis in stroke using multiparametric MR imaging. Humanhealth and pathology. Université Grenoble Alpes, 2016. English. �NNT : 2016GREAS026�. �tel-01692151�
THÈSE Pour obtenir le grade de
DOCTEUR DE LA COMMUNAUTÉ UNIVERSITÉ GRENOBLE ALPES Spécialité : Biotechnologie, Instrumentation, Signal et Imagerie pour la Biologie, la Médecine et l’Environnement (BIS) Arrêté ministériel : 7 août 2006 Présentée par
Rui HE Thèse dirigée par Alexandre KRAINIK et codirigée par Emmanuel BARBIER préparée au sein de l’Institut des Neurosciences de Grenoble dans l'École Doctorale Ingénierie pour la Santé, la Cognition et l’Environnement
Évaluation d'une analyse voxel à voxel dans
l'accident vasculaire cérébral à partir d'images IRM multiparamétriques
Thèse soutenue publiquement le 30 novembre 2016 à Grenoble devant le jury composé de :
M. Thomas TOURDIAS Professeur CHU de Bordeaux Rapporteur / Président du jury M. Samuel VALABLE Chargé de recherche CNRS Rapporteur M. Mathieu HATT Chargé de recherche INSERM U1101 Examinateur M. Benjamin LEMASSON Chargé de recherche INSERM U1216 Examinateur M. Alexandre KRAINIK Professeur CHU Grenoble Alpes Directeur de thèse M. Emmanuel BARBIER Directeur de recherche INSERM U1216 Co-directeur de thèse


Acknowledgements
I would like to express my sincerest gratitude to my supervisors, Prof. Alexandre Krainik and Dr. Emmanuel Barbier. They have given their time generously, been a great sources of guidance, support and encouragement. They have led me into multidisciplinary environment, taught me principles of research, and how to carry out new ideas. In the preparation of the thesis, they have spent much time reading through each draft and provided me brilliant advice. Under their extraordinary supervision, the progress in the manuscript writing is obvious. Without their patient instruction, insightful criticism and expert comments, the completion of this thesis would not have been possible.
Many thanks go to Dr. Benjamin Lemasson. He has supervised me since the project started and gave me invaluable help. I gained my experience in operation when I followed him in the animal experiments. Furthermore, I do appreciate that the technical support such as software package update and analytical method improvement he provided kindly. For the revision of my thesis and article, he has also put considerable time and effort into them.
Special thanks should go to Dr. Olivier Detante and Dr. Anaïck Moisan for their direct help in the research of stroke, both clinical and preclinical, and also for their valuable comments on my thesis and article. The experiment data and clinical information they provided were crucial to continue my research.
I gratefully acknowledge the help of Dr. Julien Bouvier and Dr. Duc Ha Hoang, who have offered me useful suggestions in my academic studies.
I would like to thank Dr. Olivier Heck for his help in the analysis of clinical data and the collection of typical cases for my thesis.
I am also deeply indebted to all the other people in our team of Institut des Neurosciences (GIN) for their direct and indirect help.
My gratitude also extends to Prof. Jean-François LeBas (Centre Hospitalier Universitaire Grenoble Alpes) and Prof. Daniel Plusquellec (UMR CNRS 6226, Institut des Sciences Chimiques de Rennes), for their advisory opinions and assistance before I came to follow my PhD study. I would like to acknowledge my indebtedness to Prof. Ming Zhu (Shanghai Children’s Medical Center), for his support and help in the preparation of all the materials for the PhD application.
Finally, I am indebted to my parents for their continuous support and encouragement during my stay in France.


Declaration
I declare that this thesis was composed by myself, that the work contained herein is my own except where explicitly stated otherwise in the content, and that the achievement in research has not been submitted for any other degree or professional qualification except as specified.
Rui He


Table of contents
1 Introduction of stroke ....................................................................................... 1 1.1 Definition .............................................................................................. 1 1.2 Cause of stroke...................................................................................... 1 1.3 Consequence and symptoms of ischemic stroke..................................... 1 1.4 Etiology of ischemic stroke ................................................................... 2
1.4.1 Cerebrovascular anatomy ............................................................... 2 1.4.1.1 Cerebrovascular anatomy of human .................................. 2 1.4.1.2 Cerebrovascular anatomy of the rat ................................... 3
1.4.2 Subtype of ischemic stroke ............................................................. 4 1.4.2.1 Subtype classification methods of ischemic stroke ............ 4
1.4.2.1.1 TOAST ...................................................................... 5 1.4.2.1.2 ASCO ........................................................................ 5 1.4.2.1.3 CCS ........................................................................... 5
1.4.2.2 TIA ................................................................................... 6 1.4.3 Infarct patterns of ischemic stroke .................................................. 6
1.5 Evolution of ischemic stroke ................................................................. 7 1.5.1 Phase of ischemic stroke ................................................................. 7 1.5.2 Pathophysiology of ischemic stroke ................................................ 8
1.5.2.1 The neurovascular unit ...................................................... 8 1.5.2.2 Kinetics of ischemia .......................................................... 9 1.5.2.3 Microcirculation .............................................................. 11 1.5.2.4 Hypoxia ........................................................................... 11 1.5.2.5 Excitotoxicity................................................................... 11 1.5.2.6 Peri-infarct depolarizations .............................................. 11 1.5.2.7 Calcium toxicity.............................................................. 12 1.5.2.8 Inflammation .................................................................. 13 1.5.2.9 Apoptosis ........................................................................ 13 1.5.2.10 Edema and permeability change of blood-brain barrier .... 14
1.6 From emergent to preventive strategies for ischemic stroke ................. 16 1.6.1 Target of ischemic stroke therapies ............................................... 16 1.6.2 Demand of development in stroke therapies .................................. 17 1.6.3 Thrombolysis therapy ................................................................... 17 1.6.4 Endovascular therapy ................................................................... 18
1.6.4.1 Intraarterial thrombolysis and correlative clinical trials ... 19 1.6.4.2 Endovascular mechanical approaches and correlative clinical trials ............................................................................................20
1.6.5 Neuroprotection therapy ............................................................... 21
1.6.6 Development space and prospect of regenerative stroke therapy ... 23 1.6.7 Potential of biotherapies for post-stroke plasticity and neural repair...................... .................................................................................... 25 1.6.8 Cell sources and cell therapy products .......................................... 26
1.6.8.1 Cell types selection ......................................................... 26 1.6.8.2 The ideal route for cell delivery....................................... 27 1.6.8.3 Comprehensive evaluation of cell therapy for stroke ....... 27
2 Magnetic resonance imaging in ischemic stroke ............................................ 29 2.1 Clinical standard MRI sequences for acute ischemic stroke ................. 29
2.1.1 Fluid attenuated inversion recovery imaging ................................. 31 2.1.2 Three-dimensional time-of-flight magnetic resonance angiography................................................................................. ................. 31 2.1.3 Two-dimensional gradient recalled echo (T2*)- weighted imaging 33 2.1.4 Diffusion associated imaging approaches...................................... 34
2.1.4.1 Diffusion-weighted imaging and apparent diffusion coefficient................................................................................................34 2.1.4.2 Diffusion-based structural connectivity ........................... 37
2.1.5 Perfusion imaging ........................................................................ 39 2.1.5.1 The fundamental of dynamic susceptibility contrast MRI perfusion technique ............................................................................. 40 2.1.5.2 Blood supply relative perfusion parameters ..................... 42 2.1.5.3 Arrival time relative perfusion parameters ....................... 43
2.2 Advanced MRI techniques for clinical ischemic stroke........................ 49 2.2.1 Functional connectivity MRI application after ischemic stroke ..... 49 2.2.2 Cerebral vasoreactivity in ischemic stroke .................................... 52
2.3 Multiparametric MRI application in ischemic stroke ........................... 54 2.3.1 Mismatch of diffusion-weighted imaging / perfusion-weighted imaging...........................................................................................................54 2.3.2 Multiparametric routine clinical MRI selections ........................... 58
3 Overview of methods for MR imaging analysis ............................................. 63 3.1 Region of interest ................................................................................ 63 3.2 Histogram analysis .............................................................................. 64 3.3 Texture analysis .................................................................................. 65 3.4 Voxel-based analysis ........................................................................... 67
3.4.1 Principal of the parametric response map (PRM): a voxel-wise methodology .............................................................................................. 69 3.4.2 Applications of parametric response map in other diseases ........... 72
4 Challenges and fundamental objective .......................................................... 75 5 Evaluation of parametric response map to assess cell therapy effects after experimental stroke ............................................................................................... 79
5.1 Brief abstract ....................................................................................... 79 5.2 Introduction ........................................................................................ 79 5.3 Materials and methods ........................................................................ 81
5.3.1 Transient Middle Cerebral Artery occlusion (MCAo) model ......... 81 5.3.2 Experimental groups and intravenous administration of hMSCs ... 82 5.3.3 MRI experiments: acquisition ....................................................... 82
5.3.3.1 MRI experiments: data processing .................................. 82 5.3.3.2 Data analysis ................................................................... 83
5.3.3.2.1 Regions of interest (ROIs) definition ........................ 83 5.3.3.2.2 Whole-lesion analysis .............................................. 83 5.3.3.2.3 Parametric response map (PRM) analysis ................. 83 5.3.3.2.4 Statistical analysis .................................................... 84
5.4 Results ................................................................................................ 84 5.4.1 Evolution of lesion volume ........................................................... 84 5.4.2 Evolution of ADC......................................................................... 84 5.4.3 Evolution of CBV......................................................................... 85 5.4.4 Evolution of VSI .......................................................................... 86
5.5 Discussion ........................................................................................... 87 5.6 Conclusion .......................................................................................... 88 5.7 Acknowledgements and sources of funding ......................................... 88 5.8 Disclosure Statement ........................................................................... 88
6 Correlating clinical outcome with voxel-based quantitative multiparametric MRI analysis in chronic ischemic stroke .............................................................101
6.1 Brief abstract ......................................................................................101 6.2 Introduction .......................................................................................101 6.3 Subjects and methods .........................................................................102
6.3.1 Study population and study design...............................................102 6.3.2 Clinical assessment......................................................................103 6.3.3 MRI assessment ..........................................................................104 6.3.4 Data processing ...........................................................................104
6.3.4.1 Diffusion data processing ...............................................105 6.3.4.2 Perfusion data processing ...............................................105 6.3.4.3 Image registration ..........................................................106 6.3.4.4 Regions of interest.............................................................106
6.3.5 Imaging analysis ..........................................................................107 6.3.5.1 Whole-lesion analysis ....................................................107 6.3.5.2 Parametric response map (PRM) analysis .......................107
6.3.6 Statistical analysis .......................................................................107 6.4 Results ...............................................................................................108
6.4.1 Clinical outcome .........................................................................108 6.4.2 Imaging data ................................................................................109
6.4.2.1 Evolution of lesion volume ............................................109 6.4.2.2 Evolution of ADC ..........................................................109 6.4.2.3 Evolution of perfusion parameters ..................................109
6.4.3 Correlation between imaging and clinical data ............................. 111 6.5 Discussion .......................................................................................... 112
6.6 Conclusion ......................................................................................... 118 6.7 Acknowledgements ............................................................................ 118 6.8 Disclosure statement .......................................................................... 118
7 General conclusion and perspectives ............................................................135 7.1 General conclusion .............................................................................135
7.1.1 The assessment of stem cell therapeutic effects in preclinical application ................................................................................................135 7.1.2 The prediction of outcome in clinical application .........................136
7.2 Perspectives .......................................................................................137 8 MRI segmentation methods (Appendix 1) ....................................................143
8.1 Manual segmentation .........................................................................144 8.2 Automatic segmentation .....................................................................146
8.2.1 Intensity-based methods ..............................................................147 8.2.1.1 Thresholding ..................................................................147 8.2.1.2 Region growing .............................................................148 8.2.1.3 Edge detection ...............................................................149
8.2.2 Atlas-based methods ....................................................................150 8.2.2.1 Probabilistic atlas segmentation .....................................150 8.2.2.2 Label propagation ..........................................................151 8.2.2.3 Multi-atlas propagation ..................................................152 8.2.2.4 Classification .................................................................153 8.2.2.5 Clustering ......................................................................155
8.2.3 Artificial neural network..............................................................157 8.2.4 Surface-based methods ................................................................159 8.2.5 Hybrid segmentation methods .....................................................161 8.2.6 Other methods .............................................................................165
List of figures............................................................................................................169 List of tables..............................................................................................................173 Summary...................................................................................................................174 NIHSS (Appendix 2).................................................................................................179 mRS (Appendix 3)....................................................................................................185 Poster (Appendix 4)..................................................................................................189 CV (Appendix 5).......................................................................................................193 References.................................................................................................................199
List of abbreviations κNN - κ-nearest-neighbor
AC - anterior commissure
ADC - apparent diffusion coefficient
AIF - arterial input function
AIS - acute ischemic stroke
Ang - angiopoietin
ANN - artificial neural network
ASL - arterial spin labeling
ASM - angular second moment
ATPase - adenosine triphosphatase
AUC - area under curve
BBB - blood-brain barrier
BCL - B-cell lymphoma
BDNF - brain-derived neurotrophic factor
BOLD - blood oxygenation level dependent
BP - blood pressure
CBF - cerebral blood flow
CBV - cerebral blood volume
CCS - Causative Classification System
CDP - crossed-diameter product
CE-MRA - contrast-enhanced magnetic resonance angiography
CI - confidence interval
CMRO2 - cerebral metabolic rate of oxygen
COPD - chronic obstructive pulmonary disease
CoW - Circle of Willis
COX2 - cyclooxygenase 2
CSF - cerebrospinal fluid
CST - corticospinal tract
CT - computed tomography
CTA - computed tomography angiography
CVR - cerebral vasoreactivity[1], cerebrovascular reserve[2]
DEFUSE - Diffusion and Perfusion Imaging Evaluation for Understanding
Stroke Evolution
DIAS - Desmoteplase In Acute Ischemic Stroke
DSA - digital subtraction angiography
DSC - dynamic susceptibility contrast
DTI - diffusion tensor imaging
DWI - diffusion-weighted imaging
EM - expectation-maximization
ENT - entropy
EP - endothelial progenitors
EPC - endothelial progenitor cell
EPITHET - Echoplanar Imaging Thrombolytic Evaluation Trial
EPO - erythropoietin
ET - endovascular treatment
FA - fractional anisotropy
FCM - fuzzy C-means
fDM - functional diffusion map
FLAIR - fluid attenuated inversion recovery
fMRI - functional magnetic resonance imaging
FOV - field of view
fSAD - functional small airway disease
FWHM - full width at half maximum
GBM - glioblastoma
GCSF - granulocyte-colony stimulating factor
Gd-DOTA - Gadolinium 1,4,7,10-tetraazacyclododecane-1,4,7,10-tetraacetic
acid
Gd-DTPA - Gadolinium Diethyl-Triamine-Penta-Acetic acid
GF - growth factor
GLCM - grey-level co-occurrence matrix
GluR2 - glutamate receptor 2
GM - grey matter
GMM - Gaussian mixture model
GRE - gradient recalled echo
HIE - hypoxic-ischemic encephalopathy
hMSC - human mesenchymal stem cell
HNSCC - head and neck squamous cell carcinoma
HSC - hematopoietic stem cell
HSP - heat-shock protein
HT - hemorrhagic transformation
HVS - hyperintense vessels sign
IA - intraarterial
IAT - intraarterial treatment
IC - intracerebral[1], infarct core[2]
ICA - internal carotid artery
ICH - intracerebral hemorrhage
ICP - intracranial pressure
IL - interleukin
IMS-2 - Interventional Management of Stroke phase 2
iNOS - inducible nitric oxide synthase
IP3 - inositol tri-phosphate
IV - intravenous
LoG - Laplacian-of-Gaussian
LP - label propagation
LRP - lipoprotein receptor-related protein
LVQ - learning vector quantization
MA - multi-atlas propagation
MAP - maximum a posteriori

MCA - middle cerebral artery
MCAo - middle cerebral artery occlusion
MCI - malignant cerebral infarction
MD - mean diffusivity
MEG - magnetoencephalography
MEMα - Minimum Essential Medium with α modification
MGESE - multi-gradient echo and spin echo
MNC - mononuclear cell
mPRM - multiparametric respons map
MR CLEAN - Multicenter Randomized Clinical trial of Endovascular treatment
for Acute ischemic stroke in the Netherlands
MR RESCUE - Mechanical Retrieval and Recanalization of Stroke Clots Using
Embolectomy
MRA - magnetic resonance angiography
MRF - Markov random field
MRI - magnetic resonance imaging
mRS - modified Rankin Scale
MSC - mesenchymal stem cell
MTT - mean transit time
NAC - neoadjuvant chemotherapy
NAWM - normal appearing white matter
NECT - non-enhanced computed tomography
NIHSS - National Institutes of Health Stroke Scale
NO - nitric oxide
NOS - nitric oxide synthase
NSC - neural stem cell
NSOPT - nonsurgical organ preservation therapy
NVU - neurovascular unit
OEF - oxygen extraction fraction
oSVD - oscillation index regularized block-circulant singular value
decomposition
PA - probabilistic atlas
PBS - phosphate-buffered saline
PC - posterior commissure
PD - progressive disease
PDGF - platelet-derived growth factor
PDGFR-α - platelet-derived growth factor receptor α
PET - positron emission tomography
PICH - primary intracerebral hematoma
pMCAo - permanent middle cerebral artery occlusion
PP - pseudoprogression
PR - partial response
PRM - parametric response map
PROACT - Prourokinase for Acute Cerebral Thromboembolism
PTS - prothrombotic state
PV - partial volume
PWI - perfusion-weighted imaging
rCBF - regional cerebral blood flow
rCBV - regional cerebral blood volume
RECIST - Response Evaluation Criteria in Solid Tumors
RESTORE - reperfusion therapy in unclear-onset stroke based on MRI
evaluation
RF - radiofrequency
ROC - receiver operating characteristic
ROI - region of interest
ROS - reactive oxygen species
rt-PA - recombinant tissue plasminogen activator
SAH - subarachnoid hemorrhage
SD - stable disease[1], standard deviation[2]
SDF-1 - stromal-cell-derived factor-1

SEM - standard error mean
SI - signal intensity
SIAS - severe intracranial arterial stenosis
SOM - self-organizing map
SRI - serotonin reuptake inhibitor
STAIR - Stroke Therapy Academic Industry Roundtable
SVZ - subventricular zone
SWIFT PRIME - Solitaire with the Intention for Thrombectomy as Primary
Endovascular Treatment
T - Tesla
T2WI - T2-weighted imaging
TA - texture analysis
TAR - tissue-at-risk
TBSS - track-based spatial statistics
TGF-β1 - transforming growth factor-β1
TIA - transient ischemic attack
Tmax - time-to-maximum
tMCAo - transient middle cerebral artery occlusion
TOAST - Trial of Org 10172 in Acute Stroke Treatment
TOF - time-of-flight
t-PA - tissue plasminogen activator
TTP - time-to-peak
USPIO - ultrasmall superparamagnetic iron oxide particles
VBM - voxel-based morphometry
VEGF - vascular endothelial growth factor
VOI - volume-of-interest
VSI - vessel size index
WHASA - white matter hyperintensities automated segmentation algorithm
WM - white matter
WMH - white matter hyperintensities
Evaluation of voxel-based analysis in stroke using
multiparametric MR imaging
Summary:
Stroke is the leading cause of disability in adults. Beyond the narrow time window and
possible risks of thrombolysis and mechanical thrombectomy, cell-therapies have strong
potential. Reports showed that transplanted stem cells can enhance functional recovery
after ischemic stroke in rodent models.
To assess the mechanisms underlying the cell-therapy benefit after stroke, imaging is
necessary. Multiparametric magnetic resonance imaging (MRI), including
diffusion-weighted imaging (DWI) and perfusion-weighted imaging (PWI), has become the
gold standard to evaluate stroke characteristics. MRI also plays an important role in the
monitoring of cerebral tissue following stroke from the acute to the chronic phase.
However, the spatial heterogeneity of each stroke lesion and its dynamic reorganization
over time, which may be related to the effect of a therapy, remain a challenge for
traditional image analysis techniques. To evaluate the effect of new therapeutic strategies,
spatial and temporal lesion heterogeneities need to be more accurately characterized and
quantified.
The current image analysis techniques, based on mean values obtained from regions
of interest (ROIs), hide the intralesional heterogeneity. Histogram-based techniques
provide an evaluation of lesion heterogeneity but fail to yield spatial information. The
parametric response map (PRM) is an alternative, voxel-based analysis technique, which
has been established in oncology as a promising tool to better investigate parametric
changes over time at the voxel level which concern the therapeutic response or prognosis
of disease.
The PhD project was divided into two parts: a preclinical and a clinical study. The goal
of the first study was to evaluate the PRM analysis using MRI data collected after the
intravenous injection of human mesenchymal stem cells (hMSCs) in an experimental
stroke model. The apparent diffusion coefficient (ADC), cerebral blood volume (CBV) and
vessel size index (VSI) were mapped using 7T MRI. Two analytic procedures, the
standard whole-lesion approach and the PRM, were performed on data collected at 4 time
points in transient middle cerebral artery occlusion (MCAo) models treated with either
hMSC or vehicle and in sham animals. During the second PhD project, 6 MR parametric
maps (diffusion and perfusion maps) were collected in 30 stroke patients (PHRC
NCT00875654). MRI data, analyzed with both a classic mean value and a PRM
approaches, were correlated with the evaluation of functional recovery after stroke
measured with the National Institutes of Health Stroke Scale (NIHSS) and the modified
Rankin Scale (mRS) at 4 time points.
In both studies, PRM analysis of MR parametric maps reveals fine changes of the
lesion induced by a cell therapy (preclinical study) and correlate with long-term prognosis
(clinical study).
In conclusion, the PRM analysis could be used as an imaging biomarker of

therapeutic efficacy and of prognostic biomarker of stroke patients. Key words: magnetic resonance imaging, brain, diffusion, perfusion, parametric response map, cerebral ischemia, cell therapy, mesenchymal stem cells, prognostic biomarker

Évaluation d'une analyse voxel à voxel dans l'accident
vasculaire cérébral à partir d'images IRM multiparamétriques
Résumé:
L'accident vasculaire cérébral (AVC) est la principale cause de handicap acquis chez
l'adulte. Au-delà de l'étroite fenêtre thérapeutique et des risques éventuels de la
thrombolyse et de la thrombectomie mécanique, la thérapie cellulaire par cellules souches
présente un fort potentiel. Plusieurs études ont montré que les cellules souches
transplantées peuvent améliorer la récupération fonctionnelle après un AVC sur des
modèles de rongeurs.
L’imagerie multiparamétrique par résonance magnétique (IRM), qui inclue l'imagerie
de diffusion et de perfusion, est aujourd’hui le protocole standard pour caractériser l'AVC.
L'imagerie permet également de suivre in vivo les mécanismes sous-jacents de la
thérapie cellulaire après un AVC de la phase aigüe à la phase chronique. Cependant, la
quantification de l'hétérogénéité spatiale des lésions, clairement visible par IRM, reste un
défi à l'heure actuelle. En effet, les techniques d'analyses d'images utilisées en routine
sont basées sur le calcul des valeurs moyennes à partir de régions d'intérêts (ROI). Cette
technique par ROI ne peut pas refléter l'hétérogénéité intra-lésionnelle. C'est pourquoi, de
nouvelles stratégies d'analyses d'images doivent être développées et évaluées afin de
quantifier l'hétérogénéité des lésions ischémiques mais aussi pour suivre l'évolution de
cette hétérogénéité au cours du temps. Des approches utilisant des analyses par
histogramme permettent d'évaluer l'hétérogénéité des lésions mais perdent l'information
spatiale. Une alternative est l'utilisation d'une analyse d'image à l'échelle du voxel
appelée "Parametric Response Map (PRM)". Cet outil a été décrit comme plus sensible
que l'analyse par ROI dans le pronostic mais aussi dans le suivi thérapeutique chez des
patients porteurs de tumeurs cérébrales ou encore atteints d'hémorragies cérébrales.
Mon projet de thèse est divisé en deux parties: une étude préclinique chez le rat et
une étude clinique (PHRC NCT00875654). La première partie de ma thèse vise à évaluer
les changements physiopathologiques mesurés par l'IRM après un traitement par cellules
souches mésenchymateuses humaines (CSMh) sur un modèle d'AVC chez le rat. Des
animaux présentant une occlusion transitoire de l'artère cérébrale moyenne (oACM) ou
non (sham) ont été traités ou non par une injection de CSMh. Au cours de cette étude,
différents paramètres IRM ont été cartographiés en utilisant une IRM 7T (4 temps
d'imagerie): le coefficient apparent de diffusion (ADC), le volume sanguin cérébral (CBV)
et l'indice de taille des vaisseaux (VSI). Les cartes d'ADC, CBV et VSI ont été analysées
en utilisant l'approche classique par ROI mais aussi par PRM. L'objectif de cette étude
était de déterminer si l'analyse par PRM était capable de détecter plus précocement l'effet
des CSMh que l'analyse par ROI. Durant la seconde partie de ma thèse, 6 paramètres
IRM (imagerie de diffusion et de perfusion) ont été acquis chez 30 patients AVC. Les
données IRM, analysées par valeur moyenne classique et par PRM, ont été corrélées
avec des évaluations de la récupération fonctionnelle : le score NIHSS (National Institutes
of Health Stroke Score) et l'échelle de Rankin modifiée (mRS) mesurés à différents temps

post-ischémie. L’analyse PRM des cartes paramétriques IRM révèle des changements fins de la lésion et corrèle avec le pronostic à long terme après l’ischémie.
En conclusion, la PRM pourrait être utilisée comme biomarqueur d’efficacité thérapeutique (combinaison d’images IRM et d’outils innovants d’analyse d'images) et comme biomarqueur pronostique des patients AVC. Mots clés: imagerie résonance magnétique, cerveau, diffusion, perfusion, carte paramétrique de réponse, ischémie cérébrale, thérapie cellulaire, cellules souches mésenchymateuses, biomarqueur pronostique

1
Chapter 1
Introduction of stroke
1.1 Definition “Stroke” is termed to describe damage to the central nervous system such
as brain and spinal cord due to abnormalities in its blood supply (ischemia) or bleeding. It is classified as ischemic or hemorrhagic. By far, the most common subtype of stroke is ischemic also called cerebral infarction [Mozaffarian et al. 2016]. Ischemic stroke results from a transient or permanent insufficient or interrupted flow of cerebral blood flow that is restricted to the territory of a brain artery. The reduction in flow is, in most cases, typically caused by the occlusion of a cerebral artery either by an embolus or by local thrombosis [Taylor et al. 1996].
1.2 Cause of stroke Ischemic and hemorrhagic are the two main types of stroke. The former
one is far more common. Ischemic stroke accounts for around 80% of strokes, and its origin is divided into cardiogenic, arterosclerotic, lacunar, hemodynamic or cryptogenic source [Adams et al. 1993]. Another 15% of strokes are related to disruption of a cerebral artery resulting in intracerebral hemorrhage (ICH). Hypertension is the main source for ICH with other reasons such as specific blood vessel abnormalities [Rathore et al. 2013]. The acute ischemic stroke (AIS) may also be complicated by a hemorrhagic transformation notably by the use of anticoagulation [Marsh et al. 2016]. In this thesis, we will focus on ischemic stroke.
1.3 Consequence and symptoms of ischemic stroke Ischemic stroke caused by a sudden artery occlusion is one of the leading
causes of mortality and long-term disability worldwide. Statistics from the American Heart Association estimate an average of one stroke occurrence every 40 seconds in United States, amounting to approximately 795,000 people experiencing new or recurrent strokes per year. From the micro-aspect, if an appropriate therapy is not given, it is calculated that about 1.8 million neurons are lost every minute [Saver et al. 2006, Mijajlovic et al. 2014]. In view of the widespread public health impact of stroke and its profound impact on patients, stroke research has remained in the forefront [Go et al. 2014].
2
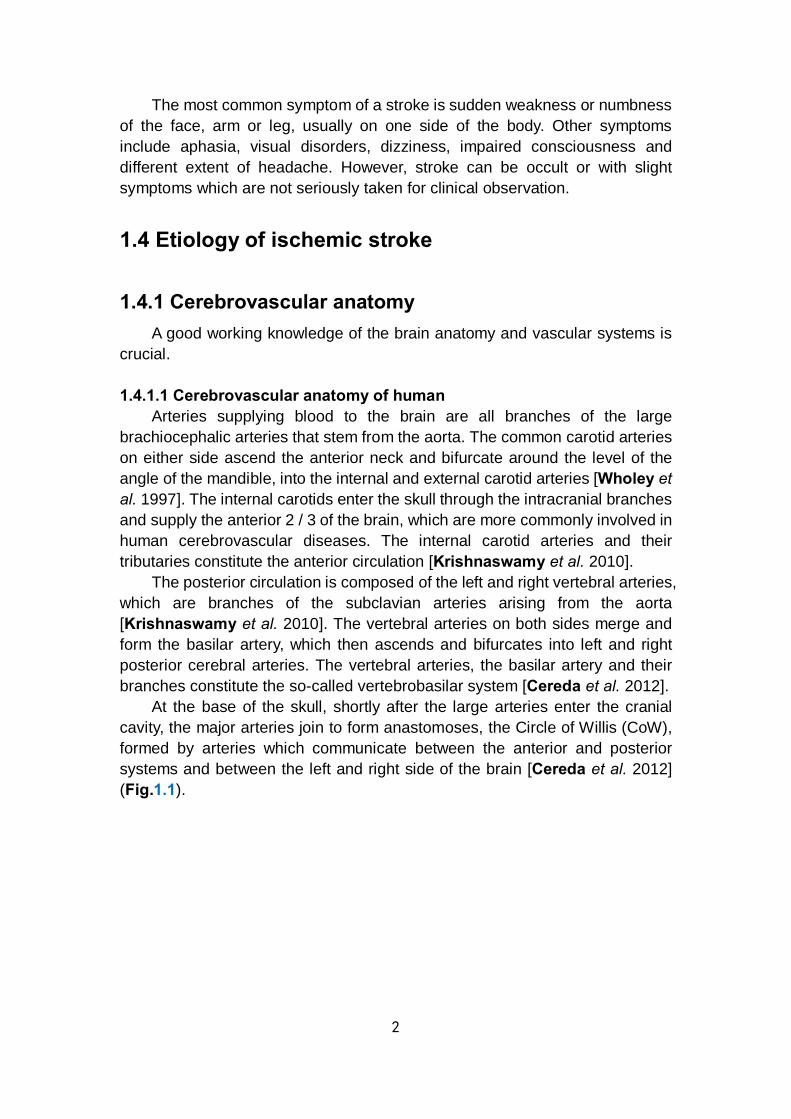
The most common symptom of a stroke is sudden weakness or numbness of the face, arm or leg, usually on one side of the body. Other symptoms include aphasia, visual disorders, dizziness, impaired consciousness and different extent of headache. However, stroke can be occult or with slight symptoms which are not seriously taken for clinical observation.
1.4 Etiology of ischemic stroke
1.4.1 Cerebrovascular anatomy A good working knowledge of the brain anatomy and vascular systems is
crucial. 1.4.1.1 Cerebrovascular anatomy of human
Arteries supplying blood to the brain are all branches of the large brachiocephalic arteries that stem from the aorta. The common carotid arteries on either side ascend the anterior neck and bifurcate around the level of the angle of the mandible, into the internal and external carotid arteries [Wholey et al. 1997]. The internal carotids enter the skull through the intracranial branches and supply the anterior 2 / 3 of the brain, which are more commonly involved in human cerebrovascular diseases. The internal carotid arteries and their tributaries constitute the anterior circulation [Krishnaswamy et al. 2010].
The posterior circulation is composed of the left and right vertebral arteries, which are branches of the subclavian arteries arising from the aorta [Krishnaswamy et al. 2010]. The vertebral arteries on both sides merge and form the basilar artery, which then ascends and bifurcates into left and right posterior cerebral arteries. The vertebral arteries, the basilar artery and their branches constitute the so-called vertebrobasilar system [Cereda et al. 2012].
At the base of the skull, shortly after the large arteries enter the cranial cavity, the major arteries join to form anastomoses, the Circle of Willis (CoW), formed by arteries which communicate between the anterior and posterior systems and between the left and right side of the brain [Cereda et al. 2012] (Fig.1.1).
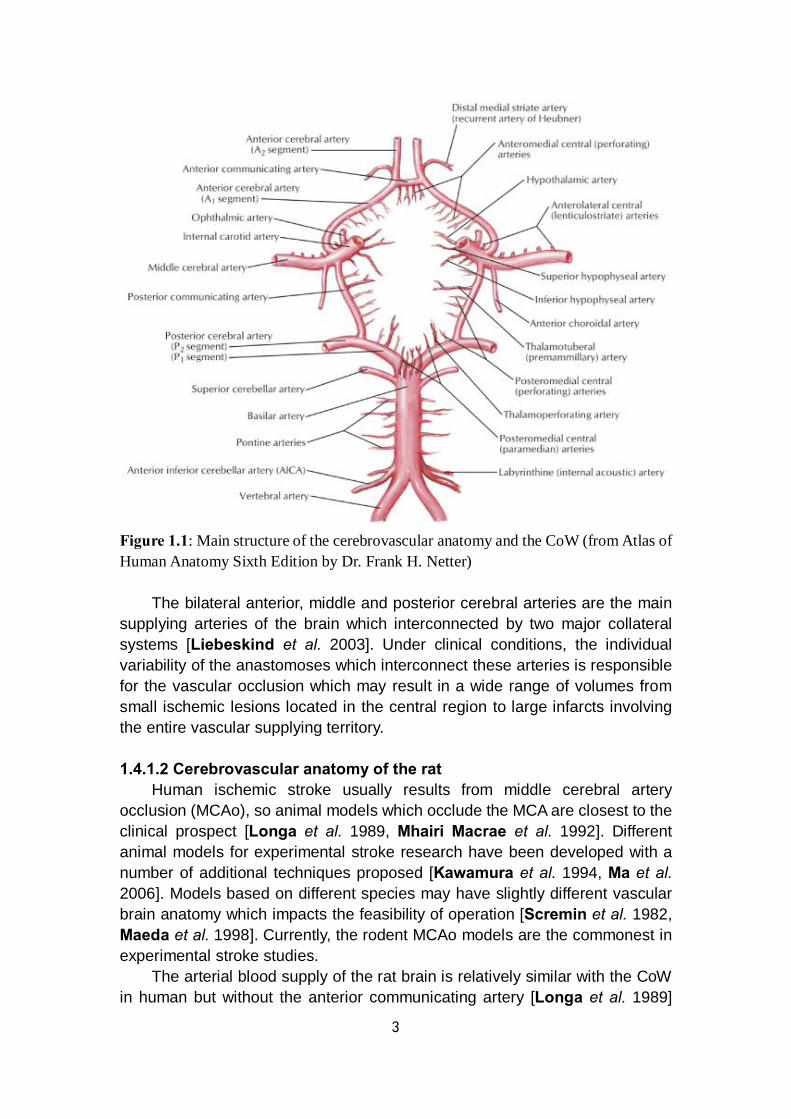
3
Figure 1.1: Main structure of the cerebrovascular anatomy and the CoW (from Atlas of Human Anatomy Sixth Edition by Dr. Frank H. Netter)
The bilateral anterior, middle and posterior cerebral arteries are the main supplying arteries of the brain which interconnected by two major collateral systems [Liebeskind et al. 2003]. Under clinical conditions, the individual variability of the anastomoses which interconnect these arteries is responsible for the vascular occlusion which may result in a wide range of volumes from small ischemic lesions located in the central region to large infarcts involving the entire vascular supplying territory. 1.4.1.2 Cerebrovascular anatomy of the rat
Human ischemic stroke usually results from middle cerebral artery occlusion (MCAo), so animal models which occlude the MCA are closest to the clinical prospect [Longa et al. 1989, Mhairi Macrae et al. 1992]. Different animal models for experimental stroke research have been developed with a number of additional techniques proposed [Kawamura et al. 1994, Ma et al. 2006]. Models based on different species may have slightly different vascular brain anatomy which impacts the feasibility of operation [Scremin et al. 1982, Maeda et al. 1998]. Currently, the rodent MCAo models are the commonest in experimental stroke studies.
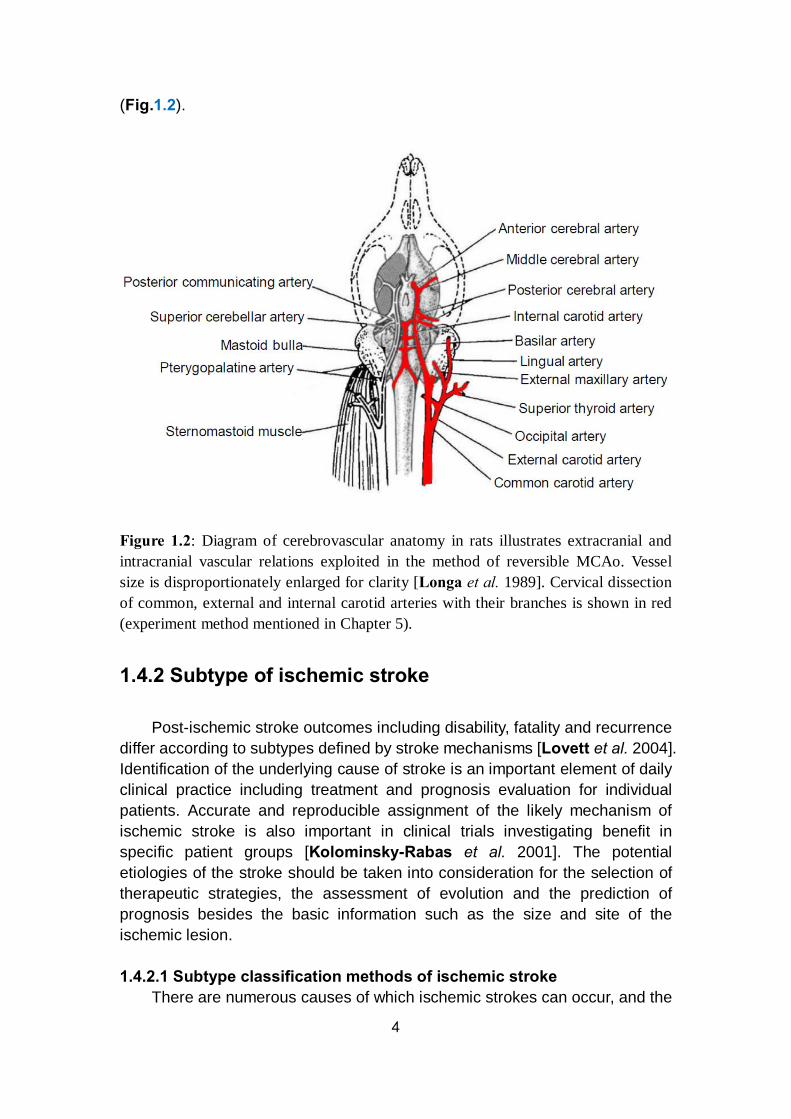
The arterial blood supply of the rat brain is relatively similar with the CoW in human but without the anterior communicating artery [Longa et al. 1989]
4
(Fig.1.2).
Figure 1.2: Diagram of cerebrovascular anatomy in rats illustrates extracranial and intracranial vascular relations exploited in the method of reversible MCAo. Vessel size is disproportionately enlarged for clarity [Longa et al. 1989]. Cervical dissection of common, external and internal carotid arteries with their branches is shown in red (experiment method mentioned in Chapter 5).
1.4.2 Subtype of ischemic stroke
Post-ischemic stroke outcomes including disability, fatality and recurrence differ according to subtypes defined by stroke mechanisms [Lovett et al. 2004]. Identification of the underlying cause of stroke is an important element of daily clinical practice including treatment and prognosis evaluation for individual patients. Accurate and reproducible assignment of the likely mechanism of ischemic stroke is also important in clinical trials investigating benefit in specific patient groups [Kolominsky-Rabas et al. 2001]. The potential etiologies of the stroke should be taken into consideration for the selection of therapeutic strategies, the assessment of evolution and the prediction of prognosis besides the basic information such as the size and site of the ischemic lesion. 1.4.2.1 Subtype classification methods of ischemic stroke
There are numerous causes of which ischemic strokes can occur, and the
5
various etiologies often result in different clinical presentations and characteristic appearance of the lesion on imaging. Several subclassification schemes for ischemic strokes have been proposed [Chen et al. 2012], including the Harvard Stroke Registry (1978) [Mohr et al. 1978], Trial of Org 10172 in Acute Stroke Treatment (TOAST) (1992) [Adams et al. 1993], Oxfordshire Community Stroke Project (1993) [Lindley et al. 1993], Causative Classification System (CCS) of stroke [Ay et al. 2005], A-S-C-O (phenotypic) classification (2009) [Marnane et al. 2010] and Chinese Ischemic Stroke Subclassification (2011) [Gao et al. 2011]. 1.4.2.1.1 TOAST
The TOAST classification is the most widely used and denotes five subtypes of ischemic stroke: 1) large-artery atherosclerosis, 2) cardioembolism, 3) small-vessel occlusion, 4) stroke of other determined etiology, and 5) stroke of undetermined etiologies which includes cases invoking more than one primary mechanism. Differentiation of this classification are based on clinical features, computed tomography (CT) / magnetic resonance imaging (MRI) data, cardiac imaging, duplex scanning of extracranial arteries, arteriography and laboratory tests for a prothrombotic state (PTS) [Adams et al. 1993].
The TOAST system promotes better understanding of different potentially contributory mechanisms in growing stroke patients [Lee et al. 2000]. 1.4.2.1.2 ASCO
The phenotype-based classification is defined by A-S-C-O: “A” for atherosclerosis, “S” for small vessel disease, “C” for cardiac source and “O” for other cause. Each of the four phenotypes is graded “1” to “3”. “1” for definitely a potential cause of the index stroke, “2” for causality uncertain and “3” for unlikely a direct cause of the index stroke. When the disease is completely absent, the grade is “0”. When grading is impossible due to insufficient definition caused by uncertain elements, the grade is “9” [Amarenco et al. 2009].
This phenotypic classification method also improves the capability to identify the most likely cause where multiple potential mechanisms are explored [Ay et al. 2007, Amarenco et al. 2009]. 1.4.2.1.3 CCS
The Causative Classification System (CCS) scheme also assigns objects into 5 categories according to the mechanisms: cardio-aortic, large artery atherosclerosis, small artery occlusion, other cause and undetermined. However, compared with TOAST, the CCS assigns the most likely subtype based on updated estimates of stroke risk associated with specific cardiac and vascular pathologies, clinical features or imaging parameters known to be more commonly associated with particular stroke mechanisms [Marnane et al.

6
2010].
Results from previous studies illustrate that the feasibility of a harmonized combined classification system should be improved for clinical stroke research based on the specific strength of each single classification system [Weimar et al. 2016]. 1.4.2.2 TIA
The transient ischemic attack (TIA), also as known as “mini stroke”, is a special type of stroke. It means a transient episode of neurological dysfunction caused by the blood flow interruption for a short period of time that tends to resolve itself quickly without acute infarction, usually within 10–20 minutes and less than 24 h before disappearing [Easton et al. 2009]. TIA occurs with a high rate, nearly 7.5 million cases worldwide each year. Although TIA is considered as benign by the public, it is still a strong warning sign of an ischemic stroke and should not be ignored to prevent a more serious attack [Giles et al. 2007, Merwick et al. 2010].
TIA is also associated with high risk of recurrent ischemic events. According to the guidelines, it recommends that patients with TIA should undergo neuroimaging evaluation within 24 h of symptom onset, by CT or MRI, preferably by MRI, especially diffusion-weighted imaging (DWI, technique mentioned in Chapter 2) because it is more sensitive than CT. However, the strength of CT is its availability and ability to quickly exclude ICH. Generally, a follow-up MRI should be performed after the emergent CT because of its superiority in identifying cerebral infarction. A lack of evidence of infarction on MRI in patients who have symptoms consistent with cerebral ischemia distinguishes TIA from minor stroke. The noninvasive imaging approaches of the intracranial and cervical arteries such as CT or MR angiography, or transcranial Doppler should also be performed within 48 h [Simmons et al. 2012]. Refinement in brain imaging and better understanding of the time course of TIA-related lesions may lead to the further potential of the MRI signature associated with transient ischemia [Olivot et al. 2011, Souillard-Scemama et al. 2015].
1.4.3 Infarct patterns of ischemic stroke Infarct patterns (especially following MCAo) can be categorized into 3
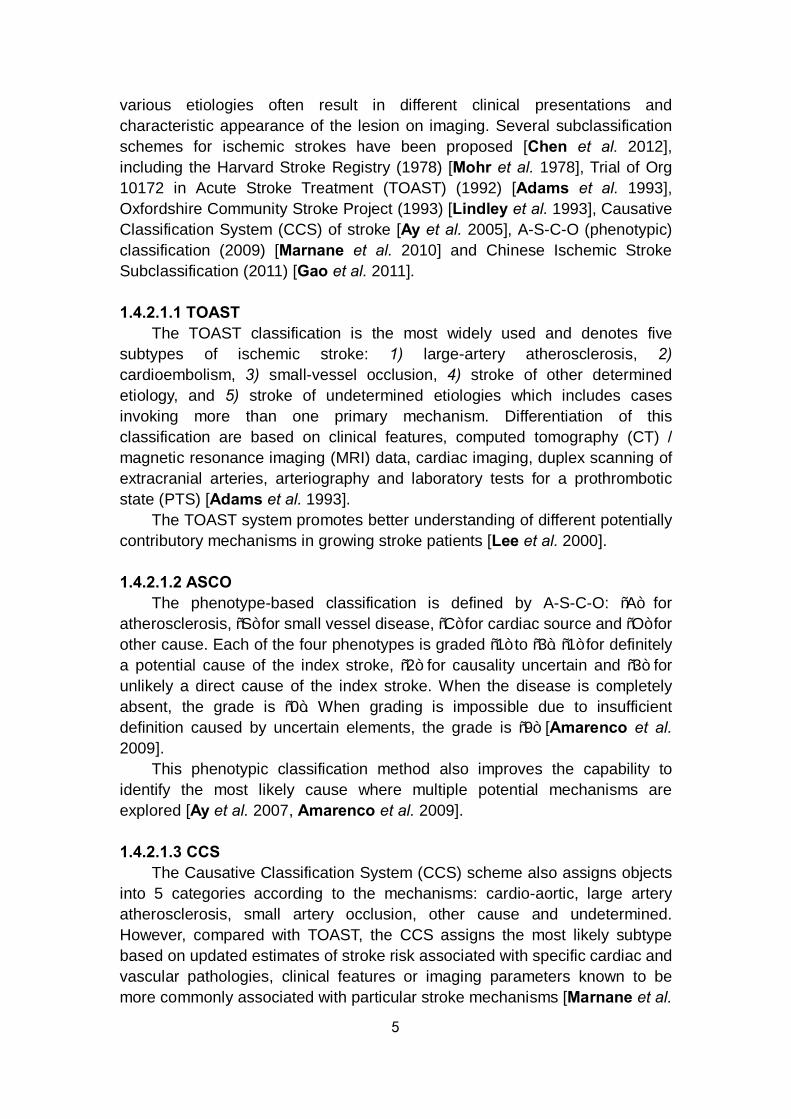
basic patterns based on DWI features, including scattered, territorial and lenticulostriatal. A territorial pattern defined as wedge-shaped infarctions involving the cortex and subcortex with clearly noticeable margins, while a lenticulostriatal pattern represents an infarction restricted only in MCA perforator artery territory. A scattered pattern is defined as infarct patterns that are not describable by the previous two patterns regardless of lesion location or infarction size. The extent of this pattern includes the cortex, subcortex of
7
the MCA territory and deep structures like internal capsule and basal ganglia [Lee et al. 2014] (Fig.1.3).
Figure 1.3: Three basic infarct patterns of acute ischemic stroke: (A) scattered, (B) territorial and (C) lenticulostriatal by DWI. Infarct lesion of each pattern: white arrow [Lee et al. 2014].
With early identification of DWI patterns a consideration to the stroke cause may be provided [Wessels et al. 2006, Bang et al. 2009b]. Emboli originating from the cardiac chamber have a high chance of becoming large, leading to a sudden major artery occlusion and a larger infarct [Arboix et al. 2010]. Furthermore, stroke caused by an embolus arising from the heart or aortic arch or recurrent emboli tends to occur in more than one arterial territory, often favors the anterior circulation and are often bilateral by neuroimaging [Wessels et al. 2006, Chung et al. 2010]. The criteria including imaging evidences indicating spontaneous recanalization and the absence of preceding atherosclerosis or other arteriopathy, along with proven cardioembolic sources can be applied to distinguish embolic occlusion from thrombotic occlusion [Lee et al. 2014].
1.5 Evolution of ischemic stroke
1.5.1 Phase of ischemic stroke Temporal evolution of ischemic stroke is typically categorized into
hyperacute (0-6 h), acute (6-24 h), subacute (24 h to approximately 2 weeks) and chronic phase of stroke (> 2 weeks old) [Gonzalez et al. 2002, Kloska et al. 2010]. During the acute phase (6-24 h), the ischemia-induced energy failure and the terminal depolarization of cell membranes result in the consequent tissue injury which established within a few minutes after the onset of ischemia. During the subsequent subacute phase (24 h-2 weeks), the largest increment of infarct volume is the expansion of the infarct core into the penumbra until, after another 4-6 h, it becomes congruent with the peri-infarct area. Finally, a delayed phase of injury evolves which may last for several days or even weeks. During chronic phase (> 2 weeks), secondary phenomena such as vasogenic

8
edema, inflammation and possibly cell death may contribute to a further progression of injury. By using multiparametric imaging techniques, evidence could be provided that shortly after occlusion of the MCA, the penumbra is approximately of the same size as the infarct core [Hata et al. 2000]. After 3 h more than 50% and between 6 and 8 h almost all of the penumbra has disappeared and is now part of the irreversibly damaged infarct core (details mentioned in 1.5.2.6).
1.5.2 Pathophysiology of ischemic stroke 1.5.2.1 The glial neurovascular unit
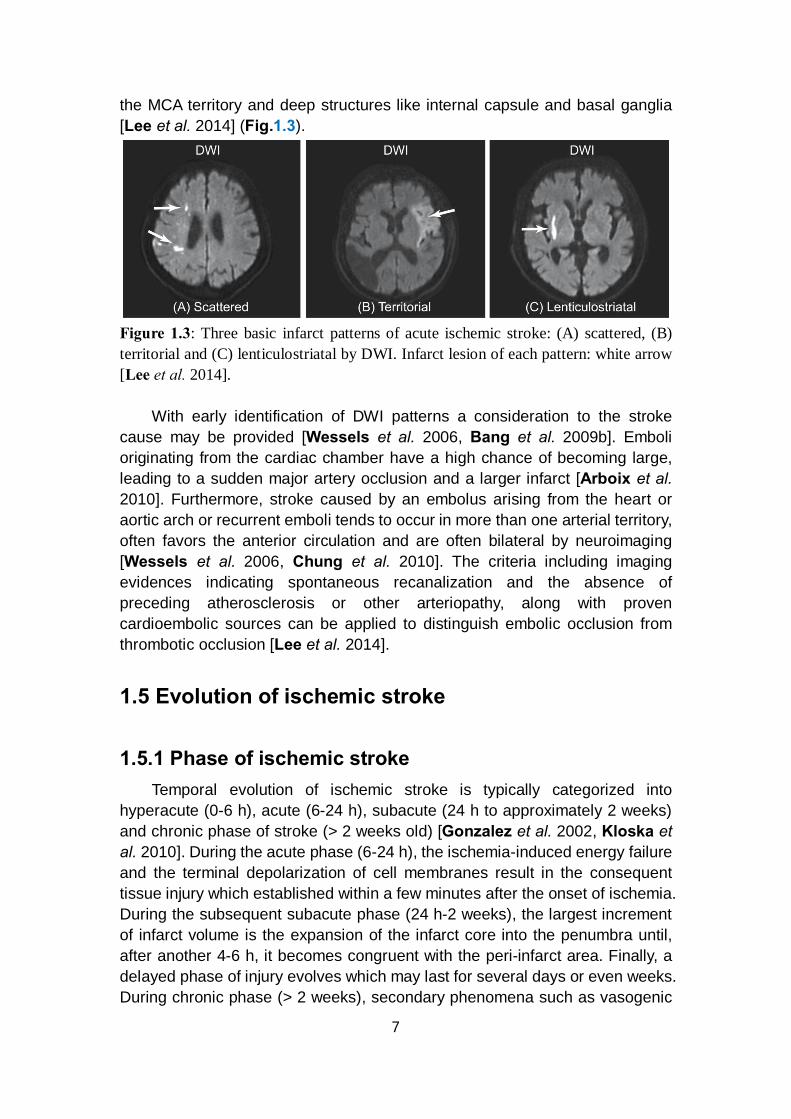
The control and modulation of regional cerebral blood flow depend on neurovascular coupling without the condition of ischemic injury [Zonta et al. 2003, Koehler et al. 2009]. Microvessel responses reflect the presence of neuronal activation, requiring the function of intact neurons. Previous studies reported that signal transmissions might be directed from microvessels to the neurons which based on the alterations in basal lamina matrix, protease generation, endothelial cell activation and glia astrocyte-endothelial cell adhesion, in view of the proximity of microvascular endothelial cells to the circumferential astrocyte end-feet [del Zoppo et al. 2003, del Zoppo et al. 2006]. This coupling is accomplished by a group of cells close to each other, termed neurovascular unit (NVU), which composed by neurons, astrocytes, endothelial cells of blood-brain barrier (BBB), myocytes, pericytes and extracellular matrix components [Muoio et al. 2014]. These cells all work together in a coordinated way through their intimate anatomical and chemical relationship, detect the needs of neuronal supply, trigger necessary response for such demands and regulate the extracellular environment of brain parenchyma [Su et al. 2009] (Fig.1.4).
9
Figure 1.4: Neurovascular unit (NVU): (A) components of the NVU, (B) precapillary arteriole with intact NVU and (C) response of the NVU to focal cerebral ischemia. Endogenous t-PA bound to LRP activates latent PDGF-CC, and active PDGF-CC binds to PDGFR-ɑ. Thrombolytic t-PA in the blood can cross a compromised BBB and active additional PDGF-CC, which exacerbates loss of BBB integrity. Tissue plasminogen activator, t-PA; lipoprotein receptor-related protein, LRP; platelet-derived growth factor CC, PDGF-CC; platelet-derived growth factor receptor ɑ, PDGFR-ɑ, adapted from [Su et al. 2009].
Whereas maintenance or timely re-establishment of flow reduces ischemic injury of both tissue and neuron, protection of neuron function in human has not prevented the evolution of injury despite the inherent mechanisms of neurovascular coupling. However, occlusion of cerebral blood flow rapidly identifies regions of neuron-vascular vulnerability within the vascular territory-at-risk which coalesce to turn into the mature ischemic lesion. So far, the failure of neuroprotective agents efficacy in clinical trials for the detectable tissue salvage could be explained by the decompensation of the NVU components due to their self-maladjustment [del Zoppo et al. 2010]. 1.5.2.2 Kinetics of ischemia

10
Oxidative glucose metabolism and brain energy state recover rapidly throughout the MCA territory, even after occlusion of as long as 1 h. After more than 3-6 h occlusion, recovery fails in the peripheral parts of the vascular territory and the volume of ischemia approaches that of permanent size [Kita et al. 1995]. Compared with energy metabolism, recovery of protein synthesis is much slower, which depends on both the duration of ischemia and the residual blood flow rate. After longer ischemia times, recovery fails in a gradually expanding core region until, after about 2 h of vascular occlusion, recovery disappears [Hermann et al. 2001].
Besides the imbalance of cerebral hemodynamics and oxygen / nutrients triggered by the ischemia, cellular disturbances may also contribute to the ischemia progression that cannot be explained by the single influence of impairment of blood flow or energy metabolism. The relevance of complex molecular mechanisms such as excitotoxicity, peri-infarct depolarizations, inflammation and apoptosis to delayed mechanisms of damage within the peri-infarct zone or penumbra which leads to permanent ischemic injury should be taken into consideration [Hossmann et al. 2006, Durukan et al. 2007] (Fig.1.5).
Figure 1.5: Schematic representation of molecular ischemic injury pathways leading to cell death. Multiple approaches are provided for the amelioration of both necrotic and apoptotic tissue injury by blocking these pathways at numerous sites [Hossmann et al. 2006].
11
1.5.2.3 Microcirculation
In focal ischemia, microcirculation is progressively disturbed. This disturbance is caused by at least three different pathophysiological mechanisms: the adhesion of white blood cells to the vessel wall; the increase in the blood viscosity due to the aggregation of blood corpuscles, and the compression of the capillaries by swollen astroglia [Vogel et al. 1999]. 1.5.2.4 Hypoxia
Once the resistance vessels are completely dilated, both autoregulation and CO2 reactivity are abolished. Blood flow follows passively the fluctuations of the systemic blood pressure. The abolishment of CO2 reactivity can also result in an uncoupling from metabolic activity which leads to the phenomenon that, during peri-infarct depolarization (details mentioned in 1.5.2.6), the cerebral blood flow is dissociated from the metabolism. Therefore, the loss of CO2 reactivity is a serious predictor of impending brain ischemia that requires immediate therapeutic interventions [Markus et al. 2001]. 1.5.2.5 Excitotoxicity
The main excitotoxicity mechanism is the high concentration of glutamate which results in primary neuronal necrosis. However, following pharmacological inhibition of ionotropic glutamate receptors, an apoptotic injury mechanism develops that may prevail under certain pathophysiological conditions [Kohara et al. 2008].
Evidence indicates that activation of glutamate receptors, through the attendant failure of ion homeostasis and increase in intracellular calcium ions concentration, is a major factor involved in initiating cell death. Although blocking glutamate receptors protects against excitotoxicity, it still has serious side-effects, such as psychotomimesis, respiratory depression or cardiovascular dysregulation [Chuang et al. 2011].
Excitotoxicity is well established as an important trigger and executioner of tissue damage in focal cerebral ischemia. Excitotoxic mechanisms can not only cause acute cell death (necrosis) but also initiate molecular events that lead to delayed cell death (apoptosis) [Hossmann et al. 1996a]. 1.5.2.6 Peri-infarct depolarizations
In the core region of the affected brain tissue, cells can undergo an irreversible anoxic depolarization and without repolarization. The core area is surrounded by tissue in which energy failure leads to electric silence with function loss, but because of residual perfusion in this region, vascular, cellular and molecular processes may lead to a certain extent of rescue for the recovery of function against the ischemic core. In focal ischemia, the blood flow range corresponds to a crescent-shaped region intercalated between the necrotic and normal brain tissue, it has been termed “penumbra” in analogy to
12
the partly illuminated area around the complete shadow of the moon in full eclipse [Manning et al. 2014]. This concept was further developed that cortical spreading depolarizations propagate the expansion of the ischemic core into the penumbra, making them a potential therapeutic target [Hossmann et al. 1996b]. Until recently, by using invasive electrophysiological recordings, spreading depolarizations of electric activity was shown in ischemic stroke of human beings, which in turn enlarged focal ischemic regions to the final size [Drenckhahn et al. 2012, Woitzik et al. 2013]. As the number of depolarizations increases, the infarcts grow larger [Mies et al. 1993]. In rat models, the drug MK-801 which can reduce the number of depolarizations was proved to decrease the infarct size [Iijima et al. 1992].
Cells can repolarize at the expense of additional energy consumption in penumbral regions with preserved perfusion. The same cells can depolarize repetitively, which termed “peri-infarct depolarizations”, in response to increasing glutamate or potassium ion levels, or both, by accumulating in the extracellular space [Hossmann et al. 1996b]. Peri-infarct depolarizations have been demonstrated in several animal models. They occur with a frequency of several events per hour and can be recorded for at least 6 to 8 h. That is why the penumbra is also defined as time-limited “fundamental reversibility”, which means the reduction in blood flow and the fundamental viability of the ischemic tissue. The blood supply is constrained in this region but with energy metabolism preserved. A direct consequence of the metabolic disturbances associated with focal ischemia is the rise of cell osmolality which causes a shift of water from the extracellular into the intracellular compartment. The resulting decline in the fluid volume of the extracellular space may be detected by measurement of electrical impedance or by DWI, both of which are sensitive to cell volume changes. A precise demarcation by tissue segmentation based on regional measures using confidence intervals (CIs) and graphic representation of ADC map could be obtained to provide additional quantitative information on the evaluation of penumbra and options of treatment [Lopez-Mejia et al. 2015]. 1.5.2.7 Calcium toxicity
Following anoxic depolarization, the calcium concentration gradients break down, leading to a sharp rise of calcium ion activity in the cytoplasm and its decline in the endoplasmic reticulum. The accumulation of calcium in the cytoplasm results in the activation of catabolic enzymes and mitochondrial disturbances, and the fall of calcium in the endoplasmic reticulum evokes a stress response, which mediates a great number of endoplasmic reticulum-dependent functional disturbances. The resulting dysfunction of the endoplasmic reticulum exhibits correlation with various cell biological abnormalities such as misfoldings of proteins, expression of stress proteins and disturbances of global protein synthesis [Paschen et al. 2003].
13
1.5.2.8 Inflammation Brain infarcts evoke a strong inflammatory response which is thought to
contribute to the progression of ischemic brain injury [del Zoppo et al. 2000]. Post-ischemic inflammation could contribute to ischemic damage by many mechanisms. The pro-inflammatory cytokines are massively upregulated both during permanent and after transient focal ischemia. Whereas microvascular obstruction by neutrophils can lead to a worse situation of ischemia, production of toxic mediators by activated inflammatory cells and injured neurons also has important consequences [del Zoppo et al. 1991].
In animal models, as well as human patients with ischemic stroke, infiltrating neutrophils produce inducible nitric oxide synthase (iNOS), an enzyme that produces toxic amounts of nitric oxide (NO) [Forster et al. 1999]. In endothelial cells, the generation of NO leads to vascular dilation, an improvement of blood flow and the alleviation of hypoxic injury, whereas in neurons it contributes to glutamate excitotoxicity and leads to free radical-induced injury by formation of peroxynitrite. The pathogenic potential of NO produced by iNOS is underscored by the observations that pharmacological inhibition of iNOS reduces ischemic brain injury and that iNOS null mice have a reduction in ischemic damage [Iadecola et al. 1997]. The fact that protection exerted by iNOS inhibition or gene deletion is based on the mechanism that is consistent with the hypothesis that ischemic injury evolves over several days [Dereski et al. 1993, Baird et al. 1997]. In addition, ischemic neurons express cyclooxygenase 2 (COX2), an enzyme that mediates ischemic injury by producing superoxide and toxic prostanoids. It is also strongly upregulated in the penumbra and can be detected in neutrophils, vascular cells and neurons [Nogawa et al. 1997, Bidmon et al. 2000]. 1.5.2.9 Apoptosis
The reactive oxygen species (ROS) produce peroxidative injury of plasma membranes and intracellular organelles. Different causes like excessive glutamate receptor activation, calcium ions overload, oxygen radicals or by mitochondrial and deoxyribonucleic acid (DNA) damage can bring about compromise to death of cells by necrosis or apoptosis. Secondary consequences of free radical reactions are the release of biologically active free fatty acids, the induction of endoplasmic reticulum stress, the induction of mitochondrial disturbances and the fragmentation of DNA [Mitsios et al. 2007]. Necrosis is the predominant mechanism that follows acute, permanent vascular occlusion, whereas in milder injury, cell suicide becomes unmasked and death resembles apoptosis, particularly within the penumbral region. The concurrence of an increased cytosolic calcium activity with the generation of reactive oxygen species causes the increase in permeability of the inner mitochondrial membrane, which leads to delayed apoptosis. This outcome may be induced by impairment of the energy state and thus enhance molecular injury pathways [Hossmann et al. 2006]. It partly depends on the

14
nature and intensity of the stimulus, the type of cell, and the stage it has reached in its life-cycle or development [Leist et al. 1998].
The genes for caspases as well as genes that suppress or augment cell death are expressed at higher levels and activated in both the early and late stages of ischemia, and genetic manipulations or drugs that block caspase family members or enhance the actions of suppressed gene confer resistance to ischemic injury [Thornberry et al. 1998]. Caspases are aspartate-specific cysteine proteases and exist as zymogens in cells, while caspase 1 and 3 play a pivotal role in ischemia-mediated apoptosis [Sairanen et al. 2009].
From the beginning of recirculation to the cascading impacts, the ischemic lesion evolves inversely by different mechanisms following the duration of ischemic injury (Fig.1.6).
Figure 1.6: The evolution and putative impact of each element of the cascade in focal cerebral ischemia [Dirnagl et al. 1999]. 1.5.2.10 Edema and permeability change of blood-brain barrier
An important modulator of focal ischemia is brain edema which can be differentiated into two phases: an early cytotoxic type of edema, followed by a late vasogenic type of edema after a period [Sakoh et al. 2003]. The cytotoxic type of edema is threshold dependent. The anoxic depolarization and equilibration of ion gradients across the cell membranes enhance intracellular osmolality, increase the intracellular uptake of sodium and cause cell swelling [Marmarou et al. 2007]. After 4-6 h from ischemia onset, the BBB breaks down and serum proteins start to leak from the blood into the brain parenchyma with the manifestation of necrosis [Gerriets et al. 2009]. This disturbance initiates a vasogenic type of edema which further increases the water content of the tissue. Vasogenic edema reaches its peak at 1-2 days after the onset of ischemia. Under clinical conditions, the malignant cerebral infarction (MCI) form, which terms a large MCA infarction, with or without involvement of the ipsilateral anterior and posterior cerebral artery territories, is the by far most dangerous complication and an indication for decompressive craniectomy due to the elevated intracranial pressure (ICP) or brain herniation [Walz et al. 2002, Simard et al. 2011]. Vasogenic edema is isosmotic and accumulates mainly in
15
the extracellular compartment influenced by multiple factors [Juenemann et al. 2015]. It secondarily reverses the decreased extracellular space and could explain the pseudonormalization of the signal intensity observed in diffusion-weighted MRI [Lansberg et al. 2001].
Inhibition of aquaporin water conductance or sodium exchange across sodium channels may reduce the formation or severity of ischemic brain edema [Badaut et al. 2011, Welling et al. 2011]. The gradient of osmotic and ionic concentrations built up during ischemia is regarded as the driving force and key factor for the generation of edema after stroke. However, aquaporin channels may modulate the speed of edema generation, but cannot change the final extent of water accumulation in brain tissue [O'Donnell et al. 2004].
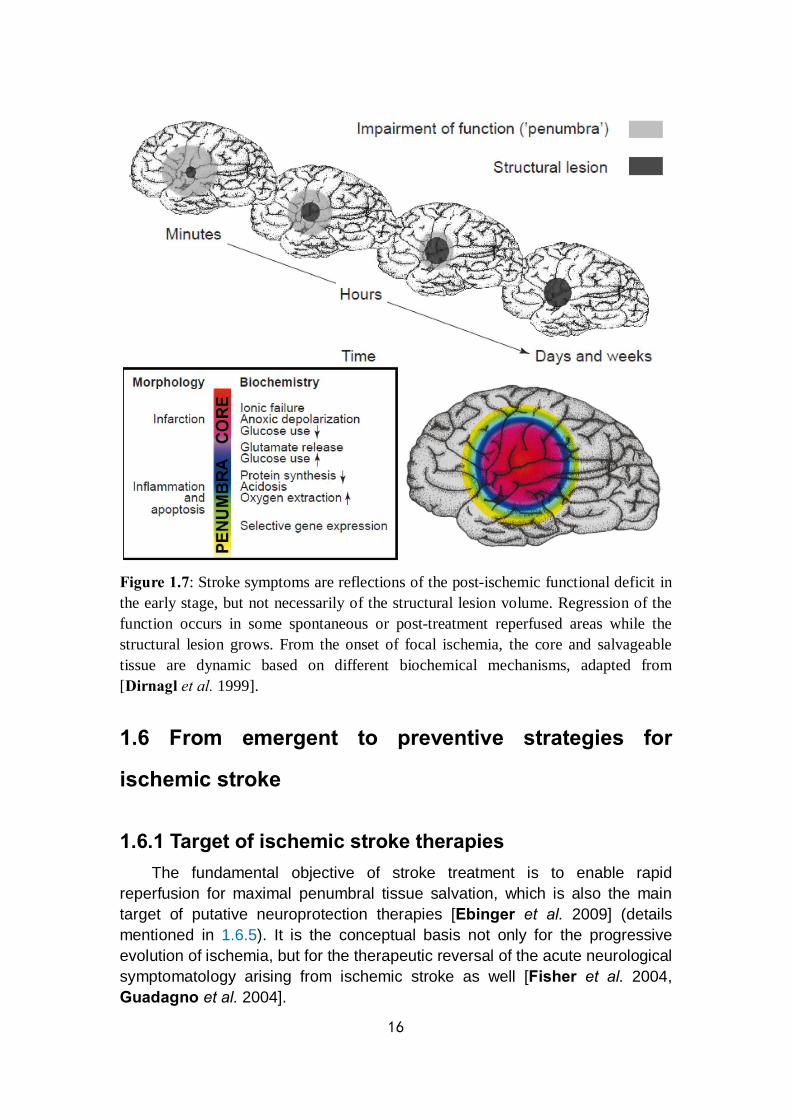
All these potential mechanisms mentioned before will more or less affect the formation and dynamic changes of penumbra, which is the premise of AIS treatment. The fate of the penumbra depends on the extent of reperfusion in the ischemic area. If persistent artery occlusion exists, the infarct will grow constantly and progressively replace the penumbra, as an irreversibly damaged lesion. Under the condition of either spontaneous or post-treatment recanalization, the penumbra will be reversible within the limited time frame (Fig.1.7). A better understanding of penumbra development which converts from microcosmic to macrocosmic level may help to define the time window for clinical therapy and the selection criteria of patients by imaging evidence with the consideration of stroke symptoms.
16
Figure 1.7: Stroke symptoms are reflections of the post-ischemic functional deficit in the early stage, but not necessarily of the structural lesion volume. Regression of the function occurs in some spontaneous or post-treatment reperfused areas while the structural lesion grows. From the onset of focal ischemia, the core and salvageable tissue are dynamic based on different biochemical mechanisms, adapted from [Dirnagl et al. 1999].
1.6 From emergent to preventive strategies for
ischemic stroke
1.6.1 Target of ischemic stroke therapies The fundamental objective of stroke treatment is to enable rapid
reperfusion for maximal penumbral tissue salvation, which is also the main target of putative neuroprotection therapies [Ebinger et al. 2009] (details mentioned in 1.6.5). It is the conceptual basis not only for the progressive evolution of ischemia, but for the therapeutic reversal of the acute neurological symptomatology arising from ischemic stroke as well [Fisher et al. 2004, Guadagno et al. 2004].
17
1.6.2 Demand of development in stroke therapies During the past decades, most major stroke trials developed worldwide
have failed, including the following: (1) Large clinical trials of secondary prevention, such as the
Warfarin-Aspirin Symptomatic Intracranial Disease Study, the Management of Atherothrombosis with Clopidogrel in High-Risk Patients with Recent Transient Ischemic Attack or Ischemic Stroke, and Clopidogrel for High Atherothrombotic Risk and Ischemic Stabilization, Management and Avoidance studies [Chimowitz et al. 2005, Bhatt et al. 2006];
(2) Recent randomized trials of new thrombolysis agents, such as the Desmoteplase In Acute Ischemic Stroke phase 2 (DIAS-2) and Abciximab in Emergent Stroke Treatment trials (phase 2) [Adams et al. 2008];
(3) Neuroprotection Therapy like the Stroke Therapy Academic Industry Roundtable (STAIR) criteria-guided Neuroprotection Trial (NXY-059) [Shuaib et al. 2007].
These results indicate the urgent need for measuring the heterogeneity and individualization of patients’ condition due to the complex mechanisms of ischemic stroke. Beyond this situation, alternatives or combination of the traditional therapeutic approaches leading to a high level of specialized care provided by an interdisciplinary team is required.
1.6.3 Thrombolysis therapy Nowadays, the clinical treatment of the AIS includes two possible methods
of therapy: medication, mainly IV thrombolysis and endovascular therapy (details mentioned in 1.6.4). Prompt reestablishment of effective blood flow with lysis of an occlusive thrombus is the goal of thrombolysis. Thrombolytic agents, including streptokinase, urokinase or recombinant tissue plasminogen activator (rt-PA), convert the proenzyme plasminogen to the enzyme active in thrombin lysis, plasmin [Dirks et al. 2012]. The rt-PA, which is fibrin specific and activating only thrombin-bound plasminogen, is the most favorable choice for thrombolytic therapy [Ehlers et al. 2007].
Substantial evidence suggests that efficacy of IV rt-PA in the first 4.5 h from onset of symptoms is higher compared with the efficacy outside the therapeutic window, but with increased risk of hemorrhagic complications as well [Hacke et al. 2008, Shobha et al. 2011]. However, the procedure of IV thrombolysis has a low percentage restoration of cerebral arteries patency so that is characterized by relatively low efficiency [Saqqur et al. 2007, Bhatia et al. 2010].
To balance the benefits of extended therapeutic time window and the risks of subsequent ischemia-reperfusion injury, it is important to select appropriate patients based on an assessment of individual risks and potential benefits for

18
thrombolysis [Khatri et al. 2012]. In contrast to rt-PA induced recanalization, and probably also to
spontaneous recanalization in humans, both of which allow gradual restoration of blood flow to the ischemic area, mechanical opening of an occlusion results in abrupt reperfusion, and thus the mechanical thrombectomy may be the only clinical selection (details mentioned in 1.6.4.2). It may be speculated that this type of ischemia and then reperfusion produces a bias in post-ischemic signaling toward reperfusion-induced secondary mechanisms of injury, which may be amenable to pharmacological intervention even after relatively long time frames [Hossmann et al. 2012]. Results from previous studies provided a huge amount of information on the concerned intervention after stroke. However, some of these results were with low predictive value due to the existed bias which caused by the lack of control on randomization, preset criteria for inclusion and exclusion, blinding and universality of experimental units [Dirnagl et al. 2009].
1.6.4 Endovascular therapy Recanalization of occluded artery is strongly associated with improved
functional recovery and reduced mortality in ischemic stroke [Rha et al. 2007]. Alternative recanalizing approaches, such as endovascular treatment (ET), have been employed for many years and have progressively gained favor profited from the possibility of using a multimodal approach and to the evolving imaging and delivery technologies that have increased safety, efficiency and frequency of recanalization [Ciccone et al. 2014].
ET can be broadly divided into the chemical dissolution of clots with intraarterially delivered thrombolytic agents, and clot retrieval / thrombectomy with mechanical devices. The main forms of endovascular approaches for AIS are illustrated [Asadi et al. 2015] (Fig.1.8). The move to acute intervention for rapid thrombus lysis in the cerebral arterial circuit was highly relevant to the progress by multiple approaches [Jeong H. S. et al. 2014, Zhang et al. 2015].
Figure 1.8: Diagrammatic sketches of main endovascular approaches in clinical trials, adapted from [Asadi et al. 2015]. The high efficiency of penumbra aspiration system has been confirmed in a Penumbra Pivotal Stroke Trial study for AIS patients within 8 h of symptom onset [Penumbra Pivotal Stroke Trial et al. 2009]. MERCI is a corkscrew shape device with helical Nitinol loops specifically designed and tested for
19
distal placement into the thrombus for removal. The target vessels were the proximal segments of major cerebral arteries, predominantly M1 segments of the middle cerebral and vertebrobasilar arteries. Clot located more distally are not suitable for the removal by MERCI [Gandhi et al. 2007]. The stent retriever device is an alternative for patients with ischemic stroke due to large intracranial artery occlusion who are ineligible for or who fail IV rt-PA therapy [Ciccone et al. 2014]. 1.6.4.1 Intraarterial thrombolysis and correlative clinical trials
IV alteplase appears to be much less effective at resolving proximal occlusions of the major intracranial arteries, which account for more than one third of acute anterior-circulation stroke cases [Heldner et al. 2013]. Early recanalization after IV alteplase was seen in only around 30% of all patients with an occlusion of the internal carotid artery terminus, and the prognosis without revascularization was generally poor for such patients [Christou et al. 2001, Lima et al. 2014]. As an invasive technique of AIS treatment, intraarterial (IA) thrombolysis is regarded as a potentially important component of the therapeutic armamentarium with the time window up to 6 h after stroke onset with the adjustment of given dose. The IA thrombolysis involves the direct introduction of fibrinolytics to the clot within the obstructed artery, which causes a local increase of the drug concentration high enough to dissolve the clot, while maintaining low systemic concentrations. Based on this theory, the dose of thrombolytic agent in IA approach is pre-defined. In a randomized trial of intraarterial treatment (IAT) for 500 AIS patients from 16 Dutch medical centers, the maximum dose of 90 mg of alteplase or 1.2×10⁶ IU of urokinase was allowed for IA thrombolysis. The dose was restricted to 30 mg of alteplase or 4×10⁵ IU of urokinase when IV alteplase was given [Berkhemer et al. 2015, Fransen et al. 2016].
Several clinical applications of IA thrombolysis were studied for different goals and led to the conclusions which showed the superiority of IAT over IV thrombolysis but still remained controversial. In the Prourokinase (Prolyse) in Acute Cerebral Thromboembolism (PROACT) study with the follow-on phase 2 and 3 trials, recanalization was significantly greater with IA thrombolytic agent than no intervention, as was the frequency of symptomatic ICH [del Zoppo et al. 1998, Furlan et al. 1999]. In the Interventional Management of Stroke phase 2 (IMS-2) trial, higher rate of symptomatic ICH but lower mortality was reported by comparing IV and IA a low dose t-PA [Investigators et al. 2007]. The IMS-3 trial focused on the effect of combined IV / IA dual therapy versus IV treatment only [Khatri et al. 2008]. Although successful revascularization in the IMS-3 trial, generally assessed as restoration of flow to more than 50% of the suffered brain territory, was associated with better functional outcomes with the combination of ET, the efficacy of ET remains to be demonstrated as compared with IV rt-PA alone so that the influence of improved devices is taken into consideration [Broderick et al. 2013]. For the patients with occlusion of anterior or posterior circulation, the SYNTHESIS Expansion trial

20
compared IAT with standard IV treatment without setting pre-specified selection criteria [Ciccone et al. 2013]. 1.6.4.2 Endovascular mechanical approaches and correlative clinical trials
Coincident with the evolution of directed delivery of plasminogen activator and its derivatives to the clot, mechanical devices designed to capture and retrieve thrombi or re-establish blood flow in the cerebral arterial circuit were devised. Mechanical treatment could involve thrombus retraction, aspiration, sonolysis, wire disruption or application of a retrievable stent [Fransen et al. 2014]. The use of mechanical thrombectomy extends the therapeutic window up to 15 h [del Zoppo et al. 1998, Arnold et al. 2010]. In clinical trials, mechanical approaches using devices which work through aspiration (e.g. Penumbra System), entrapment and retrieval (e.g., MERCITM Retriever) or, as the last generation devices, through stenting and retrieval combined (e.g. SolitaireTM, ev3 Neurovascular, Irvine, CA and TrevoTM, Stryker, Kalamazoo, MI) (see Fig.1.8), have largely replaced local IA thrombolysis as first-line stroke strategies [Mehta et al. 2013].
In the Mechanical Retrieval and Recanalization of Stroke Clots Using Embolectomy (MR RESCUE) trial, the rate of successful revascularization was compared between mechanical thrombectomy using the MERCI Retriever (Concentic Medical, Mountain View, USA) and standard care. The main novelty of this trial as compared with IMS-3 trial and SYNTHESIS-Expansion trial was to stratify the candidates by imaging selection, which defined the penumbral pattern within 8 h from stroke onset [Broderick et al. 2013, Ciccone et al. 2013, Kidwell et al. 2013a].
Different generations of techniques based on different principles do affect the prognosis. The Multi-MERCI trial showed an increased recanalization rate with the MERCI retriever combined with IA t-PA compared to clot retrieval alone and illustrated that the new generation of devices contributed to a higher rate of reperfusion after treatment than the first generation of devices [Smith et al. 2008, Nogueira et al. 2012]. The TREVO-2 trial proved that those who were ineligible for or failure to respond to IV rt-PA should be treated with the Trevo Retriever in preference to the MERCI Retriever [Nogueira et al. 2012]. The Solitaire with the Intention for Thrombectomy as Primary Endovascular Treatment (SWIFT PRIME) trial still found a better long-term effect of ET in terms of reperfusion frequency and safety by Solitaire FR stent comparing with MERCI Set [Nogueira et al. 2012, Saver et al. 2012, Broussalis et al. 2013].
The Multicenter Randomized Clinical trial of Endovascular treatment for Acute ischemic stroke in the Netherlands (MR CLEAN) was a multicenter clinical trial with randomized treatment allocation, open-label treatment and blinded endpoint evaluation for 500 patients. The active comparison was IAT including IA alteplase or urokinase and / or mechanical treatment versus no IAT [Fransen et al. 2016]. General inclusion criteria of MR CLEAN are: a
21
clinical diagnosis of acute stroke with a deficit on the NIHSS score of at least 2, CT or MRI ruling out ICH, occlusion of distal intracranial carotid artery or middle (M1 or M2) or anterior cerebral artery (A1) demonstrated with CT angiography (CTA), MR angiography (MRA) or digital subtraction angiography (DSA), and possibility to start treatment within 6 h of onset. There is possibility to use several local thrombolytic agents and mechanical devices for a broad range of patients with AIS in the setting of a proximal thrombo-embolic occlusion of the intracranial artery belonging to the anterior circulation. The trial’s pragmatism is also apparent from the clinical situations it addresses: patients who have been treated unsuccessfully with IV thrombolysis, patients who can be treated within 6 h, but do not meet the time window requirements for IV thrombolysis, and patients with contraindications for IV or IA thrombolytic agents (thrombectomy only) [Fransen et al. 2014, Fransen et al. 2016].
By the analysis of a large sample of patients with AIS, ET with mechanical thrombectomy versus standard medical care with t-PA was associated with improved functional outcomes and higher rates of angiographic revascularization (59% in MR CLEAN and 88% in SWIFT PRIME), but no significant difference in symptomatic ICH (6% in MR CLEAN and 0% in SWIFT PRIME) or overall mortality at 90 days. Although argument remains, alteplase can be started immediately after non-contrast CT, before vessel occlusion status is known. Evidence for ET is best established for stent retrievers with treatment started within 6 h of stroke symptom onset. Patients with occlusion of the internal carotid artery (ICA) and proximal MCA clearly benefit from endovascular thrombectomy, but there is residual uncertainty in the case of more distal occlusions and in patients with clinically very mild symptoms. To extend the therapeutic time window, the perfusion imaging selection may help in some ongoing clinical trials [Badhiwala et al. 2015, Campbell et al. 2015, Phan et al. 2016].
1.6.5 Neuroprotection therapy The general concept of neuroprotection refers to pharmacological
treatments that alleviate the molecular injury cascades leading to neuronal cell death. Obviously, neuroprotection is invalid for a brain region in which blood flow has declined below the threshold of energy failure, but it may contribute to the temporary preservation of the penumbra, bridging the interval between the onset of ischemia and the restitution of blood flow, and / or preventing secondary neuronal cell death during reperfusion [Wahlgren et al. 2004]. However, as the penumbra can be effectively treated by improvement of blood flow alone, neuroprotective interventions are mediated not only by interference with ischemic injury cascades, but also by reducing the mismatch between blood flow and metabolism.
Apparently, the achievement of numerous controlled clinical trials focusing on neuroprotection against cerebral ischemia with compounds previously
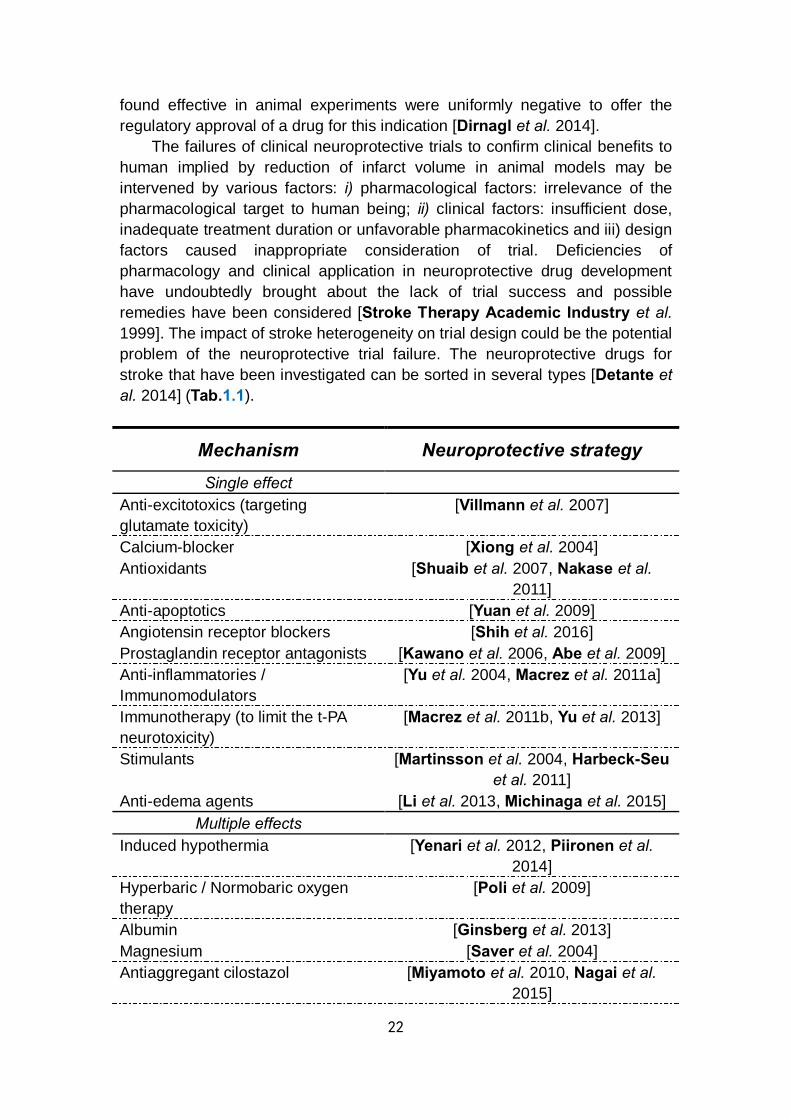
22
found effective in animal experiments were uniformly negative to offer the regulatory approval of a drug for this indication [Dirnagl et al. 2014].
The failures of clinical neuroprotective trials to confirm clinical benefits to human implied by reduction of infarct volume in animal models may be intervened by various factors: i) pharmacological factors: irrelevance of the pharmacological target to human being; ii) clinical factors: insufficient dose, inadequate treatment duration or unfavorable pharmacokinetics and iii) design factors caused inappropriate consideration of trial. Deficiencies of pharmacology and clinical application in neuroprotective drug development have undoubtedly brought about the lack of trial success and possible remedies have been considered [Stroke Therapy Academic Industry et al. 1999]. The impact of stroke heterogeneity on trial design could be the potential problem of the neuroprotective trial failure. The neuroprotective drugs for stroke that have been investigated can be sorted in several types [Detante et al. 2014] (Tab.1.1).
Mechanism Neuroprotective strategy Single effect
Anti-excitotoxics (targeting glutamate toxicity)
[Villmann et al. 2007]
Calcium-blocker [Xiong et al. 2004] Antioxidants [Shuaib et al. 2007, Nakase et al.
2011] Anti-apoptotics [Yuan et al. 2009] Angiotensin receptor blockers [Shih et al. 2016] Prostaglandin receptor antagonists [Kawano et al. 2006, Abe et al. 2009] Anti-inflammatories / Immunomodulators
[Yu et al. 2004, Macrez et al. 2011a]
Immunotherapy (to limit the t-PA neurotoxicity)
[Macrez et al. 2011b, Yu et al. 2013]
Stimulants [Martinsson et al. 2004, Harbeck-Seu et al. 2011]
Anti-edema agents [Li et al. 2013, Michinaga et al. 2015] Multiple effects
Induced hypothermia [Yenari et al. 2012, Piironen et al. 2014]
Hyperbaric / Normobaric oxygen therapy
[Poli et al. 2009]
Albumin [Ginsberg et al. 2013] Magnesium [Saver et al. 2004] Antiaggregant cilostazol [Miyamoto et al. 2010, Nagai et al.
2015]
23
Statins [Chen et al. 2003] Citicoline (cytidine diphosphate-choline, CDP-choline)
[Davalos et al. 2012]
Sildenafil [Zhang et al. 2012] Traditional Chinese medicine [Chen C. L. et al. 2013,
Venketasubramanian et al. 2015] Table 1.1: The list of references concerning representative neuroprotective trials for ischemic stroke based on different mechanisms including both single and multiple effects [Detante et al. 2014].
Pathophysiological heterogeneity is of particular relevance to neuroprotection. However, as these interventions are only effective if energy metabolism recovers by unimpaired reperfusion, they may be of limited relevance for clinical stroke. There are three principal types of patients in whom neuroprotective therapies are probably ineffective: i) those who lack a biological substrate relevant to the mode of function of the drug [Yam et al. 2000], ii) those who lack a representation of the ischemic penumbra, which seems likely to be of restricted volume in most patients but with wide interindividual variation, and is probably absent under specific conditions such as the primary intracerebral hematoma (PICH) and lacunar strokes, which are characterized by white matter (WM) ischemia, result mostly from end artery disease [Heiss et al. 1998, Hirano et al. 1999] and iii) those who have no collateral flow for reperfusion, also lack a biological substrate for neuroprotective drug delivery [Moustafa et al. 2008].
1.6.6 Development space and prospect of regenerative
stroke therapy Following stroke, the brain cannot recover completely with endogenous
neuroprotection and repair mechanisms. Except early IV thrombolysis, craniectomy for large infarctions and malignant strokes or admission to a stroke unit that incorporates intensive care and rehabilitation of above, no other treatment currently exists to efficiently enhance recovery after stroke. However, only a minor portion of stroke victim benefit from these therapies because of contraindications or lack of access. [Jauch et al. 2013, Sarraj et al. 2014].
Complex pathophysiological processes are involved during the evolution of cerebral ischemia for the response to brain cell damage. Brain tissue responds to most of the noxious signals by inducing protective mechanisms [Dirnagl et al. 2012]. During the infarction of brain tissue, destruction overwhelms protection, while tissue around the ischemic core may have been spared by restored substrate delivery including collateral, spontaneous or therapeutic reperfusion and cellular mechanisms of protection [Detante et al.

24
2014] (Fig.1.9).
Figure 1.9: Time course of stroke and associated therapeutic time window. B-cell lymphoma protein, BCL; brain derived neurotrophic factor, BDNF; blood pressure, BP; peri-infarct depolarization, Depol; endothelial progenitor, EP; erythropoietin, EPO; granulocyte-colony stimulating factor, GCSF; growth factor, GF; glutamate receptor 2, GluR2; hematopoietic stem cell, HSC; heat-shock protein, HSP; interleukin, IL; inositol tri-phosphate, IP3; intravenous, IV; mononuclear cell, MNC; mesenchymal stromal / stem cell, MSC; nitric oxide synthase, NOS; serotonin reuptake inhibitor, SRI; vascular endothelial growth factor, VEGF [Detante et al. 2014].
The hemodynamic, metabolic and ionic changes described in previous sections do not affect the ischemic territory homogeneously. Although there is ample evidence that the penumbra exists in stroke patients, the extent and temporal dynamics of this area are less well defined: it might be smaller or exist for a shorter period in humans than that elaborated by hypothesis [Kaufmann et al. 1999]. Furthermore, the current guidelines neglect the fact that the portion of potentially salvageable ischemic tissue is not dependent on the time window but the individual collateral blood flow (e.g. arteriogenic growth of collateral vessels induced by some cytokines occurs in the brain
25
under conditions of reduced arterial blood supply, and can provide powerful protection against ischemic stroke [Busch et al. 2003].)
For all these reasons, regenerative therapies based on new biological medium and correlative sensitive monitoring approaches are urgently demanded.
1.6.7 Potential of biotherapies for post-stroke plasticity
and neural repair With the discovery of functionally active stem cells in the hippocampus
and the subventricular zone (SVZ) of the adult brain, the possibility of endogenous regeneration of brain infarcts has been evoked [Imitola et al. 2004]. The number of spontaneously regenerating neurons is too low to maintain the regeneration and repair of brain infarcts. Regeneration therapy has also been attempted by transplantation of immortalized neuroepithelial cells, neural stem cells and stem cells derived from fetal brain tissue, bone marrow or umbilical cord blood. However, the reported functional improvements are probably unspecific effects which cannot be explained by the samples with a small number of surviving cells. It is difficult to predict the effects but evidence of spontaneous neurogenesis, angiogenesis and synaptogenesis distant from the ischemic lesion points to a remodelling of the surviving tissue which may promote post-ischemic brain plasticity [Roitberg et al. 2004]. Understanding these processes may unveil hitherto unknown mechanisms that may become targets of future therapeutic interventions [Wechsler et al. 2004]. In accordance with the concept of NVU and the role of several angiogenic factors in neurogenesis, the new microvasculature could be insufficient to prevent the premature failure of neurons [Greenberg et al. 2013]. From a therapeutic point of view, it could be of interest to enhance the vascular remodeling and vessel formation during the subacute phase notably using cell therapy [Gutierrez et al. 2009, Onteniente et al. 2011].
Currently, multiple biotherapies targeting different mechanisms, mainly by therapeutic cells and / or growth factors, hold great promise as regenerative medical strategies for ischemic stroke. The improvements in host brain plasticity and associated functional recovery have been identified after injection of stem cells with mechanisms remaining uncertain. The effects of cell therapies on post-ischemic angio-vasculogenesis seem to be crucial in explaining early post-graft benefits [Gutierrez et al. 2009]. Intracerebral (IC) injection of endothelial cells can improve vasculogenesis linked to neurogenesis via vascular endothelial growth factor (VEGF) release mechanisms [Ishikawa et al. 2013]. Another important effect of cell therapy is enhanced glial remodeling and limitations in anterograde degeneration [Chopp et al. 2009, Li et al. 2014].
During stroke recovery, the structural brain plasticity based on the
26
surviving tissue participates in reorganization of damaged networks and exhibits neuro-synaptogenesis with axonal sprouting for several month [Darsalia et al. 2005, Carmichael et al. 2006, Thored et al. 2006, Murphy et al. 2009]. Stroke increases neurogenesis from neural stem cells (NSCs) of the SVZ and hippocampal dentate gyrus, generating neuroblasts that migrate to the lesion and differentiate into mature neurons [Parent et al. 2002]. Stroke damage is not limited to neurons but involve all brain cell type including the extracellular matrix in a “glio-neurovascular niche”, which linked angio-vasculogenesis and glial function during the stem cells work [Shen et al. 2008, Arai et al. 2009, Walker et al. 2009]. Endothelial cells release factors that both stimulate the self-renewal of NSC and also enhance the production of neuron [Shen et al. 2004]. As a consequence, microvessels size and density changes are supposed to help stimulate the neuronal plasticity [Ergul et al. 2012, Boehm-Sturm et al. 2013].
Additionally, glial cells play a key role during post-ischemia recovery, with astrocytes removing excitatory neurotransmitters and K+ and thereby limiting excitotoxic damage. These cells also modulate synaptogenesis by enhancing the formation of functional synapse [Pannasch et al. 2011]. Microglia is thought to contribute to the post-stroke remodeling process, both acting as an inflammation modulator and also by releasing trophic factors that encourage synaptogenesis and neurite outgrowth [Madinier et al. 2009].
However, neurogenesis from endogenous NSCs is relatively weak and many new neurons die, resulting in incomplete and disappointing long-term functional recovery after stroke [Arvidsson et al. 2002]. The effects of these complex processes comprising post-stroke plasticity are still reinforced by exercise and rehabilitation [Langhorne et al. 2011, Pekna et al. 2012, Schmidt et al. 2014].
Guidelines for selecting the optimal time window, and ideal delivery routes and doses are still debated and the answers may depend on the chosen cell type and its hypothesized mechanism including early neuroprotection, delayed neural repair, trophic systemic transient effects or graft survival and integration [Detante et al. 2014].
1.6.8 Cell sources and cell therapy products 1.6.8.1 Cell types selection
Today, the great variety of available stem cell types and sources form a rich therapeutic arsenal for ischemic stroke which requires careful consideration regarding their respective preclinical safety and efficacy profiles, cell characterization, mechanisms of action, delivery routes and in vivo distribution properties prior to the clinical application [Onteniente et al. 2013, Shinozuka et al. 2013]. Currently, among many available cell types, bone marrow-derived cell populations such as mesenchymal stromal / stem cells
27
(MSC), umbilical cord stem cell and NSC are the most commonly investigated for clinical use [Detante et al. 2014].
In clinical trials, stromal / stem cells isolated from autologous bone marrow [Honmou et al. 2012, Eckert et al. 2013], peripheral blood [Kim et al. 2006, Paczkowska et al. 2009] or adipose tissue [Gutierrez-Fernandez et al. 2013, Gao et al. 2014] are the most widely used. Besides sources of adult, fetal sources such as umbilical cord are relatively available for banking and production of clinical grade stem cells from either the cord itself or from samples of cord blood [Park et al. 2009, Kim D. W. et al. 2013].
There are three main categories of therapeutic cells for the biotherapies, which distinguished by different characteristics [Detante et al. 2014]. Application of MSC must take precautions when using ex vivo cultures because excessive MSC expansion with different passages could affect their therapeutic features and subsequently modify the final phenotype [Shahdadfar et al. 2005, Li et al. 2008]. NSC grafts usually require immunosuppressant treatment during the process of cell therapy [Mack et al. 2011]. The third category of therapeutic cells includes the hematopoietic stem cells and endothelial progenitors [Chen et al. 2008, Schwarting et al. 2008], which are feasibly harvested from autologous / allogeneic cord blood, bone marrow or peripheral blood after mobilization and represent a type of mononuclear cell (MNC) usable without amplification to enhance microvascular repair [Brenneman et al. 2010, Yang et al. 2011]. 1.6.8.2 The ideal route for cell delivery
The best delivery route for cell therapy after stroke still remains debated, depending strongly on the expected therapeutic effects. Theoretically, IC delivery would be preferred for cell replacement while IV or IA injection would be better for systemic and trophic support [Detante et al. 2014].
Compared to surgical implantation, systemic IV injections are less invasive and easier to implement in the relevant operation [Guzman et al. 2008]. Other graft routes such as IA or IC, could avoid the lung entrapment problem and thereby increase the number of grafted cells for the concentration in target [Seyfried et al. 2008, Kawabori et al. 2012].
The comparisons of neuroprotection in the acute phase and delayed neural repair / trophic systemic transient effects and grafts survival or integration revealed that the optimal therapeutic timing after stroke onset remains debated, depending on the cell type and specific mechanism [Detante et al. 2014]. For example, IA injection of NSCs leads to greater differentiation into astrocytes about 6-24 h after stroke, whereas injection at 7-14 days post-stroke leads to greater differentiation into neurons [Guzman et al. 2008, Rosenblum et al. 2012]. 1.6.8.3 Comprehensive evaluation of cell therapy for stroke
Whereas results from publications suggested that early IV injection of
28
MSCs within 24 h could be effective [Wang et al. 2014], evidence has been reported that treatment delays up to one month after stroke can also result in improvements in functional recovery [Shen et al. 2007, Komatsu et al. 2010]. A great advantage of clinical cell therapies would be the feasibility to delay the treatment until the subacute or chronic phase, which benefits a majority of stroke patients. So the evaluation of therapeutic effects should be carried out both soon after the stroke onset and at a later stage.
To define a clinical strategy of cell therapy for ischemic stroke, the individual condition of patients should be taken into account. Several aspects of factors will impact the feasibility of neurorestorative therapies development including the influences related to the stroke type, localization, infarct size, basic neurovascular risk factors such as hypertension, diabetes mellitus, dyslipidemia, cerebral small vessel diseases and concomitant treatments like thrombolysis or statins [Luitse et al. 2012]. Some of these factors will be crucial to determine the selection of objects of the trial and the final efficacy of the treatment [Lee et al. 2010].
Beside the feasibility for the operation, safety issues should also be emphasized to reach the success of clinical trials. Due to the multivariate characteristics and uncertain mechanisms concerning the application of therapeutic cells, the tumorigenicity must be taken seriously for all clinical grade cell products by using long-term surveys. As for the immunogenicity, the immunomodulation properties of MSCs from all sources should be regarded with respect [Li et al. 2006]. Although MSCs or MNCs harvested from human sources are generally used in animal models of experimental stroke without immunosuppression. For medical grade allogenic NSCs, the use of concomitant immunosuppression should be taken into consideration to avoid severe inflammatory reaction notably after local delivery [Kondziolka et al. 2005, Hurst et al. 2013].
To realize an efficient transfer of the regenerative approach for the development of stroke therapies in the future, all translational concerns from the bench to the bedside should be thought through [Detante et al. 2014]. Actually, still a number of crucial problems remain unsolved both at the bench and at the bedside in this field. The new imaging methods by MRI may hold the key to a better understanding of stroke therapies and to a quantitative assessment of stroke evolution in clinical trials.
29
Chapter 2
Magnetic resonance imaging in ischemic stroke
Magnetic resonance imaging (MRI), as a versatile and non-invasive modality, has been performed in a crucial and efficient manner to provide accurate information in both preclinical and clinical stroke studies [Karki et al. 2010, Rymner et al. 2010, Vidale et al. 2013]. In routine clinic, besides the clinical information including the onset of symptoms, the relevant individual history and the indices involving severity and recovery (e.g. the NIHSS score), imaging strategies based on multiparametric MRI approaches have been widely used to assess the evolution of cerebral ischemic injury in stroke patients [Kidwell et al. 2013b, Kim Y. W. et al. 2013]. The main goals of such imaging strategies are supposed to rule out intracerebral hemorrhage (ICH), to define the extent of the ischemic injury, to differentiate between the infarct core and the salvageable penumbral tissue and to visualize the vessel status [El-Koussy et al. 2014]. Multiparametric MRI is nowadays widely available and frequently applied in most stroke centers. In particular, diffusion-weighted imaging (DWI) and perfusion-weighted imaging (PWI) have become important tools for current diagnosis and treatment decision making in patients with acute ischemic stroke (AIS) [Thomalla et al. 2011]. Although imaging of brain anatomy historically has been done by computed tomography (CT), but ever-increasingly is supplanted by the superb soft tissue contrast provided by MRI [Bryan et al. 1991]. Besides, the versatility of MRI methods also enables much more detailed biophysical information on pathophysiological changes after stroke, above and beyond lesion structure.
2.1 Clinical standard MRI sequences for acute
ischemic stroke
Different types of tissue contrasts can be exhibited markedly by various MRI sequence characteristics. In CHU Grenoble Alpes, basic MR sequences including fluid attenuated inversion recovery (FLAIR), two-dimensional gradient recalled echo (T2*)-weighted imaging, three-dimensional time-of-flight magnetic resonance angiography (3D-TOF MRA) and DWI are used for the regular diagnosis of stroke in daily clinical work (Fig.2.1). Data from basic MR sequences will be viewed or postprocessed on the work station of IMPAX (Fig.2.2).

30
Figure 2.1: An example of the basic MR sequences for stroke identification in routine clinical work in CHU Grenoble Alpes. The stroke lesion appears as a hyperintense region on DWI and a corresponding hypointense region on ADC map (white arrows). FLAIR and T2*WI are not sensitive to provide a clear profile of the stroke lesion. The feature of right middle cerebral artery (MCA) is invisible on both transverse section of TOF MRA and 3D reconstruction images (blue arrows). An old infarction or malacia is found with similar signal intensity to cerebrospinal fluid (CSF) on DWI, ADC, FLAIR and T2*WI (yellow arrows). L, left hemisphere; R, right hemisphere.
Figure 2.2: The interface of the work station based on IMPAX in CHU Grenoble Alpes.
31
2.1.1 Fluid attenuated inversion recovery imaging Recovery of longitudinal magnetization is characterized by the time
constant T1, whereas decay of transverse magnetization is characterized by the time constant T2. On T2-weighted imaging (T2WI) and FLAIR imaging, ischemic lesion appears as a mass of hyperintense seen at the early 3-6 h after stroke onset. FLAIR images can be used to assess for old cerebral infarction and the extent of small vessel disease. Moreover, FLAIR images are also highly sensitive to subarachnoid hemorrhage (SAH) as well as acute cerebral venous sinus thrombosis. However, conventional MRI sequences like T2WI or FLAIR do not have a high sensitivity to depict early infarction compared with CT [Fiebach et al. 2004].
The signal changes in FLAIR proportionately increase with a rise in water content inside the infarcted brain tissue. The volume of water content increases due to the secondary vasogenic edema after the blood brain barrier (BBB) disruption, and occurs within 1-4 h of stroke onset [Eastwood et al. 2003]. Hyperintense vessels sign (HVS) on FLAIR image has been supposed to be an indicator of slow flow and early ischemia as a result of large vessel occlusion or stenosis as well as inadequacy of collateral circulation. HVS is not equivalent to the occurred infarction but indicates tissue-at-risk (TAR) of infarction. It should prompt consideration of revascularization and flow augmentation strategies [Kamran et al. 2000]. However, the detection of the HVS has been proved to be weakened by Gadolinium in ischemic stroke. Therefore, both pre- and post-contrast FLAIR sequences are suggested [Dani et al. 2012]. Typically, single FLAIR imaging can help to detect the presence of ischemia approximately 3 h after stroke onset [Thomalla et al. 2009]. Under emergent clinical conditions, stroke patients with the exact time of symptom onset unknown remain questions of criteria on accurate evaluation of ischemia and suitable selection of treatment. FLAIR imaging has been attempted to help identify time window of tissue fate [Thomalla et al. 2010, Kang et al. 2012a]. A recent research suggests that using regional FLAIR relative signal intensity ratios of damaged and contralateral healthy tissue may be better than visual inspection alone for predicting the phase of stroke [Cheng et al. 2013].
2.1.2 Three-dimensional time-of-flight magnetic resonance
angiography Magnetic resonance angiography (MRA) provides a non-invasive
technique to screen for pathological changes of intracranial arteries such as occlusions, stenosis, malformations or aneurysms [Azuma et al. 2015, Lin Z. et al. 2016, Wrede et al. 2016]. There are two approaches, unenhanced three-dimensional time-of-flight (3D-TOF) MRA and contrast-enhanced MRA
32
(CE-MRA), available to reach this goal, each performing slightly less sensitively than the gold standard, digital subtraction angiography (DSA). With most recent hardware, image quality of optimized four-dimensional time-of-flight (4D-TOF) MRA or 7T-MRA, was comparable with DSA considering both sequences [Shibukawa et al. 2015, Wrede et al. 2016].
MRA enables the non-invasive assessment of vascular patency of the intracranial circulation. When blood flows into the imaging plane, its magnetization is at equilibrium and thus exhibits positive image contrast with respect to the background static tissues. This effect enables imaging of the vascular lumen, but only for through-plane flow [Davis et al. 1993]. Images can be generated on which flow within the vessel yielding increased signal intensity (bright blood) or on which the lumen is depicted as decreased signal intensity (black blood). TOF is regarded as the most frequently used bright-blood MR angiographic technique for current applications [Naveen et al. 2015].
By using recent technical improvements like parallel imaging and higher magnetic fields, high spatial isotropic resolution, fast acquisition times and reduced artifacts can be achieved by 3D-TOF MRA [Kloska et al. 2010, Gonzalez et al. 2012]. As a rapid diagnosis tool, 3D-TOF MRA can be used to detect intravascular occlusion due to thrombus and to evaluate the stenosis of vessels in patients with AIS, especially in uncooperative patients [Mezzapesa et al. 2006, Lin Z. et al. 2016].
An alternative to 3D-TOF MRA is CE-MRA, typically involving the intravenous injection of a paramagnetic contrast agent such as Gadolinium Diethyl-Triamine-Penta-Acetic acid (Gd-DTPA), which enhances T1 relaxation by increasing the signal intensity of blood on appropriately T1-weighted images, with respect to the signal from static tissues. CE-MRA provides more contrast than 3D-TOF and is much less sensitive to flow dynamics. Consequently, CE-MRA can be used more effectively to show both extracranial and intracranial vessels [Runge et al. 1993, Sohn et al. 2003]. Accumulating evidences also illustrate that CE-MRA can be used to scrutinize characterization of vulnerable plaque in the carotid arteries, which is a potential imaging marker of stroke risk [Wasserman et al. 2010, Yamada et al. 2016]. One disadvantage of CE-MRA is that Gadolinium contrast agent administration is contraindicated to those who with poor renal function [Morita et al. 2011].
However, an image similar to a conventional arteriogram can be reconstructed from the intravascular signals that are sensitive to a large vessel occlusion or a narrowing in the internal carotid, vertebral, basilar and first and second segments of the anterior, middle and posterior cerebral arteries. It was reported that unenhanced 3D-TOF MRA at 3T cannot replace DSA, and evaluation of intraluminal structure remained difficult with MRA regardless 3D-TOF or CE-MRA at 3T [Azuma et al. 2015, Attali et al. 2016]. Although 3D-TOF MRA has yet been the preferred approach in a large-scale clinical trial, the need for differentiating which patients have lesions amenable to
33
thrombolysis seems clear given the potential risks of treatment [Nour et al. 2014].
2.1.3 Two-dimensional gradient recalled echo (T2*)-
weighted imaging In hyperacute / acute phase of stroke, especially in populations with
relevant risk factors such as hypertension, the first task is to differentiate ischemic stroke from ICH, which is impossible to confirm by clinical findings only. Generally, as a fast imaging technique, CT is demanded as the standard method for the clinical diagnosis of ICH [Alobeidi et al. 2015, Fink et al. 2015].
T2* reflects decay of transverse magnetization which is measured in the absence of compensation for all macroscopic sources of magnetic field inhomogeneity in space and is typically smaller than corresponding T2 value [Macintosh et al. 2013]. T2* provides an additional mechanism to achieve tissue-specific MR signal contrast by reducing the phase coherence of magnetization in the transverse plane and resulting in a rapider decay of transverse magnetization than is measured by the T2 parameter [Kidambi et al. 2014].
T2*-weighted imaging contributes to multiple clinical applications, which stem from the fact that the T2* signals of blood vary with oxygenation content, based on the magnetic susceptibility characteristics of the oxygenated / deoxygenated hemoglobin and increase the local magnetic field inhomogeneities with iron deposition, separately [Anderson et al. 2001, Mokhtar et al. 2016]. Abnormal accumulation of deoxygenated blood provides hypointensity on T2*-weighted images, which is supposed to be an indicator of vascular pathological situation. It has been reported that T2*-weighted images are capable of detecting acute ICH, with equivalent accuracy to CT [Chalela et al. 2007]. Microbleeds, indicative of multiple types of micro-angiopathy can also be detected by T2*-weighted imaging, but not on CT, because of insufficient density contrast and spatial resolution. T2*-weighted images are also capable of depicting hemorrhagic transformation (HT) of ischemic stroke, and provide indications for ruling out primary intracerebral hematoma (PICH) as well as depicting thrombosed veins or sinuses [Fazekas et al. 1999]. On T2*-weighted images, hyperintensity is rarely visible in the infarct core, which is surrounded by a hypointense rim. If there is a surrounding hyperintensity on T2-weighted and T2*-weighted images with a hypointensity on T1-weighted images, it possibly represents perifocal vasogenic edema. In addition, a susceptibility reduced T2*-weighted signal of the M1 segment of the MCA by T2*-weighted imaging is a strong predictor for no early recanalization after intravenous thrombolysis in AIS patients with ICA or proximal MCA occlusion (MCAo) [Kimura et al. 2009].
34
2.1.4 Diffusion associated imaging approaches 2.1.4.1 Diffusion-weighted imaging and apparent diffusion coefficient
The normal motion of water molecules within living biological tissues is random (Brownian motion). After focal occlusion of a cerebral artery occurs, brain parenchyma can compensate a hypoperfusion up to a cerebral blood flow threshold of approximately 20 mL / 100 g tissue / min by increased oxygen extraction with intact cellular membrane. If the cerebral blood flow falls below this threshold, the neuronal cells remain viable down to a minimum cerebral blood flow of approximately 12 mL / 100 g tissue / min. However, the neuronal function starts to be impaired at this phase. After normalization of the cerebral blood flow, neuronal cells can recover without any defect. If the cerebral blood flow falls below 12 mL / 100 g tissue / min, deficit of metabolites occurs, causing a sodium-potassium adenosine triphosphatase (Na+ / K+-ATPase) pump failure in each ischemic cell [Decanniere et al. 1995, Kohno et al. 1995]. The failure of this membrane channel results in subsequent uncontrolled net shift of extracellular water into the intracellular space with the consequence of cytotoxic edema initiation and irreversible damage to the neuronal cells [Sorensen et al. 1999, Liu et al. 2001]. Depending on the extent of cerebral blood flow reduction and cell integrity status, a central area of irreversibly damaged brain parenchyma, the infarct core, and a surrounding area of acute ischemic but potentially salvageable tissue, the penumbra, can be differentiated. The portions of these two types of ischemic tissue are highly dependent preexisting cerebral arterial collaterals [Helgason et al. 2001, Famakin et al. 2009].
The reduction of Brownian molecular motion in the extracellular space can be measured with diffusion-weighted imaging (DWI), in which the anatomical site can be partially recognized based on spatial encoding and is measured as a signal attenuation providing diffusion-weighted contrast. Compared to standard MR sequences based on proton density or relaxation time, which are known to be insensitive to the immediate effects of cerebral ischemia, DWI is highly sensitive for the detection of ischemic stroke, even as early as 11 minutes after stroke onset [Hjort et al. 2005b, Mascalchi et al. 2005]. Evidence-based guidelines proposed by the Therapeutics and Technology Assessment subcommittee of the American Academy of Neurology, endorses the role of DWI in accurate diagnosis of acute ischemic stroke particularly in the first 12 h as being superior to non-enhanced CT (NECT) [Edlow et al. 2011]. Since brain regions with a strong water diffusion restriction more or less are assumed to represent the infarct core, the DWI infarct volume may have predictive ability towards final infarct volume and overall clinical outcomes [Campbell et al. 2012]. Stroke lesions can also be measured quantitatively with the apparent diffusion coefficient (ADC) map by a corresponding automatical mathematical modeling if the degree of diffusion weighting is

35
manipulated in a series of (at least two) DWI trials [Srinivasan et al. 2006] (formula seen in Chapter 5).
Stroke lesions appear as hyperintense areas on DWI and as correlative hypointense areas on ADC maps [Kim et al. 2014]. Acute ischemic lesions can be divided into hyperacute lesions with DWI-positive and low ADC value, and subacute lesions with normalized ADC value. Chronic lesions can be differentiated from acute lesions by normalization of both DWI and ADC. The presence of multiple DWI lesions of varying ages suggests active early recurrences over time and portends a higher early risk of ischemic events in the future [Seitz et al. 2005, Sylaja et al. 2007]. Moreover, small cortical or subcortical lesions in AIS, especially in the posterior fossa or brain stem, are more easily detected by DWI than CT. DWI also enables the identification of small lacunar infarcts that had previously been undetectable on CT [Nah et al. 2010].
In the normal white matter, ADC ranges are 600-1050 × 10−6 mm2 / s and the mean ADC value is 840 ± 110 × 10−6 mm2 / s [Sener et al. 2001]. If the estimated duration from focal ischemia onset is short enough, reperfusion leads to a restoration of normal ADC value [Silva et al. 2002]. If ischemia is prolonged, ADC may not recover fully, depending on the time length of ischemia and the value of ADC immediately before reperfusion. Studies of fixed ischemic duration (45 minutes) revealed that only ischemic tissue with a change in ADC ≤ 250 × 10-6 mm2 / s recovered after reperfusion [Hasegawa et al. 1994, Rudin et al. 2001]. It was also reported that an ADC ≤ 620 × 10-6 mm2 / s was proposed as the threshold for identification of infarct core (IC[2]) with a sensitivity of 69% and a specificity of 78% [Purushotham et al. 2015]. Generally, it is accepted that a single measure of ADC alone cannot distinguish reversible from irreversible ischemic damage. The duration of ischemia is an essential factor to be taken into consideration with the reduction in ADC value to determine the reversibility of stroke lesion. However, the former usually cannot readily be confirmed in clinical cases [Engelter et al. 2008].
DWI allows the detection of silent infarctions at different sites from the symptomatic, small, deep infarction and concomitant small lesions outside the striatocapsular distribution could be identified. It was reported that proximal MCA lesions were a common cause of small deep infarcts, and that patients with parental arterial disease by branch atherosclerosis were more likely to have recurrent strokes and a poor long-term prognosis [Bang et al. 2002, Bang et al. 2004].
Most lesions on DWI do correspond to brain ischemia. The mean ADC value of DWI-positive lesions is typically less decreased in patients with transient deficit than in patients with sustained deficit, which due to the inaccuracy of ADC measurements in small DWI-positive lesions that are often not detectable on ADC map [Lamy et al. 2006] (Fig.2.3). Some ischemic lesions vanish rapidly and may no longer be visible 48 hours after transient ischemic attack (TIA) onset suggesting that delayed MRI after TIA reduces the
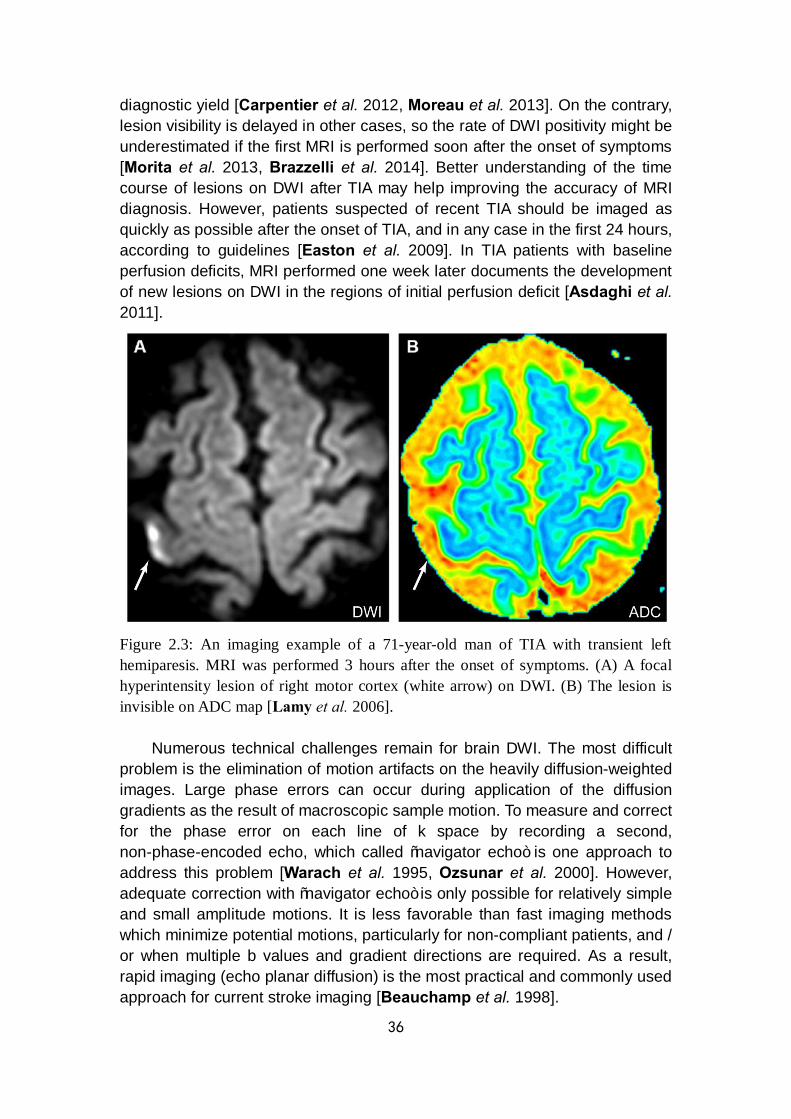
36
diagnostic yield [Carpentier et al. 2012, Moreau et al. 2013]. On the contrary, lesion visibility is delayed in other cases, so the rate of DWI positivity might be underestimated if the first MRI is performed soon after the onset of symptoms [Morita et al. 2013, Brazzelli et al. 2014]. Better understanding of the time course of lesions on DWI after TIA may help improving the accuracy of MRI diagnosis. However, patients suspected of recent TIA should be imaged as quickly as possible after the onset of TIA, and in any case in the first 24 hours, according to guidelines [Easton et al. 2009]. In TIA patients with baseline perfusion deficits, MRI performed one week later documents the development of new lesions on DWI in the regions of initial perfusion deficit [Asdaghi et al. 2011].
Figure 2.3: An imaging example of a 71-year-old man of TIA with transient left hemiparesis. MRI was performed 3 hours after the onset of symptoms. (A) A focal hyperintensity lesion of right motor cortex (white arrow) on DWI. (B) The lesion is invisible on ADC map [Lamy et al. 2006].
Numerous technical challenges remain for brain DWI. The most difficult problem is the elimination of motion artifacts on the heavily diffusion-weighted images. Large phase errors can occur during application of the diffusion gradients as the result of macroscopic sample motion. To measure and correct for the phase error on each line of k space by recording a second, non-phase-encoded echo, which called “navigator echo” is one approach to address this problem [Warach et al. 1995, Ozsunar et al. 2000]. However, adequate correction with “navigator echo” is only possible for relatively simple and small amplitude motions. It is less favorable than fast imaging methods which minimize potential motions, particularly for non-compliant patients, and / or when multiple b values and gradient directions are required. As a result, rapid imaging (echo planar diffusion) is the most practical and commonly used approach for current stroke imaging [Beauchamp et al. 1998].

37
2.1.4.2 Diffusion-based structural connectivity
The fact that Brownian motion of water molecules has a preferred direction is proved in WM tracts with preferentially occurring along the length of axonal fibers and comparatively restricted in the orthogonal directions, which is referred to as diffusion anisotropy. The myelination of axons, the axonal membrane and microtubules within axons are all considered to contribute to the diffusion anisotropy. With such property, WM fiber tracts and corresponding directions can be exploited noninvasively by MRI techniques [Nucifora et al. 2007]. If a series of DWI scans are conducted with diffusion weighting in a variety of different orientations, the direction and magnitude of diffusion and the correlations between motions in different directions can be potentially estimated to define the anisotropic diffusion tensor imaging, termed DTI [Goto et al. 2016].
DTI is the most common method for the demonstration of changes in anatomical connectivity in vivo [Le Bihan et al. 2003]. Besides the reconstructed visualization of fiber tracts, the anatomical connectivity changes can also be assessed by evaluating diffusion characteristics, such as fractional anisotropy (FA) and mean diffusivity (MD), the two most commonly used measures. FA is a summary measure of microstructural integrity, which represents the degree of directionality of molecular displacement by diffusion and describes the extent of a preferred diffusion direction within a particular voxel. It varies between 0 and 1, which refers to the value of isotropic diffusion and infinite anisotropic diffusion. MD is an inverse measure of the membrane density, which reflects the average diffusion amplitude of molecular displacement in three orthogonal directions [Qin et al. 2012] (Fig.2.4).
Figure 2.4: DTI quantitative parametric maps including (A) T2-weighted imaging (T2WI, b = 0) based on DTI data as reference, (B) mean diffusivity (MD) which is similar to T2W image, (C) fractional anisotropy (FA) with white matter (WM) appearing hyperintense and (D) the major eigenvector direction indicated by color with red = R / L, green = A / P and blue = S / I, weighted by FA, adapted from [Alexander et al. 2007].
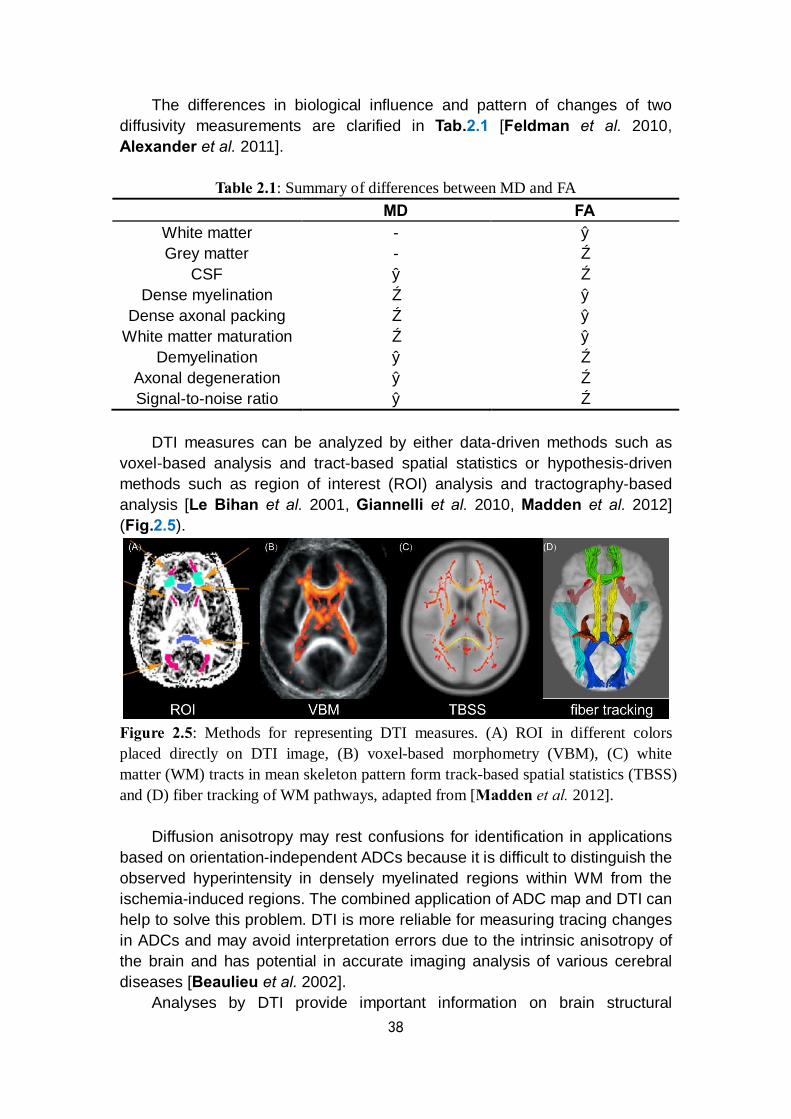
38
The differences in biological influence and pattern of changes of two diffusivity measurements are clarified in Tab.2.1 [Feldman et al. 2010, Alexander et al. 2011].
Table 2.1: Summary of differences between MD and FA MD FA
White matter - ↑ Grey matter - ↓
CSF ↑ ↓ Dense myelination ↓ ↑
Dense axonal packing ↓ ↑ White matter maturation ↓ ↑
Demyelination ↑ ↓ Axonal degeneration ↑ ↓ Signal-to-noise ratio ↑ ↓
DTI measures can be analyzed by either data-driven methods such as
voxel-based analysis and tract-based spatial statistics or hypothesis-driven methods such as region of interest (ROI) analysis and tractography-based analysis [Le Bihan et al. 2001, Giannelli et al. 2010, Madden et al. 2012] (Fig.2.5).
Figure 2.5: Methods for representing DTI measures. (A) ROI in different colors placed directly on DTI image, (B) voxel-based morphometry (VBM), (C) white matter (WM) tracts in mean skeleton pattern form track-based spatial statistics (TBSS) and (D) fiber tracking of WM pathways, adapted from [Madden et al. 2012].
Diffusion anisotropy may rest confusions for identification in applications based on orientation-independent ADCs because it is difficult to distinguish the observed hyperintensity in densely myelinated regions within WM from the ischemia-induced regions. The combined application of ADC map and DTI can help to solve this problem. DTI is more reliable for measuring tracing changes in ADCs and may avoid interpretation errors due to the intrinsic anisotropy of the brain and has potential in accurate imaging analysis of various cerebral diseases [Beaulieu et al. 2002].
Analyses by DTI provide important information on brain structural
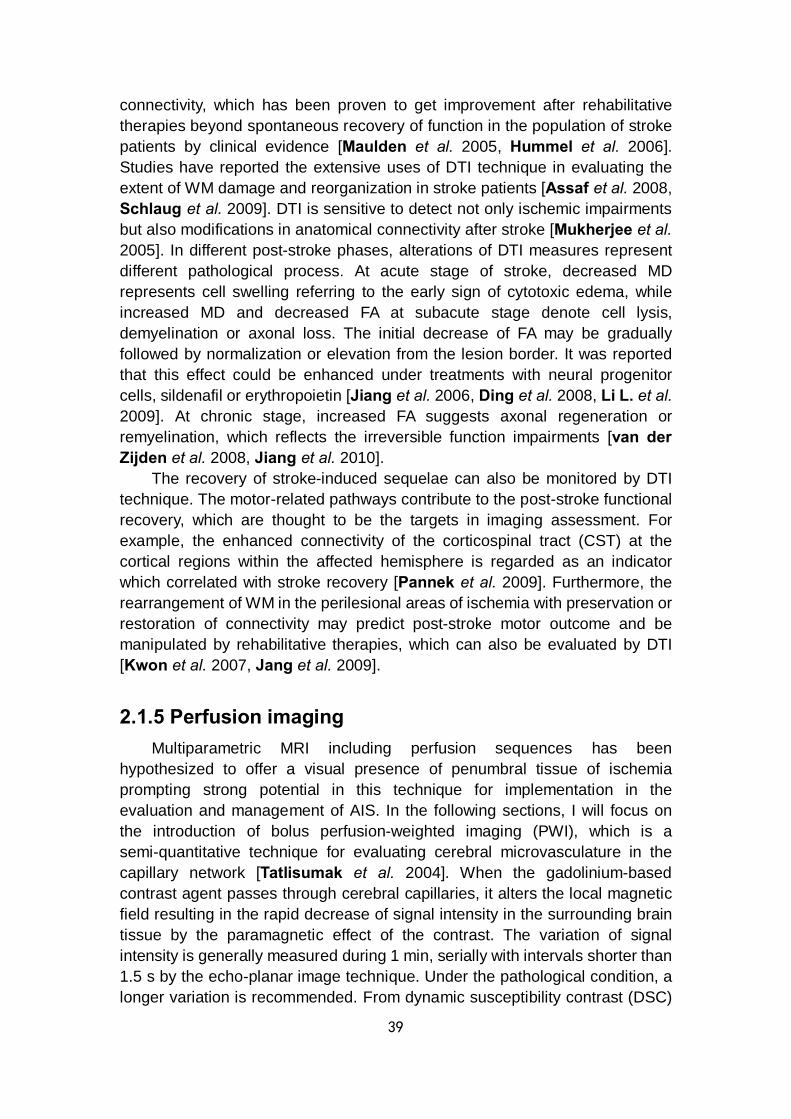
39
connectivity, which has been proven to get improvement after rehabilitative therapies beyond spontaneous recovery of function in the population of stroke patients by clinical evidence [Maulden et al. 2005, Hummel et al. 2006]. Studies have reported the extensive uses of DTI technique in evaluating the extent of WM damage and reorganization in stroke patients [Assaf et al. 2008, Schlaug et al. 2009]. DTI is sensitive to detect not only ischemic impairments but also modifications in anatomical connectivity after stroke [Mukherjee et al. 2005]. In different post-stroke phases, alterations of DTI measures represent different pathological process. At acute stage of stroke, decreased MD represents cell swelling referring to the early sign of cytotoxic edema, while increased MD and decreased FA at subacute stage denote cell lysis, demyelination or axonal loss. The initial decrease of FA may be gradually followed by normalization or elevation from the lesion border. It was reported that this effect could be enhanced under treatments with neural progenitor cells, sildenafil or erythropoietin [Jiang et al. 2006, Ding et al. 2008, Li L. et al. 2009]. At chronic stage, increased FA suggests axonal regeneration or remyelination, which reflects the irreversible function impairments [van der Zijden et al. 2008, Jiang et al. 2010].
The recovery of stroke-induced sequelae can also be monitored by DTI technique. The motor-related pathways contribute to the post-stroke functional recovery, which are thought to be the targets in imaging assessment. For example, the enhanced connectivity of the corticospinal tract (CST) at the cortical regions within the affected hemisphere is regarded as an indicator which correlated with stroke recovery [Pannek et al. 2009]. Furthermore, the rearrangement of WM in the perilesional areas of ischemia with preservation or restoration of connectivity may predict post-stroke motor outcome and be manipulated by rehabilitative therapies, which can also be evaluated by DTI [Kwon et al. 2007, Jang et al. 2009].
2.1.5 Perfusion imaging Multiparametric MRI including perfusion sequences has been
hypothesized to offer a visual presence of penumbral tissue of ischemia prompting strong potential in this technique for implementation in the evaluation and management of AIS. In the following sections, I will focus on the introduction of bolus perfusion-weighted imaging (PWI), which is a semi-quantitative technique for evaluating cerebral microvasculature in the capillary network [Tatlisumak et al. 2004]. When the gadolinium-based contrast agent passes through cerebral capillaries, it alters the local magnetic field resulting in the rapid decrease of signal intensity in the surrounding brain tissue by the paramagnetic effect of the contrast. The variation of signal intensity is generally measured during 1 min, serially with intervals shorter than 1.5 s by the echo-planar image technique. Under the pathological condition, a longer variation is recommended. From dynamic susceptibility contrast (DSC)
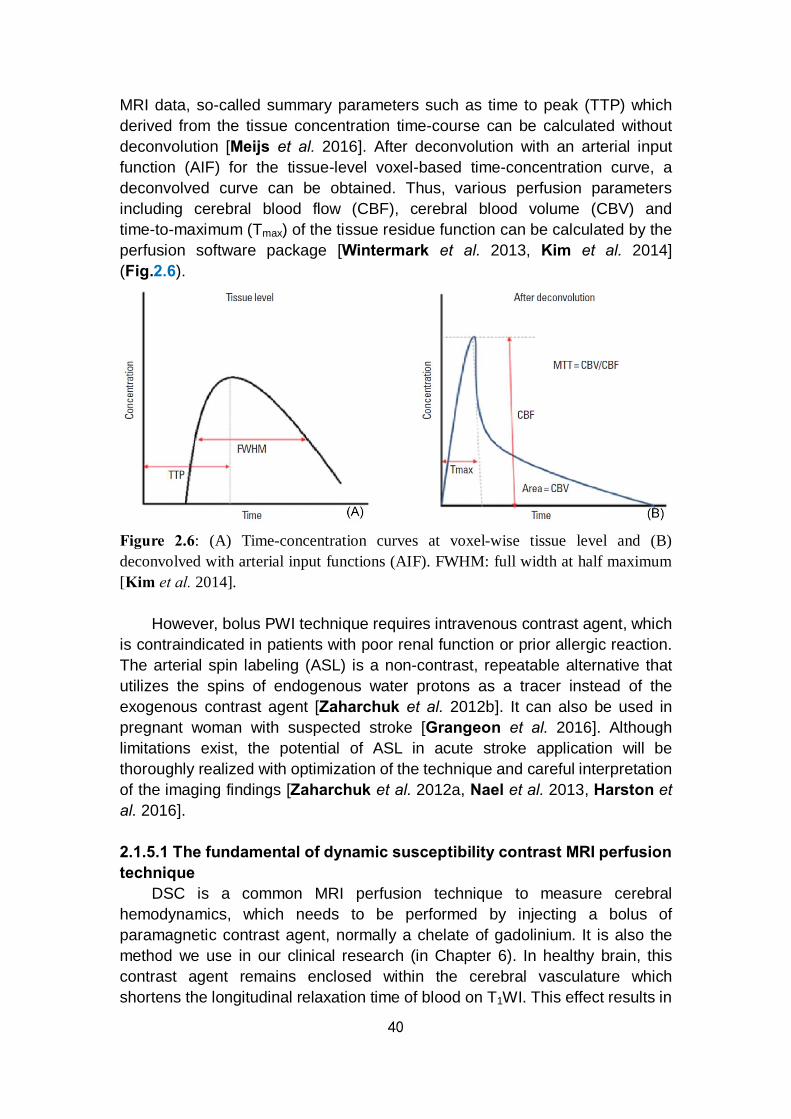
40
MRI data, so-called summary parameters such as time to peak (TTP) which derived from the tissue concentration time-course can be calculated without deconvolution [Meijs et al. 2016]. After deconvolution with an arterial input function (AIF) for the tissue-level voxel-based time-concentration curve, a deconvolved curve can be obtained. Thus, various perfusion parameters including cerebral blood flow (CBF), cerebral blood volume (CBV) and time-to-maximum (Tmax) of the tissue residue function can be calculated by the perfusion software package [Wintermark et al. 2013, Kim et al. 2014] (Fig.2.6).
Figure 2.6: (A) Time-concentration curves at voxel-wise tissue level and (B) deconvolved with arterial input functions (AIF). FWHM: full width at half maximum [Kim et al. 2014].
However, bolus PWI technique requires intravenous contrast agent, which is contraindicated in patients with poor renal function or prior allergic reaction. The arterial spin labeling (ASL) is a non-contrast, repeatable alternative that utilizes the spins of endogenous water protons as a tracer instead of the exogenous contrast agent [Zaharchuk et al. 2012b]. It can also be used in pregnant woman with suspected stroke [Grangeon et al. 2016]. Although limitations exist, the potential of ASL in acute stroke application will be thoroughly realized with optimization of the technique and careful interpretation of the imaging findings [Zaharchuk et al. 2012a, Nael et al. 2013, Harston et al. 2016]. 2.1.5.1 The fundamental of dynamic susceptibility contrast MRI perfusion technique
DSC is a common MRI perfusion technique to measure cerebral hemodynamics, which needs to be performed by injecting a bolus of paramagnetic contrast agent, normally a chelate of gadolinium. It is also the method we use in our clinical research (in Chapter 6). In healthy brain, this contrast agent remains enclosed within the cerebral vasculature which shortens the longitudinal relaxation time of blood on T1WI. This effect results in
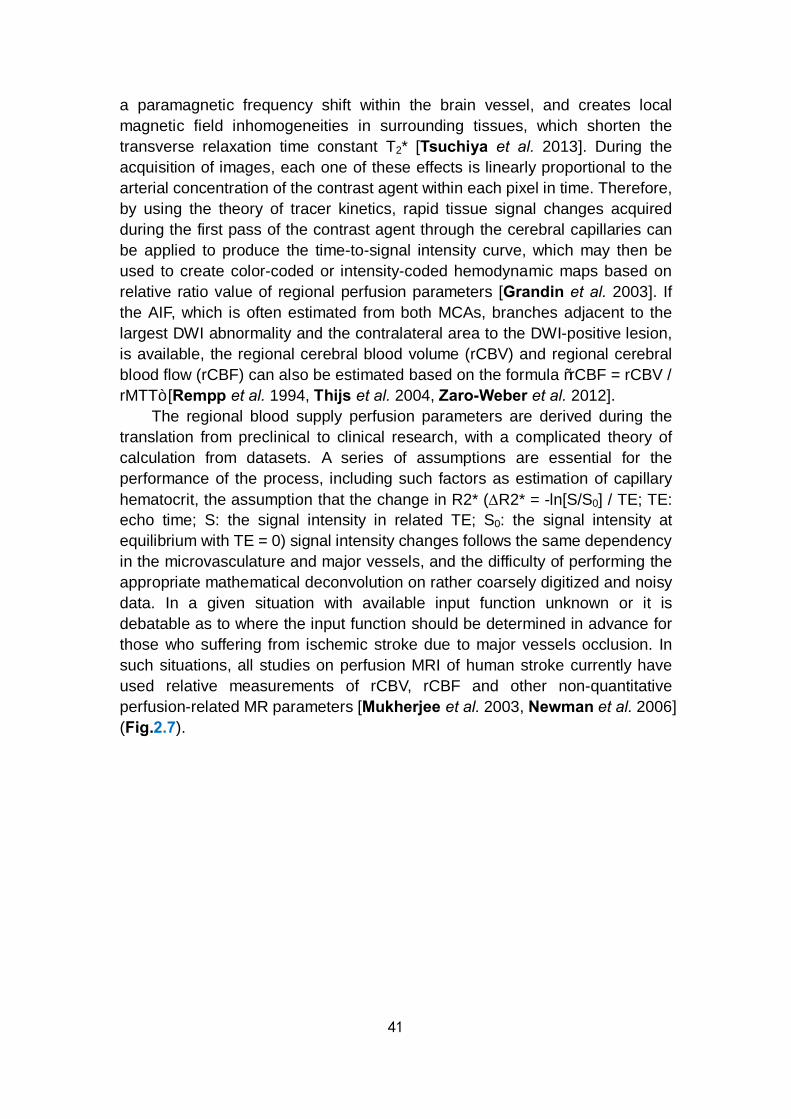
41
a paramagnetic frequency shift within the brain vessel, and creates local magnetic field inhomogeneities in surrounding tissues, which shorten the transverse relaxation time constant T2* [Tsuchiya et al. 2013]. During the acquisition of images, each one of these effects is linearly proportional to the arterial concentration of the contrast agent within each pixel in time. Therefore, by using the theory of tracer kinetics, rapid tissue signal changes acquired during the first pass of the contrast agent through the cerebral capillaries can be applied to produce the time-to-signal intensity curve, which may then be used to create color-coded or intensity-coded hemodynamic maps based on relative ratio value of regional perfusion parameters [Grandin et al. 2003]. If the AIF, which is often estimated from both MCAs, branches adjacent to the largest DWI abnormality and the contralateral area to the DWI-positive lesion, is available, the regional cerebral blood volume (rCBV) and regional cerebral blood flow (rCBF) can also be estimated based on the formula “rCBF = rCBV / rMTT” [Rempp et al. 1994, Thijs et al. 2004, Zaro-Weber et al. 2012].
The regional blood supply perfusion parameters are derived during the translation from preclinical to clinical research, with a complicated theory of calculation from datasets. A series of assumptions are essential for the performance of the process, including such factors as estimation of capillary hematocrit, the assumption that the change in R2* (∆R2* = -ln[S/S0] / TE; TE: echo time; S: the signal intensity in related TE; S0: the signal intensity at equilibrium with TE = 0) signal intensity changes follows the same dependency in the microvasculature and major vessels, and the difficulty of performing the appropriate mathematical deconvolution on rather coarsely digitized and noisy data. In a given situation with available input function unknown or it is debatable as to where the input function should be determined in advance for those who suffering from ischemic stroke due to major vessels occlusion. In such situations, all studies on perfusion MRI of human stroke currently have used relative measurements of rCBV, rCBF and other non-quantitative perfusion-related MR parameters [Mukherjee et al. 2003, Newman et al. 2006] (Fig.2.7).
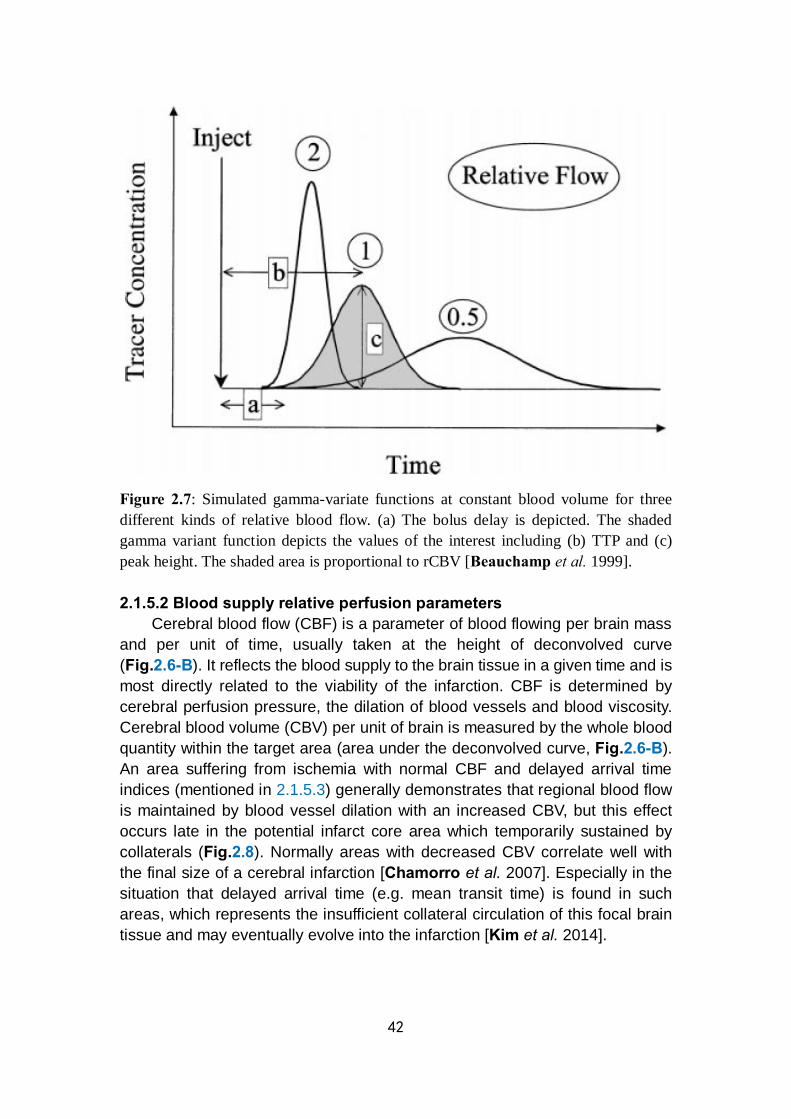
42
Figure 2.7: Simulated gamma-variate functions at constant blood volume for three different kinds of relative blood flow. (a) The bolus delay is depicted. The shaded gamma variant function depicts the values of the interest including (b) TTP and (c) peak height. The shaded area is proportional to rCBV [Beauchamp et al. 1999]. 2.1.5.2 Blood supply relative perfusion parameters
Cerebral blood flow (CBF) is a parameter of blood flowing per brain mass and per unit of time, usually taken at the height of deconvolved curve (Fig.2.6-B). It reflects the blood supply to the brain tissue in a given time and is most directly related to the viability of the infarction. CBF is determined by cerebral perfusion pressure, the dilation of blood vessels and blood viscosity. Cerebral blood volume (CBV) per unit of brain is measured by the whole blood quantity within the target area (area under the deconvolved curve, Fig.2.6-B). An area suffering from ischemia with normal CBF and delayed arrival time indices (mentioned in 2.1.5.3) generally demonstrates that regional blood flow is maintained by blood vessel dilation with an increased CBV, but this effect occurs late in the potential infarct core area which temporarily sustained by collaterals (Fig.2.8). Normally areas with decreased CBV correlate well with the final size of a cerebral infarction [Chamorro et al. 2007]. Especially in the situation that delayed arrival time (e.g. mean transit time) is found in such areas, which represents the insufficient collateral circulation of this focal brain tissue and may eventually evolve into the infarction [Kim et al. 2014].
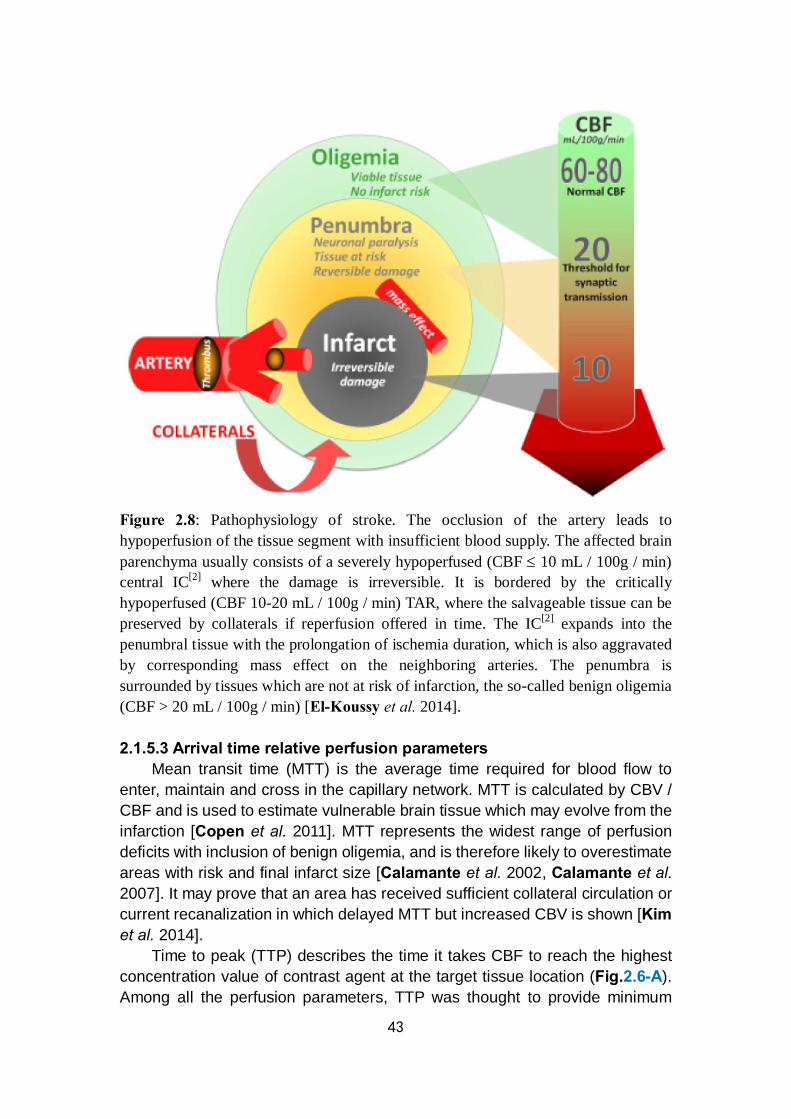
43
Figure 2.8: Pathophysiology of stroke. The occlusion of the artery leads to hypoperfusion of the tissue segment with insufficient blood supply. The affected brain parenchyma usually consists of a severely hypoperfused (CBF ≤ 10 mL / 100g / min) central IC[2] where the damage is irreversible. It is bordered by the critically hypoperfused (CBF 10-20 mL / 100g / min) TAR, where the salvageable tissue can be preserved by collaterals if reperfusion offered in time. The IC[2] expands into the penumbral tissue with the prolongation of ischemia duration, which is also aggravated by corresponding mass effect on the neighboring arteries. The penumbra is surrounded by tissues which are not at risk of infarction, the so-called benign oligemia (CBF > 20 mL / 100g / min) [El-Koussy et al. 2014]. 2.1.5.3 Arrival time relative perfusion parameters
Mean transit time (MTT) is the average time required for blood flow to enter, maintain and cross in the capillary network. MTT is calculated by CBV / CBF and is used to estimate vulnerable brain tissue which may evolve from the infarction [Copen et al. 2011]. MTT represents the widest range of perfusion deficits with inclusion of benign oligemia, and is therefore likely to overestimate areas with risk and final infarct size [Calamante et al. 2002, Calamante et al. 2007]. It may prove that an area has received sufficient collateral circulation or current recanalization in which delayed MTT but increased CBV is shown [Kim et al. 2014].
Time to peak (TTP) describes the time it takes CBF to reach the highest concentration value of contrast agent at the target tissue location (Fig.2.6-A). Among all the perfusion parameters, TTP was thought to provide minimum

44
information because it is an indirect measurement of brain perfusion. Like MTT, a delay in TTP in patients with chronic carotid artery stenosis cannot indicate acute infarction only by showing prolonged arrival time. Therefore, TTP may also overestimate the hypoperfused area in an acute infarction [Kim et al. 2014]. Still, TTP is much more sensitive than CBV map in detecting abnormalities in AIS. Two reasons may get involved to the increased TTP: i) blood flow may decrease with increased MTT at constant blood volume, or ii) blood flow may be collateral or contralateral with the consequence that the bolus has to traverse a longer path to reach the ischemic region finally. Furthermore, it is also possible that both mechanisms occur [Soher et al. 1998, Helenius et al. 2003].
Time-to-maximum (Tmax) is the time that tissue residue function takes to reach its maximum value. Tmax is sensitive to reflect dynamic changes of brain tissue into an infarction and changes in the perfusion state. It can also predict tissue viability, as a non-physiological parameter of the capability of brain tissue to survive. Since this parameter is not influenced by scan duration, Tmax has the merit that sufficient scanning for a long time is possible, so that contrast agent is well-distributed [Copen et al. 2011]. Thus, Tmax is the most widely accepted reliable parameter to assess the penumbra, but with the exact value remaining controversial. In previous studies, different thresholds for Tmax were set to represent the accurate penumbra in the Diffusion and Perfusion Imaging Evaluation for Understanding Stroke Evolution (DEFUSE) trial [Albers et al. 2006a], whereas in the evaluation of alteplase effects beyond 3 h after stroke onset in the Echoplanar Imaging Thrombolytic Evaluation Trial (EPITHET) cohort, a Tmax of 4-6 s delay was used [Donnan et al. 2009]. A study reported that a Tmax > 8 s with a core volume of approximately 100 mL (lesion size on DWI) as an adequate threshold for identification of patients with malignant profile of infarction who would have unfavorable outcomes despite reperfusion therapy [Mlynash et al. 2011], while another study suggested that Tmax ≥ 10 s delay best predicts the final infarction [Nagakane et al. 2012]. The features of conventional MRI techniques for stroke are summarized in Tab.2.2.
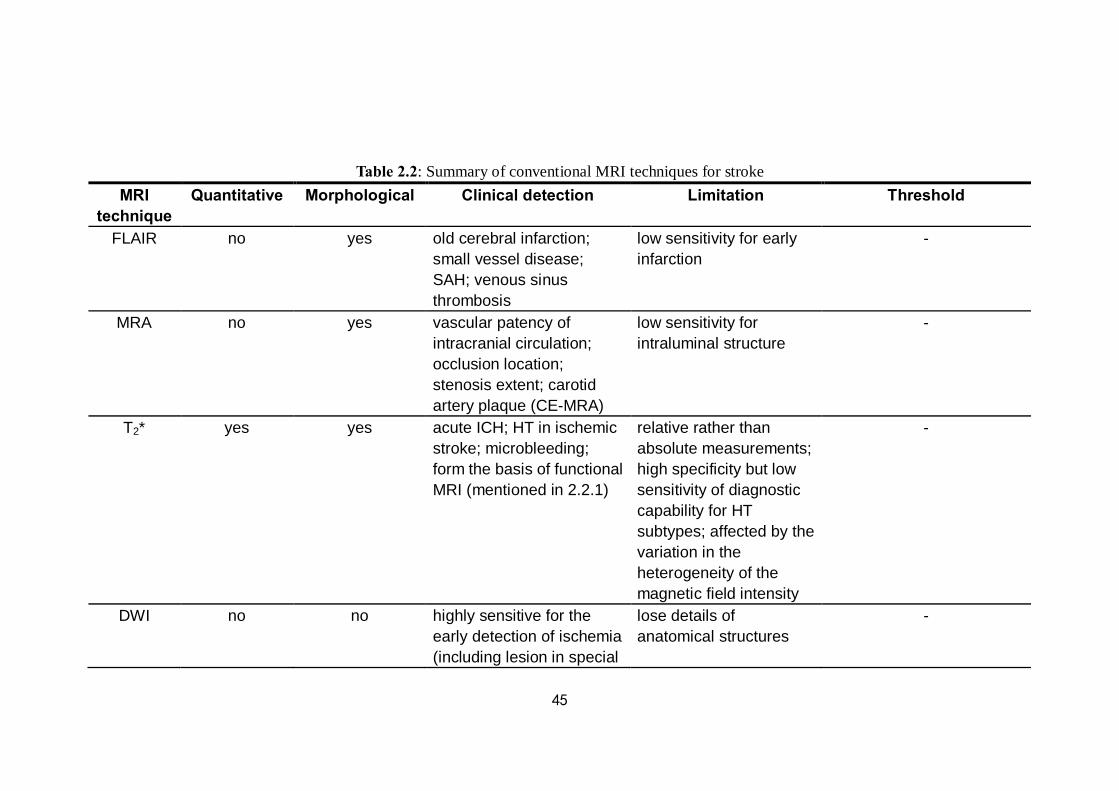
45
Table 2.2: Summary of conventional MRI techniques for stroke MRI
technique Quantitative Morphological Clinical detection Limitation Threshold
FLAIR no yes old cerebral infarction; small vessel disease; SAH; venous sinus thrombosis
low sensitivity for early infarction
-
MRA no yes vascular patency of intracranial circulation; occlusion location; stenosis extent; carotid artery plaque (CE-MRA)
low sensitivity for intraluminal structure
-
T2* yes yes acute ICH; HT in ischemic stroke; microbleeding; form the basis of functional MRI (mentioned in 2.2.1)
relative rather than absolute measurements; high specificity but low sensitivity of diagnostic capability for HT subtypes; affected by the variation in the heterogeneity of the magnetic field intensity
-
DWI no no highly sensitive for the early detection of ischemia (including lesion in special
lose details of anatomical structures
-

46
anatomical site, lacunar infarct, silent infarction); measurement of infarct volume
ADC yes no ADC values help identify stroke phases; the extent of IC[2]
inaccuracy in small DWI-positive lesion measurement (TIA); the prediction of tissue fate is affected by heterogeneous ADC values in the lesion
one example of IC[2] identification: ADC ≤ 620 × 10-6 mm2 / s (a sensitivity of 69% and a specificity of 78%) [Purushotham et al. 2015]; while the fate of brain tissue within and around the DWI lesion has been proven to be variable and not to be predicted based on the ADC alone [Loh et al. 2005]
DTI yes yes tracing changes with diffusion direction and amplitude of molecular displacement; structural (anatomical) connectivity; post-stroke WM damage and reorganization
- -
MD sensitive to cellularity, edema and necrosis
- mean of the largest, medium and smallest eigenvalue of diffusion
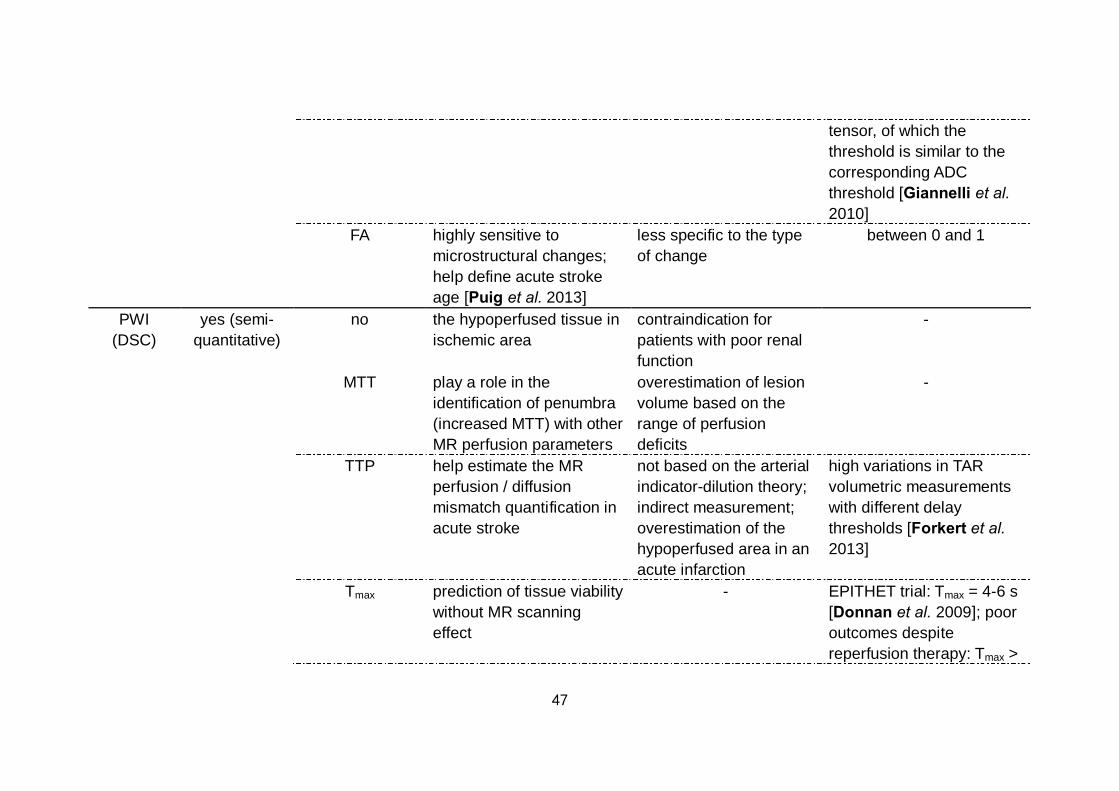
47
tensor, of which the threshold is similar to the corresponding ADC threshold [Giannelli et al. 2010]
FA highly sensitive to microstructural changes; help define acute stroke age [Puig et al. 2013]
less specific to the type of change
between 0 and 1
PWI (DSC)
yes (semi- quantitative)
no the hypoperfused tissue in ischemic area
contraindication for patients with poor renal function
-
MTT play a role in the identification of penumbra (increased MTT) with other MR perfusion parameters
overestimation of lesion volume based on the range of perfusion deficits
-
TTP help estimate the MR perfusion / diffusion mismatch quantification in acute stroke
not based on the arterial indicator-dilution theory; indirect measurement; overestimation of the hypoperfused area in an acute infarction
high variations in TAR volumetric measurements with different delay thresholds [Forkert et al. 2013]
Tmax prediction of tissue viability without MR scanning effect
- EPITHET trial: Tmax = 4-6 s [Donnan et al. 2009]; poor outcomes despite reperfusion therapy: Tmax >

48
8 s with core volume ≈ 100 mL [Mlynash et al. 2011]; prediction of final infarction: Tmax ≥ 10 s [Nagakane et al. 2012]; however, no standard of the delay threshold has been established by unified opinion
CBF play an important role in delineating hypoperfused brain tissue; decrease moderately in penumbra; help identify the infarct core with restricted diffusion apart from decreased CBF
difficult to measure in absolute terms (normally relative measurement to an internal control is applied instead)
IC[2]: CBF ≤ 10 mL / 100g / min; TAR: CBF 10-20 mL / 100g / min; benign oligemia: CBF ≥ 20 mL / 100g / min [El-Koussy et al. 2014]; still, differences of the threshold exist between quantification techniques and researches
CBV remain normal or increase in penumbra; reflect auto-regulatory mechanisms in ischemia; help evaluate the capillary perfusion by collaterals
absolute measurement is influenced by the permeability of microvasculature (normally relative measurement is calculated instead)
49
2.2 Advanced MRI techniques for clinical ischemic
stroke
2.2.1 Functional connectivity MRI application after
ischemic stroke As mentioned in Section 2.1.4.2, structural damage from ischemic stroke
onset is associated with both local and global changes in brain function. Since the evolution of stroke is generally static after the initial damage, subsequent functional changes of victims are more likely to represent the brain responses to ischemic injury than just to represent ongoing pathological processes. Challenges and opportunities are brought out based on such stroke features by means of functional MRI (fMRI) to analyze the consequence of focal ischemia on brain function and recovery, as well as the reorganization in brain [Carter et al. 2012b].
However, knowledge of brain functional alteration in a particular region cannot contribute to the mechanisms of interactions among all regions which modulate behavior in concert by a single brain activation [Stephan et al. 2007]. Great insight into neural network dysfunction and functional reorganization based on a system perspective can be provided by functional connectivity analyses [van Meer et al. 2010, Carter et al. 2012b]. Connectivity changes may contribute to a better prediction of stroke outcomes and an inspiration for new therapeutic intervention development [Carter et al. 2012a]. Besides structural connectivity by DTI mentioned before, fMRI-based functional connectivity describes how anatomically connected areas physiologically interact with each other, which is defined as temporal dependency between spatially remote neurophysiological events with a non-directional and extensively correlative nature [Stephan et al. 2007] (Fig.2.9).

50
Figure 2.9: Connectivity analysis methods implemented for brain networks can be acquired with different monitoring modalities. The functional organization of the brain is characterized by segregation and integration of imaging data processing. Brain connectivity analysis can be divided into three different but related forms including structural, functional and effective connectivity. Effective connectivity refers to the causal interactions between different activated brain areas which described by the influence one neuronal system exerts upon another under the assumptions of a given mechanistic model [Stephan et al. 2007] (from multimodal connectivity brain network project of cognitive engineering in Singapore Institute for Neurotechnology, SINAPSE) From the website: http://www.sinapseinstitute.org/projects/cognitiveengr/connectivity
In acute stroke settings, the application of fMRI based on the blood oxygenation level dependent (BOLD) signal helps to define the penumbra condition, which is identified as an area of hypoperfusion with remaining

51
metabolic activity evaluated by indices such as the oxygen extraction fraction (OEF) and the cerebral metabolic rate of oxygen (CMRO2) [Heiss et al. 2000a]. Compared with positron emission tomography (PET), BOLD-fMRI is feasible to measure these metrics in human in vivo non-invasively and without ionizing radiation [Bulte et al. 2012]. The imaging principle of BOLD-fMRI is that metabolic events triggered by neuronal activity generated by sensory stimuli or behavior of memory, cognition, action or emotion, result in increased CBV and decreased deoxyhemoglobin content subsequently, which lead to increases in BOLD signal by reducing local magnetic inhomogeneities in activated region [Heeger et al. 2002]. This technique enables the investigation of brain reorganization processes with spatial resolution of millimeters and provides information of neural activity at the macroscale level [Hyde et al. 2001, Rehme et al. 2013].
Based on a theoretical perspective which is different from structural connectivity, fMRI allows a direct and fairly straightforward measure of interaction between different brain regions. Thus, the signal provides a large scale view of functional systems across the entire brain network and the correlative regional interaction which not depends on simple mono-synaptic connections [Honey et al. 2009]. Therefore, it is regarded as a promising tool to study the remote physiological effects of lesions distributed on distant areas.
The main advantage of this approach is that the measures of data are not only at the group level but also for individual objects. And it can be easily obtained even in severe patients that cannot cooperate in cognitive testing during scanning. Furthermore, it is possible to obtain a survey of multiple networks in time in a single scan [Tambini et al. 2010, Grefkes et al. 2011, Westlake et al. 2011, Van Essen et al. 2012].
Beyond the affect area suffered from an ischemic lesion, the intact functional network architecture of remote cortical areas can also be affected due to this structural damage [Nomura et al. 2010, Wang et al. 2010]. The functional interactions between these distinct areas constituting a network can be described by functional connectivity evaluation which based on the statistical association, generally the temporal correlation or covariance, between spatially remote neurophysiological processes [Marrelec et al. 2009]. By neuroimaging series, resting-state functional connectivity illustrates intrinsic, spontaneous networks that elucidate the functional architecture of the human brain under task-independent condition [Biswal et al. 2010, Friston et al. 2011]. A ROI can be selected as a reference to define voxels in the brain image which correlated with network activity in a region over time [Pugh et al. 2000]. The coherence across the whole brain with such ROIs is analyzed from imaging data [Lewis et al. 2009]. The identification of the processes that induce functional improvement in the brain network may reveal appropriate therapeutic targets for rehabilitation strategies and help develop novel interventions [Kolb et al. 2010, Bajaj et al. 2015].
Immediately after stroke onset, resting-state functional connectivity of the
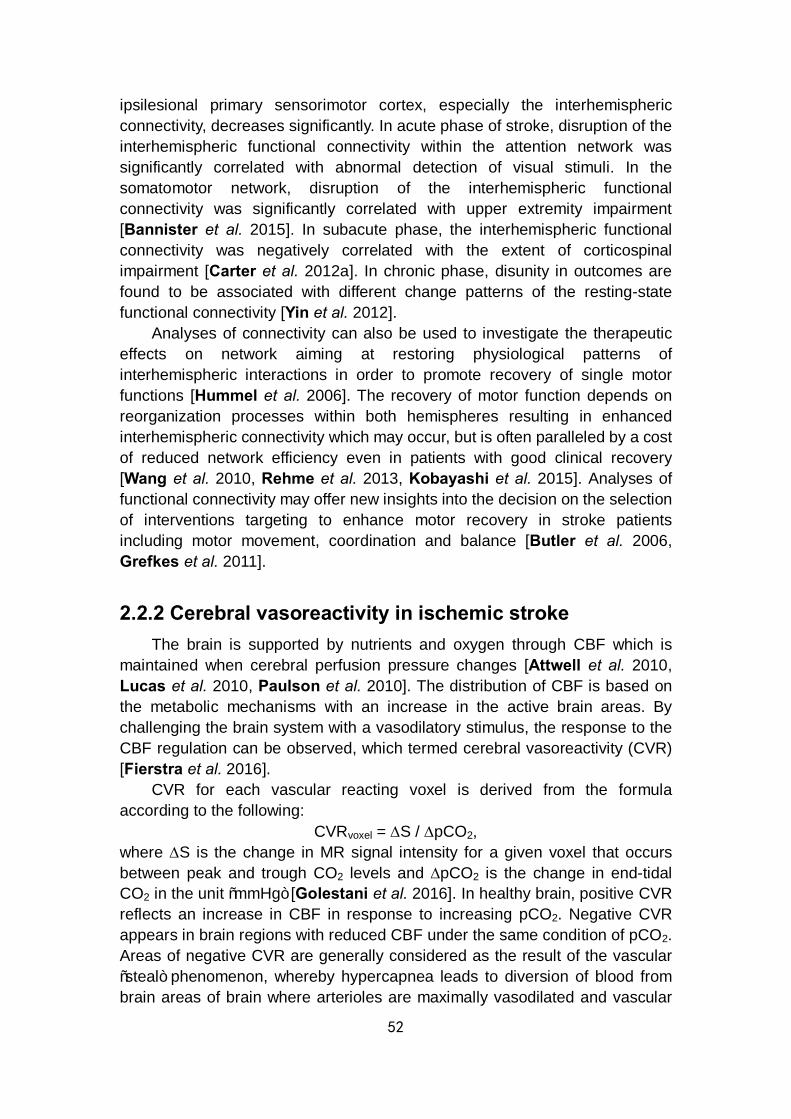
52
ipsilesional primary sensorimotor cortex, especially the interhemispheric connectivity, decreases significantly. In acute phase of stroke, disruption of the interhemispheric functional connectivity within the attention network was significantly correlated with abnormal detection of visual stimuli. In the somatomotor network, disruption of the interhemispheric functional connectivity was significantly correlated with upper extremity impairment [Bannister et al. 2015]. In subacute phase, the interhemispheric functional connectivity was negatively correlated with the extent of corticospinal impairment [Carter et al. 2012a]. In chronic phase, disunity in outcomes are found to be associated with different change patterns of the resting-state functional connectivity [Yin et al. 2012].
Analyses of connectivity can also be used to investigate the therapeutic effects on network aiming at restoring physiological patterns of interhemispheric interactions in order to promote recovery of single motor functions [Hummel et al. 2006]. The recovery of motor function depends on reorganization processes within both hemispheres resulting in enhanced interhemispheric connectivity which may occur, but is often paralleled by a cost of reduced network efficiency even in patients with good clinical recovery [Wang et al. 2010, Rehme et al. 2013, Kobayashi et al. 2015]. Analyses of functional connectivity may offer new insights into the decision on the selection of interventions targeting to enhance motor recovery in stroke patients including motor movement, coordination and balance [Butler et al. 2006, Grefkes et al. 2011].
2.2.2 Cerebral vasoreactivity in ischemic stroke The brain is supported by nutrients and oxygen through CBF which is
maintained when cerebral perfusion pressure changes [Attwell et al. 2010, Lucas et al. 2010, Paulson et al. 2010]. The distribution of CBF is based on the metabolic mechanisms with an increase in the active brain areas. By challenging the brain system with a vasodilatory stimulus, the response to the CBF regulation can be observed, which termed cerebral vasoreactivity (CVR) [Fierstra et al. 2016].
CVR for each vascular reacting voxel is derived from the formula according to the following:
CVRvoxel = ∆S / ∆pCO2, where ∆S is the change in MR signal intensity for a given voxel that occurs between peak and trough CO2 levels and ∆pCO2 is the change in end-tidal CO2 in the unit “mmHg” [Golestani et al. 2016]. In healthy brain, positive CVR reflects an increase in CBF in response to increasing pCO2. Negative CVR appears in brain regions with reduced CBF under the same condition of pCO2. Areas of negative CVR are generally considered as the result of the vascular “steal” phenomenon, whereby hypercapnea leads to diversion of blood from brain areas of brain where arterioles are maximally vasodilated and vascular

53
resistance is already minimized to areas of the brain capable of decreasing vascular resistance in response to a CO2 stimulus [Mandell et al. 2008, Heyn et al. 2010]. Measuring variations of CVR between different brain regions has the potential to not only better understanding of how the cerebral vasculature controls the distribution of blood flow but also to detect cerebrovascular pathophysiological processes [Mandell et al. 2011, Fierstra et al. 2013].
CVR measurement has potential to assess the risk factors of ischemic stroke. Carotid artery stenosis is one of the factors which cannot be underestimated in the prediction of stroke occurrence because it has been reported that 20% of the 2-year incidence rate with symptomatic disease after intracranial arterial stenosis [Famakin et al. 2009]. BOLD-fMRI measurement of CVR has been proved to be highly correlated with CBF in patients with intracranial steno-occlusive disease caused by atherosclerosis [van der Zande et al. 2005, Mandell et al. 2008]. Bouvier et al. reported that decreased cerebrovascular reserve (CVR[2]) is spatially associated with decreased CMRO2 in grey matter (GM) of patients with severe intracranial arterial stenosis (SIAS). The degree of ipsilateral CVR[2] reduction was well-correlated with the amplitude of the CMRO2 deficit. The observation of the relationship between impaired CVR[2] and oxygen parameters in patients with chronic low grade ischemia may be helpful in the selection of candidates for medical therapy or percutaneous transluminal angioplasty-stenting [Bouvier et al. 2015]. The results of CO2-stimulated CVR by BOLD-fMRI were suggested to help provide additional information on the identification of a subset in such patients who are most likely to have a hemodynamic improvement following revascularization by the same session as routine MRI (MRA) [Mandell et al. 2011]. An impaired CVR is usually predictive of the occurrence of ischemia-related events in patients with carotid stenosis / occlusion [Lam et al. 2000, Markus et al. 2001]. As reported, the hemispheric asymmetry CVR derived from CO2-stimulated BOLD-fMRI reveals that hemodynamic impairment in a larger percentage of patients with carotid occlusion who have a higher risk of stroke recurrence [Goode et al. 2016] (Fig.2.10).
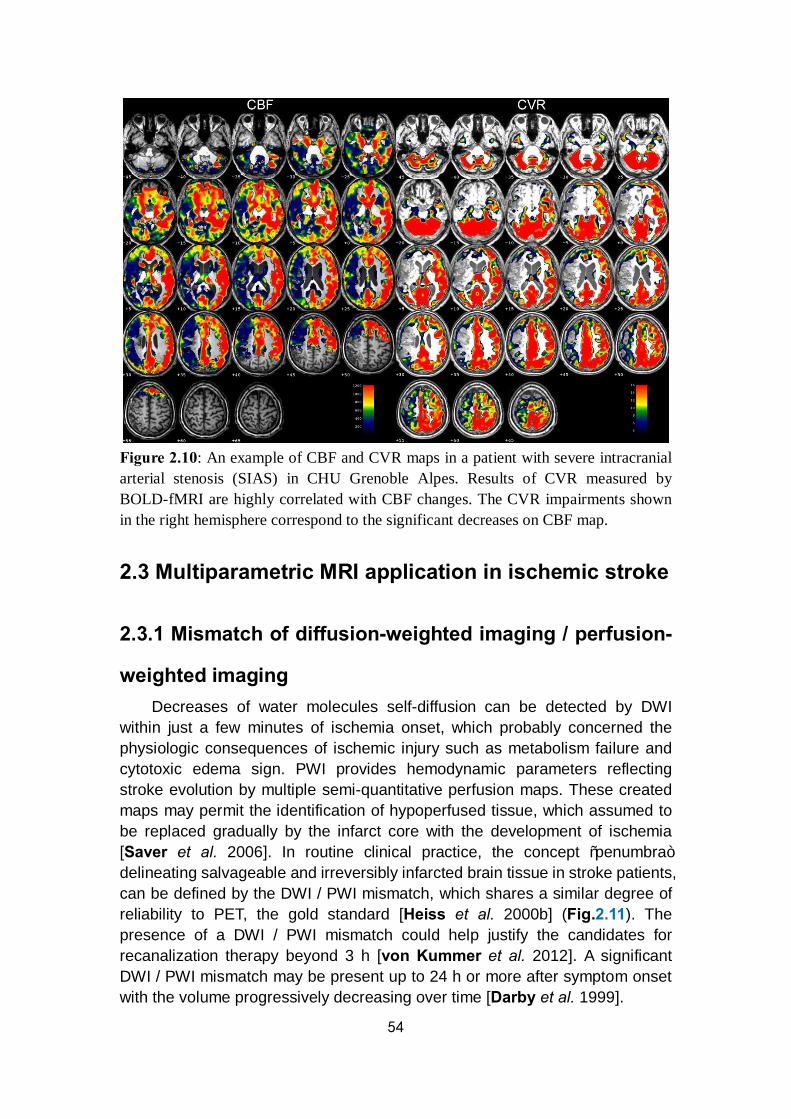
54
Figure 2.10: An example of CBF and CVR maps in a patient with severe intracranial arterial stenosis (SIAS) in CHU Grenoble Alpes. Results of CVR measured by BOLD-fMRI are highly correlated with CBF changes. The CVR impairments shown in the right hemisphere correspond to the significant decreases on CBF map.
2.3 Multiparametric MRI application in ischemic stroke
2.3.1 Mismatch of diffusion-weighted imaging / perfusion-
weighted imaging Decreases of water molecules self-diffusion can be detected by DWI
within just a few minutes of ischemia onset, which probably concerned the physiologic consequences of ischemic injury such as metabolism failure and cytotoxic edema sign. PWI provides hemodynamic parameters reflecting stroke evolution by multiple semi-quantitative perfusion maps. These created maps may permit the identification of hypoperfused tissue, which assumed to be replaced gradually by the infarct core with the development of ischemia [Saver et al. 2006]. In routine clinical practice, the concept “penumbra” delineating salvageable and irreversibly infarcted brain tissue in stroke patients, can be defined by the DWI / PWI mismatch, which shares a similar degree of reliability to PET, the gold standard [Heiss et al. 2000b] (Fig.2.11). The presence of a DWI / PWI mismatch could help justify the candidates for recanalization therapy beyond 3 h [von Kummer et al. 2012]. A significant DWI / PWI mismatch may be present up to 24 h or more after symptom onset with the volume progressively decreasing over time [Darby et al. 1999].
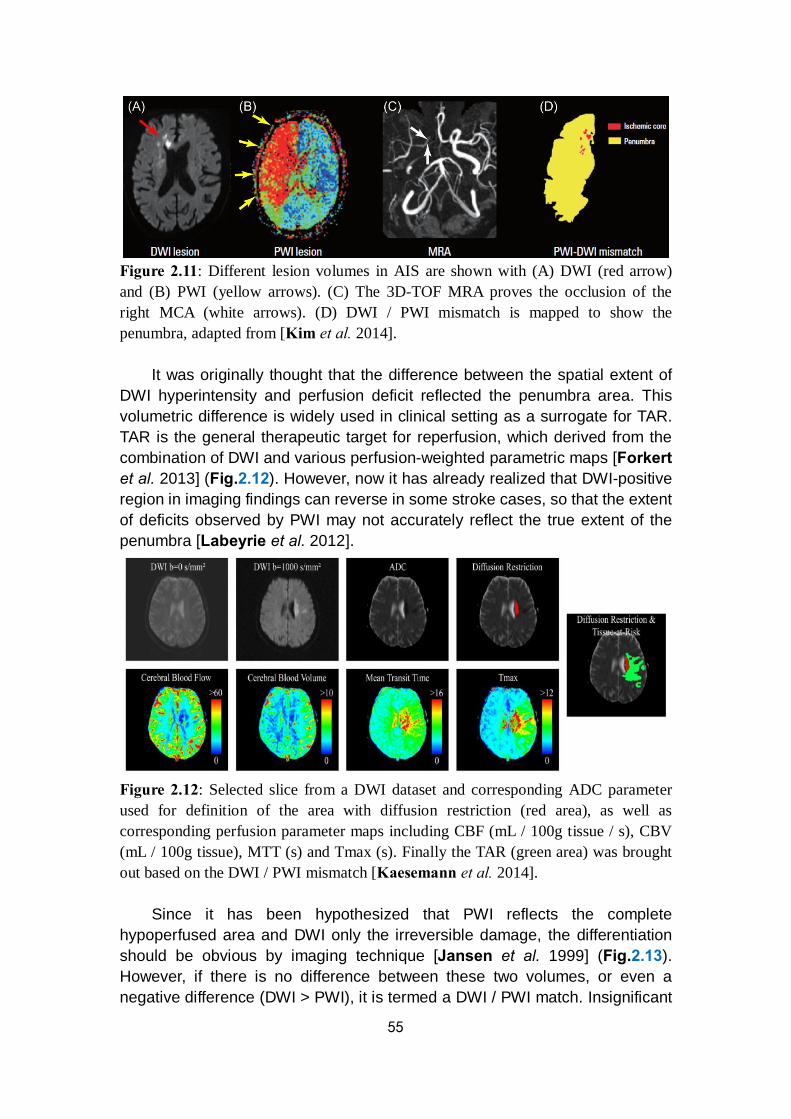
55
Figure 2.11: Different lesion volumes in AIS are shown with (A) DWI (red arrow) and (B) PWI (yellow arrows). (C) The 3D-TOF MRA proves the occlusion of the right MCA (white arrows). (D) DWI / PWI mismatch is mapped to show the penumbra, adapted from [Kim et al. 2014].
It was originally thought that the difference between the spatial extent of DWI hyperintensity and perfusion deficit reflected the penumbra area. This volumetric difference is widely used in clinical setting as a surrogate for TAR. TAR is the general therapeutic target for reperfusion, which derived from the combination of DWI and various perfusion-weighted parametric maps [Forkert et al. 2013] (Fig.2.12). However, now it has already realized that DWI-positive region in imaging findings can reverse in some stroke cases, so that the extent of deficits observed by PWI may not accurately reflect the true extent of the penumbra [Labeyrie et al. 2012].
Figure 2.12: Selected slice from a DWI dataset and corresponding ADC parameter used for definition of the area with diffusion restriction (red area), as well as corresponding perfusion parameter maps including CBF (mL / 100g tissue / s), CBV (mL / 100g tissue), MTT (s) and Tmax (s). Finally the TAR (green area) was brought out based on the DWI / PWI mismatch [Kaesemann et al. 2014].
Since it has been hypothesized that PWI reflects the complete hypoperfused area and DWI only the irreversible damage, the differentiation should be obvious by imaging technique [Jansen et al. 1999] (Fig.2.13). However, if there is no difference between these two volumes, or even a negative difference (DWI > PWI), it is termed a DWI / PWI match. Insignificant
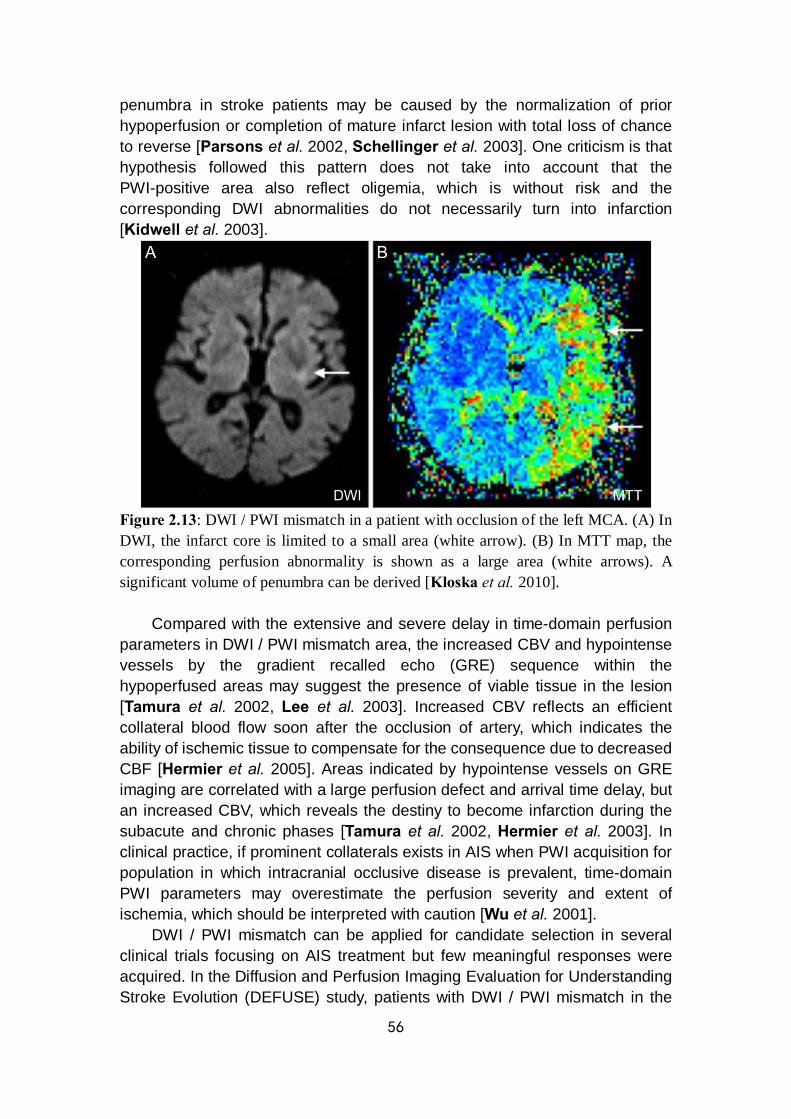
56
penumbra in stroke patients may be caused by the normalization of prior hypoperfusion or completion of mature infarct lesion with total loss of chance to reverse [Parsons et al. 2002, Schellinger et al. 2003]. One criticism is that hypothesis followed this pattern does not take into account that the PWI-positive area also reflect oligemia, which is without risk and the corresponding DWI abnormalities do not necessarily turn into infarction [Kidwell et al. 2003].
Figure 2.13: DWI / PWI mismatch in a patient with occlusion of the left MCA. (A) In DWI, the infarct core is limited to a small area (white arrow). (B) In MTT map, the corresponding perfusion abnormality is shown as a large area (white arrows). A significant volume of penumbra can be derived [Kloska et al. 2010].
Compared with the extensive and severe delay in time-domain perfusion parameters in DWI / PWI mismatch area, the increased CBV and hypointense vessels by the gradient recalled echo (GRE) sequence within the hypoperfused areas may suggest the presence of viable tissue in the lesion [Tamura et al. 2002, Lee et al. 2003]. Increased CBV reflects an efficient collateral blood flow soon after the occlusion of artery, which indicates the ability of ischemic tissue to compensate for the consequence due to decreased CBF [Hermier et al. 2005]. Areas indicated by hypointense vessels on GRE imaging are correlated with a large perfusion defect and arrival time delay, but an increased CBV, which reveals the destiny to become infarction during the subacute and chronic phases [Tamura et al. 2002, Hermier et al. 2003]. In clinical practice, if prominent collaterals exists in AIS when PWI acquisition for population in which intracranial occlusive disease is prevalent, time-domain PWI parameters may overestimate the perfusion severity and extent of ischemia, which should be interpreted with caution [Wu et al. 2001].
DWI / PWI mismatch can be applied for candidate selection in several clinical trials focusing on AIS treatment but few meaningful responses were acquired. In the Diffusion and Perfusion Imaging Evaluation for Understanding Stroke Evolution (DEFUSE) study, patients with DWI / PWI mismatch in the
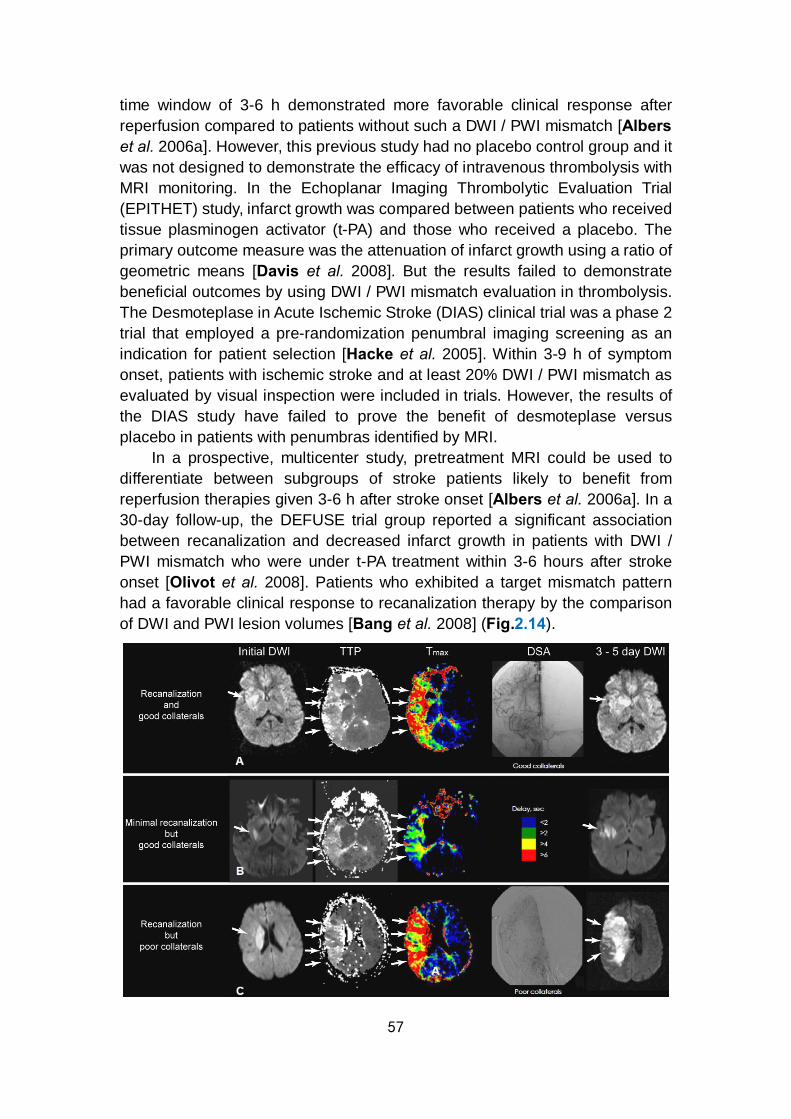
57
time window of 3-6 h demonstrated more favorable clinical response after reperfusion compared to patients without such a DWI / PWI mismatch [Albers et al. 2006a]. However, this previous study had no placebo control group and it was not designed to demonstrate the efficacy of intravenous thrombolysis with MRI monitoring. In the Echoplanar Imaging Thrombolytic Evaluation Trial (EPITHET) study, infarct growth was compared between patients who received tissue plasminogen activator (t-PA) and those who received a placebo. The primary outcome measure was the attenuation of infarct growth using a ratio of geometric means [Davis et al. 2008]. But the results failed to demonstrate beneficial outcomes by using DWI / PWI mismatch evaluation in thrombolysis. The Desmoteplase in Acute Ischemic Stroke (DIAS) clinical trial was a phase 2 trial that employed a pre-randomization penumbral imaging screening as an indication for patient selection [Hacke et al. 2005]. Within 3-9 h of symptom onset, patients with ischemic stroke and at least 20% DWI / PWI mismatch as evaluated by visual inspection were included in trials. However, the results of the DIAS study have failed to prove the benefit of desmoteplase versus placebo in patients with penumbras identified by MRI.
In a prospective, multicenter study, pretreatment MRI could be used to differentiate between subgroups of stroke patients likely to benefit from reperfusion therapies given 3-6 h after stroke onset [Albers et al. 2006a]. In a 30-day follow-up, the DEFUSE trial group reported a significant association between recanalization and decreased infarct growth in patients with DWI / PWI mismatch who were under t-PA treatment within 3-6 hours after stroke onset [Olivot et al. 2008]. Patients who exhibited a target mismatch pattern had a favorable clinical response to recanalization therapy by the comparison of DWI and PWI lesion volumes [Bang et al. 2008] (Fig.2.14).
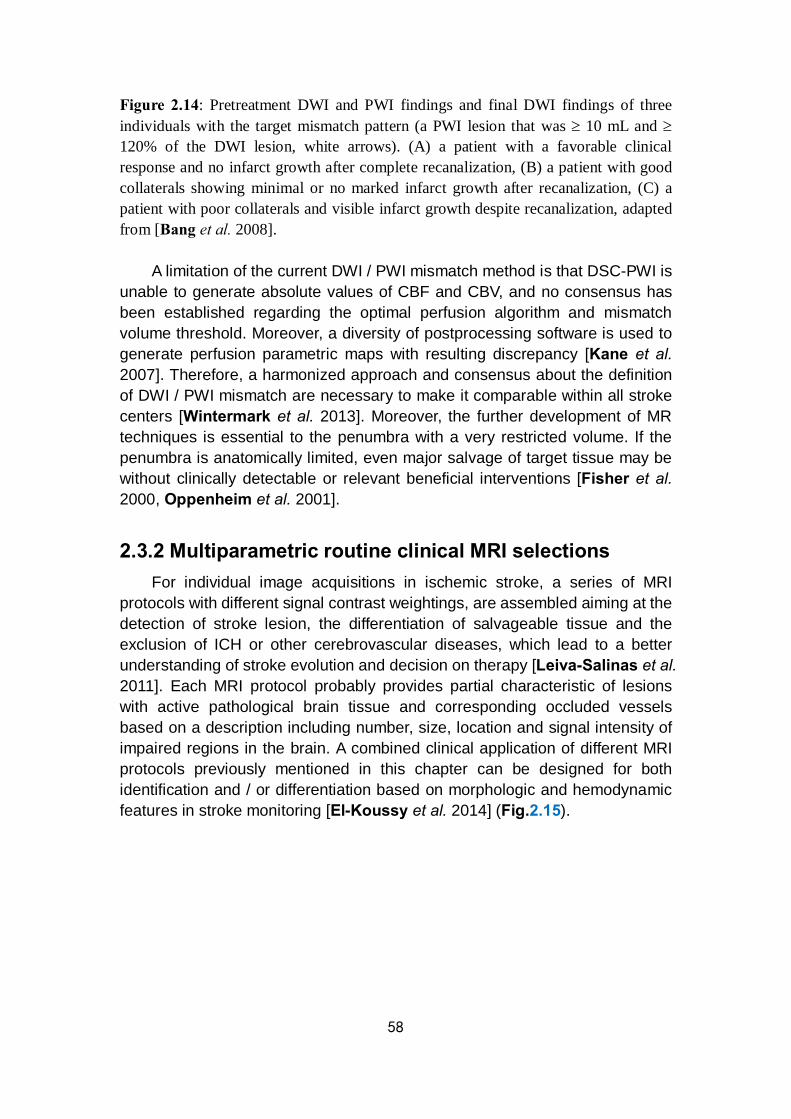
58
Figure 2.14: Pretreatment DWI and PWI findings and final DWI findings of three individuals with the target mismatch pattern (a PWI lesion that was ≥ 10 mL and ≥ 120% of the DWI lesion, white arrows). (A) a patient with a favorable clinical response and no infarct growth after complete recanalization, (B) a patient with good collaterals showing minimal or no marked infarct growth after recanalization, (C) a patient with poor collaterals and visible infarct growth despite recanalization, adapted from [Bang et al. 2008].
A limitation of the current DWI / PWI mismatch method is that DSC-PWI is unable to generate absolute values of CBF and CBV, and no consensus has been established regarding the optimal perfusion algorithm and mismatch volume threshold. Moreover, a diversity of postprocessing software is used to generate perfusion parametric maps with resulting discrepancy [Kane et al. 2007]. Therefore, a harmonized approach and consensus about the definition of DWI / PWI mismatch are necessary to make it comparable within all stroke centers [Wintermark et al. 2013]. Moreover, the further development of MR techniques is essential to the penumbra with a very restricted volume. If the penumbra is anatomically limited, even major salvage of target tissue may be without clinically detectable or relevant beneficial interventions [Fisher et al. 2000, Oppenheim et al. 2001].
2.3.2 Multiparametric routine clinical MRI selections For individual image acquisitions in ischemic stroke, a series of MRI
protocols with different signal contrast weightings, are assembled aiming at the detection of stroke lesion, the differentiation of salvageable tissue and the exclusion of ICH or other cerebrovascular diseases, which lead to a better understanding of stroke evolution and decision on therapy [Leiva-Salinas et al. 2011]. Each MRI protocol probably provides partial characteristic of lesions with active pathological brain tissue and corresponding occluded vessels based on a description including number, size, location and signal intensity of impaired regions in the brain. A combined clinical application of different MRI protocols previously mentioned in this chapter can be designed for both identification and / or differentiation based on morphologic and hemodynamic features in stroke monitoring [El-Koussy et al. 2014] (Fig.2.15).
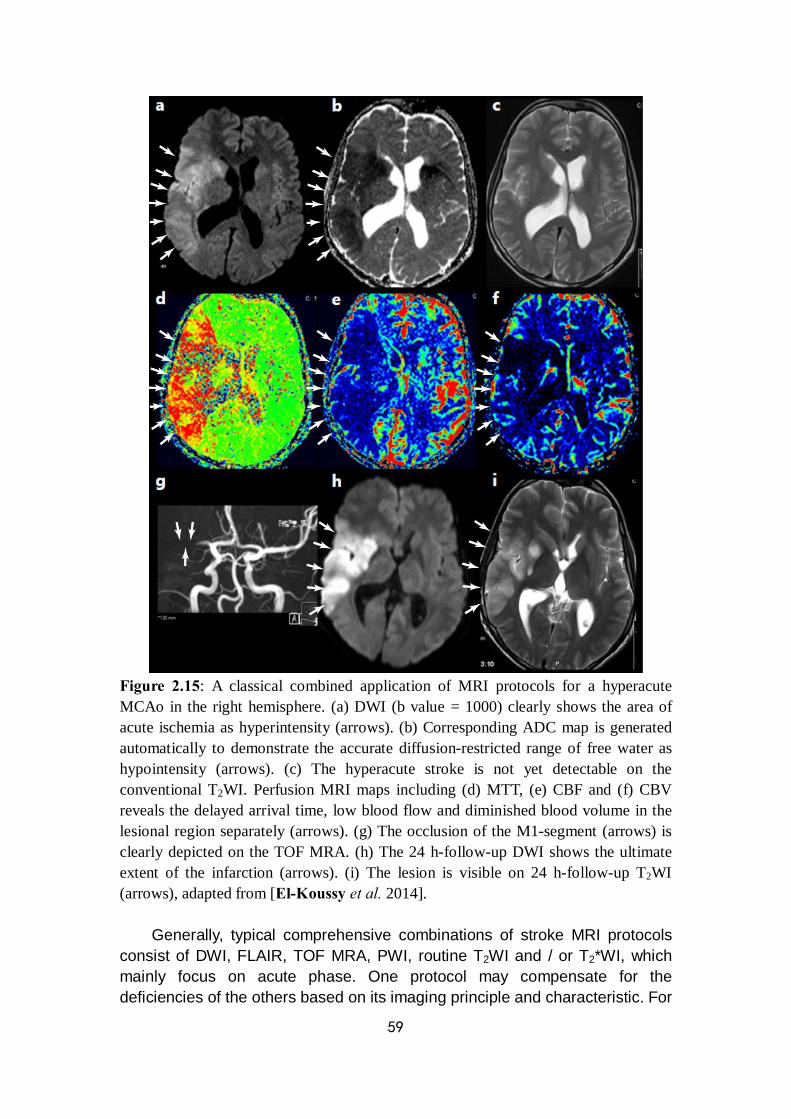
59
Figure 2.15: A classical combined application of MRI protocols for a hyperacute MCAo in the right hemisphere. (a) DWI (b value = 1000) clearly shows the area of acute ischemia as hyperintensity (arrows). (b) Corresponding ADC map is generated automatically to demonstrate the accurate diffusion-restricted range of free water as hypointensity (arrows). (c) The hyperacute stroke is not yet detectable on the conventional T2WI. Perfusion MRI maps including (d) MTT, (e) CBF and (f) CBV reveals the delayed arrival time, low blood flow and diminished blood volume in the lesional region separately (arrows). (g) The occlusion of the M1-segment (arrows) is clearly depicted on the TOF MRA. (h) The 24 h-follow-up DWI shows the ultimate extent of the infarction (arrows). (i) The lesion is visible on 24 h-follow-up T2WI (arrows), adapted from [El-Koussy et al. 2014].
Generally, typical comprehensive combinations of stroke MRI protocols consist of DWI, FLAIR, TOF MRA, PWI, routine T2WI and / or T2*WI, which mainly focus on acute phase. One protocol may compensate for the deficiencies of the others based on its imaging principle and characteristic. For
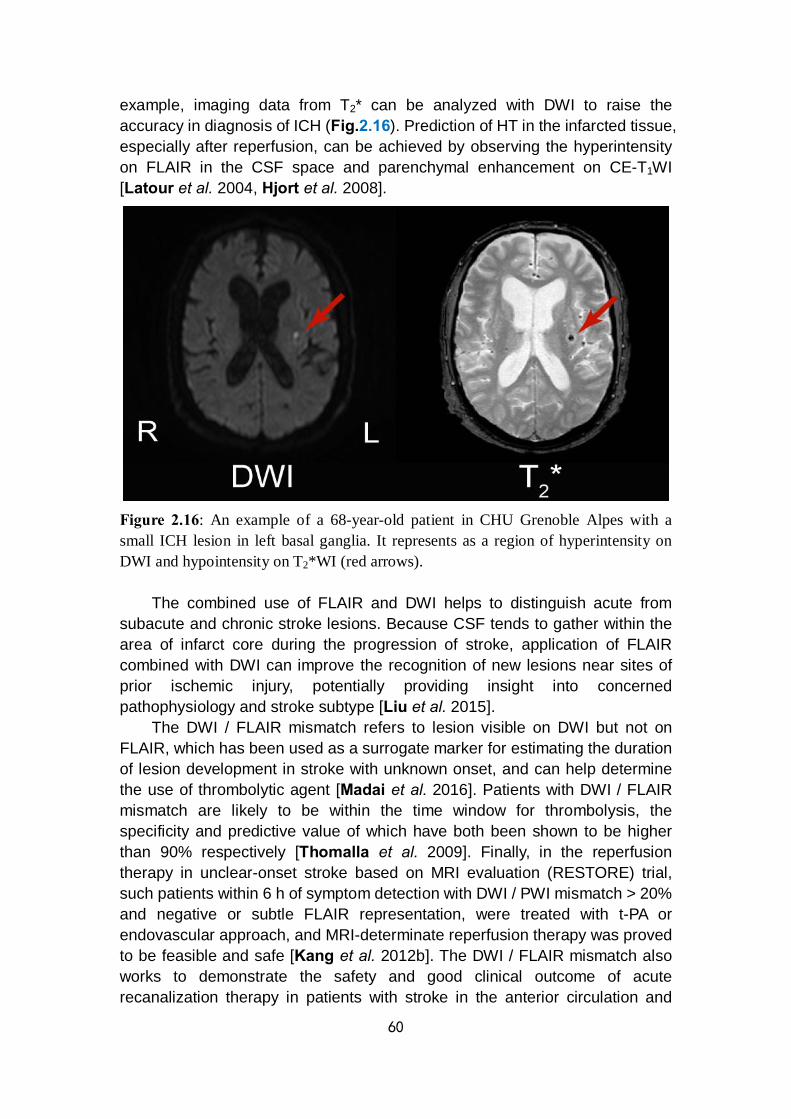
60
example, imaging data from T2* can be analyzed with DWI to raise the accuracy in diagnosis of ICH (Fig.2.16). Prediction of HT in the infarcted tissue, especially after reperfusion, can be achieved by observing the hyperintensity on FLAIR in the CSF space and parenchymal enhancement on CE-T1WI [Latour et al. 2004, Hjort et al. 2008].
Figure 2.16: An example of a 68-year-old patient in CHU Grenoble Alpes with a small ICH lesion in left basal ganglia. It represents as a region of hyperintensity on DWI and hypointensity on T2*WI (red arrows).
The combined use of FLAIR and DWI helps to distinguish acute from subacute and chronic stroke lesions. Because CSF tends to gather within the area of infarct core during the progression of stroke, application of FLAIR combined with DWI can improve the recognition of new lesions near sites of prior ischemic injury, potentially providing insight into concerned pathophysiology and stroke subtype [Liu et al. 2015].
The DWI / FLAIR mismatch refers to lesion visible on DWI but not on FLAIR, which has been used as a surrogate marker for estimating the duration of lesion development in stroke with unknown onset, and can help determine the use of thrombolytic agent [Madai et al. 2016]. Patients with DWI / FLAIR mismatch are likely to be within the time window for thrombolysis, the specificity and predictive value of which have both been shown to be higher than 90% respectively [Thomalla et al. 2009]. Finally, in the reperfusion therapy in unclear-onset stroke based on MRI evaluation (RESTORE) trial, such patients within 6 h of symptom detection with DWI / PWI mismatch > 20% and negative or subtle FLAIR representation, were treated with t-PA or endovascular approach, and MRI-determinate reperfusion therapy was proved to be feasible and safe [Kang et al. 2012b]. The DWI / FLAIR mismatch also works to demonstrate the safety and good clinical outcome of acute recanalization therapy in patients with stroke in the anterior circulation and
61
unknown time of onset [Mourand et al. 2016]. However, potential confounding factors that interfere with the diagnostic
accuracy of DWI / FLAIR mismatch also exist. In addition to the unclear stroke onset time, BBB permeability affected by premature age and too large lesion size may cause altered FLAIR intensity [Thomalla et al. 2011, Kim et al. 2014]. Besides biological variations in individual situation of stroke patient, statistical analysis has also suggested that DWI / FLAIR mismatch may be not definitely associated poor outcome of HT, which means the selecting wake-up stroke patients by DWI / FLAIR mismatch standard may exclude a large group of patients who might benefit in therapeutic trial [Odland et al. 2015].
Flow-sensitive TOF MRA is a prior choice for the evaluation of intracranial arteries, while CE-MRA is feasible to provide a true lumenography for a combined assessment of both intracranial and extracranial cervical arteries [Hassan et al. 2013]. Extent of collateral circulation can be evaluated based on CE-MRA and PWI, which helps predict the final infarct volume and thus the prognosis [Angermaier et al. 2011].
Anatomical peculiarities of congenital vascular variation or malformation may handicap the operation of stroke therapeutic intervention, which can be demonstrated by morphological MR sequences, such as MRA / CE-MRA [El-Koussy et al. 2014]. CE-T1WI can show arterial enhancement in some hyperacute ischemic stroke cases, probably based on local slow blood flow velocity. It also provides additional information on the differential diagnosis to rule out other intracranial diseases such as tumor or inflammatory disease [Srinivasan et al. 2006]. So these techniques may help to describe an exact presence of lesion and define a correct diagnosis when applied with other MRI sequences in the evaluation of stroke.
However, the clinical significance of a combination of single conventional MR sequences remains controversial. Information from imaging evidence may not be efficiently predictive for a certain pathophysiological phenomenon during stroke evolution. Furthermore, the results from imaging data should be considered with caution for clinical decision because of the underestimation or overestimation of true state of stroke progression such as TAR, lesion growth and collateralization [Mezzapesa et al. 2006]. The application of current conventional MRI protocols is still inadequate to reflect an exact, follow-up change of stroke lesion development due to the lack of a standard for the justified selection among all these parameters. Optimization of analytic methods for present imaging techniques may have potential to solve this problem. The benefits and limitations of multiparametric MRI application for stroke are summarized in Tab.2.3.
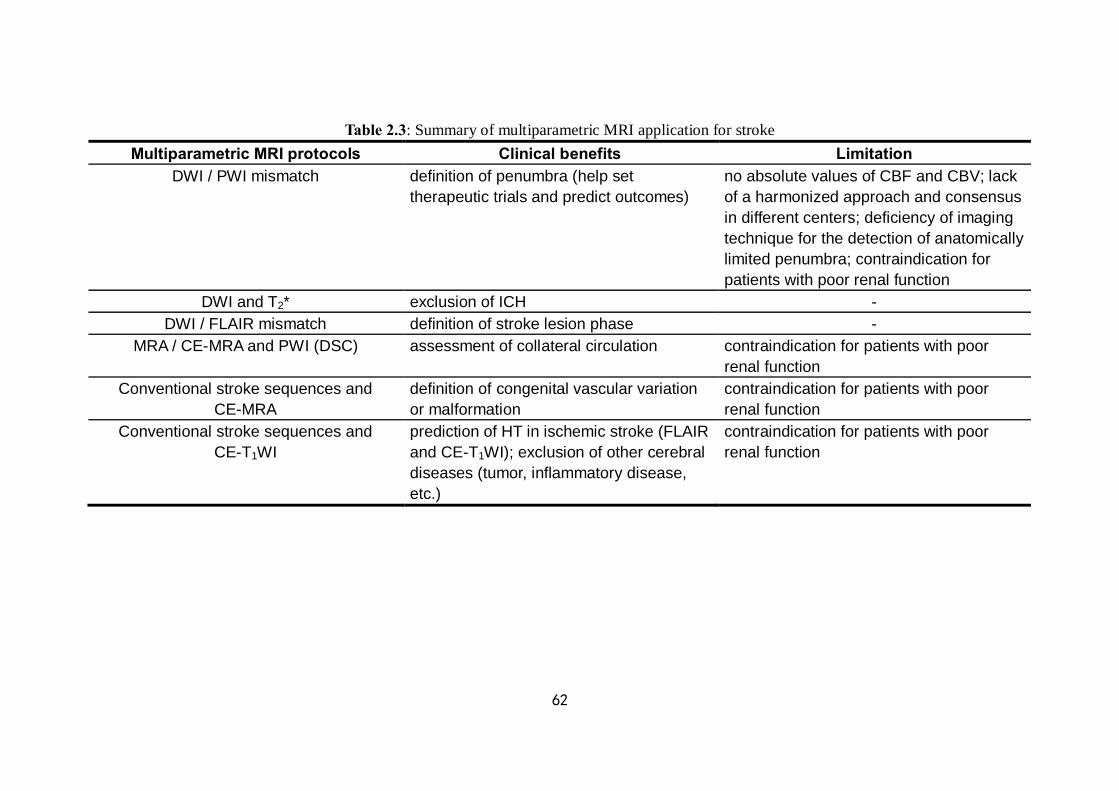
62
Table 2.3: Summary of multiparametric MRI application for stroke Multiparametric MRI protocols Clinical benefits Limitation
DWI / PWI mismatch definition of penumbra (help set therapeutic trials and predict outcomes)
no absolute values of CBF and CBV; lack of a harmonized approach and consensus in different centers; deficiency of imaging technique for the detection of anatomically limited penumbra; contraindication for patients with poor renal function
DWI and T2* exclusion of ICH - DWI / FLAIR mismatch definition of stroke lesion phase -
MRA / CE-MRA and PWI (DSC) assessment of collateral circulation contraindication for patients with poor renal function
Conventional stroke sequences and CE-MRA
definition of congenital vascular variation or malformation
contraindication for patients with poor renal function
Conventional stroke sequences and CE-T1WI
prediction of HT in ischemic stroke (FLAIR and CE-T1WI); exclusion of other cerebral diseases (tumor, inflammatory disease, etc.)
contraindication for patients with poor renal function
63
Chapter 3
Overview of methods for MR imaging analysis
In Chapter 2, current MRI techniques in stroke application have been introduced in detail. These techniques provide information of physiologically distinct characteristics of stroke from the very beginning of ischemia to a long-term follow-up. An overall comprehension of stroke progression can be derived from the combination of multiparametric MR images. In simple terms, the conventional MR images help to identify basic anatomical features such as location, extent, and quantity of lesion. The diffusion images can reflect lesion volume, edema and other complementary information for conventional sequences. Perfusion images can evaluate the hemodynamics influenced by stroke and define the salvageable tissue with corresponding diffusion images. With plenty of imaging data, clinical trials can be well designed based on objective evaluation of stroke evolution, accurate decision of treatment selection, and effective reflection of therapeutic reaction. A reasonable method of imaging analysis used for all measures from different imaging protocols can quantify the stroke-induced changes and bring about intraindividual comparison between different durations and interindividual comparison between objects with different interventions or outcomes, even from different centers. In this level, multiparametric imaging analyses focus on the features of the lesion rather than global changes, especially for those which are invisible or nullified by routine screening.
In this chapter, both frequently-used and newly-developed imaging analysis methods will be introduced. By means of these methods, new insights could be obtained into the characteristics of brain insults, mainly solid lesions. Due to the popular option in brain tumor, this pathology will be on target for most illustrations of imaging analysis methods. 3.1 Region of interest
A subset of pixels in an input image is the basic for image analysis task, which can be selected as samples in a data set identified for a specific purpose. Target containing these selected pixels is termed the region of interest (ROI). The ROI selection may be fairly arbitrary for a general test or particularly purposeful for the representation of designated imaging characteristics. The application of a ROI is widely used in medical imaging analysis for identification of lesion, comparison of tissue contrast and measurement of volume. Since ROI analysis provides benefits in image-based research, the definition of ROI is part of a more general concept and also the premise of image segmentation with following data analysis. ROIs can be defined both in terms of structural and functional features. Structural ROIs are generally defined according to anatomical knowledge. Due to the individual substantial variability, ROIs are

64
normally set for each subject. With developments in segmentation methods, some anatomical structures in images can be reliably defined with a minimum manual intervention [Fischl et al. 2004].
In the evaluation of ischemic stroke evolution or relevant therapeutic effect, the whole lesion identification and the infarct volume computation are important to reflect the severity of ischemic injury from onset of stroke to post-reperfusion.
The ROI definition of stroke lesion is mainly based on the morphological feature and signal changes in MR images. It can be segmented both manually and automatically. Manual delineation of a ROI, as the most common method, generally takes the first step in various studies. So we could think it as the premise which is entirely possible to affect the final results. However, due to the limited spatial extent, manual ROI can be replaced by a global segmentation, normally semi- / automatically. Automatic imaging segmentation methods based on different theories and algorithms may lead to similar outputs although respective deficits exist. A detailed introduction of current imaging segmentation methods has been made in Chapter 8 (Appendix 1). Briefly, automatic segmentation methods can be used for different purposes, mainly focusing on distinction of anatomical structures in healthy brain of multiple populations and separation of tumor contour from original background that initially confounds the observer by the naked eye. Since the sequence-specific MRI findings provide huge information of stroke in different phases to help classify subtypes, evaluate extent, determine infarct age and guide the treatment selection, and dealing with stroke is generally in critical conditions, the routine imaging analysis is sufficient [Allen et al. 2012]. Still, global segmentation of brain suffering from stroke has been reported, mainly through hybrid segmentation method such as the Markov random field (MRF) with random forest classification [Mitra et al. 2014], thresholding with subtracted atlas [Tsai et al. 2014] and multiple modalities [Kabir et al. 2007, Maier et al. 2015] (cf. 8.2). 3.2 Histogram analysis
Once the target image has been segmented spatially based on the MR signal changes, various metrics which reflect class distribution of the imaging data can be extracted. From the selected ROI, one can simply extract the mean value and its standard deviation of an imaging parameter. However, a classic metric of descriptive statistic may differ from each other. It depends on whether the parametric values of the ROI have typicality to represent the feature of classification. To refine analysis, histograms can help to lead to a more accurate and objective description of the imaging data.
A histogram is the most commonly used graphical representation to show the probability distribution of a continuous quantitative variable by depicting the frequencies in certain ranges of values. This method provides a rough estimation of the data density in medical application. In clinical cases, histogram methods were used for the MR imaging analysis of brain tumor and hypoxic-ischemic encephalopathy (HIE) [Pope et al. 2009, Cauley et al. 2014]. In tumor progression-free survival assessment, the data on the basis of mean values of the histogram analysis was dichotomized to provide more accurate information on the parametric value classifiers and the lesion volume change
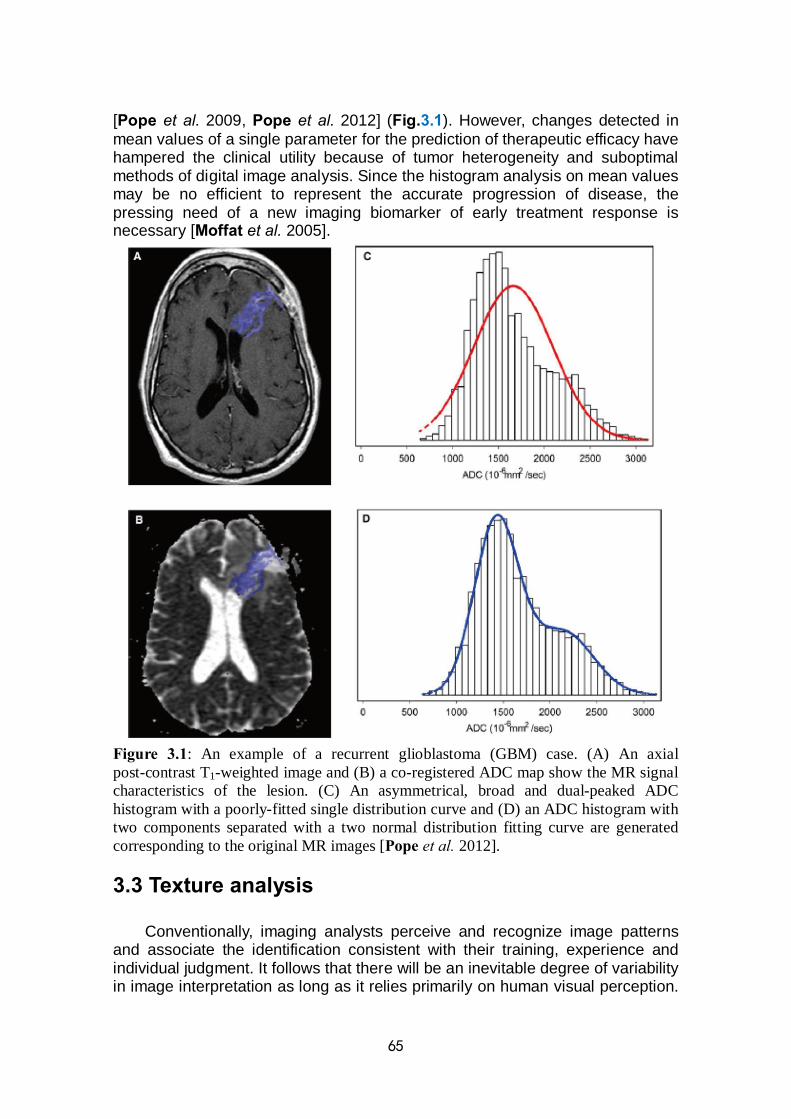
65
[Pope et al. 2009, Pope et al. 2012] (Fig.3.1). However, changes detected in mean values of a single parameter for the prediction of therapeutic efficacy have hampered the clinical utility because of tumor heterogeneity and suboptimal methods of digital image analysis. Since the histogram analysis on mean values may be no efficient to represent the accurate progression of disease, the pressing need of a new imaging biomarker of early treatment response is necessary [Moffat et al. 2005].
Figure 3.1: An example of a recurrent glioblastoma (GBM) case. (A) An axial post-contrast T1-weighted image and (B) a co-registered ADC map show the MR signal characteristics of the lesion. (C) An asymmetrical, broad and dual-peaked ADC histogram with a poorly-fitted single distribution curve and (D) an ADC histogram with two components separated with a two normal distribution fitting curve are generated corresponding to the original MR images [Pope et al. 2012]. 3.3 Texture analysis
Conventionally, imaging analysts perceive and recognize image patterns and associate the identification consistent with their training, experience and individual judgment. It follows that there will be an inevitable degree of variability in image interpretation as long as it relies primarily on human visual perception.
66
Tools for automated pattern recognition and image analysis can provide objective information to support clinical decision-making and may effectively reduce this variability. An alternative is texture analysis (TA), which displayed by a wide range of techniques that enable quantification of the grey-level patterns, pixel interrelationships and the spectral properties of images. Texture parameters are used to characterize the underlying structures of the observed tissues [Sikio et al. 2014]. Feature extraction from the images is the first step of TA, from which the results can be used for texture discrimination, texture classification or outline determination. Information of variation in surface intensity or patterns, including that are imperceptible to the human visual system can be provided by TA. It has already demonstrated considerable potential in MR neuroimaging as an objective strategy for lesion segmentation and characterization by examining the nature of grey-level transitions, particularly in cases in which the lesions are inseparable on the basis of standard sequences such as T1, T2, proton-attenuation, and DWI [Tourassi et al. 1999]. Additionally, TA can provide the underlying textural features which assist in monitoring disease progression or longitudinal observation of emerging therapies. Furthermore, it has been shown to increase the level of diagnostic information extracted from other imaging modalities rather than MRI [Garra et al. 1993, Ito et al. 1995].
The application of TA can be restricted to a set of pre-defined ROIs if the spatial extent of the lesion is identified by an independent means. In the selection of ROI or imaging data size, the investigator should balance the need to capture sufficient textural information for classification purposes with the desire to avoid including the ROI or whole image that span multiple tissue categories [Kassner et al. 2010].
In the case of acute ischemic stroke (AIS), due to the risk of hemorrhagic transformation (HT), the thrombolysis approach is limited within a narrow time window [Shobha et al. 2011]. Based on the role of blood-brain barrier (BBB) disruption before HT, the texture features which reveal the differences in the complexity and homogeneity of HT-prone stroke infarcts can be evaluated by first-order and 2D grey-level co-occurrence matrix (GLCM) from post-contrast T1-weighted spin-echo images of AIS. Metrics constructed by the GLCM distances reveal information on the spatial distribution of pixel values which are regarded to bring together the features of microtexture [Pantic et al. 2013]. As the final result, contrast and correlation are thought to be capable of predicting HT and were much more sensitive predictors than conventional visual assessment of post-contrast T1WI [Kassner et al. 2009].
TA can also be used in the assessment of ischemia-associated treatment. The inflammatory factor is an underlying mechanism which influences the progression of ischemic stroke [Amantea et al. 2014]. To investigate the therapeutic potential of anti-inflammatory agents in post-ischemia, the texture parameters were applied to detect early differences in T2WI of stroke depending on anti-inflammatory agents and the correlation between texture features and changes in ADC and T2 maps [Chen et al. 2010] (Fig.3.2).

67
Figure 3.2: Texture analysis flowchart: T2WI acquired from MR scanner is loaded to the MaZda software, then ROIs containing image texture are defined. After textural features are computed, distribution of three texture parameters is presented for classification. Finally, data classification is performed by means of nonlinear discriminated analysis (NDA). Transformation of three original features is presented, resulting in two NDA features. As the results mentioned, two texture parameters (black circle), which indicate contrast and co-occurrence matrix-based feature estimated as a variance of differential distribution respectively, are capable of distinguishing infarct segments between treated group and control group, adapted from [Chen et al. 2010].
Image features contained a large amount of information which naked eye
cannot reach, whereas TA could be the alternative for assessing structural properties of images in detail, including homogeneity, complexity and disorder level [Pantic et al. 2013]. In chronic ischemic stroke, correlations of DTI and texture analysis parameters showed that the two methods mainly reveal different information and could both assist in detecting tissue damage due to stroke outside the infarct core area [Xie et al. 2012]. The textural parameters, angular second moment (ASM) and entropy (ENT) characterize the homogeneity of the matrix entries. The results indicated that the damaged brain structure on ipsilateral hemisphere is more heterogeneous and random in texture than the unaffected areas in the contralateral hemisphere, which is easily hidden by the general naked eyes’ observation [Sikio et al. 2014]. 3.4 Voxel-based analysis
Advances in updated equipment, imaging techniques, targeted probes, and contrast agents provide benefits in various diseases by a rich-feature dataset, especially in monitoring of tumor therapy response [Abramson et al. 2013]. So
68
we cite an instance of tumor for the statement of current predicament in imaging data analysis.
The increased toolbox of techniques provides more details in the characterization and interrogation of tumor evolution. So the Response Evaluation Criteria in Solid Tumors (RECIST) was defined as the clinical standard criteria for assessing the post-treatment follow-ups [Eisenhauer et al. 2009]. One of the key metric in RECIST is the linear measurement of the longest diameter of a tumor or sum of multiple tumors obtained from anatomical tumor images. The characteristics of tumor dimension have been fundamental to the integration of imaging in routine clinical practice. Additionally, the MRI-derived metrics beyond morphological measurement such as DWI and PWI results may be more sensitive to reflect the overall response to treatment [Ingrisch et al. 2013, Sourbron et al. 2013]. These multimodal image-derived metrics are extracted from whole tumor volume-of-interest (VOI) contours. Histogram analysis of the quantitative voxel values contained within this target lesion follows [Jones et al. 2010]. Histogram analysis allows for quantification of the image-based VOI assessment, as mentioned in 3.2.2. The mean value where tumor response is quantified by the magnitude of change from baseline following treatment is evaluated by this approach. However, metrics of the whole tumor are thought to be representative when tumor evolution is relatively homogeneous. In other cases, these VOI-based measures may be less sensitive for detecting treatment-associated changes in longitudinally acquired scans in the presence of intra-tumor heterogeneity where local changes are spatially varying within the mass [Boes et al. 2014].
Current observation for treatment response evaluation in brain tumor relies on changes in the maximal crossed-diameter product (CDP) of the tumor at each set time point of a therapeutic protocol, which have been correlated with increased survival for patients with high-grade gliomas treated with primary radiation therapy [Chisholm et al. 1989, Barker et al. 1996, James et al. 1999]. Improvements in individual-specific imaging-based metrics are important to obtain an objective reflection of treatment response correlated with clinical trial outcome. A surrogate biomarker for the efficacy evaluation might enable earlier detection to guide suitable clinical decisions and adjust ongoing therapy to alternative, because the general period for treatment monitoring is always weeks to months from the onset of the therapeutic protocol [Behin et al. 2003, Yankeelov et al. 2013].
Early therapeutic response readouts during the treatment may be explained by the emerging heterogeneity exposed by voxel-based analysis. The intralesional heterogeneity can be thought as self-characterized feature or therapeutic reaction to the intervention. The former situation can lead to different outcomes of individuals with similar imaging representation using summary metrics extracted from whole lesion volume contours, while the latter situation may result in early identification of therapeutic efficacy using more sensitive response metrics, as mentioned above [Tsien et al. 2010, Lestro Henriques et al. 2015]. Changes of quantitative voxel values contained within the target ROI in histogram MR metrics can be minimal and uniformly shifted with a corresponding net shift in the mean value or have similar numbers of voxels with increased and decreased values, thus nullifying the overall histogram shift. However, robust
69
measures can be exploited by voxel-based analysis when value changes within the lesion are relatively heterogeneous rather than homogeneous [Boes et al. 2014]. In the following section, we focus on the spread of a relatively new voxel-based imaging analytic methodology. 3.4.1 Principle of the parametric response map (PRM): a voxel-wise methodology
DWI itself is a sensitive metric that is able to detect early tumor-associated edema and tumor cellularity changes during the treatment, which precede macroscopic volumetric response [Ellingson et al. 2010]. In addition, it also allows the identification of spatially distinct regional response to the therapy within tumor tissues [Ross et al. 2003, Hall et al. 2004, Moffat et al. 2004]. Whole-tumor analysis is the most common technique for assessing therapeutic response, typically comparing post-therapy or mid-therapy mean ADC value changes to pre-therapy ones. However, the response of ADC to cytotoxic therapy in the clinical setting has been revealed to be more complex due to heterogeneity observed within tumors [Chenevert et al. 2000, Mardor et al. 2003, Mardor et al. 2004]. During the treatment of patients with malignant brain tumors, it has been shown that diffusion changes could both increase and decrease over time within the same tumor volume, which means loss and gathering of intracellular space separately, especially for therapies with modest efficacy [Moffat et al. 2005, Moffat et al. 2006]. Assessing the changes in overall tumor mean ADC value can lead to a diminution of sensitivity for the ADC measure because of divergent changes in tumor ADC values after treatment.
As a new pattern of imaging data statistical approach, the PRM, which initially used only in ADC maps, has been developed for segmenting tumors based on a defined threshold of ADC value changes following therapy.
Theoretically, the procedure of PRM analyses on each kind of voxel-based map is achieved and similar. Here, the generation of PRMADC will be described in details as an example:
1) All images were co-registered onto a reference sequence (generally T2WI or FLAIR) of the initial time point (baseline) using a fully automated, affine, mutual information-based, simplex optimization algorithm (co-registration function in SPM12 free software, distributed under the terms of the GNU General Public License as published by the Free Software Foundation);
2) The 95% confidence interval (CI) was computed for the classification of ADC values. Briefly, we empirically calculated the threshold that yields a significant change in ADC value for each voxel between the baseline and the target time point using a reference of healthy tissue in undamaged brain (the mirrored ROI of the lesion in the contralateral hemisphere or the lesion ROI in the ipsilateral hemisphere of the sham object). The ADC threshold was determined by the 95% unchanged CI resulting from linear least squares analysis on the data combined from all the reference objects;
3) PRMADC maps were determined by calculating the difference between ADC within the lesion at the baseline and at each following time point. Red voxels represent voxels within each lesion with an increase in the ADC value (beyond the CI), blue voxels represent voxels with a decrease in the ADC value (below the CI), and green voxels represent voxels within each lesion with an
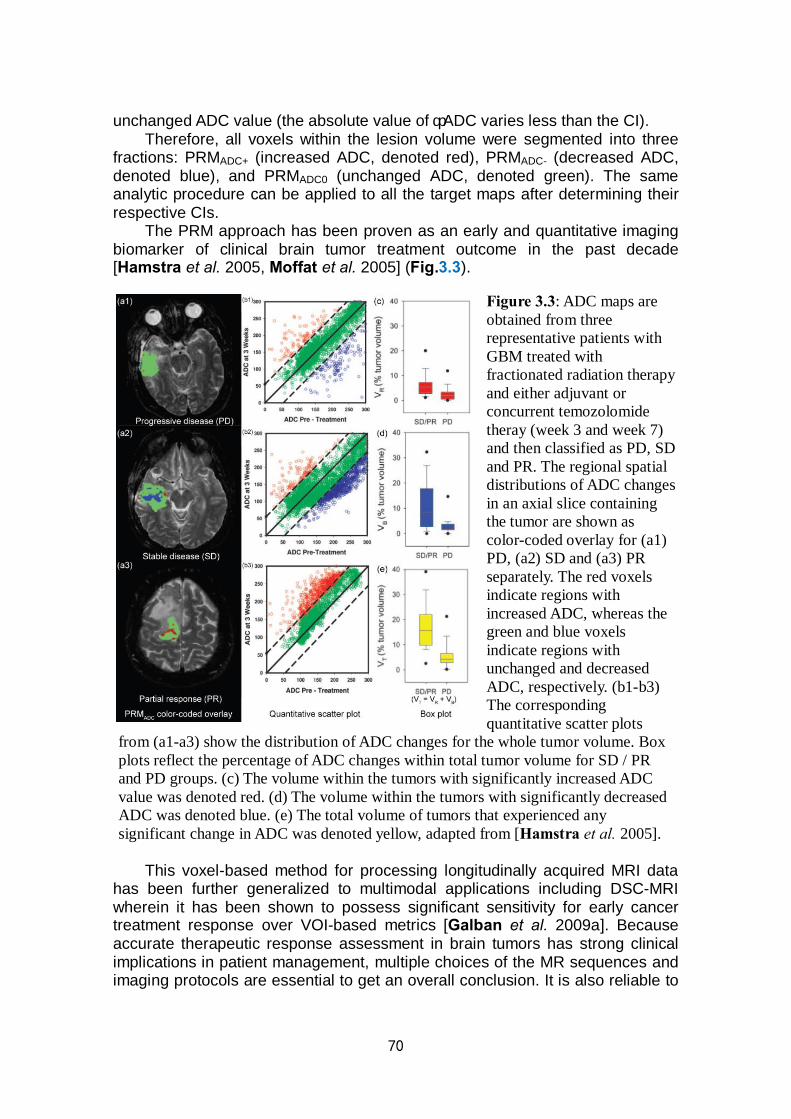
70
unchanged ADC value (the absolute value of ΔADC varies less than the CI). Therefore, all voxels within the lesion volume were segmented into three
fractions: PRMADC+ (increased ADC, denoted red), PRMADC- (decreased ADC, denoted blue), and PRMADC0 (unchanged ADC, denoted green). The same analytic procedure can be applied to all the target maps after determining their respective CIs.
The PRM approach has been proven as an early and quantitative imaging biomarker of clinical brain tumor treatment outcome in the past decade [Hamstra et al. 2005, Moffat et al. 2005] (Fig.3.3).
This voxel-based method for processing longitudinally acquired MRI data
has been further generalized to multimodal applications including DSC-MRI wherein it has been shown to possess significant sensitivity for early cancer treatment response over VOI-based metrics [Galban et al. 2009a]. Because accurate therapeutic response assessment in brain tumors has strong clinical implications in patient management, multiple choices of the MR sequences and imaging protocols are essential to get an overall conclusion. It is also reliable to
Figure 3.3: ADC maps are obtained from three representative patients with GBM treated with fractionated radiation therapy and either adjuvant or concurrent temozolomide theray (week 3 and week 7) and then classified as PD, SD and PR. The regional spatial distributions of ADC changes in an axial slice containing the tumor are shown as color-coded overlay for (a1) PD, (a2) SD and (a3) PR separately. The red voxels indicate regions with increased ADC, whereas the green and blue voxels indicate regions with unchanged and decreased ADC, respectively. (b1-b3) The corresponding quantitative scatter plots
from (a1-a3) show the distribution of ADC changes for the whole tumor volume. Box plots reflect the percentage of ADC changes within total tumor volume for SD / PR and PD groups. (c) The volume within the tumors with significantly increased ADC value was denoted red. (d) The volume within the tumors with significantly decreased ADC was denoted blue. (e) The total volume of tumors that experienced any significant change in ADC was denoted yellow, adapted from [Hamstra et al. 2005].
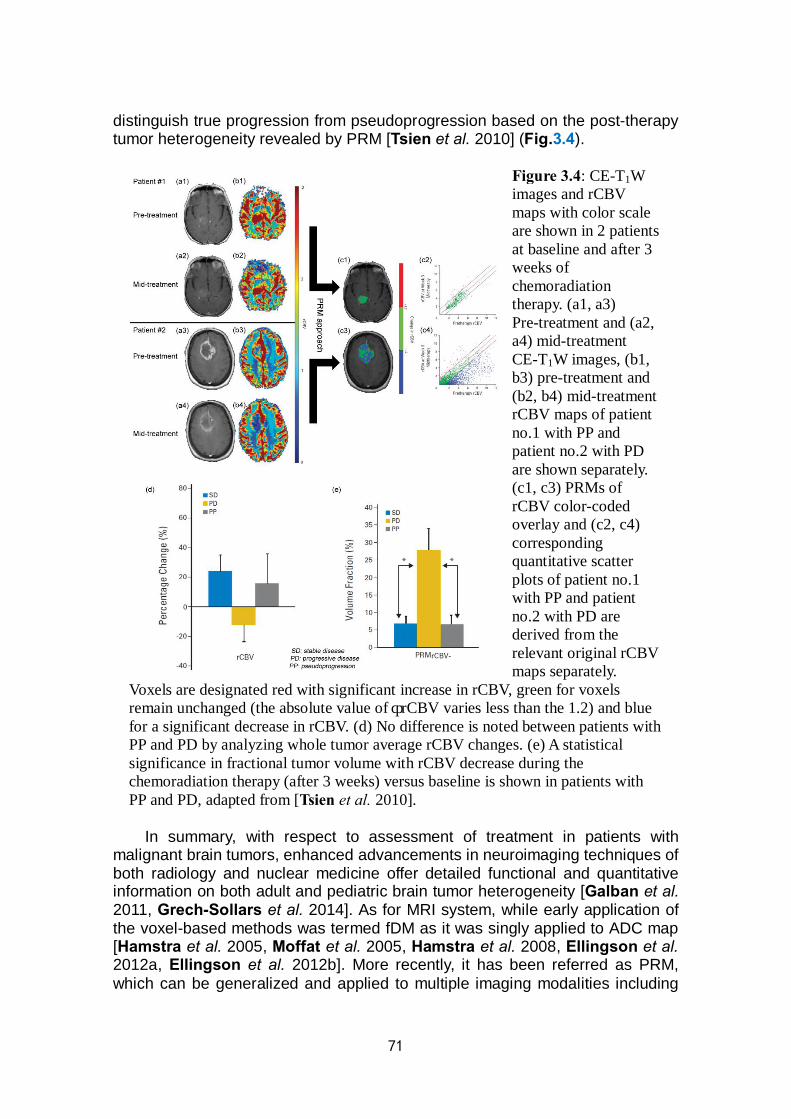
71
distinguish true progression from pseudoprogression based on the post-therapy tumor heterogeneity revealed by PRM [Tsien et al. 2010] (Fig.3.4).
Figure 3.4: CE-T1W images and rCBV maps with color scale are shown in 2 patients at baseline and after 3 weeks of chemoradiation therapy. (a1, a3) Pre-treatment and (a2, a4) mid-treatment CE-T1W images, (b1, b3) pre-treatment and (b2, b4) mid-treatment rCBV maps of patient no.1 with PP and patient no.2 with PD are shown separately. (c1, c3) PRMs of rCBV color-coded overlay and (c2, c4) corresponding quantitative scatter plots of patient no.1 with PP and patient no.2 with PD are derived from the relevant original rCBV maps separately.
Voxels are designated red with significant increase in rCBV, green for voxels remain unchanged (the absolute value of ΔrCBV varies less than the 1.2) and blue for a significant decrease in rCBV. (d) No difference is noted between patients with PP and PD by analyzing whole tumor average rCBV changes. (e) A statistical significance in fractional tumor volume with rCBV decrease during the chemoradiation therapy (after 3 weeks) versus baseline is shown in patients with PP and PD, adapted from [Tsien et al. 2010].
In summary, with respect to assessment of treatment in patients with
malignant brain tumors, enhanced advancements in neuroimaging techniques of both radiology and nuclear medicine offer detailed functional and quantitative information on both adult and pediatric brain tumor heterogeneity [Galban et al. 2011, Grech-Sollars et al. 2014]. As for MRI system, while early application of the voxel-based methods was termed fDM as it was singly applied to ADC map [Hamstra et al. 2005, Moffat et al. 2005, Hamstra et al. 2008, Ellingson et al. 2012a, Ellingson et al. 2012b]. More recently, it has been referred as PRM, which can be generalized and applied to multiple imaging modalities including
72
MRI, CT, PET, etc [Galban et al. 2009a, Chiba et al. 2012, Galban et al. 2012, Harris et al. 2012, Hoff et al. 2012]. 3.4.2 Applications of parametric response map in other diseases
DWI sequence and corresponding ADC map are widely used in the various diseases of whole body. Since PRM assessment of the heterogeneity appears as a promising imaging biomarker in efficacy between patients with malignant brain tumors, theoretically the extension of ADC-mediated PRM analysis has potential to be applied besides the brain, including breast cancer [Sinha et al. 2002], rectal carcinoma [Kremser et al. 2003], uterine fibroids [Liapi et al. 2005], prostate cancer [Sinha et al. 2004], head and neck tumors [Wang et al. 2001] and liver metastases [Theilmann et al. 2004].
Several published results have shown the successful applications of PRM in different diseases outside brain. It has been testified that PRM has great potential for the revolutionary imaging analysis in multiple targets of organ based on diversified image platforms. For example, a PRM analysis for ADC values appears to provide an improved sensitivity over histogram-based mean ADC changes for early response assessment in patients with breast cancer undergoing neoadjuvant chemotherapy (NAC) [Galban et al. 2015b]. It also has the potential to provide both prognostic and spatial information during the nonsurgical organ preservation therapy (NSOPT) of head and neck squamous cell carcinoma (HNSCC) [Galban et al. 2009b]. For the metastatic prostate cancer to the bone, the potential application of this approach has been proven to be sensitive to assess early changes in therapeutic response of solid bone lesions [Lee et al. 2007b] (Fig.3.5).
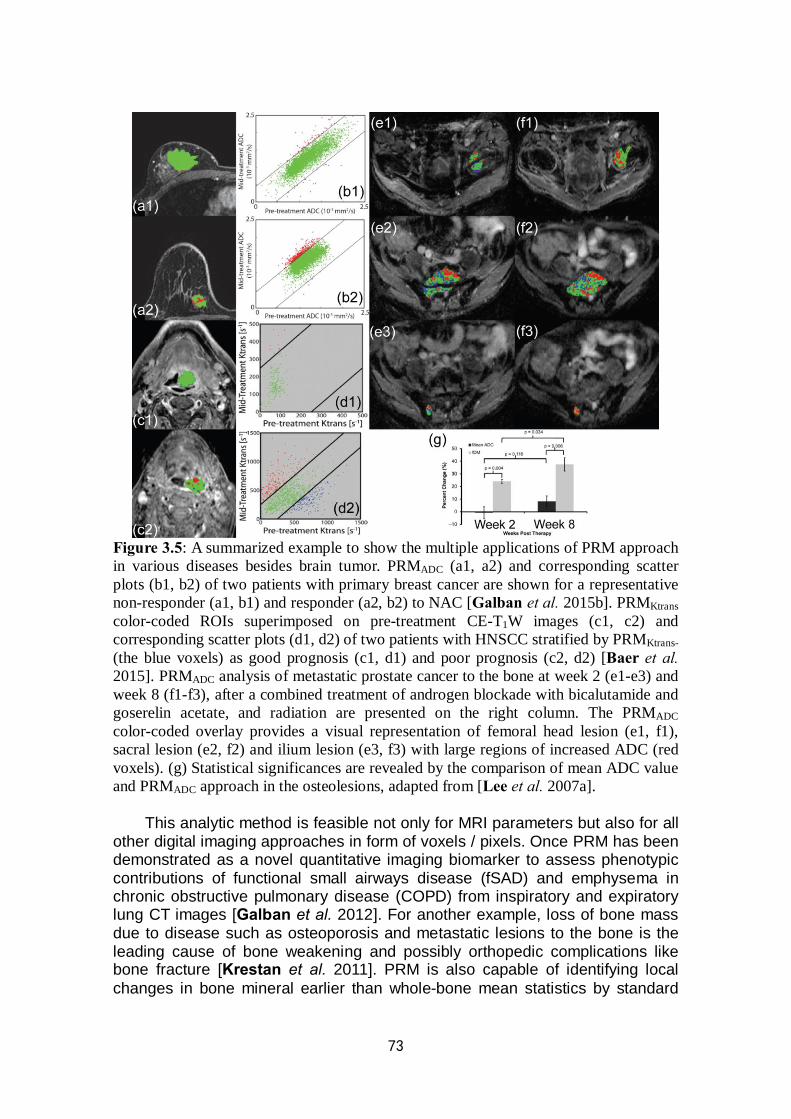
73
Figure 3.5: A summarized example to show the multiple applications of PRM approach in various diseases besides brain tumor. PRMADC (a1, a2) and corresponding scatter plots (b1, b2) of two patients with primary breast cancer are shown for a representative non-responder (a1, b1) and responder (a2, b2) to NAC [Galban et al. 2015b]. PRMKtrans color-coded ROIs superimposed on pre-treatment CE-T1W images (c1, c2) and corresponding scatter plots (d1, d2) of two patients with HNSCC stratified by PRMKtrans- (the blue voxels) as good prognosis (c1, d1) and poor prognosis (c2, d2) [Baer et al. 2015]. PRMADC analysis of metastatic prostate cancer to the bone at week 2 (e1-e3) and week 8 (f1-f3), after a combined treatment of androgen blockade with bicalutamide and goserelin acetate, and radiation are presented on the right column. The PRMADC color-coded overlay provides a visual representation of femoral head lesion (e1, f1), sacral lesion (e2, f2) and ilium lesion (e3, f3) with large regions of increased ADC (red voxels). (g) Statistical significances are revealed by the comparison of mean ADC value and PRMADC approach in the osteolesions, adapted from [Lee et al. 2007a].
This analytic method is feasible not only for MRI parameters but also for all other digital imaging approaches in form of voxels / pixels. Once PRM has been demonstrated as a novel quantitative imaging biomarker to assess phenotypic contributions of functional small airways disease (fSAD) and emphysema in chronic obstructive pulmonary disease (COPD) from inspiratory and expiratory lung CT images [Galban et al. 2012]. For another example, loss of bone mass due to disease such as osteoporosis and metastatic lesions to the bone is the leading cause of bone weakening and possibly orthopedic complications like bone fracture [Krestan et al. 2011]. PRM is also capable of identifying local changes in bone mineral earlier than whole-bone mean statistics by standard

74
CT-based protocols in a preclinical research. It is able to detect changes in bone mass with higher sensitivity and spatial location than conventional CT scans, which may provide information on clinical decision making for human suffering from bone loss [Hoff et al. 2015].
The advantages and drawbacks of different imaging analysis strategies introduced in this chapter are summarized in Tab.3.1.
Table 3.1: The strengths and challenges of different imaging analysis methods Strengths Challenges
Whole ROI-based analysis
Manageable; Visually observable; Widely-accepted; Instant comparability
Limited spatial extent; Nullification of the overall value shift; Dependency on ROI contours
Texture analysis Characterize the underlying structure of the observed tissues
A restriction to a set of predefined regions of interest without sufficient textural information; Difficulties in feature classification
Voxel-based analysis
(parametric response map)
Provide voxel-wise classification and spatial information; Show the heterogeneity of individuals; Sensitive to early prediction
Data of at least two time points is obligatory; Inherent complexity of image registration
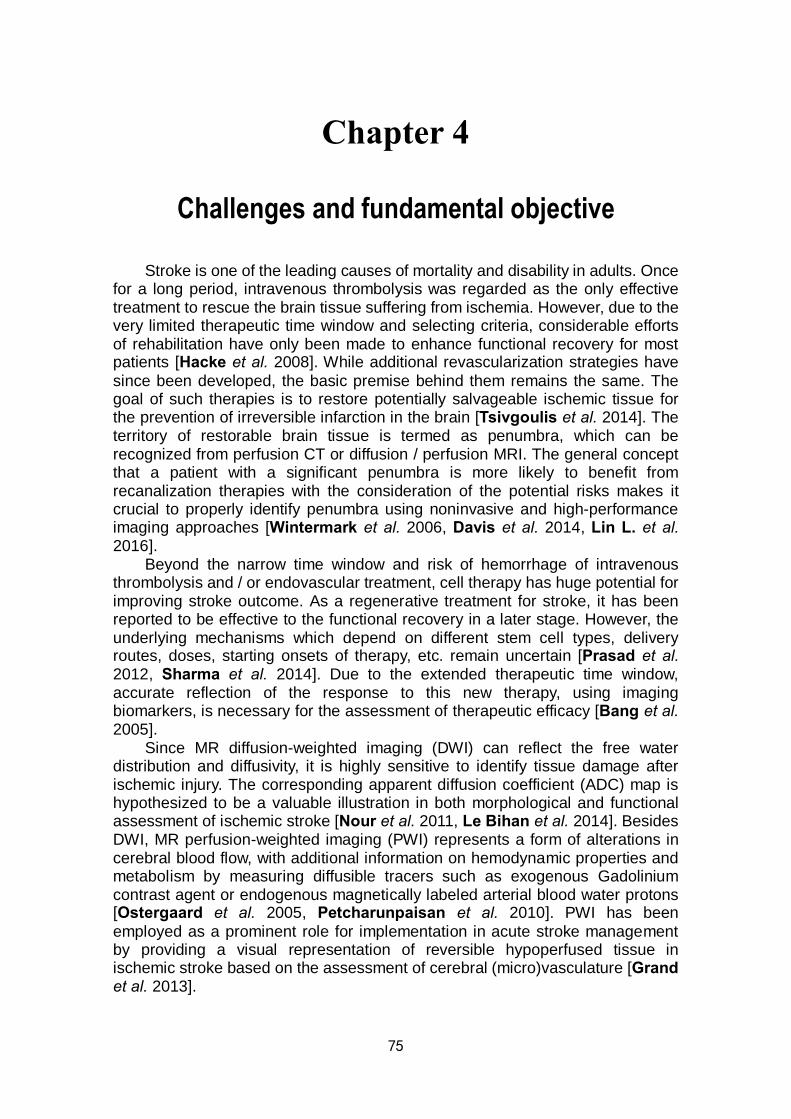
75
Chapter 4
Challenges and fundamental objective
Stroke is one of the leading causes of mortality and disability in adults. Once for a long period, intravenous thrombolysis was regarded as the only effective treatment to rescue the brain tissue suffering from ischemia. However, due to the very limited therapeutic time window and selecting criteria, considerable efforts of rehabilitation have only been made to enhance functional recovery for most patients [Hacke et al. 2008]. While additional revascularization strategies have since been developed, the basic premise behind them remains the same. The goal of such therapies is to restore potentially salvageable ischemic tissue for the prevention of irreversible infarction in the brain [Tsivgoulis et al. 2014]. The territory of restorable brain tissue is termed as penumbra, which can be recognized from perfusion CT or diffusion / perfusion MRI. The general concept that a patient with a significant penumbra is more likely to benefit from recanalization therapies with the consideration of the potential risks makes it crucial to properly identify penumbra using noninvasive and high-performance imaging approaches [Wintermark et al. 2006, Davis et al. 2014, Lin L. et al. 2016].
Beyond the narrow time window and risk of hemorrhage of intravenous thrombolysis and / or endovascular treatment, cell therapy has huge potential for improving stroke outcome. As a regenerative treatment for stroke, it has been reported to be effective to the functional recovery in a later stage. However, the underlying mechanisms which depend on different stem cell types, delivery routes, doses, starting onsets of therapy, etc. remain uncertain [Prasad et al. 2012, Sharma et al. 2014]. Due to the extended therapeutic time window, accurate reflection of the response to this new therapy, using imaging biomarkers, is necessary for the assessment of therapeutic efficacy [Bang et al. 2005].
Since MR diffusion-weighted imaging (DWI) can reflect the free water distribution and diffusivity, it is highly sensitive to identify tissue damage after ischemic injury. The corresponding apparent diffusion coefficient (ADC) map is hypothesized to be a valuable illustration in both morphological and functional assessment of ischemic stroke [Nour et al. 2011, Le Bihan et al. 2014]. Besides DWI, MR perfusion-weighted imaging (PWI) represents a form of alterations in cerebral blood flow, with additional information on hemodynamic properties and metabolism by measuring diffusible tracers such as exogenous Gadolinium contrast agent or endogenous magnetically labeled arterial blood water protons [Ostergaard et al. 2005, Petcharunpaisan et al. 2010]. PWI has been employed as a prominent role for implementation in acute stroke management by providing a visual representation of reversible hypoperfused tissue in ischemic stroke based on the assessment of cerebral (micro)vasculature [Grand et al. 2013].
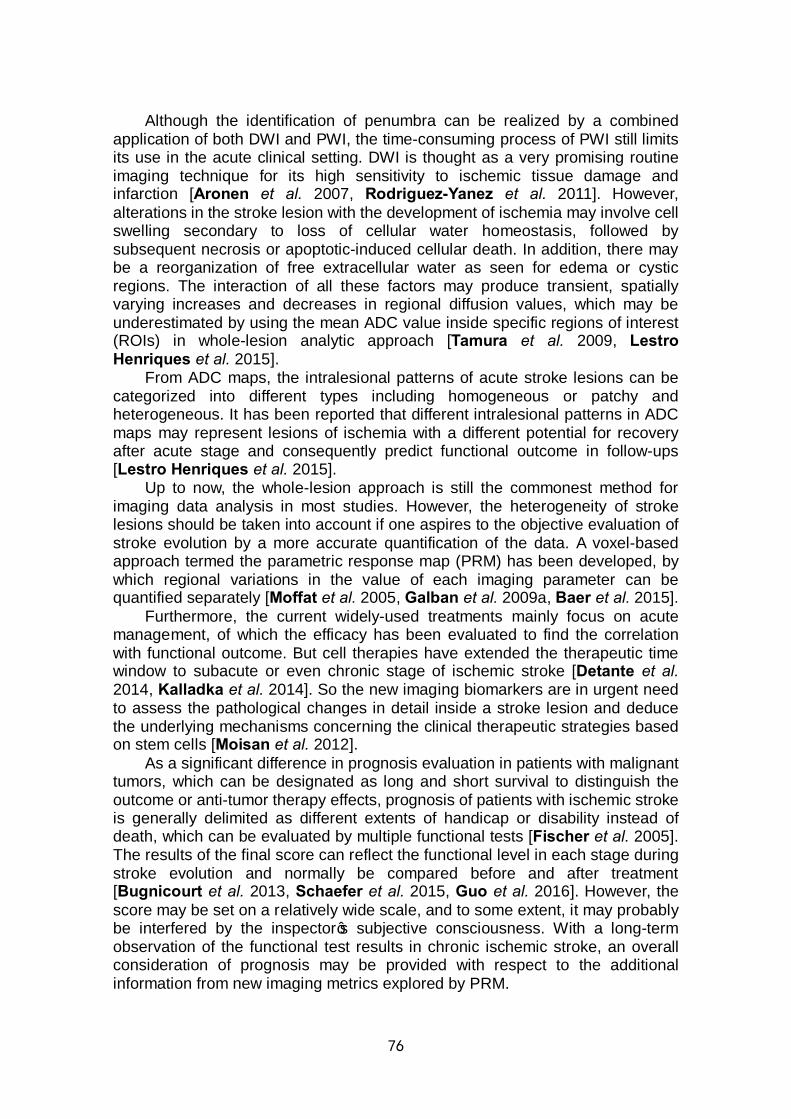
76
Although the identification of penumbra can be realized by a combined application of both DWI and PWI, the time-consuming process of PWI still limits its use in the acute clinical setting. DWI is thought as a very promising routine imaging technique for its high sensitivity to ischemic tissue damage and infarction [Aronen et al. 2007, Rodriguez-Yanez et al. 2011]. However, alterations in the stroke lesion with the development of ischemia may involve cell swelling secondary to loss of cellular water homeostasis, followed by subsequent necrosis or apoptotic-induced cellular death. In addition, there may be a reorganization of free extracellular water as seen for edema or cystic regions. The interaction of all these factors may produce transient, spatially varying increases and decreases in regional diffusion values, which may be underestimated by using the mean ADC value inside specific regions of interest (ROIs) in whole-lesion analytic approach [Tamura et al. 2009, Lestro Henriques et al. 2015].
From ADC maps, the intralesional patterns of acute stroke lesions can be categorized into different types including homogeneous or patchy and heterogeneous. It has been reported that different intralesional patterns in ADC maps may represent lesions of ischemia with a different potential for recovery after acute stage and consequently predict functional outcome in follow-ups [Lestro Henriques et al. 2015].
Up to now, the whole-lesion approach is still the commonest method for imaging data analysis in most studies. However, the heterogeneity of stroke lesions should be taken into account if one aspires to the objective evaluation of stroke evolution by a more accurate quantification of the data. A voxel-based approach termed the parametric response map (PRM) has been developed, by which regional variations in the value of each imaging parameter can be quantified separately [Moffat et al. 2005, Galban et al. 2009a, Baer et al. 2015].
Furthermore, the current widely-used treatments mainly focus on acute management, of which the efficacy has been evaluated to find the correlation with functional outcome. But cell therapies have extended the therapeutic time window to subacute or even chronic stage of ischemic stroke [Detante et al. 2014, Kalladka et al. 2014]. So the new imaging biomarkers are in urgent need to assess the pathological changes in detail inside a stroke lesion and deduce the underlying mechanisms concerning the clinical therapeutic strategies based on stem cells [Moisan et al. 2012].
As a significant difference in prognosis evaluation in patients with malignant tumors, which can be designated as long and short survival to distinguish the outcome or anti-tumor therapy effects, prognosis of patients with ischemic stroke is generally delimited as different extents of handicap or disability instead of death, which can be evaluated by multiple functional tests [Fischer et al. 2005]. The results of the final score can reflect the functional level in each stage during stroke evolution and normally be compared before and after treatment [Bugnicourt et al. 2013, Schaefer et al. 2015, Guo et al. 2016]. However, the score may be set on a relatively wide scale, and to some extent, it may probably be interfered by the inspector’s subjective consciousness. With a long-term observation of the functional test results in chronic ischemic stroke, an overall consideration of prognosis may be provided with respect to the additional information from new imaging metrics explored by PRM.
77
Our studies were divided into two parts including a preclinical and a clinical research, with a main goal to reveal the superiority of PRM approach over the conventional whole-lesion approach in stroke imaging analysis.
In our preclinical study, we compared these two analytic approaches based on the same multiparametric MR protocols including diffusion, perfusion and vessel size at several pre- and post-treatment time points to assess the effects of a biotherapy with intravenous delivery of human mesenchymal stem cells (hMSCs) in subacute stage, using a rat model after experimental stroke.
In the clinical study, patients suffering from ischemic stroke were undergone the DWI and PWI inspection at the set time points in chronic stage. For each time point, the National Institutes of Health Stroke Scale (NIHSS) and the modified Rankin Scale (mRS) were obtained for objective quantification of the impairment after ischemic injury. All the MRI parameters were analyzed by whole-lesion approach and PRM approach. The PRM results were derived from the comparison of the parametric values between the baseline and each other time point. An overall analysis was done to show the correlation between imaging metrics and functional scores during the whole follow-up.
As we have known from the published references, our work is the first trial to use PRM approach for the MRI data analysis in stroke monitoring, including estimation of new therapy efficacy and prediction of functional outcome. It may prove that the PRM can be used as a feasible and potential imaging tool to reflect the accuracy of intralesional characteristics for individuals with stroke, which may correlate with the therapeutic response and clinical outcome.

78
79
Chapter 5
Evaluation of parametric response map to assess cell therapy effects after experimental stroke
(This part of research has been submitted to the journal “Cell Transplantation”) 5.1 Brief abstract
Stroke is the leading cause of disability in adults. After the very narrow time frame during which treatment by thrombolysis and mechanical thrombectomy is possible, cell therapy has huge potential for enhancing stroke recovery. Accurate analysis of the response to new therapy, using imaging biomarkers, is needed to assess therapeutic efficacy. The aim of this study is to compare two analysis techniques: the parametric response map (PRM), a voxel-based technique, and the standard whole-lesion approach. These two analyses were performed on data collected at 4 time points in a transient middle cerebral artery occlusion (tMCAo) model, which was treated with human mesenchymal stem cell (hMSC) therapy. The apparent diffusion coefficient (ADC), cerebral blood volume (CBV) and vessel size index (VSI) were mapped using MRI. Two groups of rats received an intravenous (IV) injection of either 1 mL phosphate-buffered saline (PBS)-glutamine (MCAo-PBS, n = 10) or 3 million hMSCs (MCAo-hMSC, n = 10). One sham group were given PBS-glutamine (sham, n = 12). Each MRI parameter was analyzed by both the PRM and whole-lesion approaches. At day 9 (D9), one day after graft, PRM revealed that hMSCs had reduced the fraction of decreased ADC (PRMADC-: MCAo-PBS 6.7±1.7% vs. MCAo-hMSC 3.3±2.4%), abolished the fraction of increased CBV (PRMCBV+: MCAo-PBS 16.1±3.7% vs. MCAo-hMSC 6.4±2.6%) and delayed the fraction of increased VSI (PRMVSI+: MCAo-PBS 17.5±6.3% vs. MCAo-hMSC 5.4±2.6%). The whole-lesion approach was, however, insensitive to these early modifications. PRM thus appears to be a promising technique for the detection of early brain changes following treatments such as cell therapy.
Key Words: ischemic stroke; cell therapy; mesenchymal stem cell; diffusion
MRI; perfusion MRI; parametric response map 5.2 Introduction
Stroke is the leading neurological cause of disability in adults. Ischemic stroke (about 80% of all cases) occurs when arterial blood flow is interrupted. Currently, thrombolysis with tissue plasminogen activator (t-PA) and mechanical thrombectomy are employed as clinical treatments. Unfortunately, only around 5% of patients are treated with t-PA / thrombectomy, due to the very narrow therapeutic time window. Thus, most patients suffering from stroke only receive
80
supportive care and rehabilitation to improve recovery [Fonarow et al. 2011]. The development of other therapeutic strategies, which may be effective beyond the time window, is therefore critical for patients.
Multiple therapeutic approaches have been developed in preclinical studies in rodent models of cerebral ischemia. To this end, there is a strong interest for the potential of cell transplantation [Moskowitz et al. 2010, Eckert et al. 2013]. Among the cell populations currently available, human mesenchymal stem cells (hMSCs), derived from bone marrow, seem to have definite therapeutic potential. Indeed, these cells are characterized by poor immunogenicity, and may be used for cell therapy following stroke, under either autologous or allogenic conditions, without inducing side effects [Moisan et al. 2012, Eckert et al. 2013, Gennai et al. 2015]. Human MSCs participate in the reconstruction of a favorable microenvironment, leading to neovascularization and tissue regeneration. Enhancement of the differentiation of stem cells into the original cell lineages of the damaged tissue, or selective migration of cells to ischemic regions to support plasticity may eventually improve functional recovery after ischemia [Orlic et al. 2001, Shyu et al. 2004]. The detailed mechanisms by which transplanted hMSCs ameliorate stroke prognosis are still poorly understood and could depend on the microenvironment (accessibility to tissue, tissue type, oxygenation level etc.) [Jeong C. H. et al. 2014]. Moreover, among all the administration routes available (intracerebral, intrathecal, intra-arterial and IV), the IV administration, less invasive, appears today safer and easier than local brain grafting following stroke in the clinical setting and allows cell distribution into vascularized and viable areas of the lesion [Detante et al. 2009]. A clinical trial already demonstrated that IV delivery of hMSC is feasible and safe for stroke patients [Bang et al. 2005].
Today, multiparametric magnetic resonance imaging (MRI), including diffusion-weighted imaging (DWI) and perfusion-weighted imaging (PWI), has become the gold standard to characterize stroke lesions [Gonzalez et al. 2012]. MRI also plays an important role in the identification, evaluation and monitoring of cerebral tissue undergoing stroke, from the acute to the recovery phase [Ding et al. 2014]. However, the spatial heterogeneity of a stroke lesion, well visible on MRI maps, remains a challenge for current image analysis techniques [Bang et al. 2009a, Lestro Henriques et al. 2015]. An analysis of the mean value across a large region of interest (ROI) by manual delineation can easily mask focal changes of intralesional tissue properties. Thus, to evaluate the therapeutic effect dedicated to stroke recovery, the lesion heterogeneity in space and time needs to be accounted for by the image analysis. Histogram-based techniques provide an evaluation of lesion heterogeneity but fail to provide spatial information. An alternative is the parametric response map (PRM), a voxel-based analysis technique, which has been used in multiple brain diseases including glioma and primary intracerebral hemorrhage (ICH). PRM, which has been established as a promising tool to investigate parametric changes of heterogeneous lesion over time at the voxel level, is well suited to evaluate a therapeutic response or to make a prognosis [Galban et al. 2009a, Galban et al. 2011, Tsai et al. 2013]. All the demonstrations of the PRM approach are based on the potential mechanisms occur during stroke evolution, which indirectly realized by imaging visualization (a schematic representation of PRMADC in

81
Fig.5.1). In a recent publication, Moisan et al. reported that an IV injection of hMSC
modifies microvasculature associated with overexpressions of several angiogenic factors such as Ang1, Ang2 or Tie2 as soon as 1 day post injection in a rat model of stroke, by enhancing endogenous angiogenesis and immature vessel stabilization in a parallel study with the same experiment condition of ours [Moisan et al. 2016]. In that article, a sustained overexpression of Ang1 and Ang2 were observed from D9 to D25 in hMSC-treated group (Fig.5.2). Ang2 has been proved to promote endothelial cells survival and participate to vascular stabilization through Tie2 activation [Kim et al. 2000, Teichert-Kuliszewska et al. 2001]. Furthermore, improvement of the functional recovery has been revealed in hMSC-treated animals by behavioral testing with a long-term follow-up [Moisan et al. 2016]. No microvascular change is however detected by the associated multiparametric MRI protocol at the early times points following hMSC injection.
To reduce the delay between the biological changes induced by the stem cells and the MRI changes, we evaluate in this study new imaging biomarkers. The MRI dataset from Moisan et al. was reprocessed by using the PRM technique. The two main methodological goals of this study were: i) to characterize the evolution of the heterogeneity of stroke lesions in a rodent model using in vivo multiparametric MRI and ii) to evaluate the potential of PRM to describe the impact of a cell therapy on the stroke lesion. 5.3 Materials and methods
All animal procedures were carried out in accordance with the French guidelines on the use of animals in scientific investigations (permits 381106 for AM, 380820 for CR and A3851610008 for experimental and animal cares facilities), with the approval of the “Grenoble Institut des Neurosciences” ethical committee (agreement 004). For all procedures, anesthesia was induced by inhalation of 5% isoflurane (Abbott Scandinavia AB, Solna, Sweden) in 30% O2 in air and was maintained throughout all surgical and imaging protocols with 2-2.5% isoflurane through a facial mask. Rectal temperature was monitored and maintained at 37.0±0.5 ℃. 5.3.1 Transient Middle Cerebral Artery occlusion (tMCAo) model
A total of 32 rats were used in this study. Twenty Sprague Dawley male rats (weighing 250-300g, Janvier, France) underwent transient focal cerebral ischemia surgery at day 0 (D0), as described by Moisan et al. [Moisan et al. 2012]. Briefly, after isolating the right carotid arterial tree, a commercially available silicon rubber-coated monofilament (diameter 0.37 mm, Doccol Corporation, Pennsylvania) was advanced from the lumen of the external carotid artery into the internal carotid artery, up to 5 mm beyond the external skull base. After 90 min of occlusion, rats were reanaesthetized and the thread was removed. A further 12 rats underwent the same surgery without occlusion (sham group).
82
5.3.2 Experimental groups and intravenous administration of hMSCs
The 20 MCAo rats were stratified randomly into 2 groups (10 rats per group). At D8, the two groups received an injection via the tail vein of either 1 mL phosphate-buffered saline (PBS)-glutamine (MCAo-PBS) or 3 million hMSCs (MCAo-hMSC). The sham group received the same PBS-glutamine injection as the MCAo-PBS group (Fig.5.3-A).
The hMSCs were used to be consistent with an ongoing clinical trial (PHRC NCT00875654). The hMSCs were isolated from bone marrow aspirated from
healthy, consenting donors and cultured at 37 ℃ in a humidified atmosphere
containing 5% CO2. Minimum Essential Medium with alpha modification (MEMɑ), supplemented with 100 ug/mL penicillin, 100 ug/mL streptomycin, and 10% fetal calf serum was used for culturing (all reagents are from Invitrogen, France).
5.3.3 MRI experiments: acquisition Each rat was analyzed by MRI (7 T, Avance III console; Bruker - Grenoble
MRI facility IRMaGE) for 3 weeks (subacute stage: D3, D7, D9 and chronic stage: D16 after transient MCAo or sham surgery). The following sequences were performed: 1) T2-weighted images (TR/TE = 2500/60 ms, voxel = 234×234×1000 μm3, 16 slices, 2 averages); 2) diffusion-weighted images (DWI: spin echo planar imaging; TR/TE = 3000/29 ms; voxel = 234×234×1000 μm3; 7 slices) for three principal directions and 3) multi-gradient echo and spin echo images (MGESE: TR/TE = 4000/40 ms; 7 echoes from 2.3 to 15.6 ms, voxel = 234×234×1000 μm3; 7 slices; 2 averages) acquired before (MGESE-pre) and 2 min after IV injection (MGESE-post) of ultrasmall superparamagnetic iron oxide particles (USPIO; P904®, Guerbet, Roissy, France; 200 μmol iron/kg body weight). 5.3.3.1 MRI experiments: data processing
The apparent diffusion coefficient (ADC) map was calculated by Eq. [1]:
[1]
where S1 is the signal intensity (SI) of the voxel obtained through three orthogonally oriented diffusion-weighted images or diffusion trace images. S0 is the SI of the voxel obtained through reference T2-weighted images. b1 is the gradient b factor with a value of 900 s/mm2. b0 is the gradient b factor with a value of 0 s/mm2.
Cerebral blood volume (CBV) and vessel size index (VSI) maps were obtained using a steady-state approach and computed using an in-house software developed within Matlab (MathWorks, Natick, MA, USA), according to Tropres et al. [Tropres et al. 2014]. CBV was derived from the ΔR2
* map using Eq. [2]:
11 0
0
[ln( )] / (b b )S
ADCS
83
[2]
where γ is the gyromagnetic ratio of the proton. Δχ is the increase in intravascular susceptibility following the injection of contrast agent (0.19 ppm (cgs)). B0 is the value of the static magnetic field.
VSI was derived using Eq. [3], according to Tropres et al. [Tropres et al. 2014], and represents the mean vessel diameter in each voxel:
[3]
Within each map of each time point, voxels for which the analysis could not be performed, for example, voxels with non-converging fits or voxels with values outside the range of validity of the method used to measure parameters (ADC > 3500 µm2/s; CBV > 17%; VSI > 50 µm), were identified and excluded from the analysis (fractions of all excluded voxels of each map: 12.8%, 17.5% and 19.8% respectively). It must be noted that the microvascular parameters (CBV and VSI) only reflect the functional vessels (i.e. those perfused by the contrast agent). 5.3.3.2 Data analysis 5.3.3.2.1 Regions of interest (ROIs) definition
For each rat and each MRI session, the whole stroke lesion, identified as the hyperintense region on the T2-weighted images, was manually delineated and subsequently checked for concordance on the ADC maps, to avoid ventricles. Each lesion was delineated on all slices where it was visible [Moisan et al. 2012]. The definition of ROIs was made blind to treatment allocation. Lesion volumes were computed by calculating the sum of lesion areas on each slice. In the sham group, a ROI was delineated on the right hemisphere, which had a contour and a size similar to that of the stroke lesions observed in the MCAo groups at D0. ROIs were then transferred onto the ADC, CBV, and VSI parametric maps. 5.3.3.2.2 Whole-lesion analysis
For each rat at each time point, ADC, CBV and VSI values were measured in each ROI and are presented as mean±standard deviation (SD[2]). 5.3.3.2.3 Parametric response map (PRM) analysis
All images were co-registered onto T2-weighted images of D3 using a fully automated, affine, mutual information-based, simplex optimization algorithm (co-registration function in SPM12 free software, distributed under the terms of the GNU General Public License as published by the Free Software Foundation). Changes in ADC, CBV and VSI maps were analyzed voxel-wise by PRM for each rat at each time point. For the purpose of clarity, PRM analyses on ADC maps will be described in details (Fig.5.3-B). We first computed the 95% confidence interval (CI) for the classification of ADC values according to most
*2
0
34
RCBVBπ γ χ
∆=
∆
*1/2 3/22
0 2
0.425( ) ( )RADCVSIB Rγ χ
∆=
∆ ∆
84
PRM procedure design. Briefly, we empirically calculated, in the sham animals, the threshold that yields a significant change in ADC value for each voxel between D3 and D7. The ADC threshold (120 µm²/s) was determined by the 95% unchanged CI resulting from linear least squares analysis on the data combined from all 12 rats of the sham group (data not shown) instead of the receiver operating characteristic (ROC) curve analysis for an optimal prediction which previously described in a reference [Galban et al. 2009b]. Then, PRMADC maps were determined by calculating the difference between ADC within the stroke lesion at D3 and at each following time point (D7, D9 and D16). Red voxels represent voxels within each lesion with an increase in the ADC value (beyond the CI of 120 µm2/s; cf. above), blue voxels represent voxels with a decrease in the ADC value (below the CI), and green voxels represent voxels within each lesion with an unchanged ADC value (the absolute value of ΔADC varies less than the CI). Therefore, all voxels within the lesion volume were segmented into three fractions: PRMADC+ (increased ADC, denoted red), PRMADC- (decreased ADC, denoted blue), and PRMADC0 (unchanged ADC, denoted green). The same analytic procedure was applied to the CBV and VSI maps. After determining each CI (2.5% for PRMCBV and 5.8 µm for PRMVSI), PRMCBV and PRMVSI maps were obtained at D7, D9 and D16 by comparison with the data acquired at D3. 5.3.3.2.4 Statistical analysis
Between-group comparison was performed using unpaired t-tests after checking the variance homogeneity (Levene’s test). In cases of variance inhomogeneity, a Mann-Whitney test was used. To evaluate the PRM changes, we performed a three-group (MCAo-PBS, MCAo-hMSC and sham) and three-time-point (D7, D9, and D16) mixed-design ANOVA, using a Bonferroni correction for multiple comparisons. Results are expressed as mean±SD[2]. All statistical analyses were conducted with a statistical software package (SPSS; SPSS, Inc, Chicago, IL). Results were declared statistically significant at the two-sided 5% comparison-wise significance level (p < 0.05). 5.4 Results 5.4.1 Evolution of lesion volume
At each time point, the mean lesion volumes of the two MCAo groups were comparable (MCAo-PBS vs. MCAo-hMSC: D3: 67.5±15.7 mm3 vs. 83.9±24.6 mm3; D7: 91.5±39.1 mm3 vs. 70.0±14.3 mm3; D9: 89.3±33.8 mm3 vs. 97.6±9.2 mm3; D16: 92.8±24.6 mm3 vs. 107.2±9.2 mm3) (Fig.5.4-A). 5.4.2 Evolution of ADC
The whole-lesion approach showed that the ADC in the MCAo and sham groups were comparable at D3 and D7 and differed at D9 and D16: the mean ADC values in the lesions were increased in both MCAo groups (MCAo-PBS and MCAo-hMSC), when compared to the sham condition (D9: 1151±166 μm2/s and 1142±144 μm2/s vs. 736±189 μm2/s; D16: 1582±415 μm2/s and 1753±145 μm2/s vs. 789±32 μm2/s, p < 0.05 respectively) (Fig.5.4-B). Moreover, the intralesional heterogeneity in both MCAo groups were two times higher at D3
85
than in the sham group (mean of the SD[2] values were 127±23 μm2/s and 129±37 μm2/s vs. 65±17 μm2/s for MCAo-PBS, MCAo-hMSC and sham groups, respectively) (Fig.5.4-B). This intralesional heterogeneity increases over time to reach a mean of the SD[2] about seven times higher in both MCAo groups than in the sham group (mean of the SD[2] values were 435±198 μm2/s and 472±121 μm2/s vs. 64±31 μm2/s for MCAo-PBS, MCAo-hMSC and sham groups, respectively) (Fig.5.4-B).
The PRM approach showed that most of the pixels in the lesion ROIs exhibited increased ADC values in the stroke animals. At the periphery of the lesion ROIs, areas with a stable or decreased ADC were also observed at each time point (Fig.5.5). A visual inspection of the maps also suggested that the PRMADC maps were relatively stable over time. PRMADC color-coded overlay of a rat in MCAo-PBS group is shown in contrast to a rat in hMSC-treated group. A corresponding quantitative scatter plot shows the distribution of ADC value at D3 compared with D9 for the entire ischemic lesion volume region (Fig.5.6).
The fractions of voxels with an increased (PRMADC+) or decreased (PRMADC-) ADC over time in both MCAo groups differed from those of the sham group. The PRMADC+ fractions were larger in the MCAo groups (MCAo-PBS and MCAo-hMSC) than in the sham group at D7 (62.7±12.1% and 71.9±14.2% vs. 4.0±3.3%, p < 0.01), D9 (68.7±9.1% and 77.1±9.4% vs. 2.9±2.3%, p < 0.01) and D16 (78.7±13.1% and 83.8±8.2% vs. 3.7±3.0%, p < 0.01) (Fig.5.9). The PRMADC- fraction was larger in the MCAo-PBS group than in the sham group at D7 (6.1±2.4% vs. 3.0±2.6%, p < 0.01), D9 (6.7±1.7% vs. 3.2±2.6%, p < 0.01) and D16 (5.7±1.7% vs. 3.0±1.9%, p < 0.01). The PRMADC- fraction was larger in the MCAo-hMSC group than in the sham group only before treatment (D7: 6.3±2.3% vs. 3.0±2.6%, p < 0.01). Moreover, the PRMADC- fraction decreased in the MCAo-hMSC group, in comparison to the MCAo-PBS group, after treatment (D9: 3.3±2.4% vs. 6.7±1.7% and D16: 3.3±1.0% vs. 5.7±1.7%; p < 0.01 respectively) (Fig.5.9). The ANOVA showed significant increase of PRMADC+ at D7, D9 and D16 in both MCAo groups when compared to the sham group. At D3, there was significant increase of PRMADC- in both MCAo groups when compared to the sham group. At D9 and D16, PRMADC- was significantly higher in the MCAo-PBS group than that in MCAo-hMSC and sham groups while no significant interaction between the latter two groups. 5.4.3 Evolution of CBV
The whole-lesion approach showed that no significant CBV difference was observed between the two MCAo groups at each time point, but the mean CBV values in the lesions were significantly increased in both MCAo groups (MCAo-PBS and MCAo-hMSC), compared to the sham group (D3: 4.1±0.4% and 4.5±0.3% vs. 2.7±0.7%; D7: 3.8±0.3% and 4.2±0.3% vs. 2.5±0.6%; D9: 4.3±0.4% and 4.4±0.4% vs. 2.7±0.3%; D16: 4.4±0.4% and 4.5±0.4% vs. 2.5±0.4%, p < 0.05 respectively) (Fig.5.4-C). Moreover, the intralesional heterogeneity in both MCAo groups was higher and stable over time than in the sham group (mean of the SD[2] values across time points were 2.6±0.4 and 2.7±0.4 vs. 1.8±0.3% for MCAo-PBS, MCAo-hMSC and sham groups, respectively) (Fig.5.4-C).
The PRM approach yielded PRMCBV maps with a large fraction of stable

86
CBV values. Small areas with either decreased or increased CBV appeared throughout each lesion and the positions of these modified CBV areas evolved with time (Fig.5.5). PRMCBV color-coded overlay of a rat in MCAo-PBS group is shown in contrast to a rat in MCAo-hMSC group. A corresponding quantitative scatter plot shows the distribution of CBV value at D3 compared with D9 for the entire ischemic lesion volume region (Fig.5.7).
The fraction of voxels with an increased (PRMCBV+) and decreased (PRMCBV-) CBV over time in the two MCAo groups differed from that of the sham group. The PRMCBV+ fraction was larger in the MCAo groups (MCAo-PBS and MCAo-hMSC) than in the sham group at D7 (15.4±2.4% and 16.4±4.7% vs. 2.9±2.3%, p < 0.01 respectively), D9 (16.1±3.7% and 6.4±2.6% vs. 3.9±2.3%, p < 0.01 and p < 0.05 respectively) and D16 (23.7±2.8% and 20.6±5.0% vs. 3.5±2.3%, p < 0.01 respectively). Moreover, the PRMCBV+ fraction was higher in the MCAo-PBS group than in the MCAo-hMSC group at D9 (16.1±3.7% vs. 6.4±2.6%, p < 0.01) (Fig.5.10). The PRMCBV- fraction was larger in the MCAo groups (MCAo-PBS and MCAo-hMSC) than in the sham group at D7 (24.1±9.5% and 25.5±7.5% vs. 4.8±2.9%, p < 0.01 respectively), D9 (16.5±6.0% and 23.5±12.2% vs. 4.2±2.5%, p < 0.01 respectively) and D16 (15.5±4.8% and 17.9±5.6% vs. 3.4±1.9%, p < 0.01 respectively) (Fig.5.10). The ANOVA showed significant increase of PRMCBV+ and PRMCBV- at D7, D9 and D16 in both MCAo groups when compared to the sham group. At D9, PRMCBV+ was significantly higher in the MCAo-PBS group than that in the MCAo-hMSC group. 5.4.4 Evolution of VSI
The whole-lesion approach showed that the VSI value measured in each lesion was higher in both MCAo groups (MCAo-PBS and MCAo-hMSC) than in the sham group at D3 (11.2±0.6 μm and 11.9±0.2 μm vs. 5.6±0.6 μm, p < 0.05 respectively), D7 (10.3±0.5 μm and 10.0±0.1 μm vs. 5.0±0.3 μm, p < 0.05 respectively), D9 (10.0±0.3 μm and 10.2±0.3 μm vs. 5.2±0.2 μm, p < 0.05 respectively) and D16 (9.4±0.5 μm and 7.6±0.4 μm vs. 5.1±0.6 μm, p < 0.05 respectively) (Fig.5.4-D). Moreover, no difference in VSI was observed between the MCAo groups (MCAo-PBS and MCAo-hMSC) at D3, D7 and D9. However, at D16, the mean VSI value was higher in the MCAo-PBS group than in the MCAo-hMSC group (9.4±0.5 μm vs. 7.6±0.4 μm, p = 0.047). Moreover, the intralesional heterogeneity in both MCAo groups were higher and stable over time as compared to the sham group (mean of the SD[2] values across time point were 4.8±0.5 and 4.8±0.5 vs. 3.3±0.6 μm for MCAo-PBS, MCAo-hMSC and sham groups, respectively) (Fig.5.4-D).
With the PRM approach, PRMVSI maps exhibited patterns similar to those of PRMCBV: a large unchanged VSI fraction with small areas of modified VSI distributed throughout each lesion, the positions of which varied with time (Fig.5.5). PRMVSI color-coded overlay of a rat in MCAo-PBS group is also shown in contrast to a rat in MCAo-hMSC group. A corresponding quantitative scatter plot shows the distribution of VSI value at D3 compared with D9 for the entire ischemic lesion volume region (Fig.5.8).
The fraction of voxels with increased (PRMVSI+) and decreased (PRMVSI-) VSI, over time, in both MCAo groups differed from that of the sham group. The PRMVSI+ fraction was larger in the MCAo groups (MCAo-PBS and MCAo-hMSC)
87
than in the sham group at D7 (12.3±2.9% and 14.3±3.6% vs. 4.0±2.4%, p < 0.01 respectively) and D16 (24.4±5.4% and 21.0±5.7% vs. 5.0±2.9%, p < 0.01 respectively). Moreover, the PRMVSI+ fraction at D9 was higher in the MCAo-PBS group than in either the MCAo-hMSC or sham groups (17.5±6.3% vs. 5.4±2.6% and 4.7±2.5%, p < 0.01 respectively) (Fig.5.11). The PRMVSI- fraction was larger in the MCAo groups (MCAo-PBS and MCAo-hMSC) than in the sham group at D7 (17.7±8.3% and 18.5±4.4% vs. 4.7±2.7%, p < 0.01 respectively), D9 (19.6±8.2% and 21.2±8.7% vs. 4.7±2.4%, p < 0.01 respectively) and D16 (13.6±4.9% and 18.3±4.9% vs. 4.3±2.1%, p < 0.01 respectively). Moreover, the PRMVSI- fraction at D16 was lower in the MCAo-PBS group than in the MCAo-hMSC group (13.6±4.9% vs. 18.3±4.9%, p < 0.01) (Fig.5.11). The ANOVA showed significant increase of PRMVSI- at D7, D9 and D16 in both MCAo groups when compared to the sham group. At D16, PRMVSI- was significantly higher in the MCAo-hMSC group than that in the MCAo-PBS group. At D7 and D16, PRMVSI+ was significantly higher in both MCAo groups than that in the sham group. At D9, PRMVSI+ was significantly higher in the MCAo-PBS group than that in MCAo-hMSC and sham groups while no significant interaction between the latter two groups. 5.5 Discussion
In this study, we analyzed MRI data collected from a stroke model undergoing cell therapy. Two analysis techniques were compared: the whole-lesion approach, which yields a mean estimate of the entire lesion for each MRI parameter, and PRM, a voxel-based approach which describes the fraction of voxels which evolves beyond a given threshold for each parameter. As expected, we observed a large heterogeneity in the stroke lesion in the ADC, CBV, and VSI maps. Furthermore, our results show that the IV injection of hMSCs induces cellular and microvascular modifications in the stroke lesion, assessed by MRI and analyzed by PRM. The microvascular MRI results are in agreement with previously reported biological data obtained in the same experimental conditions (release of angiogenic factors, such as angiopoietin 2 (Ang2), angiopoietin 1 (Ang1), stromal-cell-derived factor-1 (SDF-1), and transforming growth factor-β1 (TGFβ1)) [Moisan et al. 2016]. The early therapeutic response (D9, one day after treatment) was easily observed and quantified by the PRM analysis, whereas the whole-lesion approach remained blind to these changes due to the heterogeneity of stroke lesions (Tab.5.1).
As expected for a transient ischemic stroke model, ADC values calculated for each lesion, by the whole-lesion approach were significantly larger in the MCAo groups than in the sham group from D9 [Decanniere et al. 1995, Kohno et al. 1995]. However, unlike the PRM approach, the increase in ADC observed with the whole-lesion approach fails to account for some small areas where ADC remains lower than normal in both MCAo groups at D7. This fraction of voxels with a reduced ADC is reduced by the hMSC treatment at D9. In this case, the PRM highlights the effect of therapy, which was not revealed by the whole-lesion approach.
We also monitored microvascular remodeling by assessing CBV and VSI, which are established methods of characterizing the changes elicited by stroke
88
therapy [Moisan et al. 2012, Liu et al. 2014, Tropres et al. 2015]. The therapeutic effect for these two parameters was spatially distributed among small regions with varying microvascular parameters. Moreover, focal changes were detected by PRM in both the VSI and CBV maps at both D9 (one day after treatment) and D16. These focal changes could not be detected by the whole-lesion approach, except for VSI at the last time point (D16). It is noteworthy that a previous study using the same MCAo model and the same type of stem cells showed a therapeutic effect upon the microvascular characteristics assessed by MRI. Stem cells either injected directly into the lesions or IV as our study [Moisan et al. 2012, Moisan et al. 2016]. If the biological effects of hMSC therapy in stroke lesions are beyond the scope of this methodological study, PRM appears as a suitable tool to guide the biological analysis towards areas that undergone physiological changes.
Overall, IV-injected hMSCs affected only a fraction of lesions. Both increases and decreases in MRI parameters were observable throughout the lesions and over time. Given the initial heterogeneity of the lesions and the underlying brain tissue, these findings are not surprising. This also suggests that longitudinal imaging data from previous clinical trials such as neuroprotective drug trials should be re-analyzed to evaluate if some negative results could be ascribed, at least in part, to the coarse analysis approach employed. 5.6 Conclusion
This study describes the application of PRM analysis to multiparametric MRI maps (ADC, CBV and VSI), after a delayed IV injection of hMSCs, in a transient stroke model. One day after treatment, the PRM analysis was able to highlight the changes induced by hMSCs upon cellular edema, microvascular plasticity and vasodilation, whereas the classic whole-lesion approach was insensitive to the early therapeutic effect. The PRM approach also indicated that the effect of hMSCs is distributed throughout the entire lesion. For longitudinal studies, PRM analysis thus appears to be a promising technique for the early detection of heterogeneous changes induced by cell therapies in heterogeneous lesions, such as those which characterize ischemic stroke. 5.7 Acknowledgements and sources of funding
We thank the Grenoble MRI Facility (IRMaGe) and the Departments of Neurology and Neuroradiology and MRI of the University Hospital of Grenoble for their valuable technical support. IRMaGe is partly funded by the French program “Investissement d’Avenir” run by French National Research Agency, grant “Infrastructure d’avenir en Biologie Santé” - ANR-11-INBS-0005.
We are also grateful to the E-Cell France platform (French network for regenerative medicine) for providing clinical grade stem cells. 5.8 Disclosure Statement
The authors indicate no potential conflicts of interest.
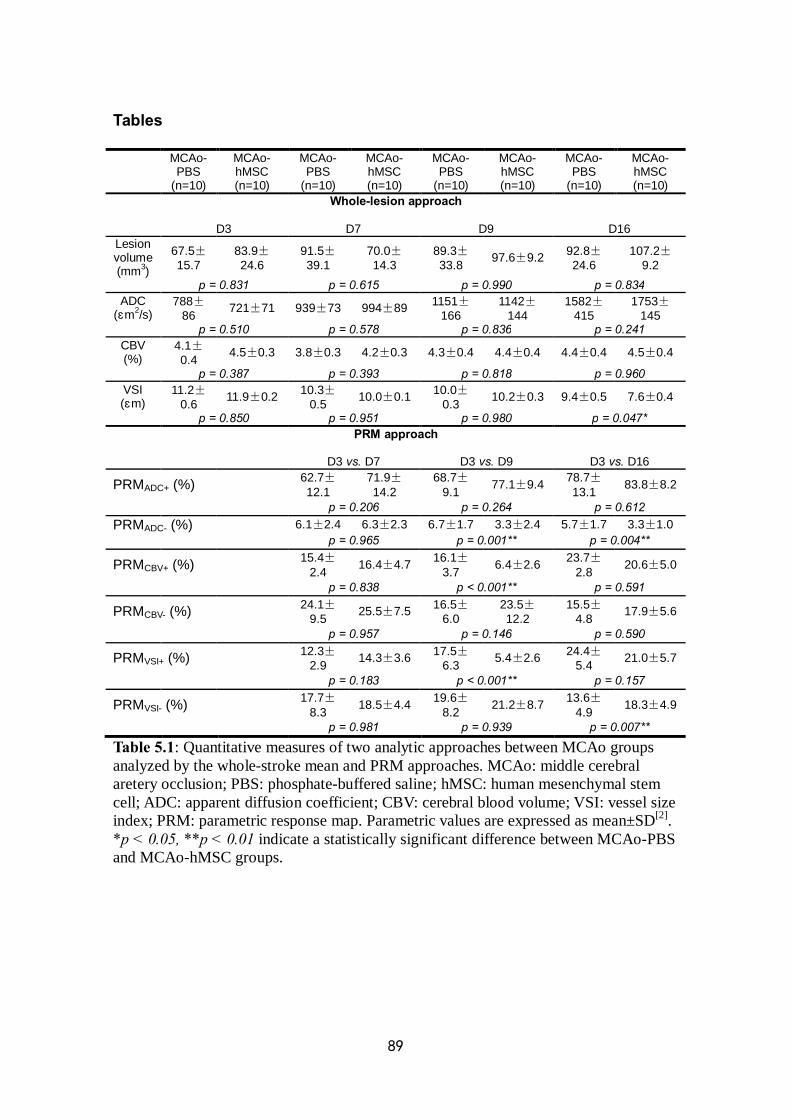
89
Tables
MCAo- PBS
(n=10)
MCAo- hMSC (n=10)
MCAo- PBS
(n=10)
MCAo- hMSC (n=10)
MCAo- PBS
(n=10)
MCAo- hMSC (n=10)
MCAo- PBS
(n=10)
MCAo- hMSC (n=10)
Whole-lesion approach
D3 D7 D9 D16 Lesion volume (mm3)
67.5±15.7
83.9±24.6
91.5±39.1
70.0±14.3
89.3±33.8 97.6±9.2 92.8±
24.6 107.2±
9.2 p = 0.831 p = 0.615 p = 0.990 p = 0.834
ADC (μm2/s)
788±86 721±71 939±73 994±89 1151±
166 1142±
144 1582±
415 1753±
145 p = 0.510 p = 0.578 p = 0.836 p = 0.241
CBV (%)
4.1±0.4 4.5±0.3 3.8±0.3 4.2±0.3 4.3±0.4 4.4±0.4 4.4±0.4 4.5±0.4
p = 0.387 p = 0.393 p = 0.818 p = 0.960 VSI (μm)
11.2±0.6 11.9±0.2 10.3±
0.5 10.0±0.1 10.0±0.3 10.2±0.3 9.4±0.5 7.6±0.4
p = 0.850 p = 0.951 p = 0.980 p = 0.047* PRM approach
D3 vs. D7 D3 vs. D9 D3 vs. D16
PRMADC+ (%) 62.7±12.1
71.9±14.2
68.7±9.1 77.1±9.4 78.7±
13.1 83.8±8.2
p = 0.206 p = 0.264 p = 0.612 PRMADC- (%) 6.1±2.4 6.3±2.3 6.7±1.7 3.3±2.4 5.7±1.7 3.3±1.0 p = 0.965 p = 0.001** p = 0.004**
PRMCBV+ (%) 15.4±2.4 16.4±4.7 16.1±
3.7 6.4±2.6 23.7±2.8 20.6±5.0
p = 0.838 p < 0.001** p = 0.591
PRMCBV- (%) 24.1±9.5 25.5±7.5 16.5±
6.0 23.5±12.2
15.5±4.8 17.9±5.6
p = 0.957 p = 0.146 p = 0.590
PRMVSI+ (%) 12.3±2.9 14.3±3.6 17.5±
6.3 5.4±2.6 24.4±5.4 21.0±5.7
p = 0.183 p < 0.001** p = 0.157
PRMVSI- (%) 17.7±8.3 18.5±4.4 19.6±
8.2 21.2±8.7 13.6±4.9 18.3±4.9
p = 0.981 p = 0.939 p = 0.007**
Table 5.1: Quantitative measures of two analytic approaches between MCAo groups analyzed by the whole-stroke mean and PRM approaches. MCAo: middle cerebral aretery occlusion; PBS: phosphate-buffered saline; hMSC: human mesenchymal stem cell; ADC: apparent diffusion coefficient; CBV: cerebral blood volume; VSI: vessel size index; PRM: parametric response map. Parametric values are expressed as mean±SD[2]. *p < 0.05, **p < 0.01 indicate a statistically significant difference between MCAo-PBS and MCAo-hMSC groups.
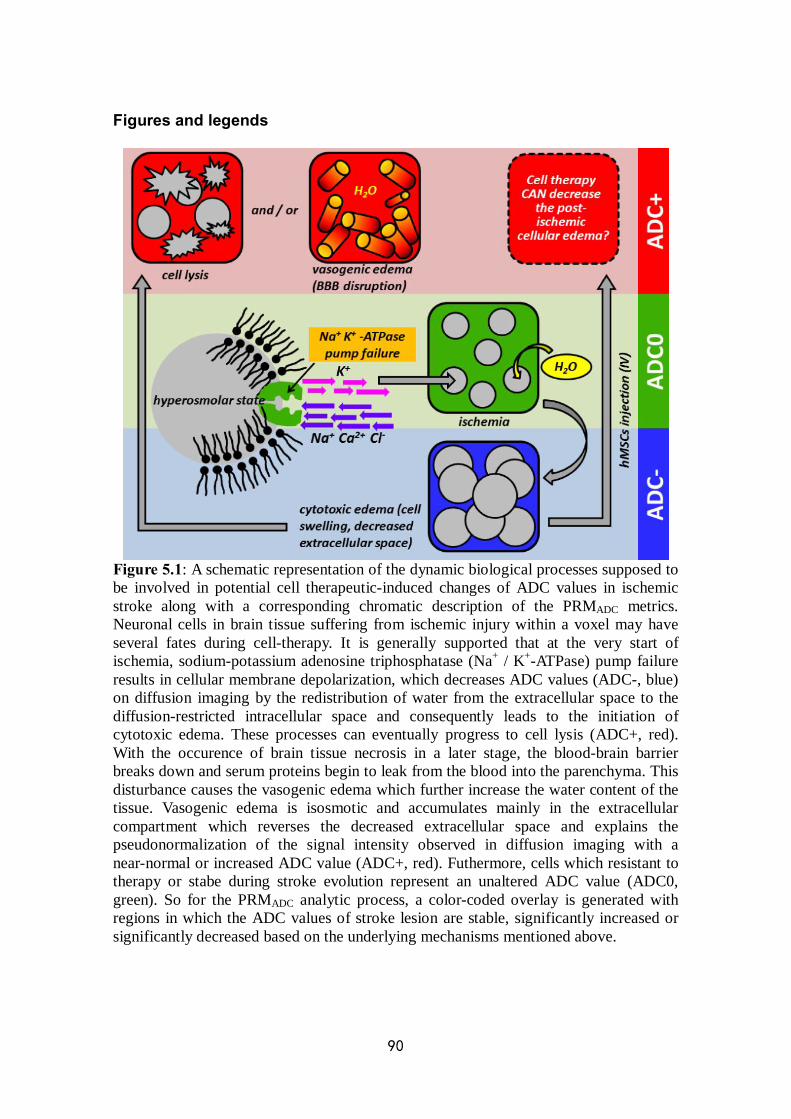
90
Figures and legends
Figure 5.1: A schematic representation of the dynamic biological processes supposed to be involved in potential cell therapeutic-induced changes of ADC values in ischemic stroke along with a corresponding chromatic description of the PRMADC metrics. Neuronal cells in brain tissue suffering from ischemic injury within a voxel may have several fates during cell-therapy. It is generally supported that at the very start of ischemia, sodium-potassium adenosine triphosphatase (Na+ / K+-ATPase) pump failure results in cellular membrane depolarization, which decreases ADC values (ADC-, blue) on diffusion imaging by the redistribution of water from the extracellular space to the diffusion-restricted intracellular space and consequently leads to the initiation of cytotoxic edema. These processes can eventually progress to cell lysis (ADC+, red). With the occurence of brain tissue necrosis in a later stage, the blood-brain barrier breaks down and serum proteins begin to leak from the blood into the parenchyma. This disturbance causes the vasogenic edema which further increase the water content of the tissue. Vasogenic edema is isosmotic and accumulates mainly in the extracellular compartment which reverses the decreased extracellular space and explains the pseudonormalization of the signal intensity observed in diffusion imaging with a near-normal or increased ADC value (ADC+, red). Futhermore, cells which resistant to therapy or stabe during stroke evolution represent an unaltered ADC value (ADC0, green). So for the PRMADC analytic process, a color-coded overlay is generated with regions in which the ADC values of stroke lesion are stable, significantly increased or significantly decreased based on the underlying mechanisms mentioned above.
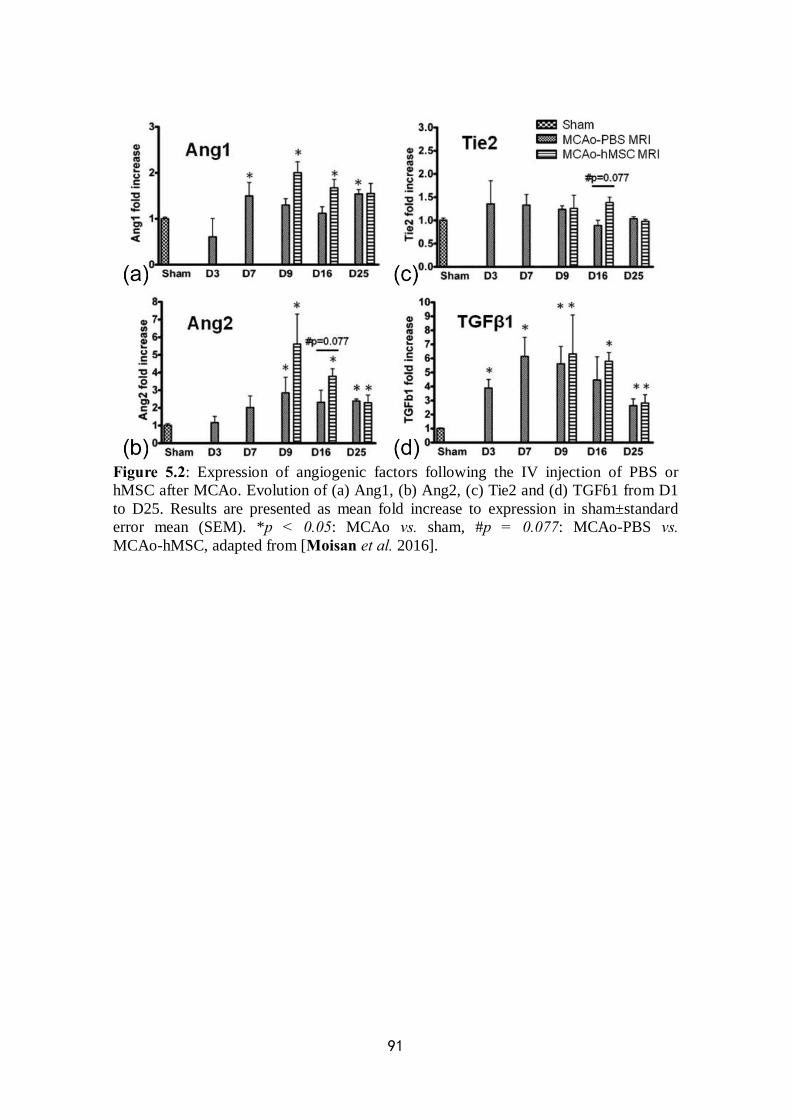
91
Figure 5.2: Expression of angiogenic factors following the IV injection of PBS or hMSC after MCAo. Evolution of (a) Ang1, (b) Ang2, (c) Tie2 and (d) TGFβ1 from D1 to D25. Results are presented as mean fold increase to expression in sham±standard error mean (SEM). *p < 0.05: MCAo vs. sham, #p = 0.077: MCAo-PBS vs. MCAo-hMSC, adapted from [Moisan et al. 2016].
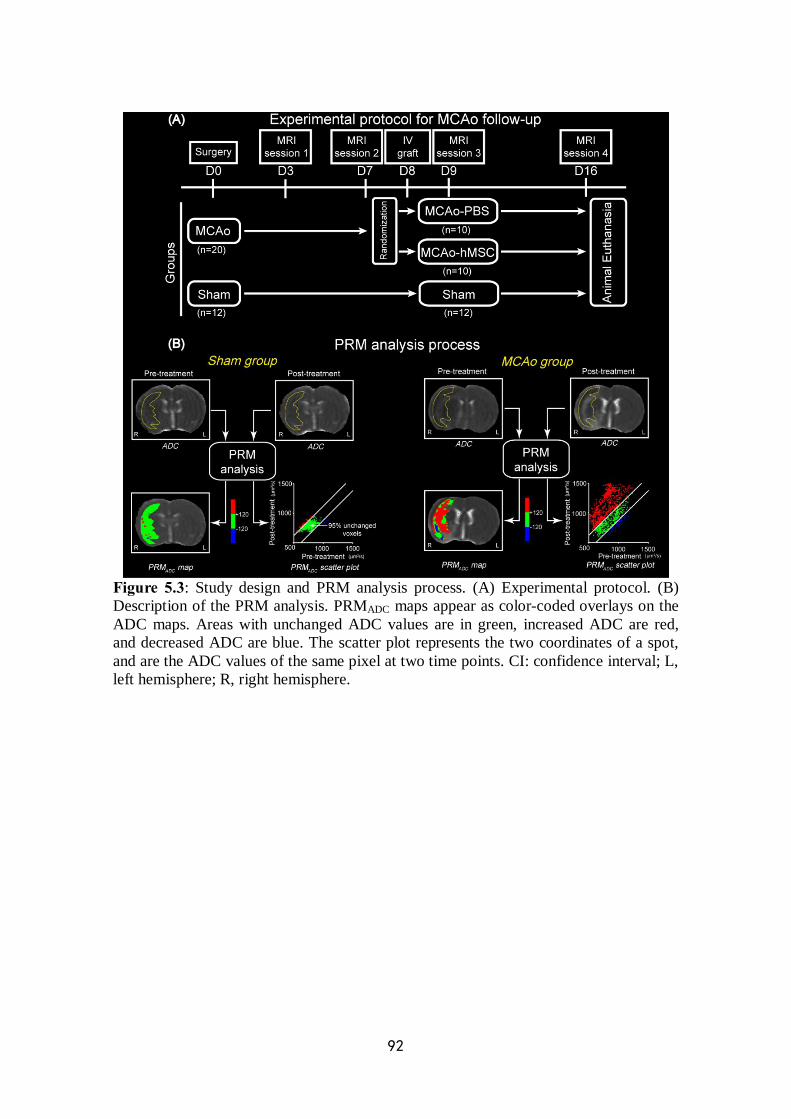
92
Figure 5.3: Study design and PRM analysis process. (A) Experimental protocol. (B) Description of the PRM analysis. PRMADC maps appear as color-coded overlays on the ADC maps. Areas with unchanged ADC values are in green, increased ADC are red, and decreased ADC are blue. The scatter plot represents the two coordinates of a spot, and are the ADC values of the same pixel at two time points. CI: confidence interval; L, left hemisphere; R, right hemisphere.
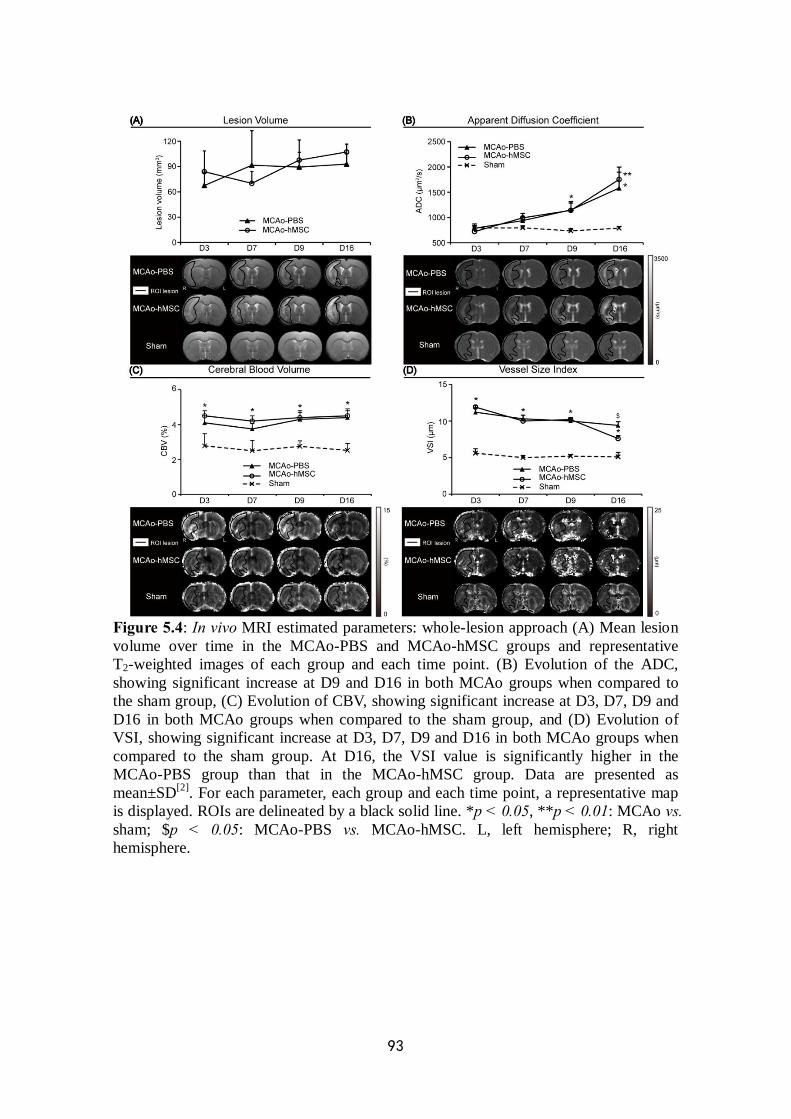
93
Figure 5.4: In vivo MRI estimated parameters: whole-lesion approach (A) Mean lesion volume over time in the MCAo-PBS and MCAo-hMSC groups and representative T2-weighted images of each group and each time point. (B) Evolution of the ADC, showing significant increase at D9 and D16 in both MCAo groups when compared to the sham group, (C) Evolution of CBV, showing significant increase at D3, D7, D9 and D16 in both MCAo groups when compared to the sham group, and (D) Evolution of VSI, showing significant increase at D3, D7, D9 and D16 in both MCAo groups when compared to the sham group. At D16, the VSI value is significantly higher in the MCAo-PBS group than that in the MCAo-hMSC group. Data are presented as mean±SD[2]. For each parameter, each group and each time point, a representative map is displayed. ROIs are delineated by a black solid line. *p < 0.05, **p < 0.01: MCAo vs. sham; $p < 0.05: MCAo-PBS vs. MCAo-hMSC. L, left hemisphere; R, right hemisphere.
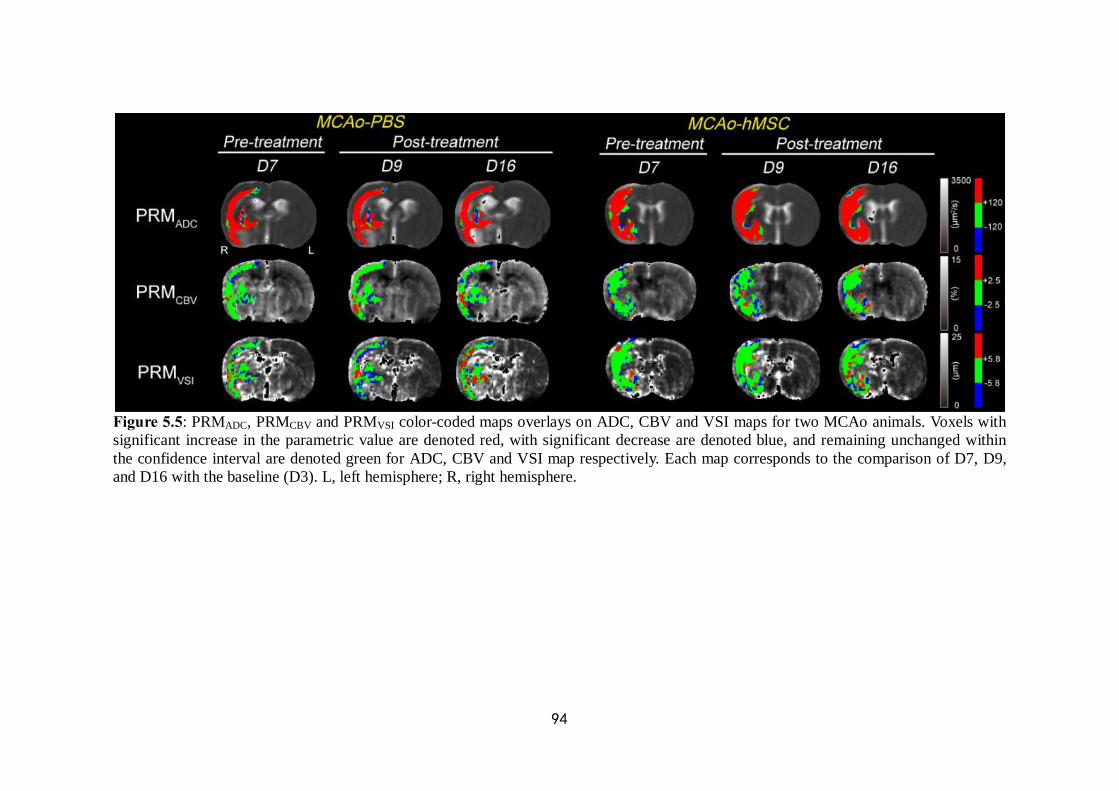
94
Figure 5.5: PRMADC, PRMCBV and PRMVSI color-coded maps overlays on ADC, CBV and VSI maps for two MCAo animals. Voxels with significant increase in the parametric value are denoted red, with significant decrease are denoted blue, and remaining unchanged within the confidence interval are denoted green for ADC, CBV and VSI map respectively. Each map corresponds to the comparison of D7, D9, and D16 with the baseline (D3). L, left hemisphere; R, right hemisphere.

95
Figure 5.6: PRMADC color-coded overlay of two representative rats in (A1) MCAo-PBS and (A2) MCAo-hMSC group respectively. Voxels are designated red with significant increase in ADC, blue for significant decrease in ADC and green if they remain statistically unaltered based on the defined threshold. Corresponding quantitative scatter plots representing the distribution of ADC at D3 compared with D9 are shown respectively (B1, B2). The 95% CIs within the scatter plot were designated by two black lines.
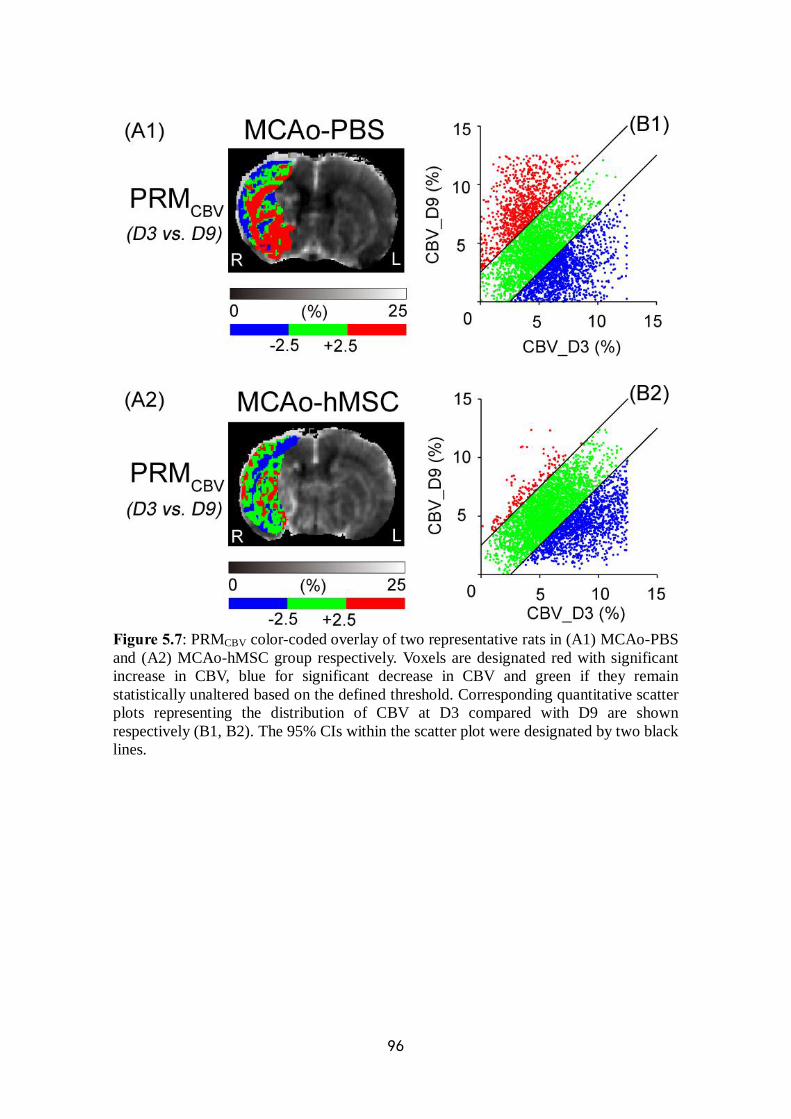
96
Figure 5.7: PRMCBV color-coded overlay of two representative rats in (A1) MCAo-PBS and (A2) MCAo-hMSC group respectively. Voxels are designated red with significant increase in CBV, blue for significant decrease in CBV and green if they remain statistically unaltered based on the defined threshold. Corresponding quantitative scatter plots representing the distribution of CBV at D3 compared with D9 are shown respectively (B1, B2). The 95% CIs within the scatter plot were designated by two black lines.
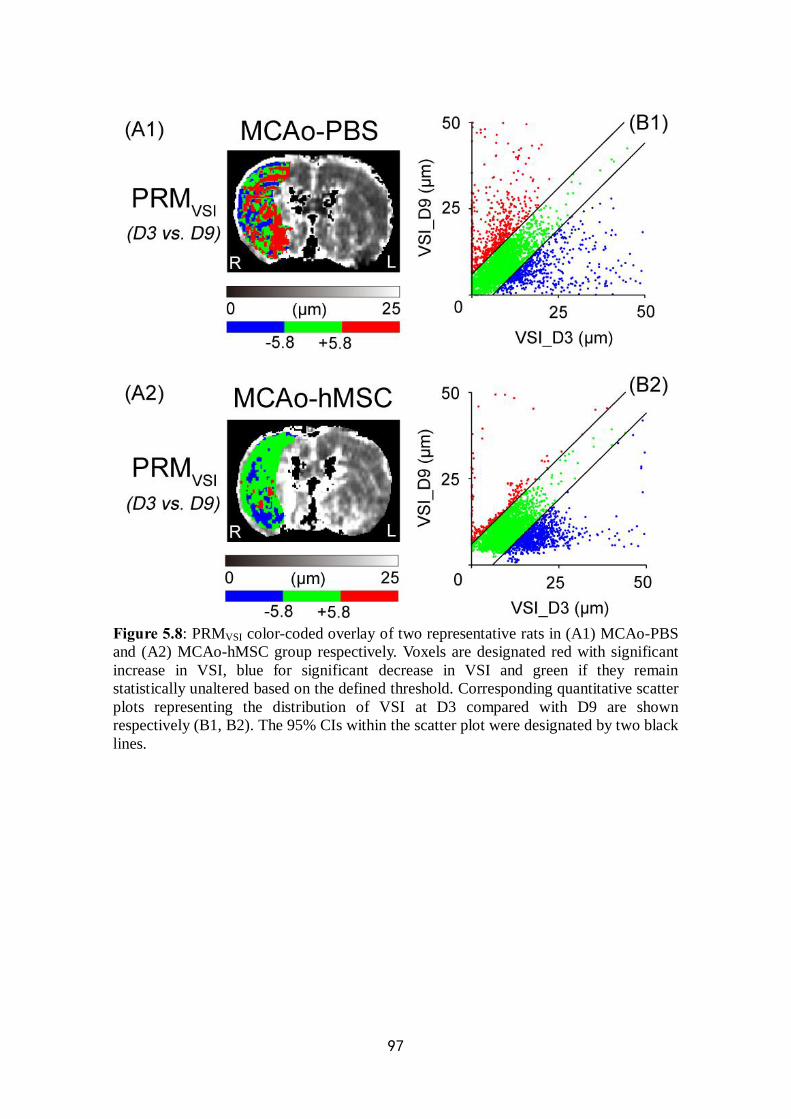
97
Figure 5.8: PRMVSI color-coded overlay of two representative rats in (A1) MCAo-PBS and (A2) MCAo-hMSC group respectively. Voxels are designated red with significant increase in VSI, blue for significant decrease in VSI and green if they remain statistically unaltered based on the defined threshold. Corresponding quantitative scatter plots representing the distribution of VSI at D3 compared with D9 are shown respectively (B1, B2). The 95% CIs within the scatter plot were designated by two black lines.

98
Figure 5.9: Histogram of the percent changes of PRMADC values. PRMADC+ (red) and PRMADC- (blue) over time in the MCAo-PBS, MCAo-hMSC and sham groups in the right hemisphere (mean±SD[2]). **p < 0.01: MCAo vs. sham; $$p < 0.01: MCAo-PBS vs. MCAo-hMSC.
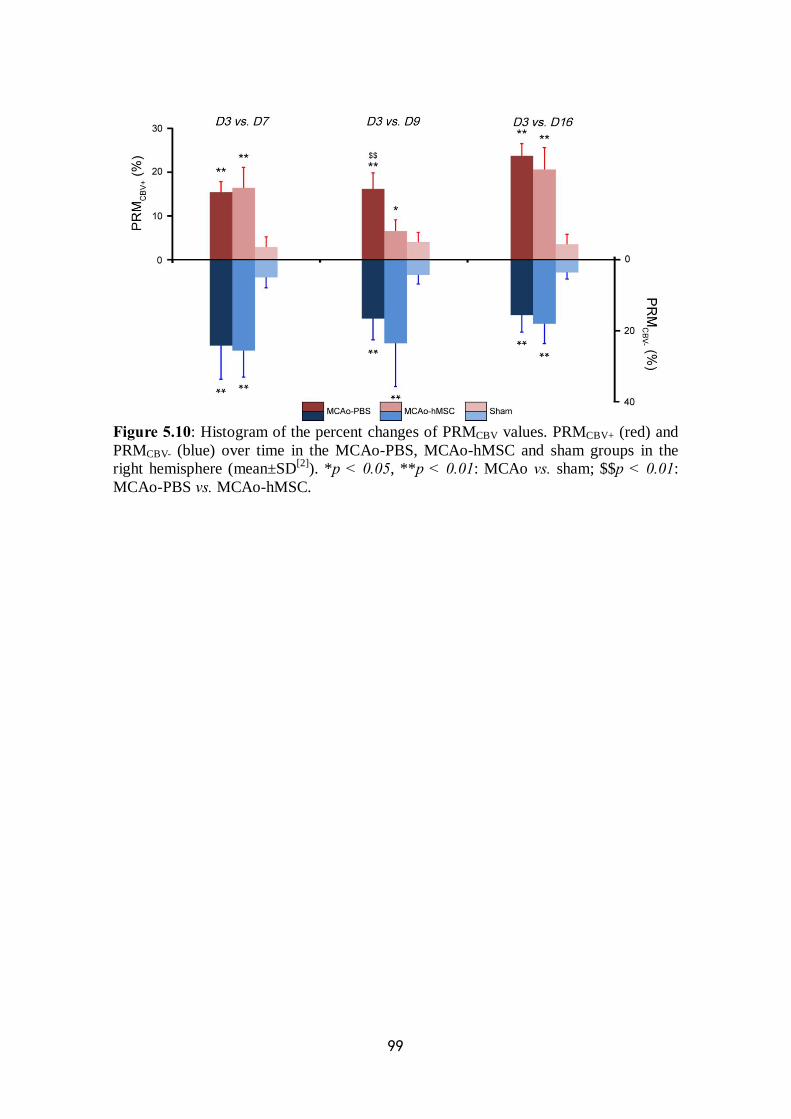
99
Figure 5.10: Histogram of the percent changes of PRMCBV values. PRMCBV+ (red) and PRMCBV- (blue) over time in the MCAo-PBS, MCAo-hMSC and sham groups in the right hemisphere (mean±SD[2]). *p < 0.05, **p < 0.01: MCAo vs. sham; $$p < 0.01: MCAo-PBS vs. MCAo-hMSC.

100
Figure 5.11: Histogram of the percent changes of PRMVSI values. PRMVSI+ (red) and PRMVSI- (blue) over time in the MCAo-PBS, MCAo-hMSC and sham groups in the right hemisphere (mean±SD[2]). **p < 0.01: MCAo vs. sham; $$p < 0.01: MCAo-PBS vs. MCAo-hMSC.
101
Chapter 6
Correlating clinical outcome with voxel-based quantitative multiparametric MRI analysis in
chronic ischemic stroke (This part of research has been submitted to Proc. ISMRM 2017)
6.1 Brief abstract
Predicting clinical outcome remains a challenge for stroke magnetic resonance imaging (MRI). In this study, we have acquired multiparametric MRI data sets including diffusion-weighted images and perfusion-weighted images of 30 patients with chronic ischemic stroke from 4 pre-defined time points ranging from 6 weeks to 7 months after stroke onset. All of the diffusion and perfusion MRI parameters were analyzed by the classic whole-lesion approach and the parametric response map (PRM), a voxel-based analytic approach at each time point. The biomarker from each acquired MRI metric that predictive for both neurological and functional outcome measured by National Institutes of Health Stroke Scale (NIHSS) and modified Rankin Scale (mRS) respectively, was investigated prospectively. The results revealed the correlation between clinical prognosis (based on NIHSS and mRS) and MRI metrics and emphasized the superiority of the PRM over the whole-lesion approach for the prediction of long-term outcome, which suggested that complementary information for the predictive assessment of post-stroke outcome can be obtained by the PRM analysis.
Key Words: chronic infarction; magnetic resonance imaging; diffusion
imaging; perfusion imaging; parametric response map; prognosis 6.2 Introduction
In the western world, stroke is a major cause of death and long-term handicap. High mortality and vast burden followed permanent disability aside, only around one-third of stroke patients have favorable recovery [Sudlow et al. 1997]. The evaluation of clinical outcome plays an important role to prospect the survival situation and life quality in stroke population. From the early phase after symptom onset to the late phase of recovery, prognosis after ischemic stroke can be influenced by a variety of assessable factors. Therefore, accurate and early outcome prediction is urgent to be realized by various means.
In well-designed clinical trials, stroke outcome is generally rated by the National Institutes of Health Stroke Scale (NIHSS) and / or modified Rankin Scale (mRS) due to their validity and availability to discriminate clinically relevant
102
grades of individual status after ischemic stroke. Between these two testing scales, the mRS is more specific to indicate functional independence for daily activities, which has been shown to be reliable and reproducible [Banks et al. 2007, Konig et al. 2008].
One challenge in post-stroke prognosis assessment remains in picking best study end point that appropriately indicates the final outcome. Therefore, it is of major interest to elucidate the relationship between early lesion patterns mostly based on MR images and functional impairment in the later phase of ischemic stroke.
Both diffusion-weighted imaging (DWI) and perfusion-weighted imaging (PWI) provide a large amount of information that could be evaluated quantitatively with image analysis methods instead of visual detection. Generally, measures of imaging parameters are based on a pre-defined region of interest (ROI) by manual delineation which contains all the significantly different values of pixels in the lesion from the healthy tissue. The intralesional characteristics in a parametric map are shown by a mean value of all the pixels in the ROI. However, an analysis of the ROI-based mean value can easily mask focal changes of intralesional tissue properties and lose details which reflect the actual evolution of stroke. The ability to predict long-term functional impairment and recovery based on diffusion and perfusion MRI sequences and associated measures of lesion evolution can be enhanced by using a voxel-wise analytic technique, the parametric response map (PRM) [Galban et al. 2009a]. PRM analyzes the parametric values voxel by voxel using coregistered longitudinal MR maps. It has been proven to be distinctly advantageous over whole-lesion volume techniques such as mean value and histogram analysis in tumor researches [Hamstra et al. 2008, Tsien et al. 2010] and gradually transferred to cerebrovascular disease application [Tsai et al. 2013]. PRM allows for classification of individual ROI-contained voxels based on the extent of change in values which is spatially dependent, and so far it has been applied across a wide variety of MRI quantitative parameters including apparent diffusion coefficient (ADC), regional cerebral blood flow (rCBF), regional cerebral blood volume (rCBV) and Ktrans in numerous researches to assess tumor therapeutic response [Moffat et al. 2005, Galban et al. 2009a, Baer et al. 2015]. PRM could also be useful in stroke because it can identify changes over time within ischemic regions at voxel-wise individual level.
In this study, we compared the ability of PRM and of a whole-lesion approach based on ROI to identify the evolution of ischemic tissue in clinical chronic stroke. Accordingly, we examined the linear correlation between these imaging parameters and clinical outcome assessed by NIHSS and mRS. We hypothesized that PRM could reveal more details on the relationship between diffusion and / or perfusion MR parameters and long-term outcome. Furthermore, the conventional MRI parameters by PRM would be a better predictor of long-term outcome than by classic whole-lesion approach. 6.3 Subjects and methods 6.3.1 Study population and study design
Thirty patients with chronic stroke examined and treated in CHU Grenoble

103
Alpes from August 2010 were selected. After confirmed diagnosis by neuroimaging evidence, either conservative or intravenous thrombolytic treatment was induced. Exclusion criteria such as intracranial hemorrhage (ICH), traumatic brain injury (TBI), previous neurological or psychiatric disorder, substance abuse, major decline in consciousness were implemented in advance. The study was approved by the CHU Grenoble Alpes Ethics Committee (PHRC NCT00875654) and according to the Declaration of Helsinki. Patients were included after providing a written informed consent.
The basic clinical information of each patient was included in Tab.6.1 (21 male, 9 female; mean age 52±10, range 27 to 67 years-old). Among these patients, eleven of them had received IV recombinant tissue plasminogen activator (rt-PA) (7 male, 4 female) within 4.5 h after the onset of stroke symptoms. The ischemic lesion is located in either left or right hemisphere (left hemisphere: n = 8; right hemisphere: n = 22).
For the clinical protocol design (Fig.6.1-A), 7 post-stroke time points in all (V1a: 7 days, V1b: 9 days, V2: 6 weeks, V3: 8 weeks, V4: 3 months, V5: 5 months, V6: 7 months) were set to monitor disease evolution after the stroke onset (V0: Day 0). All 30 patients underwent the MRI scan at 4 time points (V2, V3, V4 and V6), NIHSS assessment was measured at 6 time points (V1a, V1b, V3, V4, V5 and V6) and mRS assessment was measured at 5 time points (V1b, V3, V4, V5 and V6). To analyze the linear correlation between imaging metrics and clinical outcome scores, the results of both NIHSS and mRS obtained at V3, V4, V5 and V6 were adopted. The daily rate changes of NIHSS and mRS scores were also measured between each two continuous time points based on the duration of interval.
6.3.2 Clinical assessment Besides the clinical indices including age, sex and side of damaged
hemisphere, severity of neurological deficit on admission assessed by NIHSS, and functional deficit measured by mRS at several pre-defined time points during the stroke monitoring were recorded, respectively (Tab.6.1).
The NIHSS consists of 5 grades rated as follows: 0, no stroke symptoms; 1-4, minor stroke; 5-15, moderate stroke; 16-20, moderate to severe stroke; 21-42, severe stroke. The scale is performed based on 11 items including level of consciousness, horizontal eye movement, visual field test, facial palsy, motor arm, motor leg, limb ataxia, sensory, language, speech, and extinction and inattention [Goldstein et al. 1989].
The mRS consists of 7 grades rated as follows: 0, no symptoms at all; 1, no significant disability: despite symptoms, able to perform all usual duties and activities; 2, slight disability: unable to carry out all previous activities but able to look after own affairs without assistance; 3, moderate disability: requiring some help but able to walk without assistance; 4, moderately severe disability: unable to walk without assistance and unable to attend to own bodily needs without assistance; 5, severe disability: bedridden, incontinent, and requiring constant nursing care and attention; and 6, death [van Swieten et al. 1988].
To verify the efficiency of functional outcome prediction using the different approaches, all 30 patients were stratified into either good- or poor-outcome subgroups according to the individual final outcome (mRS score at V6). For the

104
good-outcome subgroup (n = 6), the mRS score estimated at V6 ranged between 0 and 2, whereas for the poor-outcome subgroup (n = 24), it ranged between 3 and 6, as previously described [Tsai et al. 2013]. 6.3.3 MRI assessment
Imaging protocol was carried out on a 3.0T Achieva MR scanner (Philips Healthcare®), using a whole-body radiofrequency (RF) transmit and 8-channel head receive coils. The total duration of all sequences used in our study was approximately 1 h, although the whole protocol which contained other procedures for different objectives such as oxygen and function would take a much longer time. Conventional MR sequences including T1-weighted imaging (T1WI), T2-weighted imaging (T2WI) and magnetic resonance angiography (MRA) were performed for clinical routine, and fluid attenuation inversion recovery (FLAIR), DWI and dynamic susceptibility contrast (DSC)-PWI were included in our research (Fig.6.1-B). All the details of MR scanning condition were mentioned below:
1) A 3D gradient recalled echo (GRE) T1-weighted image (160 contiguous slices, slice thickness = 1 mm, TR/TE = 9.8/4.6 ms, 512 × 512 matrix, a field of view (FOV) of 256 × 160 mm and 4.5 min acquisition time) was performed;
2) An MRA was performed using a time-of-flight (TOF) sequence (130 slices, thickness = 1.4 mm, TR/TE = 25/3.4 ms, 560 × 560 matrix, a FOV of 220 × 180 mm and 5.3 min acquisition time) on the Circle of Willis (CoW);
3) An axial FLAIR sequence (30 slices, 0.4 mm slice gap, TR/TE = 11000/125 ms, TI = 2200 ms, 512 × 512 matrix, a FOV of 230 × 180 mm, resolution = 0.45 × 0.45 × 4 mm and 2.9 min acquisition time) was performed;
4) Axial slices obtained with spin-echo DWI (28 slices, 0.4 mm slice gap, TR/TE 2372/55 ms, 256 × 256 matrix, resolution = 0.9 × 0.9 × 0.4 mm and 0.46 min acquisition time) were acquired with b values of 0 and 1000 s/mm2, the high b value measurements were performed with six combinations of diffusion gradient vectors;
5) A dynamic, gradient-echo, echo-planar PWI (25 contiguous slices, 0 mm slice gap, thickness = 4 mm, TR/TE 1670/40 ms, flip angle 75°, 112 × 112 matrix, resolution = 2 × 2 × 4 mm, a FOV of 224 × 184 mm and 1.1 min acquisition time) was performed. After acquisition of 4 baseline images, a bolus of Gadolinium-DOTA (0.1 mmol/kg, Guerbet, France) was injected and flushed with physiological saline (60 mL) at a rate of 5 mL/s with a magnetic resonance compatible power injector (MEDRAD, Inc., Warrendale, PA, USA). To obtain an accurate estimate of the baseline MR signal intensity S0 prior to the arrival of contrast agent an injection delay of 10 s was applied. Eight single-shot, gradient-echo and echo-planar images were obtained per slice.
All these sequences were acquired in an axial plane, parallel to the anterior commissure-posterior commissure (AC-PC), covering the entire brain. 6.3.4 Data processing
Data analysis was performed using in-house developed modules run in Matlab (The MathWorks, Inc., Natick, MA, USA) and SPM12 software (Statistical
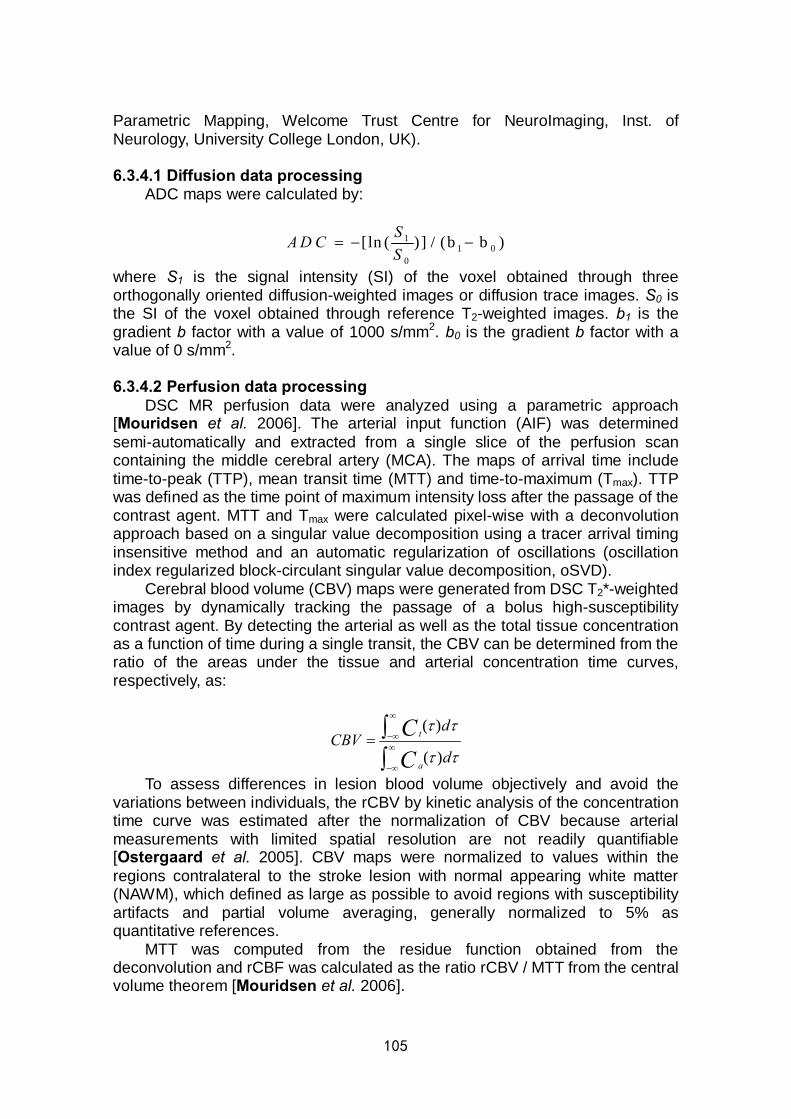
105
Parametric Mapping, Welcome Trust Centre for NeuroImaging, Inst. of Neurology, University College London, UK). 6.3.4.1 Diffusion data processing
ADC maps were calculated by:
where S1 is the signal intensity (SI) of the voxel obtained through three orthogonally oriented diffusion-weighted images or diffusion trace images. S0 is the SI of the voxel obtained through reference T2-weighted images. b1 is the gradient b factor with a value of 1000 s/mm2. b0 is the gradient b factor with a value of 0 s/mm2. 6.3.4.2 Perfusion data processing
DSC MR perfusion data were analyzed using a parametric approach [Mouridsen et al. 2006]. The arterial input function (AIF) was determined semi-automatically and extracted from a single slice of the perfusion scan containing the middle cerebral artery (MCA). The maps of arrival time include time-to-peak (TTP), mean transit time (MTT) and time-to-maximum (Tmax). TTP was defined as the time point of maximum intensity loss after the passage of the contrast agent. MTT and Tmax were calculated pixel-wise with a deconvolution approach based on a singular value decomposition using a tracer arrival timing insensitive method and an automatic regularization of oscillations (oscillation index regularized block-circulant singular value decomposition, oSVD).
Cerebral blood volume (CBV) maps were generated from DSC T2*-weighted images by dynamically tracking the passage of a bolus high-susceptibility contrast agent. By detecting the arterial as well as the total tissue concentration as a function of time during a single transit, the CBV can be determined from the ratio of the areas under the tissue and arterial concentration time curves, respectively, as:
( )
( )t
a
dCBV
d
CC
τ τ
τ τ
∞
−∞∞
−∞
= ∫∫
To assess differences in lesion blood volume objectively and avoid the variations between individuals, the rCBV by kinetic analysis of the concentration time curve was estimated after the normalization of CBV because arterial measurements with limited spatial resolution are not readily quantifiable [Ostergaard et al. 2005]. CBV maps were normalized to values within the regions contralateral to the stroke lesion with normal appearing white matter (NAWM), which defined as large as possible to avoid regions with susceptibility artifacts and partial volume averaging, generally normalized to 5% as quantitative references.
MTT was computed from the residue function obtained from the deconvolution and rCBF was calculated as the ratio rCBV / MTT from the central volume theorem [Mouridsen et al. 2006].
11 0
0
[ln ( ) ] / (b b )SA D CS
= − −
106
6.3.4.3 Image registration
All image data were registered to FLAIR images at baseline (V2) using mutual information as an objective function and Nelder-Mead simplex as an optimizer algorithm (co-registration function in SPM12 free software, distributed under the terms of the GNU General Public License as published by the Free Software Foundation). Automatic co-registration of different and similar weighted serial MRI scans for the same patient was performed assuming a rigid body-geometry relationship, which meant rotation and translation between head scans, so that the motion and susceptibility artifacts were restrained. Pairwise registration was applied under the situation that lesion volume changes were obviously large. 6.3.4.4 Regions of interest
Following co-registration, regions of interest (ROIs) of ischemia were manually contoured under the guidance of experienced clinicians including stroke physician and neuroradiologist blinded to the diagnosis. ROIs of the whole stroke lesion were drawn on FLAIR images, identified as the hyperintense regions, and subsequently checked for concordance on the ADC maps. Caution was taken to exclude the ventricles. Lesion volumes were computed by calculating the sum of lesion areas on each slice. On the contralateral undamaged hemisphere, a mask was applied to delineate the ROI contains NAWM with mean value of each target parameter in healthy tissue (ADC: 686.2±34.3 μm2/s, MTT: 5.0±0.9 s, TTP: 23.5±2.3 s, Tmax: 2.2±0.4 s, rCBF: 16.0±1.7 mL/100g/min and rCBV: 8.1±0.7%). For each object, this ROI was used to acquire the range and determine the threshold of each parameter in PRM analysis. All these ROIs (lesion and reference) were then automatically transferred onto each other registered parametric maps, which especially avoids the confusion of delineation on those non-morphological maps.
Shrinkage or growth of the ischemic lesion during the stroke evolution between two monitoring time points may occur. However, for the stroke population, no significant changes in lesion volume were observed between each two time points set for the subsequent PRM analysis (V2 vs. V3, V2 vs. V4 and V2 vs. V6, cf. below). Therefore, only voxels that were present in both baseline (V2) and each other time points were included. Voxels with non-converging fits or values outside the range of validity of the measurement (ADC > 3500 μm2/s, MTT > 27 s, TTP > 60 s, Tmax > 60 s, rCBF > 100 mL/100g/min, rCBV > 48%), were identified and excluded from the analysis (fractions of all excluded voxels of each map: ADC, MTT: < 1.0%; TTP: 2.6%; Tmax: 4.7%; rCBF: 3.0% and rCBV: 3.6%).
For the resultant parametric maps consist of spatially aligned voxels, ROIs were initially contoured at each time point. Besides the comparison of lesion volume measured based on these ROIs (e.g. volume of ROIV2 vs. volume of ROIV3), the mean parametric values at a single time point calculated based on ROIs delineated at respective time points were also statistically analyzed (e.g. ADCV2 measured in ROIV2 vs. ADCV2 in ROIV3). The purpose of this step is to exclude the influential factor of size change of the ROI in the parametric value measurements in the case that the ROI contoured during the follow-up contains
107
voxels of tissular content with quite different value compared to the original one. In our study, there was no significant variation between the results in different ROIs on each map at each time point so that a single one from the ROIs contoured at 4 time points was selected for the PRM analysis. 6.3.5 Imaging analysis
Two imaging post-processing approaches were assessed for monitoring stroke evolution using ROIs delineated on both diffusion and perfusion parametric maps. 6.3.5.1 Whole-lesion analysis
For each patient at each time point (V2, V3, V4 and V6), both diffusion and perfusion parametric values (ADC, MTT, TTP, Tmax, rCBF and rCBV) were measured in each ROI. 6.3.5.2 Parametric response map (PRM) analysis
Changes in six co-registered diffusion and perfusion parametric maps were analyzed voxel-wise by PRM for each patient (n = 30) at each of the 4 time points from V2 to V6. For the purpose of clarity, PRM analyses on ADC maps (V2 vs. V3) will be described in details. We first computed the 95% confidence interval (CI) for the classification of ADC values according to most PRM procedure design. Briefly, we empirically calculated the threshold that yields a significant change in ADC value for each voxel between the baseline (V2) and V3 based on the reference ROI. The ADC threshold (200 µm²/s) was determined by the 95% unchanged CI resulting from linear least squares analysis on the data combined from all 30 patients instead of the receiver operating characteristic (ROC) curve analysis for an optimal prediction which previously described in a reference [Galban et al. 2009b]. For each patient, the ROI within the contralateral hemisphere containing NAWM was used to acquire the range of ADC at V2 and V3. Then, PRMADC maps were determined by calculating the difference between ADC within the lesion ROI at V2 and at each following time point (V3, V4 and V6). Red voxels represent voxels within each lesion with an increase in the ADC value (beyond the CI of 200 µm2/s; cf. above), blue voxels represent voxels with a decrease in the ADC value (below the CI) and green voxels represent voxels within each lesion with an unchanged ADC value (the absolute value of ΔADC varies less than the CI). Therefore, all voxels within the lesion volume were stratified into three fractions: PRMADC+ (increased ADC, denoted red), PRMADC- (decreased ADC, denoted blue) and PRMADC0 (unchanged ADC, denoted green). The sum of both PRMADC+ and PRMADC- volume was termed PRMADC+/-, which indicate the total volume of voxels with ADC changes within the lesion. The same analytic procedure was applied to the other five perfusion maps (MTT, TTP, Tmax, rCBF and rCBV). After determining each CI (2.8 s for PRMMTT, 4 s for PRMTTP, 2 s for PRMTmax, 25 mL/100g/min for PRMrCBF and 1% for PRMrCBV), the other five parametric maps were obtained at V3, V4 and V6 by comparison with the data acquired at V2. 6.3.6 Statistical analysis
108
A paired 2-tailed Student’s t-test was used for comparison of differences in baseline 1) lesion volume, 2) mean parametric values (ADC, MTT, TTP, Tmax, rCBF, rCBV), 3) percentage of voxels with increased value, percentage of voxels with decreased value and total percentage of voxels with significantly changed value by PRM approach (PRMADC, PRMMTT, PRMTTP, PRMTmax, PRMrCBF, PRMrCBV) with each other individual time point.
Significance of median incremental daily changes in NIHSS score and mRS score was assessed using a non-parametric Mood’s median test. Comparison of scores between thrombolysis group and no-thrombolysis group was performed using unpaired t-tests after checking the variance homogeneity (Levene’s test). In cases of variance inhomogeneity, a Mann-Whitney test was used.
We performed Pearson correlation coefficient (Pearson’s r) for correlations of the representative imaging parameters with the assessment of neurological and functional deficit (NIHSS and mRS score respectively) at each time point. In addition, the receiver operating characteristic (ROC) curve analysis was also applied to define the most predictive parameter for the clinical outcome. Differences between pre-defined good-outcome subgroup and poor-outcome subgroup based on categorical final functional outcome (mRS at V6) were also performed using unpaired t-tests for the comparisons of positive PRM results from correlation analysis. Results are expressed as mean±standard deviation (SD[2]). All statistical analyses were conducted using the software SPSS19.0® (SPSS, Inc, Chicago, IL). Results were declared statistically significant at the two-sided 5% comparison-wise significance level (p < 0.05). 6.4 Results 6.4.1 Clinical outcome
The NIHSS score and mRS score were measured at pre-defined time points (mentioned in 6.3.2). The results were analyzed overall for the total population (n = 30) and separately for objects treated by thrombolysis or not (thrombolysis: 11, no-thrombolysis: 19). The measurements of NIHSS and mRS for all patients are shown in Fig.6.2-A and Fig.6.2-C, respectively. The NIHSS and the mRS of the thrombolysis subgroup was compared to no-thrombolysis subgroup at each time point (Fig.6.2-B and Fig.6.2-D). Rate change of NIHSS and mRS were overall measured in sequential durations (Fig.6.3-A and C). The comparisons between thrombolysis and no-thrombolysis subgroups were also undergone (Fig.6.3-B and D). No intergroup significance was shown at each time point for both value and rate change. Information of both imaging metrics and outcome assessment from V3 to V6 was taken into consideration for correlation analysis. The mRS score is significantly higher at V3 than that at V5 and V6 (p = 0.016 and p = 0.008, respectively, Fig.6.2-C), while the rate change is significantly higher from V3 to V5 than that from V5 to V6 (p = 0.006, Fig.6.3-C). No significance was shown between other time points of interest for either NIHSS or mRS (both value and rate change). In sum, the NIHSS, mRS and the rate change of mRS were decreased over time. The rate change of NIHSS was decreased from V1b to V5 and slightly increased from V5 to V6.
109
6.4.2 Imaging data 6.4.2.1 Evolution of lesion volume
At each time point for MRI session, the mean lesion volumes based on the manually-delineated ROIs of the whole sample were measured (Tab.6.2). No significance was shown in the lesion volume measurement over time. However, lesion volume of the poor-outcome subgroup was larger all along than that of the good-outcome subgroup (V2: p = 0.001, V3: p = 0.002 and V6: p = 0.005) (Fig.6.4-A). 6.4.2.2 Evolution of ADC
The whole-lesion approach showed that the mean ADC value in the lesions was increased over time (Tab.6.2). At each time point, the mean ADC values measured in each lesion in the two subgroups with good- and poor-outcome (hereinafter referred to as “subgroups”) were similar (Fig.6.4-B).
A visual inspection of the ADC map of a patient (No.22) with good outcome suggested that the PRM approach showed that most of the pixels in the lesion ROIs exhibited increased ADC values in the ischemic lesions (Fig.6.5-A). Some areas with decreased ADC in the lesion ROIs were also observed at each time point (Tab.6.3).
The fraction of voxels with ADC changes increased over time, in which the increased ADC volume (PRMADC+) kept growing in two subgroups. No significant interaction of any PRMADC metric between subgroups and time points was found. However, we observed that the PRMADC+ fraction was larger in the poor-outcome subgroup than that in the good-outcome subgroup at V3 (33.5±9.2% vs. 29.0±9.5%), V4 (53.8±17.1% vs. 39.5±10.2%) and reverse at V6 (57.8±24.6% vs. 63.4±26.7%) (Fig.6.6-A1). Moreover, the PRMADC- fraction was larger in the good-outcome subgroup than that in the poor-outcome subgroup at all the time points (V3: 23.1±11.8% vs. 14.2±9.3%; V4: 17.3±9.7% vs. 9.3±5.9% and V6: 13.8±6.2% vs. 11.3±6.0%) (Fig.6.6-A2). 6.4.2.3 Evolution of perfusion parameters MTT
The whole-lesion approach showed that the mean MTT value in the lesion was increased over time (Tab.6.2). The mean MTT values measured in two subgroups were similar (Fig.6.4-C).
The PRM approach showed that the pixels whose value changed over time were scattered in the lesion ROIs (Tab.6.3). A visual inspection of the maps suggested that the PRMMTT maps were mainly more rambling with value change in the patient (No.14) of the poor-outcome subgroup over time (Fig.6.5-B) as compared to the one of the good-outcome subgroup (Fig.6.5-A).
The fraction of voxels with MTT changes increased over time, in which both the increased MTT (PRMMTT+) and decreased MTT (PRMMTT-) in the good-outcome subgroup followed the same trend. The PRMMTT+ fractions in two subgroups were similar over time (Fig.6.6-B1). The PRMMTT- fraction was larger in the poor-outcome subgroup than that in the good-outcome subgroup at only V3 (15.0±9.1% vs. 12.8±5.9%) but reversed at V4 (15.6±10.3% vs. 16.8±7.0%) and V6 (8.9±6.6% vs. 18.8±6.1%) (Fig.6.6-B2). No significant interaction
110
between subgroups and time points was found. TTP
The whole-lesion approach showed that the mean TTP values in the lesions were approximately equivalent over time (Tab.6.2). The mean TTP values measured in the lesions for both subgroups were similar (Fig.6.4-D).
The PRM approach showed that the pixels with increased and stable TTP value scattered across the lesion ROIs of the good-outcome subgroup (Fig.6.5-A), whereas pixels with decreased TTP value represent a considerably large fraction of the lesion of the poor-outcome subgroup (Fig.6.5-B).
The fraction of voxels with increased TTP (PRMTTP+) increased over time in both subgroups. The PRMTTP+ fractions in two subgroups were similar over time (Fig.6.6-C1). The PRMTTP- fraction was larger in the poor-outcome subgroup than that in the good-outcome subgroup at V3 (28.3±11.1% vs. 20.5±9.8%). At V4, the PRMTTP- fraction was decreased, therefore it was significantly lower in the good-outcome subgroup than that in the poor-outcome subgroup (16.4±5.7% vs. 34.0±7.9%, p = 0.037). The fraction reversed in both subgroups at V6 (22.1±16.2% vs. 24.3±9.4%) (Fig.6.6-C2). Tmax
The whole-lesion approach showed that the mean Tmax value in the lesion increased over time (Tab.6.2). The mean Tmax values measured in the lesions in two subgroups were similar (Fig.6.4-E).
The PRM approach showed that the pixels with increased and stable Tmax value scattered in the lesion ROIs of the good-outcome subgroup (Fig.6.5-A), whereas pixels with decreased Tmax value occupied the largest fraction of the lesion in the poor-outcome subgroup (Fig.6.5-B).
The fraction of voxels with the increased Tmax (PRMTmax+) increased over time in both subgroups. The PRMTmax+ fraction was larger in the good-outcome subgroup than that in the poor-outcome subgroup at V3 (24.5±9.2% vs. 21.2±7.5%) and V6 (36.3±12.7% vs. 30.7±10.2%) but reversed at V4 (25.2±9.8% vs. 27.9±9.6%) (Fig.6.6-D1). The PRMTmax- fraction was larger in the poor-outcome subgroup than that in the good-outcome subgroup at each time point. It is worthwhile to note that the PRMTmax- fraction decreased significantly at V4 in the good-outcome subgroup when compared to the poor-outcome subgroup (1.7±1.3% vs. 20.1±13.5%, p = 0.045) (Fig.6.6-D2). rCBF
The whole-lesion approach showed that the mean rCBF value in the lesion decreased over time (Tab.6.2). The mean rCBF values measured in the lesions of both subgroups were similar (Fig.6.4-F).
The PRM approach showed that the pixels with stable rCBF value were scattered in the lesion ROIs of the good-outcome subgroup (Fig.6.5-A), whereas pixels with decreased rCBF value were scattered in the lesion of the poor-outcome subgroup (Fig.6.5-B).
The fractions of voxels with the increased rCBF (PRMrCBF+) were similar in both subgroups at each time point (Fig.6.6-E1). The PRMrCBF- fraction was larger in the good- than that in the poor-outcome subgroup at V3 (4.1±2.7% vs.
111
3.7±1.3%) and then reversed at V4 (5.2±2.1% vs. 6.3±2.4%) and V6 (7.2±2.3% vs. 8.0±5.0%) (Fig.6.6-E2). No significant interaction between groups and time points was found. rCBV
The whole-lesion approach showed that the mean rCBV value in the lesion increased from V2 to V3 and then decreased over time (Tab.6.2). The mean rCBV values in the lesions of both subgroups were similar (Fig.6.4-G).
The PRM approach showed that the pixels with mainly stable rCBV value scattered in the lesion ROIs of the good-outcome subgroup (Fig.6.5-A), whereas pixels with decreased rCBV value scattered in the lesion of the poor-outcome subgroup (Fig.6.5-B).
The fraction of voxels with the increased rCBV (PRMrCBV+) was significantly larger in the good-outcome subgroup than that in the poor-outcome subgroup at V3 (15.7±2.8% vs. 4.7±1.8%, p = 0.001), then decreased at V4 (6.5±3.9% vs. 9.1±7.2%), reversed until V6 (8.9±4.9% vs. 4.9±2.4%) (Fig.6.6-F1). The PRMrCBV- fraction was significantly larger in the poor-outcome subgroup than that in the good-outcome subgroup at V3 (9.8±2.9% vs. 3.1±1.3%, p = 0.036) but not at V4 (10.7±5.1% vs. 7.0±2.7%) and V6 (10.1±3.6% vs. 10.0±4.0%) (Fig.6.6-F2). The feature of PRMrCBV changes at the early time point was more evident than those of other acquired parameters. PRMrCBV color-coded overlay of a patient with good outcome showed a sharp contrast when compared to a patient with poor outcome. A corresponding quantitative scatter plot demonstrated the distribution of rCBV value at V2 compared with V3 for the entire ischemic lesion volume region (Fig.6.7). A larger volume of voxels with increased rCBV and a relatively smaller volume of voxels with decreased rCBV appeared simultaneously in the good-outcome patient compared to the poor-outcome patient at V3. 6.4.3 Correlation between imaging and clinical data
All the imaging metrics mentioned above were undergone correlation analysis with both NIHSS and mRS scores of each time point (528 statistical analysis in all, 336 for mean values and 192 for PRM results), and the positive results (11 in mean values and 53 in PRM metrics) were summarized (Tab.6.4). We only considered as potential predictive biomarker the correlation between imaging metrics obtained at a relatively earlier stage and long-term NIHSS and / or mRS score. The PRMADC+/- at V3 had significant correlation with the rate change of NIHSS at V4 (r = 0.618, p < 0.05) (Tab.6.4-C). This metric at V4 also showed correlation with the rate change of both NIHSS and mRS at V5 (r = 0.497, p < 0.05; r = 0.513, p < 0.05, respectively) (Tab.6.4-C and D). The PRMrCBV- at V3 had significant correlation with NIHSS at V6 (r = 0.524, p < 0.05), the PRMrCBV- at V4 had significant correlation with NIHSS at V5 and V6 (r = 0.495, p < 0.05; r = 0.610, p < 0.01, respectively) (Tab.6.4-A). The PRMrCBV+ at V3 exhibited excellent inverse correlation with mRS at V6 (r = -0.668, p < 0.01) (Tab.6.4-B) and with NIHSS at V4 and V5 (r = -0.583, p < 0.05; r = -0.518, p < 0.05, respectively) (Tab.6.4-A). Furthermore, the PRMTmax- at V3 has significant correlation with NIHSS at V3 and V6 (r = 0.537, p < 0.05; r = 0.534, p < 0.05, respectively) (Tab.6.4-A). The PRMTmax- at V4 had significant correlation with
112
both NIHSS and mRS at V5 (r = 0.593, p < 0.01; r = 0.510, p < 0.05, respectively) (Tab.6.4-A and B) and NIHSS at V6 (r = 0.621, p < 0.01) (Tab.6.4-A). It also correlated with the rate change of NIHSS at V5 (r = 0.534, p <0.05) (Tab.6.4-A). The PRMTmax+/- at V3 had correlation with NIHSS at V6 (r = 0.498, p < 0.05) (Tab.6.4-A). The PRMTmax+/- at V4 had significant correlation with both NIHSS and mRS at V5 (r = 0.455, p < 0.05; r = 0.480, p < 0.05, respectively) and NIHSS at V6 (r = 0.514, p < 0.05) (Tab.6.4-A and B). Although the correlation between PRMTmax+/- and later NIHSS and / or mRS score existed, it was not strong. Based on these analytic results (correlation coefficient r), PRMrCBV (both PRMrCBV+ and PRMrCBV-) and PRMTmax- (also with PRMTmax+/-) were picked as candidates for potential predictor.
The rCBV changes estimated by both whole-lesion approach and PRM were illustrated by scatter plot versus both NIHSS and mRS at a delayed stage (Fig.6.8). The mean change of rCBV at each early time point was not correlated with the final NIHSS or mRS, whereas the PRMrCBV+ at V3 was correlated with the final mRS and the PRMrCBV- at V3 was correlated with the final NIHSS.
ROC analysis was undergone based on these primary results compared with mean value of the single time point. The ROC curves evaluated the ability to predict NIHSS and mRS at V6 with PRMrCBV metrics at V3 and the mean rCBV value at V2 and V3 respectively. For the prediction of NIHSS at V6, the PRMrCBV- had the largest area under curve (AUC = 0.841, p = 0.023). When a cutoff of 7.0 for PRMrCBV- was used, the sensitivity and specificity were 0.86 and 0.89 respectively (Fig.6.9-A). For the prediction of mRS at V6, the PRMrCBV+ had the largest AUC (0.897, p = 0.037). For PRMrCBV+, the cutoff of 4.0 was applied to acquire the sensitivity and specificity (0.70 and 0.98, respectively) (Fig.6.9-B). Since the NIHSS and mRS at V6 have significant correlation between each other (r = 0.744, p < 0.01), but the PRMrCBV- was not correlated with PRMrCBV+ at V3 (r = 0.279, p > 0.05), both metrics can be regarded as independent predictors for the final clinical outcome.
The Tmax changes estimated by both whole-lesion approach and PRM were also illustrated by scatter plot versus both NIHSS and mRS at a later time point. The mean change of Tmax value at each early time point was not correlated with the NIHSS or mRS at V5, whereas the PRMTmax- at V4 was correlated with both NIHSS and mRS at V5 (Fig.6.10).
The ROC curves indicated that PRMTmax- at V4 can predict both NIHSS and mRS at V5 and be superior to the mean Tmax value at V2 and V4 respectively. For the prediction of NIHSS at V5, the PRMTmax- had the largest AUC (0.900, p = 0.002) and the sensitivity and specificity were 0.80 and 0.98 respectively using the cutoff of 8.8 (Fig.6.9-C). For the prediction of mRS at V5, the PRMTmax- had the largest AUC (0.961, p = 0.013) and the sensitivity and specificity were 0.98 and 0.94 respectively using the cutoff of 3.1 (Fig.6.9-D). 6.5 Discussion
Inconsistencies regarding post-stroke prognosis have been reported in clinical researches which focus on patients with infarctions of the similar size, arterial territory and duration after symptoms onset including complete middle cerebral artery occlusion (MCAo) [Koyama et al. 2014, Lima et al. 2014]. Possible explanations for this diversity in clinical outcome have been proposed

113
and include interindividual variability in collateral circulation, preconditioning and microcirculation response after ischemic impairment [Thompson et al. 2013, Malik et al. 2014]. Although differences in lesion volume can reflect the severity of ischemic stroke in our study, this metric lacked the capability to predict the final outcome. And for those cases with similar lesion volumes, the assessment of stroke progression remained inconclusive. Previous clinical studies investigating diffusion and / or perfusion MRI for stroke monitoring have evaluated the capabilities of different types of MRI sequences or parameters, both descriptive and quantitative, as potential predictors of outcome. However, these studies have historically relied on the whole-lesion mean value as the summary statistic of multiparametric MR maps for quantification of corresponding parameters, with varying clinical significance [Barber et al. 1998, Berry et al. 1998]. The polytropic changes of parametric values throughout the lesion were believed to desensitize the final results using whole-lesion approach. For instance, in our results, even the minimal percentage changes (lower than 5%) of rCBF or rCBV values which were invisible on original images can be calculated by PRM approach, although they were still inconspicuous on color-coded PRM overlays (Tab.3). The capability of PRM to quantify the slight changes further supports this viewpoint. The spatial information of the image was also preserved using PRM and local variations in terms of all voxels with changed and stable values during stroke evolution can be distinguished based on their spatial distributions, which may confuse the differentiation between different contents within the lesion by visual observation. Furthermore, the relationship between quantitative heterogeneous changes in multiparametric MR maps and final outcome has not yet been addressed in clinical setting although it has been suggested in preclinical stroke [Lestro Henriques et al. 2015].
Here, PRM facilitates identification of the voxel-based value changes in both diffusion and perfusion imaging data set over duration from 6 weeks to 7 months. Because no specific therapy was induced during the whole follow-up, the positive correlation with final outcomes can be considered as a pure influence of individual inhomogeneity of stroke evolution between different subjects, which may be hidden by traditional imaging analytic methods. These results revealed by PRM emphasize the importance of heterogeneous evolution in stroke, which may explain the different outcome.
The diffusion sequence is widely used in acute stroke to visualize the infarct core, the cytotoxic edema and, with great importance, the penumbra with perfusion MRI in aid, whereas it is used as secondary in chronic stroke. In acute phase, the tissue at risk may be salvageable if effective therapy is induced within the time window [Schlaug et al. 1999]. At chronic stage, without recanalization of spontaneous or therapeutic factor, the penumbra has already vanished and developed into irreversible necrosis within the lesion. However, a preclinical research reported that ongoing changes in damaged rat brain tissues can persist for at least 1 year after stroke. The post-stroke temporal evolution of multiparametric MRI measures including ADC in aged rats out to 1 year may provide useful information about the long-term course of brain injury and remodeling, which is hypothesized to be similar in human brain [Karki et al. 2010].
In our results, the total volume of voxels with both increased and decreased
114
ADC values (PRMADC+/-) of 8 weeks (V3) after stroke was correlated with the rate change of NIHSS during the following month, of which the PRMADC+/- was correlated with the rate change of both NIHSS and mRS during the next 2 months (until V5). Furthermore, the sum of heterogeneous ADC changes within the lesion followed the same trend (increased over time) with the changes of outcome measures (improved over time). From the PRMADC color-coded overlay and the estimates of the overall PRMADC, the volume of heterogeneous ADC changes mainly consist of voxels with increased ADC (PRMADC- only around 10%). The total volume increased over time with the same trend of PRMADC+. The heterogeneity pattern of ADC in good-outcome subgroup was similar to that in poor-outcome subgroup. This finding may imply that the ADC reversed from acute phase and increased during 5 months after stroke was due to the vasogenic edema in the poor-outcome subgroup with a similar representation in the good-outcome subgroup. Resolution of the liquefaction necrosis in cerebral infarction can result in the formation of a cystic space, in which the diffusion is restricted. The PRMADC- in the stroke lesion may reflect this pathological process. In the representative of the poor-outcome subgroup (Fig.6.5-B), the volume of voxels with decreased ADC (blue layer) corresponding to the hypointense region on original ADC map may refer to the formation from malacia to liquefaction during V4 and V6 because the initially increased ADC-constraint volume was limited in this period. However, the PRMADC- was insensitive to be a reliable predictor probably for the reason that, i) the liquefaction brought about the cell death and neuron loss, which led to poor outcome or ii) the change of lesion size was relatively limited after liquefaction, which avoided the recurrence of ischemia in brain tissue of such area. The dilemma in PRMADC- analysis of predictive capability may need more evidences to clarify.
It is noteworthy that a negative correlation appeared between PRMADC+/- and the rate change of mRS during 2 months after V5, which was conspicuous for PRMADC+/- of 7 months after stroke (r = -0.961, p < 0.01). This phenomenon may indicate that the ratio of contents within the total volume of ADC changes reversed from 5 months after stroke because either PRMADC+ or PRMADC- was regarded as independent predictor. Since the lack of imaging evidence of V5, the details of dynamic changes in ADC during 4 months from V4 remain unclear.
The challenge of delineating penumbra in acute stroke gets various perfusion metrics and their corresponding thresholds involved in terms of the prediction of subsequent fate of brain tissue [Thijs et al. 2001]. The choice of perfusion parameter combined with diffusion-weighted images critically affects the assessment of tissue at risk at acute stage and the following selection of candidates with potential benefits of thrombolysis [Hjort et al. 2005a, Kane et al. 2007]. Since the biotherapies developed, the therapeutic time frame extends by a large margin [Detante et al. 2014]. It is increasingly meaningful to identify an ideal perfusion biomarker for the best prediction of chronic stroke follow-up, but conflicting results yielded need to be dissected.
The CBV is an important perfusion parameter which corresponds to the volume of blood passes through capillary network contained in a certain volume of brain [Kaneko et al. 2004]. An area suffering from ischemia with normal blood flow and delayed arrival time indices generally demonstrates that regional blood supply is maintained by autoregulation, but this effect occurs late in the potential

115
infarct core area which temporarily sustained by collaterals. In general, areas with decreased CBV correlate well with the final size of a cerebral infarction [Chamorro et al. 2007]. Especially in the condition that delayed arrival time (e.g. MTT) is found in the area with decreased CBV, it might imply the insufficient collateral circulation of the focal brain tissue, which will eventually evolve into the infarction [Singer et al. 2003, Lee et al. 2009, Kim et al. 2014]. In the example of PRM color-coded overlay of a poor-outcome patient (Fig.6.5-B), the distribution of the blue layer in PRMrCBV map (PRMrCBV-) basically matched that of the red layer in PRMMTT map (PRMMTT+), which might support the theory.
In our study, the percentage changes of rCBV defined by PRM between V2 and V3 (during 2 weeks) outperformed the single mean rCBV value at either time point in determining both long-term neurological and functional outcome after stroke. The mean rCBV value did not correlate with further prognosis or sufficiently stratify the subjects with opposite outcomes. The predictive capability of PRMrCBV was also confirmed by the ROC analysis. In detail, the PRMrCBV- at V3 (V2 vs. V3) was positive correlated with NIHSS score at V6 while PRMrCBV+ at V3 (V2 vs. V3) was negative correlated with mRS score at V6. A possible explanation was that the reduction in local blood volume of brain tissue which occurred in duration of 2 weeks from 8 weeks after stroke onset may portend a worse outcome about 5 months later from the nearer monitoring time point of PRM analysis, perhaps owing to poor collateral status in patients with unfavorable outcome. The cerebral collateral circulation is an evolutionarily conserved blood vessel network generated to maintain consistent cerebral perfusion encountering physiological and pathophysiological changes of hemodynamics. The promising clinical evolution in patients with chronic stroke is informed by the evaluation of collateral status in terms of the risk of stroke recurrence. The beneficial influence of collateral flow is significantly correlated with the follow-ups of stroke patients in a later phase. The qualified illustration of cerebral collateral circulation can be accomplished by real-time non-invasive imaging techniques, generally MRI [Liebeskind et al. 2009]. The PRM, as an independent determinant of outcome, provides rich details on the fundamental feature of perfusion condition which may help inform the quality and quantity of collateral flow.
An increase in PRMrCBV+ and / or a decrease in PRMrCBV- in chronic infarction may derive from an increase in overall density of microvasculature or dilation of microvessels, as both could lead to a net increase of cerebral blood volume in the region suffering from ischemia. However, the increased PRMrCBV- and / or the decreased PRMrCBV+ at V3 which correlated with high NIHSS and / or mRS score at V6, cannot be simply interpreted as a decreased total value of rCBV correlating with poor clinical outcome, and vice versa. The correlation analysis results in this study represented that the PRMrCBV- was not correlated with PRMrCBV+ at V3, which meant either rCBV change exploited by PRM approach played a role as an independent predictor for long-term clinical outcome.
Besides the possible reasons mentioned above, the decreased rCBV may also be a consequence of capillary obstruction or metabolic depression. Several factors including plugging of capillaries by leukocytes, endothelial swelling, formation of microvilli, platelet aggregation and external compression of
116
capillaries secondary to edema or perivascular astrocyte swelling contribute to rCBV reduction. In addition, metabolic failure indicated by an increased oxygen extraction fraction (OEF) and a reduced CMRO2 is also related to the decrease in rCBV [Singer et al. 2003]. Therefore, alternative imaging approaches such as positron emission tomography (PET) and blood-oxygen-level dependent functional MRI (BOLD fMRI) are essential to help interpret PRMrCBV alterations to obtain an objective description of stroke evolution [Wise et al. 2013].
Tmax represents the time from the start of the scan until the maximum intensity of contrast agent arrives at each voxel. Tmax is sensitive to reflect dynamic changes of brain tissue into an infarction and changes of perfusion level. It can also predict brain tissue viability suffering from ischemic injury, although high Tmax value has been reported to be correlated with lower likelihood of tissue survival [Shih et al. 2003, Olivot et al. 2009]. Tmax may be prolonged in very large volumes of tissue which is not proceeding to infarction regardless of CBF status [Bang et al. 2010]. Since Tmax is not influenced by scan duration, it has the merit that sufficient scanning for a long time is possible to achieve an even distribution of contrast agent [Copen et al. 2011]. In addition, Tmax has little grey matter (GM) / white matter (WM) heterogeneity and relatively low conspicuity of large blood vessels, which may complicate the observation of parenchymal condition. In some studies, Tmax has been speculated as a profile of collateral extent [Liebeskind et al. 2005, Christensen et al. 2008]. Thus, Tmax is considered as a widely accepted reliable perfusion parameter to assess the viable tissue in stroke, but with the exact threshold remaining controversial. In previous studies, different thresholds for Tmax were set with a main goal of representing the accurate situation of acute stroke evolution although this parameter was seldom used in chronic stroke cases. In the evaluation of alteplase effects beyond 3 hrs after stroke onset in the Echoplanar Imaging Thrombolytic Evaluation Trial (EPITHET) cohort, a Tmax of 4-6 s delay was used [Donnan et al. 2009]. A Tmax > 8 s with a core volume of approximately 100 mL (lesion size on DWI) was reported as an adequate threshold for identification of patients with malignant profile of infarction and consequent unfavorable outcome despite reperfusion therapy [Mlynash et al. 2011]. A Tmax ≥ 10 s was also reported in another study to best predict the final infarction [Nagakane et al. 2012].
Generally, optimal Tmax thresholds from one study must be used with caution in other studies if the same experimental conditions are not ensured. However, the PRM analysis contributes to an objective assessment based on intraindividual percentage changes of both temporal and spatial complementary information and avoids bias of pre-defined thresholds among different researches.
By using general analytic methods, an increasing number of studies have promoted the use of Tmax to gain considerable success in clinical trials [Albers et al. 2006b, Davis et al. 2008, Olivot et al. 2009]. However, various hemodynamic situations can result in the same Tmax appearance. Besides the influence from the process of deconvolution, other factors from the feature of subjects such as arterial abnormalities in patients also lead to bolus temporal dispersion which affects the Tmax measure [Calamante et al. 2006]. One study showed that whereas Tmax theoretically reflects bolus delay, the measure Tmax is influenced

117
also by bolus temporal dispersion and, to a smaller degree, by MTT. Tmax primarily reflects macrovascular features, whereas MTT reflects microvascular features [Calamante et al. 2010]. Nevertheless, the severe Tmax abnormality could not be solely explained by prolonged MTT, it may also reflect delay or dispersion. Tmax should be considered with the combination of other macrovascular or microvascular indices to interpret the physiological process, so that the various factors contributing to the measured Tmax may be disentangled. Due to the complex interaction between different factors influencing Tmax measure, the clinical significance of Tmax is not straightforward.
It was thought that Tmax should not be used in some clinical conditions such as chronic stroke to avoid misleading conclusions. To have a reasonable and objective understanding of the significance of delay-weighted measures in stroke, the temporal dynamics of blood supply including collaterals recruitment are required to provide more information based on delay-related perfusion parameters [Liebeskind et al. 2005, Christensen et al. 2008]. Coincidentally, the PRM approach is capable of indicating the temporal evolution of all voxel-wise parameters and may help explain the relevance of Tmax to post-stroke pathophysiology.
Among all the perfusion parameters of arrival time in our study, the PRMTmax- of 3 months after stroke onset (during around 6 weeks) can reflect the outcome of the same time point and predict both NIHSS and mRS of 2 months later. Since the correlation is positive with both outcome scores of two continuous time points, in other words, the delay of time to the peak of the residue curve significantly shortened of 6 weeks during the follow-up may imply unfavorable neurological and functional deficits after 2 months. The ROC curves also confirmed that the diagnostic and predictive capability of PRMTmax- was superior to the mean Tmax at either single time point with high sensitivity and specificity.
In our research, the improvement using PRM approach in assessing the outcome of stroke patients is definite, but limitations still remained. The challenge existed for the validation of all components of this approach including imaging data acquisition, algorithm selection for registration and response mapping for heterogeneity illustration [Boes et al. 2014]. Due to the problems in technical processing, an overall influence of image datasets emerged. The sample volume of the PRM analysis shrank because of the failure in registration compliance between two time points probably induced by the susceptibility artifacts associated with scanning protocols in the image of either time point. Consistent imaging protocols that provide repeatable and quantitative readouts are crucial for applying PRM across clinical setting. Still, the predictive potential of PRM for the clinical outcome of stroke patients has been evaluated using ROC curves. To get an objective effect of sensitivity by the PRM cutoff in ROC analysis, various cutoffs should be tested in a considerable quantity of samples. Furthermore, for the methodology of PRM approach in clinical applications, the applicability across imaging parameters or even modalities in a repeatable and robust manner is appreciated. For the application in different diseases, the PRM study design should be individualized with different purposes and targets based on the specific pathophysiological characteristics during the disease evolution, although the basic theories of the overall data process are similar.

118
Furthermore, it is worthwhile to note that an exceptive spot (lower left area) of the linear discordance appeared in the scatter plot for the correlation analysis of PRMrCBV- at V3 and NIHSS score at V6 (Fig.6.8-D, black arrow). After rechecking the imaging data of this object (No.3), two ischemic lesions in the right hemisphere were demonstrated. Before the initiation of the PRM analytic process, regions with abnormal signal on each slice were taken into account to promise the integrity of lesion volume. So in this counterexample, the percentage change of rCBV between V2 and V3 were calculated voxel by voxel for both lesions. However, one lesion located in non-functional cortical area (right superior parietal lobe) with a relatively larger volume of decreased rCBV may not aggravate the neurological deficits proportionally according to our hypothesis on the predictive efficacy of PRMrCBV-. Due to the interindividual variation of functional area distribution in brain, the prediction performance and practicability of PRM approach may be influenced by the simultaneous heterogeneous changes in multiple lesions. Conservatively, PRM technique is promising to deduce the clinical status of the stroke patient with a single ischemic lesion. This assumption needs to be proven in further researches with sufficient samples by means of PRM, necessarily with assistance of other imaging approaches such as magnetoencephalography (MEG), diffusion tensor imaging (DTI) and BOLD fMRI.
6.6 Conclusion This study describes for the first time the clinical application of PRM
analysis of multiparametric MR measures based on diffusion and perfusion maps in chronic stroke patients. The perfusion parameters analyzed by PRM were highly correlated with long-term clinical outcomes including neurological impairment and degree of disability, whereas the classic whole-lesion approach was insensitive to the outcome prediction. This new approach allows for spatial voxel-wise tracking of hemodynamic changes from imaging evidence. In the monitoring of stroke patients, it may be feasible to use perfusion PRM metrics as imaging biomarkers to predict the further prognosis. With the existing superiority of PRM applications in voxel-based tracking of disease status and progression, it may be more suitable to reflect the pathophysiological heterogeneity within stroke lesions and may renovate the thinking process from a new perspective for imaging evaluation of clinical stroke cases. It would also certainly promising to evaluate in greater details emerging stroke therapies such as the use of stem cells.
6.7 Acknowledgements The authors are grateful to the PHRC “Intravenous Stem Cells After
Ischemic Stroke” (phase 2 / NCT00875654) and “HEuristic multiparameter MRI study to assess autologous MEsenchymatous stem cells therapy in subacute Stroke” for the financial support.
6.8 Disclosure statement The authors indicate no potential conflicts of interest.
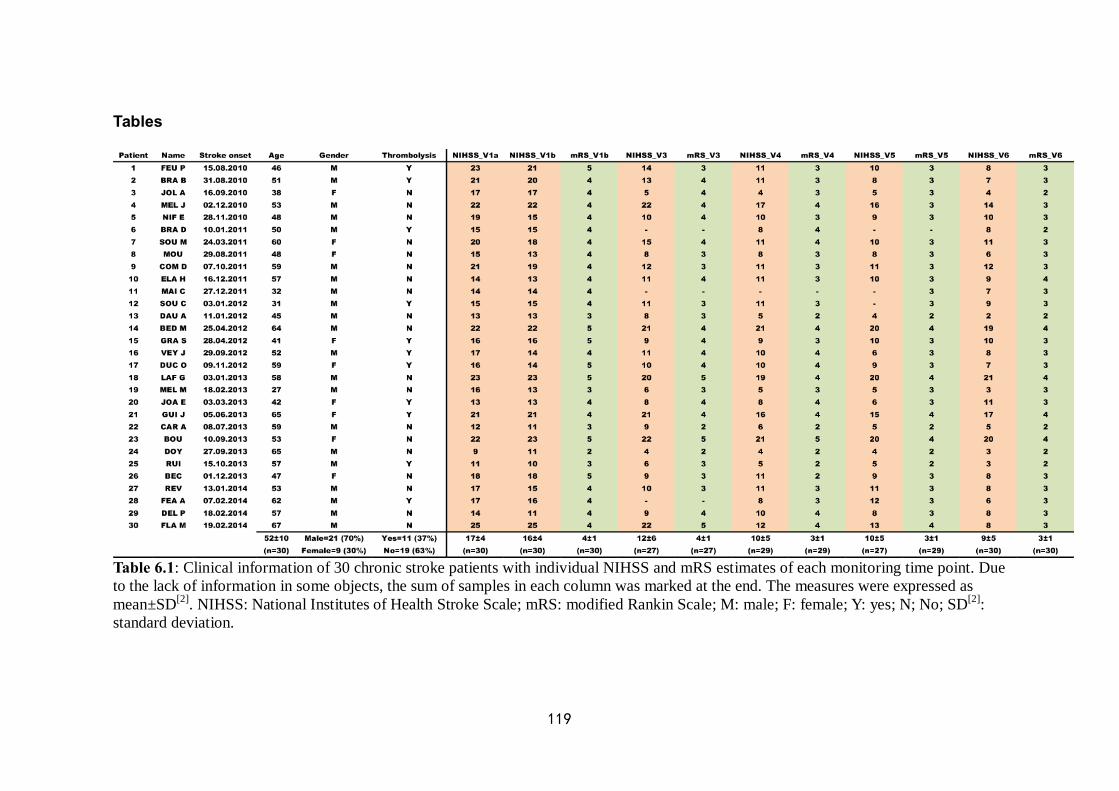
119
Tables
Table 6.1: Clinical information of 30 chronic stroke patients with individual NIHSS and mRS estimates of each monitoring time point. Due to the lack of information in some objects, the sum of samples in each column was marked at the end. The measures were expressed as mean±SD[2]. NIHSS: National Institutes of Health Stroke Scale; mRS: modified Rankin Scale; M: male; F: female; Y: yes; N; No; SD[2]: standard deviation.
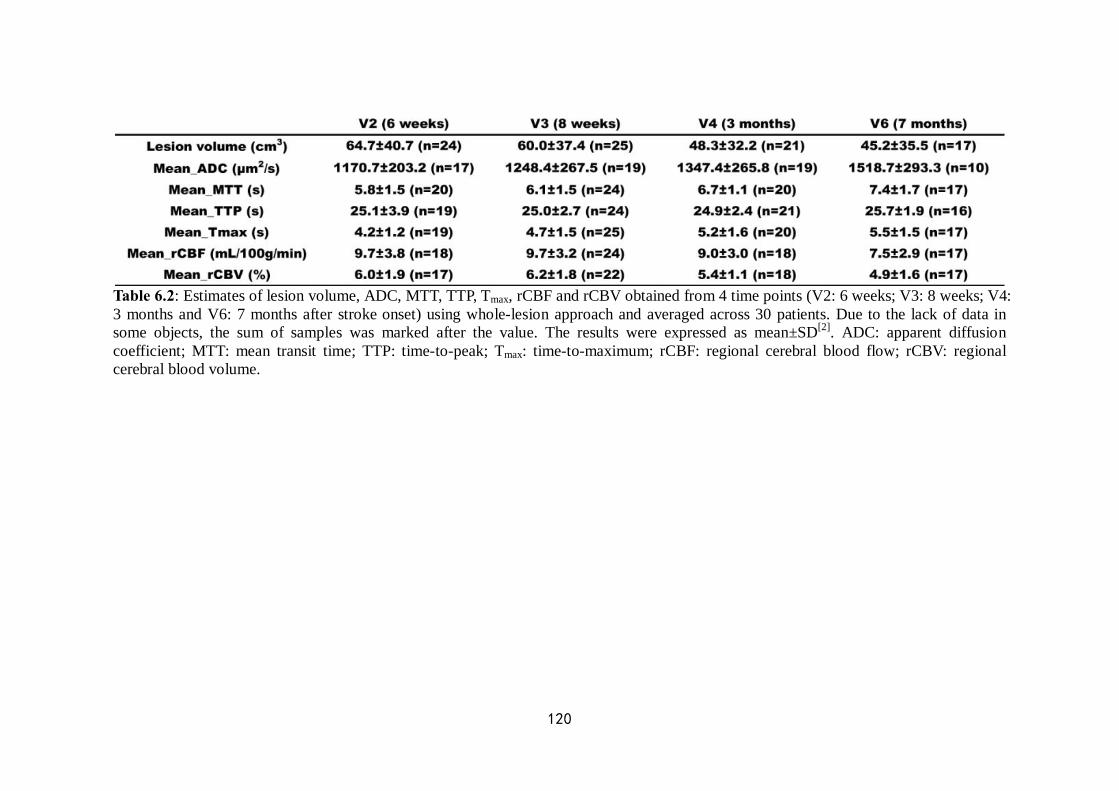
120
Table 6.2: Estimates of lesion volume, ADC, MTT, TTP, Tmax, rCBF and rCBV obtained from 4 time points (V2: 6 weeks; V3: 8 weeks; V4: 3 months and V6: 7 months after stroke onset) using whole-lesion approach and averaged across 30 patients. Due to the lack of data in some objects, the sum of samples was marked after the value. The results were expressed as mean±SD[2]. ADC: apparent diffusion coefficient; MTT: mean transit time; TTP: time-to-peak; Tmax: time-to-maximum; rCBF: regional cerebral blood flow; rCBV: regional cerebral blood volume.

121
Table 6.3: Estimates of ADC, MTT, TTP, Tmax, rCBF and rCBV obtained from the comparison between the baseline and each other time point using PRM approach and averaged across 30 patients. Due to the lack of data in some objects, the sum of samples was marked in parentheses. The results were expressed as mean±SD[2]. PRM: parametric response map; ADC: apparent diffusion coefficient; MTT: mean transit time; TTP: time-to-peak; Tmax: time-to-maximum; rCBF: regional cerebral blood flow; rCBV: regional cerebral blood volume; ADC+: the volume of voxels with increased ADC values (denoted red); ADC-: the volume of voxels with decreased ADC values (denoted blue); ADC+/-: the sum of ADC+ and ADC- (denoted yellow). The same pattern of PRM estimates was applied for other parameters.
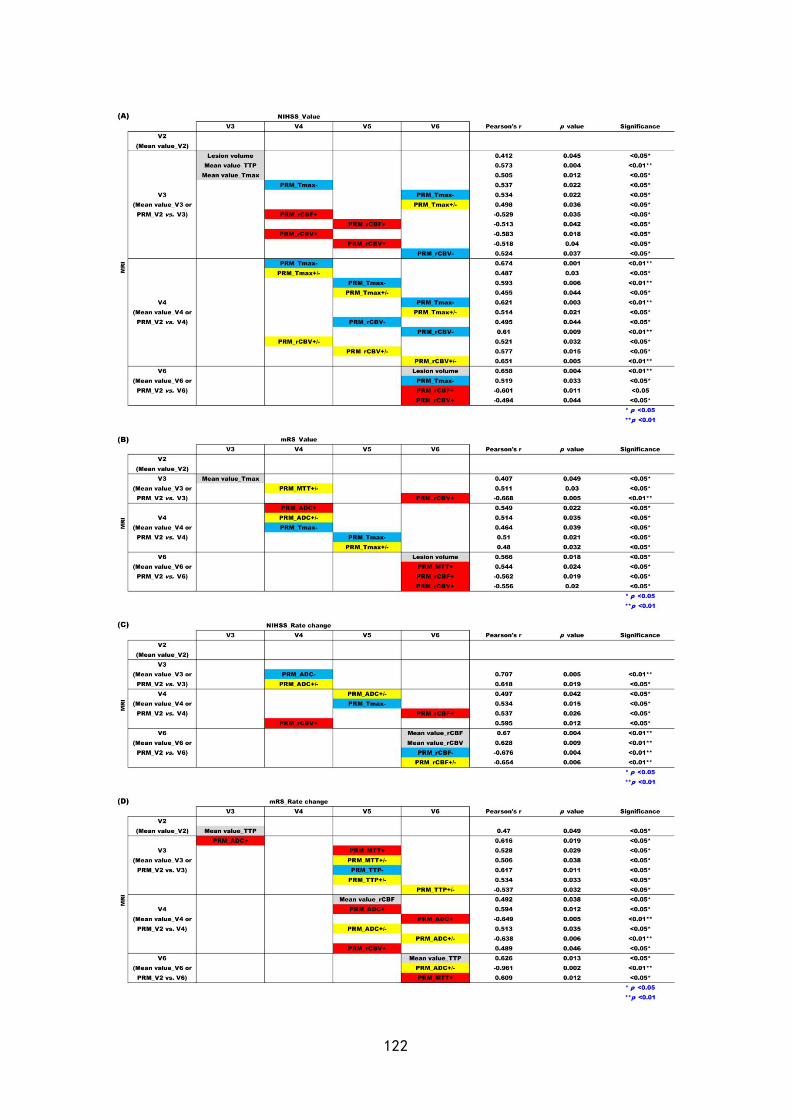
122
123
Table 6.4: Imaging parameters analyzed by both whole-lesion approach and PRM were estimated versus outcome measures at each corresponding time point and positive results were demonstrated. In detail, lesion volume, mean value of ADC, MTT, TTP, Tmax, rCBF and rCBV at each time point (denoted grey), and PRM fractions including volume of voxels with increased values (denoted red), decreased values (denoted blue) and the total volume of voxels with all changed values (denoted yellow) of ADC, MTT, TTP, Tmax, rCBF and rCBV between each following time point and baseline were analyzed with (A) NIHSS, (B) mRS, (C) rate change of NIHSS and (D) rate change of mRS at each time point by correlation analysis. Only positive results were recorded in this table with respective correlation coeffient (r) and p value. ** p < 0.01, * p < 0.05; PRM: parametric response map; ADC: apparent diffusion coefficient; MTT: mean transit time; TTP: time-to-peak; Tmax: time-to-maximum; rCBF: regional cerebral blood flow; rCBV: regional cerebral blood volume; NIHSS: National Institutes of Health Stroke Scale; mRS: modified Rankin Scale.
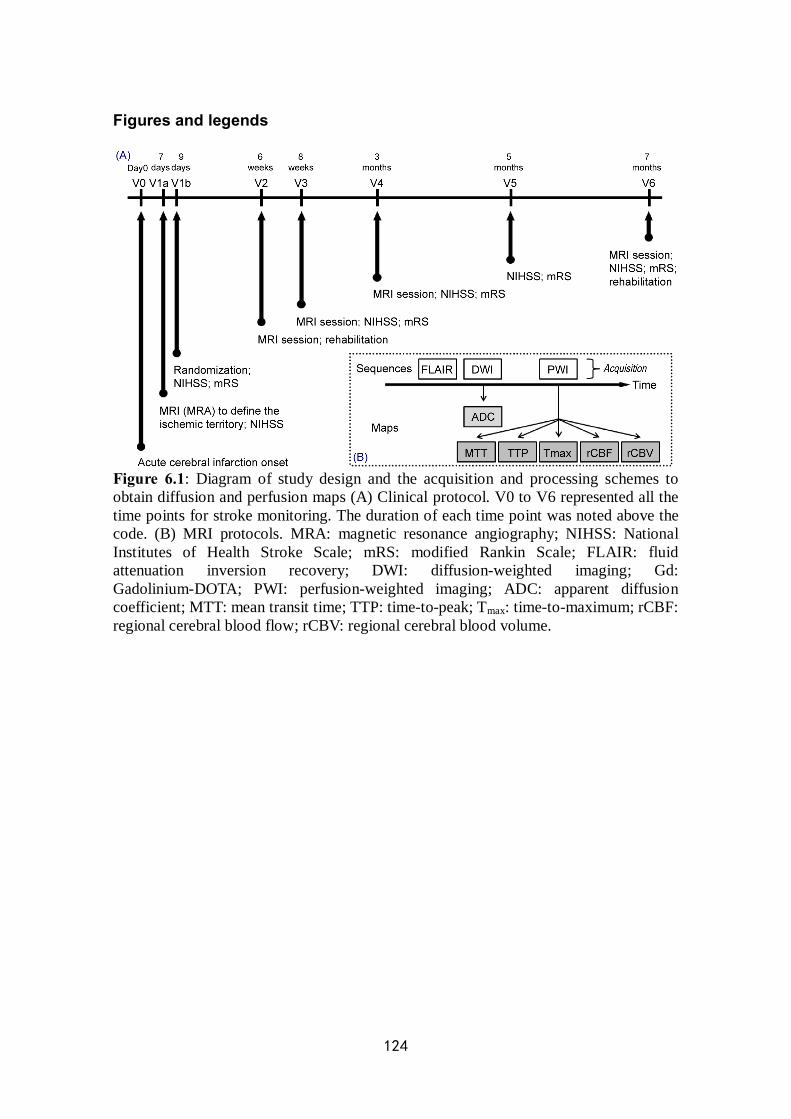
124
Figures and legends
Figure 6.1: Diagram of study design and the acquisition and processing schemes to obtain diffusion and perfusion maps (A) Clinical protocol. V0 to V6 represented all the time points for stroke monitoring. The duration of each time point was noted above the code. (B) MRI protocols. MRA: magnetic resonance angiography; NIHSS: National Institutes of Health Stroke Scale; mRS: modified Rankin Scale; FLAIR: fluid attenuation inversion recovery; DWI: diffusion-weighted imaging; Gd: Gadolinium-DOTA; PWI: perfusion-weighted imaging; ADC: apparent diffusion coefficient; MTT: mean transit time; TTP: time-to-peak; Tmax: time-to-maximum; rCBF: regional cerebral blood flow; rCBV: regional cerebral blood volume.
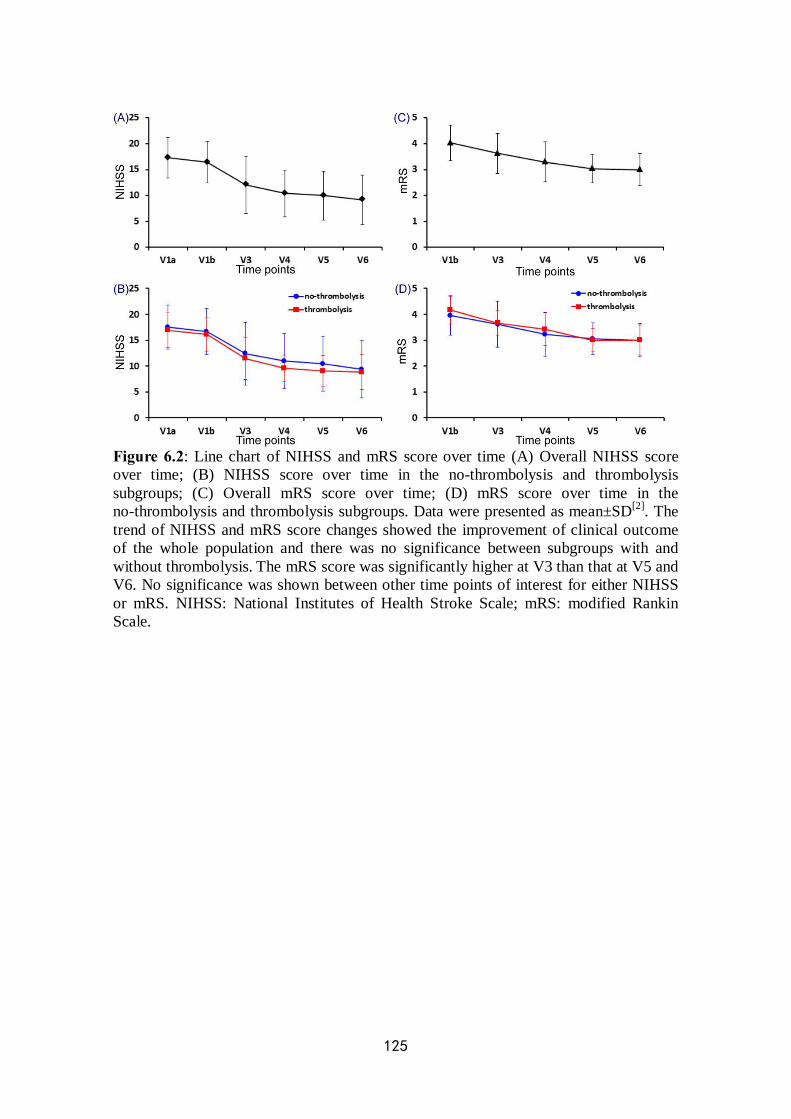
125
Figure 6.2: Line chart of NIHSS and mRS score over time (A) Overall NIHSS score over time; (B) NIHSS score over time in the no-thrombolysis and thrombolysis subgroups; (C) Overall mRS score over time; (D) mRS score over time in the no-thrombolysis and thrombolysis subgroups. Data were presented as mean±SD[2]. The trend of NIHSS and mRS score changes showed the improvement of clinical outcome of the whole population and there was no significance between subgroups with and without thrombolysis. The mRS score was significantly higher at V3 than that at V5 and V6. No significance was shown between other time points of interest for either NIHSS or mRS. NIHSS: National Institutes of Health Stroke Scale; mRS: modified Rankin Scale.
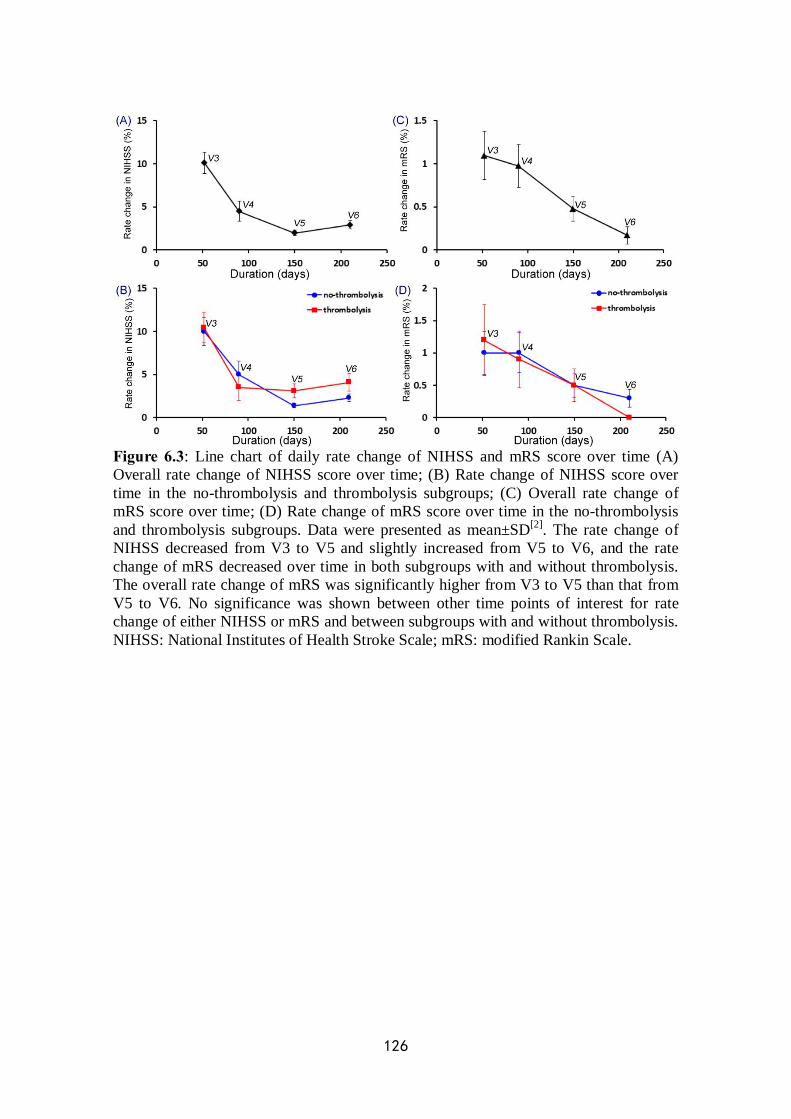
126
Figure 6.3: Line chart of daily rate change of NIHSS and mRS score over time (A) Overall rate change of NIHSS score over time; (B) Rate change of NIHSS score over time in the no-thrombolysis and thrombolysis subgroups; (C) Overall rate change of mRS score over time; (D) Rate change of mRS score over time in the no-thrombolysis and thrombolysis subgroups. Data were presented as mean±SD[2]. The rate change of NIHSS decreased from V3 to V5 and slightly increased from V5 to V6, and the rate change of mRS decreased over time in both subgroups with and without thrombolysis. The overall rate change of mRS was significantly higher from V3 to V5 than that from V5 to V6. No significance was shown between other time points of interest for rate change of either NIHSS or mRS and between subgroups with and without thrombolysis. NIHSS: National Institutes of Health Stroke Scale; mRS: modified Rankin Scale.
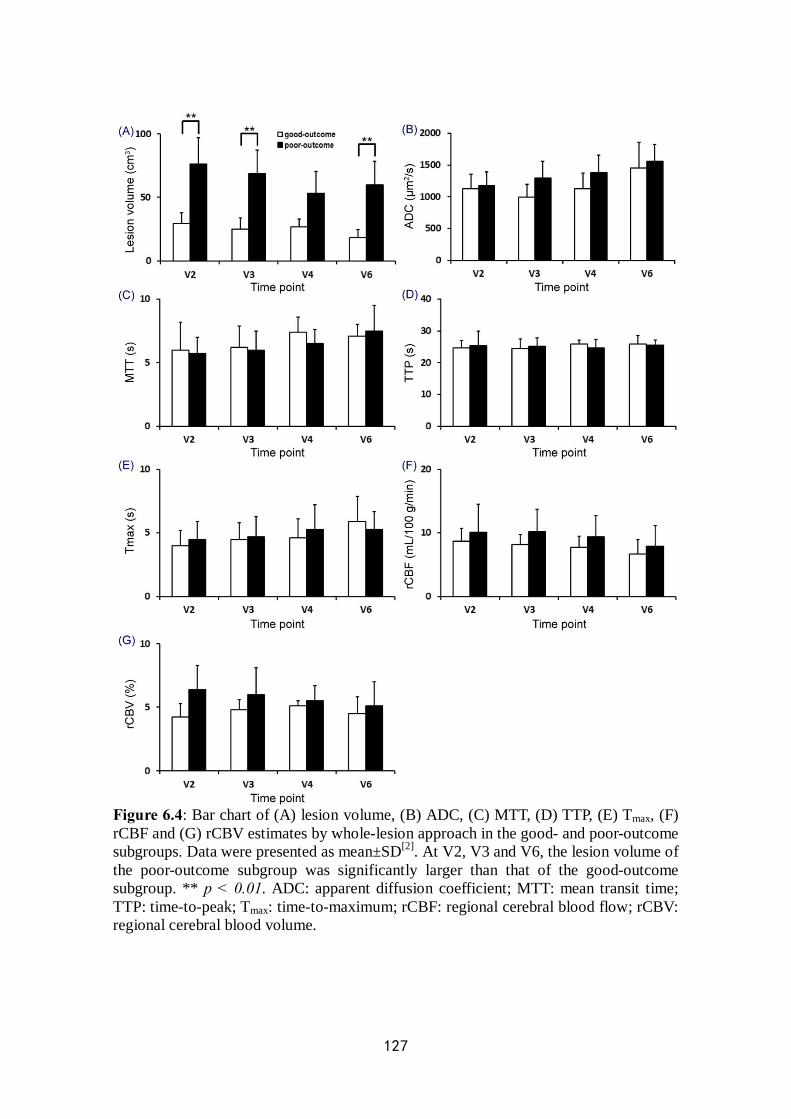
127
Figure 6.4: Bar chart of (A) lesion volume, (B) ADC, (C) MTT, (D) TTP, (E) Tmax, (F) rCBF and (G) rCBV estimates by whole-lesion approach in the good- and poor-outcome subgroups. Data were presented as mean±SD[2]. At V2, V3 and V6, the lesion volume of the poor-outcome subgroup was significantly larger than that of the good-outcome subgroup. ** p < 0.01. ADC: apparent diffusion coefficient; MTT: mean transit time; TTP: time-to-peak; Tmax: time-to-maximum; rCBF: regional cerebral blood flow; rCBV: regional cerebral blood volume.
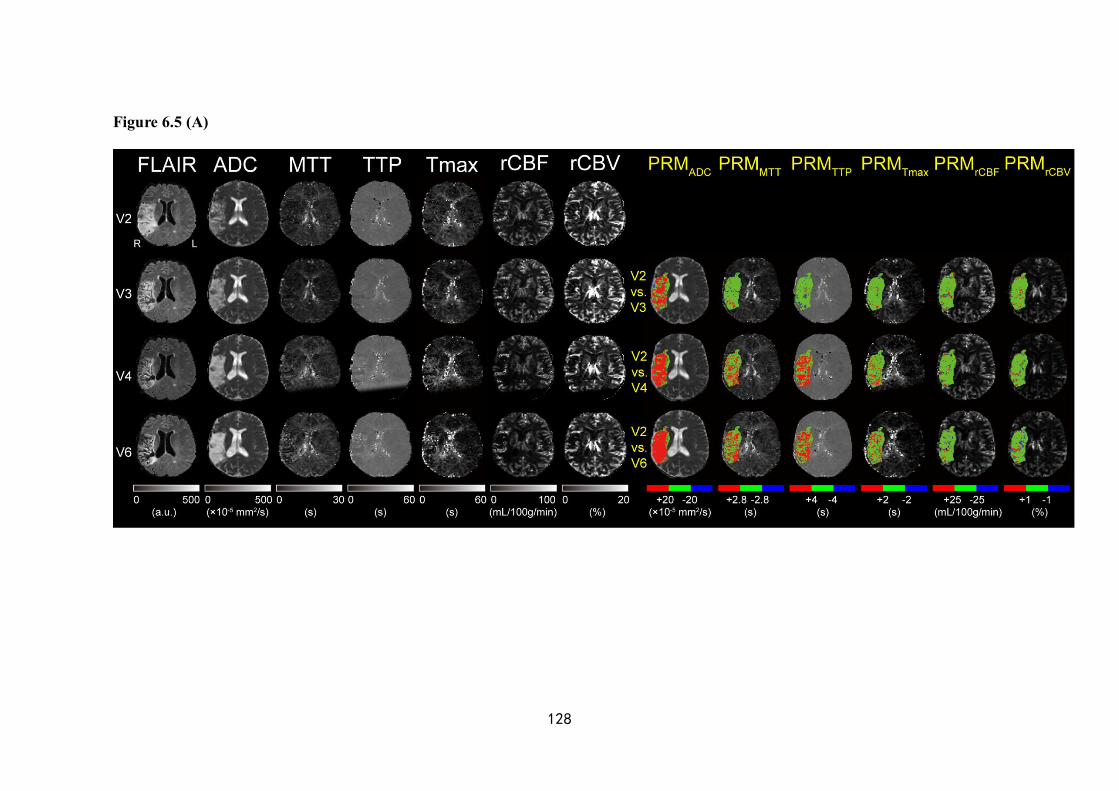
128
Figure 6.5 (A)
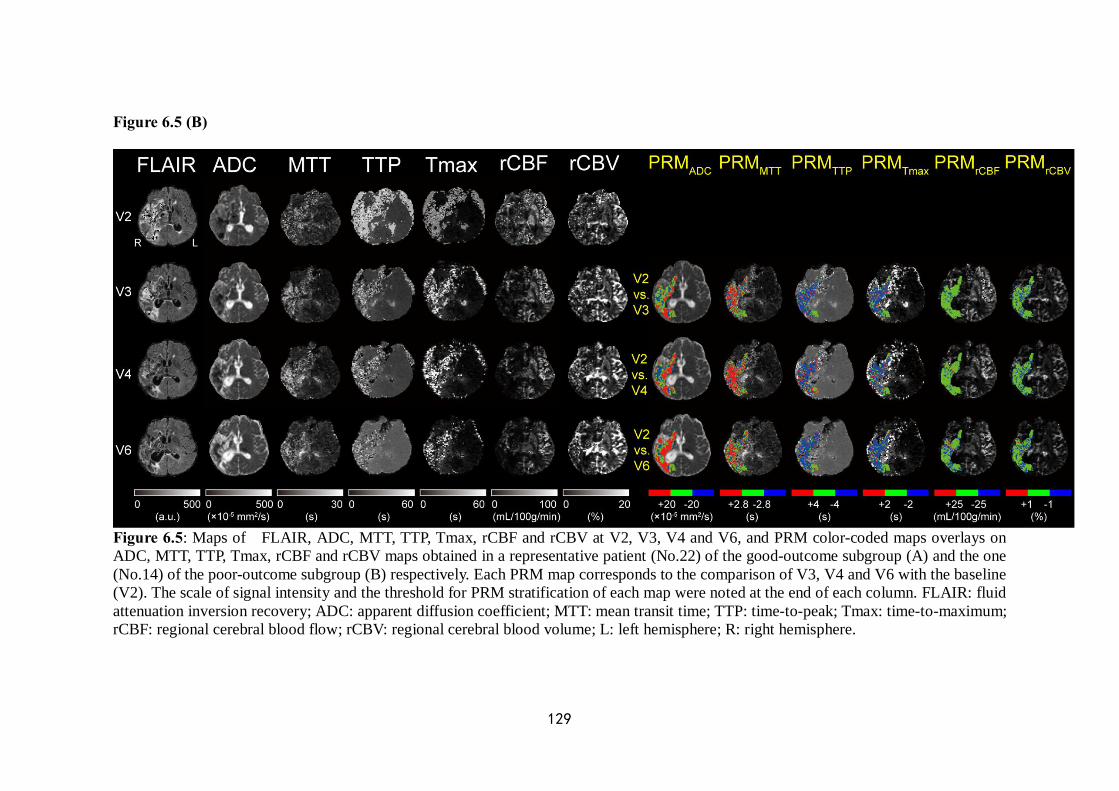
129
Figure 6.5 (B)
Figure 6.5: Maps of FLAIR, ADC, MTT, TTP, Tmax, rCBF and rCBV at V2, V3, V4 and V6, and PRM color-coded maps overlays on ADC, MTT, TTP, Tmax, rCBF and rCBV maps obtained in a representative patient (No.22) of the good-outcome subgroup (A) and the one (No.14) of the poor-outcome subgroup (B) respectively. Each PRM map corresponds to the comparison of V3, V4 and V6 with the baseline (V2). The scale of signal intensity and the threshold for PRM stratification of each map were noted at the end of each column. FLAIR: fluid attenuation inversion recovery; ADC: apparent diffusion coefficient; MTT: mean transit time; TTP: time-to-peak; Tmax: time-to-maximum; rCBF: regional cerebral blood flow; rCBV: regional cerebral blood volume; L: left hemisphere; R: right hemisphere.
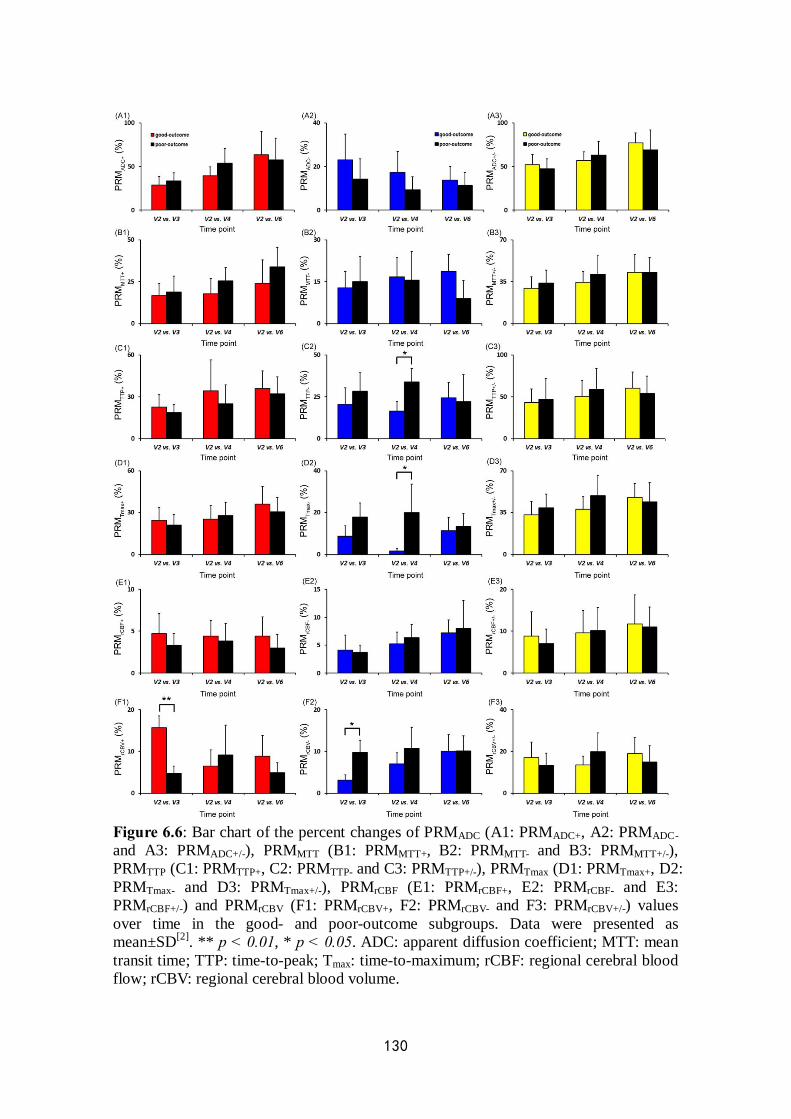
130
Figure 6.6: Bar chart of the percent changes of PRMADC (A1: PRMADC+, A2: PRMADC- and A3: PRMADC+/-), PRMMTT (B1: PRMMTT+, B2: PRMMTT- and B3: PRMMTT+/-), PRMTTP (C1: PRMTTP+, C2: PRMTTP- and C3: PRMTTP+/-), PRMTmax (D1: PRMTmax+, D2: PRMTmax- and D3: PRMTmax+/-), PRMrCBF (E1: PRMrCBF+, E2: PRMrCBF- and E3: PRMrCBF+/-) and PRMrCBV (F1: PRMrCBV+, F2: PRMrCBV- and F3: PRMrCBV+/-) values over time in the good- and poor-outcome subgroups. Data were presented as mean±SD[2]. ** p < 0.01, * p < 0.05. ADC: apparent diffusion coefficient; MTT: mean transit time; TTP: time-to-peak; Tmax: time-to-maximum; rCBF: regional cerebral blood flow; rCBV: regional cerebral blood volume.
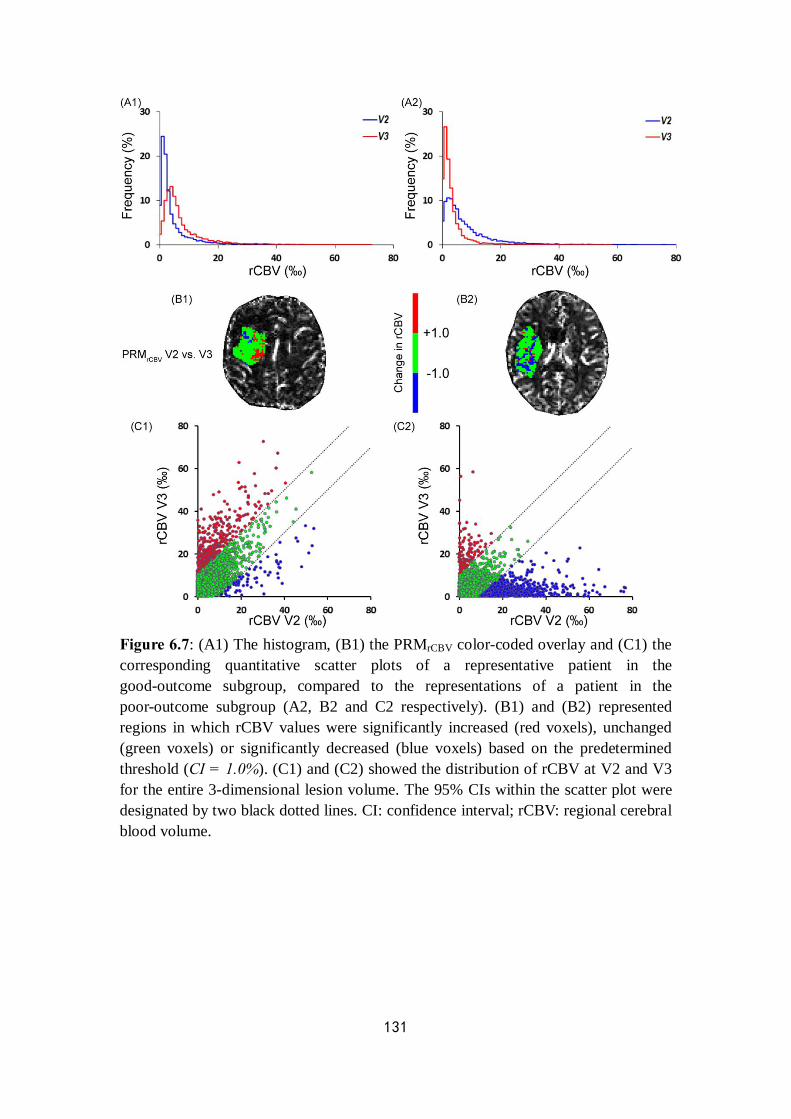
131
Figure 6.7: (A1) The histogram, (B1) the PRMrCBV color-coded overlay and (C1) the corresponding quantitative scatter plots of a representative patient in the good-outcome subgroup, compared to the representations of a patient in the poor-outcome subgroup (A2, B2 and C2 respectively). (B1) and (B2) represented regions in which rCBV values were significantly increased (red voxels), unchanged (green voxels) or significantly decreased (blue voxels) based on the predetermined threshold (CI = 1.0%). (C1) and (C2) showed the distribution of rCBV at V2 and V3 for the entire 3-dimensional lesion volume. The 95% CIs within the scatter plot were designated by two black dotted lines. CI: confidence interval; rCBV: regional cerebral blood volume.
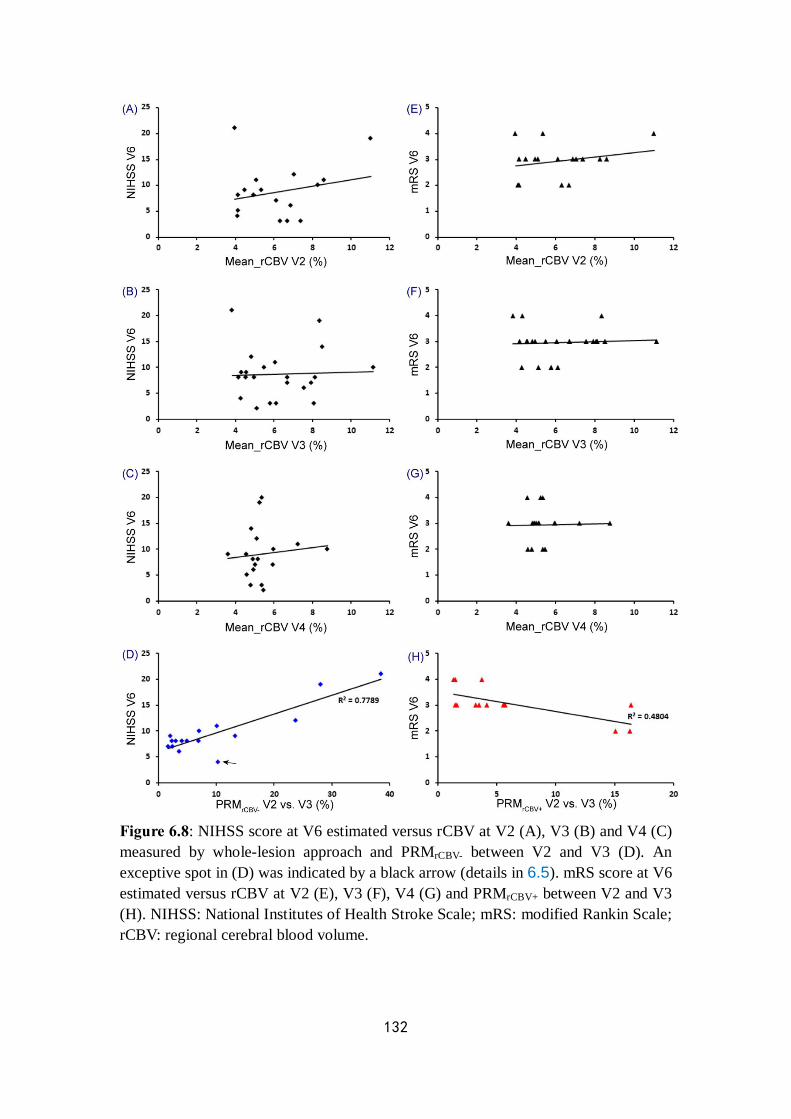
132
Figure 6.8: NIHSS score at V6 estimated versus rCBV at V2 (A), V3 (B) and V4 (C) measured by whole-lesion approach and PRMrCBV- between V2 and V3 (D). An exceptive spot in (D) was indicated by a black arrow (details in 6.5). mRS score at V6 estimated versus rCBV at V2 (E), V3 (F), V4 (G) and PRMrCBV+ between V2 and V3 (H). NIHSS: National Institutes of Health Stroke Scale; mRS: modified Rankin Scale; rCBV: regional cerebral blood volume.
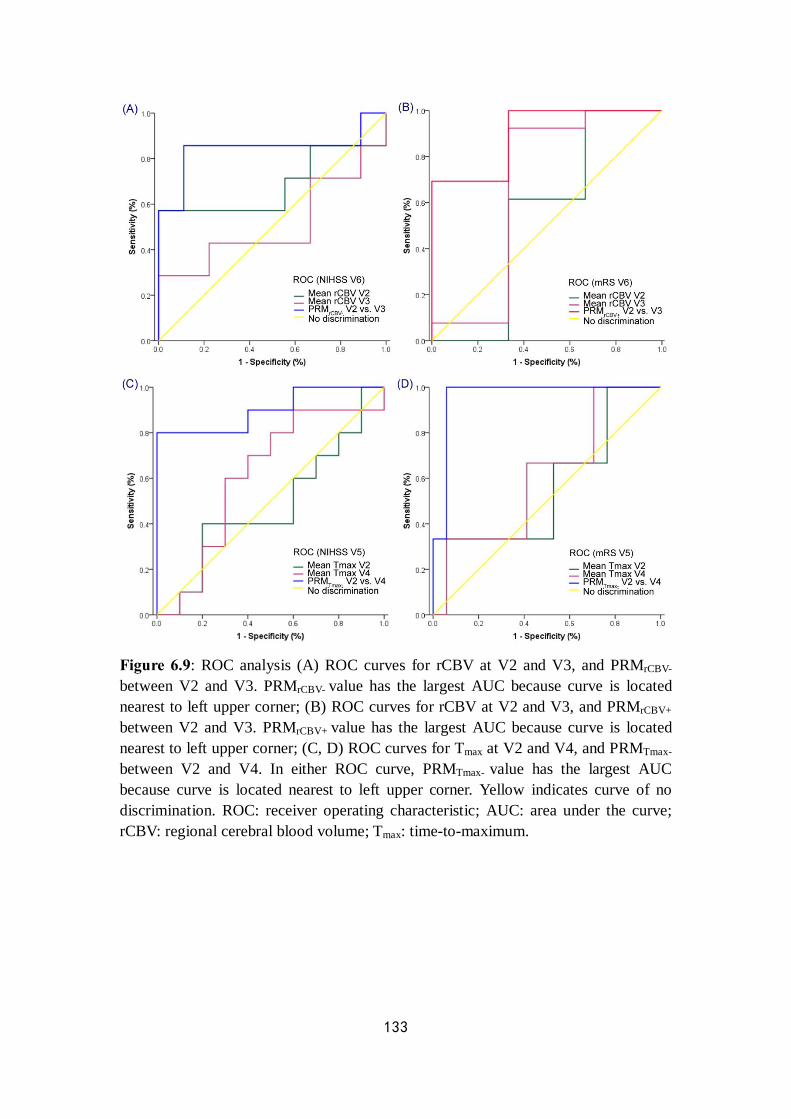
133
Figure 6.9: ROC analysis (A) ROC curves for rCBV at V2 and V3, and PRMrCBV- between V2 and V3. PRMrCBV- value has the largest AUC because curve is located nearest to left upper corner; (B) ROC curves for rCBV at V2 and V3, and PRMrCBV+ between V2 and V3. PRMrCBV+ value has the largest AUC because curve is located nearest to left upper corner; (C, D) ROC curves for Tmax at V2 and V4, and PRMTmax- between V2 and V4. In either ROC curve, PRMTmax- value has the largest AUC because curve is located nearest to left upper corner. Yellow indicates curve of no discrimination. ROC: receiver operating characteristic; AUC: area under the curve; rCBV: regional cerebral blood volume; Tmax: time-to-maximum.

134
Figure 6.10: NIHSS score at V5 esimated versus Tmax at V2 (A), V3 (B) and V4 (C) measured by whole-lesion approach and PRMTmax- between V2 and V4 (D). mRS score at V5 esimated versus Tmax at V2 (E), V3 (F), V4 (G) and PRMTmax- between V2 and V4 (H). NIHSS: National Institutes of Health Stroke Scale; mRS: modified Rankin Scale; Tmax: time-to-maximum.
135
Chapter 7
General conclusion and perspectives
7.1 General conclusion
Cerebral multiparametric MRI plays an important role in assessment of stroke at different stages. Imaging data analyzed by different methods may lead to diversity of results, which impact on the evaluation of stroke evolution and relevant treatment decision.
In all studies performed in this thesis, a novel methodology of imaging analysis based on a voxel-wise approach has been applied to help to identify the heterogeneity within stroke lesions from which potential imaging biomarkers were derived for more accurate evaluation of therapeutic response and prediction of clinical outcome.
The application of this approach has been used in rat models of experimental stroke and then transferred to chronic stroke patients.
7.1.1 The assessment of stem cell therapeutic effects in
preclinical application Stroke is a medical emergency in which time is critical for victims.
However, most patients are excluded by the limited therapeutic time window. For a long duration and even until now, the imaging approaches, normally diffusion and perfusion MRI sequences have been regarded as diagnostic tools to investigate the penumbra which probably offer an opportunity to select patients that may benefit from treatment strategies. With the development of biotherapies, the medical grade stem cells are regarded as the alternative for current stroke therapies in a delayed time frame [Detante et al. 2014].
However, although the cell therapies have been thought to be potential to promote the functional recovery in subacute or chronic phase of stroke, the proposed mechanisms remain poorly understood. Quantitative MRI techniques including DWI and PWI are essential to assess the therapeutic response of stem cells. The diffusion-weighted images are capable of measuring the random thermal motion of water, while the perfusion-weighted images are capable of quantifying changes in stroke hemodynamics and assessing the angiogenesis after ischemic injury [Moisan et al. 2012].
In general, evaluation of therapeutic response to drugs, biomaterials or
136
other interventions based on imaging data uses the mean value throughout the whole lesion as the quantitative metric. However, intralesional heterogeneity of stroke is an inherent property which correlates with different patterns of the parametric value change, and therefore classic analytic methods using a mean average of the voxels in the entire lesion can significantly underestimate the details of regional change after the therapy.
The parametric response map (PRM), a voxel-wise technique, is an alternative to present the heterogeneity within the lesion by the comparison of serial maps acquired before and during the therapy after spatially aligning via co-registration. The volume fraction of voxels with significant value changes between the baseline and an early time point may reflect the early response to the treatment [Galban et al. 2009a]. In view of the capability to exhibit early therapeutic response using the PRM on multiparametric MR images in various clinical sites, this technique is believed to be feasible to provide more details of cell-therapy effects in stroke, although no mature precedent in such application has been reported yet.
In our preclinical research, the PRM approach was applied to both diffusion and perfusion maps including ADC, CBV and VSI for the assessment of the response to hMSC therapy between MCAo rat models with and without treatment. Focal changes on each map were detected by the PRM just one day after a delayed IV injection of hMSCs. The PRM was able to highlight the changes potentially induced by hMSCs upon cellular edema, microvascular plasticity and vasodilation, which have been proven by the histological evidence in a parallel research by Moisan et al. under the same experimental condition [Moisan et al. 2016]. However, the classic whole-lesion approach was insensitive to show the early response. Thus, PRM analysis appears to be a promising tool for the early detection of heterogeneous changes induced by stem cell therapy in stroke lesions. The PRM reflects the superiority over the whole-lesion approach, so that it is potential to be a new monitor for therapeutic efficiency in stroke.
7.1.2 The prediction of outcome in clinical application Lestro Henriques et al. reported that heterogeneous ADC patterns in
ischemic areas of similar size correlated with different functional outcome in permanent MCAo (pMCAo) rodent models [Lestro Henriques et al. 2015]. It is hypothesized that “one stroke may differ from another” even without any therapeutic intervention. Therefore, the motivation of research in this part is to design a complementary clinical protocol to predict clinical outcome of chronic stroke based on the intralesional heterogeneity in both diffusion and perfusion MR maps. In the previous study, the definition of patterns according to qualitative visual criteria and histogram categorization was not sufficient to reflect the temporal evolution of stroke. Whereas in our research, the PRM approach provided a quantitative analysis on stratifications of voxels with
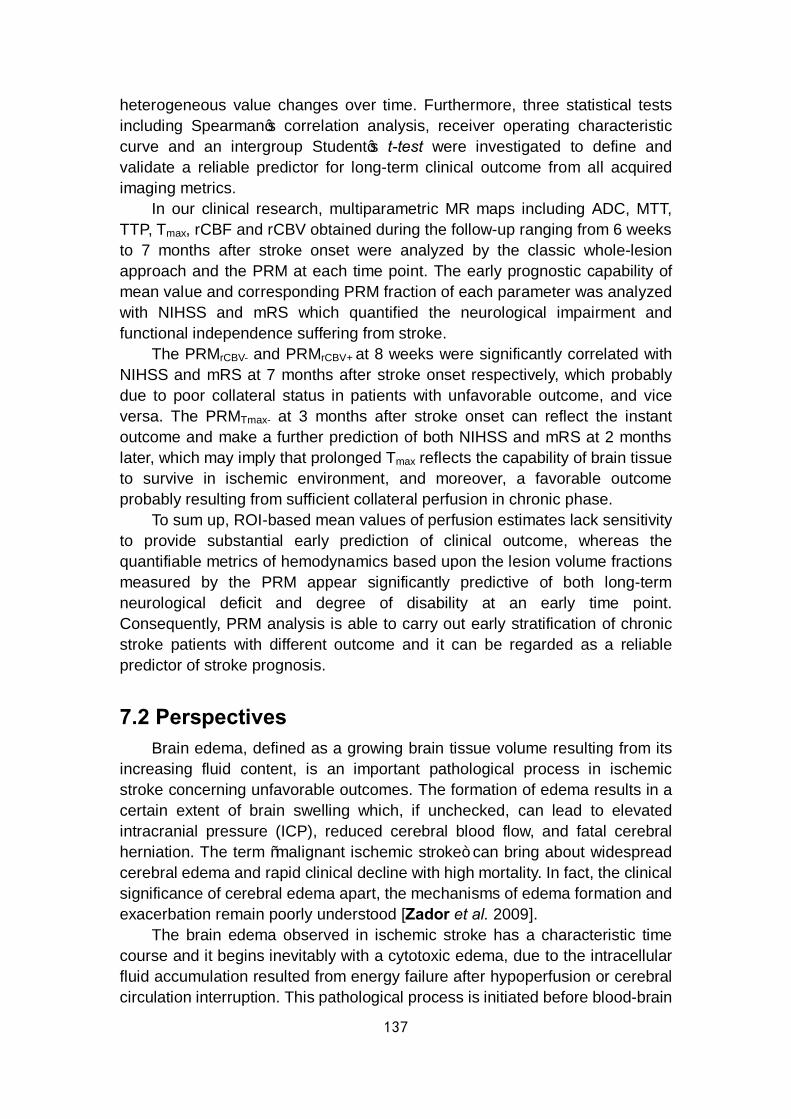
137
heterogeneous value changes over time. Furthermore, three statistical tests including Spearman’s correlation analysis, receiver operating characteristic curve and an intergroup Student’s t-test were investigated to define and validate a reliable predictor for long-term clinical outcome from all acquired imaging metrics.
In our clinical research, multiparametric MR maps including ADC, MTT, TTP, Tmax, rCBF and rCBV obtained during the follow-up ranging from 6 weeks to 7 months after stroke onset were analyzed by the classic whole-lesion approach and the PRM at each time point. The early prognostic capability of mean value and corresponding PRM fraction of each parameter was analyzed with NIHSS and mRS which quantified the neurological impairment and functional independence suffering from stroke.
The PRMrCBV- and PRMrCBV+ at 8 weeks were significantly correlated with NIHSS and mRS at 7 months after stroke onset respectively, which probably due to poor collateral status in patients with unfavorable outcome, and vice versa. The PRMTmax- at 3 months after stroke onset can reflect the instant outcome and make a further prediction of both NIHSS and mRS at 2 months later, which may imply that prolonged Tmax reflects the capability of brain tissue to survive in ischemic environment, and moreover, a favorable outcome probably resulting from sufficient collateral perfusion in chronic phase.
To sum up, ROI-based mean values of perfusion estimates lack sensitivity to provide substantial early prediction of clinical outcome, whereas the quantifiable metrics of hemodynamics based upon the lesion volume fractions measured by the PRM appear significantly predictive of both long-term neurological deficit and degree of disability at an early time point. Consequently, PRM analysis is able to carry out early stratification of chronic stroke patients with different outcome and it can be regarded as a reliable predictor of stroke prognosis.
7.2 Perspectives Brain edema, defined as a growing brain tissue volume resulting from its
increasing fluid content, is an important pathological process in ischemic stroke concerning unfavorable outcomes. The formation of edema results in a certain extent of brain swelling which, if unchecked, can lead to elevated intracranial pressure (ICP), reduced cerebral blood flow, and fatal cerebral herniation. The term “malignant ischemic stroke” can bring about widespread cerebral edema and rapid clinical decline with high mortality. In fact, the clinical significance of cerebral edema apart, the mechanisms of edema formation and exacerbation remain poorly understood [Zador et al. 2009].
The brain edema observed in ischemic stroke has a characteristic time course and it begins inevitably with a cytotoxic edema, due to the intracellular fluid accumulation resulted from energy failure after hypoperfusion or cerebral circulation interruption. This pathological process is initiated before blood-brain
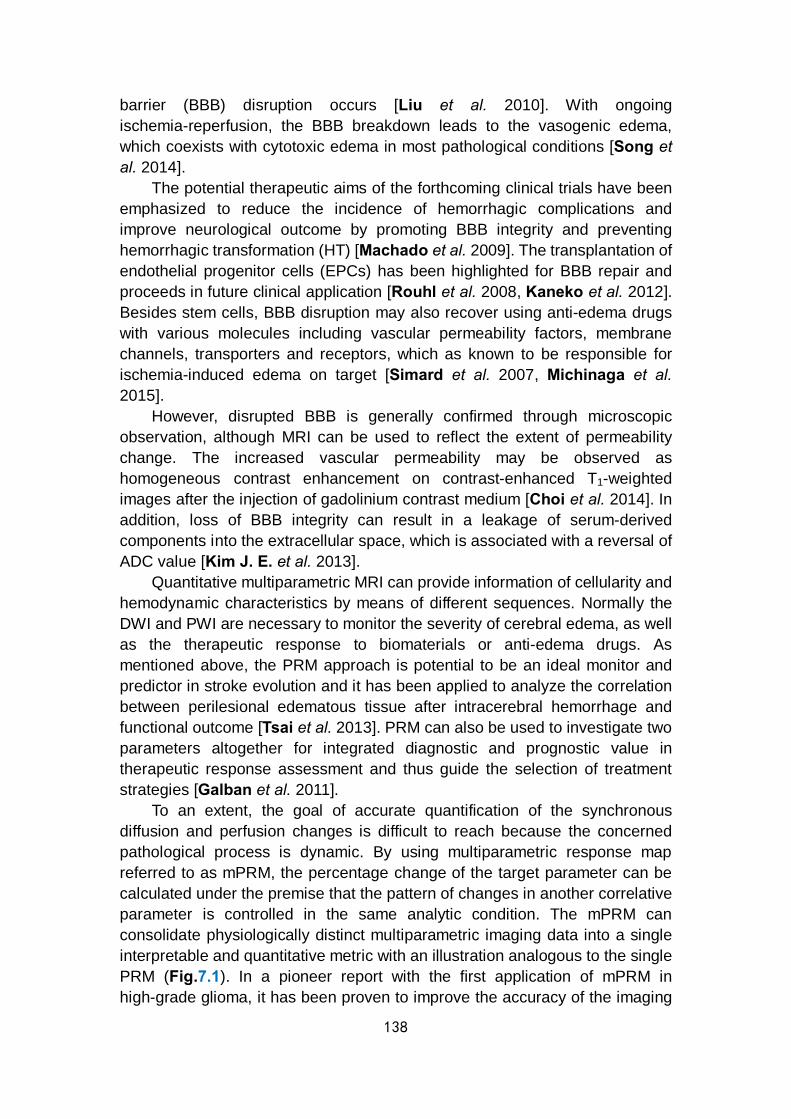
138
barrier (BBB) disruption occurs [Liu et al. 2010]. With ongoing ischemia-reperfusion, the BBB breakdown leads to the vasogenic edema, which coexists with cytotoxic edema in most pathological conditions [Song et al. 2014].
The potential therapeutic aims of the forthcoming clinical trials have been emphasized to reduce the incidence of hemorrhagic complications and improve neurological outcome by promoting BBB integrity and preventing hemorrhagic transformation (HT) [Machado et al. 2009]. The transplantation of endothelial progenitor cells (EPCs) has been highlighted for BBB repair and proceeds in future clinical application [Rouhl et al. 2008, Kaneko et al. 2012]. Besides stem cells, BBB disruption may also recover using anti-edema drugs with various molecules including vascular permeability factors, membrane channels, transporters and receptors, which as known to be responsible for ischemia-induced edema on target [Simard et al. 2007, Michinaga et al. 2015].
However, disrupted BBB is generally confirmed through microscopic observation, although MRI can be used to reflect the extent of permeability change. The increased vascular permeability may be observed as homogeneous contrast enhancement on contrast-enhanced T1-weighted images after the injection of gadolinium contrast medium [Choi et al. 2014]. In addition, loss of BBB integrity can result in a leakage of serum-derived components into the extracellular space, which is associated with a reversal of ADC value [Kim J. E. et al. 2013].
Quantitative multiparametric MRI can provide information of cellularity and hemodynamic characteristics by means of different sequences. Normally the DWI and PWI are necessary to monitor the severity of cerebral edema, as well as the therapeutic response to biomaterials or anti-edema drugs. As mentioned above, the PRM approach is potential to be an ideal monitor and predictor in stroke evolution and it has been applied to analyze the correlation between perilesional edematous tissue after intracerebral hemorrhage and functional outcome [Tsai et al. 2013]. PRM can also be used to investigate two parameters altogether for integrated diagnostic and prognostic value in therapeutic response assessment and thus guide the selection of treatment strategies [Galban et al. 2011].
To an extent, the goal of accurate quantification of the synchronous diffusion and perfusion changes is difficult to reach because the concerned pathological process is dynamic. By using multiparametric response map referred to as mPRM, the percentage change of the target parameter can be calculated under the premise that the pattern of changes in another correlative parameter is controlled in the same analytic condition. The mPRM can consolidate physiologically distinct multiparametric imaging data into a single interpretable and quantitative metric with an illustration analogous to the single PRM (Fig.7.1). In a pioneer report with the first application of mPRM in high-grade glioma, it has been proven to improve the accuracy of the imaging
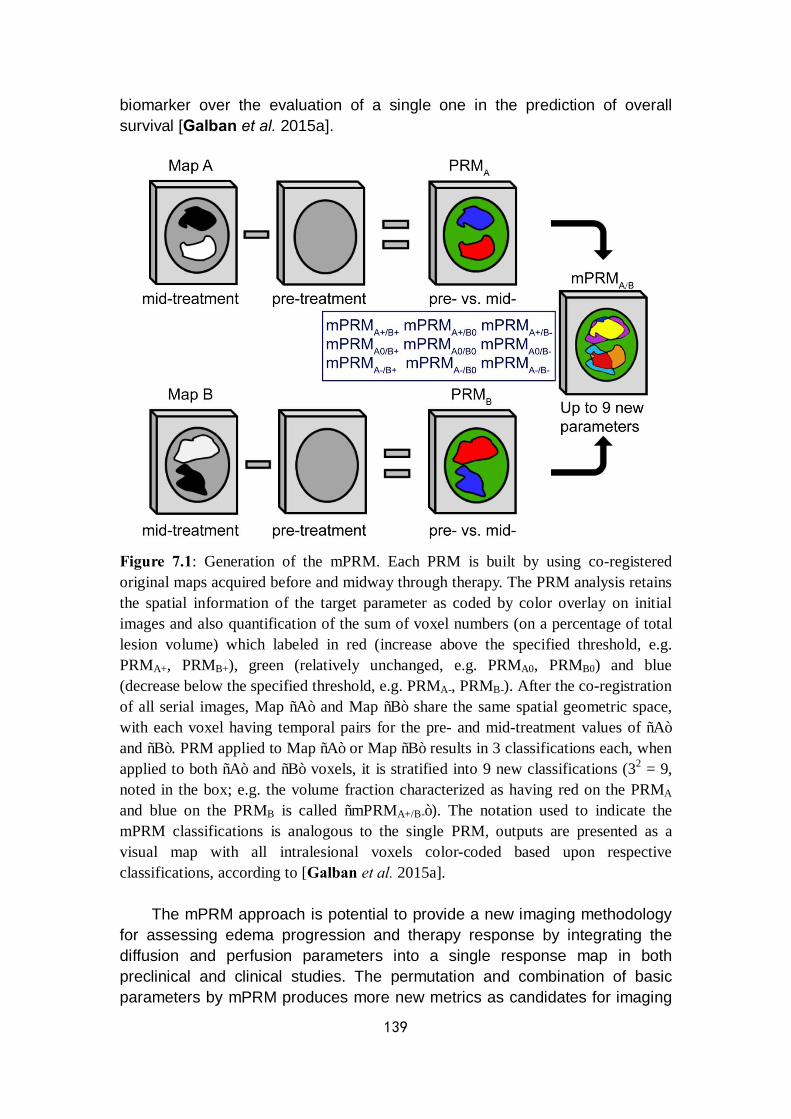
139
biomarker over the evaluation of a single one in the prediction of overall survival [Galban et al. 2015a].
Figure 7.1: Generation of the mPRM. Each PRM is built by using co-registered original maps acquired before and midway through therapy. The PRM analysis retains the spatial information of the target parameter as coded by color overlay on initial images and also quantification of the sum of voxel numbers (on a percentage of total lesion volume) which labeled in red (increase above the specified threshold, e.g. PRMA+, PRMB+), green (relatively unchanged, e.g. PRMA0, PRMB0) and blue (decrease below the specified threshold, e.g. PRMA-, PRMB-). After the co-registration of all serial images, Map “A” and Map “B” share the same spatial geometric space, with each voxel having temporal pairs for the pre- and mid-treatment values of “A” and “B”. PRM applied to Map “A” or Map “B” results in 3 classifications each, when applied to both “A” and “B” voxels, it is stratified into 9 new classifications (32 = 9, noted in the box; e.g. the volume fraction characterized as having red on the PRMA and blue on the PRMB is called “mPRMA+/B-”). The notation used to indicate the mPRM classifications is analogous to the single PRM, outputs are presented as a visual map with all intralesional voxels color-coded based upon respective classifications, according to [Galban et al. 2015a].
The mPRM approach is potential to provide a new imaging methodology for assessing edema progression and therapy response by integrating the diffusion and perfusion parameters into a single response map in both preclinical and clinical studies. The permutation and combination of basic parameters by mPRM produces more new metrics as candidates for imaging
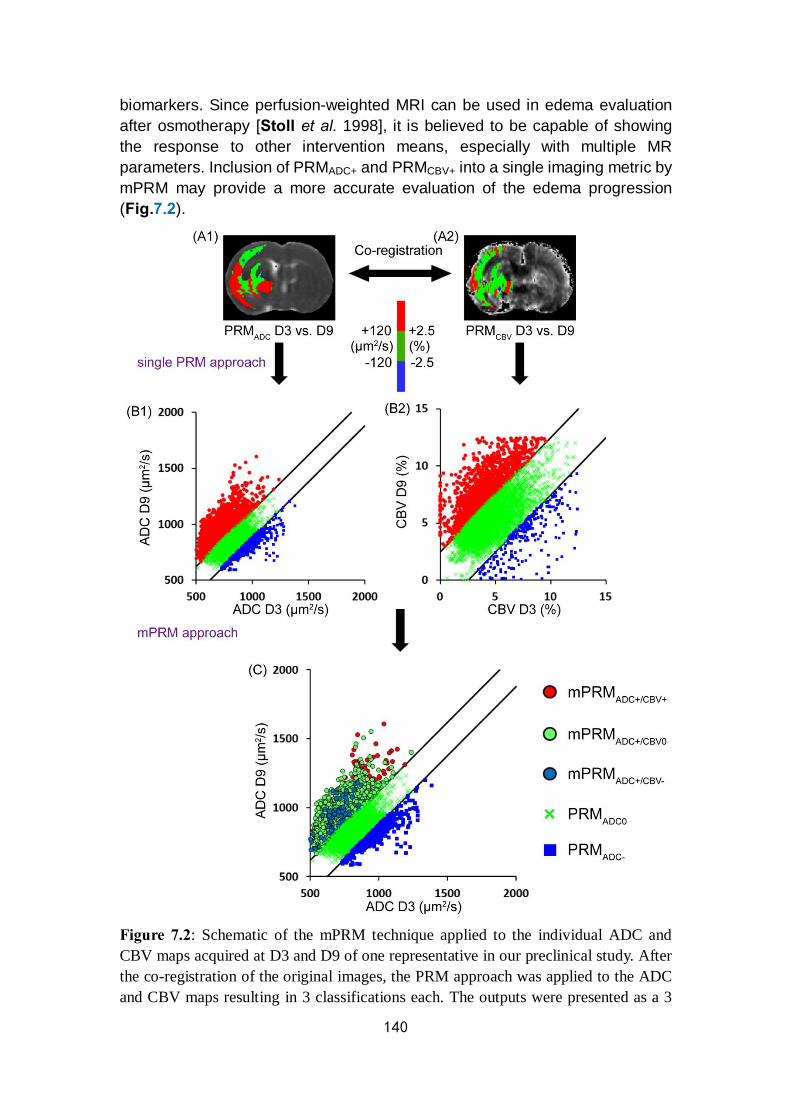
140
biomarkers. Since perfusion-weighted MRI can be used in edema evaluation after osmotherapy [Stoll et al. 1998], it is believed to be capable of showing the response to other intervention means, especially with multiple MR parameters. Inclusion of PRMADC+ and PRMCBV+ into a single imaging metric by mPRM may provide a more accurate evaluation of the edema progression (Fig.7.2).
Figure 7.2: Schematic of the mPRM technique applied to the individual ADC and CBV maps acquired at D3 and D9 of one representative in our preclinical study. After the co-registration of the original images, the PRM approach was applied to the ADC and CBV maps resulting in 3 classifications each. The outputs were presented as a 3
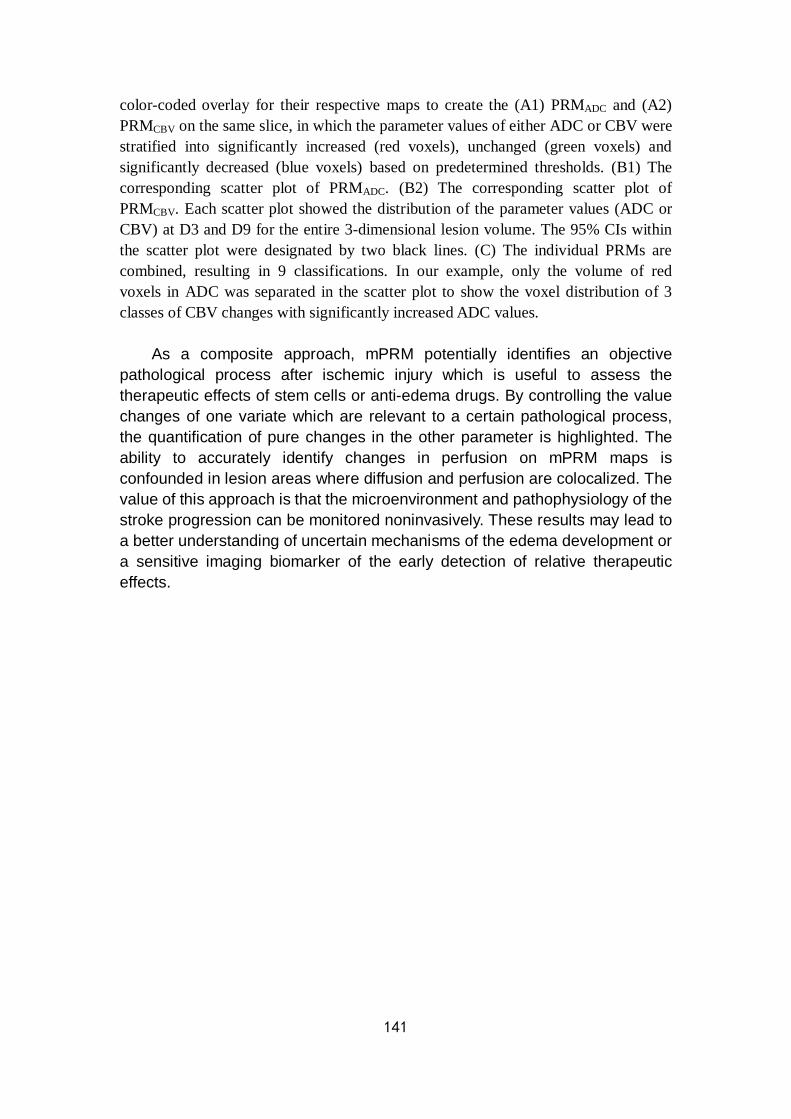
141
color-coded overlay for their respective maps to create the (A1) PRMADC and (A2) PRMCBV on the same slice, in which the parameter values of either ADC or CBV were stratified into significantly increased (red voxels), unchanged (green voxels) and significantly decreased (blue voxels) based on predetermined thresholds. (B1) The corresponding scatter plot of PRMADC. (B2) The corresponding scatter plot of PRMCBV. Each scatter plot showed the distribution of the parameter values (ADC or CBV) at D3 and D9 for the entire 3-dimensional lesion volume. The 95% CIs within the scatter plot were designated by two black lines. (C) The individual PRMs are combined, resulting in 9 classifications. In our example, only the volume of red voxels in ADC was separated in the scatter plot to show the voxel distribution of 3 classes of CBV changes with significantly increased ADC values.
As a composite approach, mPRM potentially identifies an objective pathological process after ischemic injury which is useful to assess the therapeutic effects of stem cells or anti-edema drugs. By controlling the value changes of one variate which are relevant to a certain pathological process, the quantification of pure changes in the other parameter is highlighted. The ability to accurately identify changes in perfusion on mPRM maps is confounded in lesion areas where diffusion and perfusion are colocalized. The value of this approach is that the microenvironment and pathophysiology of the stroke progression can be monitored noninvasively. These results may lead to a better understanding of uncertain mechanisms of the edema development or a sensitive imaging biomarker of the early detection of relative therapeutic effects.

142
143
Appendix 1
Chapter 8
MRI segmentation methods
Data acquisition, extraction and analysis are consequent but independent steps in imaging research. As an improvement in the methodology of imaging analysis, PRM approach does not change the innate character of dataset. Based on different requirements of practical applications, with considering efficiency, repeatability and optimization, selection of image segmentation method could be regarded as an explorative step which helps define the final target for research. In this chapter, I will review the different methods available for this key step.
As a probe of brain anatomy, physiology and function, MRI is a noninvasive and highly versatile modality that promises to play a significantly important role in neuroimaging. Accurate segmentation of brain MRI is undoubtedly of great potential for both preclinical and clinical researches on various neurological diseases. The aim of image segmentation is to divide an image into a set of semantically meaningful, homogeneous and non-overlapping regions of similar attributes such as intensity, depth or texture. The segmentation result is either an image with labels identifying each delineated region or a set of contours which describe the region boundaries [Despotovic et al. 2015]. However, challenges remained in MRI brain segmentation arise from various reasons, including data size, low contrast between tissue classes, unavailability of a priori knowledge, both local and global perspectives [Scherrer et al. 2007].
A wide variety of segmentation techniques were developed and separated into several categories based on the classification scheme [Pham et al. 2000]. Both healthy and impaired brains are potential targets of MRI segmentation with different levels of difficulty in manipulation. For the healthy brain of a specific population, template-associated methods are feasible to attain favorable repeatability and reproducibility among different individuals. For the pathological brain, accurate delineation of lesion is the primary task which tightly related with evaluation of severity, therapeutic effects, prognosis, and even clinical interventions such as precise tumorectomy.
All in all, the main cerebral MRI segmentation methods with multiple applications including healthy brain, brain tumor and ischemic stroke can be grouped as follows:
144
Ø Manual segmentation Ø Automatic segmentation n Intensity-based methods ² Thresholding ² Region growing (Region merging) ² Edge detection
n Atlas-based methods ² Probabilistic atlas segmentation (PA) ² Label propagation (LP) ² Multi-atlas propagation (MA) ² Classification ² Clustering
n Artificial neural networks (ANNs) n Surface-based methods ² Deformable models
n Hybrid segmentation methods n Other methods ² Texture segmentation ² Wavelet transform ² Multispectral segmentation
8.1 Manual segmentation
Manual segmentation of anatomy in brain MRI data is considered to be with the closest quality of gold standard. It refers to the process where a human operator segments and labels an image manually. The procedure is typically done by a trained operator who goes through around multiple images to extract the contours of the target structures on 3D volumetric imagery slice by slice. This method is believed to have high accuracy because it solves the difficulties related to image quality and artifacts by reliably identifying and delineating different structures in medical images [Garg et al. 2014]. However, it depends to a great extent on individual experience and a prior knowledge is generally required before the procedure.
With the developments of imaging tools and attendant higher resolution, more slices and more image types of acquired data, the manual segmentation has become an intensive and relatively time-consuming task, especially in clinical emergency. Manual delineation is not only tedious but also particularly difficult to reproduce due to the intra- or interindividual difference in operation [Collier et al. 2003]. Registration before manual segmentation, normally in anatomic atlas of healthy brain, can improve the operability by transferring the ground truth template labels onto the unlabeled images, which then fused to obtain the final outputs in the target population (Fig.8.1). Accurate delineation of target regions is of prime importance as inaccuracies in the templates for an accurate segmentation. The outlines of the overlay should follow the anatomical structure boundaries of intensity change and physiological
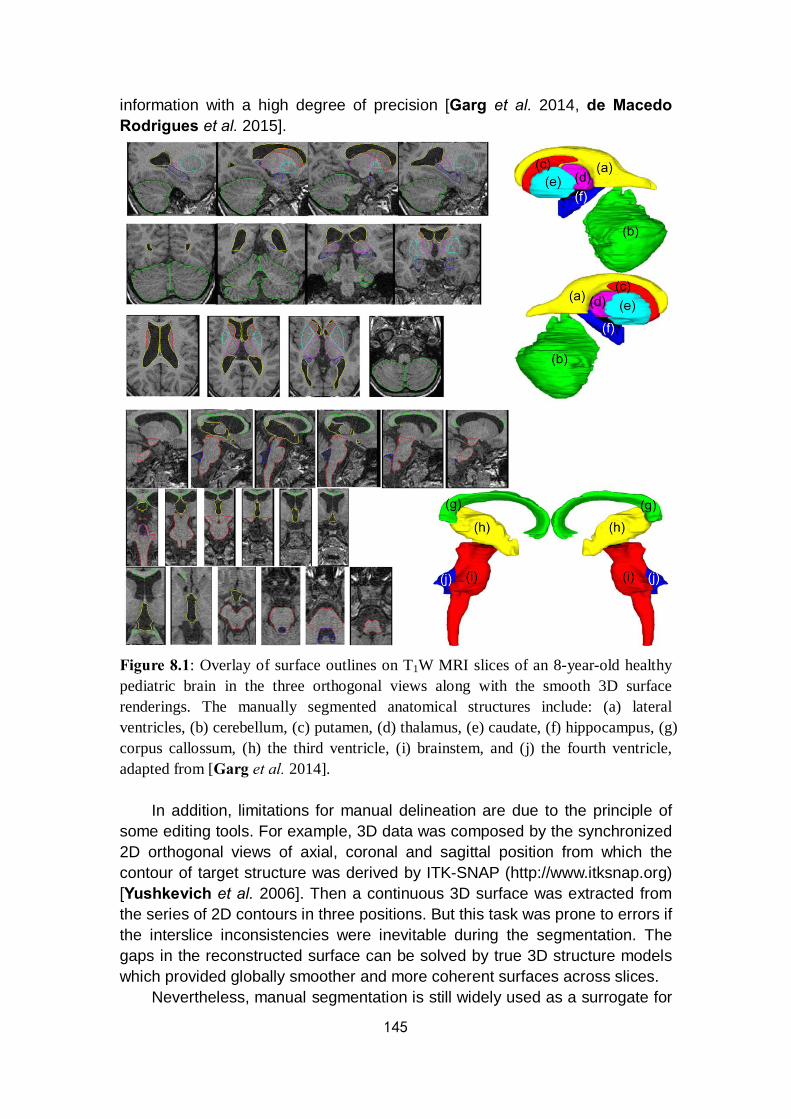
145
information with a high degree of precision [Garg et al. 2014, de Macedo Rodrigues et al. 2015].
Figure 8.1: Overlay of surface outlines on T1W MRI slices of an 8-year-old healthy pediatric brain in the three orthogonal views along with the smooth 3D surface renderings. The manually segmented anatomical structures include: (a) lateral ventricles, (b) cerebellum, (c) putamen, (d) thalamus, (e) caudate, (f) hippocampus, (g) corpus callossum, (h) the third ventricle, (i) brainstem, and (j) the fourth ventricle, adapted from [Garg et al. 2014].
In addition, limitations for manual delineation are due to the principle of some editing tools. For example, 3D data was composed by the synchronized 2D orthogonal views of axial, coronal and sagittal position from which the contour of target structure was derived by ITK-SNAP (http://www.itksnap.org) [Yushkevich et al. 2006]. Then a continuous 3D surface was extracted from the series of 2D contours in three positions. But this task was prone to errors if the interslice inconsistencies were inevitable during the segmentation. The gaps in the reconstructed surface can be solved by true 3D structure models which provided globally smoother and more coherent surfaces across slices.
Nevertheless, manual segmentation is still widely used as a surrogate for
146
ground truth delineation and quantitative evaluation because of the convenience. Furthermore, the different brain structures derived from manual segmentation can be applied as the ground truth in brain atlas formation and thus can be used in the approaches for atlas-based segmentation [Shi et al. 2011] (methods mentioned in 8.2.2.2).
8.2 Automatic segmentation
Automatic segmentation can be categorized as semi-automatic and fully automatic approaches, which provide clinical potential benefits on the monitoring and evaluation of a variety of diseases, especially in brain tumors. The semi-automatic method for tumor extraction showed greater efficiency and stability than the manual method [Yu et al. 2016]. An automated, reliable and efficient technique for MRI brain segmentation is challenged by several factors. The common factor is the random Rician noise associated with the magnitude MR images [He et al. 2009]. Because of the non-uniformity in the radiofrequency (RF) coils or acquisition sequences, intensity inhomogeneity, also called bias field, usually appears as an intensity variation across the MR images during the image generation [Li Y. et al. 2011]. Thus, a bias of the resultant intensities which is hardly observed by the naked eye may lead to a serious misclassification by using intensity-based segmentation algorithms. In addition, images can be corrupted by other negative factors such as noises, partial volume (PV) effect and truncation (Gibbs) artifact. PV effect means more than one type of class / tissue occupies one voxel / pixel of the image, which leads to the fuzzy boundaries between different tissues. [Ruan et al. 2000]. The manifestation of truncation artifacts, also as known as Gibbs phenomenon, are the overshoot and ringing artifacts around sharp changes in image contrast, which caused by the truncation of a Fourier series of a discontinuous function. Normally, the truncation artifacts are unavoidable at sharp edges with high contrast when the image is being deblurred. The reduction of truncation artifacts can be realized at the cost of compromising image resolution because high-frequency components of the data will be excluded by blurring the input image [Zeng et al. 2011].
In general, brain MR imaging elements are typically classified into three main tissue types: WM, GM and cerebrospinal fluid (CSF). But various fundamental components of structural brain MRI data can lead to significantly different results of segmentation. For example, compared with the adult brain MR images, contrast in neonatal MR images is much lower than that of adult because the majority of WM is as-yet unmyelinated and has the water content closer to that of GM than in adults and adolescents. Besides the image contrast, the intensities of tissues are significantly affected by intensity inhomogeneity due to not only RF inhomogeneity but also biological properties of the developing tissue, which leads to a large overlap in their intensity
147
distributions. The inversion of contrast between GM and WM, compared to adult MRI, is also a difficulty given the limited resolution of neonate MRI. Due to this inverted GM / WM contrast, many voxels between CSF and GM can be incorrectly classified as WM by conventional intensity-based segmentation approaches. In a word, it remains challenging to segment brain MR images, especially for neonatal brain images [Xue et al. 2007, Shi et al. 2010]. Method complexity has thus evolved to account for these constraints.
8.2.1 Intensity-based methods
Intensity-based segmentation methods distinguish individual voxel / pixel of different types according to their intensities. In the case of the brain MRI, elements are typically classified into three tissue types as described before. More detailed classification is limited by the overlap between different brain structural intensity profiles such as brain and non-brain tissue (e.g. the scalp).
Several intensity-based techniques are available for tissue classification. The most common method is to use intensity histogram of all voxels and fitting Gaussian functions to the distribution, and then associates a probability to a given intensity of correspondence to a given type of tissue. Incorporating tools for dealing with artifacts in MRI are required even only for the basic separation of the three main tissue classes. Incorporating neighborhood information helps to give preference to spatially homogeneous regions in the resulting segmentation by significantly decreasing misclassification caused by random noise in the image [Pham et al. 2000]. 8.2.1.1 Thresholding
As the simplest image segmentation method, the thresholding procedure uses the intensity histogram to define the thresholds τ values which separate the desired classes (e.g. object from background). The segmentation is then realized by grouping all pixels between defined thresholds into one class. Thresholding methods have many variations including global signal threshold, local threshold depending on the location in the image, multi-thresholding, adaptive thresholding and so forth (Fig.8.2). They can be applied to separate background voxels from the brain tissue or to initialize the tissue classes in other iterative segmentation methods.

148
Figure 8.2: Grey level histogram can be partitioned by (a) a single threshold or (b) multiple thresholds [Despotovic et al. 2015].
Although thresholding method is fast and computationally efficient, the neighborhood information which reflects the imaging spatial characteristics is not taken into account. Thus, it tends to produce scattered groups of pixels rather than connected regions because of its sensitivity to noise and intensity inhomogeneities, especially under low contrast condition. Furthermore, this method is not suitable for textured images because of their perceptual qualities from the higher order interactions between image elements [Ghaye et al. 2013, Despotovic et al. 2015]. 8.2.1.2 Region growing
Region growing is a technique for extracting a connected region of the image which consists of groups of voxels with similar intensities [Sharma et al. 2010]. It is suitable for segmentation of volumetric images which are composed of large connected homogeneous regions. The selection of seed points is a key step which based on the criterion of users such as pixels in a defined greyscale range or pixels evenly distributed on a grid. This procedure starts from the seed points which can be manually defined or automatically initialized with the algorithm to the accumulation of all neighboring voxels with similar intensities which satisfy a predefined uniformity or homogeneity criterion. It is repeated until all examined qualified voxels are added to the growing region [Park et al. 2014, Despotovic et al. 2015].
Successful applications of region growing algorithm provide huge information in brain MRI analysis for segmentation of brain vessels [Passat et al. 2005], extraction of brain surface [del Fresno et al. 2009] and brain tumor [Hsieh et al. 2011] (Fig.8.3). A semiautomatic segmentation technique based on region growing was applied to measure the infarction volume on 3D image representation [Dastidar et al. 2000].
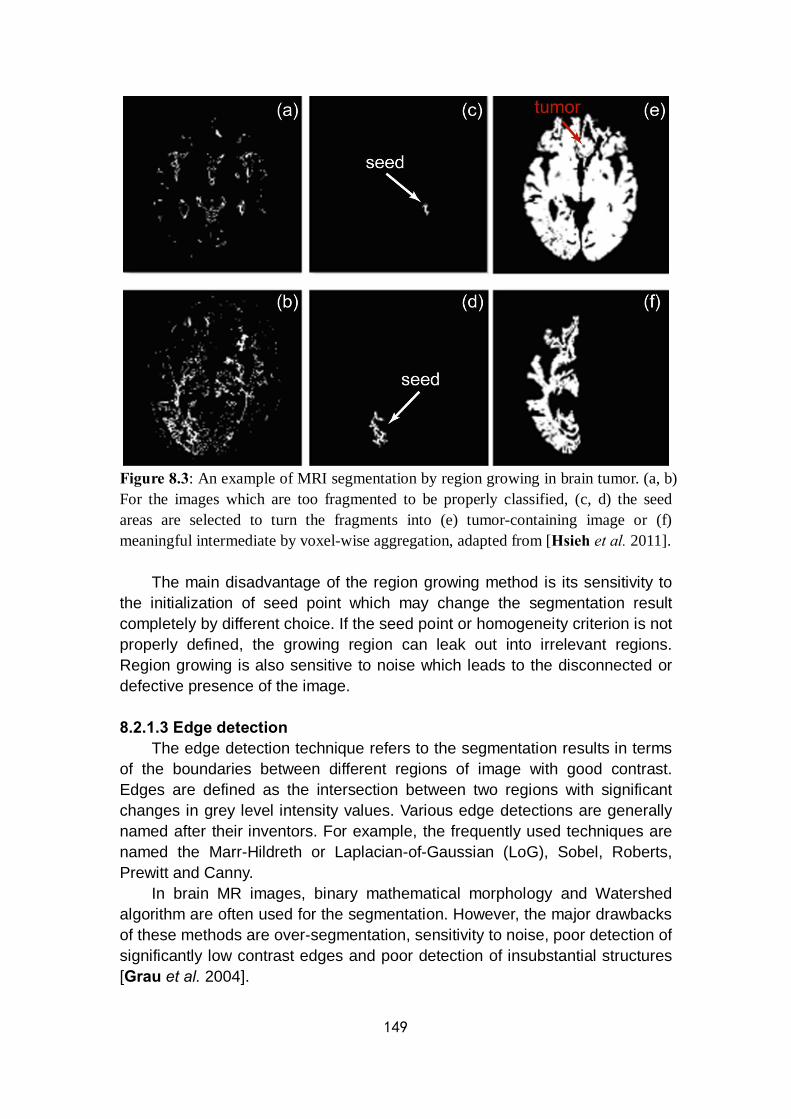
149
Figure 8.3: An example of MRI segmentation by region growing in brain tumor. (a, b) For the images which are too fragmented to be properly classified, (c, d) the seed areas are selected to turn the fragments into (e) tumor-containing image or (f) meaningful intermediate by voxel-wise aggregation, adapted from [Hsieh et al. 2011].
The main disadvantage of the region growing method is its sensitivity to the initialization of seed point which may change the segmentation result completely by different choice. If the seed point or homogeneity criterion is not properly defined, the growing region can leak out into irrelevant regions. Region growing is also sensitive to noise which leads to the disconnected or defective presence of the image. 8.2.1.3 Edge detection
The edge detection technique refers to the segmentation results in terms of the boundaries between different regions of image with good contrast. Edges are defined as the intersection between two regions with significant changes in grey level intensity values. Various edge detections are generally named after their inventors. For example, the frequently used techniques are named the Marr-Hildreth or Laplacian-of-Gaussian (LoG), Sobel, Roberts, Prewitt and Canny.
In brain MR images, binary mathematical morphology and Watershed algorithm are often used for the segmentation. However, the major drawbacks of these methods are over-segmentation, sensitivity to noise, poor detection of significantly low contrast edges and poor detection of insubstantial structures [Grau et al. 2004].
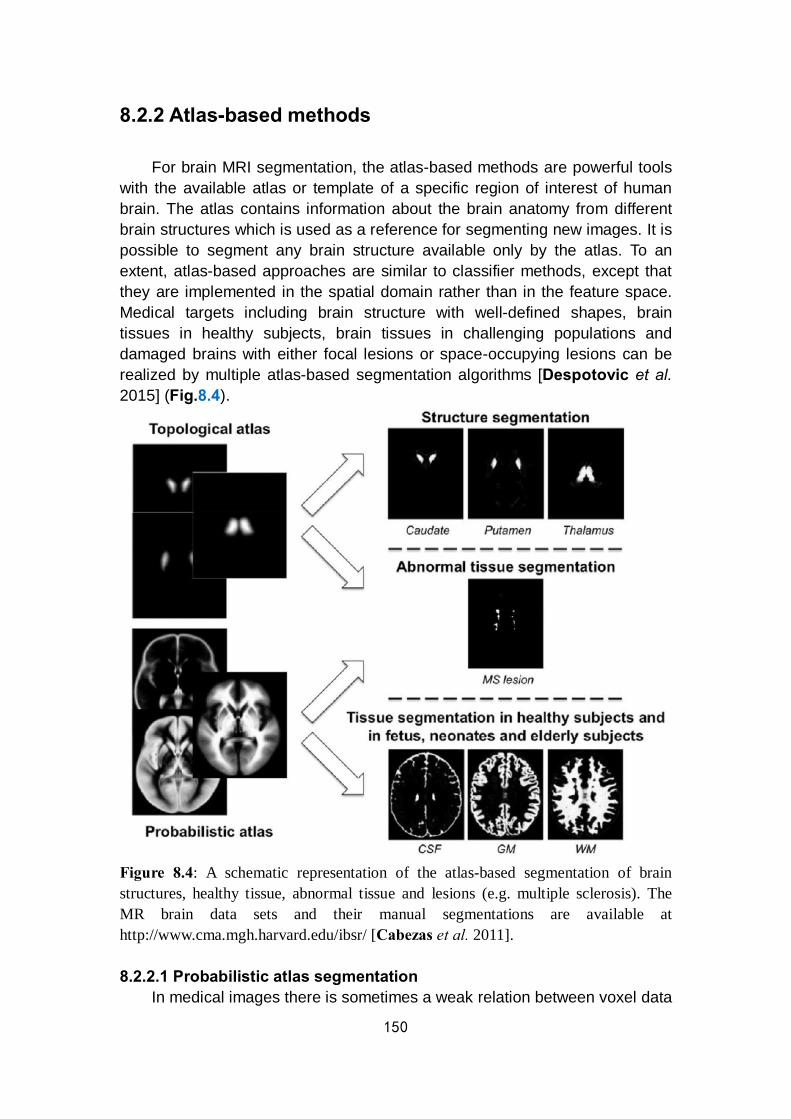
150
8.2.2 Atlas-based methods
For brain MRI segmentation, the atlas-based methods are powerful tools with the available atlas or template of a specific region of interest of human brain. The atlas contains information about the brain anatomy from different brain structures which is used as a reference for segmenting new images. It is possible to segment any brain structure available only by the atlas. To an extent, atlas-based approaches are similar to classifier methods, except that they are implemented in the spatial domain rather than in the feature space. Medical targets including brain structure with well-defined shapes, brain tissues in healthy subjects, brain tissues in challenging populations and damaged brains with either focal lesions or space-occupying lesions can be realized by multiple atlas-based segmentation algorithms [Despotovic et al. 2015] (Fig.8.4).
Figure 8.4: A schematic representation of the atlas-based segmentation of brain structures, healthy tissue, abnormal tissue and lesions (e.g. multiple sclerosis). The MR brain data sets and their manual segmentations are available at http://www.cma.mgh.harvard.edu/ibsr/ [Cabezas et al. 2011]. 8.2.2.1 Probabilistic atlas segmentation
In medical images there is sometimes a weak relation between voxel data
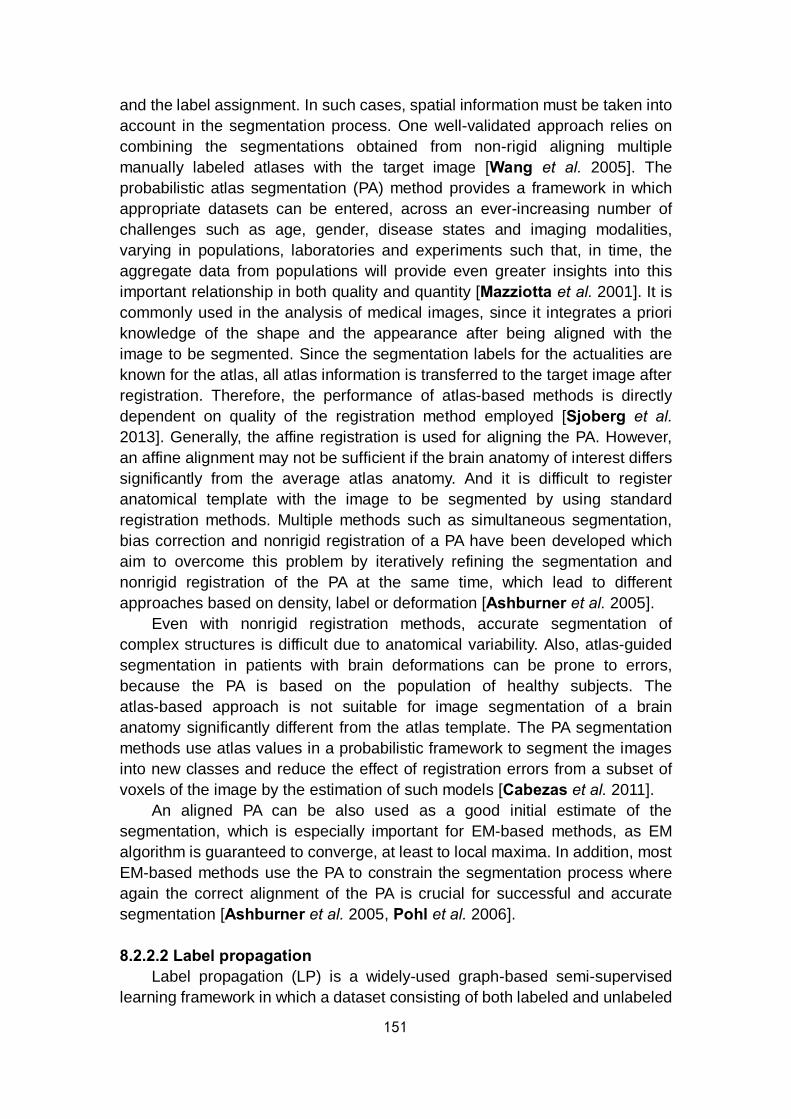
151
and the label assignment. In such cases, spatial information must be taken into account in the segmentation process. One well-validated approach relies on combining the segmentations obtained from non-rigid aligning multiple manually labeled atlases with the target image [Wang et al. 2005]. The probabilistic atlas segmentation (PA) method provides a framework in which appropriate datasets can be entered, across an ever-increasing number of challenges such as age, gender, disease states and imaging modalities, varying in populations, laboratories and experiments such that, in time, the aggregate data from populations will provide even greater insights into this important relationship in both quality and quantity [Mazziotta et al. 2001]. It is commonly used in the analysis of medical images, since it integrates a priori knowledge of the shape and the appearance after being aligned with the image to be segmented. Since the segmentation labels for the actualities are known for the atlas, all atlas information is transferred to the target image after registration. Therefore, the performance of atlas-based methods is directly dependent on quality of the registration method employed [Sjoberg et al. 2013]. Generally, the affine registration is used for aligning the PA. However, an affine alignment may not be sufficient if the brain anatomy of interest differs significantly from the average atlas anatomy. And it is difficult to register anatomical template with the image to be segmented by using standard registration methods. Multiple methods such as simultaneous segmentation, bias correction and nonrigid registration of a PA have been developed which aim to overcome this problem by iteratively refining the segmentation and nonrigid registration of the PA at the same time, which lead to different approaches based on density, label or deformation [Ashburner et al. 2005].
Even with nonrigid registration methods, accurate segmentation of complex structures is difficult due to anatomical variability. Also, atlas-guided segmentation in patients with brain deformations can be prone to errors, because the PA is based on the population of healthy subjects. The atlas-based approach is not suitable for image segmentation of a brain anatomy significantly different from the atlas template. The PA segmentation methods use atlas values in a probabilistic framework to segment the images into new classes and reduce the effect of registration errors from a subset of voxels of the image by the estimation of such models [Cabezas et al. 2011].
An aligned PA can be also used as a good initial estimate of the segmentation, which is especially important for EM-based methods, as EM algorithm is guaranteed to converge, at least to local maxima. In addition, most EM-based methods use the PA to constrain the segmentation process where again the correct alignment of the PA is crucial for successful and accurate segmentation [Ashburner et al. 2005, Pohl et al. 2006]. 8.2.2.2 Label propagation
Label propagation (LP) is a widely-used graph-based semi-supervised learning framework in which a dataset consisting of both labeled and unlabeled
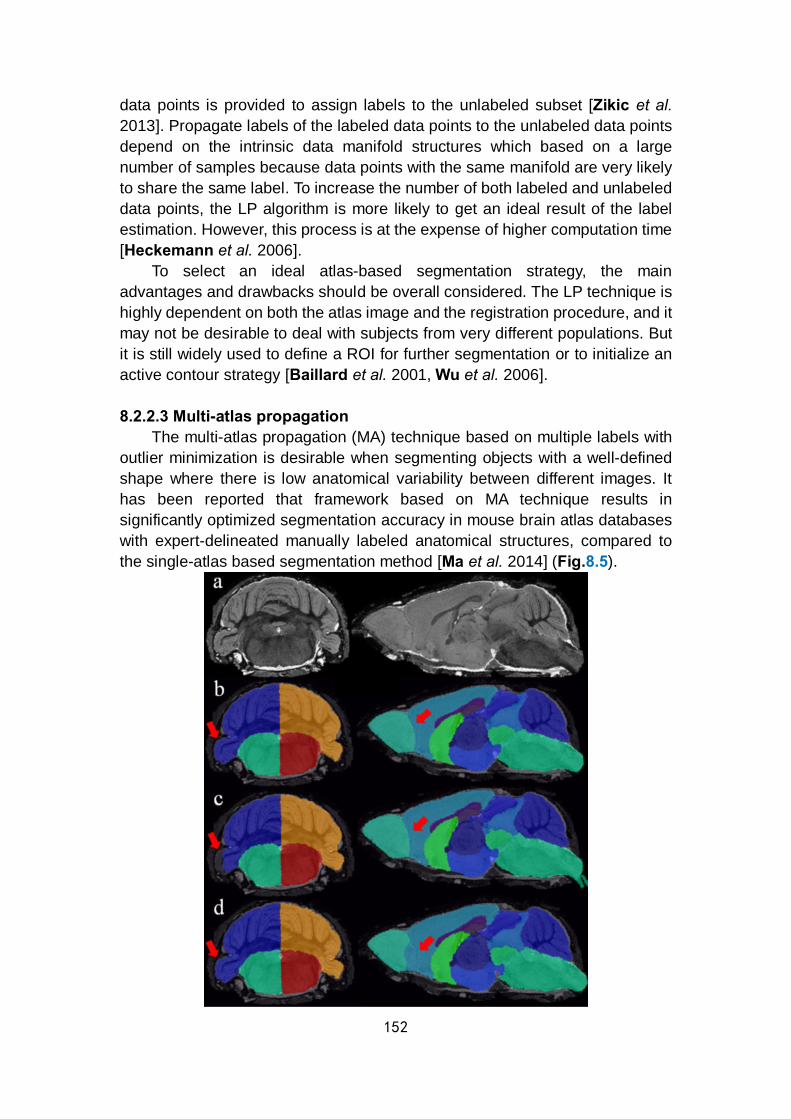
152
data points is provided to assign labels to the unlabeled subset [Zikic et al. 2013]. Propagate labels of the labeled data points to the unlabeled data points depend on the intrinsic data manifold structures which based on a large number of samples because data points with the same manifold are very likely to share the same label. To increase the number of both labeled and unlabeled data points, the LP algorithm is more likely to get an ideal result of the label estimation. However, this process is at the expense of higher computation time [Heckemann et al. 2006].
To select an ideal atlas-based segmentation strategy, the main advantages and drawbacks should be overall considered. The LP technique is highly dependent on both the atlas image and the registration procedure, and it may not be desirable to deal with subjects from very different populations. But it is still widely used to define a ROI for further segmentation or to initialize an active contour strategy [Baillard et al. 2001, Wu et al. 2006]. 8.2.2.3 Multi-atlas propagation
The multi-atlas propagation (MA) technique based on multiple labels with outlier minimization is desirable when segmenting objects with a well-defined shape where there is low anatomical variability between different images. It has been reported that framework based on MA technique results in significantly optimized segmentation accuracy in mouse brain atlas databases with expert-delineated manually labeled anatomical structures, compared to the single-atlas based segmentation method [Ma et al. 2014] (Fig.8.5).
153
Figure 8.5: Sample images comparing the parcellation result of MA segmentation method and the single-atlas based method. The selected coronal and sagittal slices demonstrated that the MA technique preserved the correct local registration in different regions while some local misalignments were found by using the single-atlas based method (red arrows). (a) The original images on which structural parcellations are overlaid. (b) Structural parcellation using the MA based framework. (c) Structural parcellation result of one single-atlas based method with part of the cerebellum mis-segmented on coronal view. (d) Another structural parcellation result of single-atlas based method with the edge between olfactory bulb and cortex mis-segmented on sagittal view [Ma et al. 2014]. 8.2.2.4 Classification
Classification methods partition image data based on different image features which can be related to intensity or other image properties besides intensity values. Segmentation results are formed by classified regions with defined labels. The problems of segmentation and classification are interlinked because segmentation implies a classification, while a classifier implicitly segments an image. A set of predefined rules based on known tissue properties or manual expert annotations of the anatomical information is essential to simplify the segmentation task. Classification methods are normally supervised which require manually segmented training images as references for automatic procedure on new images [Kiang et al. 2003].
The κ-nearest-neighbor (κNN) classifier is one of the simplest approaches by ranking the voxels according to the majority vote of the closest training data. It is also regarded as a nonparametric classifier because it makes no underlying assumption about the statistical structure of the data, which is especially suitable for a huge amount of training data [Geva et al. 1991].
The first step of brain MRI segmentation based on image intensities is to apply the κNN classification methods corresponding to the spatial localization of brain structure (classes) as a nonrigidly registered template, to enhance the classification process [Warfield et al. 2000, Svolos et al. 2013]. The segmentation is calculated in an iterative process by interleaving the segmentation refinement with updating the nonrigid alignment to the template. A huge amount of training samples for each tissue class are manually selected for the κNN classifier during the processing procedure. Due to the manual interaction during training phase, the method is not fully automatic and the results depend on the choice of the training set. A better generalization of robust selection of training samples is developed for the κNN classification to realize a fully automatic process of anatomical structures [Cocosco et al. 2003]. However, it does not deal well with the problem of natural intensity variation within each tissue class. And the correction of the bias field during pre-processing is necessary for both methods.
As for the parametric classifiers, one of the most commonly used is called Bayesian classifier which models the probabilistic relationships between the
154
attribute set and the class variables, and subsequently estimates corresponding probability of variables [Wells et al. 1996]. Based on the relationship between posterior probability, prior probability and likelihood of Bayes rule, all the pixel intensities are supposed to be independent samples from a mixture of Gaussian probability distributions in brain MRI segmentation. Samples from each component of the Gaussian mixture are collected as the training data. The Bayesian classifier assigns each pixel of the newly obtained data to the class with the highest posterior probability to continue the classification process [Marroquin et al. 2002].
Different algorithms can be exploited based on Bayesian classifiers to estimate parameters in statistical models. The expectation-maximization (EM) algorithm is a natural generalization of maximum likelihood estimation to the incomplete data case which arises in many computational biology applications that involve probabilistic models [Papaconstadopoulos et al. 2016]. This imaging segmentation method by Bayesian classifiers has been successfully implemented in several software packages such as FAST, FreeSurfer, SPM and 3DSlicer [Zhang et al. 2001, Fischl et al. 2002, Ashburner et al. 2005, Pohl et al. 2006]. Besides the bias correction in the EM framework, various additional improvements have been achieved for ideal segmentation, such as nonrigid alignment of atlas [Ashburner et al. 2005]. By this improvement, neighborhood information is estimated by the statistical model in the form of Markov random field (MRF) [Held et al. 1997, Zhang et al. 2001] or by the Gaussian mixture model (GMM) to produce the α-stable distribution mixture model [Salas-Gonzalez et al. 2013]. The Bayesian framework can also be used to segment particular cerebral anatomy and its neighboring brain structures by the generalization of a PA [Iglesias et al. 2015].
The segmentation of chronic ischemic stroke is generally confused by the remote, asymptomatic, even silent appearance or white matter hyperintensities (WMH) with the heterogeneity within the lesion volume caused by ongoing gliosis or demyelination [Cramer et al. 2006, Vernooij et al. 2007]. Multimodal techniques for image segmentation can be combined to provide more accurate identification of classes in the images of chronic ischemic stroke. An automated Bayesian / MRF segmentation strategy combining with random forest classification was applied to identify ischemic, WM and other secondary lesions in chronic stroke from multimodal MRI including T1WI, T2WI, FLAIR and DWI [Mitra et al. 2014] (Fig.8.6). Random forest is a multitude of single decision trees for classification, regression and other tasks, with each outputs the mode of classes of object from an input vector [Li X. et al. 2009, Azeez et al. 2015].

155
Figure 8.6: Likelihood and random forest probabilistic segmentation of probable ischemic lesion areas. (a) Original FLAIR image, (b) the likelihood of the probable lesion area with heterogeneity in the probabilities (white arrow) and (c) the smoother probabilities by random forest segmentation [Mitra et al. 2014].
For supervised classification methods, the manual interaction task is supposed to be laborious and time-consuming. And the neighborhood information of data is not taken into account which leads to the high sensitivity to noise. Also, by using the same training set for a large number of images will cause bias towards the anatomical and physiological variability between different subjects [Despotovic et al. 2015]. 8.2.2.5 Clustering
Clustering methods are unsupervised segmentation methods that partition an image into clusters of voxels / pixels with similar intensities by self-training on the data instead of using training images. The segmentation and self-training are processed in parallel by iterating between data clustering and estimating the properties of each tissue class. The most commonly used clustering methods are the EM method, the fuzzy C-means (FCM) clustering and the κ-means clustering [Pham et al. 2000, Chuang et al. 2006, Chen Z. et al. 2013].
The EM method usually segments objects by either assigning a class label to a pixel or by estimating the relative amounts of the various tissue types within a pixel [Singh et al. 2004]. The procedure is iterative for the calculation of maximum likelihood or maximum a posteriori (MAP) probability. In brain MRI segmentation, the EM method typically assumes cerebral intensities of different tissues accord with a GMM. Compared with FCM and κ-means methods, EM method is highly sensitive to initialization of some certain parameters instead of training data [Pham et al. 2000].
The first step of EM approach for segmentation is to initialize the EM algorithm [Rohlfing et al. 2003, Lu et al. 2008]. Normally, the GMM is used to initially estimate model parameters followed by the iteration between expectation step (E-step) and maximization step (M-step) until convergence. E-step is to estimate the segmentation of target given the current estimate of
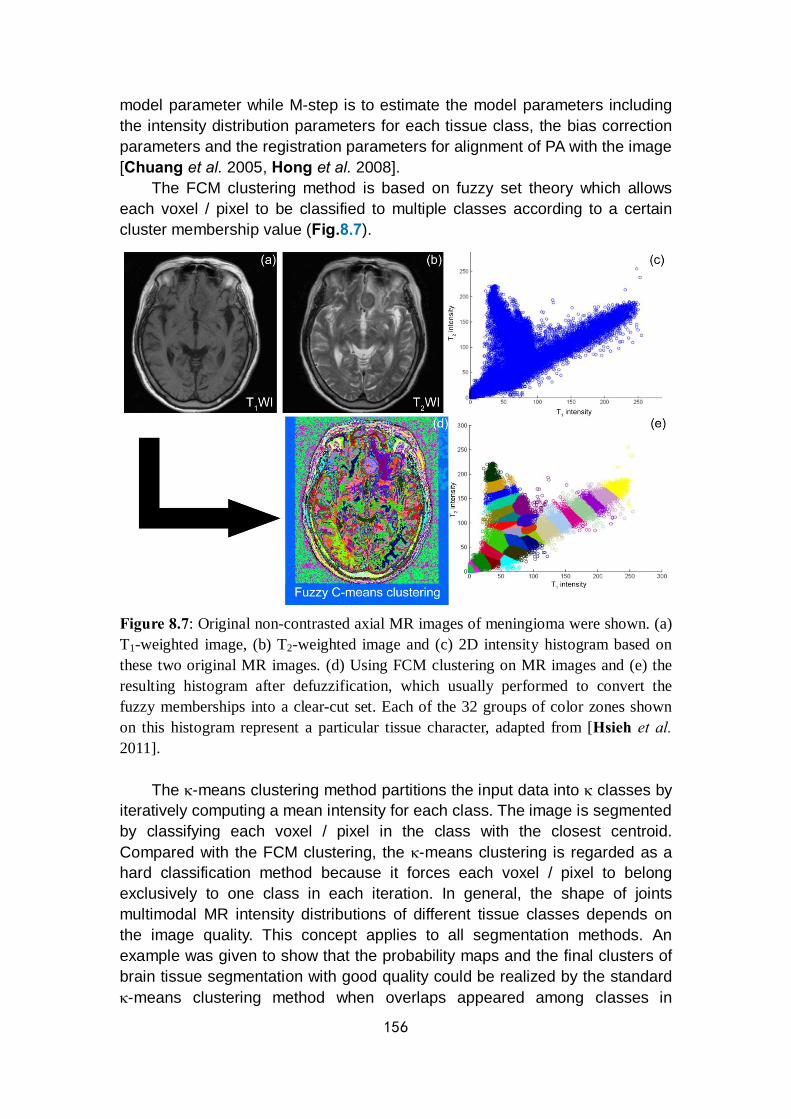
156
model parameter while M-step is to estimate the model parameters including the intensity distribution parameters for each tissue class, the bias correction parameters and the registration parameters for alignment of PA with the image [Chuang et al. 2005, Hong et al. 2008].
The FCM clustering method is based on fuzzy set theory which allows each voxel / pixel to be classified to multiple classes according to a certain cluster membership value (Fig.8.7).
Figure 8.7: Original non-contrasted axial MR images of meningioma were shown. (a) T1-weighted image, (b) T2-weighted image and (c) 2D intensity histogram based on these two original MR images. (d) Using FCM clustering on MR images and (e) the resulting histogram after defuzzification, which usually performed to convert the fuzzy memberships into a clear-cut set. Each of the 32 groups of color zones shown on this histogram represent a particular tissue character, adapted from [Hsieh et al. 2011].
The κ-means clustering method partitions the input data into κ classes by iteratively computing a mean intensity for each class. The image is segmented by classifying each voxel / pixel in the class with the closest centroid. Compared with the FCM clustering, the κ-means clustering is regarded as a hard classification method because it forces each voxel / pixel to belong exclusively to one class in each iteration. In general, the shape of joints multimodal MR intensity distributions of different tissue classes depends on the image quality. This concept applies to all segmentation methods. An example was given to show that the probability maps and the final clusters of brain tissue segmentation with good quality could be realized by the standard κ-means clustering method when overlaps appeared among classes in

157
multimodal MR intensity distributions (Fig.8.8). Under the condition of a significant overlap among tissue classes, the spatial information is required to eliminate the bias of classification [Despotovic et al. 2015].
Figure 8.8: Joint 2D intensity histogram of the multimodal T1W and T2W MRI clustering of the adult brain, which consisted by three overlapped Gaussian distributions. (a) Tissue distribution of GW, WM and CSF on T1W and T2W MRI at horizontal and vertical level with a slight overlap among classes. (b) After the application of the standard κ-means clustering method, the scatter plot of the T1W and T2W tissue intensities represent GM, WM and CSF by red, green and blue lump separately [Despotovic et al. 2015].
For acute ischemic lesion identification and quantification, an automatic segmentation methodology based on unsupervised clustering and spatial clustering on FLAIR images with incorporation of DWI images enabled differentiation between the post-ischemic area and other hyperintense signal areas [Artzi et al. 2013].
The disadvantage of clustering methods is that they are sensitive to noise and intensity heterogeneity due to their initialization without incorporating spatial neighborhood information. Several extensions of the clustering algorithms concern optimization of the neighboring pixels modification, measurement of spatial information and noise filtering have been proposed to improve the clustering performance for images biased by this factor [Ahmed et al. 2002, Chen et al. 2004, Shen et al. 2005, Rivest-Henault et al. 2011].
8.2.3 Artificial neural network
Artificial neural network (ANN) is a parallel distributed processor of
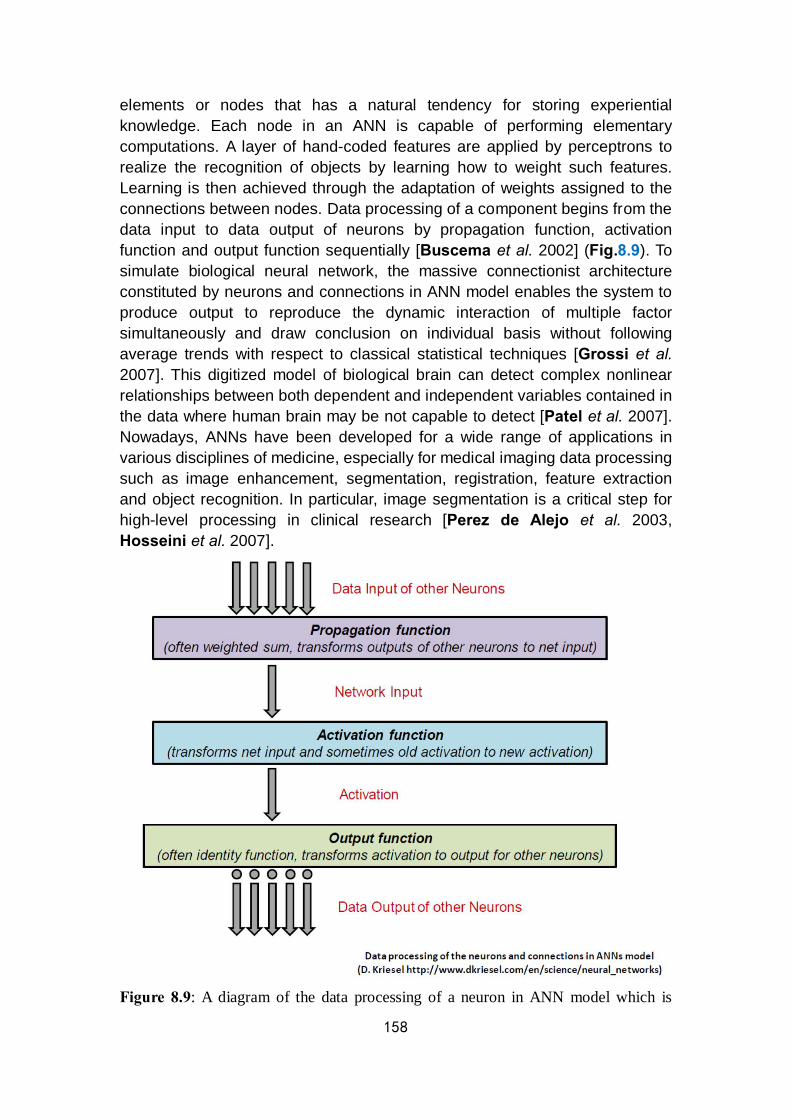
158
elements or nodes that has a natural tendency for storing experiential knowledge. Each node in an ANN is capable of performing elementary computations. A layer of hand-coded features are applied by perceptrons to realize the recognition of objects by learning how to weight such features. Learning is then achieved through the adaptation of weights assigned to the connections between nodes. Data processing of a component begins from the data input to data output of neurons by propagation function, activation function and output function sequentially [Buscema et al. 2002] (Fig.8.9). To simulate biological neural network, the massive connectionist architecture constituted by neurons and connections in ANN model enables the system to produce output to reproduce the dynamic interaction of multiple factor simultaneously and draw conclusion on individual basis without following average trends with respect to classical statistical techniques [Grossi et al. 2007]. This digitized model of biological brain can detect complex nonlinear relationships between both dependent and independent variables contained in the data where human brain may be not capable to detect [Patel et al. 2007]. Nowadays, ANNs have been developed for a wide range of applications in various disciplines of medicine, especially for medical imaging data processing such as image enhancement, segmentation, registration, feature extraction and object recognition. In particular, image segmentation is a critical step for high-level processing in clinical research [Perez de Alejo et al. 2003, Hosseini et al. 2007].
Figure 8.9: A diagram of the data processing of a neuron in ANN model which is
159
available at http://www.dkriesel.com/en/science/neural_networks.
In medical imaging application, data segmentation was determined by classifier and followed by the ANN [Hall et al. 1992]. ANNs can also be used in an unsupervised fashion as a clustering method as well as for deformable models by exploiting imaging data constraints with a priori knowledge about the location, size and shape of anatomical structures [McInerney et al. 1996, Reddick et al. 1997]. Because of the many interconnections used in a neural network, spatial information can be easily incorporated into its classification procedures [Pham et al. 2000]. However, the training data is indispensable for the ANNs. The other major disadvantage is that the simulation by the ANNs usually requires high processing time, especially for large neural networks, so that equipment with high standard configuration is necessary.
The self-organizing map (SOM) is a type of ANN extracted from the learning vector quantization (LVQ) [Torrecilla et al. 2009]. It is able to convert complex, nonlinear statistical relationships between high-dimensional data items into simple geometric relationships on a low-dimensional display using unsupervised learning. However, SOM algorithms are highly dependent on the training data representatives and the initialization of the connection weights. And they have a high consumption of computation if the dimensions of the data increases [Rajchl et al. 2015].
8.2.4 Surface-based methods
The deformable models based on the surface-based methods provide active contours and surfaces for brain MRI segmentation. Deformable models are physically motivated, model-based techniques for detecting region boundaries by using closed parametric curves or surfaces that deform under the influence of internal and external forces. To delineate a boundary on the object of interest, a closed curve or surface must be placed near the desired boundary first and then be allowed to undergo an iterative relaxation process. Internal forces are computed from within the curve or surface to keep it smooth throughout the deformation. External forces are usually derived from the image to drive the curve or surface toward the desired feature of interest [Pham et al. 2000]. The contour deforms to minimize the contour energy that includes the internal energy from the contour and the external energy from the image by the snake model, an original deformable model. Improvements such as snake variations and level set on deformable contour method have been proposed for image segmentation to obtain a better convergence [Xu et al. 1998, Verma et al. 2012].
Volumetric images revealing the location and amount of brain shift can be taken intra-operatively during the neurosurgery. However, surgical constraints limit both the time per acquisition as well as prevent the application of

160
multi-modality imaging. The reliability of the resulting volumetric calculation is dependent on the accuracy of the brain surface detection which could be contributed by an ideal surface-based method and provide a weighted result of 3D point corresponding estimation and surface deformation constraints [DeLorenzo et al. 2006] (Fig.8.10). In a recent publication, a new non-rigid registration method that integrates surface and sulci feature to noninvasively track the brain surface has been proposed. Measured brain surfaces were acquired using phase-shift 3D shape measurement, which offers 2D image pixels and their corresponding 3D points directly. The corresponding feature-concerned points between intraoperative brain surfaces were estimated by a designed algorithm and subsequently led to a smooth surface deformation and local surface details. The advantages of this surface-based method are the integration of vessels or sulci features, robustness in dealing with dissociation in variable deformation magnitude and features and feasibility in compensating for brain shift in image-guided neurosurgeries [Jiang et al. 2016].
Figure 8.10: The extracted preoperative brain surface and the 3D point locations selected during surgery for validation. The 3D manually-selected preoperative definition of sulci location smoothed extracted surface and intraoperative stereo images with outlined sulci were inputs to the surface detection algorithm. (a) The extracted 3D brain surface (the craniotomy area labeled in red curve), (b) The initial (black arrow) and final (white arrow) brain surface positions by 3D points were acquired in the operation room for algorithm validation and (c, d) Intraoperative
161
images acquired approximately 3 h after surgery by stereo camera. The sulci used as the feature information are outlined (white lines), adapted from [DeLorenzo et al. 2006].
The benefits of deformable models in cerebral cortical MRI segmentation are that they are capable of generating closed parametric curves or surfaces from images and incorporating a smoothness constraint that provides robustness to noise and spurious edges. On the other side, deformable models require manual interaction to place an initial model and choose appropriate parameters. Poor convergence to concave boundaries exhibited by standard deformable models can be alleviated through the use of topological model which uses an implicit representation, pressure force and other modified external-force models [Terzopoulos et al. 1997, Xu et al. 1998].
8.2.5 Hybrid segmentation methods
Technological development of brain MRI segmentation is continuously explored but each of them has particular advantages and drawbacks. Since a selection of the most appropriate technique for a given application is often a difficult task, a combination of multiple techniques may be necessary to obtain the segmentation goal. Therefore, hybrid or combined segmentation methods have been used extensively in different brain MRI segmentation applications [Li B. N. et al. 2011]. The main idea is to combine different complementary segmentation methods into a hybrid approach to avoid many individual disadvantages and improve segmentation accuracy.
Definitely, to segment images of adult healthy brain, the effect can be reinforced by using multiple MR contrasts. As for the computational segmentation techniques, EM method combined with binary mathematical morphology and active contours models once were applied on 2D MRI to realize it [Kapur et al. 1996]. Brain lesions with different sizes, locations and textures were detected and delineated by an automated procedure with the combination of outliers detection and fuzzy clustering from single T1 images [Seghier et al. 2008] (Fig.8.11). For segmenting tumor lesions, edema, cysts, necrosis and normal tissue in T2 and FLAIR MRI, a hybrid MRI segmentation method was developed on ANN [Vijayakumar et al. 2011]. Furthermore, a combination of model-based region growing and spectrum information was applied in blood vessels segmentation [Jiang et al. 2013]. Hybrid segmentation methods are also used for the neonatal brain segmentation. Brain volume or anatomical regions in neonates can be segmented by the combination of thresholding, active contours, FCM clustering and morphological operations [Despotovic et al. 2010, Gui et al. 2012].
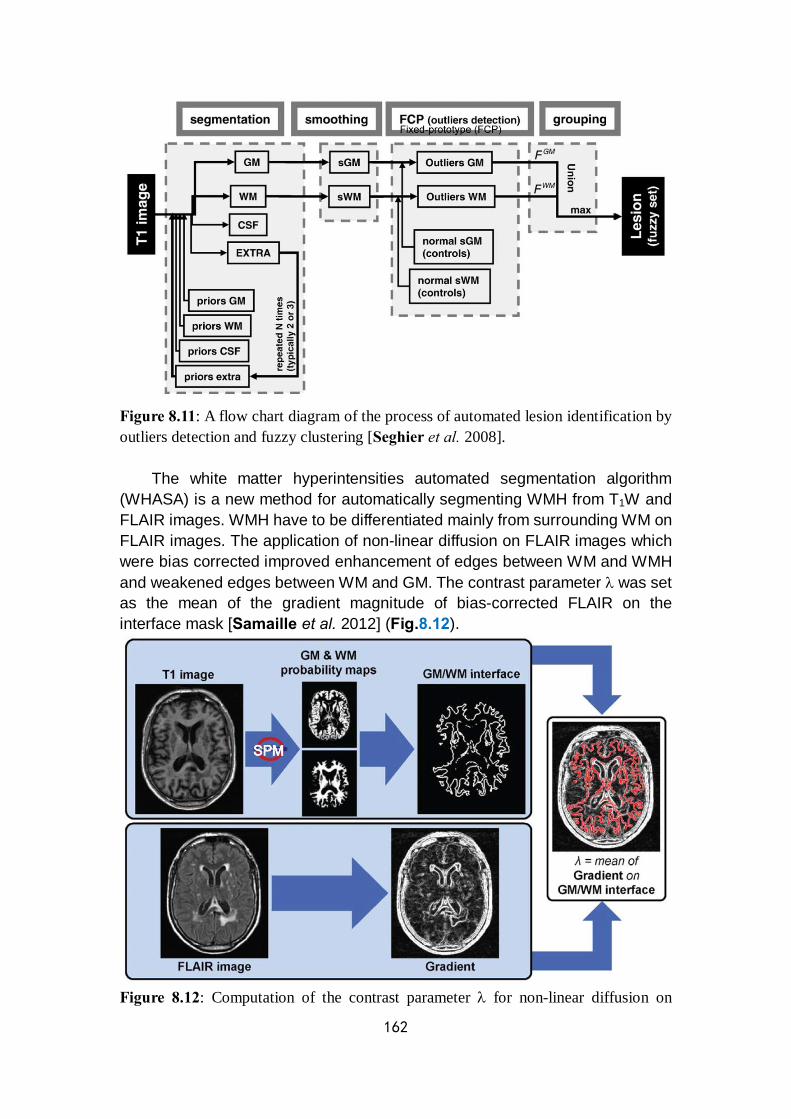
162
Figure 8.11: A flow chart diagram of the process of automated lesion identification by outliers detection and fuzzy clustering [Seghier et al. 2008].
The white matter hyperintensities automated segmentation algorithm (WHASA) is a new method for automatically segmenting WMH from T1W and FLAIR images. WMH have to be differentiated mainly from surrounding WM on FLAIR images. The application of non-linear diffusion on FLAIR images which were bias corrected improved enhancement of edges between WM and WMH and weakened edges between WM and GM. The contrast parameter λ was set as the mean of the gradient magnitude of bias-corrected FLAIR on the interface mask [Samaille et al. 2012] (Fig.8.12).
Figure 8.12: Computation of the contrast parameter λ for non-linear diffusion on
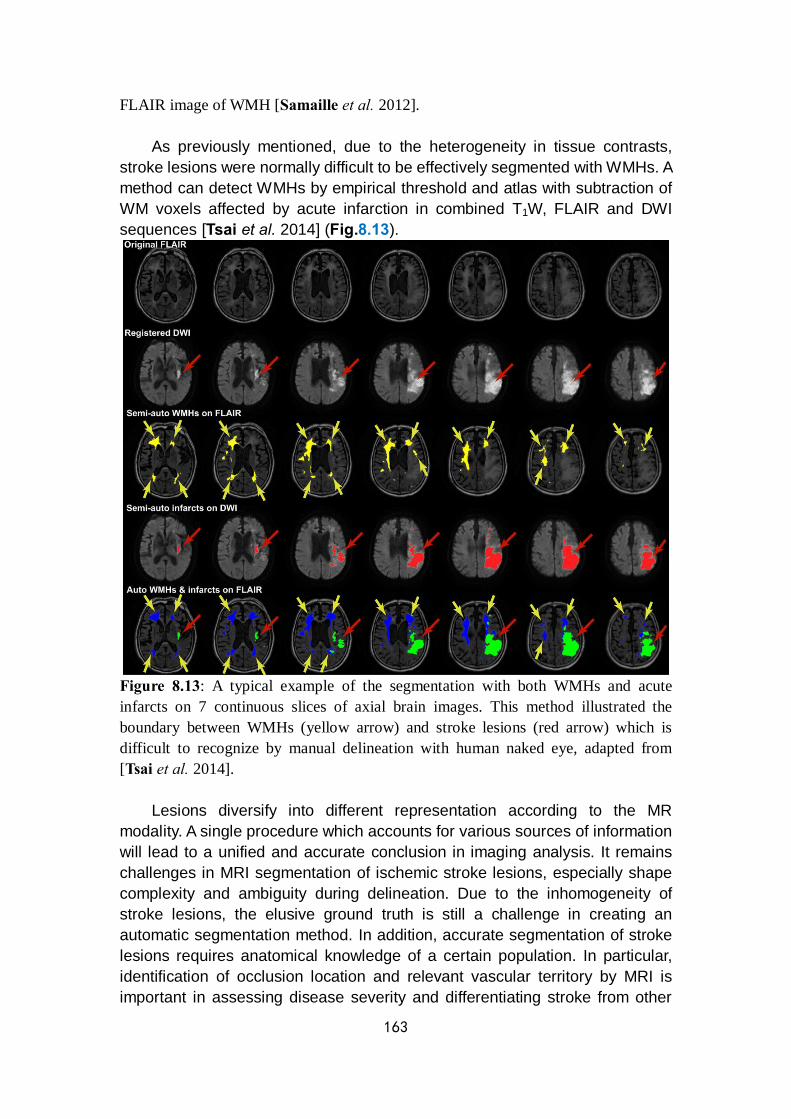
163
FLAIR image of WMH [Samaille et al. 2012].
As previously mentioned, due to the heterogeneity in tissue contrasts, stroke lesions were normally difficult to be effectively segmented with WMHs. A method can detect WMHs by empirical threshold and atlas with subtraction of WM voxels affected by acute infarction in combined T1W, FLAIR and DWI sequences [Tsai et al. 2014] (Fig.8.13).
Figure 8.13: A typical example of the segmentation with both WMHs and acute infarcts on 7 continuous slices of axial brain images. This method illustrated the boundary between WMHs (yellow arrow) and stroke lesions (red arrow) which is difficult to recognize by manual delineation with human naked eye, adapted from [Tsai et al. 2014].
Lesions diversify into different representation according to the MR modality. A single procedure which accounts for various sources of information will lead to a unified and accurate conclusion in imaging analysis. It remains challenges in MRI segmentation of ischemic stroke lesions, especially shape complexity and ambiguity during delineation. Due to the inhomogeneity of stroke lesions, the elusive ground truth is still a challenge in creating an automatic segmentation method. In addition, accurate segmentation of stroke lesions requires anatomical knowledge of a certain population. In particular, identification of occlusion location and relevant vascular territory by MRI is important in assessing disease severity and differentiating stroke from other
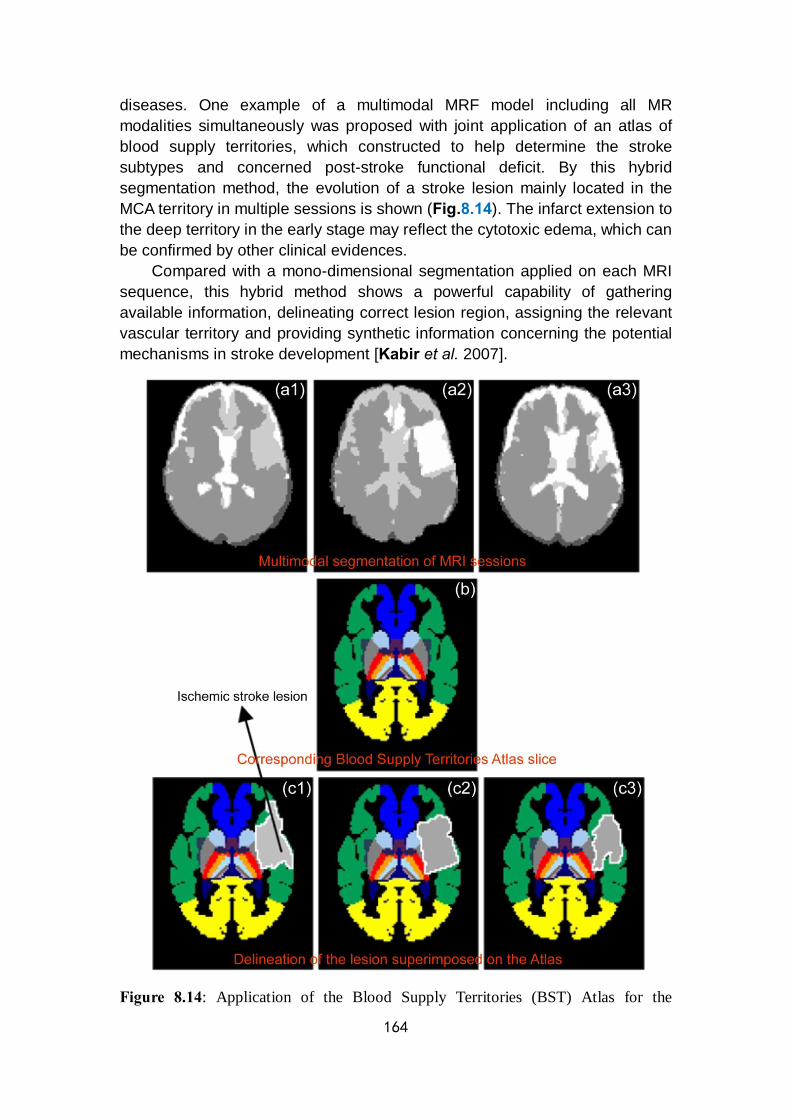
164
diseases. One example of a multimodal MRF model including all MR modalities simultaneously was proposed with joint application of an atlas of blood supply territories, which constructed to help determine the stroke subtypes and concerned post-stroke functional deficit. By this hybrid segmentation method, the evolution of a stroke lesion mainly located in the MCA territory in multiple sessions is shown (Fig.8.14). The infarct extension to the deep territory in the early stage may reflect the cytotoxic edema, which can be confirmed by other clinical evidences.
Compared with a mono-dimensional segmentation applied on each MRI sequence, this hybrid method shows a powerful capability of gathering available information, delineating correct lesion region, assigning the relevant vascular territory and providing synthetic information concerning the potential mechanisms in stroke development [Kabir et al. 2007].
Figure 8.14: Application of the Blood Supply Territories (BST) Atlas for the
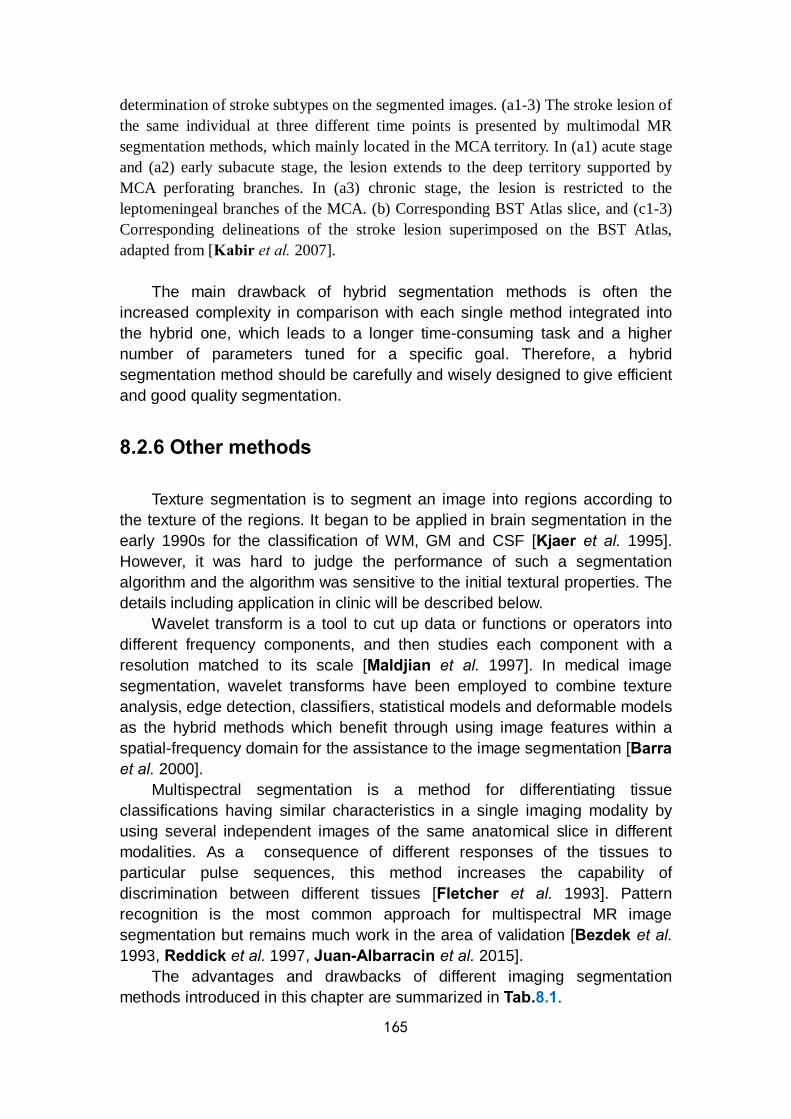
165
determination of stroke subtypes on the segmented images. (a1-3) The stroke lesion of the same individual at three different time points is presented by multimodal MR segmentation methods, which mainly located in the MCA territory. In (a1) acute stage and (a2) early subacute stage, the lesion extends to the deep territory supported by MCA perforating branches. In (a3) chronic stage, the lesion is restricted to the leptomeningeal branches of the MCA. (b) Corresponding BST Atlas slice, and (c1-3) Corresponding delineations of the stroke lesion superimposed on the BST Atlas, adapted from [Kabir et al. 2007].
The main drawback of hybrid segmentation methods is often the increased complexity in comparison with each single method integrated into the hybrid one, which leads to a longer time-consuming task and a higher number of parameters tuned for a specific goal. Therefore, a hybrid segmentation method should be carefully and wisely designed to give efficient and good quality segmentation.
8.2.6 Other methods
Texture segmentation is to segment an image into regions according to the texture of the regions. It began to be applied in brain segmentation in the early 1990s for the classification of WM, GM and CSF [Kjaer et al. 1995]. However, it was hard to judge the performance of such a segmentation algorithm and the algorithm was sensitive to the initial textural properties. The details including application in clinic will be described below.
Wavelet transform is a tool to cut up data or functions or operators into different frequency components, and then studies each component with a resolution matched to its scale [Maldjian et al. 1997]. In medical image segmentation, wavelet transforms have been employed to combine texture analysis, edge detection, classifiers, statistical models and deformable models as the hybrid methods which benefit through using image features within a spatial-frequency domain for the assistance to the image segmentation [Barra et al. 2000].
Multispectral segmentation is a method for differentiating tissue classifications having similar characteristics in a single imaging modality by using several independent images of the same anatomical slice in different modalities. As a consequence of different responses of the tissues to particular pulse sequences, this method increases the capability of discrimination between different tissues [Fletcher et al. 1993]. Pattern recognition is the most common approach for multispectral MR image segmentation but remains much work in the area of validation [Bezdek et al. 1993, Reddick et al. 1997, Juan-Albarracin et al. 2015].
The advantages and drawbacks of different imaging segmentation methods introduced in this chapter are summarized in Tab.8.1.
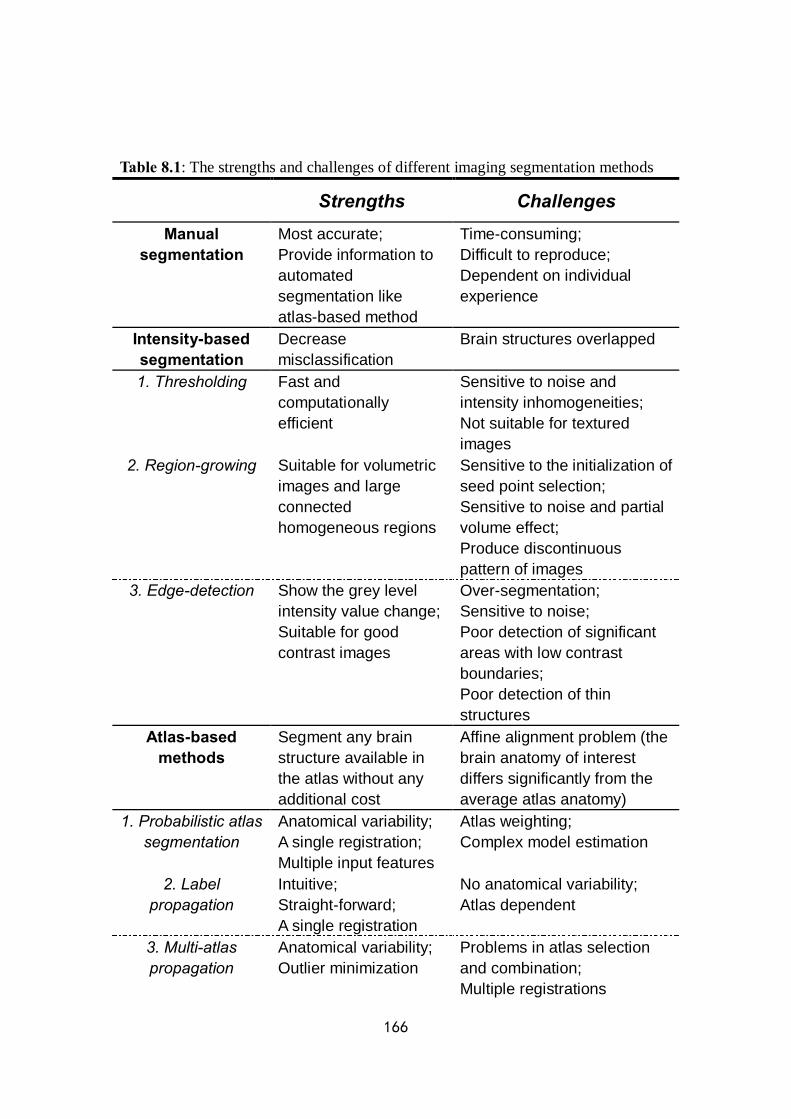
166
Table 8.1: The strengths and challenges of different imaging segmentation methods Strengths Challenges
Manual segmentation
Most accurate; Provide information to automated segmentation like atlas-based method
Time-consuming; Difficult to reproduce; Dependent on individual experience
Intensity-based segmentation
Decrease misclassification
Brain structures overlapped
1. Thresholding Fast and computationally efficient
Sensitive to noise and intensity inhomogeneities; Not suitable for textured images
2. Region-growing Suitable for volumetric images and large connected homogeneous regions
Sensitive to the initialization of seed point selection; Sensitive to noise and partial volume effect; Produce discontinuous pattern of images
3. Edge-detection Show the grey level intensity value change; Suitable for good contrast images
Over-segmentation; Sensitive to noise; Poor detection of significant areas with low contrast boundaries; Poor detection of thin structures
Atlas-based methods
Segment any brain structure available in the atlas without any additional cost
Affine alignment problem (the brain anatomy of interest differs significantly from the average atlas anatomy)
1. Probabilistic atlas segmentation
Anatomical variability; A single registration; Multiple input features
Atlas weighting; Complex model estimation
2. Label propagation
Intuitive; Straight-forward; A single registration
No anatomical variability; Atlas dependent
3. Multi-atlas propagation
Anatomical variability; Outlier minimization
Problems in atlas selection and combination; Multiple registrations
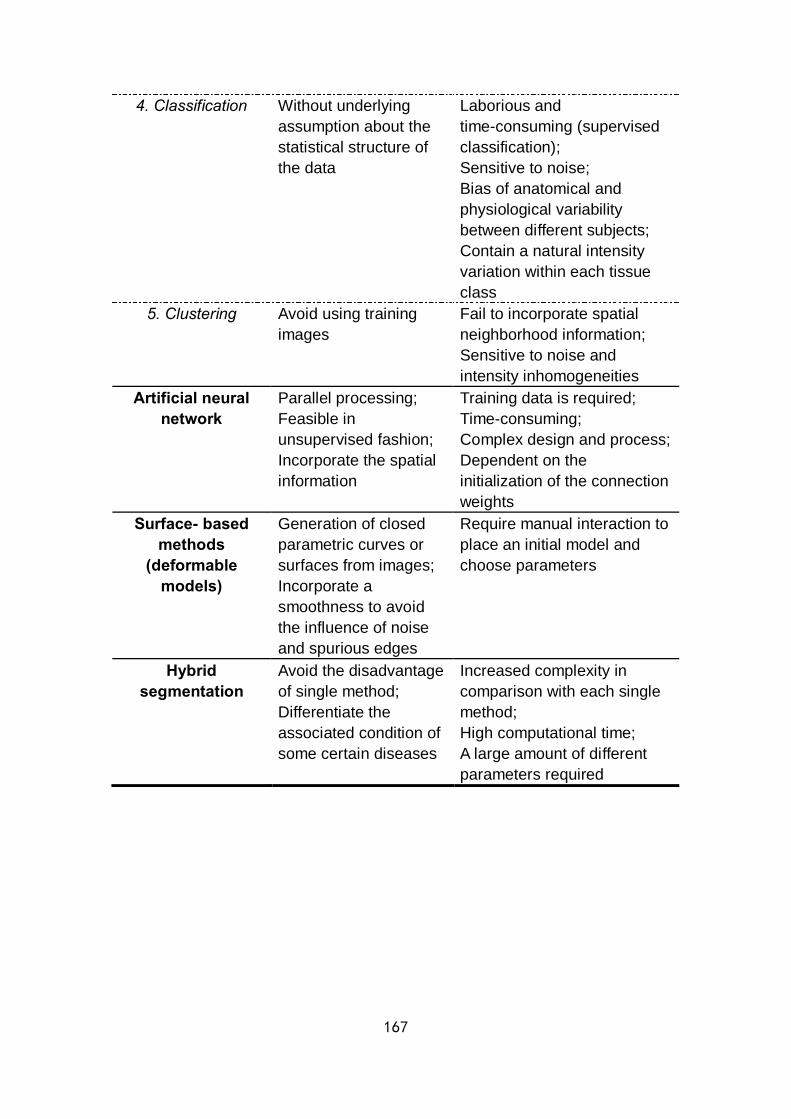
167
4. Classification Without underlying assumption about the statistical structure of the data
Laborious and time-consuming (supervised classification); Sensitive to noise; Bias of anatomical and physiological variability between different subjects; Contain a natural intensity variation within each tissue class
5. Clustering Avoid using training images
Fail to incorporate spatial neighborhood information; Sensitive to noise and intensity inhomogeneities
Artificial neural network
Parallel processing; Feasible in unsupervised fashion; Incorporate the spatial information
Training data is required; Time-consuming; Complex design and process; Dependent on the initialization of the connection weights
Surface- based methods
(deformable models)
Generation of closed parametric curves or surfaces from images; Incorporate a smoothness to avoid the influence of noise and spurious edges
Require manual interaction to place an initial model and choose parameters
Hybrid segmentation
Avoid the disadvantage of single method; Differentiate the associated condition of some certain diseases
Increased complexity in comparison with each single method; High computational time; A large amount of different parameters required

168
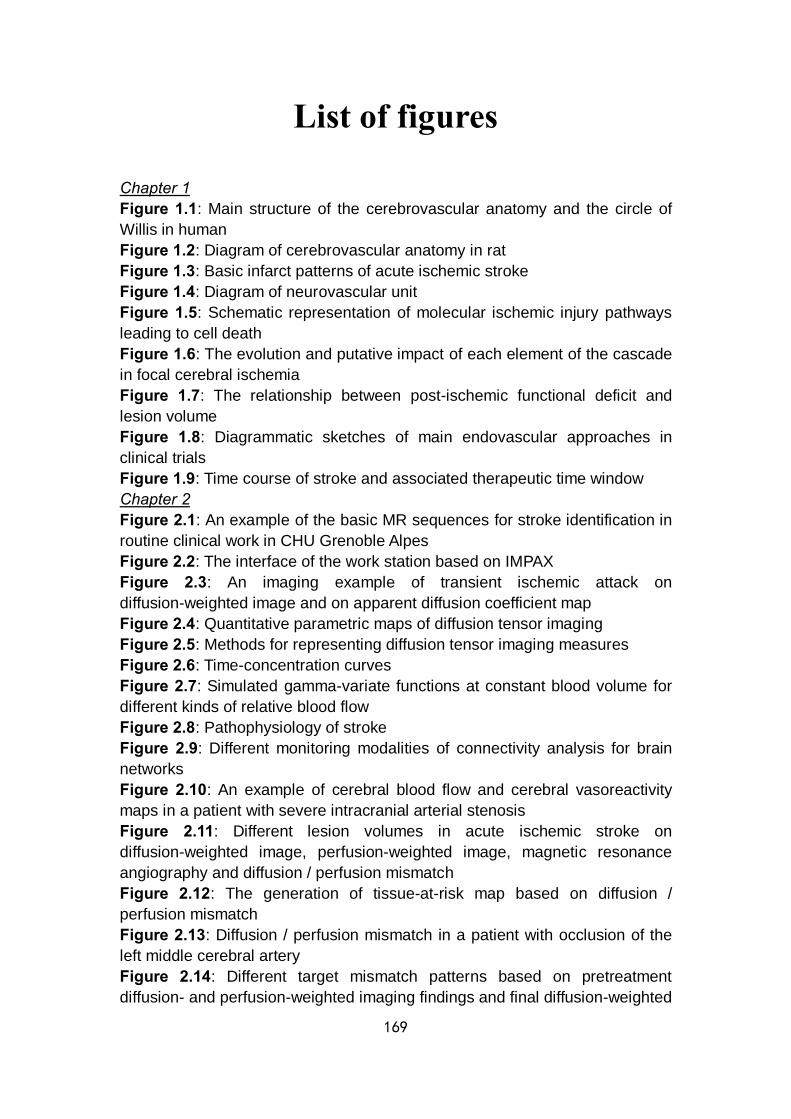
169
List of figures
Chapter 1 Figure 1.1: Main structure of the cerebrovascular anatomy and the circle of Willis in human Figure 1.2: Diagram of cerebrovascular anatomy in rat Figure 1.3: Basic infarct patterns of acute ischemic stroke Figure 1.4: Diagram of neurovascular unit Figure 1.5: Schematic representation of molecular ischemic injury pathways leading to cell death Figure 1.6: The evolution and putative impact of each element of the cascade in focal cerebral ischemia Figure 1.7: The relationship between post-ischemic functional deficit and lesion volume Figure 1.8: Diagrammatic sketches of main endovascular approaches in clinical trials Figure 1.9: Time course of stroke and associated therapeutic time window Chapter 2 Figure 2.1: An example of the basic MR sequences for stroke identification in routine clinical work in CHU Grenoble Alpes Figure 2.2: The interface of the work station based on IMPAX Figure 2.3: An imaging example of transient ischemic attack on diffusion-weighted image and on apparent diffusion coefficient map Figure 2.4: Quantitative parametric maps of diffusion tensor imaging Figure 2.5: Methods for representing diffusion tensor imaging measures Figure 2.6: Time-concentration curves Figure 2.7: Simulated gamma-variate functions at constant blood volume for different kinds of relative blood flow Figure 2.8: Pathophysiology of stroke Figure 2.9: Different monitoring modalities of connectivity analysis for brain networks Figure 2.10: An example of cerebral blood flow and cerebral vasoreactivity maps in a patient with severe intracranial arterial stenosis Figure 2.11: Different lesion volumes in acute ischemic stroke on diffusion-weighted image, perfusion-weighted image, magnetic resonance angiography and diffusion / perfusion mismatch Figure 2.12: The generation of tissue-at-risk map based on diffusion / perfusion mismatch Figure 2.13: Diffusion / perfusion mismatch in a patient with occlusion of the left middle cerebral artery Figure 2.14: Different target mismatch patterns based on pretreatment diffusion- and perfusion-weighted imaging findings and final diffusion-weighted

170
imaging findings Figure 2.15: A classical combined application of MRI protocols for a hyperacute middle cerebral artery occlusion in the right hemisphere Figure 2.16: An example of a small intracerebral hemorrhage lesion in left basal ganglia on diffusion-weighted image and T2*-weighted image Chapter 3 Figure 3.1: An example of histogram analysis of a recurrent glioblastoma case Figure 3.2: Texture analysis flowchart in preclinical stroke research Figure 3.3: Application of functional diffusion map approach for progressive disease, stable disease and partial response in patients with glioblastoma Figure 3.4: Application of parametric response map approach for pseudoprogression and progressive disease in patients with high-grade glioma Figure 3.5: Application of parametric response map approach in various diseases beside brain tumor Chapter 5 Figure 5.1: A schematic representation of the dynamic biological processes supposed to be involved in post-treatment apparent diffusion coefficient changes in ischemic stroke along with a corresponding chromatic description of metrics by parametric response map Figure 5.2: Expression of angiogenic factors following the intravenous injection of phosphate-buffered saline-glutamine and human mesenchymal stem cells in rats with middle cerebral artery occlusion Figure 5.3: Study design and analysis process of parametric response map in our preclinical research Figure 5.4: In vivo MRI estimated parameters by whole-lesion mean approach Figure 5.5: Parametric response map color-coded overlays on apparent diffusion coefficient, cerebral blood volume and vessel size index maps for two animals of treated and untreated groups Figure 5.6: Parametric response map color-coded overlays on apparent diffusion coefficient maps for two rats of treated and untreated groups at Day 9 (one day after injection) Figure 5.7: Parametric response map color-coded overlays on cerebral blood volume maps for two rats of treated and untreated groups at Day 9 (one day after injection) Figure 5.8: Parametric response map color-coded overlays on vessel size index maps for two rats of treated and untreated groups at Day 9 (one day after injection) Figure 5.9: Histogram of the percent changes of parametric response map on apparent diffusion coefficient values Figure 5.10: Histogram of the percent changes of parametric response map on cerebral blood volume values Figure 5.11: Histogram of the percent changes of parametric response map on vessel size index values Chapter 6
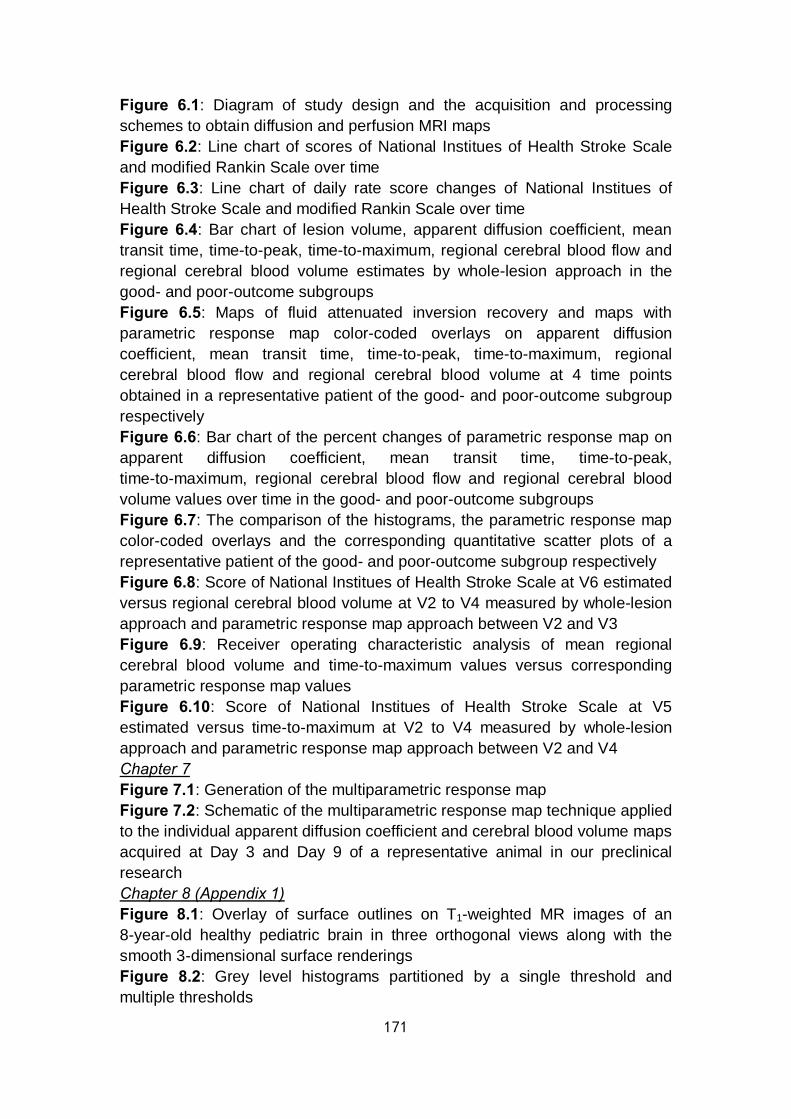
171
Figure 6.1: Diagram of study design and the acquisition and processing schemes to obtain diffusion and perfusion MRI maps Figure 6.2: Line chart of scores of National Institues of Health Stroke Scale and modified Rankin Scale over time Figure 6.3: Line chart of daily rate score changes of National Institues of Health Stroke Scale and modified Rankin Scale over time Figure 6.4: Bar chart of lesion volume, apparent diffusion coefficient, mean transit time, time-to-peak, time-to-maximum, regional cerebral blood flow and regional cerebral blood volume estimates by whole-lesion approach in the good- and poor-outcome subgroups Figure 6.5: Maps of fluid attenuated inversion recovery and maps with parametric response map color-coded overlays on apparent diffusion coefficient, mean transit time, time-to-peak, time-to-maximum, regional cerebral blood flow and regional cerebral blood volume at 4 time points obtained in a representative patient of the good- and poor-outcome subgroup respectively Figure 6.6: Bar chart of the percent changes of parametric response map on apparent diffusion coefficient, mean transit time, time-to-peak, time-to-maximum, regional cerebral blood flow and regional cerebral blood volume values over time in the good- and poor-outcome subgroups Figure 6.7: The comparison of the histograms, the parametric response map color-coded overlays and the corresponding quantitative scatter plots of a representative patient of the good- and poor-outcome subgroup respectively Figure 6.8: Score of National Institues of Health Stroke Scale at V6 estimated versus regional cerebral blood volume at V2 to V4 measured by whole-lesion approach and parametric response map approach between V2 and V3 Figure 6.9: Receiver operating characteristic analysis of mean regional cerebral blood volume and time-to-maximum values versus corresponding parametric response map values Figure 6.10: Score of National Institues of Health Stroke Scale at V5 estimated versus time-to-maximum at V2 to V4 measured by whole-lesion approach and parametric response map approach between V2 and V4 Chapter 7 Figure 7.1: Generation of the multiparametric response map Figure 7.2: Schematic of the multiparametric response map technique applied to the individual apparent diffusion coefficient and cerebral blood volume maps acquired at Day 3 and Day 9 of a representative animal in our preclinical research Chapter 8 (Appendix 1) Figure 8.1: Overlay of surface outlines on T1-weighted MR images of an 8-year-old healthy pediatric brain in three orthogonal views along with the smooth 3-dimensional surface renderings Figure 8.2: Grey level histograms partitioned by a single threshold and multiple thresholds
172
Figure 8.3: An example of MRI segmentation by region growing in brain tumor Figure 8.4: A schematic representation of the atlas-based segmentation of brain structure, healthy tissue, abnormal tissue and lesions of multiple sclerosis Figure 8.5: Sample images comparing the parcellation result of multi-atlas propagation segmentation method and the single-atlas based method Figure 8.6: Likelihood and random forest probabilistic segmentation of probable ischemic lesion areas Figure 8.7: Application of fuzzy C-means clustering on non-contrasted axial T1-weighted and T2-weighted MR images of meningioma Figure 8.8: Joint 2-dimensional intensity histogram of the multimodal T1-weighted and T2-weighted MRI clustering of the adult brain, which consisted by three overlapped Gaussian distributions Figure 8.9: A diagram of the data processing of a neuron in artificial neural network model Figure 8.10: The extracted preoperative brain surface and the 3-dimensional point locations selected during surgery for validation Figure 8.11: A flowchart diagram of the process of automated lesion identification by outliers detection and fuzzy clustering Figure 8.12: Computation of the contrast parameter λ for non-linear diffusion on fluid attenuated inversion recovery image of white matter hyperintensities Figure 8.13: A typical example of the segmentation with both white matter hyperintensities and acute infarcts on continuous slices of axial fluid attenuated inversion recovery and diffusion-weighted images Figure 8.14: Application of the Blood Supply Territories Atlas for the determination of stroke subtypes on the segmented images
173
List of tables
Chapter 1 Table 1.1: The list of references concerning representative neuroprotective trials for ischemic stroke based on different mechanisms Chapter 2 Table 2.1: Summary of differences between mean diffusivity and fractional anisotropy Table 2.2: Summary of conventional MRI techniques for stroke Table 2.3: Summary of multiparametric MRI application for stroke Chapter 3 Table 3.1: The strengths and challenges of different imaging analysis methods Chapter 5 Table 5.1: Quantitative measures of whole-lesion mean approach and parametric response map approach between treated and untreated groups of rats with middle cerebral artery occlusion Chapter 6 Table 6.1: Clinical information of 30 chronic stroke patients with individual estimates of National Institues of Health Stroke Scale and modified Rankin Scale of each monitoring time point Table 6.2: Estimates of lesion volume, apparent diffusion coefficient, mean transit time, time-to-peak, time-to-maximum, regional cerebral blood flow and regional cerebral blood volume obtained from 4 time points by whole-lesion approach Table 6.3: Estimates of lesion volume, apparent diffusion coefficient, mean transit time, time-to-peak, time-to-maximum, regional cerebral blood flow and regional cerebral blood volume obtained from the comparison between the baseline and each other time point by parametric response map approach Table 6.4: Positive results of correlation analysis between imaging parameters analyzed by both whole-lesion approach and parametric response map approach and outcome measures at each corresponding time point Chapter 8 (Appendix 1) Table 8.1: The strengths and challenges of different imaging segmentation methods

174
L’accident vasculaire cérébral (AVC) est la principale cause de handicap acquis chez l’adulte. Seul 30% des patients récupèrent favorablement après un AVC. De la phase aigüe à la phase tardive, le pronostic après un accident vasculaire ischémique dépend de nombreux facteurs. Lors d’essais cliniques, les échelles « National Institutes of Health Stroke Scale » (NIHSS) et / ou « modified Rankin Scale » (mRS) sont les outils les plus communément utilisés pour caractériser l’impact de l’AVC sur le patient. Ces échelles sont aujourd’hui considérées comme des prédicteurs objectifs de l’état final du patient après un AVC.
Au-delà de la courte fenêtre d’intervention (thrombolyse, thrombectomie), de nombreuses études rapportent le potentiel des biothérapies pour favoriser la plasticité et la réparation neuronale après un AVC. Parmi ces thérapies, les thérapies cellulaires employant des cellules souches semblent très prometteuses. En effet, plusieurs études montrent qu’une greffe de cellules souches favorise la récupération fonctionnelle dans des modèles animaux d’AVC. Chez l’homme, la faisabilité des thérapies cellules est acquise et des résultats prometteurs ont été obtenus.
Pour caractériser de façon non-invasive les effets à court et long terme de ces thérapies cellulaires, il est nécessaire de développer de nouvelles approches d’imagerie. L’imagerie par résonance magnétique (IRM) multiparamétrique pourrait être un indicateur intéressant de la réponse thérapeutique ou de la récupération spontanée. En particulier, l’IRM multiparamétrique pourrait permettre d’orienter le traitement et de mieux trier les patients en vue d’une thérapie par cellules souches. Pour évaluer ce potentiel, il convient d’évaluer la corrélation entre les informations issues de l’imagerie et les échelles cliniques qui évaluent l’état final du patient.
En routine clinique, l’imagerie de diffusion (DWI) et l’imagerie de perfusion (PWI) sont devenues la référence pour évaluer l’AVC à la phase aigüe. L’imagerie DWI mesure le mouvement Brownien des protons de l’eau dans le tissu et est sensible à l’œdème qui se forme au tout début de l’AVC. Le coefficient apparent de diffusion (ADC) fourni des informations quantitatives que l’on peut relier au type d’œdème (cytotoxique ou vasogénique) et qui dépend de la durée et de la sévérité de l’AVC. L’imagerie PWI met en évidence la sévérité et l’étendue du déficit de perfusion, des déterminants majeurs de l’état final du patient. En cas d’incertitude sur le moment de survenue de l’AVC, le niveau déficit de perfusion peut aider à orienter la stratégie thérapeutique. L’approche classique pour mesurer la perfusion est l’approche de premier passage (dynamic susceptibility contrast, DSC), qui repose sur l’injection intraveineuse d’un produit de contraste. L’obtention de données quantitative repose sur l’identification d’une fonction d’entrée artérielle et introduit une certaine variabilité dans les résultats.
L’analyse de cartes paramétriques IRM obtenues à la phase précoce et sur l’ensemble d’une lésion ne montre pas nécessairement de bonnes corrélations avec le devenir du patient. Une cause probable de cette absence de corrélation est le fait que l’on néglige l’hétérogénéité de la lésion ischémique. En effet, les hétérogénéités spatiale et temporelle des lésions sont très probablement des facteurs importants dans l’évolution de la lésion et donc dans l’évaluation de stratégies thérapeutiques. Prendre en compte cette hétérogénéité reste un défi pour l’analyse de données d’imagerie.
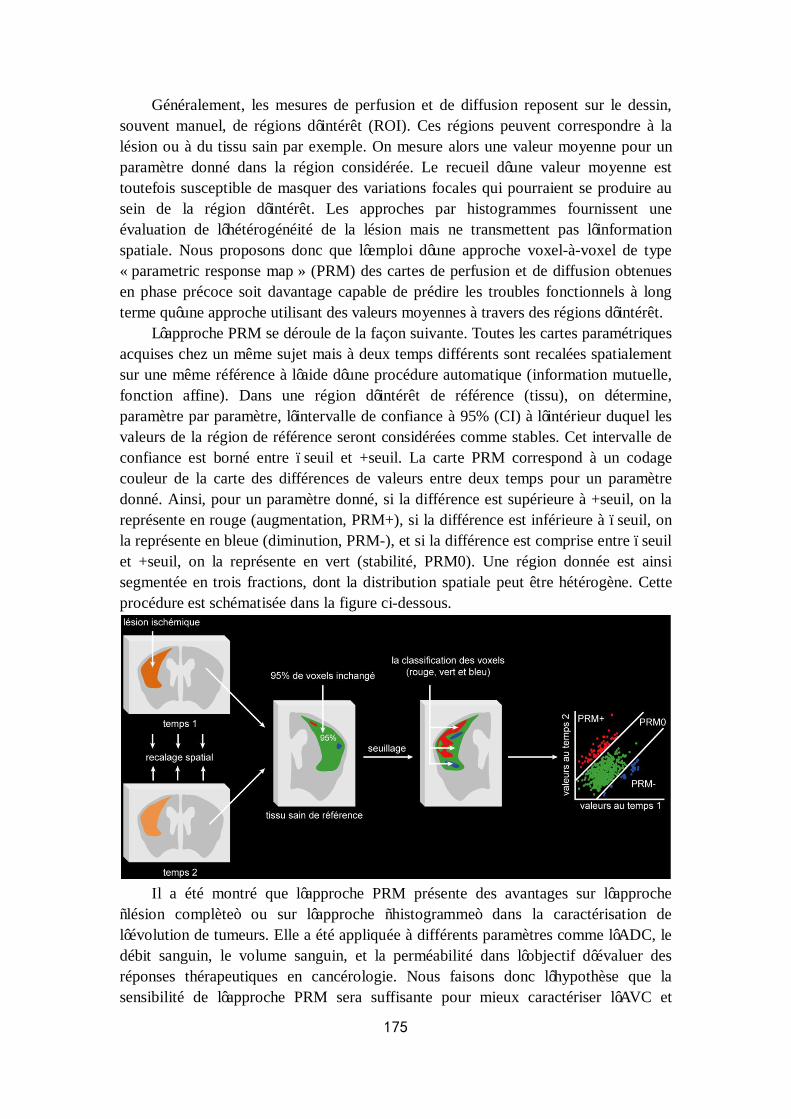
175
Généralement, les mesures de perfusion et de diffusion reposent sur le dessin, souvent manuel, de régions d’intérêt (ROI). Ces régions peuvent correspondre à la lésion ou à du tissu sain par exemple. On mesure alors une valeur moyenne pour un paramètre donné dans la région considérée. Le recueil d’une valeur moyenne est toutefois susceptible de masquer des variations focales qui pourraient se produire au sein de la région d’intérêt. Les approches par histogrammes fournissent une évaluation de l’hétérogénéité de la lésion mais ne transmettent pas l’information spatiale. Nous proposons donc que l’emploi d’une approche voxel-à-voxel de type « parametric response map » (PRM) des cartes de perfusion et de diffusion obtenues en phase précoce soit davantage capable de prédire les troubles fonctionnels à long terme qu’une approche utilisant des valeurs moyennes à travers des régions d’intérêt.
L’approche PRM se déroule de la façon suivante. Toutes les cartes paramétriques acquises chez un même sujet mais à deux temps différents sont recalées spatialement sur une même référence à l’aide d’une procédure automatique (information mutuelle, fonction affine). Dans une région d’intérêt de référence (tissu), on détermine, paramètre par paramètre, l’intervalle de confiance à 95% (CI) à l’intérieur duquel les valeurs de la région de référence seront considérées comme stables. Cet intervalle de confiance est borné entre –seuil et +seuil. La carte PRM correspond à un codage couleur de la carte des différences de valeurs entre deux temps pour un paramètre donné. Ainsi, pour un paramètre donné, si la différence est supérieure à +seuil, on la représente en rouge (augmentation, PRM+), si la différence est inférieure à –seuil, on la représente en bleue (diminution, PRM-), et si la différence est comprise entre –seuil et +seuil, on la représente en vert (stabilité, PRM0). Une région donnée est ainsi segmentée en trois fractions, dont la distribution spatiale peut être hétérogène. Cette procédure est schématisée dans la figure ci-dessous.
Il a été montré que l’approche PRM présente des avantages sur l’approche
“lésion complète” ou sur l’approche “histogramme” dans la caractérisation de l’évolution de tumeurs. Elle a été appliquée à différents paramètres comme l’ADC, le débit sanguin, le volume sanguin, et la perméabilité dans l’objectif d’évaluer des réponses thérapeutiques en cancérologie. Nous faisons donc l’hypothèse que la sensibilité de l’approche PRM sera suffisante pour mieux caractériser l’AVC et
176
notamment l’hétérogénéité des lésions ischémiques. Nous évaluerons également le lien entre les indications issues de l’analyse PRM et les échelles cliniques.
Mon projet de thèse comporte deux parties. La première étude porte sur la caractérisation à partir d’IRM multiparamétrique de l’effet de cellules souches mésenchymateuses humaines (CSMh) injectés à la phase subaigüe dans un modèle d’AVC ischémique chez le rat. La seconde étude porte sur l’application de la PRM à des images de perfusion et de diffusion collectées chez des patients à différents temps après AVC et au lien entre les analyses PRM et les échelles cliniques caractérisant l’état du patient.
L’objectif de la première étude était de comparer deux méthodes d’analyse : une approche « lésion entière » standard et l’approche PRM. Ces deux analyses ont été réalisées sur des données IRM collectées à 4 temps (jours 3, 7, 9 et 16) chez des rats ayant subi un AVC ischémique (occlusion transitoire de l’artère cérébrale moyenne), traités ou non par CSMh. Les paramètres IRM mesurés à 7T étaient : l’ADC, le volume sanguin (CBV) et l’index de taille des vaisseaux (VSI). A J8, un groupe de rats a reçu une injection intraveineuse de 3 millions de CSMh et un groupe de rat une injection de PBS-glutamine. A J9, un jour après la greffe, l’approche PRM met en évidence chez le groupe traité une réduction de la fraction des pixels qui présentent un ADC réduit (PRMADC-), une disparition de la fraction PRMCBV+, et un retard dans l’apparition de la fraction PRMVSI+, par rapport au groupe PBS. L’approche « lésion entière » ne met en évidence aucune différence entre les deux groupes. Ces résultats sont en accord avec des analyses de biologie moléculaire obtenus dans les mêmes conditions (libération de facteurs angiogéniques : Ang1, Ang2, SDT-1, TGFβ1). L’approche PRM a également mis en évidence un impact des CSMh distribué à l’intérieur de la lésion. Si l’étude des mécanismes biologiques des effets des CSMh sur la lésion ischémique est au-delà de ce travail de thèse, les données recueillies au cours de cette étude suggèrent que l’approche PRM est plus sensible que l’approche « lésion entière » pour mettre en évidence et pour localiser de petites modifications de la lésion ischémique en réponse à un traitement.
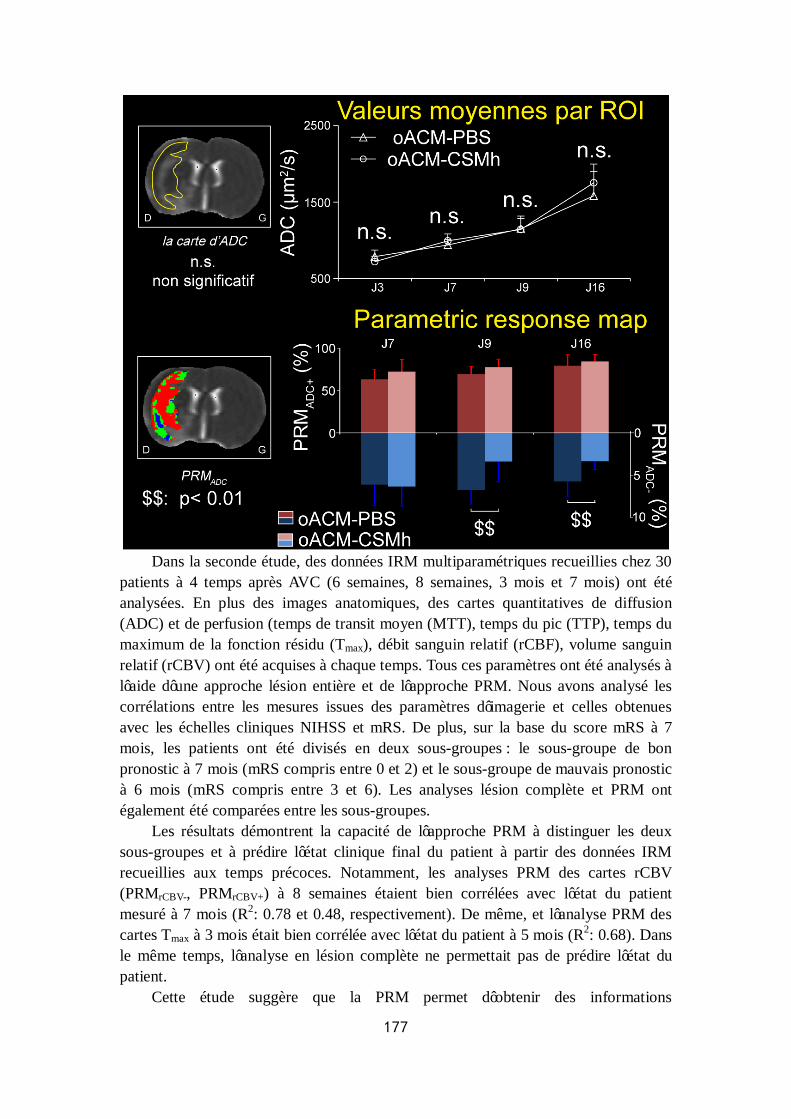
177
Dans la seconde étude, des données IRM multiparamétriques recueillies chez 30
patients à 4 temps après AVC (6 semaines, 8 semaines, 3 mois et 7 mois) ont été analysées. En plus des images anatomiques, des cartes quantitatives de diffusion (ADC) et de perfusion (temps de transit moyen (MTT), temps du pic (TTP), temps du maximum de la fonction résidu (Tmax), débit sanguin relatif (rCBF), volume sanguin relatif (rCBV) ont été acquises à chaque temps. Tous ces paramètres ont été analysés à l’aide d’une approche lésion entière et de l’approche PRM. Nous avons analysé les corrélations entre les mesures issues des paramètres d’imagerie et celles obtenues avec les échelles cliniques NIHSS et mRS. De plus, sur la base du score mRS à 7 mois, les patients ont été divisés en deux sous-groupes : le sous-groupe de bon pronostic à 7 mois (mRS compris entre 0 et 2) et le sous-groupe de mauvais pronostic à 6 mois (mRS compris entre 3 et 6). Les analyses lésion complète et PRM ont également été comparées entre les sous-groupes.
Les résultats démontrent la capacité de l’approche PRM à distinguer les deux sous-groupes et à prédire l’état clinique final du patient à partir des données IRM recueillies aux temps précoces. Notamment, les analyses PRM des cartes rCBV (PRMrCBV-, PRMrCBV+) à 8 semaines étaient bien corrélées avec l’état du patient mesuré à 7 mois (R2: 0.78 et 0.48, respectivement). De même, et l’analyse PRM des cartes Tmax à 3 mois était bien corrélée avec l’état du patient à 5 mois (R2: 0.68). Dans le même temps, l’analyse en lésion complète ne permettait pas de prédire l’état du patient.
Cette étude suggère que la PRM permet d’obtenir des informations
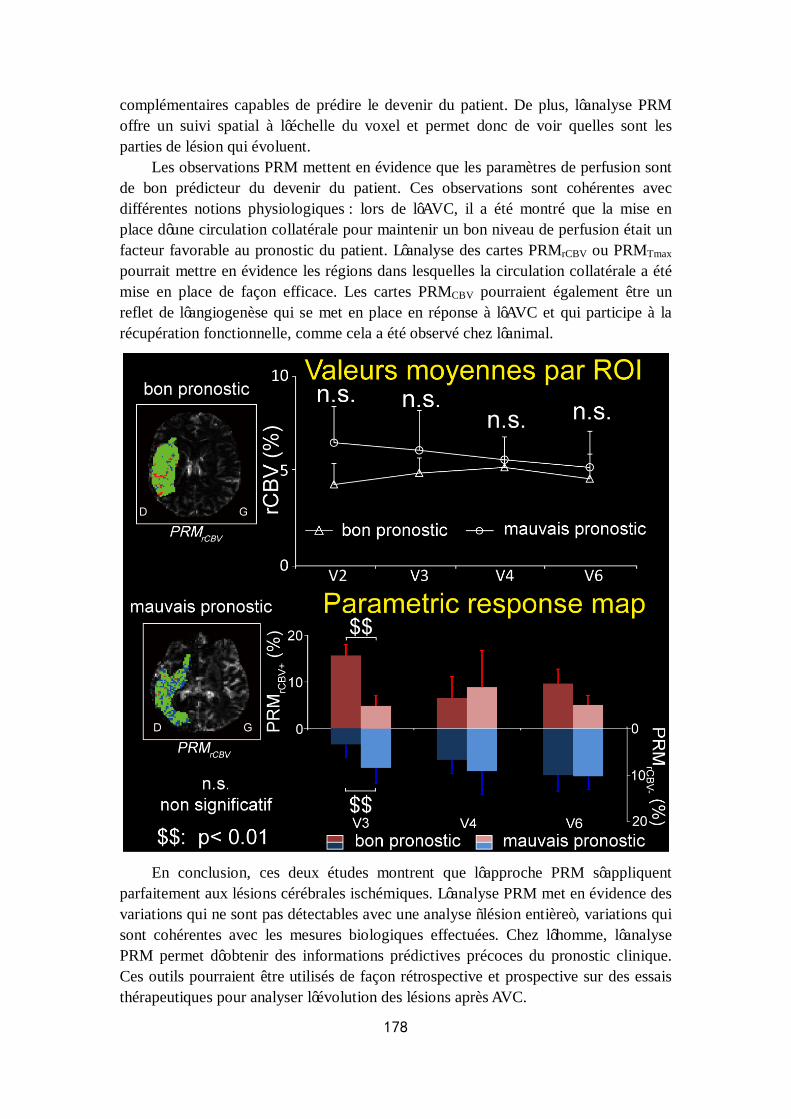
178
complémentaires capables de prédire le devenir du patient. De plus, l’analyse PRM offre un suivi spatial à l’échelle du voxel et permet donc de voir quelles sont les parties de lésion qui évoluent.
Les observations PRM mettent en évidence que les paramètres de perfusion sont de bon prédicteur du devenir du patient. Ces observations sont cohérentes avec différentes notions physiologiques : lors de l’AVC, il a été montré que la mise en place d’une circulation collatérale pour maintenir un bon niveau de perfusion était un facteur favorable au pronostic du patient. L’analyse des cartes PRMrCBV ou PRMTmax pourrait mettre en évidence les régions dans lesquelles la circulation collatérale a été mise en place de façon efficace. Les cartes PRMCBV pourraient également être un reflet de l’angiogenèse qui se met en place en réponse à l’AVC et qui participe à la récupération fonctionnelle, comme cela a été observé chez l’animal.
En conclusion, ces deux études montrent que l’approche PRM s’appliquent
parfaitement aux lésions cérébrales ischémiques. L’analyse PRM met en évidence des variations qui ne sont pas détectables avec une analyse “lésion entière”, variations qui sont cohérentes avec les mesures biologiques effectuées. Chez l’homme, l’analyse PRM permet d’obtenir des informations prédictives précoces du pronostic clinique. Ces outils pourraient être utilisés de façon rétrospective et prospective sur des essais thérapeutiques pour analyser l’évolution des lésions après AVC.

179
Appendix 2
National Institutes of Health Stroke Scale

180

Patient Identification. ___ ___-___ ___ ___-___ ___ ___
Pt. Date of Birth ___ ___/___ ___/___ ___
Hospital ________________________(___ ___-___ ___)
Date of Exam ___ ___/___ ___/___ ___
Interval: [ ] Baseline [ ] 2 hours post treatment [ ] 24 hours post onset of symptoms ±20 minutes [ ] 7-10 days [ ] 3 months [ ] Other ________________________________(___ ___)
Time: ___ ___:___ ___ [ ]am [ ]pm Person Administering Scale _____________________________________ Administer stroke scale items in the order listed. Record performance in each category after each subscale exam. Do not go back and change scores. Follow directions provided for each exam technique. Scores should reflect what the patient does, not what the clinician thinks the patient can do. The clinician should record answers while administering the exam and work quickly. Except where indicated, the patient should not be coached (i.e., repeated requests to patient to make a special effort).
Instructions Scale Definition Score
1a. Level of Consciousness: The investigator must choose a response if a full evaluation is prevented by such obstacles as an endotracheal tube, language barrier, orotracheal trauma/bandages. A 3 is scored only if the patient makes no movement (other than reflexive posturing) in response to noxious stimulation.
0 = Alert; keenly responsive. 1 = Not alert; but arousable by minor stimulation to obey,
answer, or respond. 2 = Not alert; requires repeated stimulation to attend, or is
obtunded and requires strong or painful stimulation to make movements (not stereotyped).
3 = Responds only with reflex motor or autonomic effects or totally unresponsive, flaccid, and areflexic.
______
1b. LOC Questions: The patient is asked the month and his/her age. The answer must be correct - there is no partial credit for being close. Aphasic and stuporous patients who do not comprehend the questions will score 2. Patients unable to speak because of endotracheal intubation, orotracheal trauma, severe dysarthria from any cause, language barrier, or any other problem not secondary to aphasia are given a 1. It is important that only the initial answer be graded and that the examiner not "help" the patient with verbal or non-verbal cues.
0 = Answers both questions correctly. 1 = Answers one question correctly. 2 = Answers neither question correctly.
______
1c. LOC Commands: The patient is asked to open and close the eyes and then to grip and release the non-paretic hand. Substitute another one step command if the hands cannot be used. Credit is given if an unequivocal attempt is made but not completed due to weakness. If the patient does not respond to command, the task should be demonstrated to him or her (pantomime), and the result scored (i.e., follows none, one or two commands). Patients with trauma, amputation, or other physical impediments should be given suitable one-step commands. Only the first attempt is scored.
0 = Performs both tasks correctly. 1 = Performs one task correctly. 2 = Performs neither task correctly.
______
2. Best Gaze: Only horizontal eye movements will be tested. Voluntary or reflexive (oculocephalic) eye movements will be scored, but caloric testing is not done. If the patient has a conjugate deviation of the eyes that can be overcome by voluntary or reflexive activity, the score will be 1. If a patient has an isolated peripheral nerve paresis (CN III, IV or VI), score a 1. Gaze is testable in all aphasic patients. Patients with ocular trauma, bandages, pre-existing blindness, or other disorder of visual acuity or fields should be tested with reflexive movements, and a choice made by the investigator. Establishing eye contact and then moving about the patient from side to side will occasionally clarify the presence of a partial gaze palsy.
0 = Normal. 1 = Partial gaze palsy; gaze is abnormal in one or both eyes,
but forced deviation or total gaze paresis is not present. 2 = Forced deviation, or total gaze paresis not overcome by the
oculocephalic maneuver.
______

Patient Identification. ___ ___-___ ___ ___-___ ___ ___
Pt. Date of Birth ___ ___/___ ___/___ ___
Hospital ________________________(___ ___-___ ___)
Date of Exam ___ ___/___ ___/___ ___
Interval: [ ] Baseline [ ] 2 hours post treatment [ ] 24 hours post onset of symptoms ±20 minutes [ ] 7-10 days [ ] 3 months [ ] Other ________________________________(___ ___)
3. Visual: Visual fields (upper and lower quadrants) are tested by confrontation, using finger counting or visual threat, as appropriate. Patients may be encouraged, but if they look at the side of the moving fingers appropriately, this can be scored as normal. If there is unilateral blindness or enucleation, visual fields in the remaining eye are scored. Score 1 only if a clear-cut asymmetry, including quadrantanopia, is found. If patient is blind from any cause, score 3. Double simultaneous stimulation is performed at this point. If there is extinction, patient receives a 1, and the results are used to respond to item 11.
0 = No visual loss. 1 = Partial hemianopia. 2 = Complete hemianopia. 3 = Bilateral hemianopia (blind including cortical blindness).
______
4. Facial Palsy: Ask – or use pantomime to encourage – the patient to show teeth or raise eyebrows and close eyes. Score symmetry of grimace in response to noxious stimuli in the poorly responsive or non-comprehending patient. If facial trauma/bandages, orotracheal tube, tape or other physical barriers obscure the face, these should be removed to the extent possible.
0 = Normal symmetrical movements. 1 = Minor paralysis (flattened nasolabial fold, asymmetry on
smiling). 2 = Partial paralysis (total or near-total paralysis of lower
face). 3 = Complete paralysis of one or both sides (absence of
facial movement in the upper and lower face).
______
5. Motor Arm: The limb is placed in the appropriate position: extend the arms (palms down) 90 degrees (if sitting) or 45 degrees (if supine). Drift is scored if the arm falls before 10 seconds. The aphasic patient is encouraged using urgency in the voice and pantomime, but not noxious stimulation. Each limb is tested in turn, beginning with the non-paretic arm. Only in the case of amputation or joint fusion at the shoulder, the examiner should record the score as untestable (UN), and clearly write the explanation for this choice.
0 = No drift; limb holds 90 (or 45) degrees for full 10 seconds. 1 = Drift; limb holds 90 (or 45) degrees, but drifts down before
full 10 seconds; does not hit bed or other support. 2 = Some effort against gravity; limb cannot get to or
maintain (if cued) 90 (or 45) degrees, drifts down to bed, but has some effort against gravity.
3 = No effort against gravity; limb falls. 4 = No movement. UN = Amputation or joint fusion, explain: _____________________ 5a. Left Arm 5b. Right Arm
______ ______
6. Motor Leg: The limb is placed in the appropriate position: hold the leg at 30 degrees (always tested supine). Drift is scored if the leg falls before 5 seconds. The aphasic patient is encouraged using urgency in the voice and pantomime, but not noxious stimulation. Each limb is tested in turn, beginning with the non-paretic leg. Only in the case of amputation or joint fusion at the hip, the examiner should record the score as untestable (UN), and clearly write the explanation for this choice.
0 = No drift; leg holds 30-degree position for full 5 seconds. 1 = Drift; leg falls by the end of the 5-second period but does
not hit bed. 2 = Some effort against gravity; leg falls to bed by 5
seconds, but has some effort against gravity. 3 = No effort against gravity; leg falls to bed immediately. 4 = No movement. UN = Amputation or joint fusion, explain: ________________ 6a. Left Leg
6b. Right Leg
______

Patient Identification. ___ ___-___ ___ ___-___ ___ ___
Pt. Date of Birth ___ ___/___ ___/___ ___
Hospital ________________________(___ ___-___ ___)
Date of Exam ___ ___/___ ___/___ ___
Interval: [ ] Baseline [ ] 2 hours post treatment [ ] 24 hours post onset of symptoms ±20 minutes [ ] 7-10 days [ ] 3 months [ ] Other ________________________________(___ ___)
______
7. Limb Ataxia: This item is aimed at finding evidence of a unilateral cerebellar lesion. Test with eyes open. In case of visual defect, ensure testing is done in intact visual field. The finger-nose-finger and heel-shin tests are performed on both sides, and ataxia is scored only if present out of proportion to weakness. Ataxia is absent in the patient who cannot understand or is paralyzed. Only in the case of amputation or joint fusion, the examiner should record the score as untestable (UN), and clearly write the explanation for this choice. In case of blindness, test by having the patient touch nose from extended arm position.
0 = Absent. 1 = Present in one limb. 2 = Present in two limbs. UN = Amputation or joint fusion, explain: ________________
______
8. Sensory: Sensation or grimace to pinprick when tested, or withdrawal from noxious stimulus in the obtunded or aphasic patient. Only sensory loss attributed to stroke is scored as abnormal and the examiner should test as many body areas (arms [not hands], legs, trunk, face) as needed to accurately check for hemisensory loss. A score of 2, “severe or total sensory loss,” should only be given when a severe or total loss of sensation can be clearly demonstrated. Stuporous and aphasic patients will, therefore, probably score 1 or 0. The patient with brainstem stroke who has bilateral loss of sensation is scored 2. If the patient does not respond and is quadriplegic, score 2. Patients in a coma (item 1a=3) are automatically given a 2 on this item.
0 = Normal; no sensory loss. 1 = Mild-to-moderate sensory loss; patient feels pinprick is
less sharp or is dull on the affected side; or there is a loss of superficial pain with pinprick, but patient is aware of being touched.
2 = Severe to total sensory loss; patient is not aware of
being touched in the face, arm, and leg.
______
9. Best Language: A great deal of information about comprehension will be obtained during the preceding sections of the examination. For this scale item, the patient is asked to describe what is happening in the attached picture, to name the items on the attached naming sheet and to read from the attached list of sentences. Comprehension is judged from responses here, as well as to all of the commands in the preceding general neurological exam. If visual loss interferes with the tests, ask the patient to identify objects placed in the hand, repeat, and produce speech. The intubated patient should be asked to write. The patient in a coma (item 1a=3) will automatically score 3 on this item. The examiner must choose a score for the patient with stupor or limited cooperation, but a score of 3 should be used only if the patient is mute and follows no one-step commands.
0 = No aphasia; normal. 1 = Mild-to-moderate aphasia; some obvious loss of fluency
or facility of comprehension, without significant limitation on ideas expressed or form of expression. Reduction of speech and/or comprehension, however, makes conversation about provided materials difficult or impossible. For example, in conversation about provided materials, examiner can identify picture or naming card content from patient’s response.
2 = Severe aphasia; all communication is through fragmentary
expression; great need for inference, questioning, and guessing by the listener. Range of information that can be exchanged is limited; listener carries burden of communication. Examiner cannot identify materials provided from patient response.
3 = Mute, global aphasia; no usable speech or auditory
comprehension.
______
10. Dysarthria: If patient is thought to be normal, an adequate sample of speech must be obtained by asking patient to read or repeat words from the attached list. If the patient has severe aphasia, the clarity of articulation of spontaneous speech can be rated. Only if the patient is intubated or has other physical barriers to producing speech, the examiner should record the score as untestable (UN), and clearly write an explanation for this choice. Do not tell the patient why he or she is being tested.
0 = Normal. 1 = Mild-to-moderate dysarthria; patient slurs at least some
words and, at worst, can be understood with some difficulty.
2 = Severe dysarthria; patient's speech is so slurred as to be unintelligible in the absence of or out of proportion to any dysphasia, or is mute/anarthric.
UN = Intubated or other physical barrier, explain:_____________________________
______

Patient Identification. ___ ___-___ ___ ___-___ ___ ___
Pt. Date of Birth ___ ___/___ ___/___ ___
Hospital ________________________(___ ___-___ ___)
Date of Exam ___ ___/___ ___/___ ___
Interval: [ ] Baseline [ ] 2 hours post treatment [ ] 24 hours post onset of symptoms ±20 minutes [ ] 7-10 days [ ] 3 months [ ] Other ________________________________(___ ___)
11. Extinction and Inattention (formerly Neglect): Sufficient information to identify neglect may be obtained during the prior testing. If the patient has a severe visual loss preventing visual double simultaneous stimulation, and the cutaneous stimuli are normal, the score is normal. If the patient has aphasia but does appear to attend to both sides, the score is normal. The presence of visual spatial neglect or anosagnosia may also be taken as evidence of abnormality. Since the abnormality is scored only if present, the item is never untestable.
0 = No abnormality. 1 = Visual, tactile, auditory, spatial, or personal inattention
or extinction to bilateral simultaneous stimulation in one of the sensory modalities.
2 = Profound hemi-inattention or extinction to more than
one modality; does not recognize own hand or orients to only one side of space.
______

185
Appendix 3
modified Rankin Scale

186

Provided by the Internet Stroke Center — www.strokecenter.org
MODIFIED Patient Name: ___________________________ RANKIN Rater Name: ___________________________ SCALE (mRS) Date: ___________________________
Score Description
0 No symptoms at all
1 No significant disability despite symptoms; able to carry out all usual duties and activities
2 Slight disability; unable to carry out all previous activities, but able to look after own affairs without assistance
3 Moderate disability; requiring some help, but able to walk without assistance
4 Moderately severe disability; unable to walk without assistance and unable to attend to own bodily needs without assistance
5 Severe disability; bedridden, incontinent and requiring constant nursing care and attention
6 Dead TOTAL (0–6): _______

188

189
Appendix 4
Poster (Proc. ISMRM May 2014, Milan, Italy)

190
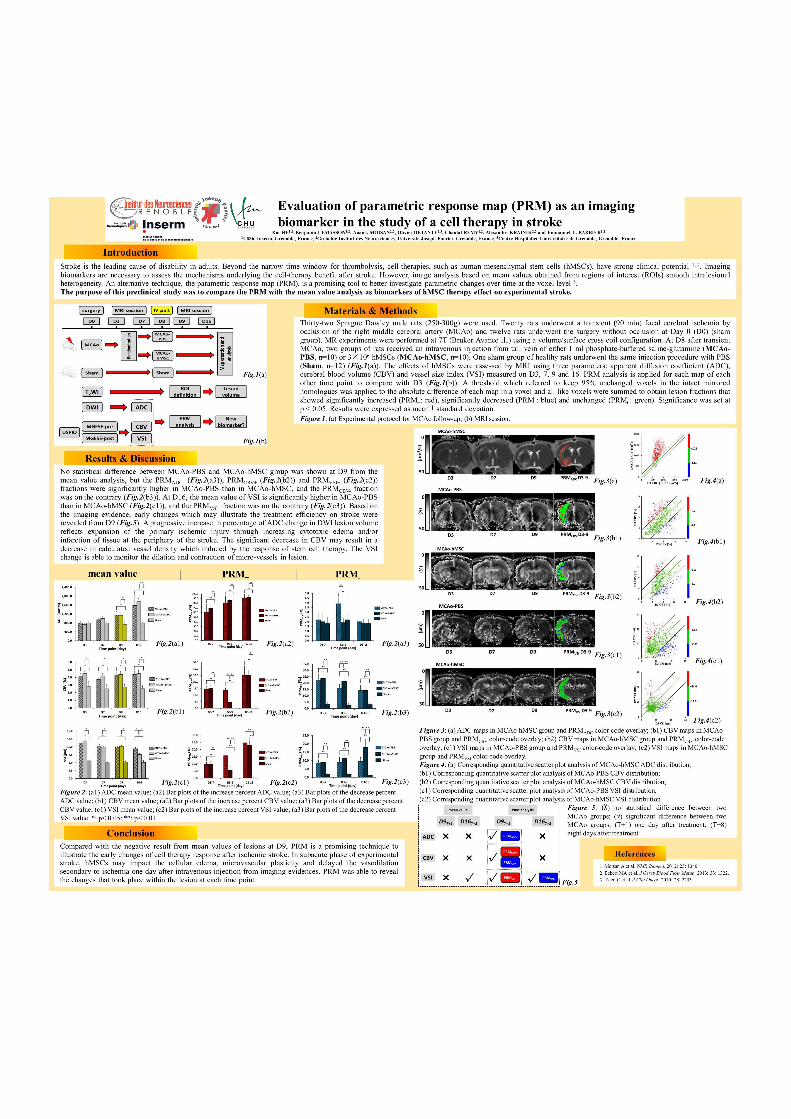

192

193
Appendix 5
Curriculum Vitae

194

195
Rui He
Grenoble Institute of Neurosciences (GIN)
INSERM U1216
Building Edmond J. Safra,
38706 La Tronche Cedex, France
+33 7 81 49 94 83 (Fr) / +86 17317308069 (Ch)
[email protected] / [email protected]
Education
01/2013 - 11/2016 Ph.D. candidate (Biotechnology, Instrumentation, Signal and Imaging for Biology, Medicine and
Environment)
Doctoral School of Healthy Engineering, Cognition and Environment, University Grenoble Alpes,
Grenoble, France
—Evaluation of voxel-based analysis in stroke using multiparametric MR imaging (thesis)
08/2008 - 07/2010 Master of 7-year direct program (Medical Imaging and Nuclear Medicine)
Diagnostic Imaging Center, Shanghai Children’s Medical Center, Shanghai Jiao Tong University,
Shanghai, P.R. China
—Evaluation of MSCT and MRI in imaging diagnosis of portosystemic malformation in children
(thesis)
—Certificate of Physician Credentials and Certificate of Medical Licensure of P.R. China
01/2007 - 07/2008 Bachelor of 7-year direct program (Clinical Medicine)
Clinical Medical College, Renji hospital, Shanghai Jiao Tong University, Shanghai, P.R. China
09/2003 - 12/2006 Medical Elementary Courses
School of Medicine, Shanghai Jiao Tong University, Shanghai, P.R. China
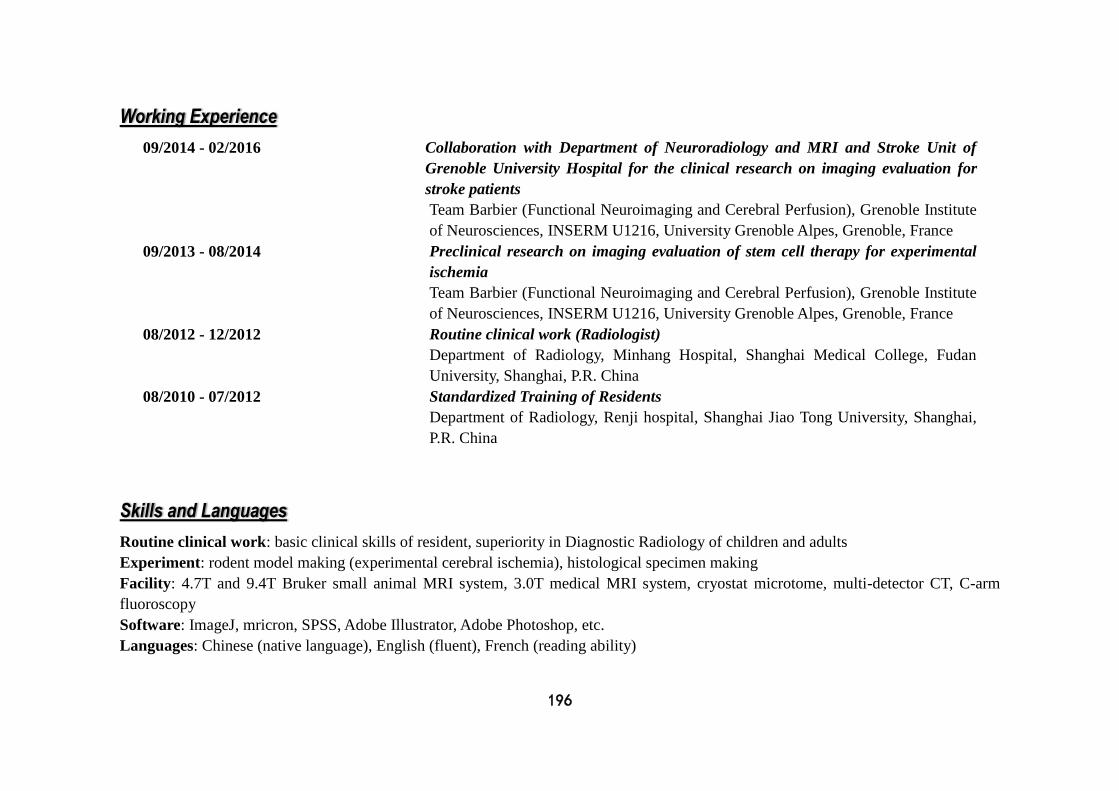
196
Working Experience
09/2014 - 02/2016 Collaboration with Department of Neuroradiology and MRI and Stroke Unit of
Grenoble University Hospital for the clinical research on imaging evaluation for
stroke patients
Team Barbier (Functional Neuroimaging and Cerebral Perfusion), Grenoble Institute
of Neurosciences, INSERM U1216, University Grenoble Alpes, Grenoble, France
09/2013 - 08/2014 Preclinical research on imaging evaluation of stem cell therapy for experimental
ischemia
Team Barbier (Functional Neuroimaging and Cerebral Perfusion), Grenoble Institute
of Neurosciences, INSERM U1216, University Grenoble Alpes, Grenoble, France
08/2012 - 12/2012 Routine clinical work (Radiologist)
Department of Radiology, Minhang Hospital, Shanghai Medical College, Fudan
University, Shanghai, P.R. China
08/2010 - 07/2012 Standardized Training of Residents
Department of Radiology, Renji hospital, Shanghai Jiao Tong University, Shanghai,
P.R. China
Skills and Languages
Routine clinical work: basic clinical skills of resident, superiority in Diagnostic Radiology of children and adults
Experiment: rodent model making (experimental cerebral ischemia), histological specimen making
Facility: 4.7T and 9.4T Bruker small animal MRI system, 3.0T medical MRI system, cryostat microtome, multi-detector CT, C-arm
fluoroscopy
Software: ImageJ, mricron, SPSS, Adobe Illustrator, Adobe Photoshop, etc.
Languages: Chinese (native language), English (fluent), French (reading ability)
197
Honors and Awards2012 Certificate of Standardized Training of Residents in Medical Imaging and Nuclear Medicine of P.R. China 2010 Certificate Excellent Graduated Student of Shanghai, Shanghai Education Committee 2004 General Course Scholarship, Shanghai Jiao Tong University
PublicationsStroke, Image Processing, Ischemia Model-making v Rui He, Anaïck Moisan, Olivier Detante, Chantal Rémy, Emmanuel L. Barbier, Alexandre Krainik, Benjamin Lemasson*.
Evaluation of parametric response mapping to assess cell therapy effects after experimental stroke[J]. Cell Transplantation. (Revised) v Rui He, Oliver Detante, Alexandre Krainik, Assia Jaillard, Emmanuel L. Barbier, Benjamin Lemasson*. Parametric response map as
an imaging predictor of functional outcome in chronic stroke patients[J]. Stroke. (In progress) Congenital Heart Diseases, Pediatric Imaging v Ming Zhu*, Aimin Sun, Rui He. Evaluation of the anomalous retro-esophageal left brachiocephalic vein in Chinese children using
multidetector CT[J]. Pediatric Radiology, 2009, 39(4): 343-347. v Rui He, Ming Zhu*. Radiological Diagnosis of Congenital Anomaly of the Vena Cava[J]. Chinese Computed Medical Imaging, 2009,
15: 454-457. v Rui He, Ming Zhu*. Multi-slice spiral CT in the Evaluation of Retroesophageal Innominate Vein[J]. Radiologic Practice, 2009,
24(12): 1371-1373. v Rui He, Ming Zhu*. Congenital Anomaly of Inferior Vena Cava in association with Omphalocele: a case report[J]. Radiologic
Practice, 2009, 24(8): 891. v Rui He, Ming Zhu*. Radiological diagnosis of congenital anomaly of the inferior vena cava[J]. Journal of Chinese Clinic Medical
Imaging, 2009, 20(9): 708-711. Organ Transplantation, Abdominal Imaging v Qiang Xia*, Rui He. Intrahepatic Biliary Strictures after Liver Transplantation[J]. Chinese Journal of Hepatobiliary Surgery, 2007,
15(4): 247-250.

198
ConferencesPoster Rui He, Benjamin Lemasson, Anaïck Moisan, Olivier Detante, Chantal Rémy, Alexandre Krainik, Emmanuel L. Barbier.
Evaluation of the parametric response map (PRM) as an imaging biomarker in the study of a cell therapy in stroke. Proc. ISMRM May 2014, Milan, Italy
Rui He, Oliver Detante, Alexandre Krainik, Assia Jaillard, Emmanuel L. Barbier, Benjamin Lemasson. Correlating clinical outcome with voxel-based quantitative multiparametric MRI analysis in chronic ischemic stroke. Proc. ISMRM 2017 and SFRMBM 2017 (Submitted)
ReferencesProf. Alexandre Krainik M.D. Ph.D. (Director) Chairman of French Society of Neuroradiology President, Department of Neuroradiology and MRI, Grenoble University Hospital, University Grenoble Alpes [email protected] Dr. Emmanuel Barbier Ph.D. (Co-director) Team leader, Grenoble Institute of Neurosciences (GIN), INSERM U1216, University Grenoble Alpes [email protected] Dr. Benjamin Lemasson Ph.D. (Co-director) Researcher, Grenoble Institute of Neurosciences (GIN), INSERM U1216, University Grenoble Alpes [email protected] Prof. Ming Zhu M.D. Chairman of Chinese Society of Pediatric Radiology Former president, Diagnostic Imaging Center, Shanghai Children’s Medical Center, Shanghai Jiao Tong University [email protected]
199
References Abe T., Kunz A., Shimamura M., Zhou P., Anrather J., Iadecola C. (2009). The neuroprotective effect of prostaglandin E2 EP1 receptor inhibition has a wide therapeutic window, is sustained in time and is not sexually dimorphic. J Cereb Blood Flow Metab 29(1): 66-72. [PMID: 18648380] Abramson R. G., Li X., Hoyt T. L., Su P. F., Arlinghaus L. R., Wilson K. J., et al. (2013). Early assessment of breast cancer response to neoadjuvant chemotherapy by semi-quantitative analysis of high-temporal resolution DCE-MRI: preliminary results. Magn Reson Imaging 31(9): 1457-1464. [PMID: 23954320] Adams H. P., Jr., Bendixen B. H., Kappelle L. J., Biller J., Love B. B., Gordon D. L., et al. (1993). Classification of subtype of acute ischemic stroke. Definitions for use in a multicenter clinical trial. TOAST. Trial of Org 10172 in Acute Stroke Treatment. Stroke 24(1): 35-41. [PMID: 7678184] Adams H. P., Jr., Effron M. B., Torner J., Davalos A., Frayne J., Teal P., et al. (2008). Emergency administration of abciximab for treatment of patients with acute ischemic stroke: results of an international phase III trial: Abciximab in Emergency Treatment of Stroke Trial (AbESTT-II). Stroke 39(1): 87-99. [PMID: 18032739] Ahmed M. N., Yamany S. M., Mohamed N., Farag A. A., Moriarty T. (2002). A modified fuzzy C-means algorithm for bias field estimation and segmentation of MRI data. IEEE Trans Med Imaging 21(3): 193-199. [PMID: 11989844] Albers G. W., Thijs V. N., Wechsler L., Kemp S., Schlaug G., Skalabrin E., et al. (2006a). Magnetic resonance imaging profiles predict clinical response to early reperfusion: the diffusion and perfusion imaging evaluation for understanding stroke evolution (DEFUSE) study. Ann Neurol 60(5): 508-517. [PMID: 17066483] Albers G. W., Thijs V. N., Wechsler L., Kemp S., Schlaug G., Skalabrin E., et al. (2006b). Magnetic resonance imaging profiles predict clinical response to early reperfusion: the diffusion and perfusion imaging evaluation for understanding stroke evolution (DEFUSE) study. Ann Neurol 60(5): 508-517. [PMID: 17066483] Alexander A. L., Hurley S. A., Samsonov A. A., Adluru N., Hosseinbor A. P., Mossahebi P., et al. (2011). Characterization of cerebral white matter properties using quantitative magnetic resonance imaging stains. Brain Connect 1(6): 423-446. [PMID: 22432902] Alexander A. L., Lee J. E., Lazar M., Field A. S. (2007). Diffusion tensor imaging of the brain. Neurotherapeutics 4(3): 316-329. [PMID: 17599699]
200
Allen L. M., Hasso A. N., Handwerker J., Farid H. (2012). Sequence-specific MR imaging findings that are useful in dating ischemic stroke. Radiographics 32(5): 1285-1297; discussion 1297-1289. [PMID: 22977018] Alobeidi F., Aviv R. I. (2015). Emergency Imaging of Intracerebral Haemorrhage. Front Neurol Neurosci 37: 13-26. [PMID: 26588327] Amantea D., Tassorelli C., Petrelli F., Certo M., Bezzi P., Micieli G., et al. (2014). Understanding the multifaceted role of inflammatory mediators in ischemic stroke. Curr Med Chem 21(18): 2098-2117. [PMID: 24372219] Amarenco P., Bogousslavsky J., Caplan L. R., Donnan G. A., Hennerici M. G. (2009). New approach to stroke subtyping: the A-S-C-O (phenotypic) classification of stroke. Cerebrovasc Dis 27(5): 502-508. [PMID: 19342826] Anderson L. J., Holden S., Davis B., Prescott E., Charrier C. C., Bunce N. H., et al. (2001). Cardiovascular T2-star (T2*) magnetic resonance for the early diagnosis of myocardial iron overload. Eur Heart J 22(23): 2171-2179. [PMID: 11913479] Angermaier A., Langner S., Kirsch M., Kessler C., Hosten N., Khaw A. V. (2011). CT-angiographic collateralization predicts final infarct volume after intra-arterial thrombolysis for acute anterior circulation ischemic stroke. Cerebrovasc Dis 31(2): 177-184. [PMID: 21135554] Arai K., Lo E. H. (2009). An oligovascular niche: cerebral endothelial cells promote the survival and proliferation of oligodendrocyte precursor cells. J Neurosci 29(14): 4351-4355. [PMID: 19357263] Arboix A., Alio J. (2010). Cardioembolic stroke: clinical features, specific cardiac disorders and prognosis. Curr Cardiol Rev 6(3): 150-161. [PMID: 21804774] Arnold M., Fischer U., Compter A., Gralla J., Findling O., Mattle H. P., et al. (2010). Acute basilar artery occlusion in the Basilar Artery International Cooperation Study: does gender matter? Stroke 41(11): 2693-2696. [PMID: 20947845] Aronen H. J., Laakso M. P., Moser M., Perkio J. (2007). Diffusion and perfusion-weighted magnetic resonance imaging techniques in stroke recovery. Eura Medicophys 43(2): 271-284. [PMID: 17589417] Artzi M., Aizenstein O., Jonas-Kimchi T., Myers V., Hallevi H., Ben Bashat D. (2013). FLAIR lesion segmentation: application in patients with brain tumors and acute ischemic stroke. Eur J Radiol 82(9): 1512-1518. [PMID: 23796882] Arvidsson A., Collin T., Kirik D., Kokaia Z., Lindvall O. (2002). Neuronal replacement
201
from endogenous precursors in the adult brain after stroke. Nat Med 8(9): 963-970. [PMID: 12161747] Asadi H., Dowling R., Yan B., Wong S., Mitchell P. (2015). Advances in endovascular treatment of acute ischaemic stroke. Intern Med J 45(8): 798-805. [PMID: 25443686] Asdaghi N., Hameed B., Saini M., Jeerakathil T., Emery D., Butcher K. (2011). Acute perfusion and diffusion abnormalities predict early new MRI lesions 1 week after minor stroke and transient ischemic attack. Stroke 42(8): 2191-2195. [PMID: 21737809] Ashburner J., Friston K. J. (2005). Unified segmentation. Neuroimage 26(3): 839-851. [PMID: 15955494] Assaf Y., Pasternak O. (2008). Diffusion tensor imaging (DTI)-based white matter mapping in brain research: a review. J Mol Neurosci 34(1): 51-61. [PMID: 18157658] Attali J., Benaissa A., Soize S., Kadziolka K., Portefaix C., Pierot L. (2016). Follow-up of intracranial aneurysms treated by flow diverter: comparison of three-dimensional time-of-flight MR angiography (3D-TOF-MRA) and contrast-enhanced MR angiography (CE-MRA) sequences with digital subtraction angiography as the gold standard. J Neurointerv Surg 8(1): 81-86. [PMID: 25352582] Attwell D., Buchan A. M., Charpak S., Lauritzen M., Macvicar B. A., Newman E. A. (2010). Glial and neuronal control of brain blood flow. Nature 468(7321): 232-243. [PMID: 21068832] Ay H., Benner T., Arsava E. M., Furie K. L., Singhal A. B., Jensen M. B., et al. (2007). A computerized algorithm for etiologic classification of ischemic stroke: the Causative Classification of Stroke System. Stroke 38(11): 2979-2984. [PMID: 17901381] Ay H., Furie K. L., Singhal A., Smith W. S., Sorensen A. G., Koroshetz W. J. (2005). An evidence-based causative classification system for acute ischemic stroke. Ann Neurol 58(5): 688-697. [PMID: 16240340] Azeez D., Gan K. B., Mohd Ali M. A., Ismail M. S. (2015). Secondary triage classification using an ensemble random forest technique. Technol Health Care 23(4): 419-428. [PMID: 25791174] Azuma M., Hirai T., Shigematsu Y., Kitajima M., Kai Y., Yano S., et al. (2015). Evaluation of Intracranial Dural Arteriovenous Fistulas: Comparison of Unenhanced 3T 3D Time-of-flight MR Angiography with Digital Subtraction Angiography. Magn Reson Med Sci 14(4): 285-293. [PMID: 25994036]
202
Badaut J., Ashwal S., Obenaus A. (2011). Aquaporins in cerebrovascular disease: a target for treatment of brain edema? Cerebrovasc Dis 31(6): 521-531. [PMID: 21487216] Badhiwala J. H., Nassiri F., Alhazzani W., Selim M. H., Farrokhyar F., Spears J., et al. (2015). Endovascular Thrombectomy for Acute Ischemic Stroke: A Meta-analysis. JAMA 314(17): 1832-1843. [PMID: 26529161] Baer A. H., Hoff B. A., Srinivasan A., Galban C. J., Mukherji S. K. (2015). Feasibility analysis of the parametric response map as an early predictor of treatment efficacy in head and neck cancer. AJNR Am J Neuroradiol 36(4): 757-762. [PMID: 25792532] Baillard C., Hellier P., Barillot C. (2001). Segmentation of brain 3D MR images using level sets and dense registration. Med Image Anal 5(3): 185-194. [PMID: 11524225] Baird A. E., Benfield A., Schlaug G., Siewert B., Lovblad K. O., Edelman R. R., et al. (1997). Enlargement of human cerebral ischemic lesion volumes measured by diffusion-weighted magnetic resonance imaging. Ann Neurol 41(5): 581-589. [PMID: 9153519] Bajaj S., Butler A. J., Drake D., Dhamala M. (2015). Functional organization and restoration of the brain motor-execution network after stroke and rehabilitation. Front Hum Neurosci 9: 173. [PMID: 25870557] Bang O. Y. (2009a). Multimodal MRI for ischemic stroke: from acute therapy to preventive strategies. J Clin Neurol 5(3): 107-119. [PMID: 19826561] Bang O. Y., Heo J. H., Kim J. Y., Park J. H., Huh K. (2002). Middle cerebral artery stenosis is a major clinical determinant in striatocapsular small, deep infarction. Arch Neurol 59(2): 259-263. [PMID: 11843697] Bang O. Y., Joo S. Y., Lee P. H., Joo U. S., Lee J. H., Joo I. S., et al. (2004). The course of patients with lacunar infarcts and a parent arterial lesion: similarities to large artery vs small artery disease. Arch Neurol 61(4): 514-519. [PMID: 15096399] Bang O. Y., Lee J. S., Lee P. H., Lee G. (2005). Autologous mesenchymal stem cell transplantation in stroke patients. Ann Neurol 57(6): 874-882. [PMID: 15929052] Bang O. Y., Lee K. H., Kim S. J., Liebeskind D. S. (2010). Benign oligemia despite a malignant MRI profile in acute ischemic stroke. J Clin Neurol 6(1): 41-45. [PMID: 20386643] Bang O. Y., Ovbiagele B., Liebeskind D. S., Restrepo L., Yoon S. R., Saver J. L. (2009b).
203
Clinical determinants of infarct pattern subtypes in large vessel atherosclerotic stroke. J Neurol 256(4): 591-599. [PMID: 19444533] Bang O. Y., Saver J. L., Buck B. H., Alger J. R., Starkman S., Ovbiagele B., et al. (2008). Impact of collateral flow on tissue fate in acute ischaemic stroke. J Neurol Neurosurg Psychiatry 79(6): 625-629. [PMID: 18077482] Banks J. L., Marotta C. A. (2007). Outcomes validity and reliability of the modified Rankin scale: implications for stroke clinical trials: a literature review and synthesis. Stroke 38(3): 1091-1096. [PMID: 17272767] Bannister L. C., Crewther S. G., Gavrilescu M., Carey L. M. (2015). Improvement in Touch Sensation after Stroke is Associated with Resting Functional Connectivity Changes. Front Neurol 6: 165. [PMID: 26284024] Barber P. A., Darby D. G., Desmond P. M., Yang Q., Gerraty R. P., Jolley D., et al. (1998). Prediction of stroke outcome with echoplanar perfusion- and diffusion-weighted MRI. Neurology 51(2): 418-426. [PMID: 9710013] Barker F. G., 2nd, Prados M. D., Chang S. M., Gutin P. H., Lamborn K. R., Larson D. A., et al. (1996). Radiation response and survival time in patients with glioblastoma multiforme. J Neurosurg 84(3): 442-448. [PMID: 8609556] Barra V., Boire J. Y. (2000). Tissue segmentation on MR images of the brain by possibilistic clustering on a 3D wavelet representation. J Magn Reson Imaging 11(3): 267-278. [PMID: 10739558] Beauchamp N. J., Jr., Barker P. B., Wang P. Y., vanZijl P. C. (1999). Imaging of acute cerebral ischemia. Radiology 212(2): 307-324. [PMID: 10429685] Beauchamp N. J., Jr., Ulug A. M., Passe T. J., van Zijl P. C. (1998). MR diffusion imaging in stroke: review and controversies. Radiographics 18(5): 1269-1283; discussion 1283-1265. [PMID: 9747619] Beaulieu C. (2002). The basis of anisotropic water diffusion in the nervous system - a technical review. NMR Biomed 15(7-8): 435-455. [PMID: 12489094] Behin A., Hoang-Xuan K., Carpentier A. F., Delattre J. Y. (2003). Primary brain tumours in adults. Lancet 361(9354): 323-331. [PMID: 12559880] Berkhemer O. A., Fransen P. S., Beumer D., van den Berg L. A., Lingsma H. F., Yoo A. J., et al. (2015). A randomized trial of intraarterial treatment for acute ischemic stroke. N Engl J Med 372(1): 11-20. [PMID: 25517348]
204
Berry I., Ranjeva J. P., Duthil P., Manelfe C. (1998). Diffusion and perfusion MRI, measurements of acute stroke events and outcome: present practice and future hope. Cerebrovasc Dis 8 Suppl 2: 8-16. [PMID: 9570021] Bezdek J. C., Hall L. O., Clarke L. P. (1993). Review of MR image segmentation techniques using pattern recognition. Med Phys 20(4): 1033-1048. [PMID: 8413011] Bhatia R., Hill M. D., Shobha N., Menon B., Bal S., Kochar P., et al. (2010). Low rates of acute recanalization with intravenous recombinant tissue plasminogen activator in ischemic stroke: real-world experience and a call for action. Stroke 41(10): 2254-2258. [PMID: 20829513] Bhatt D. L., Fox K. A., Hacke W., Berger P. B., Black H. R., Boden W. E., et al. (2006). Clopidogrel and aspirin versus aspirin alone for the prevention of atherothrombotic events. N Engl J Med 354(16): 1706-1717. [PMID: 16531616] Bidmon H. J., Oermann E., Schiene K., Schmitt M., Kato K., Asayama K., et al. (2000). Unilateral upregulation of cyclooxygenase-2 following cerebral, cortical photothrombosis in the rat: suppression by MK-801 and co-distribution with enzymes involved in the oxidative stress cascade. J Chem Neuroanat 20(2): 163-176. [PMID: 11118808] Biswal B. B., Mennes M., Zuo X. N., Gohel S., Kelly C., Smith S. M., et al. (2010). Toward discovery science of human brain function. Proc Natl Acad Sci U S A 107(10): 4734-4739. [PMID: 20176931] Boehm-Sturm P., Farr T. D., Adamczak J., Jikeli J. F., Mengler L., Wiedermann D., et al. (2013). Vascular changes after stroke in the rat: a longitudinal study using optimized magnetic resonance imaging. Contrast Media Mol Imaging 8(5): 383-392. [PMID: 23740808] Boes J. L., Hoff B. A., Hylton N., Pickles M. D., Turnbull L. W., Schott A. F., et al. (2014). Image registration for quantitative parametric response mapping of cancer treatment response. Transl Oncol 7(1): 101-110. [PMID: 24772213] Bouvier J., Detante O., Tahon F., Attye A., Perret T., Chechin D., et al. (2015). Reduced CMRO(2) and cerebrovascular reserve in patients with severe intracranial arterial stenosis: a combined multiparametric qBOLD oxygenation and BOLD fMRI study. Hum Brain Mapp 36(2): 695-706. [PMID: 25307948] Brazzelli M., Chappell F. M., Miranda H., Shuler K., Dennis M., Sandercock P. A., et al. (2014). Diffusion-weighted imaging and diagnosis of transient ischemic attack. Ann Neurol 75(1): 67-76. [PMID: 24085376]
205
Brenneman M., Sharma S., Harting M., Strong R., Cox C. S., Jr., Aronowski J., et al. (2010). Autologous bone marrow mononuclear cells enhance recovery after acute ischemic stroke in young and middle-aged rats. J Cereb Blood Flow Metab 30(1): 140-149. [PMID: 19773802] Broderick J. P., Palesch Y. Y., Demchuk A. M., Yeatts S. D., Khatri P., Hill M. D., et al. (2013). Endovascular therapy after intravenous t-PA versus t-PA alone for stroke. N Engl J Med 368(10): 893-903. [PMID: 23390923] Broussalis E., Trinka E., Hitzl W., Wallner A., Chroust V., Killer-Oberpfalzer M. (2013). Comparison of stent-retriever devices versus the Merci retriever for endovascular treatment of acute stroke. AJNR Am J Neuroradiol 34(2): 366-372. [PMID: 22790249] Bryan R. N., Levy L. M., Whitlow W. D., Killian J. M., Preziosi T. J., Rosario J. A. (1991). Diagnosis of acute cerebral infarction: comparison of CT and MR imaging. AJNR Am J Neuroradiol 12(4): 611-620. [PMID: 1688347] Bugnicourt J. M., Godefroy O. (2013). Day-7 or day-90 modified Rankin scale score: what is the best measure of outcome after thrombolysis in ischemic stroke? J Thromb Thrombolysis 36(3): 316. [PMID: 23054466] Bulte D. P., Kelly M., Germuska M., Xie J., Chappell M. A., Okell T. W., et al. (2012). Quantitative measurement of cerebral physiology using respiratory-calibrated MRI. Neuroimage 60(1): 582-591. [PMID: 22209811] Buscema M. (2002). A brief overview and introduction to artificial neural networks. Subst Use Misuse 37(8-10): 1093-1148. [PMID: 12180558] Busch H. J., Buschmann I. R., Mies G., Bode C., Hossmann K. A. (2003). Arteriogenesis in hypoperfused rat brain. J Cereb Blood Flow Metab 23(5): 621-628. [PMID: 12771578] Butler A. J., Page S. J. (2006). Mental practice with motor imagery: evidence for motor recovery and cortical reorganization after stroke. Arch Phys Med Rehabil 87(12 Suppl 2): S2-11. [PMID: 17140874] Cabezas M., Oliver A., Llado X., Freixenet J., Cuadra M. B. (2011). A review of atlas-based segmentation for magnetic resonance brain images. Comput Methods Programs Biomed 104(3): e158-177. [PMID: 21871688] Calamante F., Christensen S., Desmond P. M., Ostergaard L., Davis S. M., Connelly A. (2010). The physiological significance of the time-to-maximum (Tmax) parameter in perfusion MRI. Stroke 41(6): 1169-1174. [PMID: 20413735] Calamante F., Gadian D. G., Connelly A. (2002). Quantification of perfusion using
206
bolus tracking magnetic resonance imaging in stroke: assumptions, limitations, and potential implications for clinical use. Stroke 33(4): 1146-1151. [PMID: 11935075] Calamante F., Vonken E. J., van Osch M. J. (2007). Contrast agent concentration measurements affecting quantification of bolus-tracking perfusion MRI. Magn Reson Med 58(3): 544-553. [PMID: 17763347] Calamante F., Willats L., Gadian D. G., Connelly A. (2006). Bolus delay and dispersion in perfusion MRI: implications for tissue predictor models in stroke. Magn Reson Med 55(5): 1180-1185. [PMID: 16598717] Campbell B. C., Donnan G. A., Lees K. R., Hacke W., Khatri P., Hill M. D., et al. (2015). Endovascular stent thrombectomy: the new standard of care for large vessel ischaemic stroke. Lancet Neurol 14(8): 846-854. [PMID: 26119323] Campbell B. C., Purushotham A., Christensen S., Desmond P. M., Nagakane Y., Parsons M. W., et al. (2012). The infarct core is well represented by the acute diffusion lesion: sustained reversal is infrequent. J Cereb Blood Flow Metab 32(1): 50-56. [PMID: 21772309] Carmichael S. T. (2006). Cellular and molecular mechanisms of neural repair after stroke: making waves. Ann Neurol 59(5): 735-742. [PMID: 16634041] Carpentier N., Edjlali M., Bouhafs F., Roca P., Calvet D., Touze E., et al. (2012). Serial brain MRI in TIA patients. J Neuroradiol 39(3): 137-141. [PMID: 22742940] Carter A. R., Patel K. R., Astafiev S. V., Snyder A. Z., Rengachary J., Strube M. J., et al. (2012a). Upstream dysfunction of somatomotor functional connectivity after corticospinal damage in stroke. Neurorehabil Neural Repair 26(1): 7-19. [PMID: 21803932] Carter A. R., Shulman G. L., Corbetta M. (2012b). Why use a connectivity-based approach to study stroke and recovery of function? Neuroimage 62(4): 2271-2280. [PMID: 22414990] Cauley K. A., Filippi C. G. (2014). Apparent diffusion coefficient histogram analysis of neonatal hypoxic-ischemic encephalopathy. Pediatr Radiol 44(6): 738-746. [PMID: 24652007] Cereda C., Carrera E. (2012). Posterior cerebral artery territory infarctions. Front Neurol Neurosci 30: 128-131. [PMID: 22377879] Chalela J. A., Kidwell C. S., Nentwich L. M., Luby M., Butman J. A., Demchuk A. M., et al. (2007). Magnetic resonance imaging and computed tomography in emergency

207
assessment of patients with suspected acute stroke: a prospective comparison. Lancet 369(9558): 293-298. [PMID: 17258669] Chamorro A. (2007). Magnetic resonance perfusion diffusion mismatch, thrombolysis, and clinical outcome in acute stroke. J Neurol Neurosurg Psychiatry 78(5): 443. [PMID: 17135454] Chen C. L., Young S. H., Gan H. H., Singh R., Lao A. Y., Baroque A. C., 2nd, et al. (2013). Chinese medicine neuroaid efficacy on stroke recovery: a double-blind, placebo-controlled, randomized study. Stroke 44(8): 2093-2100. [PMID: 23780952] Chen G., Strzelecki M., Pang Q., Kim H., Stodkilde-Jorgensen H. (2010). Textures in magnetic resonance images of the ischemic rat brain treated with an anti-inflammatory agent. Clin Imaging 34(1): 7-13. [PMID: 20122513] Chen J., Zhang Z. G., Li Y., Wang Y., Wang L., Jiang H., et al. (2003). Statins induce angiogenesis, neurogenesis, and synaptogenesis after stroke. Ann Neurol 53(6): 743-751. [PMID: 12783420] Chen P. H., Gao S., Wang Y. J., Xu A. D., Li Y. S., Wang D. (2012). Classifying Ischemic Stroke, from TOAST to CISS. CNS Neurosci Ther 18(6): 452-456. [PMID: 22268862] Chen S., Zhang D. (2004). Robust image segmentation using FCM with spatial constraints based on new kernel-induced distance measure. IEEE Trans Syst Man Cybern B Cybern 34(4): 1907-1916. [PMID: 15462455] Chen Z., Yu H., Chen H. (2013). [Research on K-means clustering segmentation method for MRI brain image based on selecting multi-peaks in gray histogram]. Sheng Wu Yi Xue Gong Cheng Xue Za Zhi 30(6): 1164-1170. [PMID: 24645589] Chen Z. Z., Jiang X. D., Zhang L. L., Shang J. H., Du M. X., Xu G., et al. (2008). Beneficial effect of autologous transplantation of bone marrow stromal cells and endothelial progenitor cells on cerebral ischemia in rabbits. Neurosci Lett 445(1): 36-41. [PMID: 18755241] Chenevert T. L., Stegman L. D., Taylor J. M., Robertson P. L., Greenberg H. S., Rehemtulla A., et al. (2000). Diffusion magnetic resonance imaging: an early surrogate marker of therapeutic efficacy in brain tumors. J Natl Cancer Inst 92(24): 2029-2036. [PMID: 11121466] Cheng B., Brinkmann M., Forkert N. D., Treszl A., Ebinger M., Kohrmann M., et al. (2013). Quantitative measurements of relative fluid-attenuated inversion recovery (FLAIR) signal intensities in acute stroke for the prediction of time from symptom onset. J Cereb Blood Flow Metab 33(1): 76-84. [PMID: 23047272]
208
Chiba Y., Kinoshita M., Okita Y., Tsuboi A., Isohashi K., Kagawa N., et al. (2012). Use of (11)C-methionine PET parametric response map for monitoring WT1 immunotherapy response in recurrent malignant glioma. J Neurosurg 116(4): 835-842. [PMID: 22242671] Chimowitz M. I., Lynn M. J., Howlett-Smith H., Stern B. J., Hertzberg V. S., Frankel M. R., et al. (2005). Comparison of warfarin and aspirin for symptomatic intracranial arterial stenosis. N Engl J Med 352(13): 1305-1316. [PMID: 15800226] Chisholm R. A., Stenning S., Hawkins T. D. (1989). The accuracy of volumetric measurement of high-grade gliomas. Clin Radiol 40(1): 17-21. [PMID: 2920513] Choi S. H., Kim H. J., Hwangbo L., Kim Y. W. (2014). The minimum percentage of triolein emulsion for studying cerebral vascular permeability with least brain edema. Iran J Radiol 11(4): e14887. [PMID: 25780547] Chopp M., Li Y., Zhang Z. G. (2009). Mechanisms underlying improved recovery of neurological function after stroke in the rodent after treatment with neurorestorative cell-based therapies. Stroke 40(3 Suppl): S143-145. [PMID: 19064763] Christensen S., Calamante F., Hjort N., Wu O., Blankholm A. D., Desmond P., et al. (2008). Inferring origin of vascular supply from tracer arrival timing patterns using bolus tracking MRI. J Magn Reson Imaging 27(6): 1371-1381. [PMID: 18504757] Christou I., Burgin W. S., Alexandrov A. V., Grotta J. C. (2001). Arterial status after intravenous TPA therapy for ischaemic stroke. A need for further interventions. Int Angiol 20(3): 208-213. [PMID: 11573054] Chuang D. M., Wang Z., Chiu C. T. (2011). GSK-3 as a Target for Lithium-Induced Neuroprotection Against Excitotoxicity in Neuronal Cultures and Animal Models of Ischemic Stroke. Front Mol Neurosci 4: 15. [PMID: 21886605] Chuang K. S., Jan M. L., Wu J., Lu J. C., Chen S., Hsu C. H., et al. (2005). A maximum likelihood expectation maximization algorithm with thresholding. Comput Med Imaging Graph 29(7): 571-578. [PMID: 15994060] Chuang K. S., Tzeng H. L., Chen S., Wu J., Chen T. J. (2006). Fuzzy c-means clustering with spatial information for image segmentation. Comput Med Imaging Graph 30(1): 9-15. [PMID: 16361080] Chung E. M., Hague J. P., Chanrion M. A., Ramnarine K. V., Katsogridakis E., Evans D. H. (2010). Embolus trajectory through a physical replica of the major cerebral arteries.
209
Stroke 41(4): 647-652. [PMID: 20150542] Ciccone A., del Zoppo G. J. (2014). Evolving role of endovascular treatment of acute ischemic stroke. Curr Neurol Neurosci Rep 14(1): 416. [PMID: 24258466] Ciccone A., Valvassori L., Nichelatti M., Sgoifo A., Ponzio M., Sterzi R., et al. (2013). Endovascular treatment for acute ischemic stroke. N Engl J Med 368(10): 904-913. [PMID: 23387822] Cocosco C. A., Zijdenbos A. P., Evans A. C. (2003). A fully automatic and robust brain MRI tissue classification method. Med Image Anal 7(4): 513-527. [PMID: 14561555] Collier D. C., Burnett S. S., Amin M., Bilton S., Brooks C., Ryan A., et al. (2003). Assessment of consistency in contouring of normal-tissue anatomic structures. J Appl Clin Med Phys 4(1): 17-24. [PMID: 12540815] Copen W. A., Schaefer P. W., Wu O. (2011). MR perfusion imaging in acute ischemic stroke. Neuroimaging Clin N Am 21(2): 259-283, x. [PMID: 21640299] Cramer S. C., Shah R., Juranek J., Crafton K. R., Le V. (2006). Activity in the peri-infarct rim in relation to recovery from stroke. Stroke 37(1): 111-115. [PMID: 16306462] Dani K. A., Latour L. L., Warach S., Investigators N. N. H. o. S. (2012). Hyperintense vessel sign on fluid-attenuated inversion recovery MR imaging is reduced by gadolinium. AJNR Am J Neuroradiol 33(8): E112-114. [PMID: 22403777] Darby D. G., Barber P. A., Gerraty R. P., Desmond P. M., Yang Q., Parsons M., et al. (1999). Pathophysiological topography of acute ischemia by combined diffusion-weighted and perfusion MRI. Stroke 30(10): 2043-2052. [PMID: 10512905] Darsalia V., Heldmann U., Lindvall O., Kokaia Z. (2005). Stroke-induced neurogenesis in aged brain. Stroke 36(8): 1790-1795. [PMID: 16002766] Dastidar P., Heinonen T., Ahonen J. P., Jehkonen M., Molnar G. (2000). Volumetric measurements of right cerebral hemisphere infarction: use of a semiautomatic MRI segmentation technique. Comput Biol Med 30(1): 41-54. [PMID: 10695814] Davalos A., Alvarez-Sabin J., Castillo J., Diez-Tejedor E., Ferro J., Martinez-Vila E., et al. (2012). Citicoline in the treatment of acute ischaemic stroke: an international, randomised, multicentre, placebo-controlled study (ICTUS trial). Lancet 380(9839): 349-357. [PMID: 22691567] Davis S., Donnan G. A. (2014). Time is Penumbra: imaging, selection and outcome.
210
The Johann jacob wepfer award 2014. Cerebrovasc Dis 38(1): 59-72. [PMID: 25227260] Davis S. M., Donnan G. A., Parsons M. W., Levi C., Butcher K. S., Peeters A., et al. (2008). Effects of alteplase beyond 3 h after stroke in the Echoplanar Imaging Thrombolytic Evaluation Trial (EPITHET): a placebo-controlled randomised trial. Lancet Neurol 7(4): 299-309. [PMID: 18296121] Davis W. L., Warnock S. H., Harnsberger H. R., Parker D. L., Chen C. X. (1993). Intracranial MRA: single volume vs. multiple thin slab 3D time-of-flight acquisition. J Comput Assist Tomogr 17(1): 15-21. [PMID: 8419427] de Macedo Rodrigues K., Ben-Avi E., Sliva D. D., Choe M. S., Drottar M., Wang R., et al. (2015). A FreeSurfer-compliant consistent manual segmentation of infant brains spanning the 0-2 year age range. Front Hum Neurosci 9: 21. [PMID: 25741260] Decanniere C., Eleff S., Davis D., van Zijl P. C. (1995). Correlation of rapid changes in the average water diffusion constant and the concentrations of lactate and ATP breakdown products during global ischemia in cat brain. Magn Reson Med 34(3): 343-352. [PMID: 7500873] del Fresno M., Venere M., Clausse A. (2009). A combined region growing and deformable model method for extraction of closed surfaces in 3D CT and MRI scans. Comput Med Imaging Graph 33(5): 369-376. [PMID: 19346100] del Zoppo G. J. (2010). The neurovascular unit in the setting of stroke. J Intern Med 267(2): 156-171. [PMID: 20175864] del Zoppo G. J., Hallenbeck J. M. (2000). Advances in the vascular pathophysiology of ischemic stroke. Thromb Res 98(3): 73-81. [PMID: 10812160] del Zoppo G. J., Higashida R. T., Furlan A. J., Pessin M. S., Rowley H. A., Gent M. (1998). PROACT: a phase II randomized trial of recombinant pro-urokinase by direct arterial delivery in acute middle cerebral artery stroke. PROACT Investigators. Prolyse in Acute Cerebral Thromboembolism. Stroke 29(1): 4-11. [PMID: 9445320] del Zoppo G. J., Mabuchi T. (2003). Cerebral microvessel responses to focal ischemia. J Cereb Blood Flow Metab 23(8): 879-894. [PMID: 12902832] del Zoppo G. J., Milner R. (2006). Integrin-matrix interactions in the cerebral microvasculature. Arterioscler Thromb Vasc Biol 26(9): 1966-1975. [PMID: 16778120] del Zoppo G. J., Schmid-Schonbein G. W., Mori E., Copeland B. R., Chang C. M. (1991). Polymorphonuclear leukocytes occlude capillaries following middle cerebral artery

211
occlusion and reperfusion in baboons. Stroke 22(10): 1276-1283. [PMID: 1926239] DeLorenzo C., Papademetris X., Wu K., Vives K. P., Spencer D., Duncan J. S. (2006). Nonrigid 3D brain registration using intensity/feature information. Med Image Comput Comput Assist Interv 9(Pt 1): 932-939. [PMID: 17354980] Dereski M. O., Chopp M., Knight R. A., Rodolosi L. C., Garcia J. H. (1993). The heterogeneous temporal evolution of focal ischemic neuronal damage in the rat. Acta Neuropathol 85(3): 327-333. [PMID: 8460534] Despotovic I., Goossens B., Philips W. (2015). MRI segmentation of the human brain: challenges, methods, and applications. Comput Math Methods Med 2015: 450341. [PMID: 25945121] Despotovic I., Vansteenkiste E., Philips W. (2010). Brain volume segmentation in newborn infants using multi-modal MRI with a low inter-slice resolution. Conf Proc IEEE Eng Med Biol Soc 2010: 5038-5041. [PMID: 21096688] Detante O., Jaillard A., Moisan A., Barbieux M., Favre I. M., Garambois K., et al. (2014). Biotherapies in stroke. Rev Neurol (Paris) 170(12): 779-798. [PMID: 25459115] Detante O., Moisan A., Dimastromatteo J., Richard M. J., Riou L., Grillon E., et al. (2009). Intravenous administration of 99mTc-HMPAO-labeled human mesenchymal stem cells after stroke: in vivo imaging and biodistribution. Cell Transplant 18(12): 1369-1379. [PMID: 19849895] Ding G., Jiang Q., Li L., Zhang L., Zhang Z. G., Ledbetter K. A., et al. (2008). Magnetic resonance imaging investigation of axonal remodeling and angiogenesis after embolic stroke in sildenafil-treated rats. J Cereb Blood Flow Metab 28(8): 1440-1448. [PMID: 18418368] Ding G. L., Chopp M., Li L., Zhang L., Zhang Z. G., Li Q. J., et al. (2014). Magnetic Resonance Imaging of Stroke in the Rat. Bo Pu Xue Za Zhi 31(1): 116-132. [PMID: 24920874] Dirks M., Niessen L. W., van Wijngaarden J., Koudstaal P. J., Franke C. L., van Oostenbrugge R. J., et al. (2012). The effectiveness of thrombolysis with intravenous alteplase for acute ischemic stroke in daily practice. Int J Stroke 7(4): 289-292. [PMID: 22168317] Dirnagl U. (2012). Pathobiology of injury after stroke: the neurovascular unit and beyond. Ann N Y Acad Sci 1268: 21-25. [PMID: 22994217] Dirnagl U., Endres M. (2014). Found in translation: preclinical stroke research
212
predicts human pathophysiology, clinical phenotypes, and therapeutic outcomes. Stroke 45(5): 1510-1518. [PMID: 24652307] Dirnagl U., Iadecola C., Moskowitz M. A. (1999). Pathobiology of ischaemic stroke: an integrated view. Trends Neurosci 22(9): 391-397. [PMID: 10441299] Dirnagl U., Macleod M. R. (2009). Stroke research at a road block: the streets from adversity should be paved with meta-analysis and good laboratory practice. Br J Pharmacol 157(7): 1154-1156. [PMID: 19664136] Donnan G. A., Baron J. C., Ma H., Davis S. M. (2009). Penumbral selection of patients for trials of acute stroke therapy. Lancet Neurol 8(3): 261-269. [PMID: 19233036] Drenckhahn C., Winkler M. K., Major S., Scheel M., Kang E. J., Pinczolits A., et al. (2012). Correlates of spreading depolarization in human scalp electroencephalography. Brain 135(Pt 3): 853-868. [PMID: 22366798] Durukan A., Tatlisumak T. (2007). Acute ischemic stroke: overview of major experimental rodent models, pathophysiology, and therapy of focal cerebral ischemia. Pharmacol Biochem Behav 87(1): 179-197. [PMID: 17521716] Easton J. D., Saver J. L., Albers G. W., Alberts M. J., Chaturvedi S., Feldmann E., et al. (2009). Definition and evaluation of transient ischemic attack: a scientific statement for healthcare professionals from the American Heart Association/American Stroke Association Stroke Council; Council on Cardiovascular Surgery and Anesthesia; Council on Cardiovascular Radiology and Intervention; Council on Cardiovascular Nursing; and the Interdisciplinary Council on Peripheral Vascular Disease. The American Academy of Neurology affirms the value of this statement as an educational tool for neurologists. Stroke 40(6): 2276-2293. [PMID: 19423857] Eastwood J. D., Engelter S. T., MacFall J. F., Delong D. M., Provenzale J. M. (2003). Quantitative assessment of the time course of infarct signal intensity on diffusion-weighted images. AJNR Am J Neuroradiol 24(4): 680-687. [PMID: 12695203] Ebinger M., De Silva D. A., Christensen S., Parsons M. W., Markus R., Donnan G. A., et al. (2009). Imaging the penumbra - strategies to detect tissue at risk after ischemic stroke. J Clin Neurosci 16(2): 178-187. [PMID: 19097909] Eckert M. A., Vu Q., Xie K., Yu J., Liao W., Cramer S. C., et al. (2013). Evidence for high translational potential of mesenchymal stromal cell therapy to improve recovery from ischemic stroke. J Cereb Blood Flow Metab 33(9): 1322-1334. [PMID: 23756689] Edlow J. A. (2011). Evidence-based guideline: the role of diffusion and perfusion MRI for the diagnosis of acute ischemic stroke: report of the Therapeutics and
213
Technology Subcommittee of the American Academy of Neurology. Neurology 76(23): 2036; author reply 2038. [PMID: 21793246] Ehlers L., Andersen G., Clausen L. B., Bech M., Kjolby M. (2007). Cost-effectiveness of intravenous thrombolysis with alteplase within a 3-hour window after acute ischemic stroke. Stroke 38(1): 85-89. [PMID: 17122430] Eisenhauer E. A., Therasse P., Bogaerts J., Schwartz L. H., Sargent D., Ford R., et al. (2009). New response evaluation criteria in solid tumours: revised RECIST guideline (version 1.1). Eur J Cancer 45(2): 228-247. [PMID: 19097774] El-Koussy M., Schroth G., Brekenfeld C., Arnold M. (2014). Imaging of acute ischemic stroke. Eur Neurol 72(5-6): 309-316. [PMID: 25323674] Ellingson B. M., Cloughesy T. F., Lai A., Nghiemphu P. L., Pope W. B. (2012a). Nonlinear registration of diffusion-weighted images improves clinical sensitivity of functional diffusion maps in recurrent glioblastoma treated with bevacizumab. Magn Reson Med 67(1): 237-245. [PMID: 21702063] Ellingson B. M., Cloughesy T. F., Zaw T., Lai A., Nghiemphu P. L., Harris R., et al. (2012b). Functional diffusion maps (fDMs) evaluated before and after radiochemotherapy predict progression-free and overall survival in newly diagnosed glioblastoma. Neuro Oncol 14(3): 333-343. [PMID: 22270220] Ellingson B. M., Malkin M. G., Rand S. D., Connelly J. M., Quinsey C., LaViolette P. S., et al. (2010). Validation of functional diffusion maps (fDMs) as a biomarker for human glioma cellularity. J Magn Reson Imaging 31(3): 538-548. [PMID: 20187195] Engelter S. T., Wetzel S. G., Bonati L. H., Fluri F., Lyrer P. A. (2008). The clinical significance of diffusion-weighted MR imaging in stroke and TIA patients. Swiss Med Wkly 138(49-50): 729-740. [PMID: 19130326] Ergul A., Alhusban A., Fagan S. C. (2012). Angiogenesis: a harmonized target for recovery after stroke. Stroke 43(8): 2270-2274. [PMID: 22618382] Famakin B. M., Chimowitz M. I., Lynn M. J., Stern B. J., George M. G., Investigators W. T. (2009). Causes and severity of ischemic stroke in patients with symptomatic intracranial arterial stenosis. Stroke 40(6): 1999-2003. [PMID: 19407228] Fazekas F., Kleinert R., Roob G., Kleinert G., Kapeller P., Schmidt R., et al. (1999). Histopathologic analysis of foci of signal loss on gradient-echo T2*-weighted MR images in patients with spontaneous intracerebral hemorrhage: evidence of microangiopathy-related microbleeds. AJNR Am J Neuroradiol 20(4): 637-642. [PMID: 10319975]

214
Feldman H. M., Yeatman J. D., Lee E. S., Barde L. H., Gaman-Bean S. (2010). Diffusion tensor imaging: a review for pediatric researchers and clinicians. J Dev Behav Pediatr 31(4): 346-356. [PMID: 20453582] Fiebach J. B., Schellinger P. D., Geletneky K., Wilde P., Meyer M., Hacke W., et al. (2004). MRI in acute subarachnoid haemorrhage; findings with a standardised stroke protocol. Neuroradiology 46(1): 44-48. [PMID: 14655034] Fierstra J., Burkhardt J. K., van Niftrik C. H., Piccirelli M., Pangalu A., Kocian R., et al. (2016). Blood oxygen-level dependent functional assessment of cerebrovascular reactivity: Feasibility for intraoperative 3 Tesla MRI. Magn Reson Med: [PMID: 26918794] Fierstra J., Sobczyk O., Battisti-Charbonney A., Mandell D. M., Poublanc J., Crawley A. P., et al. (2013). Measuring cerebrovascular reactivity: what stimulus to use? J Physiol 591(Pt 23): 5809-5821. [PMID: 24081155] Fink K. R., Benjert J. L. (2015). Imaging of Nontraumatic Neuroradiology Emergencies. Radiol Clin North Am 53(4): 871-890, x. [PMID: 26046515] Fischer U., Arnold M., Nedeltchev K., Brekenfeld C., Ballinari P., Remonda L., et al. (2005). NIHSS score and arteriographic findings in acute ischemic stroke. Stroke 36(10): 2121-2125. [PMID: 16151026] Fischl B., Salat D. H., Busa E., Albert M., Dieterich M., Haselgrove C., et al. (2002). Whole brain segmentation: automated labeling of neuroanatomical structures in the human brain. Neuron 33(3): 341-355. [PMID: 11832223] Fischl B., van der Kouwe A., Destrieux C., Halgren E., Segonne F., Salat D. H., et al. (2004). Automatically parcellating the human cerebral cortex. Cereb Cortex 14(1): 11-22. [PMID: 14654453] Fisher M. (2004). The ischemic penumbra: identification, evolution and treatment concepts. Cerebrovasc Dis 17 Suppl 1: 1-6. [PMID: 14694275] Fisher M., Baron J. C. (2000). Which targets are relevant for therapy of acute ischemic stroke? Stroke 31(4): 984-986. [PMID: 10754012] Fletcher L. M., Barsotti J. B., Hornak J. P. (1993). A multispectral analysis of brain tissues. Magn Reson Med 29(5): 623-630. [PMID: 8505898] Fonarow G. C., Smith E. E., Saver J. L., Reeves M. J., Bhatt D. L., Grau-Sepulveda M. V., et al. (2011). Timeliness of tissue-type plasminogen activator therapy in acute
215
ischemic stroke: patient characteristics, hospital factors, and outcomes associated with door-to-needle times within 60 minutes. Circulation 123(7): 750-758. [PMID: 21311083] Forkert N. D., Kaesemann P., Treszl A., Siemonsen S., Cheng B., Handels H., et al. (2013). Comparison of 10 TTP and Tmax estimation techniques for MR perfusion-diffusion mismatch quantification in acute stroke. AJNR Am J Neuroradiol 34(9): 1697-1703. [PMID: 23538410] Forster C., Clark H. B., Ross M. E., Iadecola C. (1999). Inducible nitric oxide synthase expression in human cerebral infarcts. Acta Neuropathol 97(3): 215-220. [PMID: 10090667] Fransen P. S., Berkhemer O. A., Lingsma H. F., Beumer D., van den Berg L. A., Yoo A. J., et al. (2016). Time to Reperfusion and Treatment Effect for Acute Ischemic Stroke: A Randomized Clinical Trial. JAMA Neurol 73(2): 190-196. [PMID: 26716735] Fransen P. S., Beumer D., Berkhemer O. A., van den Berg L. A., Lingsma H., van der Lugt A., et al. (2014). MR CLEAN, a multicenter randomized clinical trial of endovascular treatment for acute ischemic stroke in the Netherlands: study protocol for a randomized controlled trial. Trials 15: 343. [PMID: 25179366] Friston K. J. (2011). Functional and effective connectivity: a review. Brain Connect 1(1): 13-36. [PMID: 22432952] Furlan A., Higashida R., Wechsler L., Gent M., Rowley H., Kase C., et al. (1999). Intra-arterial prourokinase for acute ischemic stroke. The PROACT II study: a randomized controlled trial. Prolyse in Acute Cerebral Thromboembolism. JAMA 282(21): 2003-2011. [PMID: 10591382] Galban C. J., Chenevert T. L., Meyer C. R., Tsien C., Lawrence T. S., Hamstra D. A., et al. (2011). Prospective analysis of parametric response map-derived MRI biomarkers: identification of early and distinct glioma response patterns not predicted by standard radiographic assessment. Clin Cancer Res 17(14): 4751-4760. [PMID: 21527563] Galban C. J., Chenevert T. L., Meyer C. R., Tsien C., Lawrence T. S., Hamstra D. A., et al. (2009a). The parametric response map is an imaging biomarker for early cancer treatment outcome. Nat Med 15(5): 572-576. [PMID: 19377487] Galban C. J., Han M. K., Boes J. L., Chughtai K. A., Meyer C. R., Johnson T. D., et al. (2012). Computed tomography-based biomarker provides unique signature for diagnosis of COPD phenotypes and disease progression. Nat Med 18(11): 1711-1715. [PMID: 23042237]

216
Galban C. J., Lemasson B., Hoff B. A., Johnson T. D., Sundgren P. C., Tsien C., et al. (2015a). Development of a Multiparametric Voxel-Based Magnetic Resonance Imaging Biomarker for Early Cancer Therapeutic Response Assessment. Tomography 1(1): 44-52. [PMID: 26568982] Galban C. J., Ma B., Malyarenko D., Pickles M. D., Heist K., Henry N. L., et al. (2015b). Multi-site clinical evaluation of DW-MRI as a treatment response metric for breast cancer patients undergoing neoadjuvant chemotherapy. PLoS One 10(3): e0122151. [PMID: 25816249] Galban C. J., Mukherji S. K., Chenevert T. L., Meyer C. R., Hamstra D. A., Bland P. H., et al. (2009b). A feasibility study of parametric response map analysis of diffusion-weighted magnetic resonance imaging scans of head and neck cancer patients for providing early detection of therapeutic efficacy. Transl Oncol 2(3): 184-190. [PMID: 19701503] Gandhi C. D., Johnson D. M., Patel A. B. (2007). The endovascular management of intracranial vascular disease including the MERCI device. Curr Treat Options Cardiovasc Med 9(2): 99-108. [PMID: 17484812] Gao S., Wang Y. J., Xu A. D., Li Y. S., Wang D. Z. (2011). Chinese ischemic stroke subclassification. Front Neurol 2: 6. [PMID: 21427797] Gao S., Zhao P., Lin C., Sun Y., Wang Y., Zhou Z., et al. (2014). Differentiation of human adipose-derived stem cells into neuron-like cells which are compatible with photocurable three-dimensional scaffolds. Tissue Eng Part A 20(7-8): 1271-1284. [PMID: 24251600] Garg A., Wong D., Popuri K., Poskitt K. J., Fitzpatrick K., Bjornson B., et al. (2014). Manually segmented template library for 8-year-old pediatric brain MRI data with 16 subcortical structures. J Med Imaging (Bellingham) 1(3): 034502. [PMID: 26158067] Garra B. S., Krasner B. H., Horii S. C., Ascher S., Mun S. K., Zeman R. K. (1993). Improving the distinction between benign and malignant breast lesions: the value of sonographic texture analysis. Ultrason Imaging 15(4): 267-285. [PMID: 8171752] Gennai S., Monsel A., Hao Q., Liu J., Gudapati V., Barbier E. L., et al. (2015). Cell-based therapy for traumatic brain injury. Br J Anaesth 115(2): 203-212. [PMID: 26170348] Gerriets T., Walberer M., Ritschel N., Tschernatsch M., Mueller C., Bachmann G., et al. (2009). Edema formation in the hyperacute phase of ischemic stroke. Laboratory investigation. J Neurosurg 111(5): 1036-1042. [PMID: 19408985]
217
Geva S., Sitte J. (1991). Adaptive nearest neighbor pattern classification. IEEE Trans Neural Netw 2(2): 318-322. [PMID: 18276387] Ghaye J., Kamat M. A., Corbino-Giunta L., Silacci P., Vergeres G., De Micheli G., et al. (2013). Image thresholding techniques for localization of sub-resolution fluorescent biomarkers. Cytometry A 83(11): 1001-1016. [PMID: 24105983] Giannelli M., Cosottini M., Michelassi M. C., Lazzarotti G., Belmonte G., Bartolozzi C., et al. (2010). Dependence of brain DTI maps of fractional anisotropy and mean diffusivity on the number of diffusion weighting directions. J Appl Clin Med Phys 11(1): 2927. [PMID: 20160677] Giles M. F., Rothwell P. M. (2007). Risk of stroke early after transient ischaemic attack: a systematic review and meta-analysis. Lancet Neurol 6(12): 1063-1072. [PMID: 17993293] Ginsberg M. D., Palesch Y. Y., Hill M. D., Martin R. H., Moy C. S., Barsan W. G., et al. (2013). High-dose albumin treatment for acute ischaemic stroke (ALIAS) Part 2: a randomised, double-blind, phase 3, placebo-controlled trial. Lancet Neurol 12(11): 1049-1058. [PMID: 24076337] Go A. S., Mozaffarian D., Roger V. L., Benjamin E. J., Berry J. D., Blaha M. J., et al. (2014). Heart disease and stroke statistics--2014 update: a report from the American Heart Association. Circulation 129(3): e28-e292. [PMID: 24352519] Goldstein L. B., Bertels C., Davis J. N. (1989). Interrater reliability of the NIH stroke scale. Arch Neurol 46(6): 660-662. [PMID: 2730378] Golestani A. M., Kwinta J. B., Strother S. C., Khatamian Y. B., Chen J. J. (2016). The association between cerebrovascular reactivity and resting-state fMRI functional connectivity in healthy adults: The influence of basal carbon dioxide. Neuroimage 132: 301-313. [PMID: 26908321] Gonzalez R. G. (2012). Clinical MRI of acute ischemic stroke. J Magn Reson Imaging 36(2): 259-271. [PMID: 22807220] Gonzalez R. G., Koroshetz W., Pryor J. (2002). Introduction to acute stroke imaging and intervention. Semin Roentgenol 37(3): 180-181. [PMID: 12226895] Goode S. D., Altaf N., Munshi S., MacSweeney S. T., Auer D. P. (2016). Impaired Cerebrovascular Reactivity Predicts Recurrent Symptoms in Patients with Carotid Artery Occlusion: A Hypercapnia BOLD fMRI Study. AJNR Am J Neuroradiol: [PMID: 27012300]
218
Goto M., Abe O., Hata J., Fukunaga I., Shimoji K., Kunimatsu A., et al. (2016). Adverse effects of metallic artifacts on voxel-wise analysis and tract-based spatial statistics in diffusion tensor imaging. Acta Radiol: [PMID: 27069095] Grand S., Tahon F., Attye A., Lefournier V., Le Bas J. F., Krainik A. (2013). Perfusion imaging in brain disease. Diagn Interv Imaging 94(12): 1241-1257. [PMID: 23876408] Grandin C. B. (2003). Assessment of brain perfusion with MRI: methodology and application to acute stroke. Neuroradiology 45(11): 755-766. [PMID: 14557902] Grangeon L., Macaigne V., Ozkul-Wermester O., Guegan-Massardier E., Lefaucheur R. (2016). Suspected stroke in a pregnant woman: Usefulness of arterial spin labeling MRI sequences. Presse Med 45(9): 794-796. [PMID: 27544705] Grau V., Mewes A. U., Alcaniz M., Kikinis R., Warfield S. K. (2004). Improved watershed transform for medical image segmentation using prior information. IEEE Trans Med Imaging 23(4): 447-458. [PMID: 15084070] Grech-Sollars M., Saunders D. E., Phipps K. P., Kaur R., Paine S. M., Jacques T. S., et al. (2014). Challenges for the functional diffusion map in pediatric brain tumors. Neuro Oncol 16(3): 449-456. [PMID: 24305721] Greenberg D. A., Jin K. (2013). Vascular endothelial growth factors (VEGFs) and stroke. Cell Mol Life Sci 70(10): 1753-1761. [PMID: 23475070] Grefkes C., Fink G. R. (2011). Reorganization of cerebral networks after stroke: new insights from neuroimaging with connectivity approaches. Brain 134(Pt 5): 1264-1276. [PMID: 21414995] Grossi E., Buscema M. (2007). Introduction to artificial neural networks. Eur J Gastroenterol Hepatol 19(12): 1046-1054. [PMID: 17998827] Guadagno J. V., Donnan G. A., Markus R., Gillard J. H., Baron J. C. (2004). Imaging the ischaemic penumbra. Curr Opin Neurol 17(1): 61-67. [PMID: 15090879] Gui L., Lisowski R., Faundez T., Huppi P. S., Lazeyras F., Kocher M. (2012). Morphology-driven automatic segmentation of MR images of the neonatal brain. Med Image Anal 16(8): 1565-1579. [PMID: 22921305] Guo Y. L., Zhang Z. P., Zhang G. S., Kong L. M., Rao H. B., Chen W., et al. (2016). Evaluation of mean diffusion and kurtosis MRI mismatch in subacute ischemic stroke: comparison with NIHSS score. Brain Res: [PMID: 27208488] Gutierrez-Fernandez M., Rodriguez-Frutos B., Ramos-Cejudo J., Teresa

219
Vallejo-Cremades M., Fuentes B., Cerdan S., et al. (2013). Effects of intravenous administration of allogenic bone marrow- and adipose tissue-derived mesenchymal stem cells on functional recovery and brain repair markers in experimental ischemic stroke. Stem Cell Res Ther 4(1): 11. [PMID: 23356495] Gutierrez M., Merino J. J., Alonso de Lecinana M., Diez-Tejedor E. (2009). Cerebral protection, brain repair, plasticity and cell therapy in ischemic stroke. Cerebrovasc Dis 27 Suppl 1: 177-186. [PMID: 19342849] Guzman R., Choi R., Gera A., De Los Angeles A., Andres R. H., Steinberg G. K. (2008). Intravascular cell replacement therapy for stroke. Neurosurg Focus 24(3-4): E15. [PMID: 18341391] Hacke W., Albers G., Al-Rawi Y., Bogousslavsky J., Davalos A., Eliasziw M., et al. (2005). The Desmoteplase in Acute Ischemic Stroke Trial (DIAS): a phase II MRI-based 9-hour window acute stroke thrombolysis trial with intravenous desmoteplase. Stroke 36(1): 66-73. [PMID: 15569863] Hacke W., Kaste M., Bluhmki E., Brozman M., Davalos A., Guidetti D., et al. (2008). Thrombolysis with alteplase 3 to 4.5 hours after acute ischemic stroke. N Engl J Med 359(13): 1317-1329. [PMID: 18815396] Hall D. E., Moffat B. A., Stojanovska J., Johnson T. D., Li Z., Hamstra D. A., et al. (2004). Therapeutic efficacy of DTI-015 using diffusion magnetic resonance imaging as an early surrogate marker. Clin Cancer Res 10(23): 7852-7859. [PMID: 15585617] Hall L. O., Bensaid A. M., Clarke L. P., Velthuizen R. P., Silbiger M. S., Bezdek J. C. (1992). A comparison of neural network and fuzzy clustering techniques in segmenting magnetic resonance images of the brain. IEEE Trans Neural Netw 3(5): 672-682. [PMID: 18276467] Hamstra D. A., Chenevert T. L., Moffat B. A., Johnson T. D., Meyer C. R., Mukherji S. K., et al. (2005). Evaluation of the functional diffusion map as an early biomarker of time-to-progression and overall survival in high-grade glioma. Proc Natl Acad Sci U S A 102(46): 16759-16764. [PMID: 16267128] Hamstra D. A., Galban C. J., Meyer C. R., Johnson T. D., Sundgren P. C., Tsien C., et al. (2008). Functional diffusion map as an early imaging biomarker for high-grade glioma: correlation with conventional radiologic response and overall survival. J Clin Oncol 26(20): 3387-3394. [PMID: 18541899] Harbeck-Seu A., Brunk I., Platz T., Vajkoczy P., Endres M., Spies C. (2011). A speedy recovery: amphetamines and other therapeutics that might impact the recovery from brain injury. Curr Opin Anaesthesiol 24(2): 144-153. [PMID: 21386667]
220
Harris R. J., Cloughesy T. F., Pope W. B., Nghiemphu P. L., Lai A., Zaw T., et al. (2012). 18F-FDOPA and 18F-FLT positron emission tomography parametric response maps predict response in recurrent malignant gliomas treated with bevacizumab. Neuro Oncol 14(8): 1079-1089. [PMID: 22711609] Harston G. W., Okell T. W., Sheerin F., Schulz U., Mathieson P., Reckless I., et al. (2016). Quantification of Serial Cerebral Blood Flow in Acute Stroke Using Arterial Spin Labeling. Stroke: [PMID: 27879446] Hasegawa Y., Fisher M., Latour L. L., Dardzinski B. J., Sotak C. H. (1994). MRI diffusion mapping of reversible and irreversible ischemic injury in focal brain ischemia. Neurology 44(8): 1484-1490. [PMID: 8058154] Hassan A. E., Rostambeigi N., Chaudhry S. A., Khan A. A., Zacharatos H., Khatri R., et al. (2013). Combination of noninvasive neurovascular imaging modalities in stroke patients: patterns of use and impact on need for digital subtraction angiography. J Stroke Cerebrovasc Dis 22(7): e53-58. [PMID: 22578916] Hata R., Maeda K., Hermann D., Mies G., Hossmann K. A. (2000). Dynamics of regional brain metabolism and gene expression after middle cerebral artery occlusion in mice. J Cereb Blood Flow Metab 20(2): 306-315. [PMID: 10698068] He L., Greenshields I. R. (2009). A nonlocal maximum likelihood estimation method for Rician noise reduction in MR images. IEEE Trans Med Imaging 28(2): 165-172. [PMID: 19188105] Heckemann R. A., Hajnal J. V., Aljabar P., Rueckert D., Hammers A. (2006). Automatic anatomical brain MRI segmentation combining label propagation and decision fusion. Neuroimage 33(1): 115-126. [PMID: 16860573] Heeger D. J., Ress D. (2002). What does fMRI tell us about neuronal activity? Nat Rev Neurosci 3(2): 142-151. [PMID: 11836522] Heiss W. D. (2000a). Ischemic penumbra: evidence from functional imaging in man. J Cereb Blood Flow Metab 20(9): 1276-1293. [PMID: 10994849] Heiss W. D., Grond M., Thiel A., von Stockhausen H. M., Rudolf J., Ghaemi M., et al. (1998). Tissue at risk of infarction rescued by early reperfusion: a positron emission tomography study in systemic recombinant tissue plasminogen activator thrombolysis of acute stroke. J Cereb Blood Flow Metab 18(12): 1298-1307. [PMID: 9850142] Heiss W. D., Kracht L., Grond M., Rudolf J., Bauer B., Wienhard K., et al. (2000b). Early

221
[(11)C]Flumazenil/H(2)O positron emission tomography predicts irreversible ischemic cortical damage in stroke patients receiving acute thrombolytic therapy. Stroke 31(2): 366-369. [PMID: 10657407] Held K., Rota Kops E., Krause B. J., Wells W. M., 3rd, Kikinis R., Muller-Gartner H. W. (1997). Markov random field segmentation of brain MR images. IEEE Trans Med Imaging 16(6): 878-886. [PMID: 9533587] Heldner M. R., Zubler C., Mattle H. P., Schroth G., Weck A., Mono M. L., et al. (2013). National Institutes of Health stroke scale score and vessel occlusion in 2152 patients with acute ischemic stroke. Stroke 44(4): 1153-1157. [PMID: 23471266] Helenius J., Perkio J., Soinne L., Ostergaard L., Carano R. A., Salonen O., et al. (2003). Cerebral hemodynamics in a healthy population measured by dynamic susceptibility contrast MR imaging. Acta Radiol 44(5): 538-546. [PMID: 14510762] Helgason C. M., Jobe T. H. (2001). Coexisting causes of ischemic stroke. Arch Neurol 58(4): 676. [PMID: 11296005] Hermann D. M., Kilic E., Hata R., Hossmann K. A., Mies G. (2001). Relationship between metabolic dysfunctions, gene responses and delayed cell death after mild focal cerebral ischemia in mice. Neuroscience 104(4): 947-955. [PMID: 11457582] Hermier M., Nighoghossian N., Derex L., Adeleine P., Wiart M., Berthezene Y., et al. (2003). Hypointense transcerebral veins at T2*-weighted MRI: a marker of hemorrhagic transformation risk in patients treated with intravenous tissue plasminogen activator. J Cereb Blood Flow Metab 23(11): 1362-1370. [PMID: 14600444] Hermier M., Nighoghossian N., Derex L., Wiart M., Nemoz C., Berthezene Y., et al. (2005). Hypointense leptomeningeal vessels at T2*-weighted MRI in acute ischemic stroke. Neurology 65(4): 652-653. [PMID: 16116143] Heyn C., Poublanc J., Crawley A., Mandell D., Han J. S., Tymianski M., et al. (2010). Quantification of cerebrovascular reactivity by blood oxygen level-dependent MR imaging and correlation with conventional angiography in patients with Moyamoya disease. AJNR Am J Neuroradiol 31(5): 862-867. [PMID: 20075092] Hirano T., Read S. J., Abbott D. F., Sachinidis J. I., Tochon-Danguy H. J., Egan G. F., et al. (1999). No evidence of hypoxic tissue on 18F-fluoromisonidazole PET after intracerebral hemorrhage. Neurology 53(9): 2179-2182. [PMID: 10599802] Hjort N., Butcher K., Davis S. M., Kidwell C. S., Koroshetz W. J., Rother J., et al. (2005a). Magnetic resonance imaging criteria for thrombolysis in acute cerebral infarct.
222
Stroke 36(2): 388-397. [PMID: 15618445] Hjort N., Christensen S., Solling C., Ashkanian M., Wu O., Rohl L., et al. (2005b). Ischemic injury detected by diffusion imaging 11 minutes after stroke. Ann Neurol 58(3): 462-465. [PMID: 16130095] Hjort N., Wu O., Ashkanian M., Solling C., Mouridsen K., Christensen S., et al. (2008). MRI detection of early blood-brain barrier disruption: parenchymal enhancement predicts focal hemorrhagic transformation after thrombolysis. Stroke 39(3): 1025-1028. [PMID: 18258832] Hoff B. A., Kozloff K. M., Boes J. L., Brisset J. C., Galban S., Van Poznak C. H., et al. (2012). Parametric response mapping of CT images provides early detection of local bone loss in a rat model of osteoporosis. Bone 51(1): 78-84. [PMID: 22542461] Hoff B. A., Toole M., Yablon C., Ross B. D., Luker G. D., VanPoznak C., et al. (2015). Potential for Early Fracture Risk Assessment in Patients with Metastatic Bone Disease using Parametric Response Mapping of CT Images. Tomography 1(2): 98-104. [PMID: 26771006] Honey C. J., Sporns O., Cammoun L., Gigandet X., Thiran J. P., Meuli R., et al. (2009). Predicting human resting-state functional connectivity from structural connectivity. Proc Natl Acad Sci U S A 106(6): 2035-2040. [PMID: 19188601] Hong H., Schonfeld D. (2008). Maximum-entropy expectation-maximization algorithm for image reconstruction and sensor field estimation. IEEE Trans Image Process 17(6): 897-907. [PMID: 18482885] Honmou O., Onodera R., Sasaki M., Waxman S. G., Kocsis J. D. (2012). Mesenchymal stem cells: therapeutic outlook for stroke. Trends Mol Med 18(5): 292-297. [PMID: 22459358] Hosseini S. M., Amiri M., Najarian S., Dargahi J. (2007). Application of artificial neural networks for the estimation of tumour characteristics in biological tissues. Int J Med Robot 3(3): 235-244. [PMID: 17577891] Hossmann K. A. (1996a). Excitotoxic mechanisms in focal ischemia. Adv Neurol 71: 69-74. [PMID: 8790791] Hossmann K. A. (1996b). Periinfarct depolarizations. Cerebrovasc Brain Metab Rev 8(3): 195-208. [PMID: 8870974] Hossmann K. A. (2006). Pathophysiology and therapy of experimental stroke. Cell Mol Neurobiol 26(7-8): 1057-1083. [PMID: 16710759]
223
Hossmann K. A. (2012). The two pathophysiologies of focal brain ischemia: implications for translational stroke research. J Cereb Blood Flow Metab 32(7): 1310-1316. [PMID: 22234335] Hsieh T. M., Liu Y. M., Liao C. C., Xiao F., Chiang I. J., Wong J. M. (2011). Automatic segmentation of meningioma from non-contrasted brain MRI integrating fuzzy clustering and region growing. BMC Med Inform Decis Mak 11: 54. [PMID: 21871082] Hummel F. C., Cohen L. G. (2006). Non-invasive brain stimulation: a new strategy to improve neurorehabilitation after stroke? Lancet Neurol 5(8): 708-712. [PMID: 16857577] Hurst R. W., Bosch E. P., Morris J. M., Dyck P. J., Reeves R. K. (2013). Inflammatory hypertrophic cauda equina following intrathecal neural stem cell injection. Muscle Nerve 48(5): 831-835. [PMID: 23740462] Hyde J. S., Biswal B. B., Jesmanowicz A. (2001). High-resolution fMRI using multislice partial k-space GR-EPI with cubic voxels. Magn Reson Med 46(1): 114-125. [PMID: 11443717] Iadecola C., Zhang F., Casey R., Nagayama M., Ross M. E. (1997). Delayed reduction of ischemic brain injury and neurological deficits in mice lacking the inducible nitric oxide synthase gene. J Neurosci 17(23): 9157-9164. [PMID: 9364062] Iglesias J. E., Van Leemput K., Bhatt P., Casillas C., Dutt S., Schuff N., et al. (2015). Bayesian segmentation of brainstem structures in MRI. Neuroimage 113: 184-195. [PMID: 25776214] Iijima T., Mies G., Hossmann K. A. (1992). Repeated negative DC deflections in rat cortex following middle cerebral artery occlusion are abolished by MK-801: effect on volume of ischemic injury. J Cereb Blood Flow Metab 12(5): 727-733. [PMID: 1506440] Imitola J., Park K. I., Teng Y. D., Nisim S., Lachyankar M., Ourednik J., et al. (2004). Stem cells: cross-talk and developmental programs. Philos Trans R Soc Lond B Biol Sci 359(1445): 823-837. [PMID: 15293810] Ingrisch M., Sourbron S. (2013). Tracer-kinetic modeling of dynamic contrast-enhanced MRI and CT: a primer. J Pharmacokinet Pharmacodyn 40(3): 281-300. [PMID: 23563847] Investigators I. I. T. (2007). The Interventional Management of Stroke (IMS) II Study. Stroke 38(7): 2127-2135. [PMID: 17525387]

224
Ishikawa H., Tajiri N., Shinozuka K., Vasconcellos J., Kaneko Y., Lee H. J., et al. (2013). Vasculogenesis in experimental stroke after human cerebral endothelial cell transplantation. Stroke 44(12): 3473-3481. [PMID: 24130140] Ito M., Ohki M., Hayashi K., Yamada M., Uetani M., Nakamura T. (1995). Trabecular texture analysis of CT images in the relationship with spinal fracture. Radiology 194(1): 55-59. [PMID: 7997582] James K., Eisenhauer E., Christian M., Terenziani M., Vena D., Muldal A., et al. (1999). Measuring response in solid tumors: unidimensional versus bidimensional measurement. J Natl Cancer Inst 91(6): 523-528. [PMID: 10088622] Jang S. H. (2009). A review of the ipsilateral motor pathway as a recovery mechanism in patients with stroke. NeuroRehabilitation 24(4): 315-320. [PMID: 19597268] Jansen O., Schellinger P., Fiebach J., Hacke W., Sartor K. (1999). Early recanalisation in acute ischaemic stroke saves tissue at risk defined by MRI. Lancet 353(9169): 2036-2037. [PMID: 10376621] Jauch E. C., Saver J. L., Adams H. P., Jr., Bruno A., Connors J. J., Demaerschalk B. M., et al. (2013). Guidelines for the early management of patients with acute ischemic stroke: a guideline for healthcare professionals from the American Heart Association/American Stroke Association. Stroke 44(3): 870-947. [PMID: 23370205] Jeong C. H., Kim S. M., Lim J. Y., Ryu C. H., Jun J. A., Jeun S. S. (2014). Mesenchymal stem cells expressing brain-derived neurotrophic factor enhance endogenous neurogenesis in an ischemic stroke model. Biomed Res Int 2014: 129145. [PMID: 24672780] Jeong H. S., Kwon H. J., Kang C. W., Song H. J., Koh H. S., Park S. M., et al. (2014). Predictive factors for early clinical improvement after intra-arterial thrombolytic therapy in acute ischemic stroke. J Stroke Cerebrovasc Dis 23(4): e283-289. [PMID: 24529352] Jiang H., He B., Fang D., Ma Z., Yang B., Zhang L. (2013). A region growing vessel segmentation algorithm based on spectrum information. Comput Math Methods Med 2013: 743870. [PMID: 24324524] Jiang J., Nakajima Y., Sohma Y., Saito T., Kin T., Oyama H., et al. (2016). Marker-less tracking of brain surface deformations by non-rigid registration integrating surface and vessel/sulci features. Int J Comput Assist Radiol Surg: [PMID: 26945999]
225
Jiang Q., Zhang Z. G., Chopp M. (2010). MRI of stroke recovery. Stroke 41(2): 410-414. [PMID: 20035069] Jiang Q., Zhang Z. G., Ding G. L., Silver B., Zhang L., Meng H., et al. (2006). MRI detects white matter reorganization after neural progenitor cell treatment of stroke. Neuroimage 32(3): 1080-1089. [PMID: 16860575] Jones D. K., Cercignani M. (2010). Twenty-five pitfalls in the analysis of diffusion MRI data. NMR Biomed 23(7): 803-820. [PMID: 20886566] Juan-Albarracin J., Fuster-Garcia E., Manjon J. V., Robles M., Aparici F., Marti-Bonmati L., et al. (2015). Automated glioblastoma segmentation based on a multiparametric structured unsupervised classification. PLoS One 10(5): e0125143. [PMID: 25978453] Juenemann M., Braun T., Doenges S., Nedelmann M., Mueller C., Bachmann G., et al. (2015). Aquaporin-4 autoantibodies increase vasogenic edema formation and infarct size in a rat stroke model. BMC Immunol 16: 30. [PMID: 25986484] Kabir Y., Dojat M., Scherrer B., Forbes F., Garbay C. (2007). Multimodal MRI segmentation of ischemic stroke lesions. Conf Proc IEEE Eng Med Biol Soc 2007: 1595-1598. [PMID: 18002276] Kaesemann P., Thomalla G., Cheng B., Treszl A., Fiehler J., Forkert N. D. (2014). Impact of Severe Extracranial ICA Stenosis on MRI Perfusion and Diffusion Parameters in Acute Ischemic Stroke. Front Neurol 5: 254. [PMID: 25538674] Kalladka D., Muir K. W. (2014). Brain repair: cell therapy in stroke. Stem Cells Cloning 7: 31-44. [PMID: 24627643] Kamran S., Bates V., Bakshi R., Wright P., Kinkel W., Miletich R. (2000). Significance of hyperintense vessels on FLAIR MRI in acute stroke. Neurology 55(2): 265-269. [PMID: 10908902] Kane I., Carpenter T., Chappell F., Rivers C., Armitage P., Sandercock P., et al. (2007). Comparison of 10 different magnetic resonance perfusion imaging processing methods in acute ischemic stroke: effect on lesion size, proportion of patients with diffusion/perfusion mismatch, clinical scores, and radiologic outcomes. Stroke 38(12): 3158-3164. [PMID: 17975106] Kaneko K., Kuwabara Y., Mihara F., Yoshiura T., Nakagawa M., Tanaka A., et al. (2004). Validation of the CBF, CBV, and MTT values by perfusion MRI in chronic occlusive cerebrovascular disease: a comparison with 15O-PET. Acad Radiol 11(5): 489-497. [PMID: 15147613]

226
Kaneko Y., Tajiri N., Shinozuka K., Glover L. E., Weinbren N. L., Cortes L., et al. (2012). Cell therapy for stroke: emphasis on optimizing safety and efficacy profile of endothelial progenitor cells. Curr Pharm Des 18(25): 3731-3734. [PMID: 22574986] Kang D. W., Kwon J. Y., Kwon S. U., Kim J. S. (2012a). Wake-up or unclear-onset strokes: are they waking up to the world of thrombolysis therapy? Int J Stroke 7(4): 311-320. [PMID: 22510216] Kang D. W., Sohn S. I., Hong K. S., Yu K. H., Hwang Y. H., Han M. K., et al. (2012b). Reperfusion therapy in unclear-onset stroke based on MRI evaluation (RESTORE): a prospective multicenter study. Stroke 43(12): 3278-3283. [PMID: 23093613] Kapur T., Grimson W. E., Wells W. M., 3rd, Kikinis R. (1996). Segmentation of brain tissue from magnetic resonance images. Med Image Anal 1(2): 109-127. [PMID: 9873924] Karki K., Knight R. A., Shen L. H., Kapke A., Lu M., Li Y., et al. (2010). Chronic brain tissue remodeling after stroke in rat: a 1-year multiparametric magnetic resonance imaging study. Brain Res 1360: 168-176. [PMID: 20828544] Kassner A., Liu F., Thornhill R. E., Tomlinson G., Mikulis D. J. (2009). Prediction of hemorrhagic transformation in acute ischemic stroke using texture analysis of postcontrast T1-weighted MR images. J Magn Reson Imaging 30(5): 933-941. [PMID: 19856407] Kassner A., Thornhill R. E. (2010). Texture analysis: a review of neurologic MR imaging applications. AJNR Am J Neuroradiol 31(5): 809-816. [PMID: 20395383] Kaufmann A. M., Firlik A. D., Fukui M. B., Wechsler L. R., Jungries C. A., Yonas H. (1999). Ischemic core and penumbra in human stroke. Stroke 30(1): 93-99. [PMID: 9880395] Kawabori M., Kuroda S., Sugiyama T., Ito M., Shichinohe H., Houkin K., et al. (2012). Intracerebral, but not intravenous, transplantation of bone marrow stromal cells enhances functional recovery in rat cerebral infarct: an optical imaging study. Neuropathology 32(3): 217-226. [PMID: 22007875] Kawamura S., Li Y., Shirasawa M., Yasui N., Fukasawa H. (1994). Reversible middle cerebral artery occlusion in rats using an intraluminal thread technique. Surg Neurol 41(5): 368-373. [PMID: 8009410] Kawano T., Anrather J., Zhou P., Park L., Wang G., Frys K. A., et al. (2006). Prostaglandin E2 EP1 receptors: downstream effectors of COX-2 neurotoxicity. Nat Med 12(2): 225-229. [PMID: 16432513]

227
Khatri P., Hill M. D., Palesch Y. Y., Spilker J., Jauch E. C., Carrozzella J. A., et al. (2008). Methodology of the Interventional Management of Stroke III Trial. Int J Stroke 3(2): 130-137. [PMID: 18706007] Khatri R., McKinney A. M., Swenson B., Janardhan V. (2012). Blood-brain barrier, reperfusion injury, and hemorrhagic transformation in acute ischemic stroke. Neurology 79(13 Suppl 1): S52-57. [PMID: 23008413] Kiang M. Y. (2003). A comparative assessment of classification methods. Decis Support Syst 35: 441-454. [PMID: XXXXXXXX] Kidambi A., Biglands J. D., Higgins D. M., Ripley D. P., Zaman A., Broadbent D. A., et al. (2014). Susceptibility-weighted cardiovascular magnetic resonance in comparison to T2 and T2 star imaging for detection of intramyocardial hemorrhage following acute myocardial infarction at 3 Tesla. J Cardiovasc Magn Reson 16: 86. [PMID: 25356834] Kidwell C. S., Alger J. R., Saver J. L. (2003). Beyond mismatch: evolving paradigms in imaging the ischemic penumbra with multimodal magnetic resonance imaging. Stroke 34(11): 2729-2735. [PMID: 14576370] Kidwell C. S., Jahan R., Gornbein J., Alger J. R., Nenov V., Ajani Z., et al. (2013a). A trial of imaging selection and endovascular treatment for ischemic stroke. N Engl J Med 368(10): 914-923. [PMID: 23394476] Kidwell C. S., Wintermark M., De Silva D. A., Schaewe T. J., Jahan R., Starkman S., et al. (2013b). Multiparametric MRI and CT models of infarct core and favorable penumbral imaging patterns in acute ischemic stroke. Stroke 44(1): 73-79. [PMID: 23233383] Kim B. J., Kang H. G., Kim H. J., Ahn S. H., Kim N. Y., Warach S., et al. (2014). Magnetic resonance imaging in acute ischemic stroke treatment. J Stroke 16(3): 131-145. [PMID: 25328872] Kim D. W., Staples M., Shinozuka K., Pantcheva P., Kang S. D., Borlongan C. V. (2013). Wharton's jelly-derived mesenchymal stem cells: phenotypic characterization and optimizing their therapeutic potential for clinical applications. Int J Mol Sci 14(6): 11692-11712. [PMID: 23727936] Kim I., Kim J. H., Moon S. O., Kwak H. J., Kim N. G., Koh G. Y. (2000). Angiopoietin-2 at high concentration can enhance endothelial cell survival through the phosphatidylinositol 3'-kinase/Akt signal transduction pathway. Oncogene 19(39): 4549-4552. [PMID: 11002428]

228
Kim J. E., Ryu H. J., Kang T. C. (2013). Status epilepticus induces vasogenic edema via tumor necrosis factor-alpha/ endothelin-1-mediated two different pathways. PLoS One 8(9): e74458. [PMID: 24040253] Kim S., Honmou O., Kato K., Nonaka T., Houkin K., Hamada H., et al. (2006). Neural differentiation potential of peripheral blood- and bone-marrow-derived precursor cells. Brain Res 1123(1): 27-33. [PMID: 17064670] Kim Y. W., Kang D. H., Hwang Y. H., Kim Y. S., Park S. P. (2013). Early Anticipation of Candidacy for Intra-Arterial Reperfusion Therapy Based on Baseline Clinical Stroke Subtypes: Comparison with Multiparametric MRI Taken within 4.5 Hours from Stroke Onset. Cerebrovasc Dis Extra 3(1): 85-94. [PMID: 23885261] Kimura K., Iguchi Y., Shibazaki K., Watanabe M., Iwanaga T., Aoki J. (2009). M1 susceptibility vessel sign on T2* as a strong predictor for no early recanalization after IV-t-PA in acute ischemic stroke. Stroke 40(9): 3130-3132. [PMID: 19556532] Kita H., Shima K., Tatsumi M., Chigasaki H. (1995). Cerebral blood flow and glucose metabolism of the ischemic rim in spontaneously hypertensive stroke-prone rats with occlusion of the middle cerebral artery. J Cereb Blood Flow Metab 15(2): 235-241. [PMID: 7860657] Kjaer L., Ring P., Thomsen C., Henriksen O. (1995). Texture analysis in quantitative MR imaging. Tissue characterisation of normal brain and intracranial tumours at 1.5 T. Acta Radiol 36(2): 127-135. [PMID: 7710790] Kloska S. P., Wintermark M., Engelhorn T., Fiebach J. B. (2010). Acute stroke magnetic resonance imaging: current status and future perspective. Neuroradiology 52(3): 189-201. [PMID: 19967531] Kobayashi Z., Akaza M., Endo H., Numasawa Y., Tomimitsu H., Shintani S. (2015). Deterioration of pre-existing hemiparesis due to an ipsilateral internal capsule infarction after a contralateral stroke. J Neurol Sci 354(1-2): 140-141. [PMID: 26025748] Koehler R. C., Roman R. J., Harder D. R. (2009). Astrocytes and the regulation of cerebral blood flow. Trends Neurosci 32(3): 160-169. [PMID: 19162338] Kohara A., Takahashi M., Yatsugi S., Tamura S., Shitaka Y., Hayashibe S., et al. (2008). Neuroprotective effects of the selective type 1 metabotropic glutamate receptor antagonist YM-202074 in rat stroke models. Brain Res 1191: 168-179. [PMID: 18164695] Kohno K., Hoehn-Berlage M., Mies G., Back T., Hossmann K. A. (1995). Relationship

229
between diffusion-weighted MR images, cerebral blood flow, and energy state in experimental brain infarction. Magn Reson Imaging 13(1): 73-80. [PMID: 7898282] Kolb B., Teskey G. C., Gibb R. (2010). Factors influencing cerebral plasticity in the normal and injured brain. Front Hum Neurosci 4: 204. [PMID: 21120136] Kolominsky-Rabas P. L., Weber M., Gefeller O., Neundoerfer B., Heuschmann P. U. (2001). Epidemiology of ischemic stroke subtypes according to TOAST criteria: incidence, recurrence, and long-term survival in ischemic stroke subtypes: a population-based study. Stroke 32(12): 2735-2740. [PMID: 11739965] Komatsu K., Honmou O., Suzuki J., Houkin K., Hamada H., Kocsis J. D. (2010). Therapeutic time window of mesenchymal stem cells derived from bone marrow after cerebral ischemia. Brain Res 1334: 84-92. [PMID: 20382136] Kondziolka D., Steinberg G. K., Wechsler L., Meltzer C. C., Elder E., Gebel J., et al. (2005). Neurotransplantation for patients with subcortical motor stroke: a phase 2 randomized trial. J Neurosurg 103(1): 38-45. [PMID: 16121971] Konig I. R., Ziegler A., Bluhmki E., Hacke W., Bath P. M., Sacco R. L., et al. (2008). Predicting long-term outcome after acute ischemic stroke: a simple index works in patients from controlled clinical trials. Stroke 39(6): 1821-1826. [PMID: 18403738] Koyama T., Marumoto K., Miyake H., Domen K. (2014). Relationship between diffusion tensor fractional anisotropy and long-term motor outcome in patients with hemiparesis after middle cerebral artery infarction. J Stroke Cerebrovasc Dis 23(9): 2397-2404. [PMID: 25169825] Kremser C., Judmaier W., Hein P., Griebel J., Lukas P., de Vries A. (2003). Preliminary results on the influence of chemoradiation on apparent diffusion coefficients of primary rectal carcinoma measured by magnetic resonance imaging. Strahlenther Onkol 179(9): 641-649. [PMID: 14628131] Krestan C. R., Nemec U., Nemec S. (2011). Imaging of insufficiency fractures. Semin Musculoskelet Radiol 15(3): 198-207. [PMID: 21644194] Krishnaswamy A., Klein J. P., Kapadia S. R. (2010). Clinical cerebrovascular anatomy. Catheter Cardiovasc Interv 75(4): 530-539. [PMID: 20049963] Kwon Y. H., Lee M. Y., Park J. W., Kang J. H., Yang D. S., Kim Y. H., et al. (2007). Differences of cortical activation pattern between cortical and corona radiata infarct. Neurosci Lett 417(2): 138-142. [PMID: 17403573] Labeyrie M. A., Turc G., Hess A., Hervo P., Mas J. L., Meder J. F., et al. (2012). Diffusion
230
lesion reversal after thrombolysis: a MR correlate of early neurological improvement. Stroke 43(11): 2986-2991. [PMID: 22996954] Lam J. M., Smielewski P., al-Rawi P., Griffiths P., Yu A. L., Pickard J. D., et al. (2000). Prediction of cerebral ischaemia during carotid endarterectomy with preoperative CO2-reactivity studies and angiography. Br J Neurosurg 14(5): 441-448. [PMID: 11198765] Lamy C., Oppenheim C., Calvet D., Domigo V., Naggara O., Meder J. L., et al. (2006). Diffusion-weighted MR imaging in transient ischaemic attacks. Eur Radiol 16(5): 1090-1095. [PMID: 16395534] Langhorne P., Bernhardt J., Kwakkel G. (2011). Stroke rehabilitation. Lancet 377(9778): 1693-1702. [PMID: 21571152] Lansberg M. G., Thijs V. N., O'Brien M. W., Ali J. O., de Crespigny A. J., Tong D. C., et al. (2001). Evolution of apparent diffusion coefficient, diffusion-weighted, and T2-weighted signal intensity of acute stroke. AJNR Am J Neuroradiol 22(4): 637-644. [PMID: 11290470] Latour L. L., Kang D. W., Ezzeddine M. A., Chalela J. A., Warach S. (2004). Early blood-brain barrier disruption in human focal brain ischemia. Ann Neurol 56(4): 468-477. [PMID: 15389899] Le Bihan D. (2003). Looking into the functional architecture of the brain with diffusion MRI. Nat Rev Neurosci 4(6): 469-480. [PMID: 12778119] Le Bihan D. (2014). Diffusion MRI: what water tells us about the brain. EMBO Mol Med 6(5): 569-573. [PMID: 24705876] Le Bihan D., Mangin J. F., Poupon C., Clark C. A., Pappata S., Molko N., et al. (2001). Diffusion tensor imaging: concepts and applications. J Magn Reson Imaging 13(4): 534-546. [PMID: 11276097] Lee J. M., Vo K. D., An H., Celik A., Lee Y., Hsu C. Y., et al. (2003). Magnetic resonance cerebral metabolic rate of oxygen utilization in hyperacute stroke patients. Ann Neurol 53(2): 227-232. [PMID: 12557290] Lee J. S., Hong J. M., Moon G. J., Lee P. H., Ahn Y. H., Bang O. Y., et al. (2010). A long-term follow-up study of intravenous autologous mesenchymal stem cell transplantation in patients with ischemic stroke. Stem Cells 28(6): 1099-1106. [PMID: 20506226] Lee K. C., Bradley D. A., Hussain M., Meyer C. R., Chenevert T. L., Jacobson J. A., et al.
231
(2007a). A feasibility study evaluating the functional diffusion map as a predictive imaging biomarker for detection of treatment response in a patient with metastatic prostate cancer to the bone. Neoplasia 9(12): 1003-1011. [PMID: 18084607] Lee K. C., Sud S., Meyer C. R., Moffat B. A., Chenevert T. L., Rehemtulla A., et al. (2007b). An imaging biomarker of early treatment response in prostate cancer that has metastasized to the bone. Cancer Res 67(8): 3524-3528. [PMID: 17440058] Lee K. J., Jung K. H., Byun J. I., Kim J. M., Roh J. K. (2014). Infarct pattern and clinical outcome in acute ischemic stroke following middle cerebral artery occlusion. Cerebrovasc Dis 38(1): 31-38. [PMID: 25196965] Lee L. J., Kidwell C. S., Alger J., Starkman S., Saver J. L. (2000). Impact on stroke subtype diagnosis of early diffusion-weighted magnetic resonance imaging and magnetic resonance angiography. Stroke 31(5): 1081-1089. [PMID: 10797169] Lee S. Y., Cha J. K., Kang M. J. (2009). Regional cerebral blood volume ratio on perfusion MRI on the growth of infarct size in acute ischemic stroke. Eur Neurol 62(5): 281-286. [PMID: 19690421] Leist M., Nicotera P. (1998). Apoptosis, excitotoxicity, and neuropathology. Exp Cell Res 239(2): 183-201. [PMID: 9521837] Leiva-Salinas C., Wintermark M., Kidwell C. S. (2011). Neuroimaging of cerebral ischemia and infarction. Neurotherapeutics 8(1): 19-27. [PMID: 21274682] Lestro Henriques I., Gutierrez-Fernandez M., Rodriguez-Frutos B., Ramos-Cejudo J., Otero-Ortega L., Navarro Hernanz T., et al. (2015). Intralesional Patterns of MRI ADC Maps Predict Outcome in Experimental Stroke. Cerebrovasc Dis 39(5-6): 293-301. [PMID: 25895451] Lewis C. M., Baldassarre A., Committeri G., Romani G. L., Corbetta M. (2009). Learning sculpts the spontaneous activity of the resting human brain. Proc Natl Acad Sci U S A 106(41): 17558-17563. [PMID: 19805061] Li B. N., Chui C. K., Chang S., Ong S. H. (2011). Integrating spatial fuzzy clustering with level set methods for automated medical image segmentation. Comput Biol Med 41(1): 1-10. [PMID: 21074756] Li L., Jiang Q., Ding G., Zhang L., Zhang Z. G., Li Q., et al. (2009). MRI identification of white matter reorganization enhanced by erythropoietin treatment in a rat model of focal ischemia. Stroke 40(3): 936-941. [PMID: 19150870] Li M., Ma R. N., Li L. H., Qu Y. Z., Gao G. D. (2013). Astragaloside IV reduces cerebral
232
edema post-ischemia/reperfusion correlating the suppression of MMP-9 and AQP4. Eur J Pharmacol 715(1-3): 189-195. [PMID: 23747593] Li W. Y., Choi Y. J., Lee P. H., Huh K., Kang Y. M., Kim H. S., et al. (2008). Mesenchymal stem cells for ischemic stroke: changes in effects after ex vivo culturing. Cell Transplant 17(9): 1045-1059. [PMID: 19177841] Li X., Zhao H. (2009). Weighted random subspace method for high dimensional data classification. Stat Interface 2(2): 153-159. [PMID: 21918713] Li Y., Hoover-Fong J., Carrino J. A., Mori S. (2011). Simultaneous segmentation and inhomogeneity correction in magnetic resonance images. Conf Proc IEEE Eng Med Biol Soc 2011: 8045-8048. [PMID: 22256208] Li Y., Liu Z., Xin H., Chopp M. (2014). The role of astrocytes in mediating exogenous cell-based restorative therapy for stroke. Glia 62(1): 1-16. [PMID: 24272702] Li Y., McIntosh K., Chen J., Zhang C., Gao Q., Borneman J., et al. (2006). Allogeneic bone marrow stromal cells promote glial-axonal remodeling without immunologic sensitization after stroke in rats. Exp Neurol 198(2): 313-325. [PMID: 16455080] Liapi E., Kamel I. R., Bluemke D. A., Jacobs M. A., Kim H. S. (2005). Assessment of response of uterine fibroids and myometrium to embolization using diffusion-weighted echoplanar MR imaging. J Comput Assist Tomogr 29(1): 83-86. [PMID: 15665689] Liebeskind D. S. (2003). Collateral circulation. Stroke 34(9): 2279-2284. [PMID: 12881609] Liebeskind D. S. (2005). Collaterals in acute stroke: beyond the clot. Neuroimaging Clin N Am 15(3): 553-573, x. [PMID: 16360589] Liebeskind D. S. (2009). Stroke: the currency of collateral circulation in acute ischemic stroke. Nat Rev Neurol 5(12): 645-646. [PMID: 19953114] Lima F. O., Furie K. L., Silva G. S., Lev M. H., Camargo E. C., Singhal A. B., et al. (2014). Prognosis of untreated strokes due to anterior circulation proximal intracranial arterial occlusions detected by use of computed tomography angiography. JAMA Neurol 71(2): 151-157. [PMID: 24323077] Lin L., Bivard A., Krishnamurthy V., Levi C. R., Parsons M. W. (2016). Whole-Brain CT Perfusion to Quantify Acute Ischemic Penumbra and Core. Radiology 279(3): 876-887. [PMID: 26785041]

233
Lin Z., Guo Z., Qiu L., Yang W., Lin M. (2016). The applied research of MRI with ASSET-EPI-FLAIR combined with 3D TOF MRA sequences in the assessment of patients with acute cerebral infarction. Acta Radiol: [PMID: 26853685] Lindley R. I., Warlow C. P., Wardlaw J. M., Dennis M. S., Slattery J., Sandercock P. A. (1993). Interobserver reliability of a clinical classification of acute cerebral infarction. Stroke 24(12): 1801-1804. [PMID: 8248958] Liu F., Akella P., Benashski S. E., Xu Y., McCullough L. D. (2010). Expression of Na-K-Cl cotransporter and edema formation are age dependent after ischemic stroke. Exp Neurol 224(2): 356-361. [PMID: 20406636] Liu J., Wang Y., Akamatsu Y., Lee C. C., Stetler R. A., Lawton M. T., et al. (2014). Vascular remodeling after ischemic stroke: mechanisms and therapeutic potentials. Prog Neurobiol 115: 138-156. [PMID: 24291532] Liu K. F., Li F., Tatlisumak T., Garcia J. H., Sotak C. H., Fisher M., et al. (2001). Regional variations in the apparent diffusion coefficient and the intracellular distribution of water in rat brain during acute focal ischemia. Stroke 32(8): 1897-1905. [PMID: 11486123] Liu S., Xu X., Cheng Q., Zu Q., Lu S., Yu J., et al. (2015). Simple quantitative measurement based on DWI to objectively judge DWI-FLAIR mismatch in a canine stroke model. Diagn Interv Radiol 21(4): 348-354. [PMID: 26038954] Loh P. S., Butcher K. S., Parsons M. W., MacGregor L., Desmond P. M., Tress B. M., et al. (2005). Apparent diffusion coefficient thresholds do not predict the response to acute stroke thrombolysis. Stroke 36(12): 2626-2631. [PMID: 16269645] Longa E. Z., Weinstein P. R., Carlson S., Cummins R. (1989). Reversible middle cerebral artery occlusion without craniectomy in rats. Stroke 20(1): 84-91. [PMID: 2643202] Lopez-Mejia M., Roldan-Valadez E. (2015). Comparisons of Apparent Diffusion Coefficient Values in Penumbra, Infarct, and Normal Brain Regions in Acute Ischemic Stroke: Confirmatory Data Using Bootstrap Confidence Intervals, Analysis of Variance, and Analysis of Means. J Stroke Cerebrovasc Dis: [PMID: 26654670] Lovett J. K., Coull A. J., Rothwell P. M. (2004). Early risk of recurrence by subtype of ischemic stroke in population-based incidence studies. Neurology 62(4): 569-573. [PMID: 14981172] Lu C. F., Wang P. S., Chou Y. C., Li H. C., Soong B. W., Wu Y. T. (2008). Segmentation of
234
diffusion-weighted brain images using expectation maximization algorithm initialized by hierarchical clustering. Conf Proc IEEE Eng Med Biol Soc 2008: 5502-5505. [PMID: 19163963] Lucas S. J., Tzeng Y. C., Galvin S. D., Thomas K. N., Ogoh S., Ainslie P. N. (2010). Influence of changes in blood pressure on cerebral perfusion and oxygenation. Hypertension 55(3): 698-705. [PMID: 20083726] Luitse M. J., Biessels G. J., Rutten G. E., Kappelle L. J. (2012). Diabetes, hyperglycaemia, and acute ischaemic stroke. Lancet Neurol 11(3): 261-271. [PMID: 22341034] Ma D., Cardoso M. J., Modat M., Powell N., Wells J., Holmes H., et al. (2014). Automatic structural parcellation of mouse brain MRI using multi-atlas label fusion. PLoS One 9(1): e86576. [PMID: 24475148] Ma J., Zhao L., Nowak T. S., Jr. (2006). Selective, reversible occlusion of the middle cerebral artery in rats by an intraluminal approach. Optimized filament design and methodology. J Neurosci Methods 156(1-2): 76-83. [PMID: 16581135] Machado L. S., Sazonova I. Y., Kozak A., Wiley D. C., El-Remessy A. B., Ergul A., et al. (2009). Minocycline and tissue-type plasminogen activator for stroke: assessment of interaction potential. Stroke 40(9): 3028-3033. [PMID: 19628804] Macintosh B. J., Graham S. J. (2013). Magnetic resonance imaging to visualize stroke and characterize stroke recovery: a review. Front Neurol 4: 60. [PMID: 23750149] Mack G. S. (2011). ReNeuron and StemCells get green light for neural stem cell trials. Nat Biotechnol 29(2): 95-97. [PMID: 21301419] Macrez R., Ali C., Toutirais O., Le Mauff B., Defer G., Dirnagl U., et al. (2011a). Stroke and the immune system: from pathophysiology to new therapeutic strategies. Lancet Neurol 10(5): 471-480. [PMID: 21511199] Macrez R., Obiang P., Gauberti M., Roussel B., Baron A., Parcq J., et al. (2011b). Antibodies preventing the interaction of tissue-type plasminogen activator with N-methyl-D-aspartate receptors reduce stroke damages and extend the therapeutic window of thrombolysis. Stroke 42(8): 2315-2322. [PMID: 21680906] Madai V. I., Wood C. N., Galinovic I., Grittner U., Piper S. K., Revankar G. S., et al. (2016). Clinical-Radiological Parameters Improve the Prediction of the Thrombolysis Time Window by Both MRI Signal Intensities and DWI-FLAIR Mismatch. Cerebrovasc Dis 42(1-2): 57-65. [PMID: 26986943]
235
Madden D. J., Bennett I. J., Burzynska A., Potter G. G., Chen N. K., Song A. W. (2012). Diffusion tensor imaging of cerebral white matter integrity in cognitive aging. Biochim Biophys Acta 1822(3): 386-400. [PMID: 21871957] Madinier A., Bertrand N., Mossiat C., Prigent-Tessier A., Beley A., Marie C., et al. (2009). Microglial involvement in neuroplastic changes following focal brain ischemia in rats. PLoS One 4(12): e8101. [PMID: 19956568] Maeda K., Hata R., Hossmann K. A. (1998). Differences in the cerebrovascular anatomy of C57black/6 and SV129 mice. Neuroreport 9(7): 1317-1319. [PMID: 9631421] Maier O., Wilms M., von der Gablentz J., Kramer U. M., Munte T. F., Handels H. (2015). Extra tree forests for sub-acute ischemic stroke lesion segmentation in MR sequences. J Neurosci Methods 240: 89-100. [PMID: 25448384] Maldjian J. A., Liu W. C., Hirschorn D., Murthy R., Semanczuk W. (1997). Wavelet transform-based image compression for transmission of MR data. AJR Am J Roentgenol 169(1): 23-26. [PMID: 9207495] Malik N., Hou Q., Vagal A., Patrie J., Xin W., Michel P., et al. (2014). Demographic and clinical predictors of leptomeningeal collaterals in stroke patients. J Stroke Cerebrovasc Dis 23(8): 2018-2022. [PMID: 25088172] Mandell D. M., Han J. S., Poublanc J., Crawley A. P., Fierstra J., Tymianski M., et al. (2011). Quantitative measurement of cerebrovascular reactivity by blood oxygen level-dependent MR imaging in patients with intracranial stenosis: preoperative cerebrovascular reactivity predicts the effect of extracranial-intracranial bypass surgery. AJNR Am J Neuroradiol 32(4): 721-727. [PMID: 21436343] Mandell D. M., Han J. S., Poublanc J., Crawley A. P., Stainsby J. A., Fisher J. A., et al. (2008). Mapping cerebrovascular reactivity using blood oxygen level-dependent MRI in Patients with arterial steno-occlusive disease: comparison with arterial spin labeling MRI. Stroke 39(7): 2021-2028. [PMID: 18451352] Manning N. W., Campbell B. C., Oxley T. J., Chapot R. (2014). Acute ischemic stroke: time, penumbra, and reperfusion. Stroke 45(2): 640-644. [PMID: 24399376] Mardor Y., Pfeffer R., Spiegelmann R., Roth Y., Maier S. E., Nissim O., et al. (2003). Early detection of response to radiation therapy in patients with brain malignancies using conventional and high b-value diffusion-weighted magnetic resonance imaging. J Clin Oncol 21(6): 1094-1100. [PMID: 12637476] Mardor Y., Roth Y., Ochershvilli A., Spiegelmann R., Tichler T., Daniels D., et al. (2004).
236
Pretreatment prediction of brain tumors' response to radiation therapy using high b-value diffusion-weighted MRI. Neoplasia 6(2): 136-142. [PMID: 15140402] Markus H., Cullinane M. (2001). Severely impaired cerebrovascular reactivity predicts stroke and TIA risk in patients with carotid artery stenosis and occlusion. Brain 124(Pt 3): 457-467. [PMID: 11222446] Marmarou A. (2007). A review of progress in understanding the pathophysiology and treatment of brain edema. Neurosurg Focus 22(5): E1. [PMID: 17613227] Marnane M., Duggan C. A., Sheehan O. C., Merwick A., Hannon N., Curtin D., et al. (2010). Stroke subtype classification to mechanism-specific and undetermined categories by TOAST, A-S-C-O, and causative classification system: direct comparison in the North Dublin population stroke study. Stroke 41(8): 1579-1586. [PMID: 20595675] Marrelec G., Benali H. (2009). A theoretical investigation of the relationship between structural equation modeling and partial correlation in functional MRI effective connectivity. Comput Intell Neurosci: 369341. [PMID: 19730736] Marroquin J. L., Vemuri B. C., Botello S., Calderon F., Fernandez-Bouzas A. (2002). An accurate and efficient bayesian method for automatic segmentation of brain MRI. IEEE Trans Med Imaging 21(8): 934-945. [PMID: 12472266] Marsh E. B., Llinas R. H., Schneider A. L., Hillis A. E., Lawrence E., Dziedzic P., et al. (2016). Predicting Hemorrhagic Transformation of Acute Ischemic Stroke: Prospective Validation of the HeRS Score. Medicine (Baltimore) 95(2): e2430. [PMID: 26765425] Martinsson L., Eksborg S. (2004). Drugs for stroke recovery: the example of amphetamines. Drugs Aging 21(2): 67-79. [PMID: 14960125] Mascalchi M., Filippi M., Floris R., Fonda C., Gasparotti R., Villari N. (2005). Diffusion-weighted MR of the brain: methodology and clinical application. Radiol Med 109(3): 155-197. [PMID: 15775887] Maulden S. A., Gassaway J., Horn S. D., Smout R. J., DeJong G. (2005). Timing of initiation of rehabilitation after stroke. Arch Phys Med Rehabil 86(12 Suppl 2): S34-S40. [PMID: 16373138] Mazziotta J., Toga A., Evans A., Fox P., Lancaster J., Zilles K., et al. (2001). A probabilistic atlas and reference system for the human brain: International Consortium for Brain Mapping (ICBM). Philos Trans R Soc Lond B Biol Sci 356(1412): 1293-1322. [PMID: 11545704]

237
McInerney T., Terzopoulos D. (1996). Deformable models in medical image analysis: a survey. Med Image Anal 1(2): 91-108. [PMID: 9873923] Mehta B., Leslie-Mazwi T. M., Chandra R. V., Chaudhry Z. A., Rabinov J. D., Hirsch J. A., et al. (2013). Assessing variability in neurointerventional practice patterns for acute ischemic stroke. J Neurointerv Surg 5 Suppl 1: i52-57. [PMID: 23235960] Meijs M., Christensen S., Lansberg M. G., Albers G. W., Calamante F. (2016). Analysis of perfusion MRI in stroke: To deconvolve, or not to deconvolve. Magn Reson Med 76(4): 1282-1290. [PMID: 26519871] Merwick A., Albers G. W., Amarenco P., Arsava E. M., Ay H., Calvet D., et al. (2010). Addition of brain and carotid imaging to the ABCD(2) score to identify patients at early risk of stroke after transient ischaemic attack: a multicentre observational study. Lancet Neurol 9(11): 1060-1069. [PMID: 20934388] Mezzapesa D. M., Petruzzellis M., Lucivero V., Prontera M., Tinelli A., Sancilio M., et al. (2006). Multimodal MR examination in acute ischemic stroke. Neuroradiology 48(4): 238-246. [PMID: 16508783] Mhairi Macrae I. (1992). New models of focal cerebral ischaemia. Br J Clin Pharmacol 34(4): 302-308. [PMID: 1457262] Michinaga S., Koyama Y. (2015). Pathogenesis of brain edema and investigation into anti-edema drugs. Int J Mol Sci 16(5): 9949-9975. [PMID: 25941935] Mies G., Iijima T., Hossmann K. A. (1993). Correlation between peri-infarct DC shifts and ischaemic neuronal damage in rat. Neuroreport 4(6): 709-711. [PMID: 8347812] Mijajlovic M. D. (2014). Thrombolytic or endovascular therapy for acute ischemic stroke: Time is brain. J Neurosci Rural Pract 5(1): 3-5. [PMID: 24741238] Mitra J., Bourgeat P., Fripp J., Ghose S., Rose S., Salvado O., et al. (2014). Lesion segmentation from multimodal MRI using random forest following ischemic stroke. Neuroimage 98: 324-335. [PMID: 24793830] Mitsios N., Gaffney J., Krupinski J., Mathias R., Wang Q., Hayward S., et al. (2007). Expression of signaling molecules associated with apoptosis in human ischemic stroke tissue. Cell Biochem Biophys 47(1): 73-86. [PMID: 17406061] Miyamoto N., Tanaka R., Shimura H., Watanabe T., Mori H., Onodera M., et al. (2010). Phosphodiesterase III inhibition promotes differentiation and survival of oligodendrocyte progenitors and enhances regeneration of ischemic white matter

238
lesions in the adult mammalian brain. J Cereb Blood Flow Metab 30(2): 299-310. [PMID: 19826432] Mlynash M., Lansberg M. G., De Silva D. A., Lee J., Christensen S., Straka M., et al. (2011). Refining the definition of the malignant profile: insights from the DEFUSE-EPITHET pooled data set. Stroke 42(5): 1270-1275. [PMID: 21474799] Moffat B. A., Chenevert T. L., Lawrence T. S., Meyer C. R., Johnson T. D., Dong Q., et al. (2005). Functional diffusion map: a noninvasive MRI biomarker for early stratification of clinical brain tumor response. Proc Natl Acad Sci U S A 102(15): 5524-5529. [PMID: 15805192] Moffat B. A., Chenevert T. L., Meyer C. R., McKeever P. E., Hall D. E., Hoff B. A., et al. (2006). The functional diffusion map: an imaging biomarker for the early prediction of cancer treatment outcome. Neoplasia 8(4): 259-267. [PMID: 16756718] Moffat B. A., Hall D. E., Stojanovska J., McConville P. J., Moody J. B., Chenevert T. L., et al. (2004). Diffusion imaging for evaluation of tumor therapies in preclinical animal models. MAGMA 17(3-6): 249-259. [PMID: 15580371] Mohr J. P., Caplan L. R., Melski J. W., Goldstein R. J., Duncan G. W., Kistler J. P., et al. (1978). The Harvard Cooperative Stroke Registry: a prospective registry. Neurology 28(8): 754-762. [PMID: 567291] Moisan A., Favre I., Rome C., De Fraipont F., Grillon E., Coquery N., et al. (2016). Intravenous injection of clinical grade human MSCs after experimental stroke: functional benefit and microvascular effect. Cell Transplant: [PMID: 26924704] Moisan A., Pannetier N., Grillon E., Richard M. J., de Fraipont F., Remy C., et al. (2012). Intracerebral injection of human mesenchymal stem cells impacts cerebral microvasculature after experimental stroke: MRI study. NMR Biomed 25(12): 1340-1348. [PMID: 22539476] Mokhtar G. M., Ibrahim W. E., Elbarbary N. S., Matter R. M., Ibrahim A. S., Sayed S. M. (2016). Pancreatic functions in adolescents with beta thalassemia major could predict cardiac and hepatic iron loading: relation to T2-star (T2*) magnetic resonance imaging. J Investig Med 64(3): 771-781. [PMID: 26912010] Moreau F., Modi J., Almekhlafi M., Bal S., Goyal M., Hill M. D., et al. (2013). Early magnetic resonance imaging in transient ischemic attack and minor stroke: do it or lose it. Stroke 44(3): 671-674. [PMID: 23390118] Morita N., Harada M., Satomi J., Terasawa Y., Kaji R., Nagahiro S. (2013). Frequency of emerging positive diffusion-weighted imaging in early repeat examinations at least

239
24 h after transient ischemic attacks. Neuroradiology 55(4): 399-403. [PMID: 23229844] Morita S., Masukawa A., Suzuki K., Hirata M., Kojima S., Ueno E. (2011). Unenhanced MR angiography: techniques and clinical applications in patients with chronic kidney disease. Radiographics 31(2): E13-33. [PMID: 21415179] Moskowitz M. A., Lo E. H., Iadecola C. (2010). The science of stroke: mechanisms in search of treatments. Neuron 67(2): 181-198. [PMID: 20670828] Mourand I., Milhaud D., Arquizan C., Lobotesis K., Schaub R., Machi P., et al. (2016). Favorable Bridging Therapy Based on DWI-FLAIR Mismatch in Patients with Unclear-Onset Stroke. AJNR Am J Neuroradiol 37(1): 88-93. [PMID: 26542231] Mouridsen K., Friston K., Hjort N., Gyldensted L., Ostergaard L., Kiebel S. (2006). Bayesian estimation of cerebral perfusion using a physiological model of microvasculature. Neuroimage 33(2): 570-579. [PMID: 16971140] Moustafa R. R., Baron J. C. (2008). Pathophysiology of ischaemic stroke: insights from imaging, and implications for therapy and drug discovery. Br J Pharmacol 153 Suppl 1: S44-54. [PMID: 18037922] Mozaffarian D., Benjamin E. J., Go A. S., Arnett D. K., Blaha M. J., Cushman M., et al. (2016). Heart Disease and Stroke Statistics-2016 Update: A Report From the American Heart Association. Circulation 133(4): e38-e360. [PMID: 26673558] Mukherjee P. (2005). Diffusion tensor imaging and fiber tractography in acute stroke. Neuroimaging Clin N Am 15(3): 655-665, xii. [PMID: 16360595] Mukherjee P., Kang H. C., Videen T. O., McKinstry R. C., Powers W. J., Derdeyn C. P. (2003). Measurement of cerebral blood flow in chronic carotid occlusive disease: comparison of dynamic susceptibility contrast perfusion MR imaging with positron emission tomography. AJNR Am J Neuroradiol 24(5): 862-871. [PMID: 12748086] Muoio V., Persson P. B., Sendeski M. M. (2014). The neurovascular unit - concept review. Acta Physiol (Oxf) 210(4): 790-798. [PMID: 24629161] Murphy T. H., Corbett D. (2009). Plasticity during stroke recovery: from synapse to behaviour. Nat Rev Neurosci 10(12): 861-872. [PMID: 19888284] Nael K., Meshksar A., Liebeskind D. S., Coull B. M., Krupinski E. A., Villablanca J. P. (2013). Quantitative analysis of hypoperfusion in acute stroke: arterial spin labeling versus dynamic susceptibility contrast. Stroke 44(11): 3090-3096. [PMID: 23988646]
240
Nagai N., Yoshioka C., Ito Y., Funakami Y., Nishikawa H., Kawabata A. (2015). Intravenous Administration of Cilostazol Nanoparticles Ameliorates Acute Ischemic Stroke in a Cerebral Ischemia/Reperfusion-Induced Injury Model. Int J Mol Sci 16(12): 29329-29344. [PMID: 26690139] Nagakane Y., Christensen S., Ogata T., Churilov L., Ma H., Parsons M. W., et al. (2012). Moving beyond a single perfusion threshold to define penumbra: a novel probabilistic mismatch definition. Stroke 43(6): 1548-1555. [PMID: 22499579] Nah H. W., Kang D. W., Kwon S. U., Kim J. S. (2010). Diversity of single small subcortical infarctions according to infarct location and parent artery disease: analysis of indicators for small vessel disease and atherosclerosis. Stroke 41(12): 2822-2827. [PMID: 20966406] Nakase T., Yoshioka S., Suzuki A. (2011). Free radical scavenger, edaravone, reduces the lesion size of lacunar infarction in human brain ischemic stroke. BMC Neurol 11: 39. [PMID: 21447190] Naveen S. R., Bhat V., Karthik G. A. (2015). Magnetic resonance angiographic evaluation of circle of Willis: A morphologic study in a tertiary hospital set up. Ann Indian Acad Neurol 18(4): 391-397. [PMID: 26713008] Newman G. C., Hospod F. E., Fain S. B., Cook T. D. (2006). Optimizing dynamic T2* MR imaging for measurement of cerebral blood flow using infusions for cerebral blood volume. AJNR Am J Neuroradiol 27(6): 1239-1240. [PMID: 16775272] Nogawa S., Zhang F., Ross M. E., Iadecola C. (1997). Cyclo-oxygenase-2 gene expression in neurons contributes to ischemic brain damage. J Neurosci 17(8): 2746-2755. [PMID: 9092596] Nogueira R. G., Lutsep H. L., Gupta R., Jovin T. G., Albers G. W., Walker G. A., et al. (2012). Trevo versus Merci retrievers for thrombectomy revascularisation of large vessel occlusions in acute ischaemic stroke (TREVO 2): a randomised trial. Lancet 380(9849): 1231-1240. [PMID: 22932714] Nomura E. M., Gratton C., Visser R. M., Kayser A., Perez F., D'Esposito M. (2010). Double dissociation of two cognitive control networks in patients with focal brain lesions. Proc Natl Acad Sci U S A 107(26): 12017-12022. [PMID: 20547857] Nour M., Liebeskind D. S. (2011). Brain imaging in stroke: insight beyond diagnosis. Neurotherapeutics 8(3): 330-339. [PMID: 21556679] Nour M., Liebeskind D. S. (2014). Imaging of cerebral ischemia: from acute stroke to chronic disorders. Neurol Clin 32(1): 193-209. [PMID: 24287390]

241
Nucifora P. G., Verma R., Lee S. K., Melhem E. R. (2007). Diffusion-tensor MR imaging and tractography: exploring brain microstructure and connectivity. Radiology 245(2): 367-384. [PMID: 17940300] O'Donnell M. E., Tran L., Lam T. I., Liu X. B., Anderson S. E. (2004). Bumetanide inhibition of the blood-brain barrier Na-K-Cl cotransporter reduces edema formation in the rat middle cerebral artery occlusion model of stroke. J Cereb Blood Flow Metab 24(9): 1046-1056. [PMID: 15356425] Odland A., Saervoll P., Advani R., Kurz M. W., Kurz K. D. (2015). Are the current MRI criteria using the DWI-FLAIR mismatch concept for selection of patients with wake-up stroke to thrombolysis excluding too many patients? Scand J Trauma Resusc Emerg Med 23: 22. [PMID: 25888410] Olivot J. M., Mlynash M., Thijs V. N., Kemp S., Lansberg M. G., Wechsler L., et al. (2009). Optimal Tmax threshold for predicting penumbral tissue in acute stroke. Stroke 40(2): 469-475. [PMID: 19109547] Olivot J. M., Mlynash M., Thijs V. N., Kemp S., Lansberg M. G., Wechsler L., et al. (2008). Relationships between infarct growth, clinical outcome, and early recanalization in diffusion and perfusion imaging for understanding stroke evolution (DEFUSE). Stroke 39(8): 2257-2263. [PMID: 18566302] Olivot J. M., Wolford C., Castle J., Mlynash M., Schwartz N. E., Lansberg M. G., et al. (2011). Two aces: transient ischemic attack work-up as outpatient assessment of clinical evaluation and safety. Stroke 42(7): 1839-1843. [PMID: 21617143] Onteniente B. (2013). The multiple aspects of stroke and stem cell therapy. Curr Mol Med 13(5): 821-831. [PMID: 23642063] Onteniente B., Polentes J. (2011). Regenerative medicine for stroke - are we there yet? Cerebrovasc Dis 31(6): 544-551. [PMID: 21487218] Oppenheim C., Grandin C., Samson Y., Smith A., Duprez T., Marsault C., et al. (2001). Is there an apparent diffusion coefficient threshold in predicting tissue viability in hyperacute stroke? Stroke 32(11): 2486-2491. [PMID: 11692005] Orlic D., Kajstura J., Chimenti S., Limana F., Jakoniuk I., Quaini F., et al. (2001). Mobilized bone marrow cells repair the infarcted heart, improving function and survival. Proc Natl Acad Sci U S A 98(18): 10344-10349. [PMID: 11504914] Ostergaard L. (2005). Principles of cerebral perfusion imaging by bolus tracking. J Magn Reson Imaging 22(6): 710-717. [PMID: 16261573]
242
Ozsunar Y., Sorensen A. G. (2000). Diffusion- and perfusion-weighted magnetic resonance imaging in human acute ischemic stroke: technical considerations. Top Magn Reson Imaging 11(5): 259-272. [PMID: 11142625] Paczkowska E., Kucia M., Koziarska D., Halasa M., Safranow K., Masiuk M., et al. (2009). Clinical evidence that very small embryonic-like stem cells are mobilized into peripheral blood in patients after stroke. Stroke 40(4): 1237-1244. [PMID: 19246697] Pannasch U., Vargova L., Reingruber J., Ezan P., Holcman D., Giaume C., et al. (2011). Astroglial networks scale synaptic activity and plasticity. Proc Natl Acad Sci U S A 108(20): 8467-8472. [PMID: 21536893] Pannek K., Chalk J. B., Finnigan S., Rose S. E. (2009). Dynamic corticospinal white matter connectivity changes during stroke recovery: a diffusion tensor probabilistic tractography study. J Magn Reson Imaging 29(3): 529-536. [PMID: 19243034] Pantic I., Pantic S., Paunovic J., Perovic M. (2013). Nuclear entropy, angular second moment, variance and texture correlation of thymus cortical and medullar lymphocytes: grey level co-occurrence matrix analysis. An Acad Bras Cienc 85(3): 1063-1072. [PMID: 23969846] Papaconstadopoulos P., Levesque I. R., Maglieri R., Seuntjens J. (2016). Direct reconstruction of the source intensity distribution of a clinical linear accelerator using a maximum likelihood expectation maximization algorithm. Phys Med Biol 61(3): 1078-1094. [PMID: 26758232] Parent J. M., Vexler Z. S., Gong C., Derugin N., Ferriero D. M. (2002). Rat forebrain neurogenesis and striatal neuron replacement after focal stroke. Ann Neurol 52(6): 802-813. [PMID: 12447935] Park D. H., Borlongan C. V., Willing A. E., Eve D. J., Cruz L. E., Sanberg C. D., et al. (2009). Human umbilical cord blood cell grafts for brain ischemia. Cell Transplant 18(9): 985-998. [PMID: 19523333] Park S., Lee J., Lee H., Shin J., Seo J., Lee K. H., et al. (2014). Parallelized seeded region growing using CUDA. Comput Math Methods Med 2014: 856453. [PMID: 25309619] Parsons M. W., Barber P. A., Chalk J., Darby D. G., Rose S., Desmond P. M., et al. (2002). Diffusion- and perfusion-weighted MRI response to thrombolysis in stroke. Ann Neurol 51(1): 28-37. [PMID: 11782981]
243
Paschen W. (2003). Shutdown of translation: lethal or protective? Unfolded protein response versus apoptosis. J Cereb Blood Flow Metab 23(7): 773-779. [PMID: 12843781] Passat N., Ronse C., Baruthio J., Armspach J. P., Maillot C., Jahn C. (2005). Region-growing segmentation of brain vessels: an atlas-based automatic approach. J Magn Reson Imaging 21(6): 715-725. [PMID: 15906324] Patel J. L., Goyal R. K. (2007). Applications of artificial neural networks in medical science. Curr Clin Pharmacol 2(3): 217-226. [PMID: 18690868] Paulson O. B., Hasselbalch S. G., Rostrup E., Knudsen G. M., Pelligrino D. (2010). Cerebral blood flow response to functional activation. J Cereb Blood Flow Metab 30(1): 2-14. [PMID: 19738630] Pekna M., Pekny M., Nilsson M. (2012). Modulation of neural plasticity as a basis for stroke rehabilitation. Stroke 43(10): 2819-2828. [PMID: 22923444] Penumbra Pivotal Stroke Trial I. (2009). The penumbra pivotal stroke trial: safety and effectiveness of a new generation of mechanical devices for clot removal in intracranial large vessel occlusive disease. Stroke 40(8): 2761-2768. [PMID: 19590057] Perez de Alejo R., Ruiz-Cabello J., Cortijo M., Rodriguez I., Echave I., Regadera J., et al. (2003). Computer-assisted enhanced volumetric segmentation magnetic resonance imaging data using a mixture of artificial neural networks. Magn Reson Imaging 21(8): 901-912. [PMID: 14599541] Petcharunpaisan S., Ramalho J., Castillo M. (2010). Arterial spin labeling in neuroimaging. World J Radiol 2(10): 384-398. [PMID: 21161024] Pham D. L., Xu C., Prince J. L. (2000). Current methods in medical image segmentation. Annu Rev Biomed Eng 2: 315-337. [PMID: 11701515] Phan K., Zhao D. F., Phan S., Huo Y. R., Mobbs R. J., Rao P. J., et al. (2016). Endovascular therapy including thrombectomy for acute ischemic stroke: A systematic review and meta-analysis with trial sequential analysis. J Clin Neurosci 29: 38-45. [PMID: 26947342] Piironen K., Tiainen M., Mustanoja S., Kaukonen K. M., Meretoja A., Tatlisumak T., et al. (2014). Mild hypothermia after intravenous thrombolysis in patients with acute stroke: a randomized controlled trial. Stroke 45(2): 486-491. [PMID: 24436240] Pohl K. M., Fisher J., Grimson W. E., Kikinis R., Wells W. M. (2006). A Bayesian model
244
for joint segmentation and registration. Neuroimage 31(1): 228-239. [PMID: 16466677] Poli S., Veltkamp R. (2009). Oxygen therapy in acute ischemic stroke - experimental efficacy and molecular mechanisms. Curr Mol Med 9(2): 227-241. [PMID: 19275631] Pope W. B., Kim H. J., Huo J., Alger J., Brown M. S., Gjertson D., et al. (2009). Recurrent glioblastoma multiforme: ADC histogram analysis predicts response to bevacizumab treatment. Radiology 252(1): 182-189. [PMID: 19561256] Pope W. B., Qiao X. J., Kim H. J., Lai A., Nghiemphu P., Xue X., et al. (2012). Apparent diffusion coefficient histogram analysis stratifies progression-free and overall survival in patients with recurrent GBM treated with bevacizumab: a multi-center study. J Neurooncol 108(3): 491-498. [PMID: 22426926] Prasad K., Mohanty S., Bhatia R., Srivastava M. V., Garg A., Srivastava A., et al. (2012). Autologous intravenous bone marrow mononuclear cell therapy for patients with subacute ischaemic stroke: a pilot study. Indian J Med Res 136(2): 221-228. [PMID: 22960888] Pugh K. R., Mencl W. E., Shaywitz B. A., Shaywitz S. E., Fulbright R. K., Constable R. T., et al. (2000). The angular gyrus in developmental dyslexia: task-specific differences in functional connectivity within posterior cortex. Psychol Sci 11(1): 51-56. [PMID: 11228843] Puig J., Blasco G., Daunis I. E. J., Thomalla G., Castellanos M., Soria G., et al. (2013). Increased corticospinal tract fractional anisotropy can discriminate stroke onset within the first 4.5 hours. Stroke 44(4): 1162-1165. [PMID: 23463753] Purushotham A., Campbell B. C., Straka M., Mlynash M., Olivot J. M., Bammer R., et al. (2015). Apparent diffusion coefficient threshold for delineation of ischemic core. Int J Stroke 10(3): 348-353. [PMID: 23802548] Qin W., Zhang M., Piao Y., Guo D., Zhu Z., Tian X., et al. (2012). Wallerian degeneration in central nervous system: dynamic associations between diffusion indices and their underlying pathology. PLoS One 7(7): e41441. [PMID: 22829950] Rajchl M., Baxter J. S., McLeod A. J., Yuan J., Qiu W., Peters T. M., et al. (2015). Hierarchical max-flow segmentation framework for multi-atlas segmentation with Kohonen self-organizing map based Gaussian mixture modeling. Med Image Anal: [PMID: 26072170] Rathore J. A., Kango Z. A., Nazir M., Mehraj A. (2013). Risk factors for stroke: a prospective hospital based study. J Ayub Med Coll Abbottabad 25(1-2): 19-22. [PMID: 25098044]
245
Reddick W. E., Glass J. O., Cook E. N., Elkin T. D., Deaton R. J. (1997). Automated segmentation and classification of multispectral magnetic resonance images of brain using artificial neural networks. IEEE Trans Med Imaging 16(6): 911-918. [PMID: 9533591] Rehme A. K., Grefkes C. (2013). Cerebral network disorders after stroke: evidence from imaging-based connectivity analyses of active and resting brain states in humans. J Physiol 591(Pt 1): 17-31. [PMID: 23090951] Rempp K. A., Brix G., Wenz F., Becker C. R., Guckel F., Lorenz W. J. (1994). Quantification of regional cerebral blood flow and volume with dynamic susceptibility contrast-enhanced MR imaging. Radiology 193(3): 637-641. [PMID: 7972800] Rha J. H., Saver J. L. (2007). The impact of recanalization on ischemic stroke outcome: a meta-analysis. Stroke 38(3): 967-973. [PMID: 17272772] Rivest-Henault D., Cheriet M. (2011). Unsupervised MRI segmentation of brain tissues using a local linear model and level set. Magn Reson Imaging 29(2): 243-259. [PMID: 20951521] Rodriguez-Yanez M., Sobrino T., Arias S., Vazquez-Herrero F., Brea D., Blanco M., et al. (2011). Early biomarkers of clinical-diffusion mismatch in acute ischemic stroke. Stroke 42(10): 2813-2818. [PMID: 21836082] Rohlfing T., Russakoff D. B., Maurer C. R. (2003). Expectation maximization strategies for multi-atlas multi-label segmentation. Inf Process Med Imaging 18: 210-221. [PMID: 15344459] Roitberg B. (2004). Transplantation for stroke. Neurol Res 26(3): 256-264. [PMID: 15142317] Rosenblum S., Wang N., Smith T. N., Pendharkar A. V., Chua J. Y., Birk H., et al. (2012). Timing of intra-arterial neural stem cell transplantation after hypoxia-ischemia influences cell engraftment, survival, and differentiation. Stroke 43(6): 1624-1631. [PMID: 22535265] Ross B. D., Moffat B. A., Lawrence T. S., Mukherji S. K., Gebarski S. S., Quint D. J., et al. (2003). Evaluation of cancer therapy using diffusion magnetic resonance imaging. Mol Cancer Ther 2(6): 581-587. [PMID: 12813138] Rouhl R. P., van Oostenbrugge R. J., Damoiseaux J., Tervaert J. W., Lodder J. (2008). Endothelial progenitor cell research in stroke: a potential shift in
246
pathophysiological and therapeutical concepts. Stroke 39(7): 2158-2165. [PMID: 18451350] Ruan S., Jaggi C., Xue J., Fadili J., Bloyet D. (2000). Brain tissue classification of magnetic resonance images using partial volume modeling. IEEE Trans Med Imaging 19(12): 1179-1187. [PMID: 11212366] Rudin M., Baumann D., Ekatodramis D., Stirnimann R., McAllister K. H., Sauter A. (2001). MRI analysis of the changes in apparent water diffusion coefficient, T(2) relaxation time, and cerebral blood flow and volume in the temporal evolution of cerebral infarction following permanent middle cerebral artery occlusion in rats. Exp Neurol 169(1): 56-63. [PMID: 11312558] Runge V. M., Kirsch J. E., Lee C. (1993). Contrast-enhanced MR angiography. J Magn Reson Imaging 3(1): 233-239. [PMID: 8428091] Rymner M. M., Akhtar N., Martin C., Summers D. (2010). Management of acute ischemic stroke: time is brain. Mo Med 107(5): 333-337. [PMID: 21207786] Sairanen T., Szepesi R., Karjalainen-Lindsberg M. L., Saksi J., Paetau A., Lindsberg P. J. (2009). Neuronal caspase-3 and PARP-1 correlate differentially with apoptosis and necrosis in ischemic human stroke. Acta Neuropathol 118(4): 541-552. [PMID: 19529948] Sakoh M., Ohnishi T., Ostergaard L., Gjedde A. (2003). Prediction of tissue survival after stroke based on changes in the apparent diffusion of water (cytotoxic edema). Acta Neurochir Suppl 86: 137-140. [PMID: 14753421] Salas-Gonzalez D., Gorriz J. M., Ramirez J., Schloegl M., Lang E. W., Ortiz A. (2013). Parameterization of the distribution of white and grey matter in MRI using the alpha-stable distribution. Comput Biol Med 43(5): 559-567. [PMID: 23485201] Samaille T., Fillon L., Cuingnet R., Jouvent E., Chabriat H., Dormont D., et al. (2012). Contrast-based fully automatic segmentation of white matter hyperintensities: method and validation. PLoS One 7(11): e48953. [PMID: 23152828] Saqqur M., Uchino K., Demchuk A. M., Molina C. A., Garami Z., Calleja S., et al. (2007). Site of arterial occlusion identified by transcranial Doppler predicts the response to intravenous thrombolysis for stroke. Stroke 38(3): 948-954. [PMID: 17290031] Sarraj A., Grotta J. C. (2014). Stroke: new horizons in treatment. Lancet Neurol 13(1): 2-3. [PMID: 24331780] Saver J. L. (2006). Time is brain--quantified. Stroke 37(1): 263-266. [PMID: 16339467]

247
Saver J. L., Jahan R., Levy E. I., Jovin T. G., Baxter B., Nogueira R. G., et al. (2012). Solitaire flow restoration device versus the Merci Retriever in patients with acute ischaemic stroke (SWIFT): a randomised, parallel-group, non-inferiority trial. Lancet 380(9849): 1241-1249. [PMID: 22932715] Saver J. L., Kidwell C., Eckstein M., Starkman S., Investigators F.-M. P. T. (2004). Prehospital neuroprotective therapy for acute stroke: results of the Field Administration of Stroke Therapy-Magnesium (FAST-MAG) pilot trial. Stroke 35(5): e106-108. [PMID: 15017009] Schaefer P. W., Pulli B., Copen W. A., Hirsch J. A., Leslie-Mazwi T., Schwamm L. H., et al. (2015). Combining MRI with NIHSS thresholds to predict outcome in acute ischemic stroke: value for patient selection. AJNR Am J Neuroradiol 36(2): 259-264. [PMID: 25258369] Schellinger P. D., Fiebach J. B., Hacke W. (2003). Imaging-based decision making in thrombolytic therapy for ischemic stroke: present status. Stroke 34(2): 575-583. [PMID: 12574579] Scherrer B., Dojat M., Forbes F., Garbay C. (2007). LOCUS: local cooperative unified segmentation of MRI brain scans. Med Image Comput Comput Assist Interv 10(Pt 1): 219-227. [PMID: 18051062] Schlaug G., Benfield A., Baird A. E., Siewert B., Lovblad K. O., Parker R. A., et al. (1999). The ischemic penumbra: operationally defined by diffusion and perfusion MRI. Neurology 53(7): 1528-1537. [PMID: 10534263] Schlaug G., Marchina S., Norton A. (2009). Evidence for plasticity in white-matter tracts of patients with chronic Broca's aphasia undergoing intense intonation-based speech therapy. Ann N Y Acad Sci 1169: 385-394. [PMID: 19673813] Schmidt A., Wellmann J., Schilling M., Strecker J. K., Sommer C., Schabitz W. R., et al. (2014). Meta-analysis of the efficacy of different training strategies in animal models of ischemic stroke. Stroke 45(1): 239-247. [PMID: 24178915] Schwarting S., Litwak S., Hao W., Bahr M., Weise J., Neumann H. (2008). Hematopoietic stem cells reduce postischemic inflammation and ameliorate ischemic brain injury. Stroke 39(10): 2867-2875. [PMID: 18658037] Scremin O. U., Sonnenschein R. R., Rubinstein E. H. (1982). Cerebrovascular anatomy and blood flow measurements in the rabbit. J Cereb Blood Flow Metab 2(1): 55-66. [PMID: 7061603]
248
Seghier M. L., Ramlackhansingh A., Crinion J., Leff A. P., Price C. J. (2008). Lesion identification using unified segmentation-normalisation models and fuzzy clustering. Neuroimage 41(4): 1253-1266. [PMID: 18482850] Seitz R. J., Meisel S., Weller P., Junghans U., Wittsack H. J., Siebler M. (2005). Initial ischemic event: perfusion-weighted MR imaging and apparent diffusion coefficient for stroke evolution. Radiology 237(3): 1020-1028. [PMID: 16237134] Sener R. N. (2001). Diffusion MRI: apparent diffusion coefficient (ADC) values in the normal brain and a classification of brain disorders based on ADC values. Comput Med Imaging Graph 25(4): 299-326. [PMID: 11356324] Seyfried D. M., Han Y., Yang D., Ding J., Savant-Bhonsale S., Shukairy M. S., et al. (2008). Mannitol enhances delivery of marrow stromal cells to the brain after experimental intracerebral hemorrhage. Brain Res 1224: 12-19. [PMID: 18573239] Shahdadfar A., Fronsdal K., Haug T., Reinholt F. P., Brinchmann J. E. (2005). In vitro expansion of human mesenchymal stem cells: choice of serum is a determinant of cell proliferation, differentiation, gene expression, and transcriptome stability. Stem Cells 23(9): 1357-1366. [PMID: 16081661] Sharma A., Sane H., Gokulchandran N., Khopkar D., Paranjape A., Sundaram J., et al. (2014). Autologous bone marrow mononuclear cells intrathecal transplantation in chronic stroke. Stroke Res Treat 2014: 234095. [PMID: 25126443] Sharma N., Aggarwal L. M. (2010). Automated medical image segmentation techniques. J Med Phys 35(1): 3-14. [PMID: 20177565] Shen L. H., Li Y., Chen J., Zacharek A., Gao Q., Kapke A., et al. (2007). Therapeutic benefit of bone marrow stromal cells administered 1 month after stroke. J Cereb Blood Flow Metab 27(1): 6-13. [PMID: 16596121] Shen Q., Goderie S. K., Jin L., Karanth N., Sun Y., Abramova N., et al. (2004). Endothelial cells stimulate self-renewal and expand neurogenesis of neural stem cells. Science 304(5675): 1338-1340. [PMID: 15060285] Shen Q., Wang Y., Kokovay E., Lin G., Chuang S. M., Goderie S. K., et al. (2008). Adult SVZ stem cells lie in a vascular niche: a quantitative analysis of niche cell-cell interactions. Cell Stem Cell 3(3): 289-300. [PMID: 18786416] Shen S., Sandham W., Granat M., Sterr A. (2005). MRI fuzzy segmentation of brain tissue using neighborhood attraction with neural-network optimization. IEEE Trans Inf Technol Biomed 9(3): 459-467. [PMID: 16167700]
249
Shi F., Fan Y., Tang S., Gilmore J. H., Lin W., Shen D. (2010). Neonatal brain image segmentation in longitudinal MRI studies. Neuroimage 49(1): 391-400. [PMID: 19660558] Shi F., Shen D., Yap P. T., Fan Y., Cheng J. Z., An H., et al. (2011). CENTS: cortical enhanced neonatal tissue segmentation. Hum Brain Mapp 32(3): 382-396. [PMID: 20690143] Shibukawa S., Nishio H., Niwa T., Obara M., Miyati T., Hara T., et al. (2015). Optimized 4D time-of-flight MR angiography using saturation pulse. J Magn Reson Imaging: [PMID: 26666670] Shih C. J., Chen H. T., Chao P. W., Kuo S. C., Li S. Y., Yang C. Y., et al. (2016). Angiotensin-converting enzyme inhibitors, angiotensin II receptor blockers and the risk of major adverse cardiac events in patients with diabetes and prior stroke: a nationwide study. J Hypertens 34(3): 567-575. [PMID: 26703918] Shih L. C., Saver J. L., Alger J. R., Starkman S., Leary M. C., Vinuela F., et al. (2003). Perfusion-weighted magnetic resonance imaging thresholds identifying core, irreversibly infarcted tissue. Stroke 34(6): 1425-1430. [PMID: 12738899] Shinozuka K., Dailey T., Tajiri N., Ishikawa H., Kaneko Y., Borlongan C. V. (2013). Stem cell transplantation for neuroprotection in stroke. Brain Sci 3(1): 239-261. [PMID: 24147217] Shobha N., Buchan A. M., Hill M. D., Canadian Alteplase for Stroke Effectiveness S. (2011). Thrombolysis at 3-4.5 hours after acute ischemic stroke onset--evidence from the Canadian Alteplase for Stroke Effectiveness Study (CASES) registry. Cerebrovasc Dis 31(3): 223-228. [PMID: 21178345] Shuaib A., Lees K. R., Lyden P., Grotta J., Davalos A., Davis S. M., et al. (2007). NXY-059 for the treatment of acute ischemic stroke. N Engl J Med 357(6): 562-571. [PMID: 17687131] Shyu W. C., Lin S. Z., Yang H. I., Tzeng Y. S., Pang C. Y., Yen P. S., et al. (2004). Functional recovery of stroke rats induced by granulocyte colony-stimulating factor-stimulated stem cells. Circulation 110(13): 1847-1854. [PMID: 15381647] Sikio M., Kolhi P., Ryymin P., Eskola H. J., Dastidar P. (2014). MRI Texture Analysis and Diffusion Tensor Imaging in Chronic Right Hemisphere Ischemic Stroke. J Neuroimaging: [PMID: 25482992] Silva M. D., Omae T., Helmer K. G., Li F., Fisher M., Sotak C. H. (2002). Separating changes in the intra- and extracellular water apparent diffusion coefficient

250
following focal cerebral ischemia in the rat brain. Magn Reson Med 48(5): 826-837. [PMID: 12417997] Simard J. M., Kent T. A., Chen M., Tarasov K. V., Gerzanich V. (2007). Brain oedema in focal ischaemia: molecular pathophysiology and theoretical implications. Lancet Neurol 6(3): 258-268. [PMID: 17303532] Simard J. M., Sahuquillo J., Sheth K. N., Kahle K. T., Walcott B. P. (2011). Managing malignant cerebral infarction. Curr Treat Options Neurol 13(2): 217-229. [PMID: 21190097] Simmons B. B., Cirignano B., Gadegbeku A. B. (2012). Transient ischemic attack: Part I. Diagnosis and evaluation. Am Fam Physician 86(6): 521-526. [PMID: 23062043] Singer O. C., de Rochemont Rdu M., Foerch C., Stengel A., Lanfermann H., Sitzer M., et al. (2003). Relation between relative cerebral blood flow, relative cerebral blood volume, and mean transit time in patients with acute ischemic stroke determined by perfusion-weighted MRI. J Cereb Blood Flow Metab 23(5): 605-611. [PMID: 12771576] Singh V., Marinescu D. C., Baker T. S. (2004). Image segmentation for automatic particle identification in electron micrographs based on hidden Markov random field models and expectation maximization. J Struct Biol 145(1-2): 123-141. [PMID: 15065680] Sinha S., Lucas-Quesada F. A., Sinha U., DeBruhl N., Bassett L. W. (2002). In vivo diffusion-weighted MRI of the breast: potential for lesion characterization. J Magn Reson Imaging 15(6): 693-704. [PMID: 12112520] Sinha S., Sinha U. (2004). In vivo diffusion tensor imaging of the human prostate. Magn Reson Med 52(3): 530-537. [PMID: 15334571] Sjoberg C., Ahnesjo A. (2013). Multi-atlas based segmentation using probabilistic label fusion with adaptive weighting of image similarity measures. Comput Methods Programs Biomed 110(3): 308-319. [PMID: 23339900] Smith W. S., Sung G., Saver J., Budzik R., Duckwiler G., Liebeskind D. S., et al. (2008). Mechanical thrombectomy for acute ischemic stroke: final results of the Multi MERCI trial. Stroke 39(4): 1205-1212. [PMID: 18309168] Soher B. J., Gillard J. H., Bryan R. N., Oppenheimer S. M., Barker P. B. (1998). Magnetic resonance perfusion imaging in acute middle cerebral artery stroke: comparison of blood volume and bolus peak arrival time. J Stroke Cerebrovasc Dis 7(1): 17-23. [PMID: 17895052]
251
Sohn C. H., Sevick R. J., Frayne R. (2003). Contrast-enhanced MR angiography of the intracranial circulation. Magn Reson Imaging Clin N Am 11(4): 599-614. [PMID: 15018113] Song M., Yu S. P. (2014). Ionic regulation of cell volume changes and cell death after ischemic stroke. Transl Stroke Res 5(1): 17-27. [PMID: 24323733] Sorensen A. G., Wu O., Copen W. A., Davis T. L., Gonzalez R. G., Koroshetz W. J., et al. (1999). Human acute cerebral ischemia: detection of changes in water diffusion anisotropy by using MR imaging. Radiology 212(3): 785-792. [PMID: 10478247] Souillard-Scemama R., Tisserand M., Calvet D., Jumadilova D., Lion S., Turc G., et al. (2015). An update on brain imaging in transient ischemic attack. J Neuroradiol 42(1): 3-11. [PMID: 25649922] Sourbron S. P., Buckley D. L. (2013). Classic models for dynamic contrast-enhanced MRI. NMR Biomed 26(8): 1004-1027. [PMID: 23674304] Srinivasan A., Goyal M., Al Azri F., Lum C. (2006). State-of-the-art imaging of acute stroke. Radiographics 26 Suppl 1: S75-95. [PMID: 17050521] Stephan K. E., Harrison L. M., Kiebel S. J., David O., Penny W. D., Friston K. J. (2007). Dynamic causal models of neural system dynamics:current state and future extensions. J Biosci 32(1): 129-144. [PMID: 17426386] Stoll M., Hagen T., Bartylla K., Weber M., Jost V., Treib J. (1998). Changes of cerebral perfusion after osmotherapy in acute cerebral edema assessed with perfusion weighted MRI. Neurol Res 20(6): 474-478. [PMID: 9713836] Stroke Therapy Academic Industry R. (1999). Recommendations for standards regarding preclinical neuroprotective and restorative drug development. Stroke 30(12): 2752-2758. [PMID: 10583007] Su E. J., Fredriksson L., Schielke G. P., Eriksson U., Lawrence D. A. (2009). Tissue plasminogen activator-mediated PDGF signaling and neurovascular coupling in stroke. J Thromb Haemost 7 Suppl 1: 155-158. [PMID: 19630790] Sudlow C. L., Warlow C. P. (1997). Comparable studies of the incidence of stroke and its pathological types: results from an international collaboration. International Stroke Incidence Collaboration. Stroke 28(3): 491-499. [PMID: 9056601] Svolos P., Tsolaki E., Theodorou K., Fountas K., Kapsalaki E., Fezoulidis I., et al. (2013). Classification methods for the differentiation of atypical meningiomas using diffusion and perfusion techniques at 3-T MRI. Clin Imaging 37(5): 856-864. [PMID:

252
23849831] Sylaja P. N., Coutts S. B., Subramaniam S., Hill M. D., Eliasziw M., Demchuk A. M., et al. (2007). Acute ischemic lesions of varying ages predict risk of ischemic events in stroke/TIA patients. Neurology 68(6): 415-419. [PMID: 17283315] Tambini A., Ketz N., Davachi L. (2010). Enhanced brain correlations during rest are related to memory for recent experiences. Neuron 65(2): 280-290. [PMID: 20152133] Tamura H., Hatazawa J., Toyoshima H., Shimosegawa E., Okudera T. (2002). Detection of deoxygenation-related signal change in acute ischemic stroke patients by T2*-weighted magnetic resonance imaging. Stroke 33(4): 967-971. [PMID: 11935045] Tamura H., Kurihara N., Machida Y., Nishino A., Shimosegawa E. (2009). How does water diffusion in human white matter change following ischemic stroke? Magn Reson Med Sci 8(3): 121-134. [PMID: 19783875] Tatlisumak T., Strbian D., Abo Ramadan U., Li F. (2004). The role of diffusion- and perfusion-weighted magnetic resonance imaging in drug development for ischemic stroke: from laboratory to clinics. Curr Vasc Pharmacol 2(4): 343-355. [PMID: 15320814] Taylor T. N., Davis P. H., Torner J. C., Holmes J., Meyer J. W., Jacobson M. F. (1996). Lifetime cost of stroke in the United States. Stroke 27(9): 1459-1466. [PMID: 8784113] Teichert-Kuliszewska K., Maisonpierre P. C., Jones N., Campbell A. I., Master Z., Bendeck M. P., et al. (2001). Biological action of angiopoietin-2 in a fibrin matrix model of angiogenesis is associated with activation of Tie2. Cardiovasc Res 49(3): 659-670. [PMID: 11166279] Terzopoulos D., McInerney T. (1997). Deformable models and the analysis of medical images. Stud Health Technol Inform 39: 369-378. [PMID: 10168933] Theilmann R. J., Borders R., Trouard T. P., Xia G., Outwater E., Ranger-Moore J., et al. (2004). Changes in water mobility measured by diffusion MRI predict response of metastatic breast cancer to chemotherapy. Neoplasia 6(6): 831-837. [PMID: 15720810] Thijs V. N., Adami A., Neumann-Haefelin T., Moseley M. E., Marks M. P., Albers G. W. (2001). Relationship between severity of MR perfusion deficit and DWI lesion evolution. Neurology 57(7): 1205-1211. [PMID: 11591836] Thijs V. N., Somford D. M., Bammer R., Robberecht W., Moseley M. E., Albers G. W. (2004). Influence of arterial input function on hypoperfusion volumes measured
253
with perfusion-weighted imaging. Stroke 35(1): 94-98. [PMID: 14671249] Thomalla G., Cheng B., Ebinger M., Hao Q., Tourdias T., Wu O., et al. (2011). DWI-FLAIR mismatch for the identification of patients with acute ischaemic stroke within 4.5 h of symptom onset (PRE-FLAIR): a multicentre observational study. Lancet Neurol 10(11): 978-986. [PMID: 21978972] Thomalla G., Gerloff C. (2010). We are on the clock: MRI as a surrogate marker of lesion age in acute ischemic stroke. Stroke 41(2): 197-198. [PMID: 20035067] Thomalla G., Rossbach P., Rosenkranz M., Siemonsen S., Krutzelmann A., Fiehler J., et al. (2009). Negative fluid-attenuated inversion recovery imaging identifies acute ischemic stroke at 3 hours or less. Ann Neurol 65(6): 724-732. [PMID: 19557859] Thompson J. W., Dave K. R., Young J. I., Perez-Pinzon M. A. (2013). Ischemic preconditioning alters the epigenetic profile of the brain from ischemic intolerance to ischemic tolerance. Neurotherapeutics 10(4): 789-797. [PMID: 23868468] Thored P., Arvidsson A., Cacci E., Ahlenius H., Kallur T., Darsalia V., et al. (2006). Persistent production of neurons from adult brain stem cells during recovery after stroke. Stem Cells 24(3): 739-747. [PMID: 16210404] Thornberry N. A., Lazebnik Y. (1998). Caspases: enemies within. Science 281(5381): 1312-1316. [PMID: 9721091] Torrecilla J. S., Rojo E., Oliet M., Dominguez J. C., Rodriguez F. (2009). Self-organizing maps and learning vector quantization networks as tools to identify vegetable oils. J Agric Food Chem 57(7): 2763-2769. [PMID: 19267437] Tourassi G. D. (1999). Journey toward computer-aided diagnosis: role of image texture analysis. Radiology 213(2): 317-320. [PMID: 10551208] Tropres I., Pannetier N., Grand S., Lemasson B., Moisan A., Peoc'h M., et al. (2014). Imaging the microvessel caliber and density: Principles and applications of microvascular MRI. Magn Reson Med: [PMID: 25168292] Tropres I., Pannetier N., Grand S., Lemasson B., Moisan A., Peoc'h M., et al. (2015). Imaging the microvessel caliber and density: Principles and applications of microvascular MRI. Magn Reson Med 73(1): 325-341. [PMID: 25168292] Tsai J. Z., Peng S. J., Chen Y. W., Wang K. W., Li C. H., Wang J. Y., et al. (2014). Automated segmentation and quantification of white matter hyperintensities in acute ischemic stroke patients with cerebral infarction. PLoS One 9(8): e104011. [PMID: 25127120]

254
Tsai Y. H., Hsu L. M., Weng H. H., Lee M. H., Yang J. T., Lin C. P. (2013). Functional diffusion map as an imaging predictor of functional outcome in patients with primary intracerebral haemorrhage. Br J Radiol 86(1021): 20110644. [PMID: 23255534] Tsien C., Galban C. J., Chenevert T. L., Johnson T. D., Hamstra D. A., Sundgren P. C., et al. (2010). Parametric response map as an imaging biomarker to distinguish progression from pseudoprogression in high-grade glioma. J Clin Oncol 28(13): 2293-2299. [PMID: 20368564] Tsivgoulis G., Katsanos A. H., Alexandrov A. V. (2014). Reperfusion therapies of acute ischemic stroke: potentials and failures. Front Neurol 5: 215. [PMID: 25404927] Tsuchiya K., Aoki S., Shimoji K., Mori H., Kunimatsu A. (2013). Consecutive acquisition of time-resolved contrast-enhanced MR angiography and perfusion MR imaging with added dose of gadolinium-based contrast agent aids diagnosis of suspected brain metastasis. Magn Reson Med Sci 12(2): 87-93. [PMID: 23666159] van der Zande F. H., Hofman P. A., Backes W. H. (2005). Mapping hypercapnia-induced cerebrovascular reactivity using BOLD MRI. Neuroradiology 47(2): 114-120. [PMID: 15616848] van der Zijden J. P., van der Toorn A., van der Marel K., Dijkhuizen R. M. (2008). Longitudinal in vivo MRI of alterations in perilesional tissue after transient ischemic stroke in rats. Exp Neurol 212(1): 207-212. [PMID: 18501349] Van Essen D. C., Ugurbil K., Auerbach E., Barch D., Behrens T. E., Bucholz R., et al. (2012). The Human Connectome Project: a data acquisition perspective. Neuroimage 62(4): 2222-2231. [PMID: 22366334] van Meer M. P., van der Marel K., Otte W. M., Berkelbach van der Sprenkel J. W., Dijkhuizen R. M. (2010). Correspondence between altered functional and structural connectivity in the contralesional sensorimotor cortex after unilateral stroke in rats: a combined resting-state functional MRI and manganese-enhanced MRI study. J Cereb Blood Flow Metab 30(10): 1707-1711. [PMID: 20664609] van Swieten J. C., Koudstaal P. J., Visser M. C., Schouten H. J., van Gijn J. (1988). Interobserver agreement for the assessment of handicap in stroke patients. Stroke 19(5): 604-607. [PMID: 3363593] Venketasubramanian N., Young S. H., Tay S. S., Umapathi T., Lao A. Y., Gan H. H., et al. (2015). CHInese Medicine NeuroAiD Efficacy on Stroke Recovery - Extension Study (CHIMES-E): A Multicenter Study of Long-Term Efficacy. Cerebrovasc Dis 39(5-6):
255
309-318. [PMID: 25925713] Verma N., Cowperthwaite M. C., Markey M. K. (2012). Variational level set approach for automatic correction of multiplicative and additive intensity inhomogeneities in brain MR Images. Conf Proc IEEE Eng Med Biol Soc 2012: 98-101. [PMID: 23365841] Vernooij M. W., Ikram M. A., Tanghe H. L., Vincent A. J., Hofman A., Krestin G. P., et al. (2007). Incidental findings on brain MRI in the general population. N Engl J Med 357(18): 1821-1828. [PMID: 17978290] Vidale S., Agostoni E. (2013). Time is brain: optimizing acute stroke management to reduce time delay. Acta Neurol Scand 127(3): e13-14. [PMID: 23410066] Vijayakumar C., Gharpure D. C. (2011). Development of image-processing software for automatic segmentation of brain tumors in MR images. J Med Phys 36(3): 147-158. [PMID: 21897560] Villmann C., Becker C. M. (2007). On the hypes and falls in neuroprotection: targeting the NMDA receptor. Neuroscientist 13(6): 594-615. [PMID: 17911221] Vogel J., Hermes A., Kuschinsky W. (1999). Evolution of microcirculatory disturbances after permanent middle cerebral artery occlusion in rats. J Cereb Blood Flow Metab 19(12): 1322-1328. [PMID: 10598936] von Kummer R., Albers G. W., Mori E., Committees D. S. (2012). The Desmoteplase in Acute Ischemic Stroke (DIAS) clinical trial program. Int J Stroke 7(7): 589-596. [PMID: 22989394] Wahlgren N. G., Ahmed N. (2004). Neuroprotection in cerebral ischaemia: facts and fancies--the need for new approaches. Cerebrovasc Dis 17 Suppl 1: 153-166. [PMID: 14694293] Walker M. R., Patel K. K., Stappenbeck T. S. (2009). The stem cell niche. J Pathol 217(2): 169-180. [PMID: 19089901] Walz B., Zimmermann C., Bottger S., Haberl R. L. (2002). Prognosis of patients after hemicraniectomy in malignant middle cerebral artery infarction. J Neurol 249(9): 1183-1190. [PMID: 12242536] Wang J., Takashima S., Takayama F., Kawakami S., Saito A., Matsushita T., et al. (2001). Head and neck lesions: characterization with diffusion-weighted echo-planar MR imaging. Radiology 220(3): 621-630. [PMID: 11526259] Wang L., Yu C., Chen H., Qin W., He Y., Fan F., et al. (2010). Dynamic functional
256
reorganization of the motor execution network after stroke. Brain 133(Pt 4): 1224-1238. [PMID: 20354002] Wang L. Q., Lin Z. Z., Zhang H. X., Shao B., Xiao L., Jiang H. G., et al. (2014). Timing and dose regimens of marrow mesenchymal stem cell transplantation affect the outcomes and neuroinflammatory response after ischemic stroke. CNS Neurosci Ther 20(4): 317-326. [PMID: 24393245] Wang Q., Seghers D., D'Agostino E., Maes F., Vandermeulen D., Suetens P., et al. (2005). Construction and validation of mean shape atlas templates for atlas-based brain image segmentation. Inf Process Med Imaging 19: 689-700. [PMID: 17354736] Warach S., Gaa J., Siewert B., Wielopolski P., Edelman R. R. (1995). Acute human stroke studied by whole brain echo planar diffusion-weighted magnetic resonance imaging. Ann Neurol 37(2): 231-241. [PMID: 7847864] Warfield S. K., Kaus M., Jolesz F. A., Kikinis R. (2000). Adaptive, template moderated, spatially varying statistical classification. Med Image Anal 4(1): 43-55. [PMID: 10972320] Wasserman B. A. (2010). Advanced contrast-enhanced MRI for looking beyond the lumen to predict stroke: building a risk profile for carotid plaque. Stroke 41(10 Suppl): S12-16. [PMID: 20876485] Wechsler L. R. (2004). Stem cell transplantation for stroke. Cleve Clin J Med 71 Suppl 1: S40-41. [PMID: 14964482] Weimar C. (2016). Stroke of undetermined cause: workup and secondary prevention. Curr Opin Neurol 29(1): 4-8. [PMID: 26641813] Welling L. C., Figueiredo E. G. (2011). Is it solely aquaporins? The mechanisms of brain edema. World Neurosurg 75(5-6): 570-571. [PMID: 21704906] Wells W. M., Grimson W. L., Kikinis R., Jolesz F. A. (1996). Adaptive segmentation of MRI data. IEEE Trans Med Imaging 15(4): 429-442. [PMID: 18215925] Wessels T., Wessels C., Ellsiepen A., Reuter I., Trittmacher S., Stolz E., et al. (2006). Contribution of diffusion-weighted imaging in determination of stroke etiology. AJNR Am J Neuroradiol 27(1): 35-39. [PMID: 16418352] Westlake K. P., Nagarajan S. S. (2011). Functional connectivity in relation to motor performance and recovery after stroke. Front Syst Neurosci 5: 8. [PMID: 21441991] Wholey M. (1997). Applied Cerebrovascular Anatomy/Pathology. J Invasive Cardiol
257
9(5): 384-386. [PMID: 10762930] Wintermark M., Albers G. W., Broderick J. P., Demchuk A. M., Fiebach J. B., Fiehler J., et al. (2013). Acute Stroke Imaging Research Roadmap II. Stroke 44(9): 2628-2639. [PMID: 23860298] Wintermark M., Flanders A. E., Velthuis B., Meuli R., van Leeuwen M., Goldsher D., et al. (2006). Perfusion-CT assessment of infarct core and penumbra: receiver operating characteristic curve analysis in 130 patients suspected of acute hemispheric stroke. Stroke 37(4): 979-985. [PMID: 16514093] Wise R. G., Harris A. D., Stone A. J., Murphy K. (2013). Measurement of OEF and absolute CMRO2: MRI-based methods using interleaved and combined hypercapnia and hyperoxia. Neuroimage 83: 135-147. [PMID: 23769703] Woitzik J., Hecht N., Pinczolits A., Sandow N., Major S., Winkler M. K., et al. (2013). Propagation of cortical spreading depolarization in the human cortex after malignant stroke. Neurology 80(12): 1095-1102. [PMID: 23446683] Wrede K. H., Matsushige T., Goericke S. L., Chen B., Umutlu L., Quick H. H., et al. (2016). Non-enhanced magnetic resonance imaging of unruptured intracranial aneurysms at 7 Tesla: Comparison with digital subtraction angiography. Eur Radiol: [PMID: 26993650] Wu O., Koroshetz W. J., Ostergaard L., Buonanno F. S., Copen W. A., Gonzalez R. G., et al. (2001). Predicting tissue outcome in acute human cerebral ischemia using combined diffusion- and perfusion-weighted MR imaging. Stroke 32(4): 933-942. [PMID: 11283394] Wu Y., Warfield S. K., Tan I. L., Wells W. M., 3rd, Meier D. S., van Schijndel R. A., et al. (2006). Automated segmentation of multiple sclerosis lesion subtypes with multichannel MRI. Neuroimage 32(3): 1205-1215. [PMID: 16797188] Xie R., Fang M., Zhou L., Fan S., Liu J., Quan H., et al. (2012). Diffusion tensor imaging detects Wallerian degeneration of the corticospinal tract early after cerebral infarction. Neural Regen Res 7(12): 900-905. [PMID: 25722673] Xiong Z. G., Zhu X. M., Chu X. P., Minami M., Hey J., Wei W. L., et al. (2004). Neuroprotection in ischemia: blocking calcium-permeable acid-sensing ion channels. Cell 118(6): 687-698. [PMID: 15369669] Xu C., Prince J. L. (1998). Snakes, shapes, and gradient vector flow. IEEE Trans Image Process 7(3): 359-369. [PMID: 18276256]
258
Xue H., Srinivasan L., Jiang S., Rutherford M., Edwards A. D., Rueckert D., et al. (2007). Automatic segmentation and reconstruction of the cortex from neonatal MRI. Neuroimage 38(3): 461-477. [PMID: 17888685] Yam P. S., Dunn L. T., Graham D. I., Dewar D., McCulloch J. (2000). NMDA receptor blockade fails to alter axonal injury in focal cerebral ischemia. J Cereb Blood Flow Metab 20(5): 772-779. [PMID: 10826527] Yamada K., Kawasaki M., Yoshimura S., Shirakawa M., Uchida K., Shindo S., et al. (2016). High-Intensity Signal in Carotid Plaque on Routine 3D-TOF-MRA Is a Risk Factor of Ischemic Stroke. Cerebrovasc Dis 41(1-2): 13-18. [PMID: 26580667] Yang B., Strong R., Sharma S., Brenneman M., Mallikarjunarao K., Xi X., et al. (2011). Therapeutic time window and dose response of autologous bone marrow mononuclear cells for ischemic stroke. J Neurosci Res 89(6): 833-839. [PMID: 21412816] Yankeelov T. E., Atuegwu N., Hormuth D., Weis J. A., Barnes S. L., Miga M. I., et al. (2013). Clinically relevant modeling of tumor growth and treatment response. Sci Transl Med 5(187): 187ps189. [PMID: 23720579] Yenari M. A., Han H. S. (2012). Neuroprotective mechanisms of hypothermia in brain ischaemia. Nat Rev Neurosci 13(4): 267-278. [PMID: 22353781] Yin D., Song F., Xu D., Peterson B. S., Sun L., Men W., et al. (2012). Patterns in cortical connectivity for determining outcomes in hand function after subcortical stroke. PLoS One 7(12): e52727. [PMID: 23285171] Yu C. Y., Ng G., Liao P. (2013). Therapeutic antibodies in stroke. Transl Stroke Res 4(5): 477-483. [PMID: 24098313] Yu G., Hess D. C., Borlongan C. V. (2004). Combined cyclosporine-A and methylprednisolone treatment exerts partial and transient neuroprotection against ischemic stroke. Brain Res 1018(1): 32-37. [PMID: 15262202] Yu Y., Lee D. H., Peng S. L., Zhang K., Zhang Y., Jiang S., et al. (2016). Assessment of Glioma Response to Radiotherapy Using Multiple MRI Biomarkers with Manual and Semiautomated Segmentation Algorithms. J Neuroimaging: [PMID: 27128445] Yuan J. (2009). Neuroprotective strategies targeting apoptotic and necrotic cell death for stroke. Apoptosis 14(4): 469-477. [PMID: 19137430] Yushkevich P. A., Piven J., Hazlett H. C., Smith R. G., Ho S., Gee J. C., et al. (2006). User-guided 3D active contour segmentation of anatomical structures: significantly
259
improved efficiency and reliability. Neuroimage 31(3): 1116-1128. [PMID: 16545965] Zador Z., Stiver S., Wang V., Manley G. T. (2009). Role of aquaporin-4 in cerebral edema and stroke. Handb Exp Pharmacol (190): 159-170. [PMID: 19096776] Zaharchuk G. (2012a). Arterial spin labeling for acute stroke: practical considerations. Transl Stroke Res 3(2): 228-235. [PMID: 24323778] Zaharchuk G., El Mogy I. S., Fischbein N. J., Albers G. W. (2012b). Comparison of arterial spin labeling and bolus perfusion-weighted imaging for detecting mismatch in acute stroke. Stroke 43(7): 1843-1848. [PMID: 22539548] Zaro-Weber O., Moeller-Hartmann W., Heiss W. D., Sobesky J. (2012). Influence of the arterial input function on absolute and relative perfusion-weighted imaging penumbral flow detection: a validation with (1)(5)O-water positron emission tomography. Stroke 43(2): 378-385. [PMID: 22135071] Zeng G. L. (2011). Gibbs artifact reduction by nonnegativity constraint. J Nucl Med Technol 39(3): 213-219. [PMID: 21795376] Zhang P. L., Wang Y. X., Chen Y., Zhang C. H., Li C. H., Dong Z., et al. (2015). Use of Intravenous Thrombolytic Therapy in Acute Ischemic Stroke Patients: Evaluation of Clinical Outcomes. Cell Biochem Biophys: [PMID: 25552251] Zhang R. L., Chopp M., Roberts C., Wei M., Wang X., Liu X., et al. (2012). Sildenafil enhances neurogenesis and oligodendrogenesis in ischemic brain of middle-aged mouse. PLoS One 7(10): e48141. [PMID: 23118941] Zhang Y., Brady M., Smith S. (2001). Segmentation of brain MR images through a hidden Markov random field model and the expectation-maximization algorithm. IEEE Trans Med Imaging 20(1): 45-57. [PMID: 11293691] Zikic D., Glocker B., Criminisi A. (2013). Atlas encoding by randomized forests for efficient label propagation. Med Image Comput Comput Assist Interv 16(Pt 3): 66-73. [PMID: 24505745] Zonta M., Angulo M. C., Gobbo S., Rosengarten B., Hossmann K. A., Pozzan T., et al. (2003). Neuron-to-astrocyte signaling is central to the dynamic control of brain microcirculation. Nat Neurosci 6(1): 43-50. [PMID: 12469126]
Related Documents