Evaluation of Tiger Conservation in India: the use of comparative effectiveness research By Gerald S. Post, DVM Masters project submitted in partial fulfillment of the requirements for the Duke Environmental Leadership Masters of Environmental Management degree in the Nicholas School of the Environment of Duke University 2010 Proposal Approved By: __________________________ Stuart L. Pimm, Ph.D., Advisor Nicholas School of the Environment

Welcome message from author
This document is posted to help you gain knowledge. Please leave a comment to let me know what you think about it! Share it to your friends and learn new things together.
Transcript
Evaluation of Tiger Conservation in India: the use of
comparative effectiveness research
By
Gerald S. Post, DVM
Masters project submitted in partial fulfillment of the
requirements for the Duke Environmental Leadership Masters of Environmental
Management degree in
the Nicholas School of the Environment of
Duke University
2010
Proposal Approved By:
__________________________
Stuart L. Pimm, Ph.D., Advisor
Nicholas School of the Environment
Abstract
Tigers, the largest of the felids, are now a globally threatened species with only approximately
3000 wild tigers surviving. India contains about 60% or 2000 of the animals, yet despite
aggressive conservation efforts the number of tigers is declining. The causes of the decline are
prey depletion, habitat destruction and poaching.
Over the past 30 years of tiger conservation efforts in the various protected areas within India,
success has been incredibly variable, with few documented cases of parks were the numbers of
tigers have risen, but many more cases of parks where tiger populations have plummeted. There
are very few scientific papers that assess the effectiveness of conservation efforts and when it is
considered, implementation rather than outcome is evaluated. Recent literature suggests that
evaluating outcomes in more predictive of conservation success. This thesis attempts to use
comparative research effectiveness techniques, a methodology used to evaluate medical therapy
effectiveness, to evaluate tiger conservation in India.
Various tiger conservation experts were polled and a list of 7 successful protected areas—Kanha,
Corbett, Pench, Kaziranga, Bhadra, Bandipur, and Nagarhole—and 5 failed protected areas—
Palamau, Dampa, Panna, Sariska and Namdapha—were generated. A list of variables that could
impact outcome at these protected areas was generated and included biologic (tiger density, prey
density, area of the reserve, the presence/absence of a biological corridor), geographical (the
Indian State the reserve is in eco-region of the reserve), economic (number of tourists, revenue
from tourism, forestry, funding per sq km) and socio-political factors (human population data,
presence/absence of a “conservation hero”, Park Management Effectiveness Rating, poaching).
The factors that were positively correlated with success included tiger density and the presence
of a biological corridor. Population density and level of funding did not correlate with success or
failure. Many of the successful reserves were in areas of high human population density and
many of the failures were in areas of low human population density. Although not statistically
correlated, the presence of a “conservation hero” was seen in 5 of the 7 successes but in only 1 of
the failures.
The lack of correlation between many of the independent variables evaluated and success or
failure of the tiger reserves has revealed that tiger conservation can be successful despite factors
such as high human population densities and only average funding to the reserve. Comparative
effectiveness research techniques can be used to evaluate conservation outcomes.
1
Introduction:
Tigers, the largest of the felids, are top predators that are now a globally threatened species.
There are only approximately 3000 wild tigers surviving in only 7% of their historical range,
with about 60% or 2000 of these animals living in India. Tiger conservation has been a priority
for the Indian government since Prime Minister Indira Gandhi implemented Project Tiger April
1, 1973. Despite this aggressive conservation effort, which at the time was the largest
conservation effort aimed at a single species ever attempted, the number of tigers in India is
declining. The cause of this decline is prey depletion, habitat destruction and poaching.
There are over 40 Tiger Reserves, National Parks or other protected areas scattered across India
that harbor or can harbor tigers. Despite the wide variation in habitat within the Indian sub-
continent the tiger is able to live in most of these areas. These protected areas were created to
provide a sanctuary for the threatened wildlife of India, and in other areas of the world this idea
has worked.
The need for endangered species conservation was raised in our awareness when Rachel Carson
published her book Silent Spring. The possibility of man causing a species to go extinct was
further thrust into the collective conscious of the world when the Americans watched as the
passenger pigeon vanished. Since that time, our scientific knowledge about the number of
species threatened or endangered has exploded. The IUCN (World Conservation Union)
publishes a yearly book, The IUCN Red List of Threatened Species™, which even keeps count
of the number of species that are threatened worldwide. Yet despite this increased knowledge,
our ability to implement effective conservation efforts is sometimes dramatically impotent.

2
Over the past 30 years the “success” of tiger conservation efforts in the various protected areas
within India has been incredibly variable. There are few documented cases of parks where the
numbers of tigers have risen, but unfortunately more cases of parks where the tiger population
has plummeted or been reduced to zero.
The number of hits in Google when endangered species conservation is put in the search field is
over 5 million. Yet despite this massive amount of information, there are very few scientific
papers that evaluate the effectiveness of conservation efforts. And when effectiveness is
evaluated, the process and type of management structure is most often evaluated while the
desired result of a biologically healthier (and safer) species population is not measured.
Implementation, not outcomes, has been the standard measured. Recent literature suggests that
evaluating outcomes is more predictive of conservation success than is evaluating
implementation (Kapos et al. 2009).
Over thirty years ago, it was demonstrated in the medical field that many of the commonly used
procedures and therapies were not always the most effective (Cochrane). There is a need for
evidence-based conservation and the medical field can serve as an example of how to pursue this
goal (Pullin & Knight 2001; Sutherland et al. 2004). Comparative Effectiveness Research is a
type of investigation common in the medical field and is now being used to evaluate the various
cancer therapies utilized in the United States (http://www.focr.org/download-repeort-improving-
medical-decisions-through-comparative-effectiveness-research-cancer-as-a-case-study.html). In
medical terminology: efficacy refers to how well an intervention works in a controlled setting;
effectiveness refers to how well it works in real world situations, and efficiency relates to how
well it works in relation to its cost. This format, of comparing various interventions over varied
real-world scenarios lends itself well to conservation evaluations and could potentially
3
demonstrate conservation strategies that are worth pursuing and those that are inadequate or
context dependent.
Objective:
Tiger conservation has been extensively reviewed in the scientific literature but what strategies
within a single geopolitical landscape that are effective has not been attempted. This master’s
project will use comparative effectiveness research techniques to evaluate a number of these
strategies. The goals of this paper are:
1. To determine what tiger conservation strategies within India are associated with
success
2. To determine what tiger conservation strategies within India are associated with failure
3. To potentially guide the Global Tiger Initiative of the World Bank as to how to most
effectively fund tiger conservation efforts
Methods:
Various experts (Bivash Pandav, Ullas Karanth, and Eric Dinerstein) involved in tiger
conservation within India were polled to determine the documented cases of “success” and
“failure” of protected areas to protect tigers. Success was defined as the improvement in the tiger
population and failure as the decline in the tiger population within the protected area over the
years 1995-2005. A list of 7 successful tiger reserves (Kanha, Corbett, Pench, Kaziranga,
Bhadra, Bandipur, and Nagarhole) and 5 failed tiger reserves (Palamau, Dampa, Panna, Sariska,
4
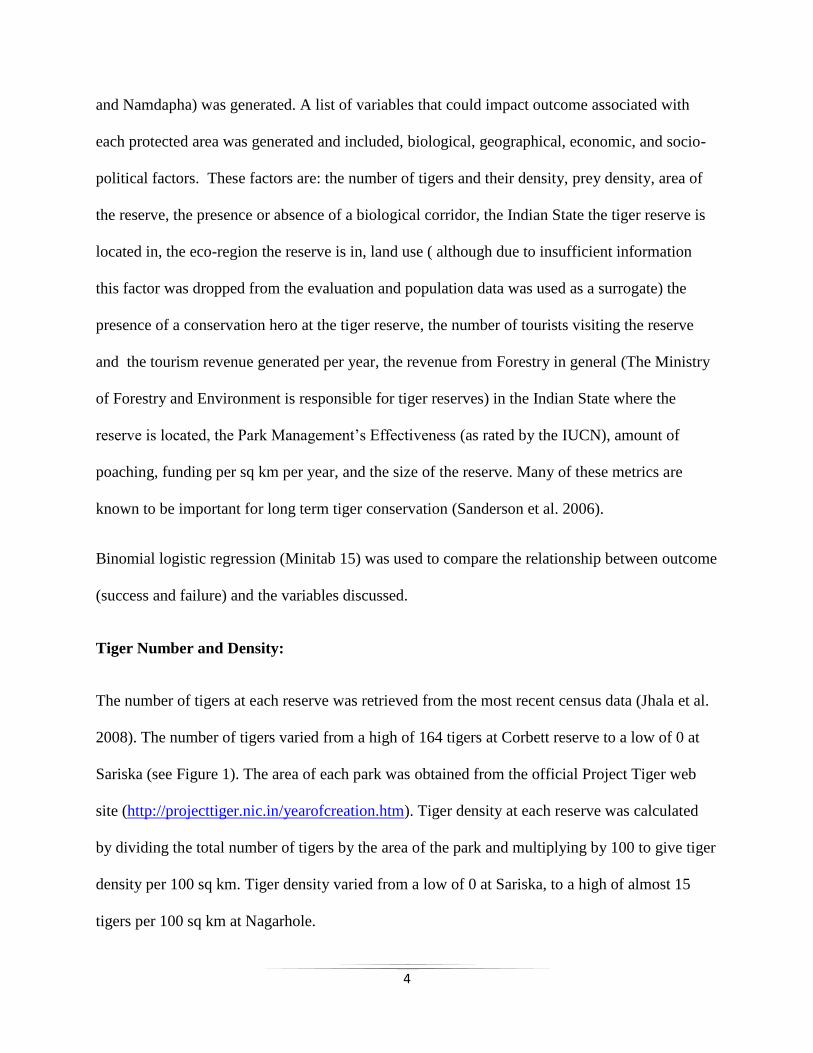
and Namdapha) was generated. A list of variables that could impact outcome associated with
each protected area was generated and included, biological, geographical, economic, and socio-
political factors. These factors are: the number of tigers and their density, prey density, area of
the reserve, the presence or absence of a biological corridor, the Indian State the tiger reserve is
located in, the eco-region the reserve is in, land use ( although due to insufficient information
this factor was dropped from the evaluation and population data was used as a surrogate) the
presence of a conservation hero at the tiger reserve, the number of tourists visiting the reserve
and the tourism revenue generated per year, the revenue from Forestry in general (The Ministry
of Forestry and Environment is responsible for tiger reserves) in the Indian State where the
reserve is located, the Park Management’s Effectiveness (as rated by the IUCN), amount of
poaching, funding per sq km per year, and the size of the reserve. Many of these metrics are
known to be important for long term tiger conservation (Sanderson et al. 2006).
Binomial logistic regression (Minitab 15) was used to compare the relationship between outcome
(success and failure) and the variables discussed.
Tiger Number and Density:
The number of tigers at each reserve was retrieved from the most recent census data (Jhala et al.
2008). The number of tigers varied from a high of 164 tigers at Corbett reserve to a low of 0 at
Sariska (see Figure 1). The area of each park was obtained from the official Project Tiger web
site (http://projecttiger.nic.in/yearofcreation.htm). Tiger density at each reserve was calculated
by dividing the total number of tigers by the area of the park and multiplying by 100 to give tiger
density per 100 sq km. Tiger density varied from a low of 0 at Sariska, to a high of almost 15
tigers per 100 sq km at Nagarhole.
5
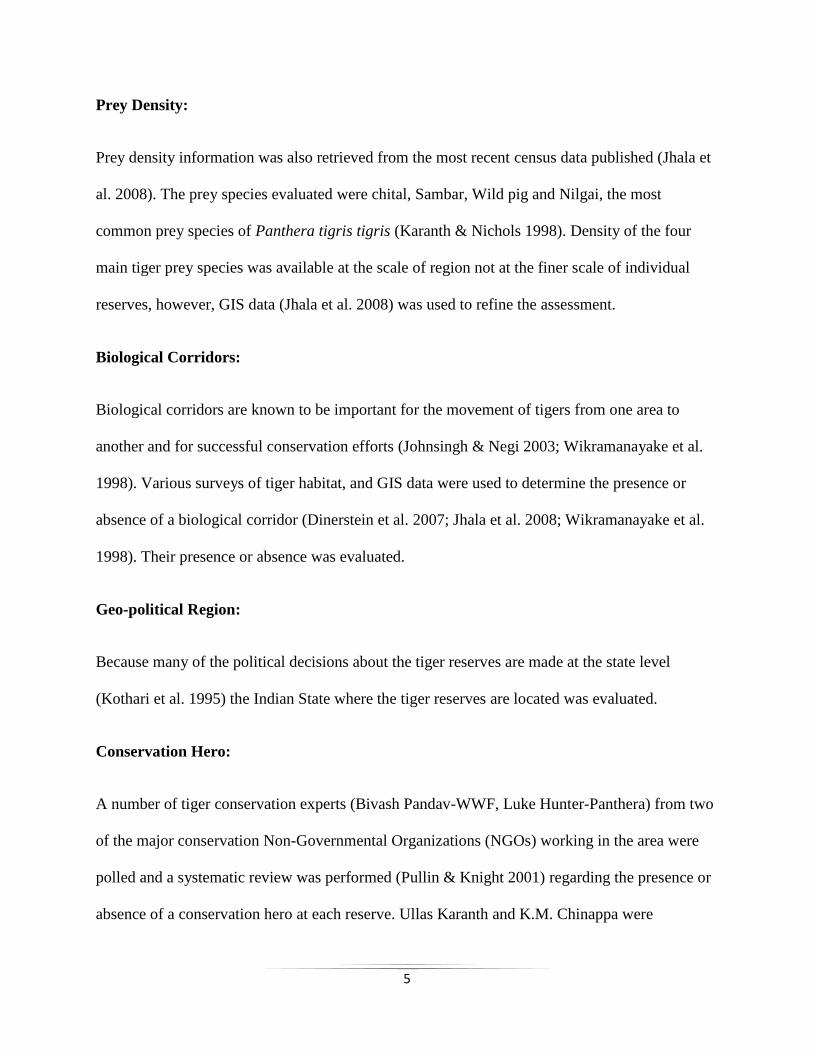
Prey Density:
Prey density information was also retrieved from the most recent census data published (Jhala et
al. 2008). The prey species evaluated were chital, Sambar, Wild pig and Nilgai, the most
common prey species of Panthera tigris tigris (Karanth & Nichols 1998). Density of the four
main tiger prey species was available at the scale of region not at the finer scale of individual
reserves, however, GIS data (Jhala et al. 2008) was used to refine the assessment.
Biological Corridors:
Biological corridors are known to be important for the movement of tigers from one area to
another and for successful conservation efforts (Johnsingh & Negi 2003; Wikramanayake et al.
1998). Various surveys of tiger habitat, and GIS data were used to determine the presence or
absence of a biological corridor (Dinerstein et al. 2007; Jhala et al. 2008; Wikramanayake et al.
1998). Their presence or absence was evaluated.
Geo-political Region:
Because many of the political decisions about the tiger reserves are made at the state level
(Kothari et al. 1995) the Indian State where the tiger reserves are located was evaluated.
Conservation Hero:
A number of tiger conservation experts (Bivash Pandav-WWF, Luke Hunter-Panthera) from two
of the major conservation Non-Governmental Organizations (NGOs) working in the area were
polled and a systematic review was performed (Pullin & Knight 2001) regarding the presence or
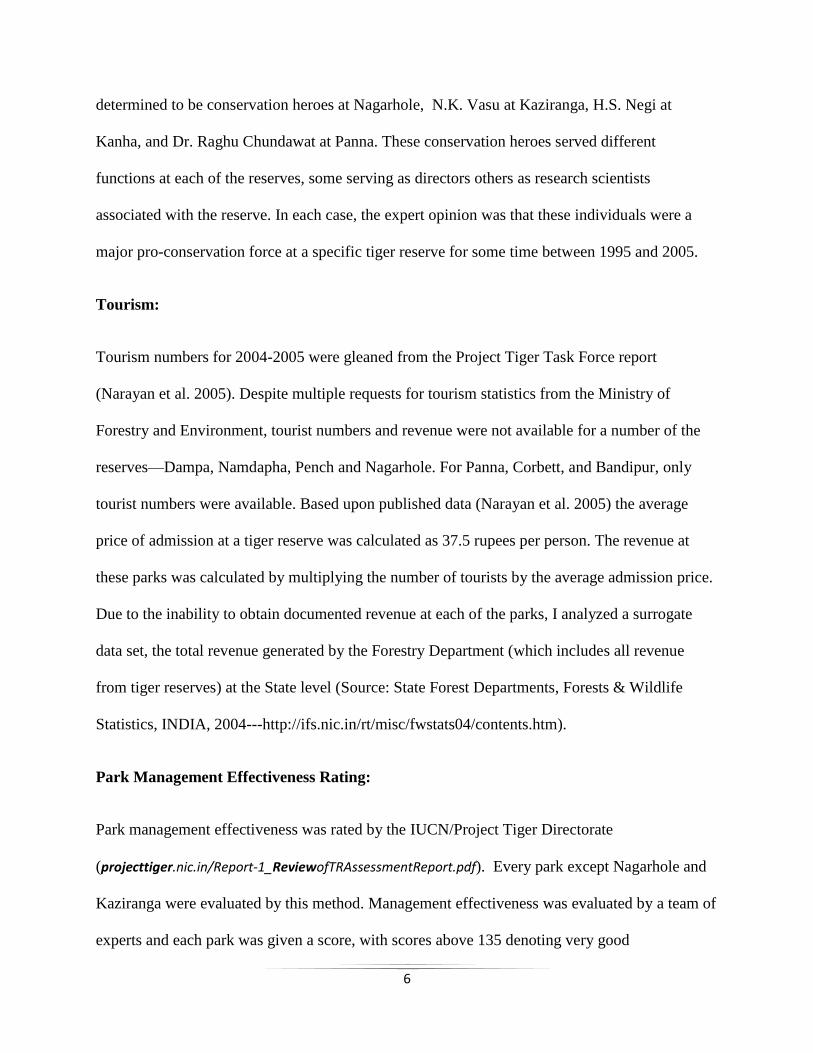
absence of a conservation hero at each reserve. Ullas Karanth and K.M. Chinappa were
6
determined to be conservation heroes at Nagarhole, N.K. Vasu at Kaziranga, H.S. Negi at
Kanha, and Dr. Raghu Chundawat at Panna. These conservation heroes served different
functions at each of the reserves, some serving as directors others as research scientists
associated with the reserve. In each case, the expert opinion was that these individuals were a
major pro-conservation force at a specific tiger reserve for some time between 1995 and 2005.
Tourism:
Tourism numbers for 2004-2005 were gleaned from the Project Tiger Task Force report
(Narayan et al. 2005). Despite multiple requests for tourism statistics from the Ministry of
Forestry and Environment, tourist numbers and revenue were not available for a number of the
reserves—Dampa, Namdapha, Pench and Nagarhole. For Panna, Corbett, and Bandipur, only
tourist numbers were available. Based upon published data (Narayan et al. 2005) the average
price of admission at a tiger reserve was calculated as 37.5 rupees per person. The revenue at
these parks was calculated by multiplying the number of tourists by the average admission price.
Due to the inability to obtain documented revenue at each of the parks, I analyzed a surrogate
data set, the total revenue generated by the Forestry Department (which includes all revenue
from tiger reserves) at the State level (Source: State Forest Departments, Forests & Wildlife
Statistics, INDIA, 2004---http://ifs.nic.in/rt/misc/fwstats04/contents.htm).
Park Management Effectiveness Rating:
Park management effectiveness was rated by the IUCN/Project Tiger Directorate
(projecttiger.nic.in/Report-1_ReviewofTRAssessmentReport.pdf). Every park except Nagarhole and
Kaziranga were evaluated by this method. Management effectiveness was evaluated by a team of
experts and each park was given a score, with scores above 135 denoting very good
7
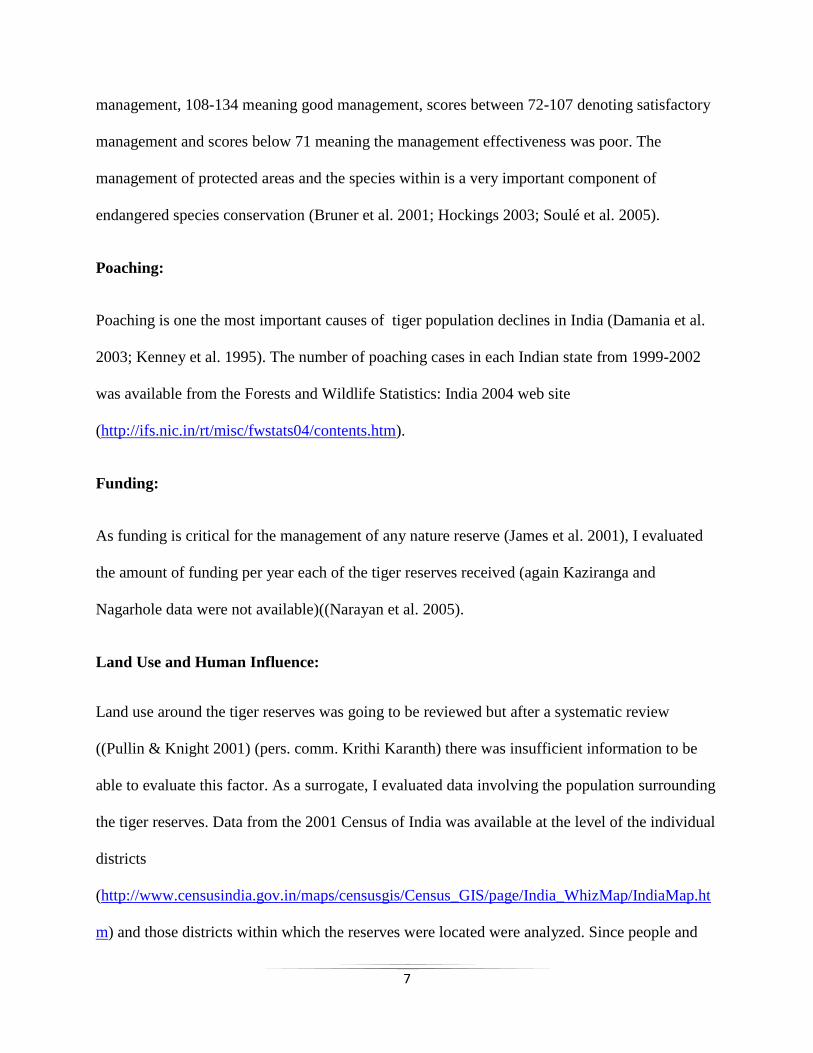
management, 108-134 meaning good management, scores between 72-107 denoting satisfactory
management and scores below 71 meaning the management effectiveness was poor. The
management of protected areas and the species within is a very important component of
endangered species conservation (Bruner et al. 2001; Hockings 2003; Soulé et al. 2005).
Poaching:
Poaching is one the most important causes of tiger population declines in India (Damania et al.
2003; Kenney et al. 1995). The number of poaching cases in each Indian state from 1999-2002
was available from the Forests and Wildlife Statistics: India 2004 web site
(http://ifs.nic.in/rt/misc/fwstats04/contents.htm).
Funding:
As funding is critical for the management of any nature reserve (James et al. 2001), I evaluated
the amount of funding per year each of the tiger reserves received (again Kaziranga and
Nagarhole data were not available)((Narayan et al. 2005).
Land Use and Human Influence:
Land use around the tiger reserves was going to be reviewed but after a systematic review
((Pullin & Knight 2001) (pers. comm. Krithi Karanth) there was insufficient information to be
able to evaluate this factor. As a surrogate, I evaluated data involving the population surrounding
the tiger reserves. Data from the 2001 Census of India was available at the level of the individual
districts
(http://www.censusindia.gov.in/maps/censusgis/Census_GIS/page/India_WhizMap/IndiaMap.ht
m) and those districts within which the reserves were located were analyzed. Since people and
8
human activity have been shown to effect the conservation of large carnivores (Pimm et al. 1995;
Purvis et al. 2000; Treves & Karanth 2003; Woodroffe 2000), total population, rural population,
population density, percentage of total population involved in the agricultural sector and
percentage of the rural population involved in the agricultural sector was gleaned from the online
Indian census database.
Results:
Results of the biological, geographical, economic, and socio-political factors are displayed in
Figures 1-4. The 12 tiger reserves analyzed resided in 4 regions of India: Western Ghats,
Central, North Eastern and Himalayan. It is interesting to note that 3 of the seven successful
reserves were located in the Western Ghats region while this region did not contain any failed
reserves.
Tiger numbers ranged from a low of zero at Sariska to a high of 164 at Corbett and the area of
the reserves ranged from 500 square kilometers to over 1900 square kilometers.
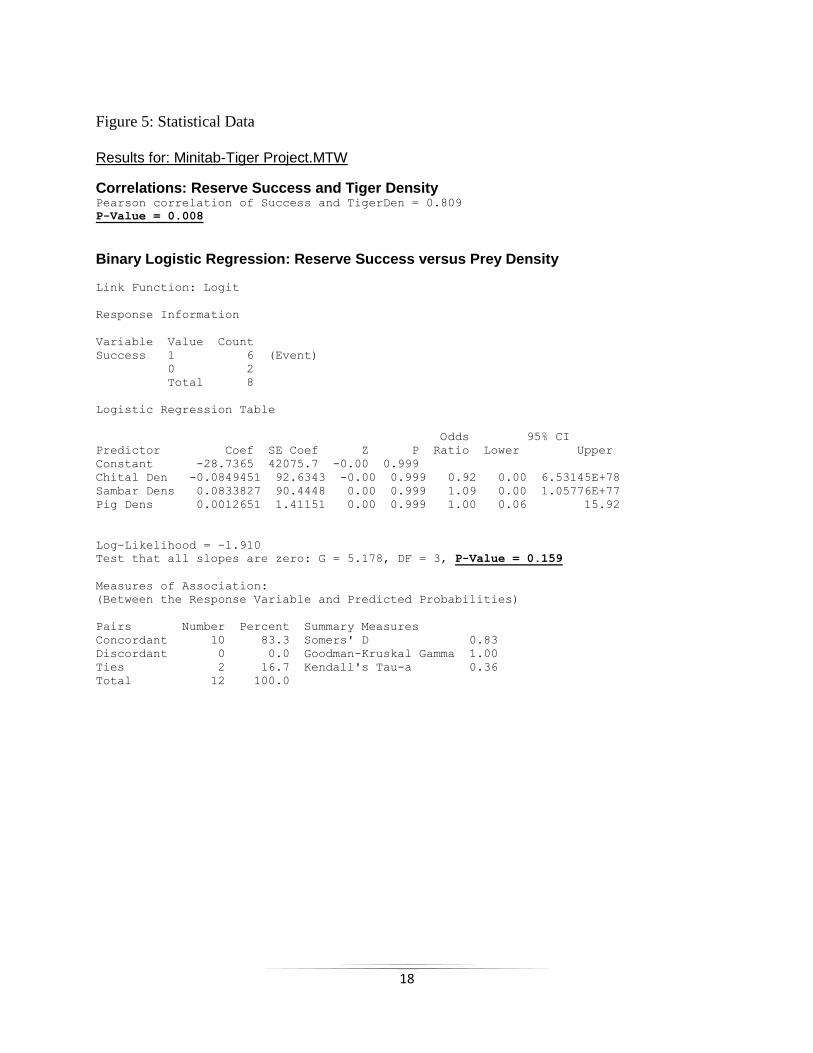
Tiger density was positively correlated with success (Pearson correlation = 0.809, P-Value =
0.008). When prey density was analyzed, however, there was no correlation with success or
failure (see Figure 5).
When the presence or absence of a biological corridor was evaluated, a positive correlation
(Pearson correlation = 0.683, P-Value = 0.014) was found.
Nine Indian States were represented in the analysis. There are total of 28 States in India, with
tiger reserves present in 17 of them.
9
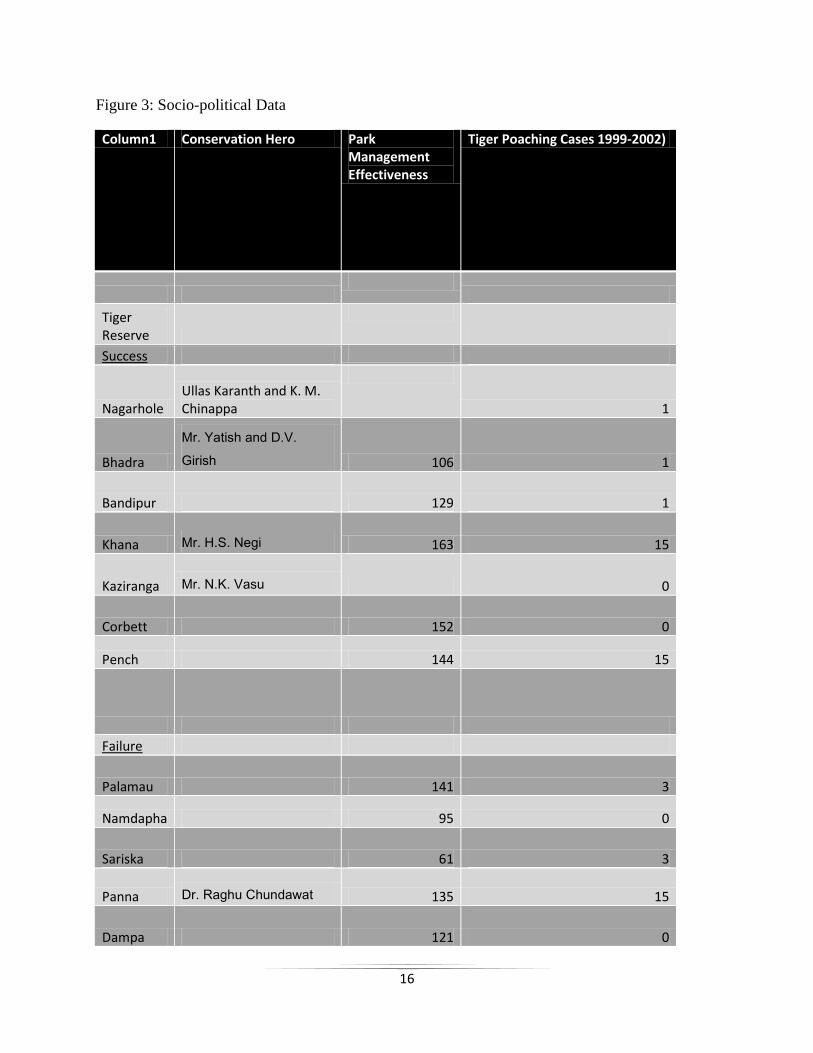
Four of the seven tiger reserves rated as successful had conservation heroes associated with the
reserve at some time period from 1995-2005, while only one of the reserves judged to be a
failure had a conservation hero associated with it. It was interesting to note, that although this
relationship was not statistically significant (p=0.235), the potential for one charismatic person to
make a profound difference is evident.
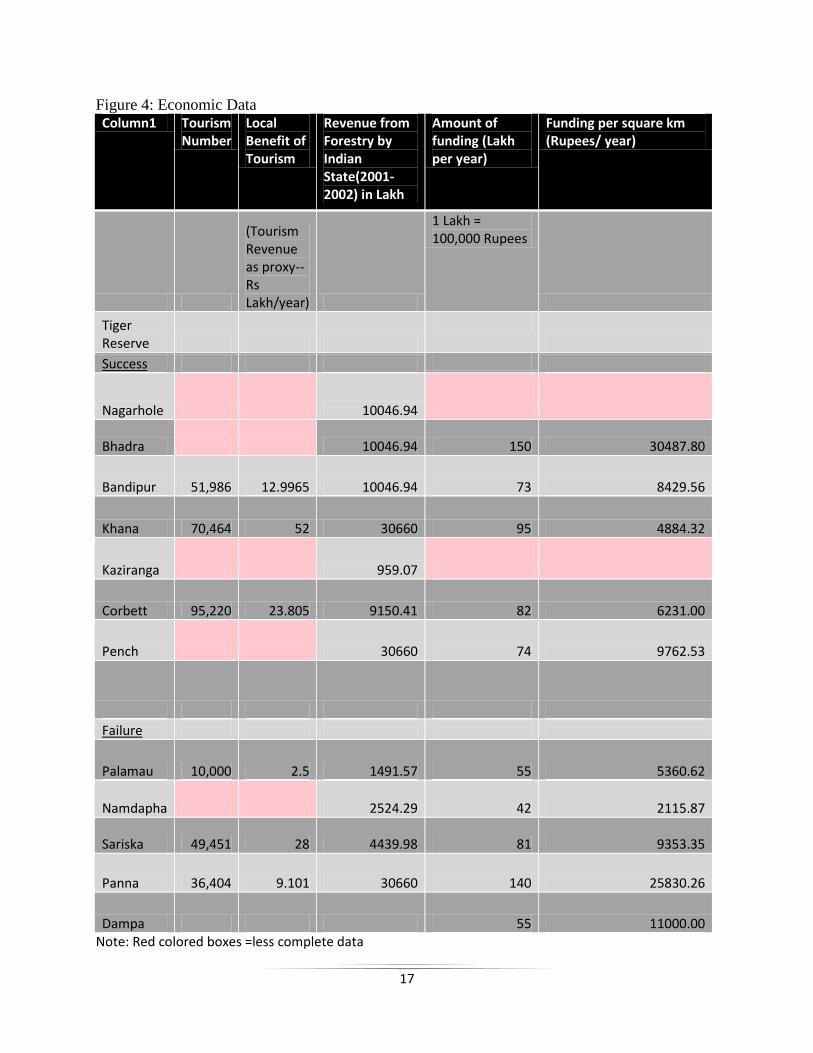
Tourism numbers (for the period 2004-2005) were available for only six tiger reserves, 3
successes and 3 failures. Revenue from the Forestry sector (2001-2002) was available only at the
scale of Indian State rather than at the district or reserve level and was found not to be
statistically correlated with success or failure (p=0.557). Although there was no statistically
significant relationship between tourism numbers or tourism related revenue and success, there
was data deficiency for 6 of the reserves concerning tourism numbers and revenue.
Park Management Effectiveness rating varied widely with one reserve achieving a poor rating,
two getting a satisfactory rating, two a good rating, and 5 getting the top rating of very good
(Review of Tiger Reserve Assessment). The rating involved 45 categories (listed in Table #3).
When analyzed, a Pearson correlation of 0.490 was found, but was not statistically significant
p=0.150)
Poaching cases were gleaned from the Forest and Wildlife Statistics in India for 2004 and the
numbers were at the scale of Indian State. These numbers likely under represent the true number
of poaching incidents (http://www.wpsi-india.org/tiger/poaching_crisis.php).
Funding information was available for 10 of the 12 reserves analyzed, and varied from 42 Lakh
(1 Lakh =100,000 Rupees) to 150 Lakh per reserve and from a little over 2000 Rupees per square
10
kilometer to over 9700. There was no positive correlation between funding per unit area and the
success of the reserve (Pearson correlation = -0.042, P-Value = 0.902).
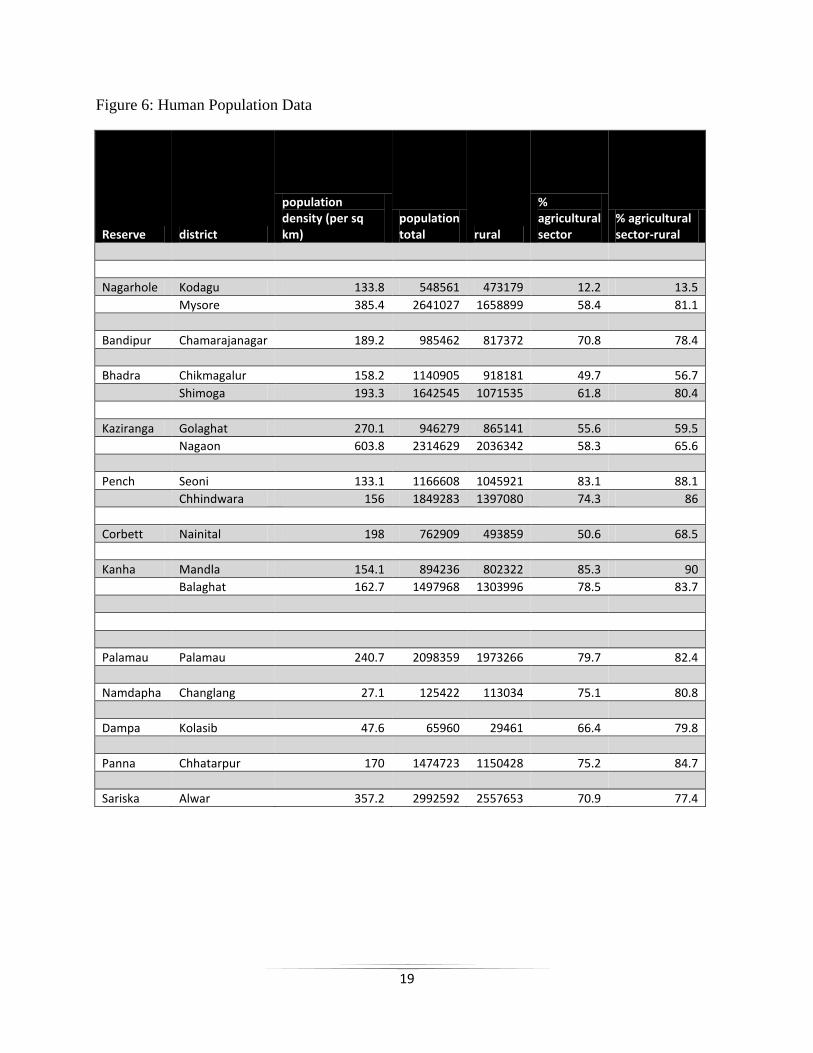
The most current census data (2002) was gleaned from the official web site of the Indian
government and the relevant information is displayed in Figure 6. This information was available
at the scale of individual districts. When reserves were situated in two districts, both districts
were used for analysis.
Discussion:
This evaluation was unique in several ways. This is the first evaluation of tiger reserves to
specifically address success and failure in terms of the biologic endpoint of healthier populations
of tigers. This was the first time in the author’s knowledge that comparative effectiveness
research was used to evaluate an endangered species conservation effort.
The lack of positive statistical significance between outcome (success or failure) and the multiple
independent variables evaluated should not detract from the conclusions of this paper; indeed,
negative findings often reveal useful scientific information (Editors (2009)).
The real value of tourism/eco-tourism to conservation is a current topic of much research
(Adams & Infield 2003; Archabald & Naughton-Treves 2002; Blom 2000; Cleary 2006; Garnett
et al. 2003; Lerner et al. 2007; Lindsey et al. 2007; Salzer & Salafsky 2006; Sandbrook 2008;
Udaya Sekhar 2003). The value of this industry to conservation may depend upon how much
revenue flows to the local people whose lives are most affected by conservation actions
((Archabald & Naughton-Treves 2002; Sandbrook 2008; Udaya Sekhar 2003). Tourism numbers
11
were only available for a few of the reserves and the information about revenue may not reflect
the benefit of the tourism to the local people. Future efforts should focus on how much economic
benefit the local population receives from eco-tourism activities at tiger reserves and if there is
any correlation with the level of benefit and the success of the reserve.
High population density has been shown to be correlated with high anthropogenic pressure on
large mammals leading to their decline (Arjunan et al. 2006; Cardillo et al. 2005; Ceballos et al.
2005; Davidson et al. 2009; Johnson et al. 2006; McKinney et al. ; McKinney 2002; Nugraha &
Sugardjito 2009; O'Brien et al. 2003; Woodroffe 2000). It was interesting to note that the human
population density was very high in many of the successful tiger reserves and the human
population density was low in many of the failed reserves. Future efforts could focus on delving
into how the successful reserves with high human population density were managed or if there
were any socio-economic factors that were different in those reserves as compared to reserves
that failed or are failing due to high human population pressure.
Land use is also intimately tied to conservation issues (Damania et al. 2003; Madhusudan 2003;
Rao et al. 2002; Sekhar 2002). The economic uses of land and its impact on tiger conservation
have been evaluated (Damania et al. 2003). Certain agricultural uses have detrimental effects on
conservation efforts through habitat destruction, the negative consequences of livestock
predation by carnivores, or crop destruction(Madhusudan 2003; Sekhar 2002). In the tiger
reserves evaluated, there seemed to be a trend toward (but not statistically significant) a negative
correlation between the number and percentage of the human population around the reserve
engaged in agricultural activities and success of the reserve.
12
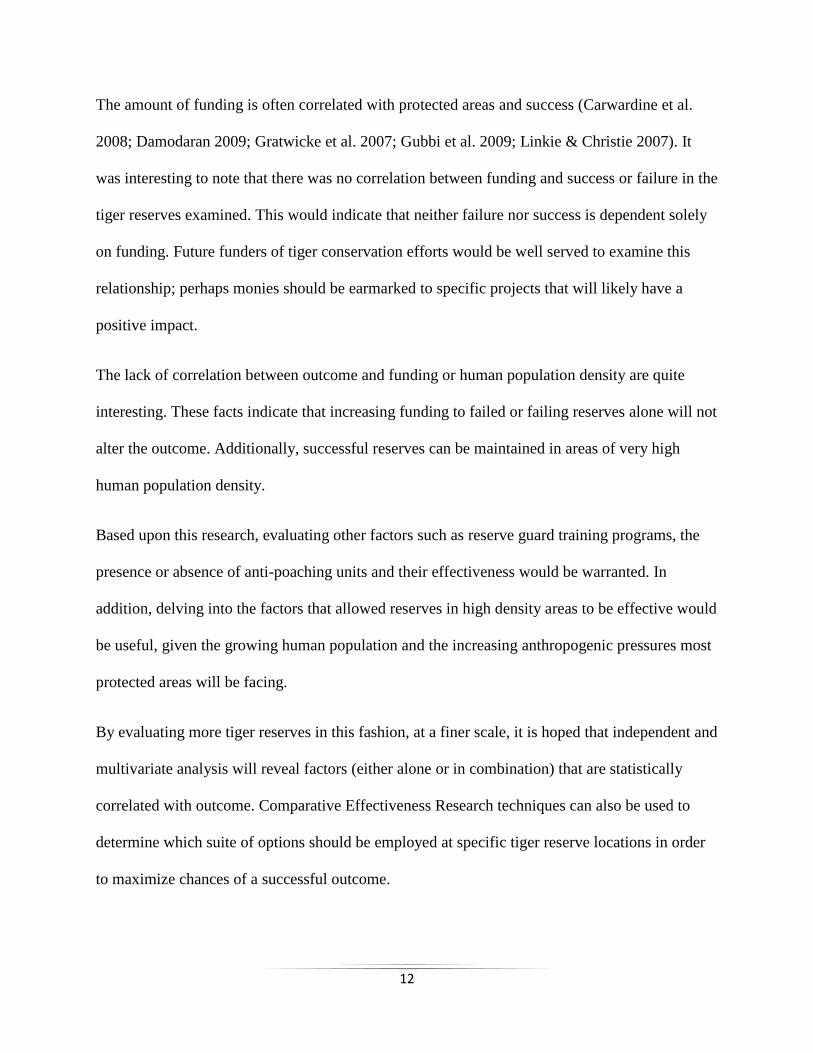
The amount of funding is often correlated with protected areas and success (Carwardine et al.
2008; Damodaran 2009; Gratwicke et al. 2007; Gubbi et al. 2009; Linkie & Christie 2007). It
was interesting to note that there was no correlation between funding and success or failure in the
tiger reserves examined. This would indicate that neither failure nor success is dependent solely
on funding. Future funders of tiger conservation efforts would be well served to examine this
relationship; perhaps monies should be earmarked to specific projects that will likely have a
positive impact.
The lack of correlation between outcome and funding or human population density are quite
interesting. These facts indicate that increasing funding to failed or failing reserves alone will not
alter the outcome. Additionally, successful reserves can be maintained in areas of very high
human population density.
Based upon this research, evaluating other factors such as reserve guard training programs, the
presence or absence of anti-poaching units and their effectiveness would be warranted. In
addition, delving into the factors that allowed reserves in high density areas to be effective would
be useful, given the growing human population and the increasing anthropogenic pressures most
protected areas will be facing.
By evaluating more tiger reserves in this fashion, at a finer scale, it is hoped that independent and
multivariate analysis will reveal factors (either alone or in combination) that are statistically
correlated with outcome. Comparative Effectiveness Research techniques can also be used to
determine which suite of options should be employed at specific tiger reserve locations in order
to maximize chances of a successful outcome.
13
The lack of correlation between the independent variables evaluated and the success or failure of
the tiger reserves is telling in its own right. This type of analysis allows conservationists to shed
light on the fact that conservation efforts can be successful despite factors such as high
population density or only average funding to a reserve. It is also hoped that with further
comparative effectiveness research, we can identify what specific measures are necessary for
success, whether it be a certain level of anti-poaching efforts, a certain amount of trained guards,
or other factors. This analysis should not be viewed as an end product but more as the beginning
of a new way to evaluate conservation efforts.
Faculty:
Dr. Stuart L. Pimm has graciously agreed to be the advisor to this Master’s Project.
Outside of Duke University Dr. Eric Dinerstein, Chief Scientist of the World Wide Fund for
Nature (WWF), and Dr. K. Ullas Karanth of the Wildlife Conservation Society in New York and
the Centre for Wildlife Studies in Bangalore, India have agreed to offer guidance with this
Master’s Project.
14
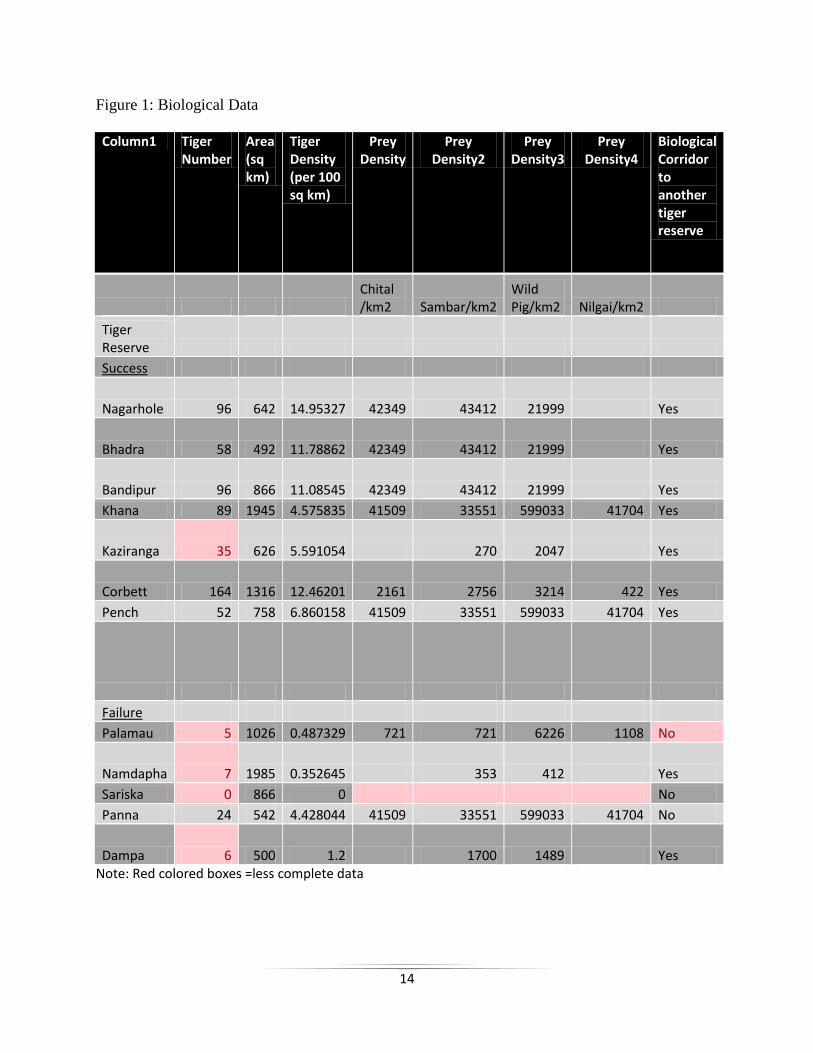
Figure 1: Biological Data
Column1 Tiger
Number Area (sq km)
Tiger Density (per 100 sq km)
Prey Density
Prey Density2
Prey Density3
Prey Density4
Biological Corridor to another tiger reserve
Chital /km2 Sambar/km2
Wild Pig/km2 Nilgai/km2
Tiger Reserve
Success
Nagarhole 96 642 14.95327 42349 43412 21999 Yes
Bhadra 58 492 11.78862 42349 43412 21999 Yes
Bandipur 96 866 11.08545 42349 43412 21999 Yes
Khana 89 1945 4.575835 41509 33551 599033 41704 Yes
Kaziranga 35 626 5.591054 270 2047 Yes
Corbett 164 1316 12.46201 2161 2756 3214 422 Yes
Pench 52 758 6.860158 41509 33551 599033 41704 Yes
Failure
Palamau 5 1026 0.487329 721 721 6226 1108 No
Namdapha 7 1985 0.352645 353 412 Yes
Sariska 0 866 0 No
Panna 24 542 4.428044 41509 33551 599033 41704 No
Dampa 6 500 1.2 1700 1489 Yes Note: Red colored boxes =less complete data
15
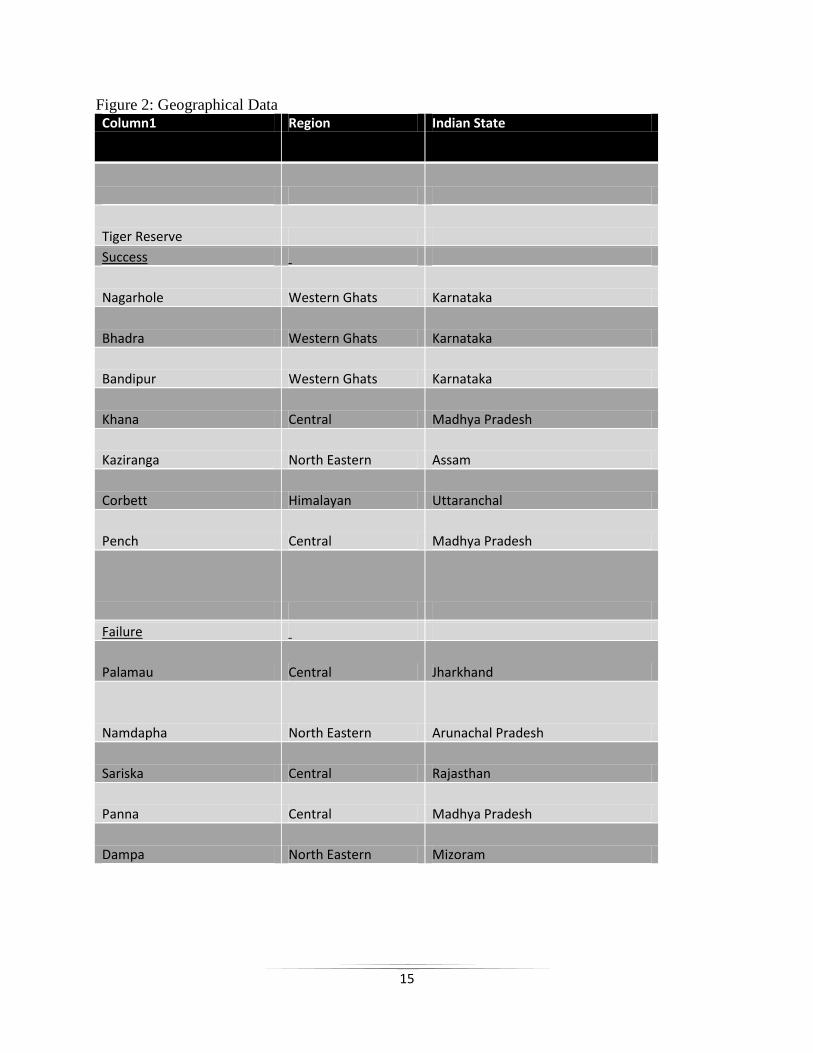
Figure 2: Geographical Data Column1 Region Indian State
Tiger Reserve
Success
Nagarhole Western Ghats Karnataka
Bhadra Western Ghats Karnataka
Bandipur Western Ghats Karnataka
Khana Central Madhya Pradesh
Kaziranga North Eastern Assam
Corbett Himalayan Uttaranchal
Pench Central Madhya Pradesh
Failure
Palamau Central Jharkhand
Namdapha North Eastern Arunachal Pradesh
Sariska Central Rajasthan
Panna Central Madhya Pradesh
Dampa North Eastern Mizoram
16
Figure 3: Socio-political Data
Column1 Conservation Hero Park Management Effectiveness
Tiger Poaching Cases 1999-2002)
Tiger Reserve
Success
Nagarhole Ullas Karanth and K. M. Chinappa
1
Bhadra
Mr. Yatish and D.V.
Girish 106 1
Bandipur 129 1
Khana Mr. H.S. Negi 163 15
Kaziranga Mr. N.K. Vasu 0
Corbett 152 0
Pench 144 15
Failure
Palamau 141 3
Namdapha 95 0
Sariska 61 3
Panna Dr. Raghu Chundawat 135 15
Dampa 121 0
17
Figure 4: Economic Data Column1 Tourism
Number Local Benefit of Tourism
Revenue from Forestry by Indian State(2001-2002) in Lakh
Amount of funding (Lakh per year)
Funding per square km (Rupees/ year)
(Tourism Revenue as proxy--Rs Lakh/year)
1 Lakh = 100,000 Rupees
Tiger Reserve
Success
Nagarhole 10046.94
Bhadra 10046.94 150 30487.80
Bandipur 51,986 12.9965 10046.94 73 8429.56
Khana 70,464 52 30660 95 4884.32
Kaziranga 959.07
Corbett 95,220 23.805 9150.41 82 6231.00
Pench 30660 74 9762.53
Failure
Palamau 10,000 2.5 1491.57 55 5360.62
Namdapha 2524.29 42 2115.87
Sariska 49,451 28 4439.98 81 9353.35
Panna 36,404 9.101 30660 140 25830.26
Dampa 55 11000.00 Note: Red colored boxes =less complete data
18
Figure 5: Statistical Data
Results for: Minitab-Tiger Project.MTW
Correlations: Reserve Success and Tiger Density Pearson correlation of Success and TigerDen = 0.809
P-Value = 0.008
Binary Logistic Regression: Reserve Success versus Prey Density
Link Function: Logit
Response Information
Variable Value Count
Success 1 6 (Event)
0 2
Total 8
Logistic Regression Table
Odds 95% CI
Predictor Coef SE Coef Z P Ratio Lower Upper
Constant -28.7365 42075.7 -0.00 0.999
Chital Den -0.0849451 92.6343 -0.00 0.999 0.92 0.00 6.53145E+78
Sambar Dens 0.0833827 90.4448 0.00 0.999 1.09 0.00 1.05776E+77
Pig Dens 0.0012651 1.41151 0.00 0.999 1.00 0.06 15.92
Log-Likelihood = -1.910
Test that all slopes are zero: G = 5.178, DF = 3, P-Value = 0.159
Measures of Association:
(Between the Response Variable and Predicted Probabilities)
Pairs Number Percent Summary Measures
Concordant 10 83.3 Somers' D 0.83
Discordant 0 0.0 Goodman-Kruskal Gamma 1.00
Ties 2 16.7 Kendall's Tau-a 0.36
Total 12 100.0
19
Figure 6: Human Population Data
Reserve district
population density (per sq km)
population total rural
% agricultural sector
% agricultural sector-rural
Nagarhole Kodagu 133.8 548561 473179 12.2 13.5
Mysore 385.4 2641027 1658899 58.4 81.1
Bandipur Chamarajanagar 189.2 985462 817372 70.8 78.4
Bhadra Chikmagalur 158.2 1140905 918181 49.7 56.7
Shimoga 193.3 1642545 1071535 61.8 80.4
Kaziranga Golaghat 270.1 946279 865141 55.6 59.5
Nagaon 603.8 2314629 2036342 58.3 65.6
Pench Seoni 133.1 1166608 1045921 83.1 88.1
Chhindwara 156 1849283 1397080 74.3 86
Corbett Nainital 198 762909 493859 50.6 68.5
Kanha Mandla 154.1 894236 802322 85.3 90
Balaghat 162.7 1497968 1303996 78.5 83.7
Palamau Palamau 240.7 2098359 1973266 79.7 82.4
Namdapha Changlang 27.1 125422 113034 75.1 80.8
Dampa Kolasib 47.6 65960 29461 66.4 79.8
Panna Chhatarpur 170 1474723 1150428 75.2 84.7
Sariska Alwar 357.2 2992592 2557653 70.9 77.4
20
Adams, W. M., and M. Infield. 2003. Who is on the gorilla’s payroll? Claims on tourist revenue from a Ugandan National Park. World Development 31:177-190.
Archabald, K., and L. Naughton-Treves. 2002. Tourism revenue-sharing around national parks in Western Uganda: early efforts to identify and reward local communities. Environmental Conservation 28:135-149.
Arjunan, M., C. Holmes, J. P. Puyravaud, and P. Davidar. 2006. Do developmental initiatives influence local attitudes toward conservation? A case study from the Kalakad–Mundanthurai Tiger Reserve, India. Journal of Environmental Management 79:188-197.
Blom, A. 2000. The monetary impact of tourism on protected area management and the local economy in Dzanga-Sangha (Central African Republic). Journal of Sustainable Tourism 8:175-189.
Bruner, A. G., R. E. Gullison, R. E. Rice, and G. A. B. da Fonseca. 2001. Effectiveness of parks in protecting tropical biodiversity. Science 291:125.
Cardillo, M., G. M. Mace, K. E. Jones, J. Bielby, O. R. P. Bininda-Emonds, W. Sechrest, C. D. L. Orme, and A. Purvis. 2005. Multiple causes of high extinction risk in large mammal species. Science 309:1239.
Carwardine, J., K. A. Wilson, G. Ceballos, P. R. Ehrlich, R. Naidoo, T. Iwamura, S. A. Hajkowicz, and H. P. Possingham. 2008. Cost-effective priorities for global mammal conservation. Proceedings of the National Academy of Sciences 105:11446.
Ceballos, G., P. R. Ehrlich, J. Soberon, I. Salazar, and J. P. Fay. 2005. Global mammal conservation: what must we manage? Science 309:603.
Cleary, D. 2006. The questionable effectiveness of science spending by international conservation organizations in the tropics. Conservation Biology 20:733-738.
Cochrane, A. L. Effectiveness and efficiency: random reflections on health services., London: Nuffield Provincial Hospitals Trust; 1972. Links.
Damania, R., R. Stringer, K. U. Karanth, and B. Stith. 2003. The economics of protecting tiger populations: linking household behavior to poaching and prey depletion. Land Economics 79:198.
Damodaran, A. 2009. Risk management instruments for debt driven conservation efforts: The case of India's Project Tiger. Ecological Economics 68:625-633.
Davidson, A. D., M. J. Hamilton, A. G. Boyer, J. H. Brown, and G. Ceballos. 2009. Multiple ecological pathways to extinction in mammals. Proceedings of the National Academy of Sciences 106:10702.
Dinerstein, E., C. Loucks, E. Wikramanayake, J. Ginsberg, E. Sanderson, J. Seidensticker, J. Forrest, G. Bryja, A. Heydlauff, S. Klenzendorf, P. Leimgruber, J. Mills, T. G. O'Brien, M. Shrestha, R. Simons, and M. Songer. 2007. The fate of wild tigers. BioScience 57:508-514.
Editors, T. P. M. (2009). Ensuring Integrity in Comparative Effectiveness Research: Accentuate the Negative. PloS Med 6:e1000152.
Garnett, S., G. Crowley, and A. Balmford. 2003. The costs and effectiveness of funding the conservation of Australian threatened birds. BioScience 53:658-665.
Gratwicke, B., J. Seidensticker, M. Shrestha, K. Vermilye, and M. Birnbaum. 2007. Evaluating the performance of a decade of Save The Tiger Fund's investments to save the world's last wild tigers. Environmental Conservation 34:255-265.
Gubbi, S., M. Linkie, and N. Leader-Williams. 2009. Evaluating the legacy of an integrated conservation and development project around a tiger reserve in India. Environmental Conservation 35:331-339.
Hockings, M. 2003. Systems for assessing the effectiveness of management in protected areas. BioScience 53:823-832.
21
James, A., K. J. Gaston, and A. Balmford. 2001. Can we afford to conserve biodiversity? BioScience 51:43-52.
Jhala, Y. V., R. Gopal, and Q. Qureshi. 2008. Status of the Tigers, Co-predators, and Prey in India. National Tiger Conservation Authority and Wildlife Institute of India. Dehradun, India.
Johnsingh, A. J. T., and A. S. Negi. 2003. Status of tiger and leopard in Rajaji–Corbett Conservation Unit, northern India. Biological Conservation 111:385-393.
Johnson, A., C. Vongkhamheng, M. Hedemark, and T. Saithongdam. 2006. Effects of human-carnivore conflict on tiger (Panthera tigris) and prey populations in Lao PDR. Animal Conservation 9:421.
Kapos, V., A. Balmford, R. Aveling, P. Bubb, P. Carey, A. Entwistle, J. Hopkins, T. Mulliken, R. Safford, and A. Stattersfield. 2009. Outcomes, not implementation, predict conservation success. Oryx 43:336-342.
Karanth, K. U., and J. D. Nichols. 1998. Estimation of tiger densities in India using photographic captures and recaptures. Ecology 79:2852-2862.
Kenney, J. S., J. L. D. Smith, A. M. Starfield, and C. W. McDougal. 1995. The long-term effects of tiger poaching on population viability. Conservation Biology 9:1127-1133.
Kothari, A., S. Suri, and N. Singh. 1995. Conservation in India: a new direction. Economic and Political Weekly:2755-2766.
Lerner, J., J. Mackey, and F. Casey. 2007. What's in Noah's wallet? Land conservation spending in the United States. BioScience 57:419-423.
Lindsey, P. A., R. Alexander, M. G. L. Mills, S. Romanach, and R. Woodroffe. 2007. Wildlife viewing preferences of visitors to protected areas in South Africa: implications for the role of ecotourism in conservation. Journal of Ecotourism 6:19-33.
Linkie, M., and S. Christie. 2007. The value of wild tiger conservation. Oryx 41:415-416. Madhusudan, M. D. 2003. Living amidst large wildlife: livestock and crop depredation by large mammals
in the interior villages of Bhadra Tiger Reserve, south India. Environmental Management 31:466-475.
McKinney, L. A., E. L. Kick, and G. M. Fulkerson. World System, Anthropogenic, and Ecological Threats to Bird and Mammal Species: A Structural Equation Analysis of Biodiversity Loss. Organization & Environment 23:3.
McKinney, M. L. 2002. Urbanization, biodiversity, and conservation. BioScience 52:883-890. Narayan, S., S. Singh, H. S. Pawar, and M. Gadgil. 2005. Joining the dots: the report of the tiger task
force. Ministry of Environment and Forests, Government of India, New Delhi, India. Nugraha, R. T., and J. Sugardjito. 2009. Assessment and Management Options of Human-Tiger Conflicts
in Kerinci Seblat National Park, Sumatra, Indonesia. Mammal Study 34:141-154. O'Brien, T. G., M. F. Kinnaird, and H. T. Wibisono. 2003. Crouching tigers, hidden prey: Sumatran tiger
and prey populations in a tropical forest landscape. Animal Conservation 6:131-139. Pimm, S. L., G. J. Russell, J. L. Gittleman, and T. M. Brooks. 1995. The future of biodiversity. Science
269:347. Pullin, A. S., and T. M. Knight. 2001. Effectiveness in conservation practice: pointers from medicine and
public health. Conservation Biology:50-54. Purvis, A., J. L. Gittleman, G. Cowlishaw, and G. M. Mace. 2000. Predicting extinction risk in declining
species. Proceedings of the Royal Society B: Biological Sciences 267:1947. Rao, K. S., R. K. Maikhuri, S. Nautiyal, and K. G. Saxena. 2002. Crop damage and livestock depredation by
wildlife: a case study from Nanda Devi Biosphere Reserve, India. Journal of Environmental Management 66:317-327.
Salzer, D., and N. Salafsky. 2006. Allocating resources between taking action, assessing status, and measuring effectiveness of conservation actions. Natural Areas Journal 26:310-316.
22
Sandbrook, C. G. 2008. Putting leakage in its place: The significance of retained tourism revenue in the local context in Rural Uganda. Journal of International Development.
Sanderson, E., J. Forrest, C. Loucks, J. Ginsberg, E. Dinerstein, J. Seidensticker, P. Leimgruber, M. Songer, A. Heydlauff, and T. O’Brien. 2006. Setting Priorities for the Conservation and Recovery of Wild Tigers: 2005–2015. The Technical Assessment. Wildlife Conservation Society, WWF, Smithsonian and National Fish and Wildlife Foundation-Save the Tiger Fund, New York and Washington, DC, USA.
Sekhar, N. U. 2002. Crop and livestock depredation caused by wild animals in protected areas: the case of Sariska Tiger Reserve, Rajasthan, India. Environmental Conservation 25:160-171.
Soulé, M. E., J. A. Estes, B. Miller, and D. L. Honnold. 2005. Strongly interacting species: conservation policy, management, and ethics. BioScience 55:168-176.
Sutherland, W. J., A. S. Pullin, P. M. Dolman, and T. M. Knight. 2004. The need for evidence-based conservation. Trends in Ecology & Evolution 19:305-308.
Treves, A., and K. U. Karanth. 2003. Human-carnivore conflict and perspectives on carnivore management worldwide. Conservation Biology 17:1491-1499.
Udaya Sekhar, N. 2003. Local people's attitudes towards conservation and wildlife tourism around Sariska Tiger Reserve, India. Journal of Environmental Management 69:339-347.
Wikramanayake, E. D., E. Dinerstein, J. G. Robinson, U. Karanth, A. Rabinowitz, D. Olson, T. Mathew, P. Hedao, M. Conner, and G. Hemley. 1998. An ecology-based method for defining priorities for large mammal conservation: the tiger as case study. Conservation Biology 12:865-878.
Woodroffe, R. 2000. Predators and people: using human densities to interpret declines of large carnivores. Animal Conservation 3:165-173.
Related Documents