341 CHILEAN JOURNAL OF AGRICULTURAL RESEARCH 75(3) JULY - SEPTEMBER 2015 RESEARCH Evaluation of three semi-empirical approaches to estimate the net radiation over a drip-irrigated olive orchard Rafael López-Olivari 1 , Samuel Ortega-Farías 2* , Luis Morales 3 , and Héctor Valdés 2 The use of actual evapotranspiration (ET a ) models requires an appropriate parameterization of the available energy, where the net radiation (R n ) is the most important component. Thus, a study was carried out to calibrate and evaluate three semi- empirical approaches to estimate net radiation (R n ) over a drip-irrigated olive (Olea europaea L. ‘Arbequina’) orchard during 2009/2010 and 2010/2011 seasons. The orchard was planted in 2005 at high density in the Pencahue Valley, Maule Region, Chile. The evaluated models were calculated using the balance between long and short wave radiation. To achieve this objective it was assumed that T s = T a for Model 1, T s = T cv for Model 2 and T s = T r for Model 3 (T s is surface temperature; T a is air temperature; and T cv is temperature inside of the tree canopy; T r is radiometric temperature). For the three models, the Brutsaert’s empirical coefficient (φ) was calibrated using incoming long wave radiation equation with the database of 2009/2010 season. Thus, the calibration indicated that φ was equal to 1.75. Using the database from 2010/2011 season, the validation indicated that the three models were able to predict the R n at a 30-min interval with errors lower than 6%, root mean square error (RMSE) between 26 and 39 W m -2 and mean absolute error (MAE) between 20 and 31 W m -2 . On daily time intervals, validation indicated that models presented errors, RMSE and MAE between 2% and 3%, 1.22-1.54 and 1.04-1.35 MJ m -2 d -1 , respectively. The three R n -Models would be evaluated and used in others Mediterranean conditions according to the availability of data to estimate net radiation over a drip-irrigated olive orchard planted at high density. Key words: Actual evapotranspiration, air emissivity, Brutsaert’s equation training system, Olea europaea. 1 Instituto de Investigaciones Agropecuarias, INIA Carillanca, km 10 camino Cajón-Vilcún s/n, Temuco, Chile. 2 Universidad de Talca, Facultad de Ciencias Agrarias, Av. Lircay s/n, Talca, Chile. * Corresponding author ([email protected]). 3 Universidad de Chile, Facultad de Ciencias Agronómicas, Santa Rosa, 11315, Santiago, Chile. Received: 10 July 2014. Accepted: 2 April 2015. doi:10.4067/S0718-58392015000400011 INTRODUCTION A better irrigation water management for optimizing water efficiency of cultivated plants is required due to irrigation water scarcity. Thus, the accurate determination of actual evapotranspiration (ET a ) is a key factor to compute the optimum water requirements. In this context, ET a is calculated using a reference evapotranspiration (ET 0 ) from a grass or alfalfa-surface multiplied by specific crop-coefficients (K c ). Furthermore, several researchers have suggested using three or two-source models to directly compute ET a . These models are based on the Penman-Monteith approach to compute separately plant transpiration from soil evaporation (Shuttleworth and Wallace, 1985; Brenner and Incoll, 1997; Testi et al., 2006; Ortega-Farías and López-Olivari, 2012). The use of ET a models requires an appropriate parameterization of the available energy, where the net radiation (R n ) is the most important factor. In general, the R n has been estimated using empirical models or linear regressions, which use the incident solar radiation as the main input variable (Kustas et al., 1994; Al-Riahi et al., 2003; Alados et al., 2003; Almeida and Landsberg, 2003). Pereira et al. (2007) used a simple approach to transform daily values of grass R n into whole tree canopy net radiation for walnut, apples, olives, and citrus. However, these models are site-specific and do not consider the long wave components in the calculation of R n . On the other hand, there are semi-empirical models based on Stefan-Boltzmann law that includes the estimation of long wave radiation into the R n formulation. The accuracy of these models depends mainly on the atmospheric emissivity (ε a ) for which there are several ways of calculations in literature (Bastiaanssen, 1995; Prata, 1996; Crawford and Duchon, 1999), but many of they are empirical and generally site-specific. Among the semi-empirical algorithms to calculate ε a , we can highlight the Brutsaert’s equation, which is based on radiative transfer theory. For agricultural applications, the Brutsaert’s emissivity equation has been widely used to compute R n for several crops such as green grass, maize, pecan, and cottonwood trees and grapevines (Allen

Welcome message from author
This document is posted to help you gain knowledge. Please leave a comment to let me know what you think about it! Share it to your friends and learn new things together.
Transcript

341340 CHILEAN JOURNAL OF AGRICULTURAL RESEARCH 75(3) JULY-SEPTEMBER 2015CHILEAN JOURNAL OF AGRICULTURAL RESEARCH 75(3) JULY-SEPTEMBER 2015
RESEARCH
Evaluation of three semi-empirical approaches to estimate the net radiation over a drip-irrigated olive orchard
Rafael López-Olivari1, Samuel Ortega-Farías2*, Luis Morales3, and Héctor Valdés2
The use of actual evapotranspiration (ETa) models requires an appropriate parameterization of the available energy, where the net radiation (Rn) is the most important component. Thus, a study was carried out to calibrate and evaluate three semi-empirical approaches to estimate net radiation (Rn) over a drip-irrigated olive (Olea europaea L. ‘Arbequina’) orchard during 2009/2010 and 2010/2011 seasons. The orchard was planted in 2005 at high density in the Pencahue Valley, Maule Region, Chile. The evaluated models were calculated using the balance between long and short wave radiation. To achieve this objective it was assumed that Ts = Ta for Model 1, Ts = Tcv for Model 2 and Ts = Tr for Model 3 (Ts is surface temperature; Ta is air temperature; and Tcv is temperature inside of the tree canopy; Tr is radiometric temperature). For the three models, the Brutsaert’s empirical coefficient (φ) was calibrated using incoming long wave radiation equation with the database of 2009/2010 season. Thus, the calibration indicated that φ was equal to 1.75. Using the database from 2010/2011 season, the validation indicated that the three models were able to predict the Rn at a 30-min interval with errors lower than 6%, root mean square error (RMSE) between 26 and 39 W m-2 and mean absolute error (MAE) between 20 and 31 W m-2. On daily time intervals, validation indicated that models presented errors, RMSE and MAE between 2% and 3%, 1.22-1.54 and 1.04-1.35 MJ m-2 d-1, respectively. The three Rn-Models would be evaluated and used in others Mediterranean conditions according to the availability of data to estimate net radiation over a drip-irrigated olive orchard planted at high density.
Key words: Actual evapotranspiration, air emissivity, Brutsaert’s equation training system, Olea europaea.
1Instituto de Investigaciones Agropecuarias, INIA Carillanca, km 10 camino Cajón-Vilcún s/n, Temuco, Chile.2Universidad de Talca, Facultad de Ciencias Agrarias, Av. Lircay s/n, Talca, Chile. *Corresponding author ([email protected]). 3Universidad de Chile, Facultad de Ciencias Agronómicas, Santa Rosa, 11315, Santiago, Chile.Received: 10 July 2014.Accepted: 2 April 2015.doi:10.4067/S0718-58392015000400011
INTRODUCTION
A better irrigation water management for optimizing water efficiency of cultivated plants is required due to irrigation water scarcity. Thus, the accurate determination of actual evapotranspiration (ETa) is a key factor to compute the optimum water requirements. In this context, ETa is calculated using a reference evapotranspiration (ET0) from a grass or alfalfa-surface multiplied by specific crop-coefficients (Kc). Furthermore, several researchers have suggested using three or two-source models to directly compute ETa. These models are based on the Penman-Monteith approach to compute separately plant transpiration from soil evaporation (Shuttleworth and Wallace, 1985; Brenner and Incoll, 1997; Testi et al., 2006; Ortega-Farías and López-Olivari, 2012). The use
of ETa models requires an appropriate parameterization of the available energy, where the net radiation (Rn) is the most important factor. In general, the Rn has been estimated using empirical models or linear regressions, which use the incident solar radiation as the main input variable (Kustas et al., 1994; Al-Riahi et al., 2003; Alados et al., 2003; Almeida and Landsberg, 2003). Pereira et al. (2007) used a simple approach to transform daily values of grass Rn into whole tree canopy net radiation for walnut, apples, olives, and citrus. However, these models are site-specific and do not consider the long wave components in the calculation of Rn. On the other hand, there are semi-empirical models based on Stefan-Boltzmann law that includes the estimation of long wave radiation into the Rn formulation. The accuracy of these models depends mainly on the atmospheric emissivity (εa) for which there are several ways of calculations in literature (Bastiaanssen, 1995; Prata, 1996; Crawford and Duchon, 1999), but many of they are empirical and generally site-specific. Among the semi-empirical algorithms to calculate εa, we can highlight the Brutsaert’s equation, which is based on radiative transfer theory. For agricultural applications, the Brutsaert’s emissivity equation has been widely used to compute Rn for several crops such as green grass, maize, pecan, and cottonwood trees and grapevines (Allen
343342 CHILEAN JOURNAL OF AGRICULTURAL RESEARCH 75(3) JULY-SEPTEMBER 2015CHILEAN JOURNAL OF AGRICULTURAL RESEARCH 75(3) JULY-SEPTEMBER 2015
et al., 1998; Ortega-Farías et al., 2000; Samani et al., 2007; Carrasco and Ortega-Farías, 2008; Irmak et al., 2010). Recently, Ezzahar et al. (2007) used the original Brutsaert’s equation to estimate long-wave radiation for an irrigated olive orchard. In this study, the authors used as input the surface temperature computed as a function of soil and canopy temperatures, and fractional cover. Furthermore, Berni et al. (2009) used the same equation incorporating the cloud fraction term (clf) to correct the emissivity on clear conditions for a drip-irrigated olive orchard. The empirical coefficient (φ) of the Brutsaert’s equation depends on variations of climate characteristics, thus a local calibration of φ is required to improve the calculation of Rn (Sugita and Brutsaert, 1993). In literature there are few semi-empirical methods to estimate Rn over fruit trees especially for olive orchard planted at high density (> 1300 trees ha-1). In this regard, the objective of this research was to evaluate three semi-empirical models to estimate net radiation (Rn) over a drip-irrigated olive orchard planted at high density.
MATERIALS AND METHODS
Net radiation model Net radiation (Rn) is considered as the sum of incoming and outgoing shortwave and long-wave radiation, which is also a measure of the available energy at an underlying surface. It is also considered the fundamental parameter that commands the climate of the planetary boundary layer, being the driving force for processes, such as, evapotranspiration, air and soil heating, and photosynthesis. The daytime variation of net radiation over an olive orchard can be calculated as: Rne = (1 – α) R↓ + σ(εa Ta
4 – εs Ts4) [1]
where, Rne is estimated net radiation (W m-2); R↓ is incoming short wave solar radiation (W m-2); α is albedo (dimensionless); εs is surface emissivity (dimensionless); εa is atmospheric emissivity (dimensionless); Ta is air temperature (°K); Ts is surface temperature (°K); σ is Stefan-Boltzmann constant (5.67 × 10⁻⁸ W m-2 °K-4). εa is determined according to the following expression (Brutsaert, 1975): εa = φ(ea /Ta)1/7 [2]where, ea is air va por pressure (kPa) and φ is empirical coefficient.
Olive orchard descriptionThe experiment was conducted during the 2009/2010 and 2010/2011 growing seasons on a drip-irrigated olive orchard (Olea europaea L. ‘Arbequina’) for oil production. The orchard had an extension of 2.7 ha with a slope of 1.6% and is located in the Pencahue Valley (35º23’ S, 71º44’ W; 96 m a.s.l.), Maule Region, Chile. The olive trees were planted in 2005 in East-West orientated rows. Trees were planted 5 m apart with 1.5 m within-row (1333 trees ha-1) and conducted in cone trellis system at a height
of 3.2 m and canopy width of 1.55 m. The climate in this area is a typical Mediterranean semiarid climate with a daily average temperature of 14.8 °C between September and May. Average annual rainfall in the region reaches 602 mm mainly concentrated during the winter months (June-September). The summer period is usually dry (3.5% of annual rainfall) and hot with high atmospheric demand for water vapor. The soil is classified as Vertisol (Family Fine, thermic Xeric Apiaquerts, Quepo series) with a clay loam texture (CIREN, 1997).
Meteorological measurementsAn automatic weather station was installed to measure meteorological variables over a drip-irrigated olive orchard planted at high density. Wind speed (u) and wind direction (w) were monitored by a cup anemometer and a wind vane (03101-5, R.M. Young Company, Traverse City, Michigan, USA), respectively. Precipitation (Pp) was measured by a rain gauge (A730RAIN, Adcon Telemetry, Klosterneuburg, Austria). Air temperature (Ta) and air relative humidity (RHa) were measured using HOBO Pro RH/Temp sensors (Onset Computer, Bourne, Massachusetts, USA). Net radiation (Rn), incoming (R↓) and outgoing (R↑) solar radiation were measured by a four-way net radiometer (CNR1, Kipp & Zonen, Delft, The Netherlands) installed at 1.9 m above the tree canopy. In this radiometer, the short and long wave solar radiations are measured by two CM3 pyranometers and two CG3 pyrgeometers, respectively. Half-hour averages of all balance radiation signals were recorded on an electronic datalogger (CR5000, Campbell Scientific, Logan, Utah, USA). Sensors of u, w, Pp, Ta, and RHa were installed at 4.8 m above the soil surface. Also, a HOBO sensor to measure canopy temperature (Tcv) and relative humidity (RHcv) was installed inside the canopy at 1.5 m above the soil surface. Finally, a hand-held multi-spectral radiometer equipped with sun angle cosine correction capacity (MSR16R, CropScan Inc., Rochester, Minnesota, USA) was used to estimate the Normalized Difference Vegetation Index (NDVI) over the canopy and soil surface between rows. The measures of multi-spectral radiometer were recorded once a week. The multi-spectral radiometer was manually transported and a support pole was used to position the radiometer 0.5 m above the tree canopy.
Irrigation management and soil-plant measurements Irrigation water was delivered four times per week using 2.1 L h-1 drippers spaced at 0.75 m intervals along the rows (two drippers per plant). Olive tree water status was evaluated, every 15 d, using midday stem water potential (ψx) measured with a pressure chamber (model 1000, PMS Instrument Co., Albany, Oregon, USA) on 30 shoots (one shoot per tree) covered for 2 h before measurement with a plastic bag and aluminum foil. Olive trees were maintained under non-water-stress conditions (ψx > -1.5

343342 CHILEAN JOURNAL OF AGRICULTURAL RESEARCH 75(3) JULY-SEPTEMBER 2015CHILEAN JOURNAL OF AGRICULTURAL RESEARCH 75(3) JULY-SEPTEMBER 2015
MPa) during both studied seasons (Moriana et al., 2007; Gómez-del-Campo et al., 2008). The fractional cover (fc) of the olive orchard was calculated according to Er-Raki et al. (2008) methodology obtaining values of 0.29 (± 0.07) and 0.30 (± 0.05) for the 2009/2010 and 2010/2011 seasons, respectively. Two averaging thermocouples probes (TCAV, Campbell Scientific) were used to measure soil temperature (Tsoil) installed at 0.02 and 0.06 m depth (two pairs in the inter row and two pairs below the row). Averages of 30-min for all thermocouples probes were recorded using an electronic datalogger (CR3000, Campbell Scientific).
Calibration and evaluationThe calibration of the original Brutsaert’s coefficient (φ = 1.24) was carried out using a database (Ta, RH, Rl
↑) from December 2009 to February 2010. At 30-min interval, the calibrated value of φ was obtained using the following equation: Rl
↓ = φ(ea /Ta)1/7 σTa4 [3]
The model evaluation was done using data collected from December 2010 to February 2011. In this case, the following three approaches were used to calculate daytime variation of Rne:a) Assuming that Ts = Ta, Equation [1] becomes (Model 1): [4]b) Assuming that Ts = Tcv, Equation [1] becomes (Model 2): [5]
c) Assuming that Ts = Tr, Equation [1] becomes (Model 3):
[6]
In the last model, Tr corresponds to the radiometric temperature which was estimated as follow (Ezzahar et al., 2007; Morillas et al., 2013): [7]where Tsoil and Tcv are soil and canopy temperatures (K), respectively; fc is the fractional cover of the olive orchard (0.29 and 0.30 during 2009/2010 and 2010/2011 seasons, respectively) and C is the empirical coefficient (C = 0.85). The surface emissivity was calculated as follow (Morales, 1997): εs = 0.9585 + 0.0357(NDVIavg) [8]where NDVIavg is the average Normalized Difference Vegetation Index. The values of NDVIavg were computed as: [9]
where NDVIbr is the normalized difference vegetation index measured from soil between rows (dimensionless); NDVIr is the normalized vegetation index measured above olive canopy (dimensionless); n is the number of total measurements and m is the individual measurement.
Statistical analysis For calibration, estimated values of Rl
↓ were compared to those measured by a CG3 pyrgeometer including the root mean square error (RMSE) and mean absolute error (MAE). For the validation, estimated values of net radiation (Rne) using Models 1, 2, and 3 were compared to those measured by CNR1. Daily and 30-min comparisons included the Rne/Rn (reo) and Rel
↓/Rl↓ (reol) ratios, RMSE,
MAE, refined index of agreement (dr) and t-statistic (Mayer and Butler, 1993; Stone, 1993; Willmott et al., 2012). These statistical parameters are described as follows:
where Ei and Oi are the estimated and observed values, respectively; O is the mean of the observed values and n is the total number of observations; n - 1 is the degree of freedom; MBE is the mean bias error. Additionally, the Z-test was used to check whether the value of reo was significantly different from 1.0 at the 95% confidence level.
RESULTS AND DISCUSSIONS
Climatic conditionsDaily mean values of incoming short wave radiation (R↓) were between 2.4-33.9 and 4.5-34.2 MJ m-2 d-1 for the 2009/2010 and 2010/2011 season, respectively. Daily mean values of measured net radiation (Rn) ranged between 0.2-21.9 MJ m-2 d-1 for 2009/2010 season and 3.5-21.8 MJ m-2 d-1 for 2010/2011 season (Figure 1a and 1d). The ratio of Rn to R↓ was about 0.46 and 0.62 during the first and second seasons, respectively. The average (Taavg), maximum (Tamax) and minimum (Tamin) air temperatures throughout 2009/2010 season were 17.9, 27.9, and 9.1 °C, respectively (Figure 1b). Temperatures during 2010/2011 season were of 19.4, 29.2, and 10.4 °C for Taavg, Tamax, and Tamin, respectively (Figure 1e). The values of minimum air temperature during the period of measurements throughout 2009/2010 and 2010/2011 seasons were of 6.2 and 4.1 °C, respectively, while those
Rne = (1 – α)R↓ + σ φ Ta – εs Tcv[ ]ea
Ta
71
[ ] 44
Rne = (1 – α)R↓ + σ φ Ta – εs Tr[ ]ea
Ta
71
[ ] 44
NDVIavg = (fcNDVIr + (1 – fc) NDVIbr)
n
∑m
i=1
t = (n – 1)MBE2
RMSE2 – MBE2
RMSE = (Ei – Oi)2
n
∑n
i=1
MAE = Ei – Oi
n
∑n
i=1
, whenEi – Oi∑
n
i=1 Ei – Oi∑n
i=1Oi – Oi2∑n
i=1
Oi – Oi2∑n
i=1≤
–1, when >Ei – Oi∑
n
i=1
Ei – Oi∑n
i=1
Oi – Oi2∑n
i=1 Oi – Oi2∑n
i=1
dr =
[10]
[11]
[12]
[13]
Rne = (1 – α)R↓ + σTa4 φ – εs[ ]ea
Ta
71
[ ]
Tr ≈ C4 fc Tcv4 + (1 fc )Tsoil
4
1–
345344 CHILEAN JOURNAL OF AGRICULTURAL RESEARCH 75(3) JULY-SEPTEMBER 2015CHILEAN JOURNAL OF AGRICULTURAL RESEARCH 75(3) JULY-SEPTEMBER 2015
of maximum air temperature during 2009/2010 and 2010/2011 seasons were 35.7 and 38.3°C, respectively. For the 2009/2010 season, mean values of Davg, Dmax, and Dmin were 1.1, 2.8 and 0.11 kPa, respectively (Figure 1c), while those observed during 2010/2011 season were of 1.2, 3.0 and 0.10 kPa, respectively (Figure 1f).
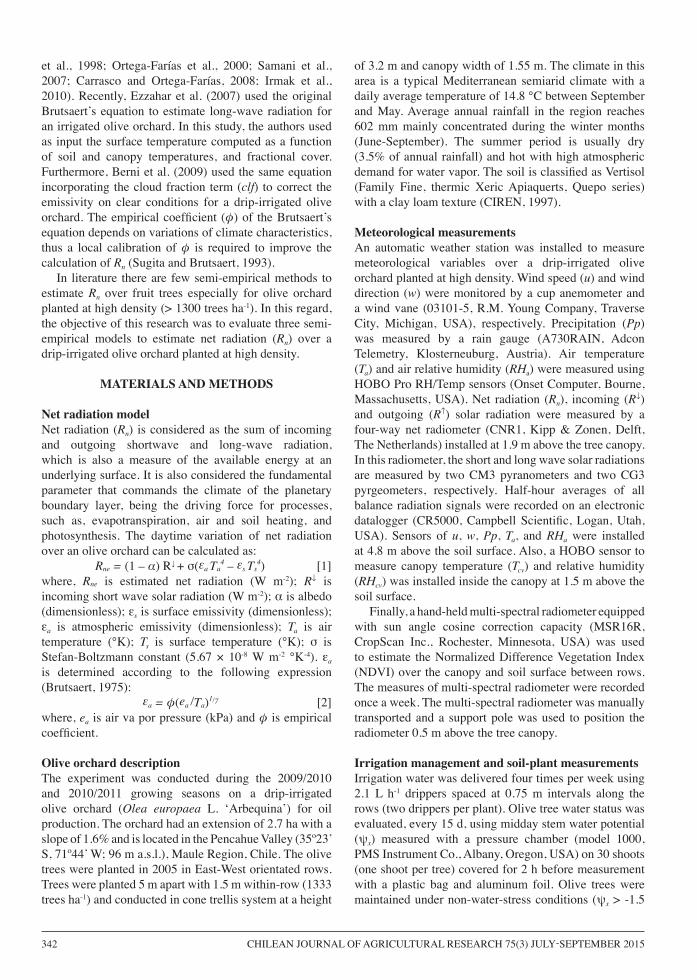
Calibration modelFor the 2009/2010 database, the Brutsaert’s coefficient was of φ = 1.75 for all three models using a non-linear optimization. In this case, the Rl
↓ values were underestimated by about 1% and 30% for φ equal to 1.75 and 1.24, respectively. Also, RMSE and MAE values were 22 and 17 W m-2 for φ = 1.75 while those were 101 and 98 W m-2 for φ = 1.24, respectively (Table 1). For φ = 1.75, the t-statistic was 1.82 and the Rel
↓/Rl↓ ratio (reol) and
refined index of agreement (dr) were more close to 1, with values of 0.99 and 0.66, respectively. However, for φ = 1.24, the t-statistic, reol, and dr indexes were 164.29, 0.70,
and 0.50, respectively (Table 1). Crawford and Duchon (1999) suggested seasonal adjustments to the φ coefficient ranging from 1.28 in January to 1.16 in July (North Hemisphere). Sridhar and Elliott (2002) for Oklahoma and Culf and Gash (1993) for Niger found a mean value of 1.31 to four different geographic and climatic conditions. However, Sugita and Brutsaert (1993) suggested a new empirical coefficient of 0.98 using data from the First International Satellite Land Surface Climatology Project (ISLSCP) Field Experiment (FIFE). In this regard, Sugita and Brutsaert (1993) proposed to locally calibrate the Brutsaert’s formula in order to accurately estimate the incoming long wave radiation for specific agroclimatic conditions. Sicart et al. (2010) indicated that the φ values depend directly on local atmospheric conditions where changes in temperature and humidity certainly are the main factors. For the 2009/2010 database, the comparison between measured and computed Rn indicated that Models 1, 2, and
Estimated Rl↓ (φ = 1.75) 1200 22 17 1.82 0.66 0.99 F
Estimated Rl↓ (φ = 1.24) 1200 101 98 164.29 0.50 0.70 F
Model 1 (φ = 1.75) 1200 27 22 9.77 0.96 1.05 FModel 1 (φ = 1.24) 1200 93 90 132.40 0.82 0.89 FModel 2 (φ = 1.75) 1200 26 21 9.86 0.96 1.04 FModel 2 (φ = 1.24) 1200 93 90 133.99 0.82 0.89 FModel 3 (φ = 1.75) (C = 0.85) 1200 31 25 0.02 0.95 1.05 FModel 3 (φ = 1.24) (C = 0.85) 1200 101 97 130.01 0.81 0.90 F
Table 1. Statistical evaluation for three semi-empirical models to estimate incoming long wave radiation (Rl↓) and net radiation (Rn) over a
drip-irrigated olive orchard planted at high density during the 2009/2010 season.
30 min comparison
RMSE: Root mean square error; MAE: mean absolute error; dr: refined index of agreement; reo: ratio of estimated (Rne) to observed (Rn) values of net radiation on 30 min; reol: ratio of estimated (Rel
↓) to observed (Rl↓) values of incoming long wave radiation on 30 min; T: true hypothesis (b = 1); F: false hypothesis (b ≠ 1).
1The smaller the value of t, the better is the model’s performance.
Number of observations Z-test
RMSE(W m-2)
MAE(W m-2) t-Statistic1 dr
reo = Rne̸Rn
reol = Rel↓̸Rl
↓
Taavg, Tamax and Tamin are average, maximum, and minimum air temperature, respectively; Davg, Dmax and Dmin are average, maximum, and minimum vapor pressure deficit, respectively; DOY is the day of year.
Figure 1. Daily values of incoming short wave radiation (R↓) and net radiation (Rn) [(a) and (d)]; air temperature (Ta) [(b) and (e)]; and vapor pressure deficit (D) [(c) and (f)] during the 2009/2010 and 2010/2011 seasons, respectively.
345344 CHILEAN JOURNAL OF AGRICULTURAL RESEARCH 75(3) JULY-SEPTEMBER 2015CHILEAN JOURNAL OF AGRICULTURAL RESEARCH 75(3) JULY-SEPTEMBER 2015
3 using φ = 1.75 presented errors between 4% and 5%, whereas those using φ = 1.24 had errors between 10% and 11%. In this regard, Brotzge and Deuchon (2000) and Brotzge and Crawford (2003) reported that the possible errors in the estimation of Rn for cloudy days could be associated with the parameterization of the air emissivity. Furthermore, Ezzahar et al. (2007) and Ortega-Farías et al. (2000) showed that the use of the uncalibrated Brutsaert’s formula that might create an important scattering for low Rn values. For all-sky condition, the major difficulty was associated with the estimation of the long wave radiation, which it is related to the surface temperature (Ts).
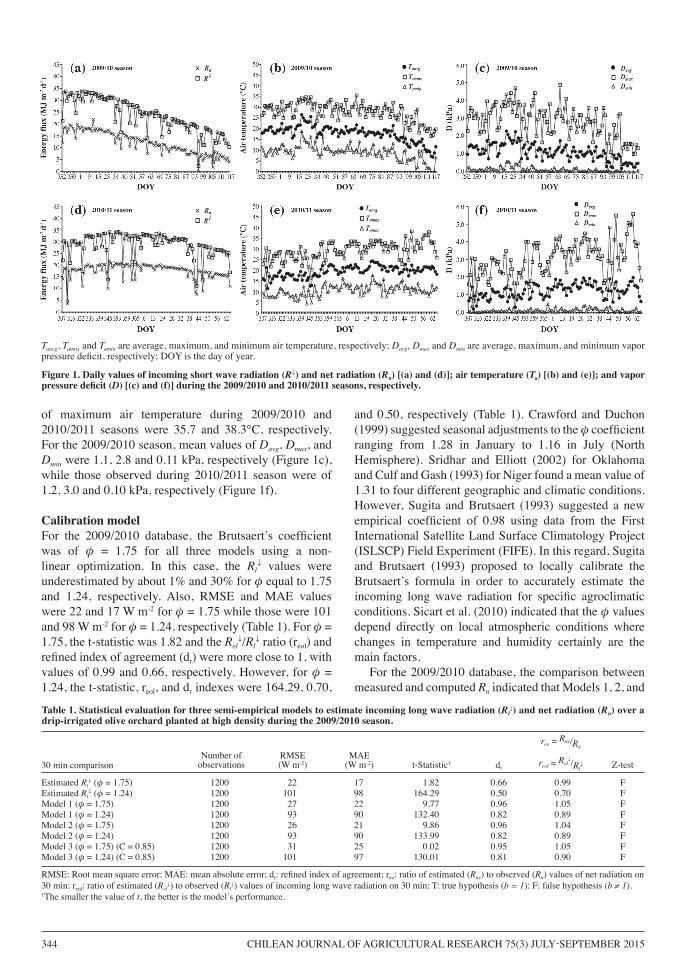
Model evaluation The mean albedo value (α) obtained using measurements of R↑/R↓ ratios from 09:00 to 18:00 h (Figure 2) indicates
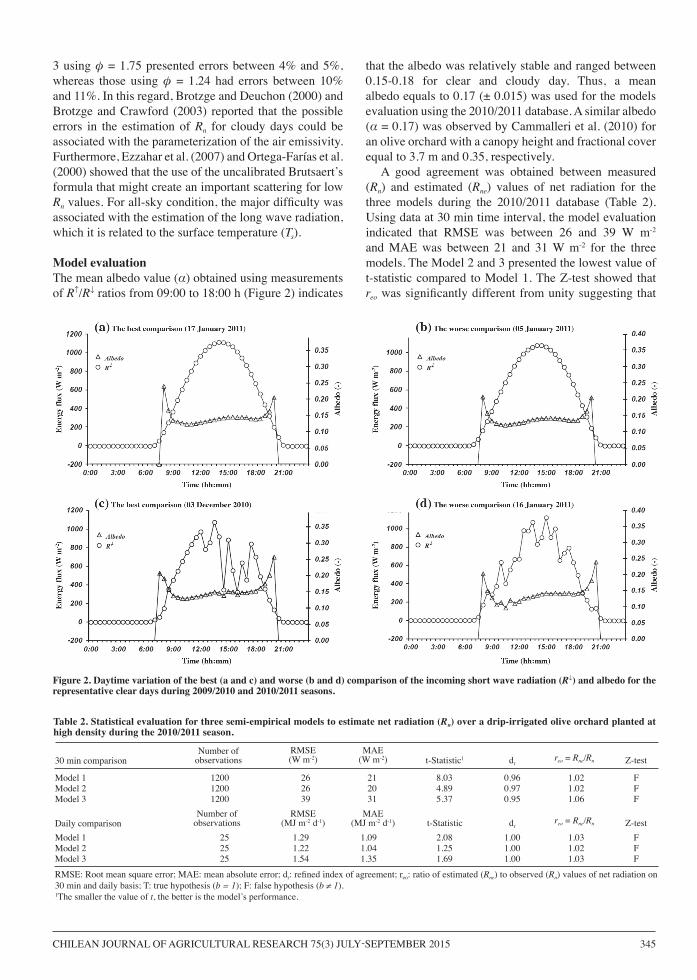
that the albedo was relatively stable and ranged between 0.15-0.18 for clear and cloudy day. Thus, a mean albedo equals to 0.17 (± 0.015) was used for the models evaluation using the 2010/2011 database. A similar albedo (α = 0.17) was observed by Cammalleri et al. (2010) for an olive orchard with a canopy height and fractional cover equal to 3.7 m and 0.35, respectively. A good agreement was obtained between measured (Rn) and estimated (Rne) values of net radiation for the three models during the 2010/2011 database (Table 2). Using data at 30 min time interval, the model evaluation indicated that RMSE was between 26 and 39 W m-2 and MAE was between 21 and 31 W m-2 for the three models. The Model 2 and 3 presented the lowest value of t-statistic compared to Model 1. The Z-test showed that reo was significantly different from unity suggesting that
Figure 2. Daytime variation of the best (a and c) and worse (b and d) comparison of the incoming short wave radiation (R↓) and albedo for the representative clear days during 2009/2010 and 2010/2011 seasons.
Model 1 1200 26 21 8.03 0.96 1.02 FModel 2 1200 26 20 4.89 0.97 1.02 FModel 3 1200 39 31 5.37 0.95 1.06 F
Table 2. Statistical evaluation for three semi-empirical models to estimate net radiation (Rn) over a drip-irrigated olive orchard planted at high density during the 2010/2011 season.
30 min comparison
RMSE: Root mean square error; MAE: mean absolute error; dr: refined index of agreement; reo: ratio of estimated (Rne) to observed (Rn) values of net radiation on 30 min and daily basis; T: true hypothesis (b = 1); F: false hypothesis (b ≠ 1). 1The smaller the value of t, the better is the model’s performance.
Number of observations Z-testt-Statistic1 dr
reo = Rne̸Rn
RMSE(MJ m-2 d-1)
MAE(MJ m-2 d-1) t-Statistic dr
reo = Rne̸RnDaily comparisonNumber of
observations Z-testModel 1 25 1.29 1.09 2.08 1.00 1.03 FModel 2 25 1.22 1.04 1.25 1.00 1.02 FModel 3 25 1.54 1.35 1.69 1.00 1.03 F
RMSE(W m-2)
MAE(W m-2)
347346 CHILEAN JOURNAL OF AGRICULTURAL RESEARCH 75(3) JULY-SEPTEMBER 2015CHILEAN JOURNAL OF AGRICULTURAL RESEARCH 75(3) JULY-SEPTEMBER 2015
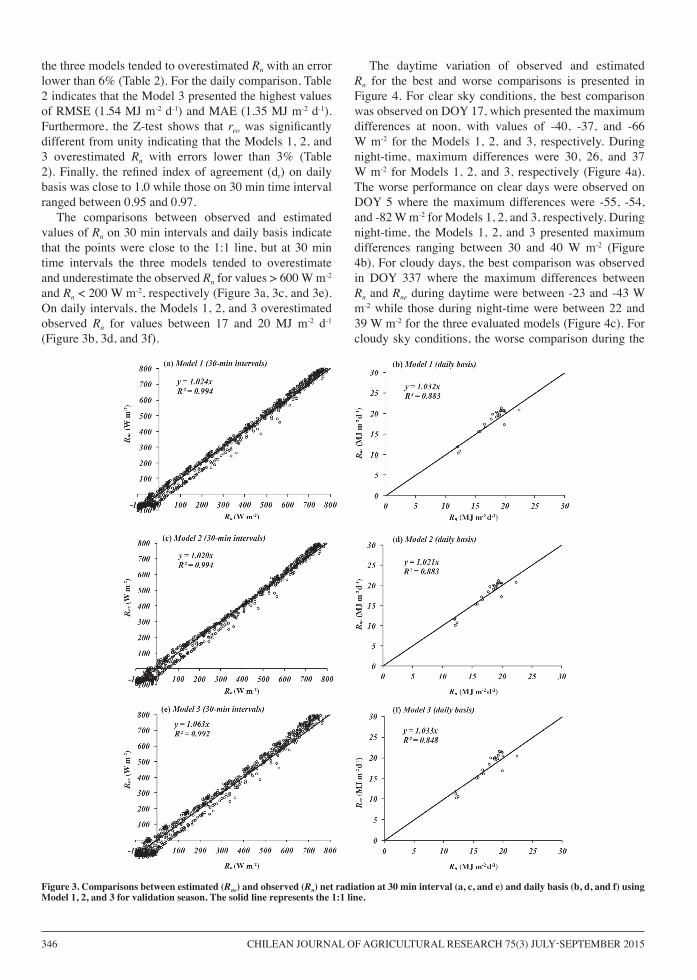
the three models tended to overestimated Rn with an error lower than 6% (Table 2). For the daily comparison, Table 2 indicates that the Model 3 presented the highest values of RMSE (1.54 MJ m-2 d-1) and MAE (1.35 MJ m-2 d-1). Furthermore, the Z-test shows that reo was significantly different from unity indicating that the Models 1, 2, and 3 overestimated Rn with errors lower than 3% (Table 2). Finally, the refined index of agreement (dr) on daily basis was close to 1.0 while those on 30 min time interval ranged between 0.95 and 0.97. The comparisons between observed and estimated values of Rn on 30 min intervals and daily basis indicate that the points were close to the 1:1 line, but at 30 min time intervals the three models tended to overestimate and underestimate the observed Rn for values > 600 W m-2 and Rn < 200 W m-2, respectively (Figure 3a, 3c, and 3e). On daily intervals, the Models 1, 2, and 3 overestimated observed Rn for values between 17 and 20 MJ m-2 d-1 (Figure 3b, 3d, and 3f).
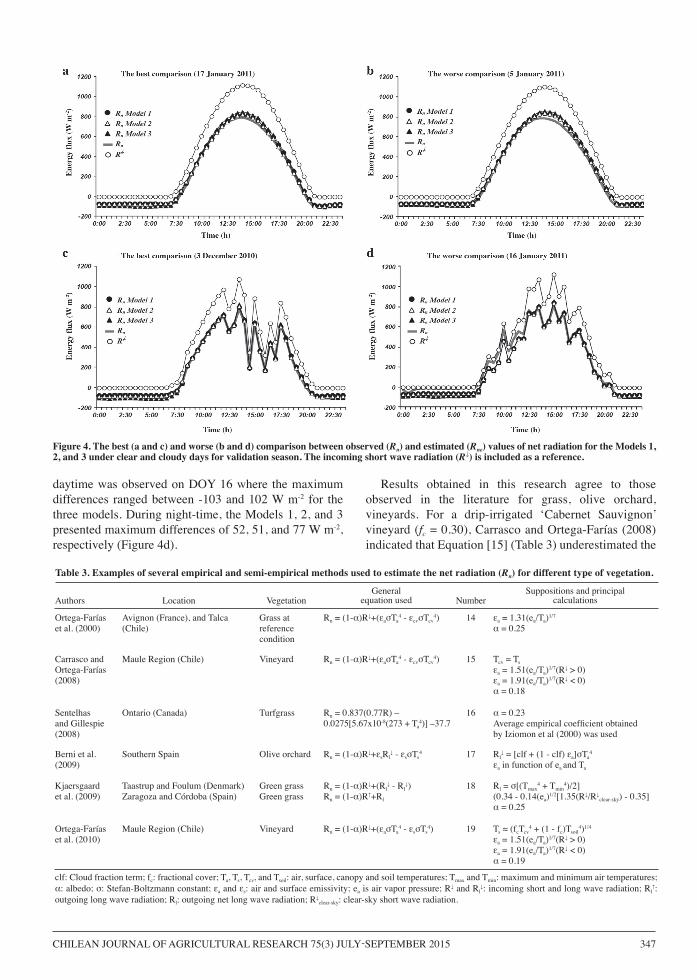
The daytime variation of observed and estimated Rn for the best and worse comparisons is presented in Figure 4. For clear sky conditions, the best comparison was observed on DOY 17, which presented the maximum differences at noon, with values of -40, -37, and -66 W m-2 for the Models 1, 2, and 3, respectively. During night-time, maximum differences were 30, 26, and 37 W m-2 for Models 1, 2, and 3, respectively (Figure 4a). The worse performance on clear days were observed on DOY 5 where the maximum differences were -55, -54, and -82 W m-2 for Models 1, 2, and 3, respectively. During night-time, the Models 1, 2, and 3 presented maximum differences ranging between 30 and 40 W m-2 (Figure 4b). For cloudy days, the best comparison was observed in DOY 337 where the maximum differences between Rn and Rne during daytime were between -23 and -43 W m-2 while those during night-time were between 22 and 39 W m-2 for the three evaluated models (Figure 4c). For cloudy sky conditions, the worse comparison during the
Figure 3. Comparisons between estimated (Rne) and observed (Rn) net radiation at 30 min interval (a, c, and e) and daily basis (b, d, and f) using Model 1, 2, and 3 for validation season. The solid line represents the 1:1 line.
347346 CHILEAN JOURNAL OF AGRICULTURAL RESEARCH 75(3) JULY-SEPTEMBER 2015CHILEAN JOURNAL OF AGRICULTURAL RESEARCH 75(3) JULY-SEPTEMBER 2015
Ortega-Farías et al. (2000)
Avignon (France), and Talca (Chile)
Grass at reference condition
Rn = (1-α)R↓+(εaσTa4 - εcvσTcv
4) 14 εa = 1.31(ea/Ta)1/7
α = 0.25
Berni et al. (2009)
Southern Spain Olive orchard Rn = (1-α)R↓+εsRl↓ - εsσTs
4 17 Rl↓ = [clf + (1 - clf) εa]σTa
4
εa in function of ea and Ta
Kjaersgaard et al. (2009)
Taastrup and Foulum (Denmark)Zaragoza and Córdoba (Spain)
Green grassGreen grass
Rn = (1-α)R↓+(Rl↓ - Rl
↓)Rn = (1-α)R↑+Rl
18 Rl = σ[(Tmax4 + Tmin
4)/2](0.34 - 0.14(ea)1/2[1.35(R↓/R↓
clear-sky) - 0.35]α = 0.25
Ortega-Farías et al. (2010)
Maule Region (Chile) Vineyard Rn = (1-α)R↓+(εaσTa4 - εsσTs
4) 19 Ts ≈ (fcTcv4 + (1 - fc)Tsoil
4)1/4
εa = 1.51(ea/Ta)1/7(R↓ > 0)εa = 1.91(ea/Ta)1/7(R↓ < 0)α = 0.19
Carrasco and Ortega-Farías (2008)
Maule Region (Chile) Vineyard Rn = (1-α)R↓+(εaσTa4 - εcvσTcv
4) 15 Tcv = Ts εa = 1.51(ea/Ta)1/7(R↓ > 0)εa = 1.91(ea/Ta)1/7(R↓ < 0)α = 0.18
Sentelhas and Gillespie (2008)
Ontario (Canada) Turfgrass Rn = 0.837(0.77R) – 0.0275[5.67x10⁻⁸(273 + Ta
4)] –37.716 α = 0.23
Average empirical coefficient obtained by Iziomon et al (2000) was used
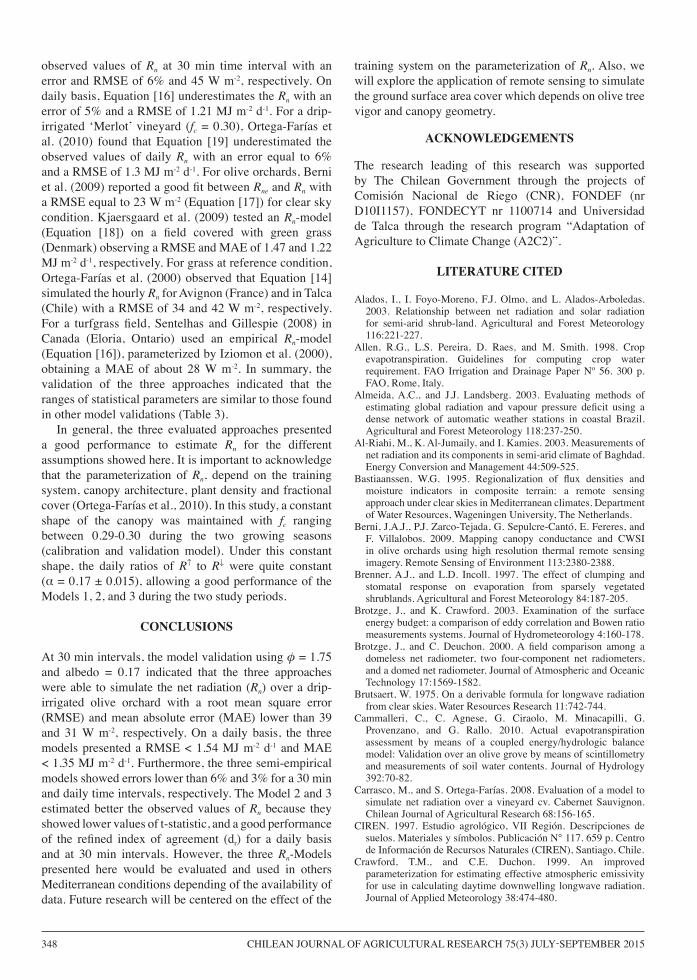
Table 3. Examples of several empirical and semi-empirical methods used to estimate the net radiation (Rn) for different type of vegetation.
Authors
clf: Cloud fraction term; fc: fractional cover; Ta, Ts, Tcv, and Tsoil: air, surface, canopy and soil temperatures; Tmax and Tmin: maximum and minimum air temperatures; α: albedo; σ: Stefan-Boltzmann constant; εa and εs: air and surface emissivity; ea is air vapor pressure; R↓ and Rl
↓: incoming short and long wave radiation; Rl↑:
outgoing long wave radiation; Rl: outgoing net long wave radiation; R↓clear-sky: clear-sky short wave radiation.
General equation usedLocation Vegetation Number
Suppositions and principal calculations
Figure 4. The best (a and c) and worse (b and d) comparison between observed (Rn) and estimated (Rne) values of net radiation for the Models 1, 2, and 3 under clear and cloudy days for validation season. The incoming short wave radiation (R↓) is included as a reference.
daytime was observed on DOY 16 where the maximum differences ranged between -103 and 102 W m-2 for the three models. During night-time, the Models 1, 2, and 3 presented maximum differences of 52, 51, and 77 W m-2, respectively (Figure 4d).
Results obtained in this research agree to those observed in the literature for grass, olive orchard, vineyards. For a drip-irrigated ‘Cabernet Sauvignon’ vineyard (fc = 0.30), Carrasco and Ortega-Farías (2008) indicated that Equation [15] (Table 3) underestimated the
349348 CHILEAN JOURNAL OF AGRICULTURAL RESEARCH 75(3) JULY-SEPTEMBER 2015CHILEAN JOURNAL OF AGRICULTURAL RESEARCH 75(3) JULY-SEPTEMBER 2015
observed values of Rn at 30 min time interval with an error and RMSE of 6% and 45 W m-2, respectively. On daily basis, Equation [16] underestimates the Rn with an error of 5% and a RMSE of 1.21 MJ m-2 d-1. For a drip-irrigated ‘Merlot’ vineyard (fc = 0.30), Ortega-Farías et al. (2010) found that Equation [19] underestimated the observed values of daily Rn with an error equal to 6% and a RMSE of 1.3 MJ m-2 d-1. For olive orchards, Berni et al. (2009) reported a good fit between Rne and Rn with a RMSE equal to 23 W m-2 (Equation [17]) for clear sky condition. Kjaersgaard et al. (2009) tested an Rn-model (Equation [18]) on a field covered with green grass (Denmark) observing a RMSE and MAE of 1.47 and 1.22 MJ m-2 d-1, respectively. For grass at reference condition, Ortega-Farías et al. (2000) observed that Equation [14] simulated the hourly Rn for Avignon (France) and in Talca (Chile) with a RMSE of 34 and 42 W m-2, respectively. For a turfgrass field, Sentelhas and Gillespie (2008) in Canada (Eloria, Ontario) used an empirical Rn-model (Equation [16]), parameterized by Iziomon et al. (2000), obtaining a MAE of about 28 W m-2. In summary, the validation of the three approaches indicated that the ranges of statistical parameters are similar to those found in other model validations (Table 3). In general, the three evaluated approaches presented a good performance to estimate Rn for the different assumptions showed here. It is important to acknowledge that the parameterization of Rn, depend on the training system, canopy architecture, plant density and fractional cover (Ortega-Farías et al., 2010). In this study, a constant shape of the canopy was maintained with fc ranging between 0.29-0.30 during the two growing seasons (calibration and validation model). Under this constant shape, the daily ratios of R↑ to R↓ were quite constant (α = 0.17 ± 0.015), allowing a good performance of the Models 1, 2, and 3 during the two study periods.
CONCLUSIONS
At 30 min intervals, the model validation using φ = 1.75 and albedo = 0.17 indicated that the three approaches were able to simulate the net radiation (Rn) over a drip-irrigated olive orchard with a root mean square error (RMSE) and mean absolute error (MAE) lower than 39 and 31 W m-2, respectively. On a daily basis, the three models presented a RMSE < 1.54 MJ m-2 d-1 and MAE < 1.35 MJ m-2 d-1. Furthermore, the three semi-empirical models showed errors lower than 6% and 3% for a 30 min and daily time intervals, respectively. The Model 2 and 3 estimated better the observed values of Rn because they showed lower values of t-statistic, and a good performance of the refined index of agreement (dr) for a daily basis and at 30 min intervals. However, the three Rn-Models presented here would be evaluated and used in others Mediterranean conditions depending of the availability of data. Future research will be centered on the effect of the
training system on the parameterization of Rn. Also, we will explore the application of remote sensing to simulate the ground surface area cover which depends on olive tree vigor and canopy geometry.
ACKNOWLEDGEMENTS
The research leading of this research was supported by The Chilean Government through the projects of Comisión Nacional de Riego (CNR), FONDEF (nr D10I1157), FONDECYT nr 1100714 and Universidad de Talca through the research program “Adaptation of Agriculture to Climate Change (A2C2)”.
LITERATURE CITED
Alados, I., I. Foyo-Moreno, F.J. Olmo, and L. Alados-Arboledas. 2003. Relationship between net radiation and solar radiation for semi-arid shrub-land. Agricultural and Forest Meteorology 116:221-227.
Allen, R.G., L.S. Pereira, D. Raes, and M. Smith. 1998. Crop evapotranspiration. Guidelines for computing crop water requirement. FAO Irrigation and Drainage Paper Nº 56. 300 p. FAO, Rome, Italy.
Almeida, A.C., and J.J. Landsberg. 2003. Evaluating methods of estimating global radiation and vapour pressure deficit using a dense network of automatic weather stations in coastal Brazil. Agricultural and Forest Meteorology 118:237-250.
Al-Riahi, M., K. Al-Jumaily, and I. Kamies. 2003. Measurements of net radiation and its components in semi-arid climate of Baghdad. Energy Conversion and Management 44:509-525.
Bastiaanssen, W.G. 1995. Regionalization of flux densities and moisture indicators in composite terrain: a remote sensing approach under clear skies in Mediterranean climates. Department of Water Resources, Wageningen University, The Netherlands.
Berni, J.A.J., P.J. Zarco-Tejada, G. Sepulcre-Cantó, E. Fereres, and F. Villalobos. 2009. Mapping canopy conductance and CWSI in olive orchards using high resolution thermal remote sensing imagery. Remote Sensing of Environment 113:2380-2388.
Brenner, A.J., and L.D. Incoll. 1997. The effect of clumping and stomatal response on evaporation from sparsely vegetated shrublands. Agricultural and Forest Meteorology 84:187-205.
Brotzge, J., and K. Crawford. 2003. Examination of the surface energy budget: a comparison of eddy correlation and Bowen ratio measurements systems. Journal of Hydrometeorology 4:160-178.
Brotzge, J., and C. Deuchon. 2000. A field comparison among a domeless net radiometer, two four-component net radiometers, and a domed net radiometer. Journal of Atmospheric and Oceanic Technology 17:1569-1582.
Brutsaert, W. 1975. On a derivable formula for longwave radiation from clear skies. Water Resources Research 11:742-744.
Cammalleri, C., C. Agnese, G. Ciraolo, M. Minacapilli, G. Provenzano, and G. Rallo. 2010. Actual evapotranspiration assessment by means of a coupled energy/hydrologic balance model: Validation over an olive grove by means of scintillometry and measurements of soil water contents. Journal of Hydrology 392:70-82.
Carrasco, M., and S. Ortega-Farías. 2008. Evaluation of a model to simulate net radiation over a vineyard cv. Cabernet Sauvignon. Chilean Journal of Agricultural Research 68:156-165.
CIREN. 1997. Estudio agrológico, VII Región. Descripciones de suelos. Materiales y símbolos. Publicación N° 117. 659 p. Centro de Información de Recursos Naturales (CIREN), Santiago, Chile.
Crawford, T.M., and C.E. Duchon. 1999. An improved parameterization for estimating effective atmospheric emissivity for use in calculating daytime downwelling longwave radiation. Journal of Applied Meteorology 38:474-480.
349348 CHILEAN JOURNAL OF AGRICULTURAL RESEARCH 75(3) JULY-SEPTEMBER 2015CHILEAN JOURNAL OF AGRICULTURAL RESEARCH 75(3) JULY-SEPTEMBER 2015
Culf, A.D., and J.H.C. Gash. 1993. Longwave radiation from clear skies in Niger: a comparison of observations with simple formulas. Journal of Applied Meteorology 32:539-547.
Er-Raki, S., A. Chehbouni, J. Hoedjes, J. Ezzahar, B. Duchemin, and F. Jacob. 2008. Improvement of FAO-56 method for olive orchards through sequential assimilation of thermal infrared-based estimates of ET. Agricultural Water Management 95:309-321.
Ezzahar, J., A. Chehbouni, J.C.B. Hoedjes, S. Er-Raki, A.H. Chebouni, G. Boulet, et al. 2007. The use of the scintillation technique for monitoring seasonal water consumption of olive orchards in a semi-arid region. Agricultural Water Management 89:173-184.
Gómez-del-Campo, M., A. Leal García, and C. Pezuela Espliego. 2008. Relationship of stem water potential and leaf conductance to vegetative growth of young olive trees in a hedgerow orchard. Australian Journal of Experimental Agriculture 59:270-279.
Irmak, S., D. Mutiibwa, and O. Payero. 2010. Net radiation dynamics: Performance of 20 daily net radiation models as related to model structure and intricacy in two climates. Transactions of the ASABE 53:1059-1076.
Iziomon, M.G., H. Mayer, and A. Matzarakis. 2000. Empirical models for estimating net radiation flux: a case study for three mid-latitude sites with orographic variability. Astrophysics and Space Science 273:313-330.
Kjaersgaard, J.H., R.H. Cuenca, A. Martínez-Cob, P. Gavilán, F. Plauborg, M. Mollerup, et al. 2009. Comparison of the performance of net radiation calculations models. Theoretical and Applied Climatology 98:57-66.
Kustas, W.P., R.T. Pinker, T.J. Schmugger, and K.S. Humes. 1994. Net radiation estimated for semiarid rangeland basin sensed date. Agricultural and Forest Meteorology 71:337-357.
Mayer, D.G., and D.G. Butler. 1993. Statistical validation. Ecological Modelling 68:21-31.
Morales, S.L. 1997. Evaluación y zonificación de riesgo de heladas mediante modelización topoclimática. 143 p. Tesis Doctoral Ciencias Ambientales. Universidad de Concepción, Concepción, Chile.
Moriana, A., D. Pérez-López, A. Gómez-Rico, M.D. Salvador, N. Olmedilla, F. Ribas, et al. 2007. Irrigation scheduling for traditional, low-density olive orchards: Water relations and influence on oil characteristics. Agricultural Water Management 87:171-179.
Morillas, L., M. García, H. Nieto, L. Villagarcia, I. Sandholt, M.P. Gonzalez-Dugo, et al. 2013. Using radiometric surface temperature for surface energy flux estimation in Mediterranean drylands from a two-source perspective. Remote Sensing of Environment 136:234-246.
Ortega-Farías, S., R. Antonioletti, and A. Olioso. 2000. Net radiation model evaluation at an hourly time step for Mediterranean conditions. Agronomie 20:157-164.
Ortega-Farías, S., and R. López-Olivari. 2012. Validation of a two-layer model to estimate latent heat flux and evapotranspiration in a drip-irrigated olive orchard. Transactions of the ASABE 55:1169-1178.
Ortega-Farías, S., C. Poblete-Echeverria, and N. Brisson. 2010. Parameterization of a two-layer model for estimating vineyard evapotranspiration using meteorological measurements. Agricultural Water Management 150:276-286.
Pereira, A.P., S. Green, and N.A. Villa Nova. 2007. Relationships between single tree canopy and grass net radiations. Agricultural and Forest Meteorology 142:45-49.
Prata, A.J. 1996. A new long-wave formula for estimating downward clear-sky radiation at the surface. Quarterly Journal of the Royal Meteorological Society 122:1127-1151.
Samani, Z., A.S. Bawazir, M. Bleiweiss, R. Skaggs, and V.D. Tran. 2007. Estimating daily net radiation over vegetation canopy through remote sensing and climatic data. Journal of Irrigation and Drainage Engineering 133(4):291-297.
Sentelhas, P.C., and T.J. Gillespie. 2008. Estimating hourly net radiation for leaf wetness duration using the Penman-Monteith equation. Theoretical and Applied Climatology 91:205-215.
Shuttleworth, W.J., and J.S. Wallace. 1985. Evaporation from sparse crops-an energy combination theory. Quarterly Journal of the Royal Meteorological Society 111:839-855.
Sicart, J.E., R. Hock, P. Ribstein, and J.P. Chazarin. 2010. Sky long-wave radiation on tropical Andean glaciers: Parameterization and sensitivity to atmospheric variables. Journal of Glaciology 56(199):854-860.
Sridhar, V., and R.L. Elliott. 2002. On the development of a simple downwelling longwave radiation scheme. Agricultural and Forest Meteorology 112:237-243.
Stone, R.J. 1993. Improved statistical procedure for the evaluation of solar radiation estimation models. Solar Energy 51(4):289-291.
Sugita, M., and W. Brutsaert. 1993. Cloud effect in the estimation of instantaneous downward longwave radiation. Water Resources Research 29:599-605.
Testi, L., F.J. Villalobos, F. Orgaz, and E. Fereres. 2006. Water requirements of olive orchards: I simulation of daily evapotranspiration for scenario analysis. Irrigation Science 24:69-76.
Willmott, C.J., S.M. Robeson, and K. Matsuura. 2012. A refined index of model performance. International Journal of Climatology 32(13):2088-2094.
Related Documents