Project n0 Evaluation of the Water4Virungas project In DRC, Rwanda and Uganda (2017-2021)

Welcome message from author
This document is posted to help you gain knowledge. Please leave a comment to let me know what you think about it! Share it to your friends and learn new things together.
Transcript

Project n0
Evaluation of the Water4Virungas project In DRC, Rwanda and Uganda (2017-2021)

1
Evaluation of the
Water4Virungas project
In DRC, Rwanda and Uganda (2017-2021)
Realised by
Aidenvironment (the Netherlands and Uganda) and Vision Verte (DRC)
Commissioned by
Embassy of the Kingdom of the Netherlands (Kigali, Rwanda)
Final version, June 2022
Project number 4042 Aidenvironment
Barentszplein 7
1013 NJ Amsterdam
The Netherlands
+ 31 (0)20 686 81 11
www.aidenvironment.org
Aidenvironment is registered at the Chamber of
Commerce of Amsterdam in the Netherlands,
number 41208024

2
Table of contents
List of figures ............................................................................................................ 6
List of tables ............................................................................................................. 7
Abbreviations ........................................................................................................... 9
1. Executive summaries ..................................................................................... 11
1.1. English executive summary ................................................................................... 11
1.1.1. Project development .................................................................................. 11
1.1.2. Methodology .............................................................................................. 12
1.1.3. Achievements ............................................................................................. 12
1.1.4. Assessment of the project .......................................................................... 16
1.1.5. Conclusions ................................................................................................. 18
1.1.6. Recommendations / lessons learnt ............................................................ 18
1.2. Résumé français ................................................................................................... 19
1.2.1. Élaboration du projet ................................................................................. 19
1.2.2. Méthodologie ............................................................................................. 20
1.2.3. Résultats ..................................................................................................... 20
1.2.4. Évaluation du projet ................................................................................... 24
1.2.5. Conclusions ................................................................................................. 26
1.2.6. Recommandations / leçons apprises .......................................................... 27
2. Introduction .................................................................................................. 28
2.1. Objective and intervention area ........................................................................... 28
2.2. Changes in the project .......................................................................................... 29
2.3. Collaboration with GVTC ...................................................................................... 36
3. Methodology ................................................................................................ 38
3.1. Phases ................................................................................................................. 38
3.2. OECD DAC criteria ................................................................................................ 38
3.3. Mixed-method approach ...................................................................................... 39
3.3.1. Document review ....................................................................................... 39
3.3.2. Key informant interviews ........................................................................... 39
3.3.3. Focus group discussions ............................................................................. 39
3.3.4. Household questionnaires .......................................................................... 40
3.3.5. Infrastructure observations ........................................................................ 40
3.3.6. Sampling ..................................................................................................... 40
3.3.7. Data analysis and references ...................................................................... 41
3.3.8. Challenges of the fieldwork ........................................................................ 41
3.4. Evaluation team ................................................................................................... 42
4. Summary of project achievements ................................................................. 43
4.1. Introduction ......................................................................................................... 43
4.2. Three countries .................................................................................................... 44

3
4.2.1. Outcome 1: WASH and IWRM .................................................................... 46
4.2.2. Outcome 2: Water management and governance ..................................... 48
4.2.3. Outcome 3: Improved relations ................................................................. 50
4.3. DRC...................................................................................................................... 51
4.3.1. Outcome 1: WASH and IWRM .................................................................... 53
4.3.2. Outcome 2: Water management and governance ..................................... 60
4.3.3. Outcome 3: Improved relations ................................................................. 64
4.4. Rwanda ............................................................................................................... 67
4.4.1. Outcome 1: WASH and IWRM .................................................................... 69
4.4.2. Outcome 2: Water management and governance ..................................... 74
4.4.3. Outcome 3: Improved relations ................................................................. 77
4.5. Uganda ................................................................................................................ 79
4.5.1. Outcome 1: WASH and IWRM .................................................................... 83
4.5.2. Outcome 2: Water management and governance ..................................... 85
4.5.3. Outcome 3: Improved relations ................................................................. 89
5. Assessment of the project .............................................................................. 92
5.1. Relevance ............................................................................................................ 92
5.1.1. Stakeholder assessment ............................................................................. 92
5.1.2. Needs and priorities ................................................................................... 93
5.1.3. Underlying issues ........................................................................................ 94
5.1.4. Changing context ........................................................................................ 98
5.1.5. Relevance of intervention design ............................................................... 98
5.1.6. Increasing relevance ................................................................................... 99
5.1.7. Matched needs ........................................................................................... 99
5.2. Coherence ............................................................................................................ 99
5.2.1. Coherence of objectives ............................................................................. 99
5.2.2. Relation to Great Lakes projects .............................................................. 101
5.2.3. Policy environment ................................................................................... 101
5.2.4. Relation to other projects ........................................................................ 102
5.2.5. Relation to other conflict transformation or peace building initiatives .. 103
5.2.6. Opportunities for improvement ............................................................... 103
5.3. Effectiveness ...................................................................................................... 104
5.3.1. Outcomes and outputs ............................................................................. 104
5.3.2. Adequacy of the project logic ................................................................... 106
5.3.3. Adequate risk management ..................................................................... 107
5.3.4. Local acceptance....................................................................................... 107
5.3.5. Infrastructural quality ............................................................................... 108
5.3.6. MSP achievements ................................................................................... 109
5.3.7. Participatory design .................................................................................. 111
5.4. Efficiency ........................................................................................................... 112
5.4.1. Costs ......................................................................................................... 112
5.4.2. Comparison with other approaches ......................................................... 112
5.4.3. Timeliness ................................................................................................. 113

4
5.4.4. Efficiency of external expertise ................................................................ 115
5.4.5. Ideas for improvement ............................................................................. 116
5.5. Impact ............................................................................................................... 118
5.5.1. Attributable changes ................................................................................ 118
5.5.2. Unintended effects positive and negative ............................................... 121
5.5.3. Ideas on improvement ............................................................................. 122
5.5.4. Validity of ToC ........................................................................................... 124
5.6. Sustainability ..................................................................................................... 128
5.6.1. Ownership ................................................................................................ 128
5.6.2. Participation ............................................................................................. 130
5.6.3. Transfer of knowledge .............................................................................. 132
5.6.4. Operation and maintenance water supply ............................................... 134
5.6.5. Knowledge of IWRM ................................................................................. 135
5.6.6. Conflict transformation ............................................................................ 136
5.6.7. Key blockages ........................................................................................... 138
5.6.8. Stabilizing effect ....................................................................................... 138
5.6.9. Health issues ............................................................................................. 139
5.6.10. Legal issues ............................................................................................... 140
6. Conclusions ................................................................................................. 141
6.1. Project achievements ......................................................................................... 141
6.1.1. Outcome 1: WASH and IWRM .................................................................. 141
6.1.2. Outcome 2: Water management and governance ................................... 141
6.1.3. Outcome 3: Improved relations ............................................................... 141
6.2. Assessment of the project .................................................................................. 141
6.2.1. Relevance .................................................................................................. 141
6.2.2. Coherence ................................................................................................. 142
6.2.3. Effectiveness ............................................................................................. 142
6.2.4. Efficiency ................................................................................................... 142
6.2.5. Impact ....................................................................................................... 143
6.2.6. Sustainability ............................................................................................ 143
7. Recommendations / lessons learnt .............................................................. 144
7.1. Recommendations for the consortium implementing the project ........................ 144
7.2. Recommendations for the GLRP ......................................................................... 146
7.3. Recommendations for park authorities, LGs ........................................................ 147
8. References .................................................................................................. 148
9. Annexes ...................................................................................................... 149
9.1. Overview of available reports for external evaluation ......................................... 149
9.2. Overview key informant interviews .................................................................... 151
9.3. Overview of FGD ................................................................................................ 152
9.4. Overview of household questionnaires ............................................................... 152

5
9.5. Overview of observed infrastructure .................................................................. 153
9.6. Overview of village visits .................................................................................... 153
9.7. Evaluation team ................................................................................................. 155

List of figures
Figure 1. Final W4V log frame (source: Changes in the W4V project document) ......... 29
Figure 2. W4V intervention area and interventions ....................................................... 29
Figure 3. Intervention villages visited during the evaluation. ........................................ 41
Figure 4. PIs presenting their goal for their farm (DRC) ................................................. 54
Figure 5. Left: RWHT (DRC). Right: tap stand (DRC) ....................................................... 57
Figure 6. Erosion control measures (DRC) ...................................................................... 58
Figure 7. Livestock trough (DRC) .................................................................................... 59
Figure 8. Left: Alnus trees planted along drainage channel (Kamiro village, Nyabihu district, Rwanda). Right: Close up ................................................................................... 72
Figure 9. Stone wall reinforced with mortar (Uganda) .................................................. 91
Figure 10. RWHTs (Rwanda) ........................................................................................... 97
Figure 11. Original ToC ................................................................................................. 126
Figure 12. Original logframe ......................................................................................... 127
Figure 13. Final logframe .............................................................................................. 128

7
List of tables
Table 1. Population and surface of intervention area .................................................... 29
Table 2. Comparison W4V original and final M&E framework ...................................... 33
Table 3. Comparison of results between W4V Progress Reports V10 and V11 ............. 43
Table 4. Targets and results of indicators and activities directly contributing to goal, for 3 countries together ....................................................................................................... 45
Table 5. Targets and results of indicators and activities contributing to outcome 1, for 3 countries together .......................................................................................................... 46
Table 6. Targets and results of indicators and activities contributing to outcome 1, for 3 countries together - continued ...................................................................................... 47
Table 7. Targets and results of indicators and activities contributing to outcome 2, for 3 countries together .......................................................................................................... 48
Table 8. Targets and results of indicators and activities contributing to outcome 2, for 3 countries together - continued ...................................................................................... 49
Table 9. Targets and results of indicators and activities contributing to outcome 3, for 3 countries together .......................................................................................................... 50
Table 10. Targets and results of indicators and activities directly contributing to goal, for DRC ............................................................................................................................ 52
Table 11. Targets and results of indicators and activities contributing to outcome 1, for DRC ................................................................................................................................. 53
Table 12. Targets and results of indicators and activities contributing to outcome 1, for DRC - continued .............................................................................................................. 55
Table 13. Targets and results of indicators and activities contributing to outcome 2, for DRC ................................................................................................................................. 60
Table 14. Targets and results of indicators and activities contributing to outcome 2, for DRC - continued .............................................................................................................. 61
Table 15. Targets and results of indicators and activities contributing to outcome 3, for DRC ................................................................................................................................. 64
Table 16. Number of conflicts transformed, based on W4V e-mail March 2022 .......... 65
Table 17. Targets and results of indicators and activities directly contributing to goal, for Rwanda ..................................................................................................................... 68
Table 18. Targets and results of indicators and activities contributing to outcome 1, for Rwanda ........................................................................................................................... 69
Table 19. Targets and results of indicators and activities contributing to outcome 1, for Rwanda - continued ........................................................................................................ 70
Table 20. Targets and results of indicators and activities contributing to outcome 2, for Rwanda ........................................................................................................................... 74
Table 21. Targets and results of indicators and activities contributing to outcome 2, for Rwanda - continued ........................................................................................................ 75
Table 22. Targets and results of indicators and activities contributing to outcome 3, for Rwanda ........................................................................................................................... 77
Table 23. Targets and results of indicators and activities directly contributing to goal, for Uganda ...................................................................................................................... 80
Table 24. Targets and results of indicators and activities contributing to outcome 1, for Uganda ............................................................................................................................ 81

8
Table 25. Targets and results of indicators and activities contributing to outcome 1, for Uganda - continued ....................................................................................................... 82
Table 26. Targets and results of indicators and activities contributing to outcome 2, for Uganda ............................................................................................................................ 85
Table 27. Targets and results of indicators and activities contributing to outcome 2, for Uganda - continued ........................................................................................................ 86
Table 28. Targets and results of indicators and activities contributing to outcome 3, for Uganda ............................................................................................................................ 89
Table 29. Use of muzzles .............................................................................................. 138

9
Abbreviations
Acronym Meaning
ASUREP Association des Usagers d’Eau Potable (Association of Drinking Water Users)
CBO Community Based Organisation
CCD Conservation and Development Committee
CDF Congolese Franc
CPD Cellule de Paix et de Développement
CLPD Comité Local de Paix et de Développement
D2B Develop 2 Build
DRC Democratic Republic of Congo
EKN Embassy of the Kingdom of the Netherlands
FARM Food security and inclusive Access to Resources for conflict-sensitive Market development
FGD Focus Group Discussion
GALS Gender Action Learning System
GLRP Great Lakes Regional Programme
GVTC Greater Virunga Transboundary Collaboration
Hinga Weze Feed the Future Hinga Weze
HWC Human Wildlife Conflict
ICCN Institut Congolais pour la Conservation de la Nature
IGCP International Gorilla Conservation Program
IWRM Integrated Water Resource Management
KII Key Informant Interview
KVWSE Kisoro Virunga Water Supply Extension
LG Local Government
MC Mercy Corps
MCCDA Mgahinga Community Conservation Development Association
MDF Management for Development Foundation
MoU Memorandum of Understanding
M&E Monitoring and evaluation
NPD Noyaux de Paix et de Développement
NWSC National Water and Sewerage Corporation (Uganda)
OECD DAC
Organisation for Economic Co-operation and Development - Development Assistance
Committee
O&M Operation and Maintenance
PIP Plan Intégré du Paysan (Integrated Farmer Plan)
PMP Plateforme/Partenariat Multi Partites (MSP / Multi Stakeholder Platform)
PSP Public Stand Point
PWCC Parish Water and conservation Committee
PWMC Parish Water Management Committee / Parish Water User Committee
RAB Rwanda Agriculture Board

10
RDB Rwanda Development Board
RDC République Démocratique du Congo
RMPR Rwanda Monthly Progress Report
RWF Rwandan Franc
RWHT Rainwater Harvesting Tank
ToC Theory of Change
UGX Ugandan Shilling
UMPR Uganda Monthly Progress Report
UWA Uganda Wildlife Authority
VSLA Village Savings and Loans Association
W4V Water4Virungas
WASAC Water and Sanitation Corporation (Rwanda)
WASH Water Sanitation Hygiene
WMC
Water Management Committee (in Uganda: a parish level committee of representatives of
RWHT level WUCs)
WSP Water Service Provider
WUC Water User Committee
WUR Wageningen University & Research

11
1. Executive summaries
1.1. English executive summary
1.1.1. Project development Water4Virungas (W4V) was established as a project in December 2016, funded by the
Embassy of the Kingdom of the Netherlands (EKN) in Kigali (Rwanda) and coordinated
by MDF Global in collaboration with Stichting Wageningen University & Research (WUR,
represented by Wageningen Environmental Research and Wageningen Centre for
Development Innovation), Witteveen+Bos and the International Gorilla Conservation
Program (IGCP). The goal of the project was to reduce conflicts through increased access
to water and improved watershed management in the Virunga Area.
W4V saw several defining moments during which the approach, methods and M&E
framework outcomes changed, caused by external and internal factors. The M&E
framework of the project was adjusted based after a peer monitoring process between
three projects on the water / food security interface (W4V, FARM and Mayi Ya Amani)
in 2017 / 2018, facilitated by Transition International. Discussion and adaptation of the
M&E framework / logframe took place and resulted in more focus on conflict in general,
but also in some delay in implementation. Internal changes included the shift from the
central organisation of the project to a national management led by project officers
based in each of the three countries, the introduction of the PIP approach to cover the
IWRM component of the project and the reduction of the involvement of Dutch experts.
An IWRM approach was planned to be integrated, and indeed elements of IWRM have
been implemented as part of the PIP approach, but this was not based on IWRM plans
considering the whole (sub-) catchments. IWRM plans were meant to be developed, but
that has not been feasible within the project period. The PIP approach has brought many
good things, but as it is focused on farmer level, it is not sufficient for an approach at
catchment level, which needs the involvement of stakeholders at a larger scale (e.g., LG,
landowners). However, many sessions were hold with local staff in all three countries to
disseminate the principles and methodologies of IWRM.
The project was to be implemented with the role for GVTC to facilitate meetings on
transboundary water issues between relevant stakeholders. When the funding for GVTC
by EKN ended, the active role of GVTC was over. Moreover, the role of GVTC has not
always been clear to the people involved in W4V.

12
1.1.2. Methodology
The evaluation followed four phases. An inception phase, a preparation and data
collection phase, a data analysis phase and then a validation and reporting phase. The
objective of the evaluation was to review the W4V project according to the OECD DAC
criteria of relevance, coherence, effectiveness, efficiency, impact, and sustainability. To
do so, the evaluators used a mixed-method approach with an emphasis on qualitative
data analysis. As requested by the client, the evaluation sought to analyse detailed
experiences of the project beneficiaries to understand the long-term impact and
sustainability of the project. The qualitative methods applied were document reviews,
focus group discussions (FGD), key informant interviews (KII) and infrastructure
observations. The more quantitative methods applied entailed household
questionnaires. The evaluation respects the anonymity of the respondents.
1.1.3. Achievements
General
Outcome 1: WASH and IWRM Water supply has improved to a large extent, as well as the handover of water schemes.
The PIP approach has produced good results (e.g., in measures against soil erosion),
although not at the scale that was targeted. Regarding the measures to counter erosion,
the reporting is somewhat spread out:
• In Résultats obtenus comparés aux prévisions V2.pdf, 624 ha in DRC + 7,1 ha in Uganda and 2 villages (under the indicator Landscape planning: Restoration of farming land) are mentioned, while
• In W4V ME Progress Report_V11 November 2021.xlsx, no results are mentioned at indicators 1 e (Number of hectares of agricultural of farmland converted to sustainable use) or 1.2b (Number of hectares rehabilitated by the community as a result of adoption of best practices demonstrated), and
• In W4V ME Progress Report_V11 November 2021.xlsx, a result of 11,4 ha in Rwanda (under the activity Farming land converted to sustainable use) is mentioned (under the indicator % change in average agricultural production at household level) and 2 villages.
Outcome 2: Water management and governance Regarding water management, the results are more mixed: community members have
more trust in LG and are satisfied with water provision. The indicators focusing more on
the long-term results / sustainability, like the facilitation of stakeholders to legalize
WUCs, and support LG in development of action, operational and financial plans, were
not reached.
Outcome 3: Improved relations Less attention has been paid to monitoring of outcome 3, as compared to outcomes 1
and 2. On output level, the PMP approach seems promising.

13
DRC
Outcome 1: WASH and IWRM The water access has improved both for domestic and livestock purposes. 3565
households now have better access to water. The percentage of households that have
at least 20 liters of safe water per day has grown from 43,3% (baseline) to 94,6%
(internal evaluation). Community and household RWHTs were built for villages located
on the hills and a 23 km long gravity flow connection between the uphill and downhill
populations was created to improve the distribution of the water. The tanks are still in
good state, and no repair cases were reported.
The distance and the time required to fetch water has therefore decreased. Still, during
the dry season, RWHTs are empty in the villages on the hills (e.g., in Kisigari), and people
need to walk towards the standpipes further away (but not anymore into the park,
according to the park authorities).
W4V has also rehabilitated 53 rainwater harvesting systems, each with a 5m³ tank.
Rainwater is used for domestic purposes, and some households also use it for drinking
(after boiling).
Runoff control techniques introduced with the PIP approach have proven successful and
the project beneficiaries report only a mild erosion on their farm. 17 villages and 624 ha
(as mentioned in Résultats obtenus comparés aux prévisions V2.pdf) were covered. Crop
production has increased.
Outcome 2: Water management and governance One WMC was introduced per RWHTs or tap stand. Their responsibilities included, but
were not limited to, operation and maintenance responsibilities and the collection of
fees from the water infrastructure users. A significant increase in attendance to LG
meetings by WMCs has been noted, and the other way around (LG attending WMC
conflict mediation meetings). The indicators focusing more on the long term results /
sustainability, like the facilitation of stakeholders to legalize WUCs and support LG in
action, operational and financial plans, were not reached. The satisfaction of the
communities regarding the water services provided by the LG remains low. First steps
towards the development of IWRM plans have been set.
Outcome 3: Improved relations W4V successfully implemented the PMP approach, primarily in Kibumba, Jomba and
Kisigari groupements. Many conflicts (water related, crop related, and plot boundary
related) were transformed. In addition, W4V fostered discussion between communities
and the park authorities, leading to the implementation of the already existing
agreement to let communities enter the park on a weekly basis, and a decrease in illegal
park entrances was noted. Furthermore, the implementation of the electric fence also

14
reduced the human-wildlife conflicts. GVTC and its centre of excellence were involved
at the start of W4V and seem to continue to operate their mediation work.
Rwanda
Outcome 1: WASH and IWRM Water access has increased through the construction of 575 RWHTs in the four districts
of interventions. 2800 households now have better access to water. The percentage of
households that have at least 20 liters of safe water per day has grown from 63,3%
(baseline) to 91,6% (internal evaluation). One of the results was the decrease of people
entering the park for water. Currently almost all the beneficiaries walk less than 30
minutes to collect water for domestic and livestock purposes. During the rainy season,
people prefer other water sources like the piped water from WASAC. RWHTs were
primarily meant to reduce runoff; domestic use (washing clothes, cooking) was a
secondary benefit, like drinking (in the dry season). The PIP approach has made people
aware of measures against erosion. 11,4 ha of farming land have been converted to
sustainable use; this represents 0,06% of surface of the total Rwandan intervention area.
Many (440.831) trees and stabilizing grasses have been planted here, but as far as can
be overseen, trees were majorly planted in already sustainably managed areas, i.e., in
Cyanika sector, bamboos were planted along roadside culvert outlets. Fruit trees were
planted on already well managed farmlands under agroforestry. In Nyabihu, some trees
were planted to stabilise drainage channels that had been constructed. Other trees were
planted in the buffer zone along the park (so, not a farmland area). So, tree planting
seems to have reinforced already quite sustainable land management, and not so much
changed unsustainably into sustainably managed lands.
Outcome 2: Water management and governance Like in the DRC, the W4V team introduced WMCs with the implementation of RWHTs.
In addition, a significant increase in LG meeting attendance has been noted: LG
representatives and WMCs attend now more each other’s meetings. Yet, the satisfaction
of the communities regarding the water services provided by the LG remains low. Other
indicators focusing more on the long term results / sustainability, like support of LG in
action, operational and financial plans, were not reached. IWRM elements have been
implemented, but no IWRM plans have been developed.
Outcome 3: Improved relations Conflicts with the park authorities decreased because the number of illegal entrances in
the park also decreased due to the availability of water resources. The maintenance of
the stone wall and the trench (in which community cooperatives participated) has
decreased the number of human-wildlife conflicts, but tensions still exist because crop
raiding is still taking place, as about 1 km of the border is not fenced. Several MoUs were
15
signed between W4V and relevant stakeholders to create an enabling environment for
the continuation of the project.
Uganda
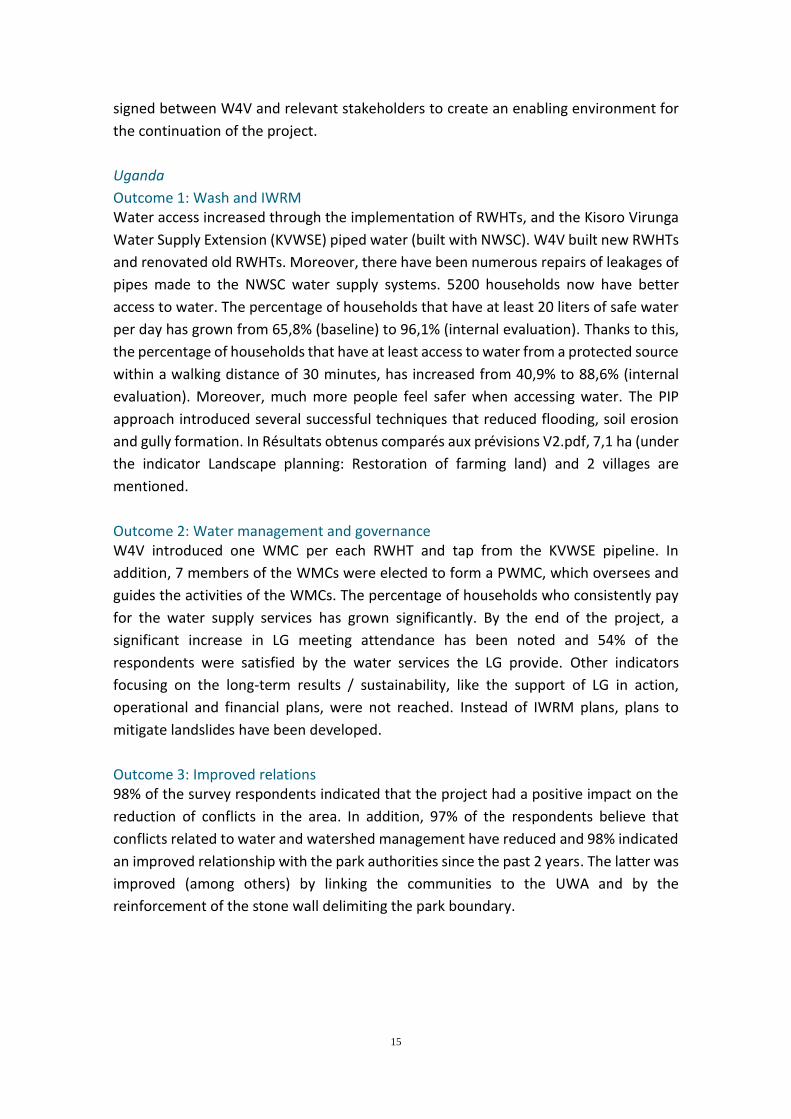
Outcome 1: Wash and IWRM Water access increased through the implementation of RWHTs, and the Kisoro Virunga
Water Supply Extension (KVWSE) piped water (built with NWSC). W4V built new RWHTs
and renovated old RWHTs. Moreover, there have been numerous repairs of leakages of
pipes made to the NWSC water supply systems. 5200 households now have better
access to water. The percentage of households that have at least 20 liters of safe water
per day has grown from 65,8% (baseline) to 96,1% (internal evaluation). Thanks to this,
the percentage of households that have at least access to water from a protected source
within a walking distance of 30 minutes, has increased from 40,9% to 88,6% (internal
evaluation). Moreover, much more people feel safer when accessing water. The PIP
approach introduced several successful techniques that reduced flooding, soil erosion
and gully formation. In Résultats obtenus comparés aux prévisions V2.pdf, 7,1 ha (under
the indicator Landscape planning: Restoration of farming land) and 2 villages are
mentioned.
Outcome 2: Water management and governance W4V introduced one WMC per each RWHT and tap from the KVWSE pipeline. In
addition, 7 members of the WMCs were elected to form a PWMC, which oversees and
guides the activities of the WMCs. The percentage of households who consistently pay
for the water supply services has grown significantly. By the end of the project, a
significant increase in LG meeting attendance has been noted and 54% of the
respondents were satisfied by the water services the LG provide. Other indicators
focusing on the long-term results / sustainability, like the support of LG in action,
operational and financial plans, were not reached. Instead of IWRM plans, plans to
mitigate landslides have been developed.
Outcome 3: Improved relations 98% of the survey respondents indicated that the project had a positive impact on the
reduction of conflicts in the area. In addition, 97% of the respondents believe that
conflicts related to water and watershed management have reduced and 98% indicated
an improved relationship with the park authorities since the past 2 years. The latter was
improved (among others) by linking the communities to the UWA and by the
reinforcement of the stone wall delimiting the park boundary.

16
1.1.4. Assessment of the project
Relevance W4V was highly relevant to the region and its communities. The project’s goal and
objectives were in line with the needs and priorities of most stakeholders and the final
beneficiaries of the project. Several activities were developed to provide both tangible
(e.g., the construction of the electrical fence, the introduction of RWHTs, the
reinforcement of the stonewall) and intangible (e.g., setting up PMPs, linking the
communities with the governments and park authorities) outcomes that would solve
the underlying issues in the region. The decisions on the siting of the RWHTs (and their
soak away pits) were not everywhere the best to address the underlying issues. The PIP
approach allowed to tackle several needs of the different target groups.
The goals of the embassy were not fulfilled completely but some of the stakeholders as
well as the evaluating team found these too ambitious for both the time and the area of
intervention.
Coherence W4V sought coherence both with the GLRP (Great Lakes Regional Programme) and
projects (e.g., FARM, Maji ya Amani, Hinga Weze) taking place in the area. The project
was in line with the Maji ya Amani and FARM projects, both in their approach (linking
governments and communities) and in their goals (regional stability and increased water
access). This did not mean that these programs collaborated. Particularly collaboration
with the FARM project did not materialize as planned. In addition, in all three countries,
W4V strove to work hand in hand with the local and park authorities and to develop
activities that fitted their policies and development plans targeting the project area. The
evaluators found that within the project team there were different ideas on the use of
fences and walls and the implementation of RWHT for floodwater reduction also
showed incoherence in some cases. It would have been good if the project could have
contributed to the full fencing / walling of the parks, in order not to displace problems.
Effectiveness The project delivered the outcomes effectively and beyond what could have been
expected under the conditions in the different countries. The changes in the approach
reduced the effectiveness. The peer monitoring organized by the Dutch Embassy and
facilitated by Transition International improved the project’s logic and the link between
the outcomes and outputs. This helped to reformulate the M&E framework so that W4V
focussed on conflict but within the limits of water management and relations between
the park and the people. In chapter 5 (section 5.3)we describe how the reformulation
challenged the effectiveness, for time reasons but also for the team to internalize and
achieve ownership over the new Theory of Change.

17
On a more practical level, the use of RWHTs as a runoff control measure can be disputed
because of the relatively small amount of water that can be stored within the tanks
compared to the average rainfall, and the siting of the soak pits not around the tanks.
The quality of the infrastructures was generally good although some RWHTs in Bugeshi
(Rwanda) were reported to be fragile (design adapted afterward), bursting of the KVWSE
pipes (Uganda) has already been noted. One reason for breakdown and leakage of the
KVWSE system was given (by the NWSC general manager) was vandalism by community
members, as e.g., nuts and screws can be sold for some quick cash, or because of jealous
neighbouring village members that did not benefit from the project. Another reason for
the breakdown of the pipes may be found in e.g., Mwanjali village, where the tap stands
had never been functional from the time they had been installed, so here, construction
may not have been done properly.
The percentages of people that consistently pay for their water, in general has
increased. The results of the PIP approach have convinced others to get trained, and the
LGs to work with the PIs. PMPs have contributed significantly to conflict resolution
(different types of conflicts).
Efficiency In terms of budgeting the project provided value for money, particularly given the
difficult context in which it operates and the over-achievement on the outputs (conflict,
covid etc). Several complaints on the lack of communication and transparency regarding
the budget have been noted. While W4V relied heavily on international expertise at the
first years of the project, during later years there was a more efficient bottom-up
approach through the PIP. Delays were caused by both internal and external factors. The
availability (due to insecurity, Covid-19) and, partly linked to that, the added value of
international expertise were judged differently in the three countries.
Impact The significant impact of W4V can be largely attributed to its activities and to the fact
that the project worked with the communities to support them in their ongoing efforts.
Noteworthy is the target on communities accessing water, which has been reached for
95% (almost 6000 households, for the three countries together). Many (different type
of) conflicts have been transformed. Moreover, some (anecdotal) positive unintended
impacts were noticed by stakeholders, such as a reduction of water borne diseases,
increase of social cohesion, and increased attendance to school.
Sustainability The project clearly focussed on activities with long term sustainability. For instance, the
PIs were instructed to teach other interested farmers to continue spreading the
approach. The WMCs are an example of a means to increase maintenance efforts (and

18
therefore sustainability) of the implemented infrastructure. The payment for water
should lead to long-term use etc. Yet, the stakeholders have voiced their concern
regarding the end of the project and the impact it will have on the continuation of the
activities. Payment for water has significantly increased, while the support to LG (e.g., in
formulating action plans) has not reached its targets. The sustainability of the
involvement of the WMCs remains to be seen, with a dwindling feeling of responsibility
for maintenance of (water) infrastructure. Even though the transfer of knowledge is part
of the PIP approach, a continuous transfer of knowledge beyond the project lifetime
appears to be a challenge. The concept of IWRM has not really been transferred
although elements have been implemented; no IWRM plans have been developed (yet).
Some external key blockages can be foreseen to the sustainability of the effects of W4V
e.g., civil unrests / insecurity, the lack of support from national authorities, the lack of
funding, and natural hazards.
1.1.5. Conclusions
W4V was a very relevant project that aligned well with the ongoing activities in the area
(other projects and local politics). The effective implementation of the ToC was delayed
by changes in the approach, but these changes led to a more prominent role for conflict
resolution. In the meantime, steady progress was made on implementation of
infrastructures. The PIP approach was found a very useful alternative for the IWRM
approach, but the evaluators conclude there could have been more efforts into the
catchment approach of IWRM. The project efficiently achieved and over-achieved part
of its outputs and consequently positively impacted the area. It is too early to conclude
on the sustainability of W4V. We can only observe what measures have been taken
within the project to make the chances on sustainable project results larger.
1.1.6. Recommendations / lessons learnt
For the consortium implementing the project The evaluators acknowledge the fact that changing a ToC, approaches and partner
organisation during a project can be relevant and necessary (and caused by a necessary
reflection process). This however needs to be compensated with new timelines for the
deliverables. In addition, allowing the implementation team to have more insight to the
budget will increase the efficiency of the project.
For the GLRP The GLRP needs to consider whether traditional 4-year implementation projects can be
asked to address the underlying causes of conflict in a region like Virunga. We believe
the conflict strategy report for W4V captured very well what the problem is and how it
should be addressed ideally. Considerable input and involvement by a donor during the
project can be beneficial, but it can frustrate the implementing organizations as well in

19
their efforts to implement a project and the need to adapt. ‘Rewarding’ the project with
more time or more finances then becomes reasonable.
For park authorities, LGs The extension of the stone wall and electrical fence along the park boundaries would
have reinforced the impact of W4V. While keeping an eye on manageability of many
stakeholders involved, involvement of a variety of relevant district departments and
religious leaders can help to spread messages and mobilize communities.
1.2. Résumé français
1.2.1. Élaboration du projet
Water4Virungas (W4V) a été créé en tant que projet en décembre 2016, financé par
l'ambassade du Royaume des Pays-Bas (EKN) et coordonné par MDF Global en
collaboration avec Stichting Wageningen University & Research (WUR, représenté par
Wageningen Environmental Research et Wageningen Centre for Development
Innovation), Witteveen+Bos et le Programme International pour la Conservation des
Gorilles (IGCP). L'objectif du projet était de réduire les conflits grâce à un meilleur accès
à l'eau et à une meilleure gestion des bassins versants dans la région des Virunga.
En raison de facteurs externes et internes au projet, W4V a connu plusieurs moments
déterminants au cours desquels l'approche, les méthodes et le cadre du suivi et de
l’évaluation ont changé. Le cadre du suivi et de l’évaluation du projet a été ajustée en
fonction des résultats du suivi par les pairs, réalisé par Transition International en 2017
/ 2018 parmi les trois projets portants sur le nexus eau / sécurité alimentaire (W4V,
FARM et Mayi Ya Amani). La discussion et l’adaptation des résultats (outcomes) ont
abouti sur la décision de se focaliser plus sur le conflit en général, induisant en même
temps un certain retard dans la mise en œuvre du projet. Les changements internes au
projet comprennent le passage de l'organisation centrale du projet à une gestion
nationale dirigée par des chargés de projet basés dans chacun des trois pays,
l'introduction de l'approche PIP pour couvrir la composante GIRE du projet et la
réduction de l'implication d'experts néerlandais.
Une approche GIRE devrait être intégrée, et en effet des éléments de GIRE ont été mis
en œuvre dans le cadre de l'approche PIP, mais cela n'était pas basé sur des plans GIRE
prenant en compte les bassins versants. Les plans GIRE devraient être élaborés, mais
cela n'a pas été possible pendant la durée du projet. L'approche PIP a apporté beaucoup
de bonnes choses, mais comme elle est centrée au niveau des agriculteurs, elle n'est pas
suffisante pour une approche au niveau du bassin versant, qui nécessite l'implication
des parties prenantes à une plus grande échelle (p.e. les autorités locales et les

20
propriétaires fonciers). Cependant, de nombreuses sessions ont été organisées avec le
personnel local dans les 3 pays pour diffuser les principes et les méthodologies de la
GIRE.
Le projet devrait être mis en œuvre avec le rôle du GVTC à faciliter des rencontres des
acteurs pertinents sur des problèmes d’eau transfrontaliers. Du moment le financement
de l’EKN pour GVTC a été terminé, le rôle active de GVTC a arrêté. En plus, le rôle de
GVTC n’a pas toujours été claire pour les personnes impliquées dans W4V.
1.2.2. Méthodologie
L'évaluation a suivi quatre phases, soit une phase de mise en route, une phase de
préparation et de collecte de données, une phase d'analyse des données, et enfin, une
phase de validation et de rapport. L'objectif de l'évaluation était d'examiner les
composantes de W4V en utilisant les critères actualisés du CAD de l'OCDE en matière de
pertinence, de cohérence, d'efficacité, d'efficience, d'impact et de durabilité. Pour ce
faire, une approche à méthodes mixtes a été utilisée en mettant l'accent sur l'analyse
qualitative des données. Comme demandé par le client, l’évaluation visait à analyser les
expériences détaillées des bénéficiaires du projet et à comprendre l'impact à long terme
et la durabilité du projet. Les méthodes qualitatives utilisées sont les suivantes : revues
de documents, discussions de groupe ciblées (FGD), des entretiens avec des
informateurs clés (KII) et des observations des infrastructures. Les méthodes plutôt
quantitatives utilisées comprennent des questionnaires destinés aux ménages.
L'évaluation respecte l'anonymat des répondants.
1.2.3. Résultats
Général Résultat 1 : WASH et GIRE L'approvisionnement en eau s'est amélioré dans une large mesure, ainsi que le transfert
des systèmes d'approvisionnement en eau. L'approche PIP a produit de bons résultats
(par exemple dans les mesures contre l'érosion des sols), mais pas à l'échelle qui était
visée. Concernant les mesures de lutte contre l'érosion, le rapportage est un peu
éparpillé :
• Dans Résultats obtenus comparés aux espérés V2.pdf, 624 ha en RDC + 7,1 ha en
Ouganda et 2 villages (sous l’indicateur Aménagement du paysage : Restauration des
terres agricoles) sont mentionnés, tandis que
• Dans W4V ME Progress Report_V11 novembre 2021.xlsx, aucun résultat n'est
mentionné au niveau des indicateurs 1e (Nombre d'hectares de terres agricoles
converties en utilisation durable) ou 1.2b (Nombre d'hectares réhabilités par la
communauté comme résultat de l'adoption des meilleures pratiques démontrées), et
• Dans W4V ME Progress Report_V11 novembre 2021.xlsx, un résultat de 11,4 ha au
Rwanda (sous l'activité Terres agricoles converties à une utilisation durable) est

21
mentionné (sous l'indicateur % de changement de la production agricole moyenne au
niveau des ménages) et 2 villages.
Résultat 2 : Gestion et gouvernance de l’eau En ce qui concerne la gestion de l'eau, les résultats sont plus mélangés : les membres de
la communauté ont plus confiance en les autorités locaux et sont satisfaits de
l'approvisionnement en eau. Les indicateurs se concentrant davantage sur les résultats
à long terme / la durabilité, comme la facilitation des parties prenantes pour légaliser
les WUC et soutenir les LG dans le développement des plans l'action, des plans
opérationnels et des plans financiers, n'ont pas été atteints.
Résultat 3 : Amélioration des relations Moins d'attention a été accordée au suivi du résultat 3, par rapport aux résultats 1 et 2.
Au niveau des extrants, l'approche PMP semble prometteuse.
RDC Résultat 1 : WASH et GIRE L'accès à l'eau est amélioré à la fois pour les besoins domestiques et pour l'élevage. 3565
ménages ont désormais un meilleur accès à l'eau. Le pourcentage de ménages disposant
d'au moins 20 litres d'eau potable par jour est passé de 43,3 % (base de référence) à
94,6 % (évaluation interne). Des réservoirs pour l’eau de pluie communautaires et privés
ont été construits pour les villages situés dans les collines et une liaison gravitaire de 23
km de long entre les populations en amont et en aval a été créée afin d'améliorer la
distribution de l'eau. Les réservoirs sont en bon état et des cas de réparations n’ont pas
été rapportés.
La distance et le temps nécessaires pour aller chercher de l'eau ont donc
considérablement diminué. Quand-même, pendant la saison sèche, les réservoirs dans
les villages en amont (p.e. à Kisigari) sont vides, et les gens doivent marcher vers les
bornes-fontaines plus éloignées (mais plus dans le parc, selon les autorités du parc).
W4V a également réhabilité 53 systèmes de récupération d'eau de pluie, chacun avec
un réservoir de 5 m³, pour desservir 8 000 ménages (KII / réunion). L'eau de pluie est
utilisée à des fins domestiques, et certains ménages l'utilisent également pour boire
(après l'avoir fait bouillir).
De plus, les techniques de contrôle du ruissellement introduites avec l'approche PIP ont
fait leurs preuves et les bénéficiaires du projet ne signalent qu'une légère érosion sur
leurs champs. 17 villages et 624 ha (tels que mentionnés dans Résultats comparés aux
espérés V2.pdf) ont été touchés. La production agricole a augmenté.
Résultat 2 : Gestion et gouvernance de l’eau

22
Un comité des usagers de l'eau (WMC) a été mis en place par réservoir ou borne
fontaine. Leurs responsabilités comprennent, sans toutefois s'y limiter, l’opération et
l'entretien l’infrastructure, la collecte des redevances auprès des utilisateurs des
infrastructures d'eau. En outre, une augmentation significative de la participation des
WMC aux réunions des gouvernements locaux a été notée, et dans l’autre sens aussi.
Les indicateurs se concentrant davantage sur les résultats à long terme / la durabilité,
comme la facilitation des parties prenantes pour légaliser les WUC et soutenir les LG
dans le développement des plans l'action, des plans opérationnels et des plans
financiers, n'ont pas été atteints. La satisfaction des communautés vis-à-vis des services
d'eau fournis par le gouvernement local reste faible. Les premières étapes vers
l'élaboration de plans de GIRE ont été définies.
Résultat 3 : Amélioration des relations L'approche PMP a été mise en œuvre avec succès en RDC et est principalement active
dans les groupements de Kibumba, Jomba et Kisigari. De nombreux conflits (liés à l'eau,
aux cultures et aux limites des parcelles) ont été transformés. De plus, W4V a encouragé
la discussion entre les communautés et les autorités du parc, ce qui a conduit à la mise
en œuvre des accords déjà existants pour permettre aux communautés d'entrer dans le
parc sur une base hebdomadaire. Par conséquent, une diminution des entrées illégales
dans le parc a été constatée. De plus, la mise en place de la clôture électrique a
également réduit les conflits homme-animaux sauvages.
Rwanda Résultat 1 : WASH et GIRE L'accès à l'eau a augmenté grâce à la construction de 575 réservoirs dans les quatre
districts d'intervention. 2800 ménages ont désormais un meilleur accès à l'eau. Le
pourcentage de ménages disposant d'au moins 20 litres d'eau potable par jour est passé
de 63,3 % (base de référence) à 91,6 % (évaluation interne). Ainsi l'entrée dans le parc
pour la recherche d’eau a diminuée. La quasi-totalité des bénéficiaires doit marcher
moins de 30 minutes pour aller chercher de l'eau à des fins domestiques et d'élevage.
Pendant la saison des pluies, les gens préfèrent d'autres sources d'eau comme l'eau du
NWSC. Les réservoirs visaient principalement à réduire le ruissellement, l'usage
domestique (laver les vêtements, cuisiner) était un avantage secondaire, comme l’eau
potable (en saison sèche). 11,4 hectares de terres agricoles ont été convertis à une
utilisation durable ; cela représente 0,06% de la superficie de la zone totale
d'intervention rwandaise. De nombreux (440.831) arbres et herbes stabilisatrices y ont
été plantés mais pour autant que l'on puisse en juger, les arbres ont été principalement
plantés dans des zones déjà gérées de manière durable, par ex. dans le secteur de
Cyanika, des bambous avaient été plantés le long des sorties de ponceaux en bordure
de route. Des arbres fruitiers ont été plantés sur des terres agricoles déjà bien gérées en

23
agroforesterie. À Nyabihu, des arbres ont été plantés pour stabiliser les canaux de
drainage qui avaient été construits. D'autres arbres ont été plantés dans la zone tampon
le long du parc (donc pas une zone agricole). Ainsi, la plantation d'arbres semble avoir
renforcé une gestion des terres déjà assez durable, et pas tellement changé des terres
gérées de manière non durable en terres gérées de manière durable.
Résultat 2 : Gestion et gouvernance de l’eau Comme en RDC, des WMC fonctionnels ont été introduits par RWHT. En outre, une
augmentation significative de la participation aux réunions du gouvernement local a été
notée. Pourtant, la satisfaction des communautés vis-à-vis des services d'eau fournis par
le gouvernement local reste faible. D'autres indicateurs axés davantage sur les résultats
à long terme / la durabilité, comme le soutien du gouvernement local dans le
développement des plans d'action, des plans opérationnels et des plans financiers, n'ont
pas été atteints. Des éléments GIRE ont été mis en œuvre, mais aucun plan GIRE n'a été
élaboré.
Résultat 3 : Amélioration des relations À mesure que les entrées illégales dans le parc ont diminué, les conflits avec les autorités
du parc suivit le même schéma. De plus, la réhabilitation du mur de pierre (auquel les
coopératives communautaires ont participé) a diminué le nombre de conflits homme-
animaux sauvages, mais des tensions existent toujours parce que le pillage des récoltes
a toujours lieu, car environ 1 km de la frontière n'est pas clôturé. Plusieurs accords ont
été signés entre W4V et les parties prenantes concernées afin de créer un
environnement propice à la progression du projet.
Ouganda Résultat 1 : WASH et GIRE L'accès à l'eau a été fortement amélioré grâce à la mise en œuvre de réservoirs et de
l'eau courante Kisoro Virunga Water Supply Extension (KVWSE) (construite avec NWSC).
En effet, de nouveaux réservoirs ont été construits dans les trois paroisses. De plus, de
nombreuses réparations de fuites de tuyaux ont été effectuées sur les systèmes
d'approvisionnement en eau de la NWSC. 5200 ménages ont désormais un meilleur
accès à l'eau. Le pourcentage de ménages disposant d'au moins 20 litres d'eau potable
par jour est passé de 65,8 % (base de référence) à 96,1 % (évaluation interne). Grâce à
ces infrastructures, le pourcentage de ménages qui ont au moins accès à l'eau d'une
source protégée à une distance de marche de 30 minutes, est passé de 40,9% à 88,6%.
De plus, beaucoup plus de gens se sentent plus en sécurité lorsqu'ils accèdent à l'eau.
L'approche PIP a introduit plusieurs techniques efficaces afin de réduire les inondations,
l'érosion des sols et la formation de ravins. Dans Résultats obtenus comparés aux usagés
V2.pdf, 7,1 ha (sous l'indicateur Aménagement du paysage : Restauration des terres
agricoles) et 2 villages sont mentionnés.

24
Résultat 2 : Gestion et gouvernance de l’eau W4V a introduit un WMC pour chaque réservoir et borne fontaine du système KVWSE.
En outre, 7 membres des WMC ont été élus pour former un comité paroissial des usagers
de l'eau (PWMC), qui supervise et guide les activités des WMC. Le pourcentage de
ménages qui paient régulièrement pour les services d'approvisionnement en eau a
considérablement augmenté. À la fin du projet, une augmentation significative du
nombre de participants aux réunions du LG a été notée et 54 % des répondants étaient
satisfaits des services d'eau fournis par le LG. D'autres indicateurs axés sur les résultats
à long terme / la durabilité, comme le soutien de LG dans le développement des plans
d'action, des plans opérationnels et des plans financiers, n'ont pas été atteints. Au lieu
de plans GIRE, des plans de réduction des glissements de terrain ont été élaborés.
Résultat 3 : Amélioration des relations 98% des répondants au sondage ont indiqué que le projet avait eu un impact positif sur
la réduction des conflits dans la région. De plus, 97% des répondants estiment que les
conflits liés à la gestion de l'eau et des bassins versants ont diminué et 98% ont indiqué
une amélioration des relations avec les autorités du parc depuis les 2 dernières années.
Ce dernier a été amélioré (notamment) par la mise en relation des communautés avec
l'Ugandan Wildlife Authority et par le renforcement du mur de pierre délimitant le parc.
1.2.4. Évaluation du projet
Pertinence W4V était très pertinent pour la région et ses communautés. En effet, le but et les
objectifs du projet étaient conformes aux besoins et aux priorités de la plupart des
parties prenantes et des bénéficiaires finaux du projet. Plusieurs activités ont été
développées afin de fournir à la fois des résultats tangibles (par exemple, la construction
de la clôture électrique, l'introduction de RWHTs, le renforcement du mur de pierre) et
immatériels (par exemple, la mise en place de PMP, la mise en relation des
communautés avec les gouvernements et les autorités du parc) qui peuvent résoudre
partiellement les problèmes sous-jacents dans la région. Les décisions sur
l'emplacement des réservoirs (et de leurs puisards) n'étaient pas partout les meilleures
pour résoudre les problèmes sous-jacents. L'approche PIP a permis de répondre à
plusieurs besoins des différents groupes cibles.
Les objectifs de l'ambassade n'ont pas été complètement atteints, mais certaines parties
prenantes ainsi que l'équipe d'évaluation les ont trouvés trop ambitieux pour le moment
et le domaine d'intervention.
Cohérence W4V a recherché la cohérence à la fois avec GLRP et les projets (par exemple, FARM,
Maji ya Amani, Hinga Weze) qui se déroulent dans la région. Le projet était conforme

25
aux projets Maji ya Amani et FARM, tant dans leur approche (lier les gouvernements et
les communautés) que dans leurs objectifs (stabilité régionale et accès accru à l'eau). De
plus, dans les trois pays, W4V s'est efforcé de travailler main dans la main avec les
autorités locales et les autorités des parcs et de développer des activités qui
correspondent à leurs politiques et plans de développement ciblant la zone du projet. Il
aurait été bien que le projet ait pu contribuer à la clôture complète des parcs, afin de ne
pas déplacer les problèmes.
Efficacité Le projet a produit des résultats efficacement et au-delà de ce à quoi on aurait pu
s'attendre, prenant en compte les conditions des différents pays. Les changements
d'approche ont réduit l'efficacité. Le suivi par les pairs facilité par Transition
International a amélioré la logique du projet. Cela a permis de reformuler la cadre du
suivi et de l’évaluation afin que W4V se concentre sur les conflits mais dans les limites
de la gestion de l'eau et des relations entre le parc et les habitants. Pourtant, plusieurs
inadéquations entre les extrants et les résultats ont été identifiées. De plus, l'utilisation
des réservoirs comme mesure de contrôle du ruissellement peut être contestée en
raison de la quantité relativement faible d'eau qui peut être stockée dans les réservoirs
par rapport à la pluviométrie moyenne, et l'emplacement des puisards non autour des
réservoirs. De plus, lorsque les réservoirs seront remplis, ils deviendront eux-mêmes une
source de ruissellement. La qualité des infrastructures était généralement bonne bien
que certains réservoirs de Bugeshi (Rwanda) aient été signalées comme fragiles
(conception adaptée par la suite), plusieurs éclatements des conduits du KVWSE
(Ouganda) ont déjà été constatés. L'une des raisons de la panne et de la fuite du système
KVWSE a été donnée (par le directeur général de la NWSC) était le vandalisme par les
membres de la communauté, comme par ex. les écrous et les vis peuvent être vendus
rapidement, ou à cause des membres jaloux des villageoises voisines qui n'avaient pas
bénéficié du projet. Une autre raison de la panne des tuyaux peut être trouvée par ex.
dans le village de Mwanjali, où les robinets n'avaient jamais été fonctionnels depuis leur
installation, donc ici, la construction n'a peut-être pas été faite correctement.
Les pourcentages de personnes qui paient régulièrement leur eau ont en général
augmenté. Les résultats de l'approche PIP ont convaincu d'autres personnes de se faire
former et les gouvernements locaux de travailler avec les PI. Les PMP ont contribué de
manière significative à la résolution des conflits (différents types de conflits).
Efficience En termes de budget, le projet semble d'un prix raisonnable, en particulier compte tenu
du contexte difficile dans lequel il opère et du dépassement des résultats (conflit, covid,
etc.). Plusieurs se plaignent du manque de transparence en ce qui concerne la décision

26
et l'allocation du budget. Ce manque de transparence a eu un impact sur l'efficacité du
projet. Alors que W4V s'est fortement appuyé sur l'expertise internationale dans les
premières années du projet, ces experts se sont positionnés en utilisant soit une
approche de conseil externe descendante, soit une approche PIP participative
ascendante. Des retards ont été causés par des facteurs internes et externes. La
disponibilité (due à l'insécurité, et à Covid-19) et, en partie liée à cela, la valeur ajoutée
de l'expertise internationale a été jugées différemment dans les trois pays.
Impact L'impact significatif de W4V peut être attribué à ses activités en grande partie, et au fait
que le projet a travaillé avec les communautés pour les soutenir dans leurs efforts
continus. Il convient de noter l'objectif d'accès des communautés à l'eau, qui a été
atteint à 95% (près de 6 000 ménages, pour les trois pays ensemble). Un grand nombre
de (différents types de) conflits ont été transformés. En outre, plusieurs impacts positifs
non intentionnels ont été remarqués par les parties prenantes tels qu'une réduction des
maladies d'origine hydrique, la cohésion sociale ou l'augmentation de la fréquentation
scolaire.
Durabilité Le projet cherchait à avoir des activités durables. Par exemple, les PI ont reçu pour
instruction de former d'autres agriculteurs intéressés afin de continuer à diffuser
l'approche. Les WMC sont un exemple de moyen d'assurer la maintenance (et donc la
pérennité) des infrastructures mises en place. Pourtant, les parties prenantes ont
exprimé leur inquiétude quant à la fin du projet et l'impact que cela aura sur la poursuite
des activités. Le paiement de l'eau a considérablement augmenté, tandis que le soutien
au gouvernement local (par exemple dans la formulation de plans d'action) n'a pas
atteint ses objectifs. La pérennité de l'implication des WUC reste à voir, avec un
sentiment de responsabilité décroissant pour l'entretien des infrastructures (de l'eau).
Quoique le transfert de connaissances fait partie de l'approche PIP, un transfert continu
de connaissances au-delà de la durée de vie du projet semble être un défi. Le concept
de GIRE n'a pas vraiment été transféré même si des éléments ont été mis en œuvre ;
aucun plan GIRE n'a été élaboré (encore). Certains blocages (externes) peuvent être
prévus en ce qui concerne le maintien des effets de W4V, par exemple, les troubles civils,
l’insécurité, le manque de soutien des autorités nationales, le manque de financement
et les risques naturels.
1.2.5. Conclusions
W4V était un projet très pertinent qui correspondait bien aux activités en cours dans la
région (autres projets et politique locale). La mise en œuvre effective de la théorie du
changement a été retardée par des changements d'approche, mais ces changements
ont conduit à un rôle plus important pour la résolution des conflits. Entre-temps, des

27
progrès constants ont été accomplis dans la mise en place des infrastructures.
L'approche PIP s'est avérée une alternative très utile à l'approche GIRE, mais les
évaluateurs concluent qu'il aurait pu y avoir plus d'efforts dans l'approche de bassin
versant de la GIRE. Le projet a efficacement atteint et dépassé ses résultats et a par
conséquent eu un impact positif sur la région. Il est trop tôt pour conclure sur la
pérennité de W4V. Nous ne pouvons qu'observer que des mesures ont été prises au sein
du projet pour augmenter les chances de résultats durables du projet.
1.2.6. Recommandations / leçons apprises
Pour le consortium mettant en œuvre le projet Les évaluateurs reconnaissent le fait que changer une approche ToC et une organisation
partenaire au cours d'un projet peut être pertinent et nécessaire (et provoqué par un
processus de réflexion nécessaire). Cela doit cependant être compensé par de nouveaux
délais pour les objectifs. De plus, permettre à l'équipe de mise en œuvre d'avoir accès
au budget augmentera l'efficacité du projet.
Pour le GLRP Le GLRP doit examiner si des programmes de mise en œuvre traditionnels de 4 ans
peuvent être demandés pour s'attaquer aux causes sous-jacentes des conflits dans une
région comme celle de Virunga. Nous pensons que le rapport sur la stratégie de conflit
pour W4V a très bien défini le problème et la manière idéale de le résoudre. Une
contribution et une implication considérables d'un bailleur au cours du projet peuvent
être bénéfiques, mais elles peuvent également frustrer les organisations chargées de la
mise en œuvre dans leurs efforts pour mettre en œuvre un projet et la nécessité de
s'adapter. ‘Récompenser’ le projet avec plus de temps ou plus de finances devient alors
raisonnable.
Pour les autorités locales et les autorités des parcs L'extension du mur de pierre et de la clôture électrique le long des limites du parc aurait
renforcé l'impact de W4V. Tout en gardant un œil sur la gérabilité des nombreuses
parties prenantes impliquées, l'implication d'une variété de départements de district
concernés et de chefs religieux peut aider à diffuser des messages et à mobiliser les
communautés.

28
2. Introduction
Water4Virungas (W4V) was established as a project in December 2016, funded by the
EKN in Kigali and coordinated by MDF Global in collaboration with Stichting WUR,
Witteveen+Bos and IGCP. As part of the Great Lakes program of the Ministry of Foreign
Affairs, the program was included in the ministry’s goal to: “contribute to stability and
mitigate the consequences of conflict through the improvement of human security,
inclusive growth, and access to natural resources (such as land).”1 In September 2021
the Ministry of Foreign Trade and Development Cooperation contracted
Aidenvironment to perform an evaluation of the W4V project. The current document is
the result of the evaluation. The evaluators are thankful to the (former) staff of the W4V
consortium partners and all others involved in this evaluation, for being available and
for providing documents and other information, whenever asked for by the evaluators.
In this introduction we describe the overall objectives and the way the project changed,
so key moments in the project that need to be understood before the results can be
valued and assessed.
2.1. Objective and intervention area
The program’s overall objective was to reduce conflicts through increased access to
water and improved watershed management in the Virunga area. Figure 1 below shows
the logframe used in the project with the outcomes and outputs.
1 https://www.dutchdevelopmentresults.nl/2019/countries/great_lakes_region
Outcomes
Outputs
Overall objective

29
Figure 1. Final W4V log frame (source: Changes in the W4V project document)
The project was implemented in DRC, Rwanda, and Uganda, in a belt of 2 km width around the national parks that cover the volcanoes (see figure 2). In table 1, population and surface of intervention area are given (from W4V_Progress Report_2020 Final).
Figure 2. W4V intervention area and interventions
Country Population Surface (km2)
DRC 97.500 90,5
Rwanda 116.600 197,0
Uganda 18.300 27,0
Total 232.400 314,5
Table 1. Population and surface of intervention area
2.2. Changes in the project
During the project, several adaptations took place, sometimes induced by external
factors, others based on changing conditions within the consortium. To understand the
development of the project we present the key changes.

30
The project set out with the main objective to reduce conflict through increased access
to water and improved watershed management in the Virunga area (W4V project
proposal September 2016). This goal was formulated in view of the problems
surrounding water at a watershed level at different levels (e.g., domestic, village,
landscape, and international levels).
The project started with an assessment of water supply options in all three countries.
Because the Rwandan authorities (WASAC, the utility) did not respond, no water supply
component was developed for Rwanda. In DRC, the water supply for Kibumba was a
priority from the start of the program. Initially, the idea was to do this via Rwanda
(where an abandoned pipeline scheme to DRC could possibly be rehabilitated).
However, this proved to be politically complex and expensive. Water supply within
Rwanda also had to be included in the program and the total budget came to some five
million Euros. It took about two years before the attempt to supply water from Rwanda
to DRC was abandoned and alternatives were sought. Late 2020 an affordable solution
in Congo (via Rugari) was explore and approved by the engineers and ICCN came on
board.
In the meantime, the Netherlands Embassy was also involved with a Develop2Build
(D2B) study on water supply in rural areas in Musanze, Nyabihu and Rubavu Districts in
Rwanda. W4V would focus on the IWRM component while D2B would tackle water
supply. However, delays with WASAC meant that the D2B study was delayed by about
two years, and the complementarity with W4V was lost.
After the first year of the project (2017), Transition International facilitated a peer
monitoring between three projects on the water/food security interface (W4V, FARM
and Mayi Ya Amani), and changes to the outcomes and outputs were proposed. In table
2 below:
• In the left two columns the specific objectives and outputs from the original
logical framework are presented;
• In the middle two columns, the most corresponding outputs from the final M&E
framework are presented;
• In the right two columns, it is indicated whether indeed, and to what extent (%),
the indicators underlying the goal, outcomes and outputs were evaluated /
measured during the (draft) internal evaluation and in the (last) W4V ME
Progress Report_V10. This percentage does not say anything about the
achievement of the targets, which will be dealt with in the chapter on
achievements. Obviously, most of the indicators underlying the goal, outcomes
and outputs in the final M&E framework have been evaluated, either during the
internal evaluation by W4V, or reported on in the W4V ME Progress Report_V11.
Only output 1.3 (watershed protection measures) and most outputs under

31
outcome 3 (improved relations) have not been measured / reported on. This
makes a balanced evaluation of the project more difficult.

32
Logical framework (original proposal, Sept. 2016)
Final M&E framework (Dec. 2018) % of
underlying indicators
evaluated in draft internal
evaluation
% of underlying indicators
reported in W4V ME Progress
Report_V10
Specific objective Output
Outcome Output
Overall objectives:
• Regional stability through improved security (and inclusive growth)
• Reduced conflict through increased access to water and improved watershed management in the Virunga area
Overall objective:
• Regional stability through human security and inclusive growth
Goal:
• Reduced conflict through increased access to water and improved watershed management in the Virunga Area
0% 100%
Specific objective 1: increased access to safe drinking water
Output 1.1: Situation analysis & options for sustainable water supply selected
Output 1.2: Quick win water supply / sanitation infra constructed and operational
Outcome 1: Improved well-being and production through improved WASH and IWRM
50% 100%
Outcome 1: Improved well-being and production through improved WASH and IWRM
Output 1.1: Increased access to safe drinking water for all communities
60% 33%
Output 1.3: Water systems designed & operational
Outcome 1: Improved well-being and production through improved WASH and IWRM
Output 1.1: Increased access to safe drinking water for all communities
60% 33%
Specific objective 2: Effective watershed management
Output 2.1: Risks and opportunities for improved watershed management mapped
Outcome 2. Improved inclusive governance and management of water
33% 100%
Outcome 2. Improved inclusive governance and management of water
Output 2.3: Development of IWRM plans and investment plans by Districts/chefferies
0% 100%
Output 2.2: Erosion control & soil fertility measures implemented at farm level
Outcome 1: Improved well-being and production through improved WASH and IWRM
Output 1.2: Erosion control and soil fertility measures adopted
0% 50%
Output 2.3: Watershed protection measures taken
Outcome 1: Improved well-being and production through improved WASH and IWRM
Output 1.3: Watershed protection measures in place
0% 0%
Outcome 2. Improved inclusive governance and management of water
Output 2.2: Improved and transparent functional relations between consumers, services providers, and LG (for water service delivery and IWRM)
67% 75%
Specific objective 3: Improved service delivery and water governance
Output 3.1: Water related and underlying conflicts addressed
Outcome 3. Improved relations and reduction of conflicts between governments, park authorities and local populations regarding access to water and other natural resources
85% 15%
Outcome 3. Improved relations and reduction of conflicts between governments, park authorities and local populations regarding access to water and other natural resources
Output 3.2: Trans boundary issues and conflicts in GVL addressed
0% 0%

33
Logical framework (original proposal, Sept. 2016) Final M&E framework (Dec. 2018)
% of underlying indicators
evaluated in draft internal
evaluation
% of underlying indicators
reported in W4V ME Progress
Report_V10
Specific objective Output
Outcome Output
Output 3.2: Citizens participate in local government annual planning and budget cycle
Outcome 2. Improved inclusive governance and management of water
Output 2.1: Citizens participate in local government annual planning and budget cycle
50% 100%
Output 3.3: Water service providers strengthened
Outcome 2. Improved inclusive governance and management of water
Output 2.4: Water user’s committees and Service providers functional
0% 100%
Output 3.4: Provincial water supply & investment plan developed
Specific objective 4: Transboundary water related issues and conflicts effectively addressed
Output 4.1: Strengthened communication with stakeholders
Outcome 3. Improved relations and reduction of conflicts between governments, park authorities and local populations regarding access to water and other natural resources
Output 3.5: Effective dialogue on Inter-government contracts on trans-border water delivery and management.
0% 0%
Output 4.2: Brokering and mediation when development deflect from plan
Outcome 3. Improved relations and reduction of conflicts between governments, park authorities and local populations regarding access to water and other natural resources
Output 3.1: Network of identified mediators/facilitators (persons/organisations/platforms) capable of using effective conflict transformation strategies is established and functional
0% 33%
Output 4.3: Progress and lessons learned from W4V available
Output 4.4: Information on water related issues Virunga available
Outcome 3. Improved relations and reduction of conflicts between governments, park authorities and local populations regarding access to water and other natural resources
Output 3.3: GVTC and communities have up to date information on water and land related conflicts.
0% 0%
Outcome 3. Improved relations and reduction of conflicts between governments, park authorities and local populations regarding access to water and other natural resources
Output 3.4: Structured relationships between park authorities, local authorities and communities strengthened
0% 0%
Table 2. Comparison W4V original and final M&E framework

34
The most remarkable differences between the old and the new outputs are the
following:
• The two comprehensive objectives have been reduced to one, more realistic, goal. The stability objective has been removed; conflict became part of the approach, not as a stand-alone anymore, and not being only transboundary anymore.
• Specific objective 1: o The situation analysis had already been done at the time of the review
and could be left out; o The outputs that focused on water supply, were replaced by an output
with a focus on the access to water: o A strong emphasis on the well-being, safety, and access to water rather
than engineering and supply
• Specific objective 2: o The mapping of risks and opportunities had been already done by the
time of the review and could be replaced by the development of IWRM plans and investment plans;
o The new output Improved and transparent functional relations between consumers, services providers and LG was added, as that apparently had become clear as an issue;
• Specific objective 3: o Water users’ committees have received more attention, next to service
providers, and at the expense of provincial water supply;
• Specific objective 4: o The strengthened communication has been replaced by an effective
dialogue on inter-government contracts on trans-border water delivery and management;
o Brokering and mediation has been specified, influenced by the PMP approach;
o Progress and lessons learned from W4V are available has disappeared, as it was said not to be measurable. After further consultations (also with EKN), it was decided that lessons learned be documented separately, e.g., the various documents that have been shared with the new (EKN funded) project (TRIDE);
o An extra output (3.4) has been added: Structured relationships between park authorities, local authorities and communities strengthened, as that apparently was an issue, which has been dealt with indeed.
At the start of the project, for indicators (under all three outcomes), targets were set,
but only some of these were measured during the endline survey / internal evaluation.
Under outcomes 1 and (most of) outcome 2, concrete targets were set for activities, but
not so for outcome 3 With the exception of the construction of the electrical fence.
Some of these activities were rather formulated as output indicators, which hasn’t made
monitoring easier.

35
The coordination was done centrally from Musanze in Rwanda by MDF, but the logistics
and workload called for a decentralization and the project recruited country officers to
implement and monitor the project in the three countries. It was generally agreed by
the interviewees that the country representatives facilitated the faster roll-out of the
program. They also mentioned that such development transformed the project into
three projects that operated independently. In hindsight, it improved the programs
delivery to bring the project management closer to the three project areas / countries,
even though that it meant that the three country projects from then on diverged more,
as the project aimed to address problems, which were different in the three countries.
Moreover, having three country projects made communication more challenging.
Regarding IWRM, an interviewee stated the following: In 2018, several conceptual notes
were prepared by W4V to include IWRM in the project. Following the IWRM principle,
the interventions should be based on a catchment approach. However, even though
IWRM elements have been integrated in the project activities (through the PIP
approach) a catchment-based approach has hardly been set up. For a catchment
approach, catchment management organizations (if not yet present) need to be set up
and be functional, with all resources and the mandate to enforce its rules. This takes
more time than the period of this project.
The evaluators found that the conceptual notes did not include a strong understanding
of IWRM or catchment management in a development context/. IWRM was filled in by
isolated soil and water conservation elements implemented through the PIP approach.
For instance, soil protection to counteract erosion and the construction of RWHTs to
counteract runoff and flooding. Moreover, several sessions were held with the local staff
in the three countries to disseminate the principles and methodologies of IWRM. The
IWRM plans that became an output (after the Transition International peer monitoring
in 2017) were a good idea, but this output was not achieved, which is not strange, as
IWRM and especially its institutional aspects (set up catchment management) need
more time than the duration of a project.
Another change over time was that the project had a 7 million euro investment budget
that reduced sharply over time. The project was extended (in Rwanda and Uganda until
March 2021, and in DRC until June 2022 – from an original end date of December 2020).
Finally, there were “normal” project delays, due to lack of information, non-uniform
government views, lack of understanding of the project by involved stakeholders. And
then there were delays related to Ebola (in DRC, five outbreaks since May 2018),
insecurity and Covid-19.

36
2.3. Collaboration with GVTC
Another change in the project setup was the role of the Greater Virunga Transboundary
Collaboration (GVTC). Several years before the project started, the embassy worked
with IGCP, and from the work of the IGCP, a transboundary collaboration emerged. With
support of the embassy, a tri-nation treaty (Uganda, Rwanda, DRC) was signed on this
transboundary collaboration. The GVTC was the secretariat (with diplomatic status) that
implemented this collaboration. GVTC is a collaboration of seven parks with biodiversity
hotspots and three national park authorities.
Around 2013, the GVTC flagged the issues around water and the park to the embassy.
Due to the geography of the area, the people who live around the park suffer from water
shortages and flooding. The communities were going into the park to fetch water due
to the lack of water sources around the park. In addition, high runoff was causing
flooding and erosion outside the park. Supported by an international study on the
hydrology of the area (Déogratias et al., n.d.), the EKN set up a call for proposals to
reduce conflict through water development. The consortium of WUR, MDF, IGCP and
Witteveen+Bos won the call. At first WUR was in the lead, but internally WUR decided
against this role and withdrew. Moreover, MDF had a long-standing experience in DRC
and was appointed as the lead organization of W4V. IGCP was already working with
GVTC, and the program was to support GVTC in the support of their centre of excellence.
In return, GVTC would facilitate meetings on transboundary water issues between
relevant stakeholders. Therefor, GVTC entered into an MoU with W4V as an
implementing partner. When the funding by EKN and the three countries ended in
March 2019, the active role of GVTC within W4V was over. No need was felt to renew
the MoU then as, according to GVTC, the MoU was only a tool to support
implementation. GVTC and its centre of excellence (supported by Dutch funding)
continue to support and facilitate continuous and effective dialogue, communication
and information sharing among all GVTC stakeholders, as that is it mandate.
The centre of excellence shares data and information (physically and virtually). It
mediated between the district, W4V and other parties and provided back up (organizing
and inviting stakeholders) in negotiations.
• In March 2019, GVTC’s last human-wildlife transboundary workshop was held;
• Recently, when a flood hit one of the water booster stations, the district
immediately informed GVTC and it coordinated the search for solutions;
• In March 2022, GVTC managed a human – wildlife conflict, between the
communities of Bugeshi (Rwanda) and the National Park. GVTC was informed
and coordinated a meeting between the two parties. Discussions on insecurity

37
have started through the Regional Technical Committee (and resolutions should
have been presented to the board on 5 April 2022).
Apparently, there are different perceptions / understanding of the mandate / role of
GVTC (GVTC: “support and facilitate continuous and effective dialogue, communication
and information sharing among all GVTC stakeholders,”, W4V: “facilitating
transboundary policy aspects”) which leads to different perceptions of the results GVTC
has booked.

38
3. Methodology
3.1. Phases
The evaluation followed 4 phases:
1. Inception phase: The main objective of this phase was to define the scope and focus
of the evaluation and assess the existing information at the project and country
specific level. An assessment of the existing information and a review of the project
documents were performed;
2. Preparation and data collection: In this phase, the team prepared the sampling
methodology, the data collection tools and the workplan. In addition, data was
collected from the 3 project countries (Uganda, Rwanda, and DRC). The data
collection plan was based on the evaluation matrix, the information gaps and the
key issues identified from the literature review;
3. Data analysis: Qualitative data were reviewed to identify patterns and explore ideas
to explain or interpret those patterns in line with the project objectives.
Quantitative data were collected in the field with tablet or phone-based application
(KOBO Collect);
4. Validation and reporting: Main findings were presented to W4V and EKN, after
which a draft report was shared, to receive comments and to prepare the final
report.
3.2. OECD DAC criteria
The objective of the evaluation is to review the W4V project and its separate
components following the updated OECD DAC criteria of relevance, coherence,
effectiveness, efficiency, impact, and sustainability. Particular attention was given to (1)
the contribution of the project to the stability in the Great Lakes Region, (2) the conflict-
sensitivity of the implementation of the project, (3) the quality of implementation
(including ownership of planning and implementation by relevant stakeholders), and (4)
the sustainability of interventions. While the evaluation is about assessing the project,
learning lessons for future projects is at least as important.
The evaluators were asked to look at the project from a qualitative and processual angle.
This means for instance that less attention was paid to outputs (and more to outcomes)
reached by W4V and more interested in the way outcomes were instrumental in making
impact / long-term change. The internal evaluation (Water4Virungas Project Internal
Evaluation Report December 2021) by W4V paid more attention to outputs. The reason

39
for this is that the project combines water, development and conflict resolution and
there is a lot to learn from this combination that can benefit new projects.
3.3. Mixed-method approach
The evaluators used a mixed-method approach primarily using qualitative analyses to
understand detailed experiences of the project beneficiaries and understand the impact
of the project on them and the project area. Quantitative data were collected to quantify
the experiences and changes mentioned. The added value of a mixed-method approach
can be found in its triangulation, complementarity, contextuality and illustration.
The qualitative methods applied were:
• Document review;
• Focus group discussions (FGD);
• Key informant interviews (KII) (both online and live);
• Infrastructure observations.
The quantitative methods applied were:
• Household questionnaires
3.3.1. Document review This involved reviewing the relevant documents such as the project proposal, baseline
study reports, progress reports, monitoring reports, field monitoring reports, policy
documents, financial documents, and reports. This was heavily done at the start to
prepare for primary data collection but also continued throughout the entire duration
of the evaluation process. An overview (not exhaustive) of the documents received is
shown in Annex 9.1.
3.3.2. Key informant interviews
With an input from the project implementation staff, key informants were selected, and
interview schedules / guide developed to capture information from the key informants.
These stakeholders varied per country. A summary of the participants is shown in Annex
9.2.
3.3.3. Focus group discussions
FGD were conducted with carefully selected groups targeting WMCs, Breeders'
Committee, PIP participants, watershed management committees at village level and
households that participated in the PMP (conflict management approach) including the
cooperatives who maintained the buffalo wall. The groups were composed of both men
and women of about 8 to 10 people. These were used to discuss the main results from
the project and the community level changes which were cause by the project.

40
Participants shared their experiences which were later crosschecked with the KII. The
data on the FGD can be found in Annex 9.3
3.3.4. Household questionnaires
Since the study was mainly qualitative, a small size of household survey was conducted
only for the purpose of validating the qualitative responses. They were often conducted
immediately after the FGD, in local language. Responses were put in a phone-based
application (Kobo Collect). Information was collected on all major project indicators. An
overview of the household questionnaires can be found in annex 9.4.
3.3.5. Infrastructure observations
Site visits to observe constructed infrastructure and collect data to assess metrics were
done to selected water schemes, water tanks, corridors and troughs for livestock,
buffalo walls/fences around the park and watershed management infrastructures and
trees planted. The purposes of the visits were to verify the existence, use and
functionality of the project infrastructures, and to verify what was told by W4V,
beneficiaries and other stakeholders. In some cases, the evaluators wanted to verify the
appropriateness of the intervention especially for watershed and landscape
management interventions. An overview of the observed interventions can be found in
Annex 9.5.
3.3.6. Sampling
Selection of sites to be visited were based on the following criteria;
• Types of intervention (balance between water, watershed, conflict
transformation and PIP)
• Selection of the sites to visit were also based on location either upstream or
downstream
• Infrastructures like tanks were selected based on functionality (that were doing
well and those that were not doing well)
• Households within the selected sites were selected randomly
The details of the villages visited are shown in the table in Annex 9.6, and a map with
the visited villages is shown on the next page.

41
Figure 3. Intervention villages visited during the evaluation.
The red dots situated outside the intervention area, indicate a location within the relevant administrative area, as suggested by a Google Earth algorithm to be representative for that administrative area.
3.3.7. Data analysis and references
The interviews and KII were either conducted following the OECD DAC criteria questions
(as prescribed by the ToR for this evaluation), or the information gathered during these
interviews was retroactively attributed to the OECD DAC criteria questions.
In this report, reference to information from interviews, KII and FGD is done
anonymously, to protect the anonymity of all interviewees and other informants.
Reference to information from household interviews, infrastructure observations, e.g.
• “It is clear that water supply has improved.” (FGD)
3.3.8. Challenges of the fieldwork
• There was insecurity in the Virunga area at the DRC side. This affected data
collection in the planned period in DRC since part of the project area was
unreachable.
• The topography was difficult to manoeuvre especially in Rwanda and DRC. In
Rwanda, the vehicle could not access certain project areas, and the evaluators
had to walk up and down the hills. The evaluators had to walk long distances often
on foot in hilly areas or on motorbikes in the case of DRC.

42
• Language problems were managed by hiring local enumerators / translators,
which always leads to some loss of information.
3.4. Evaluation team
The consultants based in DRC (Vision Verte) and Uganda (Aidenvironment) worked on
primary data collection, and participated in document review, tool development &
primary data collection and reporting. They were assisted by guides, translators and
enumerators based in the project. The translators and enumerators supported the
consultants with translation and household questionnaires. The consultants were also
assisted a lot by the project implementation team.
The consultants based in the Netherlands worked on the reporting, controlled the
quality of the information, and oversaw the study. They participated in tool
development, document reviews, online interviews (data collection) and reporting.
Details of the evaluation team are given in Annex 9.7.

43
4. Summary of project achievements
4.1. Introduction
In this chapter, the achievements on the level of outputs and outcomes will be
presented. As far as the achievements at impact level are concerned, these can be found
in section 6.2.5.
The project faced some issue as its objectives and targets had to adapt to the field reality
and the adoptions of the measures was slower than initially anticipated (Internal
evaluation presentation). Yet, despite these conditions, the project managed to
implement most of its activities and reach quite some targets.
In the following sections, project achievements are summarized in two ways:
Every section starts with a table, in which quantitative data on results are presented, as
measured and reported by W4V, in the following documents:
• Résultats obtenus comparés aux prévisions v2 (received 14/10/2021) ;
• W4V Internal evaluation report (received 8/3/2022);
• W4V ME Progress Report_V11 November 2021 (received 28/4/2022);
As most of these data were received at the end of this external evaluation, they have
not been checked, but they have been converted in tables to give some quantitative
data to complement this qualitative external evaluation.
Regarding the internal evaluation and the baseline (report from November 2018):
measurements were done in a control group only during the baseline in DRC, not in
Rwanda or Uganda, nor during the internal evaluation for the three countries.
W4V ME Progress Report V11 differed quite a lot from V10: Country W4V ME Progress Report_V10:
% completed as compared to targets
W4V ME Progress Report_V11 November 2021:
% completed as compared to targets
DRC 85% 97%
Rwanda 73% 57%
Uganda 83% 105%
Three countries 76% 75%
Table 3. Comparison of results between W4V Progress Reports V10 and V11
The evaluators noted significant changes reported in results between 11 March (V10)
and 28 April (V11) 2022. In the case of e.g. the number of households benefiting from
the RWHTs in Rwanda, the reported result in V11 seems rather to reflect the target.

44
After each quantitative table, the W4V achievements are summarized in text, based on
this external qualitative evaluation by Aidenvironment. As the assignment of
Aidenvironment was not to check the quantitative data by W4V (and as these data came
in too late to be checked anyway), the quantitative tables (by W4V) and the qualitative
texts (by Aidenvironment) sometimes contradict each other.
4.2. Three countries
In the following tables, the data (as received from W4V) are added for the three
countries (by Aidenvironment).

Indicator Description
(italic if not evaluated in draft internal evaluation)
Target Completed Activity
(italic if not reported in W4V ME Progress
Report_V10)
Unit of
measurement
Target Com-
pleted#
Com-
pleted
%
Goal: Reduced conflict through increased access to water and improved watershed management in the Virunga Area
Indicator 1 % of people living in the project area (disaggregated by age, gender and
community groups) who express that conflicts related to access to water
and watershed management have reduced
33% Construction of rainwater harvesting tanks -
community
tank 16 16 100%
Construction of rainwater harvesting tanks -
household
tank 645 660 102%
Construction of water scheme scheme 3 4 133%
Construction of PSP (Public Standpoint)/ kiosks PSP / kiosk 34 34 100%
Construction of water taps tap connected to
Bunagana scheme
8 8 100%
Rehabilitation of existing rainwater harvesting
tanks
tank 53 53 100%
Introduce and implement PIP approach in W4V
intervention areas/ villages
PIP approach per
intervention areas
13 9 69%
Indicator 2 % of people (disaggregated by age, gender, and community groups) in the
project area who consider the project has had a positive impact on reducing
conflicts
45% Introduce the PMP approach around W4V
intervention areas/ parishes
PMP per conflict 9 9 100%
Indicator 3 % of people (disaggregated by age, gender, and community groups) in the
project area who express that the relations with the park authorities have
improved
33% Establish the advocacy communication
mechanisms between communities and PA’s
(Protected Areas)
platform for
dialogue
3 3 100%
Set up mechanisms for conflict and complaints
management around W4V intervention areas/
Parishes/ villages
mechanism per
intervention area
8 8 100%
Strengthen the advocacy communication
mechanisms between communities and PA’s
(Protected Areas)
platform for
dialogue
3 11 367%
Conduct training for PWCC and PPC in Uganda training 2 2 100%
Table 4. Targets and results of indicators and activities directly contributing to goal, for 3 countries together

46
4.2.1. Outcome 1: WASH and IWRM
Indicator Description
(italic if not evaluated in draft internal evaluation)
Target Com-
pleted
Activity
(italic if not reported in W4V ME Progress Report_V10)
Unit of measurement Target Com-
pleted #
Com-
pleted %
Outcome 1: Improved well-being and production through improved WASH and IWRM
Indicator 1a % of people men and women of the different age and community
groups who consider they are safe when accessing water (safety
at water point and along the way)
70% 89% Community accessing water household 5.949 11.565 194%
Conduct studies study per intervention
area?
6 6 100%
Indicator 1b % of households reporting increase access to water provided by
the project
40% 68% Contract constructors constructor 24 24 100%
Conduct stakeholders advocacy meetings on the water scheme meeting 24 18 75%
Indicator 1c % of households (disaggregated by age, gender, and community)
reporting increased access to water for their cattle
30% Construction of troughs trough 2 2 100%
Community accessing water for their cattle breeder 100 75 75%
Indicator 1d % change in average agricultural production at household level 10% 28% Selection and training of PIs farmer adopting PIP 8.448 2.170 26%
Scale up PIP at the village/hill level village adopting PIP 10 9 90%
Advocate to ban illegal markets to local authorities in DRC meeting 24 1 4%
Sensitize communities on farming best practices PI adhering to best
practices
3.060 842 28%
meeting / activity 24 36 150%
Select and train government technical staff and village leaders
on PIP approach
Gov. technical staff
members
45 37 82%
Farming land converted to sustainable use hectare? 100 11,4 11%
Indicator 1e Number of hectares of agricultural of farmland converted to
sustainable use
5 0 Conduct mapping of the areas map or hectare? 1.005 753,9 75%
Conduct soil scan in the area scan of field 50 144 288%
Indicator 1f % of people who consider that they are protected against flooding
and erosion
77% Initiate IWRM activities IWRM activity 3 3 100%
Planting trees and soils stabilization grasses in farmlands tree planted - grasses
included?
433.629 449.308 104%
Setting up water ponds in the fields and along the roads water pond 1.060 1.140 108%
Construct households RWHTs and water ponds to reduce
runoff
RWHTs and ponds
around it
661 661 103%
Set up demo plots for sustainable agricultural practices demo plot 5 6 120%
Set up kitchen garden person 50 17 34%
Set up nurseries and produce seedlings nursery 1 1 100%
Table 5. Targets and results of indicators and activities contributing to outcome 1, for 3 countries together

47
Indicator Description
(italic if not evaluated in draft internal evaluation)
Target Com-
pleted
Activity
(italic if not reported in W4V ME Progress
Report_V10)
Unit of measurement Target Com-
pleted #
Com-
pleted %
Output 1.1: Increased access to safe drinking water for all communities
Indicator 1.1a % of households that have at least 20 liters of safe water per day 68% 77%
Indicator 1.1b % of households that have at least 5 litters of safe water per person per day 70% 85%
Indicator 1.1c % of households that have at least access to water from a protected source
within a walking distance of 30 minutes
55% 80%
Indicator 1.1d Number of functional water facilities (disaggregated by type of facilities)
newly constructed by the project - RWHTs
67 Handover of the scheme to Local Government (LG)
/community
scheme? 3 3 100%
Number of functional water facilities (disaggregated by type of facilities)
newly constructed by the project – water schemes
1
Indicator 1.1e Number of functional of water facilities (disaggregated by type of facilities)
rehabilitated by the project
34 Identify and demarcate the cattle corridors corridor 23 15 65%
Indicator 1.1f % of households that access water from protected water sources due to
project intervention
30%
Output 1.2: Erosion control and soil fertility measures adopted/ implemented
Indicator 1.2a % of targeted households (disaggregated by locality, gender, and age) that
have adopted soil erosion control and soil fertility measures
38% Sensitize communities on protection of the
catchment/ water sources and farming best practices
on the hills
PI adhering to best
practices
524 878 168%
Indicator 1.2b Number of hectares rehabilitated by the community (disaggregated by
areas) as a result of adoption of best practices demonstrated
5 (in Résultats obtenus comparés aux prévisions
V2.pdf)
hectare 5 631,1 +/-
infinite
Table 6. Targets and results of indicators and activities contributing to outcome 1, for 3 countries together - continued
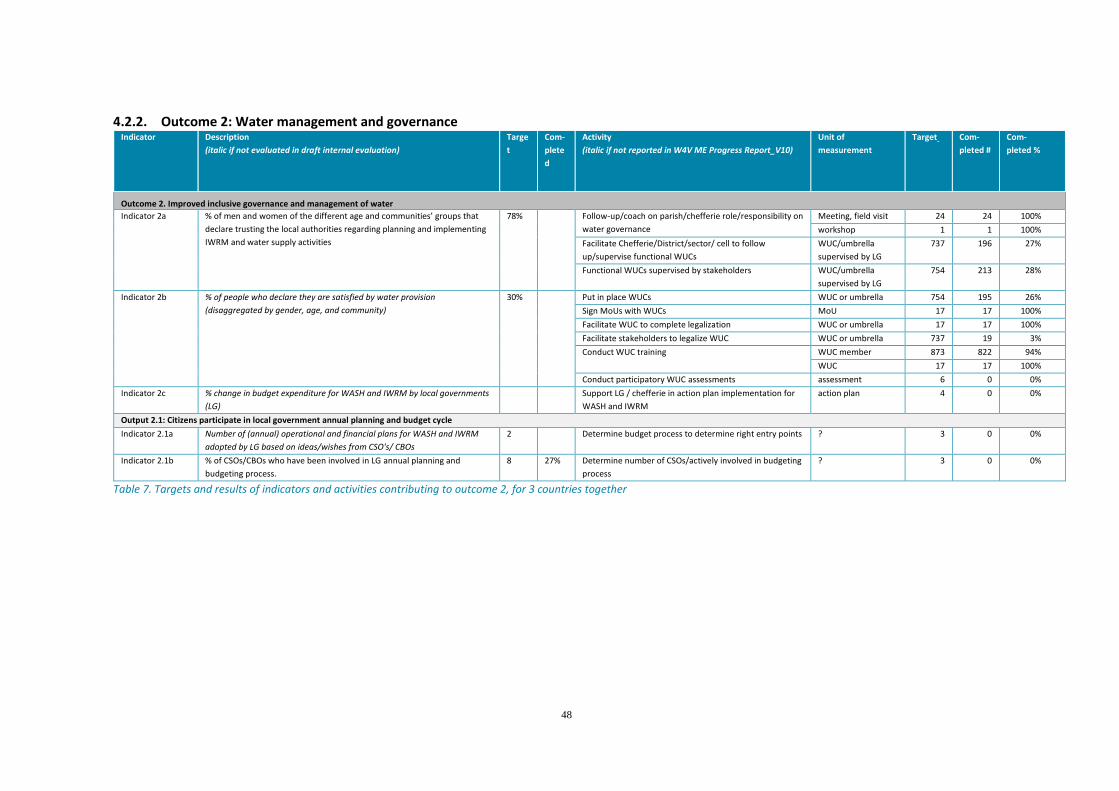
48
4.2.2. Outcome 2: Water management and governance Indicator Description
(italic if not evaluated in draft internal evaluation)
Targe
t
Com-
plete
d
Activity
(italic if not reported in W4V ME Progress Report_V10)
Unit of
measurement
Target Com-
pleted #
Com-
pleted %
Outcome 2. Improved inclusive governance and management of water
Indicator 2a % of men and women of the different age and communities’ groups that
declare trusting the local authorities regarding planning and implementing
IWRM and water supply activities
78% Follow-up/coach on parish/chefferie role/responsibility on
water governance
Meeting, field visit 24 24 100%
workshop 1 1 100%
Facilitate Chefferie/District/sector/ cell to follow
up/supervise functional WUCs
WUC/umbrella
supervised by LG
737 196 27%
Functional WUCs supervised by stakeholders WUC/umbrella
supervised by LG
754 213 28%
Indicator 2b % of people who declare they are satisfied by water provision
(disaggregated by gender, age, and community)
30% Put in place WUCs WUC or umbrella 754 195 26%
Sign MoUs with WUCs MoU 17 17 100%
Facilitate WUC to complete legalization WUC or umbrella 17 17 100%
Facilitate stakeholders to legalize WUC WUC or umbrella 737 19 3%
Conduct WUC training WUC member 873 822 94%
WUC 17 17 100%
Conduct participatory WUC assessments assessment 6 0 0%
Indicator 2c % change in budget expenditure for WASH and IWRM by local governments
(LG)
Support LG / chefferie in action plan implementation for
WASH and IWRM
action plan 4 0 0%
Output 2.1: Citizens participate in local government annual planning and budget cycle
Indicator 2.1a Number of (annual) operational and financial plans for WASH and IWRM
adopted by LG based on ideas/wishes from CSO's/ CBOs
2 Determine budget process to determine right entry points ? 3 0 0%
Indicator 2.1b % of CSOs/CBOs who have been involved in LG annual planning and
budgeting process.
8 27% Determine number of CSOs/actively involved in budgeting
process
? 3 0 0%
Table 7. Targets and results of indicators and activities contributing to outcome 2, for 3 countries together

49
Indicator Description
(italic if not evaluated in draft internal evaluation)
Target Com-
pleted
Activity
(italic if not reported in W4V ME Progress Report_V10)
Unit of
measurement
Target Com-
pleted #
Com-
pleted %
Output 2.2: Improved and transparent functional relations between consumers, services providers, and LG (for water service delivery and IWRM)
Indicator 2.2a % of households (disaggregated by different community) who
consistently pay for the water supply services
70% 51% Conduct meeting with WUC/stakeholders to set up
mechanisms for cost recovery
meeting 8 4 50%
Support WUC / stakeholders in facilitating communities
to agree on water cost
amount of water
cost agreed?
2 0 0%
Establish VSLA VSLA 19 1 5%
Field visits with stakeholders to prepare communities
on paying / agreed amount
field visit 60 35 58%
W4V accompany stakeholders to monitor WSP/WUC on
payment /agreed amount
monitoring visit 60 42 70%
Support WSP/WUC to put in place fin. management,
accountability mechanisms
WSP/WUC/VSLA
with mechanisms
754 18 2%
Indicator 2.2b % of households (disaggregated by, different community) who attend
meetings with LG and service providers on water and watershed
management
80% 92% Engage LG to put water/shed management issues on
agenda of community meetings
Watershed issue on
LG agenda
3 2,5 83%
Engage WSP/WUC to conduct meetings with
communities on water related issues
meeting of WUC
with community
43 43 100%
Conduct community awareness to attend watershed
management meetings
meeting 43 43 100%
Set up PWCC PWCC 3 3 100%
Indicator 2.2c % of recommendations made by WUCs, WSPs adopted by LG annually
due to project intervention
40% Follow up on recommendations made during
community meetings with WSP, LG
recommendations
implemented
12 9 75%
Output 2.3: Support the development of IWRM plan and investment plan by Districts/ chefferies/ Parishes
Indicator 2.3a number of Districts/ Chefferies with IWRM plan with budgets Advocate for IWRM plans, budgets Parish with plan 4 0 0%
Output 2.4: Water user’s committee and Service provider functional
Indicator 2.4a % of water user’s committee who effectively manage their water points 70%
Indicator 2.4b % of men and women of the different age and community groups in the
water committees
53% Female inclusion in WUC number or %? 445,5 283 64%
Male inclusion in WUC number or %? 444,5 283 64%
>= 35 years inclusion in WUC number or %? 437 4 1%
<35 years inclusion in WUC number or %? 436 4 1%
Minority group inclusion in WUC member 76 76 100%
Majority group inclusion in WUC member 681 0 0%
Indicator 2.4c % of WUCs that has up to date records accessible by members 47% Follow-up of availability notebooks WUC + notebook 754 213 28%
Table 8. Targets and results of indicators and activities contributing to outcome 2, for 3 countries together - continued
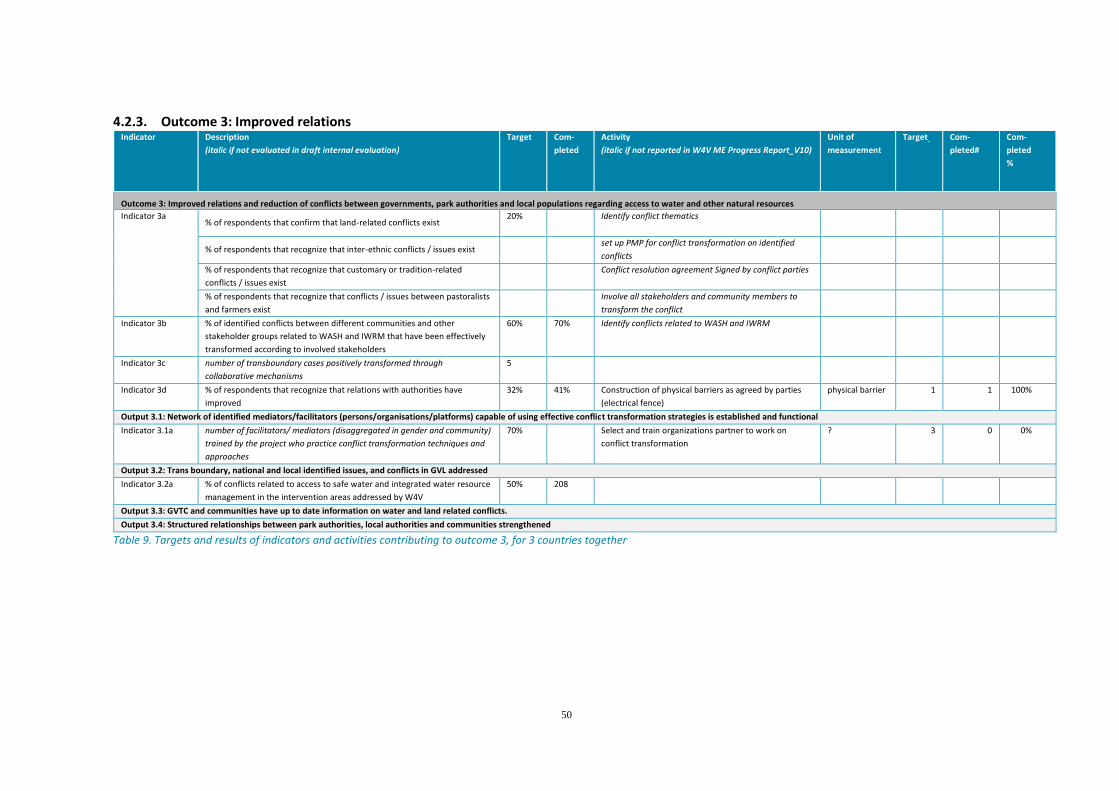
50
4.2.3. Outcome 3: Improved relations Indicator Description
(italic if not evaluated in draft internal evaluation)
Target Com-
pleted
Activity
(italic if not reported in W4V ME Progress Report_V10)
Unit of
measurement
Target Com-
pleted#
Com-
pleted
%
Outcome 3: Improved relations and reduction of conflicts between governments, park authorities and local populations regarding access to water and other natural resources
Indicator 3a % of respondents that confirm that land-related conflicts exist
20% Identify conflict thematics
% of respondents that recognize that inter-ethnic conflicts / issues exist set up PMP for conflict transformation on identified
conflicts
% of respondents that recognize that customary or tradition-related
conflicts / issues exist
Conflict resolution agreement Signed by conflict parties
% of respondents that recognize that conflicts / issues between pastoralists
and farmers exist
Involve all stakeholders and community members to
transform the conflict
Indicator 3b % of identified conflicts between different communities and other
stakeholder groups related to WASH and IWRM that have been effectively
transformed according to involved stakeholders
60% 70% Identify conflicts related to WASH and IWRM
Indicator 3c number of transboundary cases positively transformed through
collaborative mechanisms
5
Indicator 3d % of respondents that recognize that relations with authorities have
improved
32% 41% Construction of physical barriers as agreed by parties
(electrical fence)
physical barrier
1 1 100%
Output 3.1: Network of identified mediators/facilitators (persons/organisations/platforms) capable of using effective conflict transformation strategies is established and functional
Indicator 3.1a number of facilitators/ mediators (disaggregated in gender and community)
trained by the project who practice conflict transformation techniques and
approaches
70% Select and train organizations partner to work on
conflict transformation
?
3 0 0%
Output 3.2: Trans boundary, national and local identified issues, and conflicts in GVL addressed
Indicator 3.2a % of conflicts related to access to safe water and integrated water resource
management in the intervention areas addressed by W4V
50% 208
Output 3.3: GVTC and communities have up to date information on water and land related conflicts.
Output 3.4: Structured relationships between park authorities, local authorities and communities strengthened
Table 9. Targets and results of indicators and activities contributing to outcome 3, for 3 countries together

(Mentioned here, as GVTC is active in the three countries:)
Output 3.3: GVTC and communities have up to date information on water and land related conflicts. GVTC has a centre of excellence (supported by Dutch funding), which shares data and
information (physically and virtually), mediates between the district, W4V and other
parties when there were conflicts, and provided back up (organizing and inviting
stakeholders) in negotiations. GVTC’s last human-wildlife transboundary workshop was
held in March 2019). Recently, when a flood hit one of the water booster stations in
Uganda, the district informed GVTC and it coordinated the search for solutions. No
reports on the achievements of the GVTC centre of excellence were received.
4.3. DRC
The project achievements were gathered from observations during field visits,
interviews with the different stakeholders, FGD, and household surveys. The latter were
carried out in the project areas of Jomba, Rugari, Kibumba and Kisigari and control areas
were chosen in Jomba and Kisigari to understand the impact of the project. A total of 46
beneficiaries and 20 control individuals were surveyed across the different
groupements.

Indicator Description
(italic if not evaluated in draft internal evaluation)
Target Com-
pleted
Activity
(italic if not reported in W4V ME Progress Report_V10)
Unit of
measurement
Target Com-
pleted#
Com-
pleted %
Goal: Reduced conflict through increased access to water and improved watershed management in the Virunga Area
Indicator 1 % of people living in the project area (disaggregated by age, gender and
community groups) who express that conflicts related to access to water
and watershed management have reduced
0% Construction of rainwater harvesting tanks - community tank 2 2 100%
Construction of rainwater harvesting tanks - household tank 85 85 100%
Construction of water scheme scheme 2 3 150%
Construction of PSP (Public Standpoint)/ kiosks PSP / kiosk
Construction of water taps tap connected to
Bunagana scheme
8 8 100%
Rehabilitation of existing rainwater harvesting tanks tank 53 53 100%
Introduce and implement PIP approach in W4V
intervention areas/ villages
PIP approach per
intervention areas
5 5 100%
Indicator 2 % of people (disaggregated by age, gender, and community groups) in
the project area who consider the project has had a positive impact on
reducing conflicts
45% Introduce the PMP approach around W4V intervention
areas/ parishes
PMP per conflict 6 6 100%
Indicator 3 % of people (disaggregated by age, gender, and community groups) in
the project area who express that the relations with the park authorities
have improved
0% Establish the advocacy communication mechanisms
between communities and PA’s (Protected Areas)
platform for
dialogue
1 1 100%
Set up mechanisms for conflict and complaints
management around W4V intervention areas/
Parishes/ villages
mechanism per
intervention area
5 5 100%
Strengthen the advocacy communication mechanisms
between communities and PA’s (Protected Areas)
platform for
dialogue
1 9 900%
Conduct training for PWCC and PPC in Uganda training
Table 10. Targets and results of indicators and activities directly contributing to goal, for DRC

53
4.3.1. Outcome 1: WASH and IWRM Indicator Description
(italic if not evaluated in draft internal evaluation)
Targe
t
Com-
pleted
Activity
(italic if not reported in W4V ME Progress Report_V10)
Unit of measurement Target Com-
pleted #
Com-
pleted
%
Outcome 1: Improved well-being and production through improved WASH and IWRM
Indicator 1a % of people men and women of the different age and community
groups who consider they are safe when accessing water (safety at
water point and along the way)
60% 83% Community accessing water household 2.149 3.565 100%
Conduct studies study per intervention
area?
3 3 100%
Indicator 1b % of households reporting increase access to water provided by the
project
40% 46% Contract constructors constructor 8 8 100%
Conduct stakeholders advocacy meetings on the water
scheme
meeting
Indicator 1c % of households (disaggregated by age, gender, and community)
reporting increased access to water for their cattle
40% Construction of troughs trough 2 2 100%
Community accessing water for their cattle breeder 100 75 75%
Indicator 1d % change in average agricultural production at household level 10% 21% Selection and training of PIs farmer adopting PIP 2.688 1778 66%
Scale up PIP at the village/hill level village adopting PIP 5 5 100%
Advocate to ban illegal markets to local authorities in DRC meeting 24 1 4%
Sensitize communities on farming best practices PI adhering to best
practices
meeting / activity 24 36 150%
Select and train government technical staff and village
leaders on PIP approach
Gov. technical staff
members
20 12 60%
Farming land converted to sustainable use hectare?
Indicator 1e Number of hectares of agricultural of farmland converted to
sustainable use
5 Conduct mapping of the areas map or hectare? 1000 750 75%
Conduct soil scan in the area scan of field 10 69 690%
Indicator 1f % of people who consider that they are protected against flooding and
erosion
65% Initiate IWRM activities IWRM activity 1 1 100%
Planting trees and soils stabilization grasses in farmlands tree planted - grasses
included?
5.584 8.477 152%
Setting up water ponds in the fields and along the roads water pond 500 500 100%
Construct households RWHTs and water ponds to reduce
runoff
RWHTs and ponds around
it
87 87 100%
Set up demo plots for sustainable agricultural practices demo plot
Set up kitchen garden person
Set up nurseries and produce seedlings nurseries 1 1 100%
Table 11. Targets and results of indicators and activities contributing to outcome 1, for DRC

54
Figure 4. PIs presenting their goal for their farm (DRC)

55
Indicator Description
(italic if not evaluated in draft internal evaluation)
Target Com-
pleted
Activity
(italic if not reported in W4V ME Progress Report_V10)
Unit of
measurement
Target Com-
pleted #
Com-
pleted %
Output 1.1: Increased access to safe drinking water for all communities
Indicator 1.1a % of households that have at least 20 liters of safe water per day 55% 95%
Indicator 1.1b % of households that have at least 5 liters of safe water per person per
day
55% 76%
Indicator 1.1c % of households that have at least access to water from a protected
source within a walking distance of 30 minutes
45% 59%
Indicator 1.1d Number of functional water facilities (disaggregated by type of
facilities) newly constructed by the project
90 Handover of the scheme to Local Government (LG)
/community
scheme? 2 2 100%
Number of functional water facilities (disaggregated by type of
facilities) newly constructed by the project – water schemes
0
Indicator 1.1e Number of functional of water facilities (disaggregated by type of
facilities) rehabilitated by the project
103 Identify and demarcate the cattle corridors corridor 23 15 65%
Indicator 1.1f % of households that access water from protected water sources due
to project intervention
40%
Output 1.2: Erosion control and soil fertility measures adopted/ implemented
Indicator 1.2a % of targeted households (disaggregated by locality, gender, and age)
that have adopted soil erosion control and soil fertility measures
35% Sensitize communities on protection of the catchment/
water sources and farming best practices on the hills
PI adhering to
best practices
2 3 150%
Indicator 1.2b Number of hectares rehabilitated by the community (disaggregated by
areas) as a result of adoption of best practices demonstrated
5 (in Résultats obtenus comparés aux prévisions V2.pdf) hectare 0 624 infinite
Table 12. Targets and results of indicators and activities contributing to outcome 1, for DRC - continued

Output 1.1: Increased access to safe drinking water for all communities Water access has improved both for domestic and livestock purposes. The percentage
of households that have at least 20 liters of safe water per day has grown from 43,3%
(baseline) to 94,6% (internal evaluation). Community and household tanks were built for
villages located in the hills and a 23 km long gravity flow connection between the uphill
and downhill populations was created to improve the distribution of the water
(interview). Kamira 3 and two small supply schemes were also developed, and the
system towards Kibumba is under construction. W4V has also rehabilitated 53 rainwater
harvesting systems (constructed by e.g., Caritas), each with a 5m³ tank. In the case of
repairs by a project, the question pops up, why these repairs were not done by the users
/ owners themselves before. This can be explained by the absence of WMCs formed by
previous water supply projects, the low level of community organisation, the financial
difficulties experienced by the chiefdom and the lack of plumbing experts in the area. It
can be expected that these problems will reoccur in the future when the tanks start to
develop new issues.
In the beginning (of the project), in Jomba (Bwisha), the National Park caused heavy
runoff in DRC therefore threatening the constructed water scheme (constructed by Fond
de Consolidation pour la Paix), which was about to break. W4V therefore rehabilitated
the scheme and protected it from erosion, for the town of Bunagana to still have
continuous water supply. The ASUREP Bunagana (managing the scheme) contributed to
this. Nowadays, the issue of the lack of water is only felt during the dry season by the
villagers that do not have access to tap stands. Rainwater is used for domestic purposes
such as cooking, washing, and bathing, and some households also use it for drinking
(after boiling). In the dry season, when the water stored in the tanks is exhausted,
households go to fetch water in the villages with standpipes.
Because of this increased water access, the household surveys reveal a significant
reduction in the time spent to fetch water both for domestic purposes and for the
livestock. Indeed, while most of the control group (602-803%) need to travel for over 2
hours to collect the water, only 154-185% of the beneficiaries need to travel that far
(compared to 22% from baseline study6). Most of them require less than 30 min (177-
2
60% of the respondents mentioned that they needed more than 2 hours to collect water for domestic purposes.
3 80% of the respondents mentioned that they needed more than 2 hours to collect water for livestock purposes.
4 15% of the respondents mentioned that they needed more than 2 hours to collect water for domestic purposes.
5 18% of the respondents mentioned that they needed more than 2 hours to collect water for livestock purposes.
6 The baseline study provided data regarding the distance to both protected and non-protected water source. Here, only the data regarding protected
water point are provided.
7 17% of the respondents mentioned that they needed less than 30min to collect water for livestock purposes.

57
578% vs 36% in baseline study) or between 30 min to 1 h our (159-4610% vs 19% in baseline
study).
Figure 5. Left: RWHT (DRC). Right: tap stand (DRC)
Output 1.2: Erosion control and soil fertility measures implemented The PIP approach allowed to tackle the issue of the water runoff. Several techniques
were promoted such as contour line bunds, trenches, techniques to till on hill slopes
(fanya chini, fanya juu), and anti-erosion hedges (Figure 6. Erosion control measures
(DRC)
The trenches are dug and managed communally (interview). After heavy rain events, a
committee of 12-15 people targeting watershed management at the scale of the village
inspected the trenches and managed them. Moreover, herbs (Pennisetum purpureum)
and trees were planted along these trenches to further prevent the water runoff. Both
can also be used as fodder for livestock production.
8
57% of the respondents mentioned that they needed less than 30min to collect water for domestic purposes
9 15% of the respondents mentioned that they needed between 30min and 1 hour to collect water for domestic purposes
10 46% of the respondents mentioned that they needed between 30min and 1 hour to collect water for livestock purposes

58
Figure 6. Erosion control measures (DRC)
These runoff control techniques seem to have proven successful, based on qualitative
interviews, and on the 630 ha rehabilitated farmland (as mentioned in Résultats obtenus
comparés aux prévisions v2). Only on the related activity “Planting trees and soils
stabilization grasses in farmlands,” quantitative data were collected by W4V: 8477 trees
were planted (more than the target of 5584), in the following groupements and villages
(all in Bwisha chefferie):
• Groupement Jomba: Gikoro: Musongero, Runyoni, Kariba, Katshibo, Runga
• Groupement Bweza: Mihika
• Groupement Kisigari: Shangi: Kanyamarhebe, Kanyabuchuku
On the activity “Farming land converted to sustainable use”, unfortunately, no data
were collected in DRC, which makes an objective assessment impossible. Although in
Jomba, more project beneficiaries experienced floods on their farmland in the past 2
years than the control respondents, the level of erosion was mainly mild (40%) /
moderate (60%) and while 100% of the control group experience severe erosion level
on their farmland (household surveys). In Kisigari, 10% reported severe erosion, against
60% in the control group. More detailed information on erosion was not collected.
Innovative farmers trained in the PIP approach have improved their lands. In Runyunyi
/ Jomba village, 5 innovative farmers have built plank houses and in Mihika / Bweza, 4
innovative farmers have built 4 plank houses (to live in). Also, many innovative farmers
have bought plots (fields) and cattle in the project sites.
The household surveys report an increase (not quantified) in crop production – 63% of
the beneficiaries and 45% of the control group (from Bushenge village / Groupement
Kisigari and Kabindi village / Rugamba sub-village / Groupement Jomba) report so. The
W4V Rapport PIP-aménagement 20210621.pdf mentions increases in yields (of four
crops) in DRC, with an average of 26,6% increase (kg/ha). This was an increase after

59
application of fertilizers, following advice from the soil scanner (which was not
calibrated well, see section 5.1.5). The increase in revenue has led to the purchase of
new plots, field and to the rehabilitation of houses (interview). Moreover, erosion has
reduced cases of conflict between farmers (compared to villages not benefiting from the
project’s actions).
The control group was interviewed in the villages Kabindi (Groupement Jomba) and
Bushenge (Groupement Kisigari). In Kabindi village, the population uses five taps to
access drinking water. These taps were built by the Tearfund on the Katagaifu spring and
are used by 4000 households. In case of water shortage, households use water from the
river. In this village, the NPD organized mediation under the FARM programme in case
of conflict between farmers and herders. Currently the mediation doesn’t function
anymore because of a lack of funding.
People in the control group interviewed did not mention improving yields or anti-
erosion measures (FGD).
Output 1.3: Watershed protection measures in place Regarding the livestock water demand, existing troughs were only rehabilitated by W4V.
Water access for livestock purposes remains a challenge for the population ().
Consequently, the beneficiaries need to walk long distances to access water for livestock
than water for domestic purposes (household survey). For example, the population of
Runyunyi travels to Nyarubara to fetch water.
Figure 7. Livestock trough (DRC)

4.3.2. Outcome 2: Water management and governance Indicator Description
(italic if not evaluated in draft internal evaluation)
Target Com-
pleted
Activity
(italic if not reported in W4V ME Progress Report_V10)
Unit of
measurement
Target Com-
pleted #
Com-
pleted
%
Outcome 2. Improved inclusive governance and management of water
Indicator 2a % of men and women of the different age and communities’ groups that
declare trusting the local authorities regarding planning and
implementing IWRM and water supply activities
60% 48% Follow-up/coach on parish/chefferie role/responsibility on
water governance
Meeting, field visit
workshop 1 1 100%
Facilitate Chefferie/District/sector/ cell to follow
up/supervise functional WUCs
WUC/umbrella
supervised by LG
177 177 100%
Functional WUCs supervised by stakeholders WUC/umbrella
supervised by LG
177 177 100%
Indicator 2b % of people who declare they are satisfied by water provision
(disaggregated by gender, age, and community)
40% Put in place WUCs WUC or umbrella 177 159 90%
Sign MoUs with WUCs MoU
Facilitate WUC to complete legalization WUC or umbrella
Facilitate stakeholders to legalize WUC WUC or umbrella 177 0 0%
Conduct WUC training WUC member 740 803 109%
WUC
Conduct participatory WUC assessments assessment 2 0 0%
Indicator 2c % change in budget expenditure for WASH and IWRM by local
governments (LG)
Support LG / chefferie in action plan implementation for
WASH and IWRM
action plan 2 0 0%
Output 2.1: Citizens participate in local government annual planning and budget cycle
Indicator 2.1a Number of (annual) operational and financial plans for WASH and IWRM
adopted by LG based on ideas/wishes from CSO’s/ CBOs
2 Determine budget process to determine right entry points ? 1 0 0%
Indicator 2.1b % of CSOs/CBOs who have been involved in LG annual planning and
budgeting process.
20 24% Determine number of CSOs/actively involved in budgeting
process
? 1 0 0%
Table 13. Targets and results of indicators and activities contributing to outcome 2, for DRC

61
Indicator Description
(italic if not evaluated in draft internal evaluation)
Target Com-pleted Activity
(italic if not reported in W4V ME Progress Report_V10)
Unit of
measurement
Target Com-
pleted #
Com-
pleted
%
Output 2.2: Improved and transparent functional relations between consumers, services providers, and LG (for water service delivery and IWRM)
Indicator 2.2a % of households (disaggregated by different community) who
consistently pay for the water supply services
70% 39% Conduct meeting with WUC/stakeholders to set up
mechanisms for cost recovery
meeting 8 0 0%
Support WUC / stakeholders in facilitating communities to
agree on water cost
amount of water
cost agreed?
2 0 0%
Establish VSLA VSLA
Field visits with stakeholders to prepare communities on
paying / agreed amount
field visit 24 0 0%
W4V accompany stakeholders to monitor WSP/WUC on
payment /agreed amount
monitoring visit 24 12 50%
Support WSP/WUC to put in place fin. Management,
accountability mechanisms
WSP/WUC/VSLA
with mechanisms
177 0 0%
Indicator 2.2b % of households (disaggregated by, different community) who attend
meetings with LG and service providers on water and watershed
management
80% 87% Engage LG to put water/shed management issues on
agenda of community meetings
Water/shed issue on
LG agenda
1 0,5 50%
Engage WSP/WUC to conduct meetings with communities
on water related issues
meeting of WUC
with community
24 24 100%
Conduct community awareness to attend water/shed
management meetings
meeting 24 24 100%
Set up PWCC PWCC
Indicator 2.2c % of recommendations made by WUCs, WSPs adopted by LG annually
due to project intervention
40% Follow up on recommendations made during community
meetings with WSP, LG
recommendations
implemented
4 4 100%
Output 2.3: Support the development of IWRM plan and investment plan by Districts/ chefferies/ Parishes
Indicator 2.3a number of Districts/ Chefferies with IWRM plan with budgets 2 Advocate for IWRM plans, budgets Parish with plan 4 0 0%
Output 2.4: Water user’s committee and Service provider functional
Indicator 2.4a % of water user’s committee who effectively manage their water points 70%
Indicator 2.4b % of men and women of the different age and community groups in the
water committees
60%,
40%
Female inclusion in WUC number or %? 370 223 60%
Male inclusion in WUC number or %? 370 223 60%
>= 35 years inclusion in WUC number or %? 370 0 0%
<35 years inclusion in WUC number or %? 370 0 0%
Minority group inclusion in WUC member 74 74 100%
Majority group inclusion in WUC member 666 0 0%
Indicator 2.4c % of WUCs that has up to date records accessible by members 70% Follow-up of availability notebooks WUC + notebook 177 177 100%
Table 14. Targets and results of indicators and activities contributing to outcome 2, for DRC - continued

Output 2.2: Improved and transparent functional relations between consumers, services providers, and LG (for water service delivery and IWRM) From the internal evaluation it became clear that the percentage of households who
consistently pay for the water supply services (indicator 2.2a) has grown significantly.
This is confirmed by the activity “W4V accompany stakeholders to monitor WSP/WUC
on payment /agreed amount” that has been relatively successful. Most other targets in
this table have not been reached.
The internal evaluation reveals an increase in attendance to the LG meetings from 42,6%
during the baseline study to 87,3% during the endline study (internal evaluation). As
data from a control group were only gathered during the baseline study, and not during
the endline study, it is hard to attribute this increase to W4V. The members of the local
water committees include local chiefs, who regularly attend weekly water (and livestock
as well) committee meetings as members. In addition, when there are LG meetings on
water at the groupement or chiefdom levels, the water committees are often invited to
report on their activities. Furthermore, when there is a conflict over water, LGs are often
invited to mediation meetings between the conflicting parties, which strengthens the
collaboration between the WMCs and the LGs.
Despite the high participation to LG meetings, the level of trust in the local authorities
is much higher within the beneficiaries i.e., 74% of the beneficiaries have trust in the
local authorities while only 25% on the control group do so. Yet, the satisfaction of the
communities regarding the water services provided by the LG remains low (48% of the
beneficiaries and 10% of the control group are satisfied). So, this means the relations
are definitely improved but not always functional.
Output 2.3: Development of Local IWRM plan and investment plan supported According to the IWRM engineer, it was indicated that the local IWRM plans, and
investment plans were the goals and visions developed for PIP for the households and
indicated that these PIP action plans developed at household and community level were
the ones used. Without having seen these community and household plans, it can be
doubted whether these have a IWRM component which is relevant on a (sub-)
catchment scale.
Next to these household plans, an agreement (protocole d’accord, August 2020) has
been set up for the catchment of Kamira (in the Bwisha chefferie), to protect the
catchment by planting and protecting hedges. A progress report (November 2020) on
these activities shows that indeed this has led to some protection measures. This
agreement and progress report could be seen as a first step towards the development
of an IWRM plan.

63
Output 2.4: Water User’s committee and service provider functional While only 8% of the household interviewed during the baseline study reported having
a water management structure in their community, W4V introduced one water
committee per RWHTs or tap stand. These committees are composed of 5 – 7 people
(each representing one household) that oversee that the users comply with the rules
(e.g., the users respect the hours during which it is allowed to tap the water), and that
oversee the maintenance and repair. Each month, all households using the water
scheme need to contribute to 1000-2000 CDF / $ 0,5-1,0. Most households seem indeed
to pay this, although some households find it difficult to pay this contribution monthly.
It is used to pay for taps and small repairs. Only in the Jomba groupement, the collected
money is transferred to the Association des Usagers d’Eau Potable (ASUREP)
(Association of Drinking Water Users) that takes care of the maintenance of the water
schemes in the groupement. ASUREP is a governance mode, so more than one ASUREP
exist, and new organisations are being established.

4.3.3. Outcome 3: Improved relations Indicator Description
(italic if not evaluated in draft internal evaluation)
Target Com-pleted Activity
(italic if not reported in W4V ME Progress
Report_V10)
Unit of
measurement
Target Com-
pleted#
Com-
pleted
%
Outcome 3: Improved relations and reduction of conflicts between governments, park authorities and local populations regarding access to water and other natural resources
Indicator 3a % of respondents that confirm that land-related conflicts exist 20% 42% Identify conflict thematics 4 4 100%
% of respondents that recognize that inter-ethnic conflicts / issues exist 3% set up PMP for conflict transformation on
identified conflicts
20 4 20%
% of respondents that recognize that customary or tradition-related
conflicts / issues exist
11% Conflict resolution agreement Signed by
conflict parties
% of respondents that recognize that conflicts / issues between
pastoralists and farmers exist
56% Involve all stakeholders and community
members to transform the conflict
Indicator 3b % of identified conflicts between different communities and other
stakeholder groups related to WASH and IWRM that have been
effectively transformed according to involved stakeholders
60% 54% Identify conflicts related to WASH and IWRM
Indicator 3c number of transboundary cases positively transformed through
collaborative mechanisms
Indicator 3d % of respondents that recognize that relations with authorities have
improved
80 20% Construction of physical barriers as agreed by
parties (electrical fence)
physical barrier 1 0 0%
Output 3.1: Network of identified mediators/facilitators (persons/organisations/platforms) capable of using effective conflict transformation strategies is established and functional
Indicator 3.1a number of facilitators/ mediators (disaggregated in gender and
community) trained by the project who practice conflict transformation
techniques and approaches
70% Select and train organizations partner to work
on conflict transformation
? 3 0 0%
Output 3.2: Trans boundary, national and local identified issues, and conflicts in GVL addressed
Indicator 3.2a % of conflicts related to access to safe water and integrated water
resource management in the intervention areas addressed by W4V
50% 208
Output 3.3: GVTC and communities have up to date information on water and land related conflicts.
Output 3.4: Structured relationships between park authorities, local authorities and communities strengthened
Table 15. Targets and results of indicators and activities contributing to outcome 3, for DRC

Output 3.1: Network of identified mediators/facilitators (persons / organisations / platforms) capable of using effective conflict transformation strategies is established The PMPs are volunteer-based mechanisms for local conflict mediation. The PMP
approach has been implemented in DRC, mainly in Kibumba, Jomba and Kisigari
groupements. 5 CLCD and 1 CGCD group were trained (covering 76 community
members). In 5 groupements, 8 groups (covering 80 community members) have been
trained in the PMP approach and when conflicts arise, they are asked to lead mediation
sessions in their villages, which strengthens their groups. In turn, members trained in
the PMP approach also go on to train others in the village.
The PMP members are now taking part in the village conflict resolution and are asked
by the local conflicts resolution structures to train local mediators.
W4V has enabled the transformation of conflicts, which refers not only to the solving of
the problem, but to the removal of its root cause as well. Regarding the number of
conflicts transformed (in DRC), W4V provided (separately) the following data:
Kind of conflict Conflict around # of conflicts # of people involved
Water related Management of water tanks 3 355
Destruction of pipes 4 105
Crop related Destruction of crops (individuals) 153 430
Destruction of crops (collective) 1 108
Plot boundary
related
Disputes on boundaries (erosion) 201 1006
Park-people Incursion of wildlife on plots
People entering the park
1
(whole region)
54.200
Table 16. Number of conflicts transformed, based on W4V e-mail March 2022
Numerous conflicts were referred to the existing NPD platforms / structures operational
in all groupements of DRC. No issues were referred to the police / court, and thus were
arranged amicably.
Output 3.2: Transboundary, national, and local identified issues and conflict in GVL addressed The general trends, of less reported conflicts and a reduction in conflicts, is confirmed
by the local authorities who identified a reduction of conflicts with the local
communities in the Mikeno sector. This has been achieved through the support of W4V
in fostering discussion between the park authorities and the communities (interview).
These discussions led to the implementation of the already existing agreement to let
communities enter the park on a weekly basis (fixed appointments). They are allowed
(guided and controlled) to enter for other natural resources (dead wood, mushrooms,
herbs). During these visits water collection is not permitted anymore as water is
available now outside the park. This is an improvement as compared to the situation

66
before, when people went into the park in an uncontrolled way. Consequently, the
number of illegal entrances within the parc have decreased within the time span of the
project (76% of the beneficiaries and 74% of the control group agree). Interviewed park
officials acknowledged that households hardly fetch water from the park.
After the relationship between W4V and ICCN improved, ICCN agreed with the
establishment of park-community committees. Earlier, they did not like the idea,
because they were concerned that it would only lead to more complaints.
A decrease in the human-wildlife conflicts has also been noted thanks to the
implementation of the electrical fence, further improving the relationship between the
park authorities and the communities (interviews).
The PIP approach is said to improve relations within households. Wives and husbands
plan together the priorities for the households and tensions are said to be avoided.
Household unity has been reinforced by the PIP approach: women are involved by their
husbands in the development of action plans. It is beyond the scope of the evaluation
to really ascertain how the PIP improved relations between husband and wife. The fact
that this story is repeated so literally by the respondents all the time makes us suspicious
people are repeating what they have heard. However., the Bwisha chefferie mentioned
that since PIP has been introduced, the households no longer complain at the chefferie
nor at the local police. Behaviour change may be reported (by different individuals)
during a project, but it is hard to predict whether this change will be sustainable.
Output 3.3: GVTC and communities have up to date information on water and land related conflicts. See section 2.3.
Output 3.4: Structured relationships between park authorities, local authorities and communities strengthened Prior to W4V, there was a climate of mistrust between the Virunga National Park
authorities, communities and LG in the Mikeno Sector and several threats to the park's
biodiversity were reported. W4V has largely reduced these conflicts:
Next to the improved drinking water supply (by W4V), the park authorities have given
permission to (weekly) tap water sources within the park. The communities have
recognised this contribution to solving their problem of lack of drinking water.
Following the PMP approach, structures (Conservation and Development Committee /
CCD / CLCD / CGCD) to channel the demands of local communities towards the park are
now being set up in the five Mikeno Sector Groups surrounding the park.
The constructed electrical fence prevents animals coming from the park to devastate
the farmers' fields.

67
Output 3.5: Inter-government agreements on trans-border water delivery and management prepared There has been an attempt to work on the trans-border water delivery in Kibumba.
However, the attempts were unsuccessful because of the complicated legal
environments in both the DRC and Rwanda. It was then agreed that this was no feasible
option.
4.4. Rwanda
The project achievements were gathered from observation during field visit, interviews
with the different stakeholders, FGD, and household surveys. The latter were carried out
in the project areas of Burera, Nyabihu and Rubavu to understand the impact of the
project. A total of 30 beneficiaries were surveyed across the different districts.

Indicator Description
(italic if not evaluated in draft internal evaluation)
Target Com-pleted Activity
(italic if not reported in W4V ME Progress
Report_V10)
Unit of
measurement
Target Com-
pleted#
Com-
pleted
%
Goal: Reduced conflict through increased access to water and improved watershed management in the Virunga Area
Indicator 1 % of people living in the project area (disaggregated by age, gender and
community groups) who express that conflicts related to access to water
and watershed management have reduced
50% Construction of rainwater harvesting tanks -
community
tank
Construction of rainwater harvesting tanks -
household
tank 560 575 103%
Construction of water scheme scheme
Construction of PSP (Public Standpoint)/ kiosks PSP / kiosk
Construction of water taps tap connected to
Bunagana scheme
Rehabilitation of existing rainwater harvesting tanks tank
Introduce and implement PIP approach in W4V
intervention areas/ villages
PIP approach per
intervention areas
2 2 100%
Indicator 2 % of people (disaggregated by age, gender, and community groups) in the
project area who consider the project has had a positive impact on reducing
conflicts
45% Introduce the PMP approach around W4V
intervention areas/ parishes
PMP per conflict
Indicator 3 % of people (disaggregated by age, gender, and community groups) in the
project area who express that the relations with the park authorities have
improved
50% Establish the advocacy communication mechanisms
between communities and PA’s (Protected Areas)
platform for
dialogue
1 1 100%
Set up mechanisms for conflict and complaints
management around W4V intervention areas/
Parishes/ villages
mechanism per
intervention area
Strengthen the advocacy communication
mechanisms between communities and PA’s
(Protected Areas)
platform for
dialogue
1 1 100%
Conduct training for PWCC and PPC in Uganda training
Table 17. Targets and results of indicators and activities directly contributing to goal, for Rwanda

69
4.4.1. Outcome 1: WASH and IWRM Indicator Description
(italic if not evaluated in draft internal evaluation)
Target Com-
pleted
Activity
(italic if not reported in W4V ME Progress Report_V10)
Unit of
measurement
Target Com-
pleted #
Com-
pleted
%
Outcome 1: Improved well-being and production through improved WASH and IWRM
Indicator 1a % of people men and women of the different age and community
groups who consider they are safe when accessing water (safety at
water point and along the way)
80% 90% Community accessing water household 2.800 2800 100%
Conduct studies study per
intervention area?
1 1 100%
Indicator 1b % of households reporting increase access to water provided by the
project
40% 77% Contract constructors constructor 8 8 100%
Conduct stakeholders advocacy meetings on the water
scheme
meeting
Indicator 1c % of households (disaggregated by age, gender, and community)
reporting increased access to water for their cattle
10% Construction of troughs trough
Community accessing water for their cattle breeder
Indicator 1d % change in average agricultural production at household level 10% 40% Selection and training of PIs farmer adopting PIP 3.200 50 2%
Scale up PIP at the village/hill level village adopting PIP 2 2 100%
Advocate to ban illegal markets to local authorities in
DRC
meeting
Sensitize communities on farming best practices PI adhering to best
practices
500 500 100%
meeting / activity
Select and train government technical staff and village
leaders on PIP approach
Gov. technical staff
members
15 15 100%
Farming land converted to sustainable use hectare? 100 11,4 11%
Indicator 1e Number of hectares of agricultural of farmland converted to
sustainable use
5 Conduct mapping of the areas map or hectare?
Conduct soil scan in the area scan of field 40 18 45%
Indicator 1f % of people who consider that they are protected against flooding
and erosion
95% Initiate IWRM activities IWRM activity 1 1 100%
Planting trees and soils stabilization grasses in
farmlands
tree planted -
grasses included?
428.045 440.831 103%
Setting up water ponds in the fields and along the roads water pond 560 640 114%
Construct households RWHTs and water ponds to
reduce runoff
RWHTs and ponds
around it
560 560 100%
Set up demo plots for sustainable agricultural practices demo plot 2 3 150%
Set up kitchen garden person
Table 18. Targets and results of indicators and activities contributing to outcome 1, for Rwanda

70
Indicator Description
(italic if not evaluated in draft internal evaluation)
Target Com-pleted Activity
(italic if not reported in W4V ME Progress Report_V10)
Unit of
measurement
Target Com-
pleted #
Com-
pleted
%
Output 1.1: Increased access to safe drinking water for all communities
Indicator 1.1a % of households that have at least 20 liters of safe water per day 75% 92%
Indicator 1.1b % of households that have at least 5 liters of safe water per person per
day
75% 96%
Indicator 1.1c % of households that have at least access to water from a protected
source within a walking distance of 30 minutes
60% 87%
Indicator 1.1d Number of functional water facilities (disaggregated by type of
facilities) newly constructed by the project
100 Handover of the scheme to Local Government (LG)
/community
scheme?
Number of functional water facilities (disaggregated by type of
facilities) newly constructed by the project – water schemes
2
Indicator 1.1e Number of functional of water facilities (disaggregated by type of
facilities) rehabilitated by the project
0 Identify and demarcate the cattle corridors corridor
Indicator 1.1f % of households that access water from protected water sources due
to project intervention
10%
Output 1.2: Erosion control and soil fertility measures adopted/ implemented
Indicator 1.2a % of targeted households (disaggregated by locality, gender, and age)
that have adopted soil erosion control and soil fertility measures
40% Sensitize communities on protection of the catchment/
water sources and farming best practices on the hills
PI adhering to
best practices
500 500 100%
Indicator 1.2b Number of hectares rehabilitated by the community (disaggregated by
areas) as a result of adoption of best practices demonstrated
5
Table 19. Targets and results of indicators and activities contributing to outcome 1, for Rwanda - continued

Output 1.1: Increased access to safe drinking water for all communities Water access for domestic use has increased through the implementation of RWHTs
in the four districts of interventions, which decreased the entrance in the park. The
percentage of households that have at least 20 liters of safe water per day has grown
from 63,3% (baseline) to 91,6% (internal evaluation). It needs to be noted, that
during the baseline survey, Indicator 1.1b was defined as % of households
(disaggregated by community groups) that have at least 10 liters of safe water per
person per day, while during the endline survey / internal evaluation, it was defined
as: % of households (disaggregated by community groups) that have at least 5 liters
of safe water per person per day.
The household survey indicates that the access to water is covering most of the
intervention area as 10011% and 9712% of the surveyed beneficiaries (compared to 54%
of the respondents from the baseline study) need to walk less than 30 min for a distance
of less than 1 km for domestic and livestock purposes respectively. Because of the
increase in water access, the KII in Cyanika and Bugeshi sectors mentioned that the
children had more time to go to school. Another consequence of the increased water
access is the saving of money otherwise used to buy several jerrycans for both domestic
and livestock purposes. The story that children go to school could not be confirmed
because the evaluators were only in the field for a few days.
Regarding the tanks constructed in Bugeshi, the beneficiaries are already making a lot
of repairs and the leakages are not stopping. The beneficiaries were already having
concerns on how they will manage the continuing leakage issues and tap breakages. As
the RWHT construction started in Bugeshi, lessons were learnt and improvements in the
design were made for the other areas. These tanks were not reinforced, and transport
uphill could have damaged the tanks as well (the volcanic eruption in 2021 was not the
cause). More so, the tanks, especially in Bugeshi, do not have an overflow drainage area.
It was actually noted during FGD with the WMC in Nsherima, Bugeshi that during rain
events, the tank overflows and floods the surrounding area. They were requesting for
help with this challenge as then still runoff is generated. This help could be really easy
by making infiltration trenches but apparently the people lack the initiative, knowledge
or ownership to do this
Output 1.2: Erosion control and soil fertility measures implemented The issue of attribution of erosion control and soil fertility measures was a difficult one:
in the districts visited, there was no clear difference between the interventions carried
out by the project beneficiaries and those done by non project beneficiaries. The
beneficiaries in Bugeshi explained that before the project, they did erosion control
11
100% of the respondents need less than 30min to collect a 20-liter jerrycan for domestic purposes
12 97% of the respondents need less than 30min to collect water for livestock purposes

72
measures because the LG wanted them to do so, without knowing their use. Since W4V
they started to understand what the use of these measures was. W4V, after discussions
with various persons and LG on the desired and functional measures to improve the land
and water conservation situation in the area, consensus was reached, and an action plan
made. After a shared inventory, the locations where intervention would take place were
fixed. So, in this case, W4V and LG have reinforced each other’s efforts.
This was less the case with the soil fertilizers, of which the beneficiaries could not explain
the use as the project made fertilizer available.
Land restoration measures such as drainage channel using stones, agroforestry, and
grass strips – which can be used as livestock feed – were introduced in all sectors of
implementation. The agroforestry measures were introduced to slow down water runoff
during the rainy season, which have been indicated as a successful measure by the social
development officer in Nsherima cell. Regarding the Alnus trees in figure 8: This area
was not cultivated before due to erosion from uphill areas that would destroy the crops.
The estimated age of these trees is 1.5 to 2 years, which was confirmed by the
landowner, and is realistic as Alnus grows at an average rate of 2 feet per year, and the
soil conditions are favourable
Figure 8. Left: Alnus trees planted along drainage channel (Kamiro village, Nyabihu district, Rwanda). Right: Close up
In Rwanda, over 85% of the survey respondents noted an increase in their yield over the
past 3 years. This will most likely be due to land conservation measures introduced
rather than to the water provided by the RWHTs, which is only occasionally (in Bugeshi)
used for irrigation of the Irish potato field. In addition, trainings on composting and on
fertilizer and pesticide use were given through the PIP approach, after which the use of
pesticides has increased. No mention was made of a potato project (funded by the Dutch
embassy), and possible changes in the use of pesticides.

73
Output 1.3: Watershed protection measures in place The government of Rwanda enforced strict regulation regarding livestock so that the
livestock is zero grazed.

4.4.2. Outcome 2: Water management and governance Indicator Description
(italic if not evaluated in draft internal evaluation)
Target Com-
pleted
Activity
(italic if not reported in W4V ME Progress Report_V10)
Unit of measurement Target Com-
pleted #
Com-
pleted
%
Outcome 2. Improved inclusive governance and management of water
Indicator 2a % of men and women of the different age and communities’ groups
that declare trusting the local authorities regarding planning and
implementing IWRM and water supply activities
95% 46% Follow-up/coach on parish/chefferie role/responsibility
on water governance
Meeting, field visit
workshop
Facilitate Chefferie/District/sector/ cell to follow
up/supervise functional WUCs
WUC/umbrella supervised
by LG
560 19 3%
Functional WUCs supervised by stakeholders WUC/umbrella supervised
by LG
560 19 3%
Indicator 2b % of people who declare they are satisfied by water provision
(disaggregated by gender, age, and community)
10% Put in place WUCs WUC or umbrella 560 19 3%
Sign MoUs with WUCs MoU
Facilitate WUC to complete legalization WUC or umbrella
Facilitate stakeholders to legalize WUC WUC or umbrella 560 19 3%
Conduct WUC training WUC member 133 19 14%
WUC
Conduct participatory WUC assessments assessment 2 0 0%
Indicator 2c % change in budget expenditure for WASH and IWRM by local
governments (LG)
Support LG / chefferie in action plan implementation
for WASH and IWRM
action plan
Output 2.1: Citizens participate in local government annual planning and budget cycle
Indicator 2.1a Number of (annual) operational and financial plans for WASH and
IWRM adopted by LG based on ideas/wishes from CSO's/ CBOs
2 Determine budget process to determine right entry
points
? 1 0 0%
Indicator 2.1b % of CSOs/CBOs who have been involved in LG annual planning and
budgeting process.
2 10% Determine number of CSOs/actively involved in
budgeting process
? 1 0 0%
Table 20. Targets and results of indicators and activities contributing to outcome 2, for Rwanda

75
Indicator Description
(italic if not evaluated in draft internal evaluation)
Target Com-
pleted
Activity
(italic if not reported in W4V ME Progress
Report_V10)
Unit of measurement Target Com-
pleted #
Com-
pleted
%
Output 2.2: Improved and transparent functional relations between consumers, services providers, and LG (for water service delivery and IWRM)
Indicator 2.2a % of households (disaggregated by different community) who
consistently pay for the water supply services
70 34% Conduct meeting with WUC/stakeholders to set up
mechanisms for cost recovery
meeting
Support WUC / stakeholders in facilitating
communities to agree on water cost
amount of water cost
agreed?
Establish VSLA VSLA 19 1 5%
Field visits with stakeholders to prepare communities
on paying / agreed amount
field visit 12 12 100%
W4V accompany stakeholders to monitor WSP/WUC
on payment /agreed amount
monitoring visit 12 12 100%
Support WSP/WUC to put in place fin. management,
accountability mechanisms
WSP/WUC/VSLA with
mechanisms
560 1 0%
Indicator 2.2b % of households (disaggregated by, different community) who
attend meetings with LG and service providers on water and
watershed management
80% 98% Engage LG to put water/shed management issues on
agenda of community meetings
Water/shed issue on
LG agenda
1 1 100%
Engage WSP/WUC to conduct meetings with
communities on water related issues
meeting of WUC with
community
19 19 100%
Conduct community awareness to attend water/shed
management meetings
meeting 19 19 100%
Set up PWCC PWCC
Indicator 2.2c % of recommendations made by WUCs, WSPs adopted by LG
annually due to project intervention
40% Follow up on recommendations made during
community meetings with WSP, LG
recommendations
implemented
4 3 75%
Output 2.3: Support the development of IWRM plan and investment plan by Districts/ chefferies/ Parishes
Indicator 2.3a number of Districts/ Chefferies with IWRM plan with budgets 4 Advocate for IWRM plans, budgets Parish with plan
Output 2.4: Water user’s committee and Service provider functional
Indicator 2.4a % of water user’s committee who effectively manage their water
points
70% 133 133 100%
Indicator 2.4b % of men and women of the different age and community groups in
the water committees
50%, 50% Female inclusion in WUC number or %? 67 4 6%
Male inclusion in WUC number or %? 66 4 6%
>= 35 years inclusion in WUC number or %? 67 4 6%
<35 years inclusion in WUC number or %? 66 4 6%
Minority group inclusion in WUC member
Majority group inclusion in WUC member
Indicator 2.4c % of WUCs that has up to date records accessible by members 70% Follow-up of availability notebooks WUC + notebook 560 19 3%
Table 21. Targets and results of indicators and activities contributing to outcome 2, for Rwanda - continued

Output 2.1: Citizens participate in LG annual planning and budget cycle While during the baseline study, respondents mentioned that they did not participate
in the LG meetings regarding water services and watershed, all survey respondents
(100%) attend LG meetings since the program. Attending the LG meetings is compulsory
for every village member anyway. Since W4V, they attend because they believed that it
was through the LG that they received this project and benefit from it. It is for this reason
that even non project beneficiaries also attended the LG meetings.
Output 2.2: Improved and transparent functional relations between consumers, services providers, and LG (for water service delivery and IWRM) The internal evaluation reveals an increase in attendance to the LG meetings from 48,6%
during the baseline study to 98,1% during the endline study (internal evaluation).
Although 93% of the respondents trust their LG regarding the planning and the
implementation of IWRM and water supply activities in their community, only 7% are
satisfied of the provided water services. This is not attributed to the project, as the LG
planning and operation system is very organised with or without external support.
Output 2.3: Development of Local IWRM plan and investment plan supported
No IWRM plans have been developed, but elements of IWRM have been implemented,
and plans developed to mitigate landslides. RWHTs were thought to contribute to the
reduction of runoff and flooding and constructed in a way to contribute to this
reduction. As the soak pits observed were not placed in a way to collect the overflowing
water from the top of the RWHTs, this will not contribute much to the reduction of
runoff and flooding, even though the water from the RWHTs is used, especially in the
rainy season (as in the dry season they are quickly emptied). See section 5.1.3 for more
information on the usefulness of the soak pits.
Output 2.4: Water User’s committee and service provider functional The WMCs are composed of all households owning a RWHT (so, most of the households)
in a village. The gender balance is well respected in all WMCs. A monthly fee of 200 RWF
is collected and put in a revolving fund. These WMCs are functional in all three districts
of Burera, Nyabihu and Rubavu (Bugeshi Sector), although the records show that the
WMC in Bugeshi stopped having regular meetings in January 2021.

4.4.3. Outcome 3: Improved relations
Indicator Description
(italic if not evaluated in draft internal evaluation)
Target Com-
pleted
Activity
(italic if not reported in W4V ME Progress
Report_V10)
Unit of
measurement
Target Com-
pleted#
Com-pleted
%
Outcome 3: Improved relations and reduction of conflicts between governments, park authorities and local populations regarding access to water and other natural resources
Indicator 3a % of respondents that confirm that land-related conflicts exist Identify conflict thematics
% of respondents that recognize that inter-ethnic conflicts / issues
exist
set up PMP for conflict transformation on identified
conflicts
% of respondents that recognize that customary or tradition-related
conflicts / issues exist
Conflict resolution agreement Signed by conflict
parties
% of respondents that recognize that conflicts / issues between
pastoralists and farmers exist
Involve all stakeholders and community members to
transform the conflict
Indicator 3b % of identified conflicts between different communities and other
stakeholder groups related to WASH and IWRM that have been
effectively transformed according to involved stakeholders
81% Identify conflicts related to WASH and IWRM
Indicator 3c number of transboundary cases positively transformed through
collaborative mechanisms
Indicator 3d % of respondents that recognize that relations with authorities have
improved
10 63% Construction of physical barriers as agreed by parties
(electrical fence)
physical barrier
Output 3.1: Network of identified mediators/facilitators (persons/organisations/platforms) capable of using effective conflict transformation strategies is established and functional
Indicator 3.1a number of facilitators/ mediators (disaggregated in gender and
community) trained by the project who practice conflict
transformation techniques and approaches
Select and train organizations partner to work on
conflict transformation
?
Output 3.2: Trans boundary, national and local identified issues, and conflicts in GVL addressed
Output 3.3: GVTC and communities have up to date information on water and land related conflicts.
Output 3.4: Structured relationships between park authorities, local authorities and communities strengthened
Table 22. Targets and results of indicators and activities contributing to outcome 3, for Rwanda
78
Output 3.1: Network of identified mediators/facilitators (persons / organisations / platforms) capable of using effective conflict transformation strategies is established Such networks were not implemented in Rwanda.
Output 3.2: Transboundary, national, and local identified issues and conflict in GVL addressed Several conflicts were identified during the baseline study: 54% of respondents reported
conflicts related to water and IWRM, 27.5% of respondents identified land related
conflicts, 56% of respondents mentioned conflicts with the park authorities, and 1.6%
identified conflicts between pastoralists and farmers. The surveys showed that 100% of
the respondents believe that there has been a decrease in illegal entry in the park over
the project period. Consequently, the relationship between the communities and the
park authorities have improved. Moreover, there are two groups involved in the park
management, i.e., the conservation group and the community members. These two
groups initially believed to have competing interests. Yet, nowadays, they see each
other as partners and the animosity has been strongly reduced.
The stone walls constructed in Rwanda have reduced the crop raiding in Bugeshi but still
some animals escape the park. Crop raiding is also still happening in Burera as the wall
does not delimit the park entirely.
Output 3.3: GVTC and communities have up to date information on water and land related conflicts See section 2.3.
Output 3.4: Structured relationships between park authorities, local authorities and communities strengthened W4V has facilitated maintenance of the physical barriers (existing wall and trench), in
Burera as well. The collaboration between the communities, the local leaders, the park
authorities and the RDB were reported to have improved in Bugeshi and Nyabihu.
Tensions are still existing in Burera because crop raiding is still taking place, as about 1
km of the border is not fenced. The government is spending a lot to compensate the
communities for this (FGD and KII with sector authorities).
Furthermore, W4V strengthened the already existing commitment of the Bugeshi
villagers that are active in the small savings groups that are being registered into
cooperatives, supported by RDB in 2000.
Several MoUs were signed to create an enabling environment for the progress of the
project. To detail and ease the implementation of the project’s activities, and specifically
to manage expectations, in the four districts of intervention, W4V signed four MoUs

79
with the four districts in 2019 (RMPR October 2019). In addition, in August 2019, W4V
signed one MoU with RAB (RMPR August 2019). Another MoU was signed between
W4V, IGCP and CBOs to tackle the human wildlife conflicts. Once the discussions were
held and the content properly worded, the signing was obvious as the content was
supported on all layers in the organisations. During the lifespan of the MoU’s, at very
few moments reference was made to the MOUs to clarify upcoming cooperation issues.
Output 3.5: Inter-government agreements on trans-border water delivery and management prepared There has been an attempt to work on the trans-border water delivery in Kibumba.
However, the attempts were unsuccessful because of the complicated legal
environments in both the DRC and Rwanda. It was then agreed that this was no feasible
option.
4.5. Uganda
The project achievements were gathered from observation during field visit, interviews
with the different stakeholders, FGD, and household surveys. The latter were carried out
in the project areas of Muramba and Nyarusiza to understand the impact of the project.
A total of 59 beneficiaries participated in the evaluation across the different sub-
counties.

80
Indicator Description
(italic if not evaluated in draft internal evaluation)
Target Com-pleted Activity
(italic if not reported in W4V ME Progress
Report_V10)
Unit of
measurement
Target Com-
pleted#
Com-
pleted
%
Goal: Reduced conflict through increased access to water and improved watershed management in the Virunga Area
Indicator 1 % of people living in the project area (disaggregated by age, gender and
community groups) who express that conflicts related to access to water
and watershed management have reduced
50% Construction of rainwater harvesting tanks -
community
tank 14 14 100%
Construction of rainwater harvesting tanks -
household
tank
Construction of water scheme scheme 1 1 100%
Construction of PSP (Public Standpoint)/ kiosks PSP / kiosk 34 34 100%
Construction of water taps tap connected
to Bunagana
scheme
Rehabilitation of existing rainwater harvesting
tanks
tank
Introduce and implement PIP approach in W4V
intervention areas/ villages
PIP approach
per
intervention
areas
6 2 33%
Indicator 2 % of people (disaggregated by age, gender, and community groups) in the
project area who consider the project has had a positive impact on reducing
conflicts
45% Introduce the PMP approach around W4V
intervention areas/ parishes
PMP per
conflict
3 3 100%
Indicator 3 % of people (disaggregated by age, gender, and community groups) in the
project area who express that the relations with the park authorities have
improved
50% Establish the advocacy communication
mechanisms between communities and PA’s
(Protected Areas)
platform for
dialogue
1 1 100%
Set up mechanisms for conflict and complaints
management around W4V intervention areas/
Parishes/ villages
mechanism per
intervention
area
3 3 100%
Strengthen the advocacy communication
mechanisms between communities and PA’s
(Protected Areas)
platform for
dialogue
1 1 100%
Conduct training for PWCC and PPC in Uganda training 2 2 100%
Table 23. Targets and results of indicators and activities directly contributing to goal, for Uganda

81
Indicator Description
(italic if not evaluated in draft internal evaluation)
Target Complet
ed
Activity
(italic if not reported in W4V ME Progress Report_V10)
Unit of measurement Target Com-
pleted #
Com-
pleted %
Outcome 1: Improved well-being and production through improved WASH and IWRM
Indicator 1a % of people men and women of the different age and community
groups who consider they are safe when accessing water (safety
at water point and along the way)
70% 40% Community accessing water household 1.000 5200 520%
Conduct studies study per intervention
area?
2 2 100%
Indicator 1b % of households reporting increase access to water provided by
the project
40% 96% Contract constructors constructor 8 8 100%
Conduct stakeholders advocacy meetings on the water
scheme
meeting 24 18 75%
Indicator 1c % of households (disaggregated by age, gender, and community)
reporting increased access to water for their cattle
40% Construction of troughs trough
Community accessing water for their cattle breeder
Indicator 1d % change in average agricultural production at household level 10% 22% Selection and training of PIs farmer adopting PIP 2.560 342 13%
Scale up PIP at the village/hill level village adopting PIP 3 2 67%
Advocate to ban illegal markets to local authorities in
DRC
meeting
Sensitize communities on farming best practices PI adhering to best
practices
2.560 342 13%
meeting / activity
Select and train government technical staff and village
leaders on PIP approach
Gov. technical staff
members
10 10 100%
Farming land converted to sustainable use hectare?
Indicator 1e Number of hectares of agricultural of farmland converted to
sustainable use
5 Conduct mapping of the areas map or hectare? 5 3,9 79%
Conduct soil scan in the area scan of field 0 57 infinite
Indicator 1f % of people who consider that they are protected against flooding
and erosion
70% Initiate IWRM activities IWRM activity 1 1 100%
Planting trees and soils stabilization grasses in
farmlands
tree planted - grasses
included?
Setting up water ponds in the fields and along the roads water pond
Construct households RWHTs and water ponds to
reduce runoff
RWHTs and ponds
around it
14 14 100%
Set up demo plots for sustainable agricultural practices demo plot 3 3 100%
Set up kitchen garden person 50 17 34%
Table 24. Targets and results of indicators and activities contributing to outcome 1, for Uganda

82
Indicator Description
(italic if not evaluated in draft internal evaluation)
Target Com-pleted Activity
(italic if not reported in W4V ME Progress
Report_V10)
Unit of
measurement
Target Com-
pleted #
Com-
pleted %
Output 1.1: Increased access to safe drinking water for all communities
Indicator 1.1a % of households that have at least 20 liters of safe water per day 75% 43%
Indicator 1.1b % of households that have at least 5 liters of safe water per
person per day
80% 83%
Indicator 1.1c % of households that have at least access to water from a
protected source within a walking distance of 30 minutes
60% 94%
Indicator 1.1d Number of functional water facilities (disaggregated by type of
facilities) newly constructed by the project
12 Handover of the scheme to Local Government (LG)
/community
scheme? 1 1 100%
Number of functional water facilities (disaggregated by type of
facilities) newly constructed by the project – water schemes
2
Indicator 1.1e Number of functional of water facilities (disaggregated by type of
facilities) rehabilitated by the project
0 Identify and demarcate the cattle corridors corridor
Indicator 1.1f % of households that access water from protected water sources
due to project intervention
40%
Output 1.2: Erosion control and soil fertility measures adopted/ implemented
Indicator 1.2a % of targeted households (disaggregated by locality, gender, and
age) that have adopted soil erosion control and soil fertility
measures
40% Sensitize communities on protection of the
catchment/ water sources and farming best
practices on the hills
PI adhering to best
practices
0 342 infinite
Indicator 1.2b Number of hectares rehabilitated by the community
(disaggregated by areas) as a result of adoption of best practices
demonstrated
5 (in Résultats obtenus comparés aux prévisions
V2.pdf)
hectare 5 7,1 142%
Table 25. Targets and results of indicators and activities contributing to outcome 1, for Uganda - continued

83
4.5.1. Outcome 1: WASH and IWRM
Output 1.1: Increased access to safe drinking water for all communities Water access has been increased through the implementation of RWHTS and the Kisoro
Virunga Water Supply Extension (KVWSE) piped water (built with NWSC). The
percentage of households that have at least 20 liters of safe water per day has grown
from 65,8% (baseline) to 96,1% (internal evaluation). 5200 households (1000
households using water from 14 constructed RWHTs reported in W4V ME Progress
Report_V11 November 2021 + 21.000 beneficiaries of the KVWSE / 5 = 4.200
households) now have better access to water. Indeed, new RWHTs were built in all three
parishes. Moreover, repairs were done of leakages of pipes in NWSC water supply
systems. People did not repair their water supply themselves, because these repairs (of
RWHTs) were very costly. They also had alternative sources of water like the small tanks
that were provided by IGCP to individual households. The RWHTs are mainly used in the
dry season (if they yield water) when the tap stands have dried out. Water from the
RWHTs is used for domestic chores like washing clothes, cooking, and drinking in the dry
season. During the rainy season, people prefer other water sources like the piped water
from NWSC. A challenge was that both the tap stands, and the tanks were set up very
close to each other.
The source of the water of the KVWSE pipe is in Nkaanka, in Nyaruvule subcounty. The
water is pumped, and the communities can access the water at the 34 tap stands. Thanks
to these infrastructures, the percentage of households that have at least access to water
from a protected source within a walking distance of 30 minutes, has increased from
40,9% to 93,5 % (internal evaluation). The baseline study identified only 32% of
respondents that would walk for less than 30 min to access water before the
implementation of W4V.
Output 1.2: Erosion control and soil fertility measures implemented Through the PIP approach, several techniques were introduced in the area to reduce
flooding, soil erosion and gully formation (FGD). These techniques include soil and water
conservation practices, trenches, stone bunds, Napier grass and tree planting and
terraces building. These techniques seem to be successful as gullies are reported to be
regreening, soil fertility is slowly being regenerated and only 39% of the survey
beneficiaries mentioned having floods on their farmland, of which 75% induced mild soil
erosion (FGD, interview). The KII support this claim as they report a decrease in flood
incidences. Stone rows running downhill were meant as a mark between plots (and not
for erosion control).
In addition to the above-mentioned soil and water conservation measures and to
improve soil fertility, training on compost making, the use of fertilizer, were given
through the PIP approach. Through the approach, a mixed crop system was introduced

84
(moving from Irish potatoes to matooke as well), and a soil scanner was used to identify
the potential soil nutrient deficiency. In Uganda however it was found that the soil
scanner was wrongly calibrated, so that all the results were inaccurate.
Despite these measures and the mention of increased yields during the FGD, only 20%
of the surveyed respondents indicated an increase in their crop production. This is due
to the limited land for cultivation and with the introduced mixed farming. Despite these
measures and the mention of increased yields during the FGD, only 20% of the surveyed
respondents indicated an increase in their crop production. This is due to the limited
land for cultivation and with the introduced mixed farming.
Output 1.3: Watershed protection measures in place The livestock is zero grazed, but it was already like that before the start of W4V.

85
4.5.2. Outcome 2: Water management and governance
Indicator Description
(italic if not evaluated in draft internal evaluation)
Target Com-
pleted
Activity
(italic if not reported in W4V ME Progress Report_V10)
Unit of
measurement
Target Com-
pleted #
Com-
pleted %
Outcome 2. Improved inclusive governance and management of water
Indicator 2a % of men and women of the different age and communities’ groups
that declare trusting the local authorities regarding planning and
implementing IWRM and water supply activities
80% 84% Follow-up/coach on parish/chefferie role/responsibility
on water governance
Meeting, field visit 24 24 100%
workshop
Facilitate Chefferie/District/sector/ cell to follow
up/supervise functional WUCs
WUC/umbrella
supervised by LG
Functional WUCs supervised by stakeholders WUC/umbrella
supervised by LG
17 17 100%
Indicator 2b % of people who declare they are satisfied by water provision
(disaggregated by gender, age, and community)
40% Put in place WUCs WUC or umbrella 17 17 100%
Sign MoUs with WUCs MoU 17 17 100%
Facilitate WUC to complete legalization WUC or umbrella 17 17 100%
Facilitate stakeholders to legalize WUC WUC or umbrella
Conduct WUC training WUC member
WUC 17 17 100%
Conduct participatory WUC assessments assessment 2 0 0%
Indicator 2c % change in budget expenditure for WASH and IWRM by local
governments (LG)
Support LG / chefferie in action plan implementation
for WASH and IWRM
action plan 2 0 0%
Output 2.1: Citizens participate in local government annual planning and budget cycle
Indicator 2.1a Number of (annual) operational and financial plans for WASH and
IWRM adopted by LG based on ideas/wishes from CSO's/ CBOs
2 Determine budget process to determine right entry
points
? 1 0 0%
Indicator 2.1b % of CSOs/CBOs who have been involved in LG annual planning and
budgeting process.
2 47,0% Determine number of CSOs/actively involved in
budgeting process
? 1 0 0%
Table 26. Targets and results of indicators and activities contributing to outcome 2, for Uganda

86
Indicator Description
(italic if not evaluated in draft internal evaluation)
Target Com-
pleted
Activity
(italic if not reported in W4V ME Progress
Report_V10)
Unit of measurement Target Com-
pleted #
Com-
pleted %
Output 2.2: Improved and transparent functional relations between consumers, services providers, and LG (for water service delivery and IWRM)
Indicator 2.2a % of households (disaggregated by different community) who
consistently pay for the water supply services
70% 79% Conduct meeting with WUC/stakeholders to set up
mechanisms for cost recovery
meeting 0 4 infinite
Support WUC / stakeholders in facilitating
communities to agree on water cost
amount of water cost
agreed?
Establish VSLA VSLA 0 12 infinite
Field visits with stakeholders to prepare
communities on paying / agreed amount
field visit 24 23 96%
W4V accompany stakeholders to monitor
WSP/WUC on payment /agreed amount
monitoring visit 24 18 75%
Support WSP/WUC to put in place fin.
management, accountability mechanisms
WSP/WUC/VSLA with
mechanisms
17 17 100%
Indicator 2.2b % of households (disaggregated by, different community) who
attend meetings with LG and service providers on water and
watershed management
80% 90% Engage LG to put water/shed management issues
on agenda of community meetings
Water/shed issue on LG
agenda
1 1 100%
Engage WSP/WUC to conduct meetings with
communities on water related issues
meeting of WUC with
community
Conduct community awareness to attend
water/shed management meetings
meeting
Introduce, set up PWCC PWCC 3 3 100%
Indicator 2.2c % of recommendations made by WUCs, WSPs adopted by LG
annually due to project intervention
40% Follow up on recommendations made during
community meetings with WSP, LG
recommendations
implemented
4 2 50%
Output 2.3: Support the development of IWRM plan and investment plan by Districts/ chefferies/ Parishes
Indicator 2.3a number of Districts/ Chefferies with IWRM plan with budgets 1 Advocate for IWRM plans, budgets Parish with plan
Output 2.4: Water user’s committee and Service provider functional
Indicator 2.4a % of water user’s committee who effectively manage their water
points
70%
Indicator 2.4b % of men and women of the different age and community groups in
the water committees
50% Female inclusion in WUC number or %? 8,5 56 659%
Male inclusion in WUC number or %? 8,5 56 659%
>= 35 years inclusion in WUC number or %?
<35 years inclusion in WUC number or %?
Minority group inclusion in WUC member 2 2 100%
Majority group inclusion in WUC member 15 0 0%
Indicator 2.4c % of WUCs that has up to date records accessible by members 70% Follow-up of availability notebooks WUC + notebook 17 17 100%
Table 27. Targets and results of indicators and activities contributing to outcome 2, for Uganda - continued

87
Output 2.1: Citizens participate in LG annual planning and budget cycle Before the implementation of W4V, LG meetings on water services and watershed topic
were not happening, due to limited funds to facilitate the LG officials. When the project
started, LG officials were brought on board to lead trainings on water management and
guide election of the WMCs and train them there after.
Output 2.2: Improved and transparent functional relations between consumers, services providers, and LG (for water service delivery and IWRM) The internal evaluation reveals an increase in attendance to the LG meetings from 76,4%
during the baseline study to 90,1% during the endline study (internal evaluation). While
95% of the respondents have trust in the LGs, only 54% are satisfied by the water
services provided by them. Initially the people were hesitant about whether the LG
would deliver on its promise of bringing more water to the area and other interventions
such as PIP but as the interventions unfolded and proved beneficial to them, trust has
been built between LG officials and beneficiaries, especially during the trainings. On the
other hand, with the non beneficiaries of the project, the little trust that existed reduced
because they kept wondering why they had been left out of the project activities, yet
they are also in need of the interventions.
Output 2.3: Development of Local IWRM plan and investment plan supported No IWRM plans have been developed, but plans were developed to mitigate landslides
(as an element of IWRM).
Output 2.4: Water User’s Committee and service provider functional According to the project logic, each RWHT and tap (from the KVWSE pipeline) has a
WMC installed (interview). The role of the committee is also to supervise the payment
per jerrycan of water and to supervise the community cleaning the water points when
necessary. The water fee of 50 UGX13 (piped water) or 100 UGX (for RWHTs’ water) is
collected per 20-liter jerrycan filled from the RWHTs or the tap stands, therefore
reducing the water expenses hugely (from 1500-2000 UGX), as some community
members used to get water from the Bodaboda water vendors (FGD).
If indeed, the WMCs are functional as described above, and more than just a committee
on paper, remains a question, that could be answered at a later moment (e.g., by
checking the status of the RWHTs). What may be a bad sign, regarding record keeping
by the WMCs, was that the WUCs just kept mentioning that they keep all the records
but could not bring the books for evaluators to verify. What may be a good sign, is that
for the old tanks that had been constructed by IGCP, there were water user committees
as well.
13
25UGX is saved for O&M and 25UGX is transferred to NWSC

88
In addition, 7 members of the WMCs were elected to form a Parish Water Management
Committee (PWMC) (interview). This committee is to oversee and guide the activities of
the WMCs. The 3 PWMCs, with the guidance of W4V merged to form an association
called the Mgahinga Conservation Development Association (MCCDA). This association
is registered at the district level and aims to supervise the conservation of natural
resources (including water) in the 3 parishes.

89
4.5.3. Outcome 3: Improved relations Indicator Description
(italic if not evaluated in draft internal evaluation)
Target Com-
pleted
Activity
(italic if not reported in W4V ME Progress Report_V10)
Unit of
measurement
Target Com-
pleted#
Com-
pleted %
Outcome 3: Improved relations and reduction of conflicts between governments, park authorities and local populations regarding access to water and other natural resources
Indicator 3a % of respondents that confirm that land-related conflicts exist Identify conflict thematics
% of respondents that recognize that inter-ethnic conflicts / issues
exist
set up PMP for conflict transformation on identified
conflicts
% of respondents that recognize that customary or tradition-related
conflicts / issues exist
Conflict resolution agreement Signed by conflict parties
% of respondents that recognize that conflicts / issues between
pastoralists and farmers exist
Involve all stakeholders and community members to
transform the conflict
Indicator 3b % of identified conflicts between different communities and other
stakeholder groups related to WASH and IWRM that have been
effectively transformed according to involved stakeholders
75% Identify conflicts related to WASH and IWRM
Indicator 3c number of transboundary cases positively transformed through
collaborative mechanisms
Indicator 3d % of respondents that recognize that relations with authorities have
improved
5 53% Construction of physical barriers as agreed by parties
(electrical fence)
physical barrier
Output 3.1: Network of identified mediators/facilitators (persons/organisations/platforms) capable of using effective conflict transformation strategies is established and functional
Indicator 3.1a number of facilitators/ mediators trained by the project who
practice conflict transformation techniques and approaches
Select and train organizations partner to work on conflict
transformation
?
Output 3.2: Trans boundary, national and local identified issues, and conflicts in GVL addressed
Output 3.3: GVTC and communities have up to date information on water and land related conflicts.
Output 3.4: Structured relationships between park authorities, local authorities and communities strengthened
Table 28. Targets and results of indicators and activities contributing to outcome 3, for Uganda

90
Output 3.1: Network of identified mediators/facilitators (persons / organisations / platforms) capable of using effective conflict transformation strategies is established The main technique used to resolve conflict is the PMP approach. This approach was
used to identify and prioritise the key conflicting area (interview). The meeting through
the PMP identified water related issues, animal crop raiding, poor park relations, and
then limited information on revenue sharing. There were no interventions implemented
in relation to livestock or grazing in Uganda.
Through the PIP training, a good collaboration between the communities and the UWA
has been established.
Output 3.2: Transboundary, national, and local identified issues and conflict in GVL addressed Several conflicts were identified during the baseline study: 61% of respondents reported
conflicts related to water and IWRM, 42% of respondents identified land related
conflicts, 30% of respondents mentioned conflicts with the park authorities, and 3.3%
identified conflicts between pastoralists and farmers. Overall, 98% of the survey
respondents indicated that the project had a positive impact on the reduction of
conflicts in the area. In addition, 97% of the respondents believe that conflicts related
to water and watershed management have reduced and 98% indicated an improved
relationship with the park authorities since the past 2 years.
The issue of the human-wildlife conflicts was tackled by the reinforcement of 1.2 km
stretch of the stone wall with mortar in Kabande village. The height of the wall was
extended by 0.3 m to reach a height of 1.5m (see Figure 9. Stone wall reinforced with
mortar (Uganda)
In addition, to further reinforce the wall, 7,440 stem cuttings of Erythrina were planted
on both sides of the wall along a stretch of 11.7 km of the wall, therefore reaching 12
villages.

91
Figure 9. Stone wall reinforced with mortar (Uganda)
Furthermore, a radio show was developed to inform communities on the Wildlife
Conservation Act and to spread information on revenue sharing (interview). No
transboundary conflicts have been reported.
Output 3.3: GVTC and communities have up to date information on water and land related conflicts See section 2.3.
Output 3.4: Structured relationships between park authorities, local authorities and communities strengthened W4V has linked the communities to the government and the UWA (FGD1). All
respondents claim that the number of illegal park entrance has decreased so that 98%
of the respondents believe that the relationship with the park authorities have
improved. This is confirmed by the UWA: since the stone wall re-enforcement (in which
communities participated actively) and the provision of water to communities:
• only one problem with an animal outside the park has been registered;
• registered cases of community members herding back strayed buffaloes to the park and call UWA staff;
• minimized registered illegal park entries by community members;
• communities have a better understanding of UWA policies, regulations, and programs.
Several MoUs were signed between W4V and different parties to create an enabling
environment for the implementation of the project activities. In June 2019, W4V signed
a MoU with the Kabande Tank B and Ruchantege Tank B water users and in June 2020,
another MoU was signed with NWSC (UMPR June 2020, 2021). Moreover, two MoUs
were signed to reinforce the stone wall. One in October 2020 between W4V and UWA
and another one in January 2021 between the villagers of Kabande, the UWA and the
92
contractors that have reinforced the stone wall with mortar and cement (UMPR October
2020; UMPR January 2021). Finally, W4V has facilitated the set up of dialog platforms
(MCCDA and PWCC).
Output 3.5: Inter-government agreements on trans-border water delivery and management prepared This output is not applicable to Uganda.

93
5. Assessment of the project
5.1. Relevance
5.1.1. Stakeholder assessment
How do different stakeholders (community members of different (socio-economic, ethnic) background, LG at different levels, park authorities), assess the relevance of the project to their needs and priorities? During the interviews, most stakeholders stated that the goal and objectives of the
project were in line with their needs and priorities. The aim of W4V was to bring
cohesion back between the different communities and ethnical groups after long years
of war (interview). In addition, the beneficiaries in Runyoni (DRC) and in Uganda
confirmed that the project answered their needs regarding conflicts, limited access to
drinking water, crop raiding by wild animals, conflicts between farmers and pastoralists
(this conflict was only felt in DRC) as well as soil erosion.
While the targets in the implementation were seen as relevant, the objectives of the
project as formulated by the embassy and answered to in the expression of interest, was
found overly ambitious by some stakeholders. This was the aim for “reduced conflict
through increased access to water and improved watershed management in the Virunga
area “(Project plan 2016).
The project intervention zone was only one section of the whole instable region
(interview). The entry point of the project to the conflict, improved water management
and relations with the park, was only part of the of conflict. From interviews with project
staff, it became clear that the focus on ethnic diversity and ethnic dimensions in conflict
transformations were politically sound but difficult for them. For one, in Rwanda this
topic cannot be part of normal conversation or intervention it is made not to exist. The
ethnic dimension which included several other groups with conflicting interests was
side-tracked to one group and found redundant. For instance, In DRC the emphasis on
Batwa participation could not be justified by the numbers of Batwa people because
there are only a few Batwa people in the Bishwa chefferie (there is mentioning of a total
of 60). We understand that this led away from a more encompassing strategy and
discussion on ethnic representation. In the field interviews (similar to the discussions
with the embassy) no-one talked about this or had the intention to give an analysis.
While the political intentions of inclusiveness and conflict resolution are correct and
laudable, the project reality tended to be more tenacious, and the project team seemed
not to be able to address the issues. Perhaps for good reasons. Talking about ethnicity
in this context is playing with fire. The Batwa problem appeared as one way to avoid
broader discussions and touch on the ethnic dimension.

94
5.1.2. Needs and priorities
To what extent has the project taken the different needs and priorities of different groups into consideration? W4V tried hard to implement where possible the required drinking water interventions
and succeeded in many places. Combined with fencing of the park, this addressed and
often solved the ongoing conflicts. In Kisigari, Kibumba, and Buhumba (DRC), the project
was unable to tackle all the urgent needs of the population, which were the lack of
drinking water and issues regarding water runoff. Currently work is still being done to
tackle these issues
The program team stated that ample attention was given to the different needs and
priorities of the different ethnical groups in the DRC (interview). They have been
included in the WMC and in the PIP approach. Indeed, the PIP approach, given its
flexibility, allowed to tackle several needs of the different target groups (interview). PIP
allowed the community to restore their soils and catchment areas as well as to increase
their agricultural production. From the implementing partners we did receive comments
that at a local level the PIP approach addressed questions of ownership that could have
sparked some conflicts between different communities but in the end it did not. The
field team also did not find any signs of this. Given the discussion above on communities
and conflict we believe that it takes a lot more time to really understand these conflict
dynamics. The implementation of the PIP approach was not always done according to
proper procedures. From field interviews in Rwanda, we found that the PIP approach
focussed mainly on men and the women were not consulted when developing the PIP
approach for their household (e.g., in Nsherima). The conflicts between pastoralists and
farmers were resolved thanks to the implementation of herding corridors and drinking
points. Finally, the introduction of the WASH component of the project was important
as it increased the use of latrine and improved the hygiene of the population.
For the agroforestry aspect of the IWRM component of the project in Rwanda, the
population was only indirectly involved through the involvement of their
representatives (cell-, sector-, and district agronomists) to decide the type of trees that
would be planted (interview). In Uganda, it was UWA that decided on Erythrina, since
Erythrina was already being planted by communities along the wall to strengthen it. The
project went ahead with the recommendation from UWA because communities were
already planting Erythrina and because UWA were experts, so it seemed like the right
decision. There was no talk of fruit trees by the community members as they preferred
another tree species which was a tree that they believed would better keep the animals
away and strengthen the wall.

95
Therefore, Alnus spp. (which is an invasive species) was planted while the population
claims that they would have preferred to have planted fruit trees that have direct
additional benefits for them.
In Uganda and Rwanda, people stated they preferred NWSC / WASAC piped water (as
far as they have access to it) to water from the RWHTs, and only use the tanks when the
taps are not bringing water, especially in the dry season, which shows the relevancy,
even though limited, of the construction of the tanks for the beneficiaries (for the dry
season). During the (beginning of the) dry season, depending on which source is
exhausted first (piped water or RWHTs), every extra source of water is relevant. But
tanks of 5 m3 (shared by more than one household), can never provide enough water to
bridge the dry season; larger volumes could have been considered. The question to solve
would be if people are willing to invest time and labour in more or bigger tanks.
Particularly if they are not capable of financing operation and maintenance. From the
discussions in Kabande village and Rugina in Gitenderi, most of the people uphill also
complained that the communities downhill already had piped water from NWSC, and
the project also added more tap stands and RWHT.
In Rwanda it was indicated that water tanks provide water for one week only. From field
observations and interviews, it was found that most tanks served one or two households
(and incidentally, three), because all the neighbours also had their own tanks. This would
give 575 constructed RWHTs x 1,6 (-1,7) households = 920 (-978) households benefiting
from the RWHTs, which is less than the 2800 households, as reported by W4V. The figure
of 2800 seems to reflect rather the target, in which 5 households together share 1
RWHT. The people without tanks were not included in any of the management activities
and decisions regarding the tanks despite intentions of the program team to do it
differently
5.1.3. Underlying issues
To what extent has the project addressed the underlying issues that led to the development of the project? (water scarcity and tensions between parks and community over people entering the parks and animals leaving the parks) Several activities were developed to provide both tangible (e.g., the construction of the
electrical fence, pastoralist corridor and livestock water points) and intangible (e.g.,
setting up community structures dealing with conflicts) outcomes that would solve the
underlying issues in the region (interview). The project shifted in approach in which one
prioritized cause (water scarcity) was made part of a more encompassing approach to
resolve conflicts and tension. Overall, we can say that the technical solutions to water
scarcity were well addressed. The project needed more time to address the wide variety
of underlying causes to conflict and tension (land right, ethnicity, human wildlife
conflict).

96
Water scarcity In DRC, many interventions sites were fitted with water provision systems, and this
reduced the need for people to go into the park to fetch water illegally.
The decisions on siting the new RWHTs in the three countries appeared to be different:
• In DRC, the RWHTs were constructed mainly on the hills where no piped water
was available.
• In Rwanda, the RWHTs were constructed in a clustered way upstream or along
gullies, in order to contribute to the countering of runoff and soil erosion. This
makes some sense as RWHTs are not considered safe drinking water (Ref.
National Policy). But the structural problems in constructing the tanks, as well as
the tanks filling up quickly made that this contribution was small. Moreover,
water supply was to be studied under the D2B project, which finally started with
much delay. The idea was that from the study there might possibly a follow-up
investment contribution for the construction of infrastructure. However, the
study started much later than planned and is taking longer than planned also.
• The water scarcity in Uganda was not addressed for the uphill communities,
which were the ones that needed to fetch water in the park. Indeed, all the
RWHTs and the pipe water were placed at the downhill population who already
received small RWHTs provided by IGCP. Therefore, the population located uphill
still walk long distances to access the water downhill.
In summary of the above, the envisaged problem by the construction of the RWHT
(water shortage or countering runoff and erosion) were not solved the RWHT were not
always relevant (see next sections as well).
Runoff and soil erosion Within the project organization, conflicting opinions exist on the objective of roof water
harvesting: some claim that it can reduce runoff and reduce flooding. Others claim that
roof water harvesting was done for water supply only. This clearly impacts the discussion
on its relevance. If roof water harvesting is done to reduce runoff, it would need to be
applied in a clustered way (at houses close to each other), with safeguards for
overflowing tanks, like well dimensioned and positioned soak pits. If roof water
harvesting is done to enlarge water supply, tanks should have been dimensioned to hold
enough water to bridge a dry season. It would have been good if there had been more
discussion and alignment on its objective within the project organization.
From interviews, it appeared that RWH tanks had been distributed (in a participatory
way) with the goal to reduce the runoff from the slopes. This led to two exceptional

97
sitings (in Gahunga sector): one household with more than one tank on their compound,
and another with both a tank on their compound and a WASAC piped water supply
connection. Selected beneficiaries of the RWHTs were all located upstream or alongside
the gullies and collected runoff from the roofs to the tanks would not add to the gullies.
Unfortunately, the high rainfall in the area causes RWH tanks to be filled up quickly,
allowing the overflows still to spill into the gullies. Soak away pits had been constructed
at each RWHT (but not in Bugeshi) to exactly prevent this problem, but these should
have been designed in a way to catch all the overflowing water, and not only the excess
water from the tap.
The three pictures (figure 10) from Rwanda, particular the left where the downpipe is
missing) illustrate the above: in case of an overflowing RWH tank, water will not be easily
caught in the soak away pit, but randomly flow around the tank (or from the pipes), and
may then easily turn into runoff, which was exactly the reason to construct the RWHTs.
In Uganda, the water of the RWHTs is not used until the dry season, leaving the full
RWHTs during the wet season to overflow. In the right picture, the gravel / pebbles all
around the tank may allow overflowing water to slow down and infiltrate, while in the
left and middle pictures, the water from overflowing tanks will hardly end up in the
pebbles and gravel, and may therefor still cause small gullies to develop, and thus not
prevent runoff and erosion. It has been mentioned that during installation of the tanks,
future users indicated that this pipe should be directed to their (future) home garden
instead of flowing into the soak away pit. Its fortunate that this strategy was not
pursued, tanks only have overflow when it is raining, adding more water to the fields
when it is already raining would have led to more erosion.
Figure 10. RWHTs (Rwanda)

98
The capacity of RWH tanks to reduce runoff is therefore expected to be limited.
Tensions between park authorities and communities W4V created a link between the communities and park authorities which reduced
conflict and created dialogue. Trust has not been entirely achieved and tensions remain.
In some places the communities in DRC, Rwanda and Uganda still need to enter the parks
to get firewood, bamboo rhizome, and herbs (interview). Yet, while in Rwanda no one is
allowed in the park, in Uganda only some people are allowed to enter the park on
specific days after having sought approval from the park authorities. If these rules are
not followed, the population trespassing could be shot dead by the game wardens (in
Uganda).
In Uganda, the PIP approach beneficiaries were encouraged to plant trees to be used as
firewood. However, because of the small size of their plots, the population needed all
the space for food crops and no trees could be planted. Another source of unresolved
tension between the park authorities and the communities was the lack of a buffer zone
between the plots of communities and park boundaries. This issue was not tackled by
the project.
While the problem caused by the wild animals raiding the crops of the farmers nearby
the park has ceased in the project intervention, the wild animals now raid other villages
that did not receive the improvement of the stone wall in Uganda. So, even though the
project has set constructive steps in addressing the underlying factors of Human-Wildlife
Conflicts, the problem of crop raiding shifted to other villages near the park. UWA still
has the mandate to resolve these issues
The recently adopted Uganda Wildlife act stipulates that the communities should
receive compensation for the damage caused by wild animals. However, since this act is
only recently adopted, there is no experience yet within the park authorities on
procedures to compensate the communities, this remains to be evaluated later.
The tensions between the park authorities and the communities are therefore not yet
entirely resolved and the communities still do not feel confident enough to have
discussions with the UWA. Since the UWA only deals with groups rather than individuals,
the project formed some groups that would link the communities to the UWA (e.g.,
MCCDA). However, the MCCDA stated that they had not received (enough) training to
be operational. From the W4V monthly reports, it becomes clear that MCCDA is
supported in registration, and in preparing a document on governance and leadership;
its members (PWCCs) have had a training to monitor operation and maintenance of
parish water schemes. A request was made by the MCCDA board to get capacity

99
building, but no mention is made of an activity; this confirms the MCCDA statement
mentioned above.
5.1.4. Changing context
How has the context in which the project was implemented changed over time, and how has this influenced the assessment of relevance of the project and its components? There were many contextual changes that occurred during the implementation also
specified in the introduction. COVID-19 impacted all the countries. This, together with
an Ebola outbreak at the start of the program strengthened the importance of the
inclusion of the WASH component within W4V.
The security situation in DRC remains instable, causing the postponing or cancelation of
implementation activities. In some case armed groups occupied the implementation
area or there was a change in governance. In the North-Kivu province the army is
governing the province (interview). This showed how the overall goal of the embassy is
relevant and the project team did what it could to address some of the underlaying
causes but some issues are beyond the control of the program. We cannot stress enough
that the evaluators found the project performed very well under these trying conditions
in Congo.
The political situation between Uganda and Rwanda changed as the population (and
therefore the W4V staff) could not cross the border anymore (interview). This however
did not impact the relevance of the project.
5.1.5. Relevance of intervention design
To what extent is the design of specific interventions (water supply schemes, water tanks, PIP, multi-stakeholder platforms) relevant to the direct beneficiaries? In Uganda, the PIP approach promoted the use of soil and water conservation practices,
which were already carried out by the communities before. In Uganda as well, a soil
scanner was used to provide some indication on the nutrient state of the soil. However,
the users of the soil scanner could not have access to any of the fertilizers needed to
correct the nutrient deficiency identified by the soil scanner (anonymous source). In
addition, it was indicated that the soil scanner was wrongly calibrated, so that all the
results communicated to the communities were inaccurate. The soil scanner would have
been relevant if it could have assisted people to understand their soils better and reduce
fertilizer input. However, if the extension cannot be bought to that level the intervention
is not relevant.
From the discussions with community members in Kabande village and Rugina in
Gitenderi, most of the people up hill also complained that the communities downhill
already had piped water from NWSC, and the project also added more tap stands and
RWHT

100
5.1.6. Increasing relevance
Could the relevance of the project have been made higher? If so, how? The project was highly relevant to the region and its communities. People in the project
commented that a broader goal could have further increase the relevance of the project.
The issues in the target area were not only water access but also conflicts on land and
water management and agriculture (anonymous source). W4V shifted its approach to
fit this goal after the first year. The project staff nationally and internationally stated
that they lacked proper time and opportunities for additional intervention to tackle
conflict resolution and for the activities to have long lasting impact (interview). In sum,
the adjustments that were proposed were good, but the time needed to deliver on these
adjustments was not there.
In DRC, the peer monitoring facilitated by Transition International concluded that W4V
should include the Batwa people in their activities. Yet, in the Jomba groupement, there
are 13 Batwa households with a total of 60 individuals. While it is highly relevant to
include all the stakeholders in the project area, it was very difficult for the W4V staff to
find the Batwa people and therefore to work with them. In Uganda, the Batwa only lived
in one settlement in Rukeri village, Nyarusiza sub-county within the project area (here
the W4V set up a RWHT that is shared with the rest of the community). This limited how
much involvement the project could have with them as the rest of the Batwa were far
away from the project area.
5.1.7. Matched needs
(From proposal) Are the expressed needs / priorities on which the Water for Virungas project was built the same as the needs / priorities of the final beneficiaries of the project? The baseline study highlighted the following issues that the communities are facing
unsafe access to drinking water, runoff causing soil erosion and flooding, conflicts
between farmers and pastoralists, conflicts between park officials and community due
to illegal park entry and destruction and wildlife. These needs have been confirmed by
the interviewees from the three different countries, therefore showing that the design
of W4V was appropriate to answer the needs and priorities of the final beneficiaries.
5.2. Coherence
5.2.1. Coherence of objectives
To what extent was the design and implementation of W4V coherent with the objectives of the Great Lakes Regional Programme? The GLRP overarching goal is to contribute to the stability of the region (MFA, 2018).
The programme is based on two pillars:

101
• Interventions that are transboundary in nature and contribute to regional
cooperation;
• Interventions that take place in Eastern DRC and have an impact on regional
stability.
To achieve these overarching goals, several long-term goals have been identified, of
which three are in line with the objectives of the Water4Virunga project. These four long
term goals are:
• Improved stability in the Great Lakes Region and especially Eastern DRC;
• Improved use of water resources and its catchments in the Kivus;
• Sustainable inclusive agricultural development to foster food security and
stability;
• Sustainable gender equitable peace to contribute to stability.
Under each long-term goal, several medium-term goals have been listed, some of them
being in line with the W4V project. These being:
• More effective local conflict-resolution through enhanced community-
government (including security actors, women, and youth groups) relations;
• Improved access to justice through local structures;
• Improved productivity and income from smallholders;
• Reduced conflict through increased access to water, involvement of
communities and improved watershed management;
• The number of people using safely water of good quality has increased;
• Improved conflict sensitivity around natural resource use and management;
• Reduction of violence against women and girls.
The activities tackling conflicts between famers and pastoralists, communities, and park
authorities as well as human wildlife conflicts are in line with the first mentioned long-
term goal of the GLRP. Like the GL Programme, W4V engaged women in its activities and
sought to open inter-ethnical dialogue.
Through the PIP approach, W4V is in line with the second and third listed long-term goal
of the GLRP. The PIP approach boosted the yield of the farmers. The increased access to
safe water is directly linked to the WMCs, WASH services and increased water access
(e.g., piped water, RWH tanks).
Indirectly, because of the decreased need to enter the park illegally to fetch water, there
was said to be less violence against women and girls (interview). In the DRC, access to
clean water has reduced abuse and violence against the women.

102
5.2.2. Relation to Great Lakes projects
To what extent was coherence sought and achieved with relevant water and food security projects in the Great Lakes Regional Programme (FARM, Maji ya Amani and GVTC)? W4V was in line with the other projects taking place within the region as they were also
working on regional stability and in water access. For instance, the aim of Maji ya Amani
(MYA) was to reduce violence and increase the stability of a groupement through
inclusion and increased access of land water resources (Vaessen, 2018). The FARM
project on the other hand, focuses more on increased agricultural production
(Aidstream, 2021). Yet their approach of bringing governments and citizen together was
very similar to the multistakeholder approach of the W4V project.
The embassy encouraged collaboration between the different programs but even
though there was lots of overlap in logistics and themes there was no meaningful
collaboration.
When after repeated encouragement still no cooperation took place, the embassy made
a joint plan a precondition to a no-cost extension for both projects.
5.2.3. Policy environment
To what extent are the project’s achievements in line with policies and plans of the provincial (DRC) /district (Rwanda, Uganda) and local authorities in the targeted areas? Content wise, W4V collaborated a lot with LGs. According to an interviewee, “whether
governments are weak or not, we really tried to add value to their capacities”: in
Rwanda with RDB, and in Uganda with NWSC.
In all three countries, the W4V staff aimed at aligning the projects’ activities with the
local policies. In DRC, the activities were in line with the chefferie and national plans
such as the IWRM plan and the Service National d’Hydraulique Rurale (National Service
for Rural Water Supply) (interview). It is important to note that there were few plans
and policies targeting the park (anonymous source). In addition, it was not easy to work
with the government. In Kibumba groupement, the W4V staff mainly worked with the
local chiefs as the chef de groupement was not willing to collaborate.
The project worked very closely with the Rwandan government on its planning
(interview), the government officials only provided the enabling environment for the
monitoring and information sharing regarding the project. One of the government
policies promotes watershed management and soil and water conservation measures.
The PIP approach was in line with such policies and implemented these. There were
questions in the program team as to how this helped to introduce the program approach
or if it was more government extension. If a project such as W4V aligns with government

103
policies, this adds to the ownership by LGs and thus, to its sustainability. Internally, W4V
could have focused more on its IWRM policy.
In Uganda, the project was in line with several other governmental programmes
(interview). For example, the human-wildlife interventions were in line with the UWA
intentions and aim. The UWA had not yet been able to kickstart the interventions before
the arrival of W4V because of a lack of budget. The W4V interventions brought new
approaches regarding how to deal with such issues. Through the PIP approach, the
farmers were able to diversify their crop system, therefore improve their household
nutrition (interview). This was aligned with the Kisoro District Nutrition Action Plan 2015
/ 2016 – 2019 / 2020. So, both programs aligned with government priorities but in
Uganda the program was more than the implementor of these policies.
Because of the good alignment of the project with the local policies, the District
Agriculture officer in Uganda mentioned his interest in incorporating the PIP approach
in their development plan of the district. The extension workers are currently working
on supporting the PIP beneficiaries as they are viewed as an organised and serious
group.
5.2.4. Relation to other projects
To what extent was coherence sought and achieved with other projects in the targeted area? It seems like few other projects have targeted the area of intervention of W4V. One of
them was a project implemented by Mercy Corps (MC). It was stated that MC
approached W4V to work together on landscape (hill) management (interview),
however, the embassy has strongly encouraged this collaboration and feels it did not
result in anything. This testifies to a more widespread phenomena where NGOs feel they
cannot mingle with other programs. Almost always this is due to a (misguided) idea
about competition over beneficiaries or difficulties with M&E. Particularly in IWRM such
turf wars are highly problematic and contra productive.
In Uganda, W4V worked with NWSC to expand the (KVWSE) pipeline to the project area.
This was however not a plan of the NWSC initially and this expansion was only feasible
through the financial contribution of the W4V project. Yet, as mentioned in the
relevance section, the project did not seek enough complementarity to (achievements
of) the previously implemented IGCP project who had implemented small portable tanks
and RWHTs in the same region as the W4V project.

104
In Rwanda, W4V worked with the Feed the Future Rwanda Activity (Hinga Weze) in
Nyabihu District to build the capacity of the PIP farmers, to increase the trainee’s
participation in the project, to increase their benefits from the project interventions,
and to increase women’s empowerment in the agricultural sector using the GALS
(Gender Action Learning System). No efforts were made to attribute results to either
W4V or Hinga Weze.
5.2.5. Relation to other conflict transformation or peace building initiatives
Specifically for the conflict transformation component: the project decided to work with multi-stakeholder platforms, which are somehow separate from existing structures such as the local peace and development committees in DRC. To what extent does this approach complement and align existing efforts in the field of conflict transformation? Before the implementation of the W4V project, one CLDC already existed. The
committees worked with ICCN and were not focusing on conflict resolution. Therefore,
the multi-stakeholder platforms brought this new focus into the project area. The water
interventions would initiate new forms of governance and this governance would give a
cause to address social inclusion and power dynamics. In reflections on this it was stated
by the involved experts that time was just not enough to do this properly. There was a
question from the embassy on how realistic it was in the program documents to link
conflict resolution to water infrastructure. To some extent the two moved
independently as well as consecutively. Where it was dependent on water infrastructure
the planning was less realistic within the project period.
The beneficiaries trained in the PMP approach provided positive feedback because of
the free services it provides. Yet, the local authorities, who do not appreciate the NPD,
found this approach superfluous. We tend to attribute the reduction of conflicts
observed in the area to the combination of the different approaches brought by the
project rather than the sole PMP approach. Thanks to the PMP approach, the CLCDs
have integrated the management of park population conflicts into their mission.
5.2.6. Opportunities for improvement
Could the coherence of the project have been made higher? If so, how? In all three countries, W4V strove to work hand in hand with the local authorities and to
develop activities that fit their policies and development plans targeting the project
area. Yet, in Uganda the water access component of the project should have taken the
previous IGCP project into account in order not to provide the people who had already
received IGCP tanks before, with even more water. The conflict transformation and
peace building activities could also have been more intense if staff would have been able
to put more time in it, both in years and by local presence. This was partially due to lack
of access but also poor planning or a misunderstanding of how much time these
processes actually take. The evaluating team also found that in certain aspects there

105
was incoherence in the implementation strategy. As said, there seems to have been
particular ideas on the use of these tanks for reduction of flooding, recharge and water
provision which did not always translate into the right way and place of implementation.
Also, the fencing of part of the park was a point of debate. One of the loose ends in the
project was the different ideas people had about the fencing of the park. The discussion
can be summarized as the choice between a hard boundary between nature and people
or a permeable boundary with buffer zones, resource benefits for people and
compensation for losses. It is true that part of the discussion was already past because
at places there was a hard boundary but supporting this and making it larger changes
the status of the park. There is a conceptual aspect about nature/people relations before
you change the fences from permeable to impermeable but still leave some parts open.
The electrical fence was put as a hard boundary; the stone wall in Uganda did not go all
the way (as it was a pilot only). Fencing/walling partly has the risk of displacing the
problem to the areas where no fence/wall is constructed. So, either you go all the way,
or the problem continues to exist.
5.3. Effectiveness
5.3.1. Outcomes and outputs
To what extent did the project achieve its outputs, both in terms of quantity and quality? (Please explain reasons for over-/underachievement) This question was already addressed in chapter 4 so that this section provides a
summary of the project’s achievements including the reason of under- or over-
achievement. It is remarkable that for outputs that have a link to governance (2c, 2.1
and 2.2, and all outputs under outcome 3), output indicators have hardly or not been
achieved. For outcome 3 (with many linkages to governance), no targets had been set
for activities, and consequently, few results were achieved. See section 5.5.3 as well.
Outcome 1: WASH and IWRM Water supply achieved good results in all countries. Indeed, 68.4% of the respondents
of the internal evaluation claim that they have increased access to RWH tanks to W4V
(the target of 40% per country was achieved). It should be noted that the water from
the tanks is not treated, which may in the long run lead to pollution if not well
maintained. Respondents attributed good results to the RWH tanks, the communities
said they needed to walk shorter distances and have more time for other activities such
as school. Given the reports on the shorted lived supplies of water from the tanks it
might be there were incidences children had more time for school, but we cannot
confirm this is a structural solution.
The agriculture / PIP / IWRM component of the project showed good results. However,
the baseline value was set very low i.e., 5 hectares (Uganda) and 100 hectares (DRC)

106
while 1000 hectares represented only 11% of the project area in DRC. While
technologies contributing to IWRM were implemented and accepted as part of the PIP
approach, these measures were primarily serving WASH and agriculture objectives. They
were not planned or implemented based on a catchment approach, which limited their
effectiveness for IWRM purposes. This is confirmed by the fact that no IWRM plans have
been developed (but some first steps were set, in DRC). Without a thorough knowledge
of IWRM, and the development of IWRM plans, it cannot be expected that IWRM can
be implemented effectively. In this case, only isolated measures (elements of IWRM)
were implemented, which can still be effective. As an example, in Bwisha chefferie, an
agreement for the protection of the Kamira catchment was developed, and some
measures to counteract soil erosion / landslides were implemented. According to a KII
in DRC, erosion control and runoff was reduced but not stopped.
Outcome 2: Water management and governance In each country, different water governance bodies were established and operational.
The results on water governance and PMP are mixed as not all the
beneficiaries/institutes seem to have understood it and apparently there has not been
enough follow up to make it stick. Community-based water governance takes time. In
Uganda, there was already an institution that ensures more sustainability (unlike in
DRC). Overall, there are still places where the setting up of water management is
ongoing. Infrastructure is still being developed. International collaboration (on water
management as well) between Rwanda and DRC was politically complicated. A specific
conflict in Bugeshi was partly solved (see section 5.5.1).
Outcome 3: Improved relations The improved relations between the different stakeholders cannot be attributed to only
one project activity, but rather to the combination of the approaches and activities
undertaken throughout W4V, e.g., PMP or PIP approach. PMP shows some early results
although the approach needed more time than was planned for. From the KII, it became
clear, that people handle conflicts themselves rather than going to the police / local
tribunals. Moreover, the beneficiaries trained in PMP now train others in turn. It can be
said that the infrastructural works aimed to improve relations have contributed to
improving relations. The construction of the electrical fence, stone wall, and trenches
also improved the relations between the park and the people. In Uganda this still needs
work. The PMP and the PIP approach also contributed to improved relations in the
household. The attribution of the results to a specific activity is complicated.

107
5.3.2. Adequacy of the project logic
To what extent was the programme logic (particularly the assumptions linking outputs to outcomes, and the risk assessment) adequate? The project’s logic originated from a question by the embassy which was in turn
informed by an ongoing collaboration between the embassy and GVTC and a
hydrological analysis (Deogratias et al. n.d)14. The initial assumptions were inclined to
technocratic solutions, stating that improved water management and access to water
would reduce conflict over water resources. In hindsight, the project’s staff reflected on
these assumptions stating that the assumption to reduce conflict only by water
infrastructure could not appreciate or accommodate the wider causes of conflict in the
area and outside. For instance, it was stated that in DRC, the conflicts about water are
also conflicts about other issues outside the local context. During the first year, the peer
monitoring by Transition International nuanced and improved the project logic and the
link between outcomes and outputs. This helped to reformulate the cause and effect so
that W4V focussed on conflict but within the limits of water management and relations
between the park and the people (human-wildlife conflict etc.). Within these new
limitations the project managed to resolve several ongoing conflicts or issues regarding
access to water, human - wildlife conflict, issues around livestock and more.
Within the link from outputs to outcomes we see the following mismatches. The fencing
or wall making around the park solved the issues partially around the sites of
implementation. The field team notices that in some cases (e.g., in Uganda), this moved
the problems to adjacent villages. The wildlife therefore encroached on the farms
without walls.
In Rwanda, RWHTs were constructed for drinking water provision but distributed with
the idea to control runoff. This was based on the observation that concentrated runoff
was coming from the roof and the road. However, the idea that roof water harvesting
tanks applied on a large scale can adequately mitigate flood water and erosion cannot
be supported logically nor empirically. These big volumes of water were also not
conducive to the tanks because the overflow was so much the erosion around the tanks
starts to create instability. The team in the field found some tanks suffering from runoff
and flooding themselves. Many of the tanks were put in Rwanda where rainfall can be
2000 mm/yr. With an average roof size of a small house being around 24 m2, this means
a 5 m3 tank needs less than 250 mm of rain to fill up and then the rest will spill over.
Even if people consume 10 tanks a year, they will not do this in the rainy season. The
idea that excess runoff from the tanks needs to go into soak pits was only partially
14
[
Déogratias, Nahayo, Ntwali Janvier, Nkurunziza Fabrice, Kamana Emmanuel, Bitariho Robert, Katcho Karume, and Byamukama James. "A Survey of
Hydrological Systems in the Greater Virunga Landscape, Around the Volcanoes National Park, Rwanda."
.

108
understood by the implementors. Soak pits were constructed around the tap, and not
around the (overflowing) tanks. It’s a good idea that could have even been done without
the implementation of the tanks (soak pits connected straight to the downpipes). Now
the clustered distribution of tanks will give cause to discord amongst community
members. Who gets to have a tank and who not? Will the people from the other areas
really be allowed to use the water? The evaluation shows only the household maintains
the tanks. Yet, it is important to note that while RWHTs could not have a large impact
on water runoff, their implementation started the discussion within the communities
regarding this issue. Indeed, the communities are now aware that there are activities
that can be implemented to capture the water runoff and they are now willing to
cooperate in that regard. Given the price of a tank and the disadvantages of plastic tanks
you would have wanted other options to be considered.
5.3.3. Adequate risk management
To what extent was risk management adequate, and to what extent has the implementation of the project been adjusted based on regular assessments of assumptions and risks? As far as our understanding goes, the project had an adequate risk management in place.
We have not heard of natural or social risks which have led to problems in
implementation. With this we also need to add that in the implementation of water
infrastructure, the PIP and RWHT’s seem to be low risk interventions. The higher risk
infrastructure will need to prove itself. The area is a volcano and infrastructure can be
affected by earthquakes, landslides, erosion etc. The project team has celebrated the
success of payment for water being introduced. In project areas where social unrest and
political instability is more a rule than the exception the collection of money should be
done cautiously.
5.3.4. Local acceptance
To what extent is there acceptance for the activities and outputs among beneficiaries and LG? Willingness to pay has been an issue with the beneficiaries and government, but the
project needed to overcome this problem of acceptance with long term financial
sustainability in mind. The remarks from the previous entry apply. In areas with high
social volatility the emphasis on paying for water needs to be balanced with the risks
that accumulation of money brings. However, the patience of the project implementors
really helped in acceptance of the willingness to pay for water. The W4V internal
evaluation revealed that the percentages of people that consistently pay for their water
has increased hugely in Uganda, quite a bit in DRC, and diminished slightly in Rwanda.
Creating a working relation with the ICCN through the support in constructing a fence
also probably helped a lot.

109
Issues with the acceptance of the need for detailed analysis also seemed to have trickled
down to the beneficiaries and governments. When a project starts, people want to see
results. When implementation is paused because of research and analysis there might
be unrest or loss of faith in the project that makes it difficult for local project staff to do
their work effectively.
Technically the interventions were well accepted by both the beneficiaries and the LGs.
There was mentioned an incident with the chef de groupement of Kibumba who could
not accept water tanks and demanded piped water. Adapting to this has now led to a
situation where many people will benefit from piped water. In other areas the tanks
were also greatly appreciated, and the fencing of the part was also already known and
accepted.
The PIP approach deserves a special mentioning here. The evaluators voiced concerns
about the acceptance of this method by LGs and it was understood that in Rwanda for
instance the method was adapted to accommodate the will of the LGs. In Bugeshi
(Rwanda), the PIP approached was experienced as a top down approach (as an extension
of LG policies), while W4V tried to introduce it as a bottom up approach. This can be
explained as follows: Bugeshi was the first area to start the PIP approach in Rwanda, LG
works more top-down (as compared to in other countries) anyway, and the project staff
responsible for this had to many (other) tasks to pay enough attention to the LG.
In Nyabihu (Rwanda), PIP was introduced more bottom up, more time was allocated for
sensitizing and training PIP beneficiaries, and achievements and their perception was
better. However, in DRC and to a lesser extent Uganda, the method emancipated
farmers to look into their own resource base and see what they could do to help
themselves. That this was accepted from a vantage point of gender and generation-
based hierarchies, bureaucratic hierarchies and intercultural hierarchical perceptions
can count as no small feat by the implementors.
5.3.5. Infrastructural quality
What was the quality of the infrastructure that was constructed? To what extent was it in line with design specifications? In Rwanda, in general, the quality of the infrastructure observed was good. However,
most of the observed RWHTs in Bugeshi were reported to be fragile so that the tap
stands broke easily, the tap could not be closed, the gutters were open, and tanks were
leaking; no counting was done to quantify the exact percentage of RWH tanks with
problems in Bugeshi. As stated before (see section 4.4.1), after construction of the first
100 RWHTs in Bugeshi, the design was adapted, for which these problems were not
reported.

110
In addition, in Uganda, the communities reported to have a lot of issues with the
bursting of the KVWSE pipes. After being contacted, it takes approximately 2 days before
the NWSC reaches the site of where the pipe has burst. In the Gitenderi Parish, the
RWHTs had been built by W4V and their design was properly done so that no issues
were identified. During the infrastructure observations, it was found that the exteriors
of these RWHTs looked much older than the W4V project and looked like the IGCP tanks
(constructed before the W4V project). Pictures of the construction of the 14 RWHTs
were then shared by W4V to proof that these were newly constructed and not
rehabilitated.
There was no mention of issues regarding the quality of the RWHTs in DRC.
Regarding the infrastructure put in place to reduce HWC, the reinforced stone wall in
Uganda was mentioned to be sturdy. The existing stone wall in Rwanda needs constant
maintenance however, which is under the mandate of RDB. There was no mention of
any quality issues of the electrical fence.
5.3.6. MSP achievements
What achievements did the multi-stakeholder platforms have? Reflections on the PMP (MSP) from the foreign experts unanimously agree that the
strategy was good but the time to implement short and it could be done with more
attention. From the different interviews in the field, it became clear that the PMPs
contributed significantly to conflict resolution. People trained were approached to solve
different types of conflicts, and as a result, less people go to the police or to local
tribunals. This was confirmed by local authorities as well as park authorities during a KII
(DRC). The trainees in turn are approached to train others in mediation of conflicts. In
Uganda, the PMP approach improved the quality of service provision (especially conflict
mediation) of the local leaders to the communities.
The cases of conflicts that PMP members have facilitated in mediation are about
conflicts between farmers related to the disruption of field boundaries by run-off water,
or between farmers and herders related to crop destruction by domestic animals.
Among them are the following (from DRC, in 2019):
• In Runyonyi, farmers Nyirabwiruka Kabirigi vs Nkeza Bwabuze were in conflict
when the water from streams had disturbed the boundaries of their fields in
March 2019. As a solution, the parties voluntarily signed the deed of compromise
and each one planted anti-erosion hedges at the boundaries of their fields to
stop the erosion.
• Farmers Bukindi Serubungo vs Ntibiramira Ntamuhanga were in conflict when
run-off water has destroyed field boundaries in Runyunyi village. The two
farmers did not sign the compromise, but each returned to their former

111
boundaries and planted agroforestry species at the edge of their fields to
stabilise the soil.
• Farmer Iraguha Mboneye vs Zacharie Ntamwemezi in Rwumba village were in
conflict when run-off water has destroyed field boundaries of their fields. The
parties voluntarily signed the deed of compromise and each of them planted
erosion control hedges at the boundaries of their fields to prevent erosion.
• Muzairwa Banombe vs Budidi Karekezi farmers in Kariba village. The parties did
not sign the compromise but were satisfied with the mediation because in their
culture writing is accompanied by drinking.
• Nzabarinda Gahotora resident of Chanzu vs Segege Sebusanane, resident of
Kinyangurube village. Segege's cows destroyed eucalyptus seedlings and food
crops in Gahotora’s field. The parties voluntarily signed the deed of compromise.
Segege replanted Gahotora's trees and Gahotora welcomed the mediation (May
2020).
And the following (from DRC, Kisigari, in 2020 and 2021):
• A conflict between a farmer Sinamenye Maisha and a herder Ndeba Ngerero
following the devastation of cassava by cows in Kitamorekwa was resolved
peacefully by PMP users on 05/10/2020. The owner of these cows paid a sum of
20,000 CDF to this farmer equivalent to the quantity of crops devastated and
promising to use the muzzles and corridors already available for his cattle to
prevent future conflicts. This conflict was resolved peacefully through mediation
by the users of the PMP approach
• A conflict between a farmer Riva Bushiru and a herder Ndangizi Kigingi over the
devastation of beans by goats in Gafumba village was resolved peacefully by PMP
users on 25/05/2021. The owner of the goats agreed to pay 10,000 CDF to the
farmer equivalent to the quantity of beans devastated and promising to use the
muzzles for his cattle to prevent conflicts. This conflict was resolved peacefully
through mediation by PMP users on 25/05/2021.
• A conflict between a farmer Mpfitumukiza Ndagijimana and a herder Vunabandi
Karibushi over the devastation of maize and sorghum by cows in Ruvumu was
resolved peacefully by PMP users on 07 April 2021. The owner of the cows
agreed to pay 40 bowls of maize and 5 of sorghum to the farmer equivalent to
the quantity of maize and sorghum devastated and promising to use the already
reopened corridors and muzzles for his cattle to prevent conflicts.
And from Uganda:
• Through PMP, UWA, W4V and the District local government officials trained
communities on conflict resolution through sensitization meetings. It is from
these trainings that reinforcement of the stone wall was agreed upon and it was
seen as a solution to the animal raids. The scale to which the stone wall was

112
reinforced is what is affecting results but otherwise the animals have not been
able to destroy the reinforced part of the stone wall.
The PMP approach was also used to deal with the establishment of infrastructure for
water access and the stone wall. The PMP approach was not implemented in Rwanda.
5.3.7. Participatory design
(From proposal) To what extent has the design of infrastructure been a participatory process (leading to the design specifications)? The PIP approach to water technologies included participatory design and as far as we
could establish, the implementers executed this with considerable care. The design of
the RWHTs was improved after the first constructions in Bugeshi (Rwanda), leading to a
lower need for repairs. The larger water infrastructure was more remotely organized
and designed in the Netherlands also because the engineers were not allowed in DRC.
Detailed negotiations did take place between the municipalities, utilities, and the project
team. In Uganda, the NWSC was well capacitated to engage in these discussions while
in DRC the project team worked mostly with the chefferie, and this did not allow
technical discussions on the same level as engineers. Negotiations in DRC did take place.
In Kibumba groupement for instance, the tanks were rejected by the groupement in
favour of piped water. Then, during the implementation local service providers were
involved. On the landscape-scale design, as already mentioned, the PIP was a
participatory approach, the engagement of the WUR water expertise was less involved
in the field and more on the research and analysis than on the practical implementation
due to the shift in focus from IWRM to PIP. Non-beneficiary community members
showed interest in the PIP approach and were included in the approach.
In Uganda, the tree species selection for planting along the stone wall was not done in
a consultative manner as communities explained that they had already planted some
Erythrina along the stone wall, but it was not helping and needed to plant other tree
species. It is one of reasons the community is not taking initiative to replant the Erythrina
in areas where the cuttings did not survive.
Better understanding the need of the beneficiaries would have improved the efficiency
of the project. In the DRC, the water tanks installed were too small for the households’
needs so that the beneficiaries are still forced to go within the park boundaries to fetch
additional water. It might mean that in this case the technology is just not appropriate
for the problem and to costly for its impact.

113
5.4. Efficiency
5.4.1. Costs
How do the costs of implementing this project compare to other projects in the area? In the DRC, the project Maji Ya Amani (MYA) - Operationalizing the ToC for the Great
Lakes Region Integrated Water and Food Security Program worked in South Kivu on
issues related to inter-ethnic conflicts and conflicts within communities during May 2017
and February 2021. Their total budget was of $ 24.3 M (€ 21.5 M ) with a yearly budget
varying between $ 5 to 8 M (€ 4.4 – 7 M).
The Food security and inclusive Access to Resources for conflict-sensitive Market
development (FARM) was a four-year program (2017-2021) implemented by Mercy
Crops and Search for a Common Ground. Its overall goal is to improve the socio-
economic and security conditions of around 25,000 households, from 120 different
villages within the province of North Kivu, DRC. Its total budget was of $ 18.4 M (€ 16.3
M) with a yearly budget of $ 1 – $ 4.9 M (€ 880,000 - € 4.3 M).
In Rwanda, Hinga Weze was a project funded by USAID. It targets smallholder farmers,
women, and children within 10 different districts of the country. The project has a total
budget of $ 32.6 million (€ 28.9 million) for the five-year period of 2017-2022.
In comparison, the W4V total budget and its yearly expenditure was close to that of the
FARM project. Yet, FARM targeted many more villages. The MYA and the Hinga Weze
projects had a considerably higher budget while they covered smaller areas and took
place during a similar time period. Indeed, the total W4V budget was € 14,055,000 and
the yearly expenditure varied from € 1.7 to € 4.1 million (audit reports 2017-2020).
It would have been interesting to calculate the costs per beneficiary for each of these
programs for the sake of comparison, but that was beyond the scope of this evaluation.
W4V came an overall estimate of € 53/beneficiary, with a large percentage of error in
the estimate of the number of beneficiaries (3. Cost per beneficiary.pdf).
5.4.2. Comparison with other approaches
How does the implementation of the project compare to alternative approaches? The PIP approach was new to the project area. The PIP approach incorporated some
elements of IWRM and then did come to stand in for the watershed management IWRM
part of the program. Compared to other programs that work on IWRM this can be
considered unique. It is difficult to compare the effectiveness in IWRM or watershed
work because the project did not explicitly monitor the watershed effect of the PIP.
114
Although not named as such, the Hinga Weze project introduces and supports the
development of what in W4V is called IWRM technologies (such as terracing). Because
of its agricultural production focus, the project also strongly supports irrigation,
improved market access, as well as the cultivation of high-nutrition value crops, which
are approaches that were not introduced by W4V.
Like the W4V project, the FARM and the Mayi Ya Amani projects used a conflict
resolution approach in DRC. In their Conflict Scan published in August 2020, the Mayi Ya
Amani project demonstrates its intention to introduce multi-stakeholder
communication platforms (Search for Common Ground, 2020a). One of these intended
platforms would comprise the different representative of the local ethnic communities
as well as the different level of LGs. The project also mentioned its wish to reenforce
and build the capacity of local structure dealing with land tenure mediation. Whether
these activities were indeed performed is unfortunately unclear because of the lack of
available information. The FARM project has worked with several different conflict
transformation community structures (such as NDP, Cellule de paix et de
développement (CPDG), Comité local de paix et de développement (CLPD)), these make
use of mediation to assist different conflicts arising within and between communities
(Search for Common Ground, 2020b).
Financially there appeared to have been internal discontent about the budgeting around
implementation, as compared to other programs people had worked on. These other
projects were taken to be more transparent and decisions less top down. Implementing
organisations stated that they struggled to understand what they could do because
budgets were not disclosed to them. Discontent was voiced where one country team
thought it deserved more budget than others. To some extent these discussions will be
inevitable in a project implemented in 3 countries.
5.4.3. Timeliness
How timely was the implementation of the project (taking into account factors outside the project’s control)? Because the entry is under efficiency, we take the timeliness to mean that the
implementers managed to get their deliverables implemented on time. In a project area
like this we believe that timeliness should not be judged too heavily. We distinguish
between external and internal factors influencing timeliness.
There were external project delays: especially the first five of the following bullets have contributed to the delays in the site selection process.
• Lack of basic info (maps, discharges of sources, present infrastructure, records for base-line);
• Not uniform governmental views/approaches;
115
• Specifically, unrealistic expectations of the chef de groupement from Kibumba;
• Time needed by beneficiaries, governments, and other stakeholders to understand the approaches, and to manage expectations.
• Insecurity to DRC made access more difficult and caused delays as well;
• The Covid-19 pandemic hit the three countries and delayed the project as
lockdowns and traveling restrictions were necessary (UMPR April 2020; RMPR
March & April 2020). This unforeseen factor was well outside the project’s
control although the staff tried to overcome the problems by introducing a
stronger online communication.
There were internal factors influencing timeliness:
One general issue was about the budget decision making, allocation, and transparency.
In the countries, the decisions on the budget were perceived as taken by the steering
committee who did not know the specific situation well, rendering the process of budget
allocating to specific activities slower and less efficient, while in fact, the steering
committee (following procedures) followed the needs and proposals from the field. This
points to a lack of clear communication and expectation management.
In DRC specifically, the project staff complained that this slowed down implementation
because they could not plan ahead. Here, this points to a lack of clear communication,
leading to different views on the same processes. They reflected on this course of events
as being very peculiar and not conducive for an efficient delivery. From our interviews
we understood that internally, in the country teams, there were people who knew and
others who did not know or could not find out what budgets they were working on. As
there were no distinctive budget lines for a specific country activity, this may have led
to the unclarity of the available budget for the different country teams. This points again
to a lack of clear communication, probably caused by the change from one
transboundary project to three country projects (which had many benefits as well), and
this may have led to some lack of confidence. The evaluators cannot say if any and (if
so,) which activities were delayed because of the lacking clear communication on the
budgets.
The peer monitoring of Transition International in year one stopped some organisations
from implementation. The project and its M&E framework were redefined. It was
reflected by most program staff that the proposed changes were good. Another
overarching issue signalled by several local staff was the lengthy discussions that took
place over the definition of the roles of the different organisations, which each had
different organization cultures, as well as different priorities in the region and the
project. As one interviewee, stated: “It took us time to find a way of working.” Such
issues therefore led to some staff members leaving the project. Similarly, GVTC stopped

116
its contribution to W4V, which was a decision some of the involved people welcomed,
as they saw GVTC as an organization that mainly held meetings. Another interviewee
mentioned that time was lost due to the multiple changes to the ToC and the long time
spent wording it (e.g., the definition of the word “outcome”). The original project
proposal seemed not to have considered the reality of DRC. These delays were within
the project’s control and could have been avoided, however, it is normal for a program
with a diversity of local and international, knowledge and implementing organisations
to have disagreements about theory and practice.
No budget and no staff were initially allocated to the IWRM activities, which delayed the
implementation of this component of the project to 2018 instead of the start of the
project (November 2016).
5.4.4. Efficiency of external expertise
The project relied heavily on international expertise for the design of interventions. Could this realistically have been done differently? If so, how? W4V had elements of a top-down approach, for instance in designing infrastructure. At
the same time one of the successes was also in a bottom-up participatory approach.
As already introduced in section 2.2, the PIP approach was drawn from international
experience but landed squarely in the DRC, Uganda and to a lesser extent, in Rwanda.
The international experts explicitly committed to field engagement allowing
considerably liberty to adjust the approach locally. There were several concerns voiced
from the field that the project was too top down. The evaluators believe that more
presence in the field by the external experts would have been better, particularly when
they want to deliver a conceptual approach such as MSP (as compared to designing
infrastructure)
In the implementation of water utilities, the international expertise was necessary
although there was a need for closer collaboration and improved communication with
the local staff and expertise. For example, in DRC, there was a lack of local partners that
made it necessary to rely on the international expertise. In Uganda, the tendering
process surrounding the RWHTs would not have been possible without the international
expertise brought by the W4V project as W4V needed to be there every step of the way
(UMPR October 2018). An interviewee reported that some international research and
training groups were included for PIP in the original proposal, but that’s didn’t work out;
in the end, MDF and IGCP implemented the PIP activities.
Some of the implementing partners found they could not participate in the budgeting
decisions taken by the project management. This opinion was noted with the disclaimer
that it is also not the role of local organizations to determine the budget but to provide

117
annual plans that can be used for budgeting. Unclarity about this role seems to have led
to discontent that could have been avoided.
While the reliance on international expertise was well perceived in Uganda, this point
of view differed significantly between the stakeholders within the three countries. One
overarching issue was the lack of presence of the international expertise; an issue that
was exacerbated by the pandemic. Especially in DRC the absence was felt even before
the pandemic when experts were not allowed to go to the field. This made it harder for
the international experts to consider the local context, which led to some mistrust and
resistance from the local staff.
5.4.5. Ideas for improvement
To what extent could the project have been able to achieve better efficiency? If so, how? During the first year the project needed to reinvent itself, with several experts flying in
on short term exploration. In some cases, the international experts could not engage
with the local experts, reducing efficiency. It may have been more efficient and
contributing more to team building and ownership to decide to have the international
experts based in the region for the first few months (during the design of
implementation) rather than making the international experts fly in.
The external input was seen as less applicable to the local situation, whether this was
true is not the question, the process was not conducive to the timely implementation.
One of the options that could have been pursued more was to bring the local experts to
a place where they could also engage with the international experts and present their
situation and work on team building. When covid started to make this even impossible
there could have been more conference calls with updates from the fields.
Even though there was an early written instruction on the procedure for the selection
of service providers / contractors, which was made available to all staff and discussed,
to some project staff it seemed that the project did not have such procedures (e.g., on
who should sign contracts). This points to a lack of clear communication. So,
communication on project management issues (selection procedures, budget, and
activity planning) could have improved, especially since the project changed from a
transboundary project to three, more independent country sub-projects, and thus
needed clear communication between project management and project officers.
The project received considerable input from the embassy and staff were exposed to a
peer monitoring already the first year which led to considerable changes and debates
about project definition. In general, revisions in the programs outcomes and outputs
tend to frustrate implementation and should be avoided. The embassy should be aware

118
that, however well intended this input would be, there is a donor/client relation that
can cloud the content of the input. The advice is to avoid intensive revisions in the
program outcomes and outputs. It appears as a lack of understanding at the inception
of the program, but also a undermines the ownership of the program staff.
However, a project operating in such a complex international setting with such a wide
variety of stakeholders also needs moments of reiteration and reflection. The
assumption that water technologies reduce conflict was not likely to hold until the end
of the project and the nuance that was brought in after the first year, has led to better
implementation.
In such a context, it is easy for local implementing organisations to request more precise
instructions and narrower budget definitions, but if solutions would be simple, they
would already have been common practice. So, in essence, we would advise to minimize
changes in the program theory of change or log frames externally. We also see that this
can be needed and that between theory and practice there will always be ambiguity that
can lead to complaint. On a more conceptual level, this kind of ambiguity can be
productive when local implementing organisations feel confidence and ownership (and
have the capacity to do something with this). It can also lead to frustration when
discussions are at conceptual level and not translated to reality.
There is a sentiment in the project staff that improvements would have been possible
in financial transparency as well as communication on finances. Disbursements were
said to come late, even though, once set in motion, they were swiftly handled and
paid. It seems therefor that the disbursements should have been set in motion earlier,
and that communication should have been clearer. As stated already in section 6.4.3,
there were no distinctive budget lines for a specific country activity, this may have led
to the unclarity of the available budget for the different country teams. We could not
link this directly to delays in project implementation, but these are not sentiments you
want to have in your program.
Budget Regarding the budget of the program, its design could have used more help of the
implementors when discussing and choosing the investments required by the project.
Moreover, the project would also have gained efficiency had communication on and
transparency on the budgeting principles be known to the implementing staff of the
project.
Some specific interventions in the project could have benefitted from stricter
procedures in the tendering (as stated on the last page already). The price of the
construction of the electrical fence by Virunga Foundation (the private development

119
branch of ICCN) of $ 342.742 can invite questions whether this should have been
tendered according to EU and Congolese law. According to the project organization and
the Virunga Foundation, no tender procedure was needed, as it was considered a
financial support to the parc authorities (ICCN / Parc National des Virungas). The exact
relationship between the ICCN / Parc National des Virunga (a Congolese government
institution) and the Virunga Foundation (a private actor) then may lead to the question
whether Virunga Foundation operates in a fair, transparent and competitive market, as
no tender procedure is needed for contracting the ICCN / Parc National des Virunga. In
this case, the external accountant should have checked the legal requirements (private
branch of a public actor benefiting from the financial contribution) as well as possibilities
(lack of security) for a tendering procedure.
Staff & role definition Staffing issues were an identified problem in each three of the countries of
implementation. The issues included a lack of staff, high turnover, and new recruits,
which impacted the quality of the training as well as the attitude of the trainees in
Rwanda (e.g., staff turnover for PIs in Nyabihu, UMPR April-June 2019; RMPR July &
October 2019). The staff shortage created a very high workload for the current staff
within the three countries. While staff turnover cannot always be prevented, a more
precise initial quantification of the work and therefore of the necessary staff required,
prevents future project delay and overwork by the current staff.
From an interview:
The most significant change was that due to the measures like terracing and planting
there was a lot less runoff. But now it is about maintenance. So are people really going
to pick this up, there are many places that are used as sink pit for runoff. These will silt
up, are they really going to do the maintenance? For IWRM, we did not consider check
dams, which was just too expensive and demanding too much time and no one was
going to maintain them.
5.5. Impact
5.5.1. Attributable changes
What change has occurred in the project area since the start of the project, and what of this can be ascribed to the project?
Impact: Reduced conflict The field surveys in DRC indicated a reduction of conflict both in general (i.e., 96% of the
beneficiaries and 55% of the control group (who were aware of the project) believed
that the project had a positive impact on the reduction of conflict in their area, and in

120
relation to water access, catchment management and in relation to the park authorities.
In Uganda, a reduction of conflicts was observed and confirmed during KII), because
people access rainwater from the tanks that were installed and the piped water scheme
that was extended during the project. W4V clearly facilitated communication and joint
action between stakeholders to reduce conflict. These changes can be attributed to the
program.
From the survey in DRC, it became clear that it was not only the PMP approach that
caused a reduction in conflicts, but rather, the complete set of approaches / project
elements together. Modesty and realism from one of the interviewees made them state
that the project has contributed to the visible results, but that conflict resolution may
be attributed as well to other organizations and individuals. They pointed e.g., to the
constructive role of LG (at all levels). In this case, the project has at least created a
conducive environment, by bringing relevant stakeholders together, and close MoUs
with them.
Outcome 1: WASH and IWRM One interviewee (project staff) stated that most changes in the water situation can be
attributed to W4V; communities were not passive before the W4V project, but they had
challenges. W4V has supported the communities in their ongoing efforts; time is now
transformed into productive activities (women not being raped anymore as they do not
need to walk long distances, children going to school instead of fetching water). W4V’s
intention on increasing the communities’ resiliency and their intention to change their
habit of awaiting international aid (as it has been the case for the past 25 years) has led
to the introduction of the PIP approach. Through this approach, the most significant
change of the project was achieved as people and think at household level and their own
solutions. In addition, there was a change in social cohesion: people now meet at the
taps stands, just like farmers who meet now. This was illustrated the crop sharing
agreement cases for victims of soil erosion on the up and downstream.
Another change attributed to the project that is mentioned, are the changes in the
landscape and vegetation due to better farming practices and planting of trees (to
diminish runoff) by the project. We must however stress again that IWRM is more than
soil and water management. So positive change in WASH and soil and water
management can be attribute to the program and this is part of IWRM.
Outcome 2: Water management and governance While only 8% of the household interviewed during the baseline study reported having
a water management structure in their community, W4V introduced one water

121
committee per RWHTs or tap stand. Particularly for the RWHT these committees have
shown very little sustainability also because the technology (and quantity) does not lend
itself for committee management. Water management done by small communities has
not shown good results worldwide. In the evaluation we noticed considerable
differences in management between the countries. In DRC there were active
management committees, and they were able to show financial records, we trust these
will survive the project. In Rwanda, the RWHT were not really well managed, but there
was record keeping. In Uganda there were many excuses as to why the records were not
kept and it is likely the committees will not reach the end of the project.
The larger water systems that were institutionally organised did have representation
and O&M in place. According to an interviewee, the most important impact in DRC is
that all ethnic groups (including the Twa) work together in the same water management
and watershed committees in the community interventions for watershed
management. This impact is so important as the tensions between the three tribes in
the area have in history often lead to e.g., open conflict, instability and people fleeing
their homes.
Outcome 3: Improved relations Community members in DRC report a reduction of conflicts linked to the access to
natural resources, and to runoff / erosion problems.
From KIIs in Uganda, it became clear that encroachment has drastically reduced because
of improved access to water and increased awareness (because of sensitization training
sessions and radio messages by UWA). There is satisfaction, but not to the fullest
because animals use the side of the wall that is not reinforced to still encroach on
gardens
In this respect, an interviewee mentioned the electrical fence only constructed in DRC
and the stone walls against buffaloes in Rwanda. Almost the whole park is now fenced
(54 km – 1 stretch in DRC still not constructed) and managed by the park authorities.
The project through its intervention has improved the relationship by closing an
agreement with the communities to enter the park on a weekly basis. This practice
existed before but discussions with park authorities by the project made this functional.
In Rwanda, land conflicts related to water flow on the farms reduced due to trainings on
soil and water conservation. In one specific case, a cross-boundary conflict (Bugeshi)
between Rwanda (upstream) and DRC (downstream) was addressed through the
planting of trees and the construction of RWHTs (on the Rwanda side of the border) to
control flooding but was not completely eradicated by the project.

122
In cases, where conflicts still do arise, it is stated that the PMP approach has led to
people not paying to the police anymore in case of conflicts; they instead go now to the
members of the PMP community to find solutions.
In Rwanda, talking about (and thus, observing any change in) conflict is a sensitive
subject, because of the historical context. But there were reports on household level
issues. In Rwanda (Nsherima), among the first PIP generation, men were able to explain
the goals of PIP, but the women could not. This could be attributed to the goals, which
were focusing more on what the man wants to achieve (like buying cattle, constructing
a house). In Rwanda as well (Gaheriheri village), when the women were asked about PIP,
they referred to the men because “the men know those things". Both women and men
were involved in PIP activities, but there was big difference in the two sectors it was
implemented in Rwanda. In Bugeshi, the impact in general was minimal but even far less
on the women; the goals were written and well understood by men, while women could
not explain them. In Nyabihu on the other hand, the situation was better, some women
could explain, although these were still few in comparison to men. It is likely that the
implementors did not or could not convey the central values of PIP.
The gender component to implementation leads to another point the evaluators need
to make. It would be easy to state that the program in Rwanda did not deliver on the
promise of inclusive and gender sensitive development and perhaps in this case it did.
In other areas the PIP approach seemed to have emancipated women and men took
their productive role more serious. Similarly, the difficulty to address ethic relations in
some areas and long-standing conflicts through water provisions could not always be
solved. Despite popular ideas amongst donors and NGOs, deeply entrenched ideas
about gender society, culture and ethnicity do not change because there is a project.
These processes move at a different pace. Projects like W4V then need to balance
between reaching impact on for instance the PIP while working with patriarchal
relations or doing nothing and missing the chance to call for more inclusive gender
relations even a bit.
5.5.2. Unintended effects positive and negative
What unintended (positive and negative) effects has the project had, and on which groups of people? Most unintended effects, which were noticed, are positive. According to an interviewee,
there were quite a lot of those, which is confirmed by the number of these mentioned
below. As attention is often not going to unintended effects (as these effects are not
expected), others may still exist, and only later (or never) be observed.
Outcome 1: WASH and IWRM Linked to WASH, three unintended effects should be noted:

123
• Water sources have been protected, leading to a reduction of water borne
diseases (amoebae, diarrhoea, cholera), and thus hygiene and health
improvements; this was confirmed by an interviewee in DRC, regarding cholera,
typhoid, amoebiasis, malaria, but no statistics could be obtained on this;
• Sanitation has improved by the construction of latrines (individual examples
from Rwanda in Nsherema in Bugeshi and Kamiro in Mukamira sectors; and
from Uganda in Nyarusiza subcounty, Gitenderi parish, Kabande village); no
quantitative statistics on this were collected;
• An individual and interesting case from Bugeshi (Rwanda), comes from one of
the PIP beneficiaries. Before PIP, he was having a hard time paying for the
health insurance for his family, a family of eleven members but after the
trainings for PIP, he was able to revise the way he spent his money and
organize himself in that now he can very stably pay for the health insurance,
and for his family.
Linked to IWRM and PIP, three unintended effects should be mentioned, which could
not be quantified and thus remain anecdotal:
• Better gender balance under the PIP approach (confirmed by three stories of
significant change);
• Production of own seeds, selling to others became more important;
• Self-financing for small projects e.g., tree nurseries and bridges; in this case, the
people benefited from the project and then realized that they had needs
beyond what the project could offer, and anyway they had no access to
government services. They then collected money and started setting up a tree
nursery and constructing a bridge.
Outcome 3: Improved relations The only negative unintended effect that was observed, is the dissatisfaction / jealousy
of the communities in the areas (in Nyarusiza, Uganda) where the project was not active,
but where the people still had heard about the project. Reports of vandalism by jealous
neighbours were solved through NWSC encouraging the beneficiaries to keep watch and
safeguard the installations and equipment, which they did.
5.5.3. Ideas on improvement
Would it have been possible for the project to achieve more impact than has been achieved? If so, what impact, and how could this have been done? If resources would have been used more efficiently (see section on efficiency as well),
possibly more impact could have been reached. The inefficient use of resources that
were observed are the following:
• Time that was lost

124
o on setting up cooperation with GVTC, who later did not participate in
the project anymore;
o on setting up cooperation with Mercy Corps (insisted on by the Dutch
Embassy); that did not last long (it was not found out why not), and
resulted in only 800 instead of 1200 hectares trenched;
o on focussing on all the right procedure for IWRM and when this proved
impossible, move the approach to PIP (including elements of IWRM);
o on involving local implementing partners only late;
• Budget that may have been lost
o on the possible lack of a proper tender procedure for the construction
of the electrical fence by Virunga Foundation (private sector) / ICCN /
Parc National des Virunga (public sector).
Impact: Reduced conflict Outcome 1: WASH and IWRM If the understanding of hydrology and the effects of locating rainwater harvesting tanks
would have depended on the needs and equal distribution of benefits, rather than on
the presumed effects on runoff and erosion, then possibly more people could have
benefited from rainwater harvesting tanks; see section 5.6.5 as well.
Outcome 2: Water management and governance If the IWRM approach could not work according to international principles, then a light
version or an alternative version could have been developed that kept in mind the
proposed impact of the catchment approach and IWRM. For instance, the objective of
IWRM is to reduce water scarcity or flooding. Stakeholder engagement is a prerequisite
according to international principles, but if governments do not collaborate fully (which
is seldom the case) downscaling the technologies and stakeholders can still deliver on
the reduced impact of scarcity and flooding.
Outcome 3: Improved relations Even though a concise overview (table 14) of the conflicts transformed during the
project was shared, W4V has paid much less attention to the monitoring and evaluation
of this outcome, as compared to outcomes 1 and 2. With the review of the M&E
framework (after the peer monitoring by Transition International), the underlying
outputs and activities were reviewed as well. A more consistent follow-up of these
underlying outputs and activities might have enabled the achievement of more results.
What would definitely have helped in reaching more impact, is the setting of targets for
the activities under outcome 3, like it was done for most activities under outcome 1 and
(most of) outcome 2 and was done for the indicators (under all outcomes). See section
5.3.1 as well. The peer monitoring (by Transition International, in 2017) would have been

125
a good opportunity for this. In case activities (originally planned for) would have been
thought of irrelevant in the meantime, they could have been reformulated at this
moment as well. Especially for governance issues, which are often difficult to quantify,
and thus to monitor, this would have helped.
Regarding activities, outputs, outcomes, and thus impact in governance:
• In DRC, the project staff had had only few interactions with the district / chefferie
staff especially regarding introducing the project to them. The other way round,
the chefferie had introduced the project staff to the communities, and the
project staff had been invited to a few meetings at the chefferie but had not
discussed incorporating / aligning their project activities in the chefferie plans.
Sometimes, the project staff were not aware of existence and / or content of the
chefferie/ district plans, and apparently did not understand the importance of
this outcome.
• In Rwanda, districts already have a way they operate and are considered and
ranked highly. It would have been complicated to have taken more time (then
available) to get the project approaches / activities incorporated in the district
plan.
• In Uganda, there was more interaction and discussions between project and
district staff; some interventions like PIP were to be included into the district
development plan according to the district agriculture officer. But the district
agriculture officer was concerned about who would fund monitoring of these
interventions after the phasing out of the project.
Generally, it can be stated that the component of governance was not given enough attention by the project staff, or not supported enough by the project management. There was no staff directly responsible for the governance component, unlike for other components.
5.5.4. Validity of ToC
(From proposal) What is the validity of the (assumed) causal relationships between activities, outputs, outcomes, and impacts (as stipulated in the theory of change / logframe)? (This will give a link to effectiveness and coherence.) The picture below is the Theory of Change from the original proposal.
• To reach improved watershed management infrastructure and measures in
place, next to the mentioned activities (watershed protection measures and
erosion control and soil fertility measures), some support to the institution
managing the watershed would be needed as well; this could have been paid
more attention during the project;
• To reach increased access to safe drinking water, approaches that can be scaled
up, would be needed; the private sector could have been involved / supported
more (e.g., business development of rainwater harvesting).

126
Figure 11. Original ToC
This ToC has not been updated, which could have been relevant. Next to this ToC, a
logframe was developed as well:

127
Figure 12. Original logframe
This logframe had separate assumptions (more than in the ToC) for each outcome:
• Outcome 1: Increased equitable access to safe drinking water o Cooperation of land owners;
o W4V legal and technical expertise;
• Outcome 2: Effective watershed management improved; o The community adopts new measures;
o W4V technical expertise available;
• Outcome 3: Improved service delivery and water governance; o Local governments are transparent;
o CSOs and CBOs utilize acquired knowledge and skills;
o The right people to be empowered with new skills and knowledge are
available;
o Plans will be adopted by relevant local authorities;
• Outcome 4: water related issues and conflicts effectively addressed; o Buy-in by local communities;
o Political will of all countries;
o Commitment of all actors in enforcing the law;
o Commitment of stakeholders towards transboundary issues.
Reduced conflict through increased access to water and improved watershed management in the
Virunga Area.
Increased equitable access to safe drinking water
Improved watershed management
Improved service delivery and governance
Water related issues and conflicts effectively
addressed
Risks and opportunity for improved watershed management mapped
Functional water facilities in place
Watershed protection measures in place
Erosion control and soil fertility measures demonstrated and
implemented
CSOs/CBOs capacity in influencing LG decision
making in regard to water strengthened
Water service providers’ capacity
strengthened
Transboundary water related issues and conflicts addressed
Community water related and underlying
conflicts addressed
Providers of water related conflicts
information supportedDevelopment of water supply and investment
plan supported
regional stability through improved human security and inclusive growth
Brokering and mediation applied properly in conflict
resolution

128
After the peer monitoring by Transition International (2017), the logframe was changed
as follows, while the (relevant) assumptions seem to have disappeared. It would have
been good if the assumptions would have been checked and updated together with
logframe, as critical thinking about assumptions can make a project work constructively
on the removal of hindrances to these assumptions.
Figure 13. Final logframe
As an example, on this statement on assumptions:
• In the ToC, to reach the outcome “Increased equitable access to water and
watershed management in a more secure Virunga Area, the assumption
“Actors committed to comply to roles and responsibilities” would have to be
fulfilled.
• In the old logframe, to reach the outcome (2) “Effective watershed
management improved”, the assumptions “The community adopts new
measures” and “W4V technical expertise available” would have to be fulfilled,
but the ToC assumption “Actors committed to comply to roles and
responsibilities” disappeared, while this is quite essential to reach effective and
improved watershed management. One needs to have a watershed /
catchment management organization (in whatever form) manage and set and
enforce rules.
Reduced conflict through increased access to water and improved watershed management in the
Virunga Area.
Increased equitable access to safe drinking water
Improved watershed management
Improved service delivery and governance
Water related issues and conflicts effectively
addressed
Risks and opportunity for improved watershed management mapped
Functional water facilities in place
Watershed protection measures in place
Erosion control and soil fertility measures demonstrated and
implemented
CSOs/CBOs capacity in influencing LG decision
making in regard to water strengthened
Water service providers’ capacity
strengthened
Transboundary water related issues and conflicts addressed
Community water related and underlying
conflicts addressed
Providers of water related conflicts
information supportedDevelopment of water supply and investment
plan supported
regional stability through improved human security and inclusive growth
Brokering and mediation applied properly in conflict
resolution

129
• In the new logframe, the assumptions were not mentioned anymore at all. This
links to sustainability of the improved and effective watershed management,
which will be hard without a managing organization / institution.
5.6. Sustainability
5.6.1. Ownership
To what extent do relevant stakeholders have a sense of ownership for the different activities? Impact: Reduced conflict The PIP method focusses directly on local ownership of the development process at
household level. As can also be seen above, this worked in many cases (not all, see the
critical remarks on gender above). This is real ownership of the development process
which was established and even spread beyond the direct beneficiaries.
Material ownership is at another level but still important to consider that the right
entities have ownership. For instance, it makes sense that ICCN is the owner of the
electrical fence. It made less sense that ICCN was owner of water schemes since they
are not a utility company. However, because this grew historically and ICCN had an
interest in maintaining the water infrastructure to keep the people out of the park, this
can be acceptable even though it’s less optimal. In some cases, ownership relations
prevented the development of resources, for instance in DRC there were big landowners
(who had tenants). One interviewee commented that “these landowners had no interest
in sustainability, we could not work with them”. Hence the program actively looked for
participants that could be owners of the process.
Outcome 1: WASH and IWRM In Rwanda, during KIIs and FGDs interviews, community members constantly asked for
more RWHTs for members without tanks; apparently the construction of water tanks
was a relevant intervention, and a linked a sense of ownership. The people without tanks
apparently did not participate in the decision making or repairs, which might lead to a
weaker sense of ownership.
In Rwanda, efforts were made to engage LGs (district, sector, and cell agronomists) and
Imbaraga (a National Farmer Organization from Rwanda that works to improve the
socio-economic conditions of farmers) in PIP activities (trainings, sharing
knowledge/tools) as part of the exit strategy. Technicians participated in a study tour
and trainings. At the time of the evaluation, it was too early to tell whether this had
worked. But it was observed that both at district and sector level, the LGs were well
informed about the implemented project activities and there was evidence that, the
sector and cell staff indeed had visits to the project communities after the project ended.

130
In Uganda, it was noted, that people prefer NWSC piped water to water from the
rainwater harvesting tanks, and only use the tanks when the taps are not bringing water
especially in the dry season. This raises the question on the ownership and participation
in discussions of the construction of the tanks for the beneficiaries (see section 5.1.3 as
well). Water from the RWHTs is used for domestic chores like washing clothes, cooking,
and drinking in the dry season. (During the rainy season, people prefer other water
sources like the piped water from NWSC.)
In Uganda as well (FGD), beneficiaries were paid for all the services they took part in,
and this has had an impact on ownership of the interventions. The beneficiaries believe
that unless they are paid, they will not ensure sustainability of the interventions, yet
these are meant to benefit them. This is a serious threat to sustainability.
In DRC as well, it became obvious that fighting erosion needs a community approach,
and a cash / food for work approach was needed to make the farmers work on these
measures. This may be attributed to opportunistic behaviour, but that was not
investigated more profoundly. In DRC, when community work was organised in the
context of hillside development (e.g., contouring, etc.), W4V facilitators noted that there
were fewer participants when there was no motivation in terms of food for work or cash
for work. Payment for labour took place during hillside development in the Jomba
Group. It was when the facilitators noticed a slackening in the farmers’ leadership that
they adopted a man-day payment on some occasions not exceeding $2/person/day.
In Uganda and Rwanda, people were paid for construction of the tanks and
reinforcement of the stone wall as well as tree planting along the stone wall. For stone
wall and tank construction in Uganda, the foremen were paid 30.000 UGX / $8,3 per day,
the masons were paid 20.000 UGX / $5,5 per day, the potters were paid 10.000 UGX /
$2,8 per day, while for tree planting, 1250 UGX / $0,3 per tree planted.
Comparably, poor management and cleaning of the tap stands (e.g., in Rukongi Parish),
can be attributed to this work left to the caretaker only by the WMC and the water users,
as he was the one benefitting from the collected money.
So, despite the fact that the work people got paid for was for their own benefit, it still
needed financial incentives in some cases. Unfortunately, this is often the case,
especially in areas where people are already accustomed to it. Getting out of that
mentality is really the most difficult thing in program implementation, it will just make
people reluctant to do anything unless they are paid. Again, the PIP approach found a
way around this by only insisting on full ownership and free participation. It needs time
and a good understanding by people in the program what they are doing it for.
Outcome 2: Water management and governance

131
While most of the first steps in institutionalizing water governance (put in place WUCs, sign
MoUs with WUCs) were done, for the next steps (legalization of WUCs, and support to WUCs
by LGs) of water governance, have not been reached, possibly because these steps take
more time. This could endanger the sustainability of the WUCs.
In DRC (Bwisha), the responsibilities of the chefferie were not clear to its members, while
the chefferie (as a key actor) would need to support the water committees that were
set up.
Outcome 3: Improved relations A sense of ownership hardly exists in the community for the stone wall, which was
constructed before the existence of W4V. This may be due to the doubts on its
effectivity, and possibly as well to some jealousy towards the electrical fence in DRC.
According to an interviewee, the stone wall was rather a short-term solution that only
reduces but not solves the problem (as opposed to the electrical fence, which is
regarded as a long-term solution).
In Uganda, the project led to formation of a lot of small VSLAs where project
beneficiaries save money (1000 UGX per month, on top of water user fees paid per
jerrycan) and at the end of the year, the whole community decides on how the money
can be used. As the group (community) decides what the saved money is used for,
members may not feel a sense of ownership, as the decision may be contrary to their
own interests; this is of course inherent to VSLAs.
5.6.2. Participation
To what extent are relevant stakeholders active in ensuring the sustainability of the different activities? Outcome 1: WASH and IWRM PIP beneficiaries of the first generation are active in transferring their knowledge to the
second generation, however, such training is hampered by the lack of a road-map and
guidelines detailing how and when the beneficiaries can manage training a new
generation of PIs. In addition, in some instances, the PIs refuse to train others as they
would like to be remunerated for their time and services.
In addition, as already mentioned, the District Agriculture officer is interested in
incorporation the PIP approach in their development plan for the district. Although the
district is currently facing some challenges regarding the facilitation and monitoring of
the trainings, including the PIP approach in the district development plan would ensure
that knowledge and discussion around the topic remain so that the approach is not
forgotten and can be sustained. In addition, it would create a centre that people can
refer to in case of doubts.

132
In Rwanda, in Bugeshi, the first generation PIP beneficiaries did not train a second
generation since they did not understand the concepts welll. In Nyabihu however, a
second generation was trained, and farmers were more positive in passing on the
knowledge. Differences between Bugeshi and Nyabihu may be attributed to different
W4V staff in the two areas, an intern involved in Nyabihu, and a GALS component added
in Nyabihu.
It was observed that both at district and sector level, the LGs were well informed and
had visits to the project communities after the project ended, which is an indication of
sustainability.
Outcome 2: Water management and governance The set-up of WMCs who take care of operation and management of RWH tanks has
been a good approach. In Bugeshi (Rwanda), repair activities have started (which is a
good sign for the operation and maintenance, but a bad sign for the initial construction
quality).
Here, it has already become an issue that only the people having a tank at their home
are responsible for the operation and maintenance, while others (usually, 4 households)
also benefit from the water. So far, the other households are allowed to fetch water
without a problem. But it was observed that it is just a matter of time before they are
prevented from using it because they don’t contribute to the maintenance and add to
the burden of repair. In this area, the WMC could even not manage all the operation
and management issues in the area as these were too many, while the water fees that
had been collected were not enough to cater for all the issues. This again testifies to the
fact that roof water tanks are a great technology but not for sharing. Especially not when
there is only 5 cubic to share.
In Burera, there were already households with tanks that had refused to be part of the
WMCs because they did not see why they should be members, yet they must handle all
the operation and management issues on their own. This kind of scenario is bound to
influence other tank owners to also not take the WMC seriously.
In Gaheriheri village, Butaka cell, Bugeshi sector, the women did not know their roles on
the WMCs and could not explain them. In Nyabihu however, a GALS approach was added
to the PIP training, which may explain the better understanding of women of the
approach in Nyabihu.
During the field work in Uganda, the researchers were not able to have an entire WMC
available for an FGD. The ones who showed up, did not always know their
responsibilities. This is an indication of a lack of motivation of people to invest time in
water management. It seemed that the caretakers of the tanks and tap stands were the

133
ones in charge and making decisions on behalf of the entire committees, which may be
because they are also the ones benefiting from the water fees collected per tank or tap
stand.
The WMCs have introduced VSLAs to manage the water infrastructure.
The VSLA system was used (in theory) to improve management and repairs of the tanks.
every tank owner (WMC member) brings money on a monthly basis for maintenance of
the tanks, which is lent out to members against a low interest. In this way, the money
collected for maintenance of the tanks grows, while at the same time giving the
members increased access to credit.
The problem in Rwanda is that the amount of money being collected is too small to be
lent out or used for repairs. In Uganda, the groups to which people are asked to
contribute are too many (water infrastructure maintenance, stone wall maintenance
etc) yet the farmers have low income. There is a tendency in international aid to assume
people will pay for O&M without taking into account their capacity to pay, their capacity
to get organised or even their interest to pay. In an area with more than one program
people are likely to wait for the next program to solve their O&M issues. The W4V also
contributed to this mentality by repairing existing tanks.
Outcome 3: Improved relations The first impressions from the field show that the PMP approach has not only been
contributing to the reduction of conflicts, but give hope that people are committed to
involve themselves in conflict resolution in the future as well. It is hard at this stage to
say if this mentality will stay.
5.6.3. Transfer of knowledge
To what extent was knowledge generated during the project transferred to relevant local actors? To what extent was knowledge transfer (and/or participatory knowledge development) part of the project’s implementation approach? Impact: Reduced conflict During one of the interviews, a worry was expressed that the Dutch Embassy has
initiated a new project (TRIDE), without all the W4V partner organizations being
involved. Interviewees spoke of a waste of the knowledge (of the approaches and area)
build-up started during W4V. However, there is continuity with other organisations and
approaches.
Outcome 1: WASH and IWRM In the field in DRC, worries about the departure of W4V were voiced, reflecting the worry
that after the retreat of the project, activities would not be continued. More specifically
on the PIP approach: on village level, the modest target (10 villages adopting PIP) was

134
almost achieved, but on farmer levels, of the ambitious target (8448 farmers adopting
PIP), only 2170 farmers (26%) was achieved. This may be due to the importance
(inherent to the PIP approach) of capacity building by the first generation to the next
generation (and further on); if this capacity building gets stuck at one generation, then
the process stops. Quite some people stated their worry that the PIP approach would
stop at the second generation of PIP, even when considering the encountered dynamism
and innovation of some farmers. Some observed that the people who were formed by
the project animators seem to be more dynamic than the ones trained (second
generation) by the first generation. In Uganda, it was mentioned that some PIP
beneficiaries refused to train others or would request for money to train others. This
would affect sustainability in a negative way. Moreover, as already mentioned, there is
a lack of a road map detailing when and how the beneficiaries could take over the
training. The first-generation beneficiaries in Nsherima Bugeshi (Rwanda) mentioned
that they could not train others and needed the project to come back and train more
beneficiaries as more people are willing to take up the PIP. These beneficiaries could not
explain their goals, had no vision for their households. This may be attributable to the
specific training they got.
Opposite sounds on PIP were heard as well: people who have the confidence that
especially an approach like PIP, with its chain of different generations, is the best
possible method to ensure sustainability, as knowledge transfer is at its core. As this
evaluation took place still during the project lifetime (within the DRC project extension
period), it may be too early to judge already.
In Uganda, there was the issue of the soil scanning machine, in which many had high
trust. As these machines were still under research and they had been programmed
wrongly, the conclusion was drawn that results obtained were inaccurate, and that it
would be sent back to WUR. Upon withdrawal of the soil scanning machine, all
respondents showed concern that they were going back to their crude ways (from
before the project) of just adding nutrients to soil without knowing whether these were
the right nutrients in the right amounts. This would be a relapse of sustainability.
Outcome 2: Water management and governance Several trainings were given to the teams on the principles of IWRM. It would have
been more interesting if this connected more to the local programs had the IWRM
method been implemented. It’s likely the knowledge remained theoretical.
Outcome 3: Improved relations In DRC, like the doubts on the continuation of the PIP approach after the retreat of the
project mentioned above, similar doubts were voiced on the PMP approach. Apparently,

135
some chiefs (of groupements) did not attribute the good results of the spatial planning
on hills and of water supply to the PMP approach, and therefor are not motivated to
support it. They may feel bypassed by it, and even loose some income (?). Direct
beneficiaries however (who were trained by the local NGOS, who in turn were trained
by WUR) are more positive on the PMP approach, as this gives especially to the poor
ways to solve problems without being forced to pay for legal services. The authorities'
dissatisfaction with the PMP approach has much to do with its voluntary nature. Many
households have flocked to this approach which not only restores their confidence but
is also voluntary. In the past, those who went to the police or the cluster to complain
had to pay exorbitant fees without a solution to their problem.
5.6.4. Operation and maintenance water supply
Specifically for water supply activities: How is operation and maintenance (including collection of resources to pay for this) organised, and to what extent will this be able to address O&M requirements after the project? How will communities access expertise for repairs? How much revenue will need to be generated to pay for repairs, and how much is being collected? One interviewee stated that, especially in DRC, efforts were made to involve the private
sector more in water supply, as part of the exit strategy. Technicians were trained to do
small repairs.
Outcome 1: WASH and IWRM Regarding RWHTs: In Rwanda (Burera), several repairs (gutters, tanks, and leakages)
over a short period of time were reported. In Bugeshi, repairs to broken tap stands,
polluted gutters, and finishing were reported. Apparently, the design in Burera was
better than the design in Bugeshi. This need to do regular repairs is felt among more
tanks’ owners. The need for more trainings on repair was therefor heard often. The
savings and credit facility for WMCs may encourage them to meet and solve this need:
if members need to fix their tanks, they can take a loan. However, not always sufficient
money is collected and available for this, and moreover borrowing of money is
complicated (all 7 members of the committee have to sign), which could discourage
borrowing. Some WMC members want to be paid a salary for their work. Some
households with tanks (Burera) did not join the WMC because they would need to pay
10,000 RWF to join. This could influence others to leave. The WMCs were (being)
registered as cooperatives, which have as a guideline that each member pays a
registration fee of 10,000 RWF / $ 9,5. These, WMCs thus were larger than other WMCs
(normally 5 - 7 members), as they brought together all community members in one cell
that had a (W4V) RWHT. It was observed (FGD Burera) that the tank owners who had
not joined the WMC hadn’t done so for the reason of the obligatory fee. There were
already some complaints regarding what the cooperative will do now that the project
ended.

136
In DRC, each household needs to pay 1000-2000 CDF / $ 0,5-1,0 per month. If paid
indeed, this would add up (5 households per RWHT) to $ 30-60 / year, which should be
sufficient for regular repairs (masonry, new tap, etc.).
In DRC as well, the chiefdom water officers don’t have the financial means to supervise
/ support the WMCs in their work.
One interviewee (from Uganda) mentioned the example of the set-up by the project of
MCCDA (Mgahinga Community Conservation Development Association), that oversees
all activities. Masons are available (and paid from water fees) to repair tap stand levels.
Regarding piped water from NWSC (Uganda): fees are collected per jerrican (50
Ugandan UGX / jerrycan), and a monthly fee is remitted to NWSC as well; the caretaker
then takes 40% of the remaining money as motivation. This monthly fee is paid from
what the caretaker collects per jerrycan; there is no clear way of accounting for this,
although the chairperson of the committee sits with the caretaker when the bill from
NWSC is received, and the caretaker brings out all the money that he collected for that
month.
Communities reported that there have been a lot of issues relating to bursting of pipes.
NWSC usually takes about two days to repair burst pipes.
5.6.5. Knowledge of IWRM
Specifically, for IWRM activities: to what extent do relevant stakeholders (mostly farmers) have the required knowledge and motivation to maintain the interventions? More could have been done to make the knowledge of IWRM more fitting to the needs
and the implementation. As already stated above, several ideas were formulated about
the catchment effect and the erosion control of the water tanks and soak pits. We stated
that some of these ideas were not realistic and could not be maintained in the field.
However, more knowledge development on the use of soak pits or infiltration pits
draining away from the downpipes of households all the way to the implementing
technicians could have helped in scaling this approach. Furthermore, the transfer of
knowledge on catchment approaches lacked a practical counterpart, so an
implementation project where the effect could be seen. The success of the PIP approach
in tackling some of the IWRM problems at catchment level is just that, the success of
the PIP approach with complementary catchment effects.
In the final W4V ME Progress Report_V11, some indicators underlying outcomes and
outputs related to IWRM have not been reported on:
• Output 1.2: Erosion control and soil fertility measures adopted/ implemented: 1
indicator;
• Output 1.3: Watershed protection measures in place: 3 indicators;

137
• Output 2.3: Support the development of IWRM plan and investment plan by
Districts/ chefferies/ Parishes: 1 indicator;
This is an indication of the lack of attention for IWRM as a concept; it is acknowledged
that some IWRM elements have been included in the PIP approach.
In DRC, it was proven difficult to involve the communities in the fight against erosion so
that such mobilisation was only achieved through paying the farmers for their work in
defining the contour line. This shows a lack of motivation (and/or knowledge) that may
hamper the sustainability of the activities.
In Rwanda, because of the government campaign on practices for watershed
management, including soil and water conservation measures, the IWRM activities have
a high chance of being maintained.
5.6.6. Conflict transformation
Specifically for conflict transformation activities: to what extent and how are these expected to continue after the project ends? Outcome 3: Improved relations Regarding the reduction of conflicts between wildlife and communities, from one of the
KII in Uganda, the good example of the Problem Animal Management (PAM) popped up:
this was formed before the project and strengthened during the project to ensure
continuity and sustainability of interventions to solve conflicts between wildlife and
communities. It is a self-motivated group that wants to strengthen the stone wall (e.g.,
by planting Erythrina) to reduce conflicts between wildlife and communities. Its elected
members are not paid but pay a membership fee (of 10 000 UGX, and a monthly
contribution of 2 000 UGX), and it has formed a VSLA for purposes of maintenance and
sustainability. This group has contributed to the following results:
• Increased community participation in activities like erecting the stone wall at the
foot of the national park;
• Weekly monitoring of the areas near the park to ensure safety of the gardens,
which has regulated encroachment;
• Especially at the places where the stone wall is not yet reinforced with cement
mortar, animal encroachment is still a problem.
The signed MoUs in Rwanda are good steps towards better cooperation, but it needs
signatory parties that have an intrinsic commitment to or allocated budget for the
outcomes of the MoU, or clear benefits.
In Uganda as well, the reinforced stone wall has worked as a demonstration plot: other
villages now plan to have the same intervention and conservation partners have visited

138
the site and plan to support the re-enforcement in other affected villages. So far, these
are only plans, and it can’t be said if they will be implemented indeed.
This could serve as an example for other areas, which can’t be confirmed yet at the time
of this evaluation.
Regarding the specific case of the stone wall electrical fence in DRC, ICCN / Virunga
Foundation has its own sources of income (e.g., tourism), which is used to cover
(amongst others) the expense of the maintenance of the fence.
It appears that the solutions to reduce the conflicts between farmers and pastoralists
have not yet reduced these conflicts to an acceptable level. Keeping cattle in stables is
not applied in the region, and there are no designated grazing meadows, reasons why
cattle will always be a threat to harvests and to water. For instance, in Chanzu,
pastoralists appear to break water pipes for their cattle to have water, as no cattle
troughs are available although 9 will be completed end of 2021. The pastoralists had
proposed to rehabilitate the still existing cattle corridors to protect agriculture from
their cattle. According to another interviewee, the project indeed has opened cattle
corridors. The proposed option of muzzles for the cattle appeared not to be accepted
by the pastoralists. The project did not meet the expectations of the farmers: not only
are there not enough community pastures in the area, but also the farmers have not
adopted the zero grazing or stable rearing technique which would be a solution to cattle
roaming. It was observed that farmers reported cases of destruction of their field crops
by cows. So, in this type of conflicts, a lot needs to be done before a sustainable
reduction of the conflict can be reached.
Regarding the muzzles: An inventory done (by W4V) in December 2021 in DRC gave the following numbers:
Table 29. Use of muzzles
TABLEAU SUR L'UTILISATION DES MUSELLETTES DANS LE PAYSAGE VIRUNGAS
PROJET W4V
Vaches Moutons Chèvres Porcs Vaches Moutons Chèvres Porcs
Kinyangurube 44 61 71 201 149 140 19 55 61 5
Gatsibo 21 51 99 197 161 170 21 58 68 23
Chanzu 32 88 103 154 153 122 29 41 46 6
Kariba 36 53 93 121 99 107 21 41 41 4
Rwunga 14 35 58 53 34 75 9 27 37 2
Runyoni 125 209 288 112 210 169 33 45 80 11
Mihika 1 153 206 272 146 215 169 45 44 55 25
Mihika 2 256 201 299 204 188 142 46 46 43 7
TOTAL 681 904 1283 1188 1209 1094 223 357 431 83
Statistiques d'animaux destinés au port des muselettes
Localités/villages
Nombre de
musellettes
produits
Nombre des
musellettes
utilisées
Muselettes utilisées par espece

139
From these numbers, it could be concluded that of the total number of all 4056 animals,
27% (being 1094 animals) were muzzled. For a newly introduced approach, this seems
to be a promising number (if followed up).
5.6.7. Key blockages
Overall, what key blockages are foreseen in sustaining the effects of W4V?
• Many conflicts cannot be controlled by the project and will continue to make it
difficult for people to maintain a sense of ownership. We also believe that in
unstable situations, the collection of maintenance fees can also attract the
wrong interest. This will provide blockages for saving and loan groups or
intended repairs of infrastructure;
• The park authorities will continue to be in conflict with communities / farmers
where the boundary is still permeable;
• A sense of ownership will lack as well if people have been paid to do
development work;
• The RWHTs are not likely to be maintained by the WMCs. We already noticed
some discord about the management set-up, and this will not likely improve the
coming years. We believe the technology in combination with the management
set-up and the intended catchment effect is not easy to maintain when people
do not truly depend on the infrastructure for their water;
• A lack of understanding of IWRM as an approach at (sub-)catchment level to
balance water quantities, if possible, caught in IWRM plans, will make proper
land and water management difficult;
• A lack of resources at the level of the LG will be a barrier to continue the activities
(e.g., the supervision of the WMCs by the LG water officer).
5.6.8. Stabilizing effect
From proposal: Moved from section on impact) To what extent has the project had an impact on stability in (and around) the targeted area? This question needs some more time to be answered, as the project has only recently
finished (in Rwanda, Uganda) or is still ongoing (in DRC). To give a first indication of the
reduction of different conflicts due to the project, possibly leading to more stability:
• Upstream – downstream (Runoff, erosion, flood mitigation): The project has
shown solutions and how to reach these solutions through the application of
bottom-up PIP approach to agricultural water harvesting. However, the
upstream downstream connections were a side effect of the PIP agenda. More
could be done to reach higher stability. The evaluators believe this aspect of
water harvesting deserves more research, or at least more than the current

140
evaluation and the M&E has allowed. A proposal went out to continue working
on this.
• Park (wildlife and authorities) – communities: The construction of the electrical
fence, and to a lesser extent the construction of the stone wall, have reduced
the encroachment by wildlife and the entering of people into the park (looking
of natural resources) and thus reduced conflicts between park authorities and
communities; the same accounts for the construction of rainwater harvesting
tanks;
• Within households: In most areas the PIP approach has contributed to
involvement of more (and diverse) family members being involved in e.g.,
planning and spending;
• Within communities: The PMP approach has contributed to communities that
can solve conflicts themselves without the need to involve (sometimes corrupt)
authorities;
• Between ethnic groups: This conflict is difficult to speak about in the intervention
area.
• Farmers – pastoralists: The project has attempted solutions (muzzles, cattle
corridors, washing place for cattle, field fencing), some of which have
contributed to higher crop yields. We believe that maintaining these practices
will be challenging when there is not follow up;
• Armed groups - government: the project has hardly been involved in these
conflicts (while armed groups are present in the program area; a good sign may
be that project staff has never been kidnapped during the programme.
5.6.9. Health issues
(From proposal) To what extent health issues (as part of environmental sustainability) have been addressed? Outcome 1: WASH and IWRM In the section on unintended effects, the positive (unintended) results on health have
been mentioned already. According to one interviewee, since the project, more people
have access to clean water, and people are aware of the quality of water they drink. This
has resulted in a reduction of water borne diseases (amoeba, diarrhoea, cholera), which
could be partly confirmed by the following epidemiologic data.
Total number of administrated water-related diseases in Kisigari / Kabaya (DRC) 2017-
2021:
• 2017: 4701
• 2018: 3093
• 2019: 3635
• 2021: 3914

141
The steep reduction in 2017 (too fast), and the gradual increase from 2018 (during the
project), however cast doubts on a direct causal relationship between the water-related
diseases incidence and the interventions by the project.
In Rwanda, it was noted however, that there was a lower water borne diseases
prevalence (cholera, diarrhoea, dysentery, typhoid) in their areas because they had
clean water nearby (tanks). No statistics could be found to confirm this.
5.6.10. Legal issues
(From proposal) To what extent legal issues (as part of institutional sustainability) have been addressed? Outcome 2: Water management and governance Some of the WMCs are supported by a LG.
Outcome 3: Improved relations Quite a lot of conflicts were transformed by W4V (see table 14), which means that these
issues were arranged amicably, and thus not referred to the police / court.

142
6. Conclusions
6.1. Project achievements
6.1.1. Outcome 1: WASH and IWRM
Water supply achieved good results in all countries. Indeed, 68.4% of the respondents
of the internal evaluation claim that they have increased access to water thanks to W4V.
The communities therefore need to walk shorter distances and have more time for other
activities such as school. The agriculture / PIP / IWRM component of the project showed
good results. However, the baseline value was set very low i.e., 1005 hectares,
representing 3% of the total intervention area). The IWRM approach was integrated in
the PIP approach. A catchment approach, which is one of the principles of the IWRM
approach, could not be undertaken and this is a missed opportunity. However, the PIP
approach was well received and accepted by the population.
6.1.2. Outcome 2: Water management and governance
In each country, one WMC was established per RWHT or tap stand and were found
operational during the external evaluation. The results on water governance and PMP
are mixed as not everyone seems to have understood it yet. Community-based water
governance takes more time than was available in this program. In Uganda, there was
already an institution which ensures more sustainability (as compared to DRC). Overall,
there are still places where the setting up of water management is ongoing.
Infrastructure is still being developed. International collaboration between Rwanda and
DRC is politically complicated
6.1.3. Outcome 3: Improved relations
PMP shows some good results to this effect. The general message from the beginning
has been that the approach needs time to start working. It can be said that the
infrastructural works aimed to improve relations have worked. The setting up of
electrical fences, walls, trenches also improved the relations between the park and the
people. In Uganda this still needs work. The PMP and interestingly, the PIP approach
also contributed to improved relations in the household. With this outcome the
evaluator noticed that attribution became an issue: was the conflict reduced because
there is now water available? A fence? The PIP or PMP approach?
6.2. Assessment of the project
6.2.1. Relevance
The project was definitely relevant. Conflicts over water and land, households,
interethnic, international and with the part. The relevance was biased towards technical
solutions and to a lesser extent stakeholder dialogue. Mismatch between politically

143
correct changes in the ToC for ethnic diversity and conflict resolution and operational
realities. The project tried to address the underlying causes with for instance park
authorities but did not always get a result. The PIP approach made itself very relevant
to several ongoing issues around gender, land rights, erosion etc.
6.2.2. Coherence
The project aligned with ongoing programs and projects in the area and sought to align
with relevant policies and government priorities. When government bodies were willing
and able to collaborate, this happened. The project departed from existing initiatives
when it introduced the PIP and PMP method, some initiatives were already working in
this direction but the PIP and PMP was stronger and implemented separately.
6.2.3. Effectiveness
The effective implementation of the theory of change was delayed by changes in the
approach, but these changes led to a more prominent role for conflict resolution using
the PIP and PMP. In the meantime, stable progress was made on implementations of
technologies such as waterpoints and tanks, leading to access to water. The fencing also
provided additional conflict mitigation at these places. The evaluators feel the use of
tanks to mitigate floods could not and did not make the proposed impact. In addition,
the building of walls and fences should not lead to a migration of the wildlife problem.
It was noticed that different ideas existed amongst project staff on the use of walls to
reduce encroachment by animals. Different ideas also existed about the catchment
impacts of the tanks. Some program staff explicitly stated the tanks were identified as a
solution for reducing flooding, hence explaining the clustering of the tanks. What we can
signal as evaluators is that if the tanks were supposed to create a catchment or IWRM
effect besides water provision than this could have been done better. The soak pits were
a good addition, but the team found they were often connected to the tap rather than
the downpipe.
The reduction of the IWRM agenda because it should be based on a total catchment
perspective and government collaboration is understandable. However, there are
alternative approaches. Based on experience from several African countries we can say
that if the IWRM principles are followed to the letter there would be very few real IWRM
programs. In fact, the bottom-up PIP approach to catchment thinking might be worth
much more than many governments supported programs that never come to the
implementation stage.
6.2.4. Efficiency
In terms of budgeting the project appears reasonably priced, particularly given the
difficult context in which it operates and the over-achievement on the outputs (conflict,

144
covid etc). Within the project team there was discontent over transparency, which
appears to be due to a lack of clear communication.
Some staff were not informed about their budgets which made implementation and
planning more complicated. The implementation was delayed by internal restructuring
through the evaluation of transition international. But it was unlikely that the
implementation of for instance the Kibumba project could have been done quicker and
cheaper without these discussions. The efficiency of external expertise was debated
within the program. Particularly the Dutch experts who could not travel to the field and
provided remote advice on the project were thought to be less efficient and effective.
Their role was reduced in favour of local expertise or communication limited to the
project coordinator
6.2.5. Impact
The project boasts very good results with both the internal and external evaluation
showing large numbers of people with improved access to water, increased water
governance and reduced conflict. We can only complement the organisation with these
good results that were delivered in a relatively short time span and under these trying
conditions. The point of attribution and socially desirable answering might reduce the
impact numbers a bit. For instance, to what extent is the reduction of tensions only
attributable to the project and its implementation or could it be that the LG’s role also
contributed? It’s difficult to tell in these complex situations. However, we hear sufficient
stories from the field that support the quantitative impact and particularly the PIP
approach had a lot of unintended positive impact for social cohesion.
6.2.6. Sustainability
To draw conclusions on sustainability when the project has still not ended, is quite
impossible. We can only observe what measures have been taken within the project to
make the chances on sustainable project results larger. The PIP approach in itself is
meant to be sustainable, by the training of the next generations of beneficiaries. It needs
to be seen if these consecutive trainings will continue. The PMP approach could be a
sustainable approach as well, through the continuation of the PMPs; in a conflict-ridden
area like the intervention area however, conflicts may be too many or too severe, and
thus may not be solved by the PMPs, which in turn may lead to disappointment. Finally,
the set-up of WMCs to take care of operation and maintenance (and the link to VSLAs
to cover the costs of repairs) has been well thought through but would need follow-up
and support to support in doing too costly or complex reparations.

145
7. Recommendations / lessons learnt
7.1. Recommendations for the consortium implementing the project
• Changing a ToC, approaches and partner organizations during a project can be
relevant and necessary (or caused by a necessary reflection process). This
however needs to be compensated with new timelines for the deliverables. The
recommendation that follows then is mostly for the donor to give a project a
new horizon, the processes and developments that projects need to go through
are usually lengthy and need time, often more than 4 years. Revisions in the ToC
make this even more unrealistic;
• It would be good to check, at some stage (especially when other changes are
asked for, e.g. in the ToC) to check an M&E framework, including indicators,
activities and targets on clear and SMART formulation and internal consistency,
while removing redundant indicators and activities;
• In a highly complex conflict-ridden area, setting a broad overarching goal may
increase the relevance of a project, as complex issues need multidimensional
solutions from different sectors. The recommendation corroborates with the
above comment on the ToC, leave room between intermediary outcomes and
final outcomes (in the form of assumptions) the program cannot control. This
will allow the complexity to exist without the program claiming to cover all and
do everything;
• From the comments of the people in the field we get the impression that the
changing of the ToC based on the involvement of Transition international were
rolled out top down. However right the conclusions might have been and as
much as the project might have improved due to an external review, the process
needs to be owned by all. With this we mean that the emphasis on how to
approach conflict in relation to water and land was changed top down. Getting
this into the fabric of the project would have been easier if the staff on the
ground was made part of it;
• A due diligence or stakeholder assessment of potential project partners can help
to prevent high expectations of the implementation capacity of an organisation
such as GVTC;
• Implementing staff and partner organizations should have an overview of
budgets and activities from the start and be involved in changes in those, to plan
and budget more efficiently themselves;
• Having strong guiding documents describing the purposes of the intervention of
the project would increase the efficiency of the project. For instance, the

146
misunderstandings about the catchment role of the water tanks or the siting of
the soak pit;
• Similarly, within the program team and between different organisations there
was discussion about the extent to which the fencing and walling of the park
should have been done all the way around or not. One of the consequences of
patching up part of the wall and fencing off large parts in DRC is that some parts
remain unwalled and become a hotspot for people wildlife conflict. For the
people who live there it is not acceptable that they get raided and their
neighbours not. This is a consequence of what is perhaps unfinished thinking of
what the park is supposed to be, an island or a continuum with the areas around
it;
• To counter the problem having international staff that could not go to the field,
it could have been explored to bring the local experts to a place where they could
have engaged with the international experts and presenting their situation and
work on team building. It was stated that this happened for some international
experts but for others there was still clearly a communication and connection
gap;
• Using 5 m3 roof water tanks for floodwater mitigation in an environment with
relatively high rainfall cannot create a catchment impact. There was discussion
between members of the consortium if this was the intention of the work. Some
staff say it is the intention, others not. The implementation strategy (clustering
in high runoff areas) suggested this effect. So at least the implementing staff was
convinced this was the intention. The soak pits are a good idea to reduce runoff,
and this could have worked better if the soak pits were constructed around the
(overflowing) tanks, or if the downpipes were connected to the pits. This could
also have been brought to a larger scale without the tanks;
• The evaluators understand the difficulty to implement IWRM measures from a
catchment perspective in three countries. However, it is believed that IWRM
implementation started with too large and ambitious an agenda and was
therefore difficult to implement in this context. Smaller infrastructure or
multipurpose infrastructure could have been proposed, starting without
government involvement and was in fact implemented. Therefore, scaling down
the stakeholder expectations of the intervention while at the same time
including the catchment effects of the infrastructure in the analysis could have
increased the IWRM component. For instance, smaller nature-based solutions
(gully plugs, contour lines, bush lines etc.) serve multiple purposes and can be
part of a catchment approach to IWRM. This way of approach to IWRM was not
found relevant by the people responsible for the IWRM agenda. The evaluators
approach would have been to start small and seeing is believing. If at a smaller
scale (one tributary) several interventions could have been piloted and

147
monitored, with a smaller number of stakeholders then this would have created
interest from other stakeholders who were first said to be reluctant (such as
government actors);
• The catchment effects of the PIP approach were perhaps not enough to cover
the whole IWRM agenda, but there was an effect. The evaluators have not been
able to assess this impact quantitatively and we recommend to do follow up
research on this. This recommendation is not a critique, merely a wish to
understand better the processes in the landscape to see how other programs
and project can work on this;
• Training could have been extended to other community agricultural extension
workers for replication in non-demonstration villages and therefore increasing
the impact of W4V;
• Communication and transparency could be improved. Implementing staff and
partner organizations should have an overview of budgets and activities from the
start, be briefed and involved in changes, to plan and budget more efficiently
themselves;
• The theory of change that emerged from the report could have left more room
for uncertainty and unexpected results, in the form of (reviewed, updated)
assumptions. For instance, by working with intermediary outcomes and then
stating the final outcomes are not within the project control. The more practical
work with water provision and human wildlife conflict still provided an outcome
that people had less issues with water. This outcome could then be seen as an
intermediary outcome that feeds into a final outcome whereby conflicts with
access to water are reduced. Between the intermediary outcomes and the final
outcome is the point where the project should no longer be directly responsible
or held accountable but relies on assumptions. Such ambiguity can facilitate local
ownership and operationalisation of the project in a dynamic and complicated
environment.
7.2. Recommendations for the GLRP
• The GLRP needs to consider whether traditional 4-year implementation
programs can be asked to address the underlying causes of conflict in a region
like the Virungas. We believe the conflict strategy report for W4V captured the
problem well and also how it should be addressed ideally. Operationalisation in
the everyday context of a conflict sensitive area could have benefitted from an
approach that leaves open more room for local organisations to manoeuvre and
adjust to the dynamics of conflicts;
• Considerable input and involvement by a donor during the project can be
beneficial, relevant, and necessary, but it can frustrate the implementing

148
organizations as well in their efforts to implement a project and the need to
adapt. If there is strongly felt need to intervene in the project, the GLRP should
also consider part of its own shortcomings (because the project was given an
initial go ahead). ‘Rewarding’ the project with more time or more finances then
becomes reasonable;
• When working with the PIP approach, including a gender approach can lead to
bigger impact as it has been seen in Nyabihu (Rwanda).
7.3. Recommendations for park authorities, LGs
• The extension of the stone wall (both in Rwanda and Uganda) to other villages
along the park boundaries would have prevented jealousy between communities
and would have reinforced the impact of W4V;
• It is good to have inclusion of (ethnic) minorities incorporated in a project logic,
but there needs to be a balance between the numerical presence of the minority
and the interventions specifically focused on them;
• While keeping an eye on manageability of many stakeholders involved,
involvement of a variety of relevant district departments (Work, Education,
Police, etc.) and religious leaders can help to spread messages and mobilize
communities.

149
8. References
(An overview of the W$V documents is given in Annex 9.1)
AidStream. (2021, November 1). Food Security and Inclusive Access to Resources for
Conflict Sensitive Market Development (FARM). Aidstream. Retrieved December
14, 2021, from https://aidstream.org/who-is-using/GB-SC-SC030289/11229
Déogratias, N., Janvier, N., Fabrice, N., Emmanuel, K., Robert, B., Karume, K., & James,
B. (n.d.). A Survey of Hydrological Systems in the Greater Virunga Landscape,
Around the Volcanoes National Park, Rwanda.
MFA (2018). (rep.). Multi-annual Country Strategy 2019 to 2022 Great Lakes region
(pp. 1–18). Retrieved from
https://www.netherlandsandyou.nl/binaries/netherlandsandyou/documents/pu
blications/2020/09/23/great-lakes-multi-annual-regional-strategy-and-
qa/Great_Lakes_Multi-Annual_Regional_Strategy.pdf
Search for Common Ground. (2020a). Maji Ya Amani – Chefferie Plaine de la Ruzizi
(Luberizi) et Chefferie de Bafuliru (Lemera et Kigoma) Province du Sud Kivu
(Conflict Scan). Search for Common Ground. Retrieved from
https://www.sfcg.org/wp-
content/uploads/2020/12/Maji_ya_amani_Rapport_Conflict_Scan_Sept_2020.p
df
Search for a Common Ground (2020b). FARM - Food Security and Inclusive Access to
Resources for Conflict Sensitive Market Development – Tujenge Kwa Utulivu –
Territoires de Rutshuru et de Masisi – Province du Nord-kivu (Conflict Scan).
Search for Common Ground. Retrieved from https://www.sfcg.org/wp-
content/uploads/2021/06/Rapport__Conflict__Scan___FARM_2020_valid%C3%
A9-.pdf
Vaessen, T. (2018). (rep.). Maji Ya Amani Quarterly report (July-September 2018) (pp. 1–
12). Retrieved from https://aidstream.org/files/documents/Maji-Ya-Amani_Q3-
Narrative-Report-2018-20190108030142.pdf
https://www.sfcg.org/wp-content/uploads/2021/06/Rapport__Conflict__Scan___FARM_2020_valid%C3%A9-.pdf

150
9. Annexes
9.1. Overview of available reports for external evaluation

151
W4V documents received (most in October 2021)
Name of report / document Number of files
Landslide / erosion measures 5
Conflict strategy 1
Location of RWHT 1
BV_W4V_Phase III vf.png 1
W4V Internal Draft Report _November 2021.docx 1
W4V progress report to RDB Final March 2021.docx 1
W4V ME Matrix Revised version 29_06_2020.docx 1
Questions March 2020 V1.docx 1
More documents were received afterward, separately.

152
9.2. Overview key informant interviews
Category DRC Rwanda Uganda General
LG • 1 Environment
department of
Bwisha
Chefferie,
• 1 rural
development
department of
Bwisha
Chefferie,
• 1 Public
procurement
department of
Bwisha
• 2 members of
Local peace
and
Development
Committee
• 3 District staff
• 3 Sector
Agronomists
• 6 Cell staff
• 10 Village
leaders
• 4 District staff,
• 2 Subcounty
staff,
• 4 Village LCs
Local leaders • Clan/ family
heads
• WMC
chairpersons
• 3 WMC
chairpersons
• 2 village elders
• 3 WMC
chairpersons
Park officials • Park warden
• ICCN
• 1 RDB • Park warden
• UWA
Project
implementors
• MDF project
staff (project
officer, M&E
officer, 3 PIP
officers, 1
water
Engineer)
• 3 PMP
partners:
GRACE,
CRONGD-NK
and FEMISA
• 2 MDF project
staff
• 1 IGCP staff
• 1 contractor
for water
tanks
• 1 GVTC staff
• MDF project
staff
• NWSC staff
• Project
officers
• Members of
the steering
committee
• International
experts
• National
specialists
• External
accountant
Donor • Embassy staff
in Kigali

153
9.3. Overview of FGD
DRC Rwanda Uganda
Total 12 FGD, total 89 men, 54
men
Total 76 men, 39 women Each FGD had 6-10 mixed
participants
Jomba Groupement
6 FGDs
Rubavu District
3 FGDs (2 WMC, 2 PIP groups, 1
cooperative group)
Muramba
2 FGDs
Kisigari Groupement
2 FGDs
Burera District
1 FGD (1 WMC)
Nyarusiza
2 FGDs
Rugari Groupement
3 FGDs
Nyabihu District
2 FGD (1 PIP group, 1 WMC)
Kibumba Groupement
1 FGD
Age differences were not considered
9.4. Overview of household questionnaires
DRC Rwanda Uganda
2 male enumerators (no females
because of the security issues in
the area), interviewing in
Kiswahili
2 male enumerators,
interviewing in Kinyarwanda
1 male, 1 female enumerator,
interviewing in Rufumbira;
interviewees both male and
female;
Jomba Groupement
20 Households
Rubavu District
10 Households (5 PIP, 5 RWHT)
Muramba
13 Households
Rugari Groupement
20 Households
Burera District
08 Households (5RWHT)
Nyarusiza
46 Households
Kisigari
20 Households
Nyabihu District
15 Households (5 PIP, 10 RWHT)
Kibumba
10 Households

154
9.5. Overview of observed infrastructure
DRC Rwanda Uganda
Jomba Groupement:
• Standpipes,
• Water tanks,
• Corridors and troughs for
livestock,
• Watershed management
Rubavu District:
• Water tanks
Muramba Subcounty:
• RWHTs,
• Tap stands,
• Erythrina boundary planting
Kisigari Groupement:
• Standpipes,
• Water tanks
• (PIP interventions were
planned but not visited
because of insecurity)
Burera District:
• Watershed
interventions,
• Afforestation,
• Water tanks
Nyarusiza Subcounty:
• Stonewall,
• Erythrina planting,
• RWHTs,
• Tap stands,
• PIP interventions at household
level
Rugari Groupement:
• Standpipes,
• Corridors and troughs for
livestock
Nyabihu District:
• Watershed
interventions,
• Water tanks
9.6. Overview of village visits
Country Districts,
chefferie
Selected
districts,
sectors,
chefferies,
groupements,
and parishes
Selected villages Interventions
DRC Bwisha Jomba • Gikoro
• Runyunyi
• Musongero
• Chanzu
• Kinyangurube
• Kabindi
Standpipes, water tanks, water committees,
corridors and troughs for livestock, PIP
(Integrated Farmer's Plan), Watershed
management, WASH, and conflict mitigation
(PMP)
Bwisha Kisigari • Kabaya
• Rumangabo
• Bushenge
Standpipes, water tanks, water committees,
corridors and troughs for livestock, WASH,
PIP (Integrated Farmer's Plan), conflict
mitigation (PMP)
Bwisha Rugari • Kigarama
• Kabaya
Standpipes, water committees, corridors and
troughs for livestock, PIP (Integrated Farmer's
Plan), WASH and conflict mitigation (PMP)
Bukumu Kibumba • Burambo
• Hewu
PMP (conflict mitigation)

155
Country Districts,
chefferie
Selected
districts,
sectors,
chefferies,
groupements,
and parishes
Selected villages Interventions
Rwanda Rubavu Rubavu
(Bugeshi)-
Butaka,
Nsherima Cells
• Gaheriheri in
Butaka cell
(uphill)
• Gaheriheri in
Nsherima cell
(downhill)
• 18 RWHTs
• 1 WMC
• 4,396,464 trees planted
• PIP (25 PIs)
Nyabihu Nyabihu
(Mukamira
sector, Gasizi
Cell
• Kamiro (uphill)
• Jenda
(downhill- agro
forestry &
tanks)
• 45 RWHTs
• 2 WMCs
• 359,678 trees planted
• PIP (25 PIs)
Burera Burera
(Gahunga and
Cyanika
sectors), Gisizi,
Nyagahinga
Cells
• Nyagisozi
• Kabyimana
• 5 RWHTs
• 12 RWHTS
• 2 WMCs
• 50,566 trees planted
Musanze Not selected
Uganda Kisoro Nyarusiza
subcounty,
Gitenderi
Parish
• Kabande
• Nzogera
• Rukeri
• Mwangari
• Ruchantege
• 2 Communal RWHTs in each village
• 1.2 km long reconstructed stone wall,
raised to a height of 1.5m, including a
0.3m mortar strengthening at the top
(Kabande)
• 4 tap stands
• 3 PIP beneficiaries 1st,2nd,3rd
generation
• 1 WMC for the tank
• 1 WMC for the tap stand
• 1 WMC for the tank before w4v
• 7,440 Erythrina planting along the
reinforced stone wall.
• 3 RWHTs inspected
• 3 tap stands inspected
Muramba
subcounty,
Gisozi Parish
• Gishondori,
chana
• Nyagakenke
• 1 RWHT rehabilitated by W4V
• 1 WMC for the tank
• 1 tap stand rehabilitated by W4V
Nyarusiza
subcounty,
Rukongi Parish
• Musasa • 2 RWHTs inspected, both were
rehabilitated by W4V
• 1 WMC for the tank
• 1 WMC for the tap stand

156
9.7. Evaluation team
Name Organization Tasks
Esther Piracel Aidenvironment, Uganda Qualitative research, field work (DRC and
Rwanda)
Sarah Nalumansi Aidenvironment, Uganda Quantitative research, field work (DRC, Uganda,
and Rwanda)
Anne Birungi Kikundwa Aidenvironment, Uganda Qualitative, quantitative research, field work
(Uganda)
Romain Lwaboshi
Ntabiruba
Vision Verte, DRC Qualitative research, field work (DRC)
Prosper Mweze
Rugomba
Vision Verte, DRC Quantitative and qualitative research, field work
(DRC)
Desiré Akonkwa Balagizi Vision Verte, DRC Quantitative and qualitative research, field work
(DRC)
Maarten Onneweer Aidenvironment, the Netherlands Team leader, content overview (Netherlands) Niels Lenderink Aidenvironment, the Netherlands Coordination, evaluation general (Netherlands)
Lauriane Noirot Aidenvironment, the Netherlands French document study and reporting,
quantitative research (Netherlands)
Tanvi Walawalkar Aidenvironment, the Netherlands English document study and reporting, qualitative
research (Netherlands)
Related Documents