Evaluation of the Use of Free and Reduced-Price Meal Eligibility as a Proxy for Identifying Economically Disadvantaged Students. Alternative Measures and Recommendations Prepared for Maryland State Department of Education By Robert Croninger Jennifer King Rice & Laura Checovich Maryland Equity Project, University of Maryland, College Park Submitted by APA Consulting Submitted June 30, 2015

Welcome message from author
This document is posted to help you gain knowledge. Please leave a comment to let me know what you think about it! Share it to your friends and learn new things together.
Transcript

Evaluation of the Use of Free and Reduced-Price Meal Eligibility as a Proxy for Identifying
Economically Disadvantaged Students. Alternative Measures and Recommendations
Prepared for
Maryland State Department of Education
By
Robert Croninger
Jennifer King Rice
&
Laura Checovich
Maryland Equity Project, University of Maryland, College Park
Submitted by
APA Consulting
Submitted June 30, 2015

Errata Sheet for:
Evaluation of the Use of Free and Reduced–Price Meal Eligibility as a Proxy for Identifying Economically Disadvantaged Students. Alternative Measures and
Recommendations
Title Page: The spelling of the last name of the third author was corrected from Checovish to Checovich.
Page i: In the Suggested Citation, the form used for listing the second author was changed from King Rice, J. to Rice, J. K.
Page i: The spelling of the last name of the third author was corrected from Checovish to Checovich.
Page 3: In the last line of the last paragraph, the percentage of all eligible schools in Maryland adopting the Community Eligibility Provision of the Healthy, Hunger-Free Kids Act of 2010 was corrected by replacing 16 percent with seven percent.
Page 4: In the first line of the first paragraph, the percentage of eligible high-poverty schools in Maryland adopting the Community Eligibility Provision of the Healthy, Hunger-Free Kids Act of 2010 was corrected by replacing seven percent with two percent.

Evaluation of the Use of Free and Reduced-Price Meal Eligibility
i
The Maryland General Assembly enacted Chapter 288, Acts of 2002 – the Bridge to Excellence in Public Schools Act, which established new primary state education aid formulas based on adequacy cost studies using the professional judgment and successful schools methods, and other education finance analyses that were conducted in 2000 and 2001 under the purview of the Commission on Education Finance, Equity and Excellence. State funding to implement the Bridge to Excellence Act was phased-in over six years, reaching full implementation in fiscal 2008. Chapter 288 required a follow up study of the adequacy of education funding in the State to be undertaken approximately 10 years after its enactment. The study must include, at a minimum, adequacy cost studies that identify a base funding level for students without special needs and per pupil weights for students with special needs to be applied to the base funding level, and an analysis of the effects of concentrations of poverty on adequacy targets. The adequacy cost study will be based on the Maryland College and Career-Ready Standards (MCCRS) adopted by the State Board of Education and include two years of results from new state assessments aligned with the standards, which are scheduled to be administered beginning in the 2014-2015 school year.
There are several additional components mandated to be included in the study. These components include evaluations of: the impact of school size, the Supplemental Grants program, the use of Free and Reduced Price Meals eligibility as the proxy for identifying economic disadvantage, the federal Community Eligibility Program in Maryland, prekindergarten services and funding, the current wealth calculation, and the impact of increasing and decreasing enrollments on local school systems. The study must also include an update of the Maryland Geographic Cost of Education Index.
Augenblick, Palaich and Associates (APA), in partnership with Picus Odden and Associates (POA), and the Maryland Equity Project (MEP) at the University of Maryland, will submit a final report to the State no later than October 31, 2016.
This report, required under Section 3.2.3.1 of the Request for Proposals (R00R4402342), describes the approach APA and its partners took to evaluate the use of free and reduced-price meal eligibility as a proxy for identifying economically disadvantaged students, including the consideration of alternative measures of economic disadvantages, for calculating compensatory aid. More specifically, it describes the indicators of economic disadvantage currently being used by state school funding formulas across the nation, including how states are addressing the changes in the collection of family income data as a result of the Community Eligibility Provision (CEP) of the Healthy, Hunger-Free Kids Act of 2010, and it simulates the effects on school district shares of state counts of economically disadvantaged students for nine different proxies. The report concludes with a discussion of the tradeoffs associated with each model.
Suggested Citation: Croninger, R. G., Rice, J. K. & Checovich, L. (2015). Evaluation of the Use of Free and Reduced-Price Meal Eligibility as a Proxy for Identifying Economically Disadvantaged Students. Alternative Measures and Recommendations. Denver, CO: Augenblick, Palaich & Associates.

Evaluation of the Use of Free and Reduced-Price Meal Eligibility
ii
Contents
Introduction .................................................................................................................................................. 1
Healthy, Hunger-Free Kids Act ...................................................................................................................... 3
State Funding Formulas and Alternative Indicators of Low-Income Status ................................................. 4
Use of Alternative Forms ........................................................................................................................... 6
Hybrid Models ........................................................................................................................................... 6
Alternative Indicators ................................................................................................................................ 7
Simulations .................................................................................................................................................... 8
FRPM-Based Simulations .......................................................................................................................... 8
Alternative Indicator Simulations ............................................................................................................. 9
Hybrid-All vs. Free and Reduced-Price Meals ......................................................................................... 11
Hybrid-1.8 vs. Free and Reduced-Price Meals ........................................................................................ 13
Hybrid 1.6 vs. Free and Reduced-Price Meals ........................................................................................ 14
Hybrid 1.4 vs. Free and Reduced-Price Meals ........................................................................................ 15
Free Only vs. Free and Reduced-Price Meals .......................................................................................... 17
Direct Certification vs. Free and Reduced-Price Meals............................................................................ 18
Title I vs. Free and Reduced-Price Meals ................................................................................................ 19
County Poverty Rates vs. Free and Reduced-Price Meals ...................................................................... 20
Weighted County Poverty Rates vs. Free and Reduced-Price Meals ...................................................... 22
Discussion & Recommendations ................................................................................................................. 23
FRPM-Based Simulations ......................................................................................................................... 24
Alternative Indicator Simulations ............................................................................................................ 26
Recommendations .................................................................................................................................. 29
References .................................................................................................................................................. 31
Appendix ..................................................................................................................................................... 33

Evaluation of the Use of Free and Reduced-Price Meal Eligibility
1
Introduction Many state aid formulas for public schools include some form of compensatory funding. While states consider a range of student characteristics to calculate compensatory aid, a primary consideration is the number of students from economically disadvantaged households who are enrolled in a school district. Low-income status is often used as a proxy for students with learning challenges because poverty strongly correlates with many of these challenges. Because of this, a majority of states and the District of Columbia provide additional funding for low-income students through their compensatory aid formulas to provide additional education services (Education Law Center, 2013; Ushomirsky & Williams, 2015). Compensatory aid “compensates” school districts for the number of economically disadvantaged students they serve, usually providing an additional amount of per pupil aid for each low-income student enrolled in the school district. Thirty-nine states plus the District of Columbia currently provide some form of compensatory aid for each enrolled low-income student to school districts as part of their school funding formula (Verstegen, 2015).
While some states identify specific categories of students thought to require additional educational resources (e.g. pregnant teenagers or students living in foster care), most states rely heavily on existing student counts administered for means-tested federal programs to estimate the number of economically disadvantaged students in a school district (Carey, 2002). As means-tested federal programs require individuals and families to meet well-specified eligibility requirements, they provide states with well-established public standards to identify students as low-income or economically needy. Across state school funding formulas, the number of students eligible to participate in the National School Lunch Program and School Breakfast Program (operated by the U.S. Department of Agriculture and state education agencies) is the most-used indicator of the number of low-income students. Twenty-two states use the number of students eligible to receive free and reduced-price meals (FRPMs) through the National School Lunch and National School Breakfast programs as part of their state funding formulas. Maryland is one of these states (Verstegen, 2015).
A student in any school can qualify for FRPMs through an application process or by direct certification. The application process requires a parent or guardian to report household income and related household data to determine if a student is eligible to receive free or reduced-price meals at school. A student, however, can also qualify categorically without an application if her economic and social situation places her in a category of students considered vulnerable to hunger or malnutrition. To identify students who qualify categorically, social service agencies and school administrators match the agencies’ records with school enrollment records, identifying students who have received services and are enrolled in specific schools. “Identified students,” as they are referred to in federal guidelines, include homeless children, children in foster care, children participating in Head Start, migrant children, and children living in households receiving services from the Supplemental Nutritional Assistance Program (SNAP), the Food Distribution Program on Indian Reservations (FDPIR), or the Temporary Assistance for Needy Families (TANF) program (Hewins & Levin, 2014).

Evaluation of the Use of Free and Reduced-Price Meal Eligibility
2
To be eligible to receive free or reduced-price meals through direct application, a student’s household income must not exceed 185 percent of the federally designated poverty threshold for a comparable size family living in a similar geographic area. Students living in households with incomes that do not exceed 130 percent of the poverty threshold are eligible to receive free meals, while students living in households with incomes between 130 percent and 185 percent of the poverty threshold are eligible to receive reduced-price meals (U.S. Department of Agriculture, Food and Nutrition Services, 2015). Although identified students (e.g. students who qualify categorically) do not have to report household income to receive free or reduced-price school meals, eligibility requirements for programs such as SNAP or TANF are roughly 130 percent of the poverty threshold (Hewins & Levin, 2014), making direct certification of eligibility by social service agencies and school administrators a good proxy for students who live in economically disadvantaged households (Carey, 2002).
Student eligibility to participate in school meal programs has been used as a primary indicator of low-income status since the 1990s (Carey, 2002). However, new eligibility requirements, such as the Community Eligibility Provision (CEP) included in the 2010 Healthy, Hunger-Free Act (HHFKA), have forced states to reconsider their formulas for compensatory aid (Center on Budget and Policy Priorities, 2015; Hewins & Levin, 2014). Moreover, as the number of students eligible for school meals programs has increased, some policymakers have questioned whether FRPM eligibility accurately differentiates between economically disadvantaged students and economically advantaged students (Cowan et al., 2012; Harwell & LeBeau, 2010; Sparks, 2014). Approximately 44 percent1 of students attending Maryland Public Schools were FRPM-eligible during the 2013-2014 school year, up from 22 percent in 1990 (Sunderman & Dayhoff, 2014). Nationwide, 51 percent of students attending public schools were eligible to receive free and reduced-price meals during the 2014-2015 school year, making “low-income” or “economically disadvantaged” students a majority in the nation’s public schools for the first time (Southern Education Foundation, 2015).
This report examines the efficacy of using FRPM eligibility as a proxy for economically disadvantaged students and alternative indicators that could be used to determine compensatory aid for school districts in Maryland. First, the report describes changes to federally-funded nutrition programs, specifically CEP (included in the HHFKA), and explains how those changes affect state funding formulas that, like Maryland’s formula, rely on the number of students eligible for free or reduced-price meals to calculate compensatory aid for school districts. Next, the report identifies a range of plausible “work-arounds” proposed by states and policy analysts to address CEP-created changes in requirements for school meal program applications, as well as a range of non-FRPM based indicators of the number of low-income students attending school districts being used in other states. Then, using Maryland’s 2013-2014 enrollment data, the report simulates the effect of nine alternative indicators of low-income status on school district shares of the estimated state count for that indicator. The report concludes with a discussion of these simulation results and the strengths and weaknesses of each indicator.
1 Based on October 2013 program enrollment data provided by the Maryland State Department of Education.

Evaluation of the Use of Free and Reduced-Price Meal Eligibility
3
Healthy, Hunger-Free Kids Act In 2010, Congress passed the Healthy, Hunger-Free Kids Act (HHFKA), reauthorizing a series of federally-funded nutrition programs. The Act had two broad goals: 1) to improve the nutritional standards associated with the meals provided by food programs and 2) to enhance the “hunger safety net” so that fewer children would go hungry across the nation (Healthy, Hunger-Free Kids Act, 2010). The federal government began piloting provisions of HHFKA in schools during the 2011-2012 school year and phased in states through the 2014-2015 school year, at which time the U.S. Department of Agriculture implemented the new policies nationwide. Maryland piloted the policies during the 2013-2014 school year and implemented them statewide during the 2014-2015 school year.
A major provision of HHFKA simplifies the application process for free and reduced-price meal programs. Under CEP, every student in a school is eligible to receive free meals if social services and school districts have identified 40 percent or more of the students as eligible through direct certification (Center on Budget and Policy Priorities and Food Research and Action Center, 2013; Levin & Neuberger, 2013).2 In other words, if 40 percent or more of students in a school were categorically identified as being vulnerable to hunger during the spring of the prior school year, then the school can opt to use the community eligibility provision to provide free meals to all students starting in the fall of the next school year. Vulnerable students, as identified in HHFKA, include homeless children, children in foster care, children participating in Head Start, migrant children, and children living in households receiving services from the SNAP, FDPIR, or TANF programs (Hewins & Levin, 2014).
If a school opts to use CEP, students who attend the school automatically qualify to receive free meals for four years. Schools that opt into the provision are, under HHFKA, no longer permitted to collect federal applications from students for the purpose of determining their eligibility for the school meal program during this period. This HHFKA requirement was created to reduce the administrative burden on schools and to reduce the amount of paperwork low-income parents have to complete to gain access to meal services. Proponents of CEP claim that the provision dramatically reduces the paperwork burden for schools, especially schools that serve high concentrations of poor and low-income children. According to the Center on Budget and Policy Priorities, in such schools, “little purpose is served in devoting resources to identify the few children who don’t qualify for free or reduced-price meals” (2015, p. 1).
While the first full implementation year of HHFKA increased student participation in the nation’s free and reduced-price meals program, not all schools eligible to use CEP opted to do so. Nationwide, 45 percent of eligible schools (schools with 40 percent or more identified students) adopted CEP; among high-poverty schools (schools with 60 percent or more identified students), 63 percent of eligible schools adopted the provision. In Maryland, the rates of adoption are substantially lower, at seven
2 Under the school meals program, all school districts are required to identify students as eligible to receive free and reduced-price meals through direct certification, regardless of whether a school qualifies for CEP or not. In non-CEP schools the total number of students eligible to receive free and reduced-price meals is the number of students identified through direct certification and the number of students identified through the application process.

Evaluation of the Use of Free and Reduced-Price Meal Eligibility
4
percent of eligible schools and two percent of eligible high-poverty schools, respectively. States that piloted HHFKA prior to the 2014-2015 school year have shown steady growth in adopting CEP, with the highest rates of growth in Illinois, New York, Ohio and Kentucky. In other states, schools and districts are taking a “wait and see” approach to the provision to more fully understand the effects of adoption (Center on Budget and Policy Priorities, 2015).
One of the challenges schools and districts face in implementing the new CEP option is that many state funding formulas use data from the school meal program applications to calculate compensatory aid. Thus, even when schools and districts want to encourage the use of CEP to qualify more students for school meal programs, administrators worry that adopting CEP will jeopardize their compensatory aid (Center on Budget and Policy Priorities, 2015; Hewins & Levin, 2014). While the elimination of the meal program applications simplifies paperwork and reduces the administrative load associated with qualifying students for school meals, it creates other challenges for school and district administrators. Namely, it can be challenging to obtain the individual income data required to determine compensatory aid in CEP schools, especially if parents do not see a direct benefit to providing these data to school personnel. Moreover, education accountability policies require individual indicators of income, so that achievement data can be disaggregated by students who receive free and reduced-price meals and students who do not. Although CEP serves the laudatory goal of providing more students with access to healthy meals, it creates challenges in states that use these individual income data to determine compensatory aid, determine eligibility for other programs, and hold schools accountable for low-income students’ achievement.
State Funding Formulas and Alternative Indicators of Low-Income Status State funding formulas use a range of indicators to identify students as economically disadvantaged. A table presenting the indicators of low-income status used in different states’ public school funding formulas is provided in the Appendix. Information for the table comes from Verstegen’s 2015 survey of school finance policy. In reviewing the survey, the study team focused on how states described the indicators used to calculate compensatory aid designated for “at-risk students.” Because this report is only interested in indicators of economically disadvantaged students, the table does not include other state-identified indicators of risk, such as the number of English Language Learners (identified as an indicator of risk in California) or the number of high school students who are more than a year older than expected for their grade (identified as an indicator of risk in the District of Columbia). If and when information on the survey was ambiguous, the study team examined state-sponsored websites to clarify the indicators being used in a state’s formula. The study team also searched for recent news about changes in state funding formulas so as to update, where necessary, the information provided in Verstegen’s survey. (This was the case for Indiana and Massachusetts.)

Evaluation of the Use of Free and Reduced-Price Meal Eligibility
5
As noted previously, a total of 39 state school funding formulas and the District of Columbia’s school funding formula include some kind of indicator of low-income status to calculate compensatory aid.3 The most frequently used indicator is eligibility for the free and reduced-price meals program: Twenty-two states use the full count of students eligible to receive free and reduced-price meals as the sole indicator or as a major indicator in their compensatory aid formulas, while seven states restrict the count to those students eligible for free meals (Michigan combines this count with other categories of eligibility). Another nine states and the District of Columbia use some form of direct certification associated with students who participate in various public assistance programs (e.g. SNAP, TANF, and Medicaid) and/or categorical criteria to identify vulnerable students (e.g. homeless students, students in foster care, or pregnant teenaged students) to calculate compensatory aid for school districts. Three states use Title I counts and two states use U.S. Census estimates of numbers of children in poverty in school districts.
While virtually all of these indicators rely on data from means-tested federally-funded programs (with the possible exception of categorical designations such as the number of children in parenting and teen pregnancy programs or juvenile delinquents), they use different income thresholds to designate whether a household is low income or economically disadvantaged. States that use eligibility for the free and reduced-priced meal program as their indicator of low-income status set the income threshold at 185 percent of the poverty threshold. States that use eligibility for free meals only (not reduced-priced meals) or direct certification based on participation in various social service programs set the threshold at approximately 130 percent of the poverty threshold. States that use the poverty rate itself as part of their formula are the most restrictive, setting the threshold at or below the poverty line as its indicator of low-income status.
Of the 39 states and the District of Columbia that use some form of low-income status indicator to calculate compensatory aid, 29 will need to make some accommodation to their funding formula for schools using CEP. The only state funding formulas that will not require an accommodation are those that use direct certification or categorical eligibility only as a low-income status indicator or those that use school district poverty rates as an indicator. While there is no comprehensive national survey of how states are adjusting their formulas to accommodate CEP requirements, several organizations (e.g. the Center on Budget and Policy Priorities and the Food Research and Action Center) have provided information and recommendations to state policymakers about alternatives to school meal applications for estimating the number of economically disadvantaged students in schools, especially CEP schools. These actual and recommended state policies, which are still evolving, fall into three broad categories: 1) use of an alternative form, funded through school districts and the state, to determine household
3 A number of states that the study team designates as having no indicator for low-income status stated that they provide “supplemental grants” to schools for at-risk students. (This was the case in Arizona.) However, these grants appear to function more as “block grants,” which school districts can use for multiple purposes. Most of these states also indicated that the grants are not designated specifically for “at-risk students” in their school funding formula.

Evaluation of the Use of Free and Reduced-Price Meal Eligibility
6
income, 2) use of a hybrid model that relies on direct certification and federal school meal applications in schools that do not qualify for CEP, and relies on prior data or a multiplier to estimate the number of low-income students in schools that do adopt CEP, or 3) use of alternative indicators, including direct certification counts in all schools.
Use of Alternative Forms In states that use school meal program eligibility as part of their funding formulas, the most common work-around is to continue to collect individual income data from households through an alternative household income form, sponsored and paid for by school districts and states.4 Although HHFKA does not permit the collection of individual income data for the purpose of qualifying students for school meals, school districts and states can use an alternative form to collect individual income data for use by other programs. California has adopted this approach by developing five different alternative forms and translating the forms into multiple languages.5 Just as in non-CEP schools, where direct certification and the federal application are used to identify low-income students, an alternative form can be used in CEP schools to gather individual income data for the purposes of accountability or to determine whether a student is eligible for other programs.
Although the use of an alternative form creates some additional paperwork for school districts, it also creates an opportunity to develop clearer, less burdensome forms than those required by the federal meals programs’ applications. For example, while federal regulations require families to provide a Social Security number, an alternative form need not include such a requirement. Moreover, the use of alternative forms can be restricted to only those students who are not identified through direct certification in CEP schools. This approach resulted in directly collecting income data from only about one-third of families in CEP schools in Detroit, Michigan; Buffalo, New York; New York City; and Rochester, New York (Hewins & Levin, 2014).
There is major concern among school officials that families may not complete the alternative form if they do not receive any direct benefit (e.g. qualifying their child for food services) for completing it. Unfortunately, there is little systematic data on alternative form response rates in school districts with CEP schools. The Food Research and Action Committee reports response rates of 98 percent in Floyd County, Kentucky, one of the pilot states for HHFKA, and in Chicago Public Schools (Hewins & Levin, 2014), but these data are at best anecdotal.
Hybrid Models Other states have adopted hybrid models to estimate the proportion of students in a school that would be eligible for free and reduced-price meals. In these states, non-CEP schools use direct certification and the federal application for the school meals program to identify low-income students and CEP schools use a work-around other than an alternative income form. A major distinction between the hybrid models and the use of an alternative income form is that many hybrid models do not provide individual
4 Personal correspondence from Jessie Hewins, Food Research and Action Committee, February 5, 2015. 5 For examples of household income forms used in California, see http://www.cde.ca.gov/fg/aa/lc/lcfffaq.asp#PROV2and3.

Evaluation of the Use of Free and Reduced-Price Meal Eligibility
7
income data about students. These models may not resolve the problems associated with using individual measures of low-income status for accountability purposes or to qualify students for other programs.
Texas, for example, uses the national multiplier for reimbursement (number of identified or directly certified students, multiplied by 1.6) to estimate the share of students eligible for free and reduced-priced meals in CEP schools.6 The multiplier is a national estimate of the ratio of the total number of public school students who qualify for free and reduced-price meals to the total number of direct certified or identified students eligible to participate in school meals. Although the estimate is not an exact number of eligible students, it has been promoted as a reasonable proxy for the number of eligible students enrolled in a school, if federal applications were still taken (Hewins & Levin, 2014; Levin & Neuberger, 2013). Federal guidelines state that the U.S. Department of Agriculture may adjust the multiplier to a number between 1.3 and 1.6 in the future, if it deems that adjustment more accurately reflects the actual ratio of free and reduced-price meals students to direct certified students. However, after such an adjustment, CEP schools may continue to use the 1.6 multiplier through their current four-year period of eligibility.
Arkansas has proposed “freezing” the percentage of students who qualified for free and reduced-price meals the year prior to a school becoming eligible for CEP. Arkansas would then adjust the percentage every five years if the national multiplier of 1.6 times the number of identified students differed from the “frozen” percentage by more than five percentage points.7 The Maryland General Assembly also passed a bill (Hunger-Free Schools Act, 2015) that included both an alternative form option and a “freeze” option. School districts can use either 1) the counts derived from the federal application in non-CEP schools and the counts derived from an alternative form in CEP schools or 2) the counts derived from the federal application in non-CEP schools and the counts derived from multiplying the percentage of students eligible for the school meals program in the year prior to adopting CEP by the current enrollment in CEP schools.
Alternative Indicators In the nine states and the District of Columbia that do not use eligibility to receive free and reduced-price meals or free meals only as part of their school funding formula, no work-around or special accommodation needs to be made for CEP schools. In these states, calculations for the purpose of compensatory aid can be the same in every school or district, regardless of whether a school adopts CEP. In the case of states that identify low-income students through direct certification and/or categorical criteria, individual indicators can also be used to disaggregate achievement data for the
6 See http://www.squaremeals.org/Programs/NationalSchoolLunchProgram/CommunityEligibilityProvision.aspx for an explanation of how Texas adjusts enrollment in CEP schools to estimate students eligible for free or reduced-price meals. 7 For a description of the proposed legislation, see http://adesharepoint2.arkansas.gov/memos/Lists/Approved%20Memos/DispForm2.aspx?ID=1488&Source=http%3A%2F%2Fadesharepoint2%2Earkansas%2Egov%2Fmemos%2Fdefault%2Easpx.

Evaluation of the Use of Free and Reduced-Price Meal Eligibility
8
purpose of accountability. These individual indicators can be used to qualify students for other programs as well, such as waivers from specific fees (Hewins & Levin, 2014).
Simulations To explore the consequences of using different indicators of low-income students for the state’s funding formula, the study team ran nine simulations using 2013-2014 program enrollment data for Maryland. Because the recommended funding formula will not be known until the completion of the assessment of the current funding formula, the study team focused on how different indicators of low-income students affected a school district’s share of the total state count for that indicator. 8 For example, if the number of FRPM-eligible students is used as the indicator for the state funding formula, what percent of the state count (share) is represented by the number of FRPM-eligible students in each school district? How does the percent of the state count change for each school district if a different proxy is used to identify disadvantaged students?
The simulations fall into two broad categories: a) FRPM-based simulations that use different “work arounds” to estimate the number of students eligible for free and reduced-price meals in non-CEP and CEP schools and b) alternative indicators that use an indicator other than FRPM eligibility to estimate the number of economically disadvantaged students in schools. FRPM-based simulations use free and reduced-price meals as the primary indicator of low-income status. These simulations propose a “work around” for how to estimate the number of students eligible for free and reduced-price meals in CEP schools. Alternative indicators propose a different proxy for identifying low-income students – one that is the same for students in non-CEP and CEP schools. The nine simulations are:
FRPM-Based Simulations • Hybrid All. School districts use direct certification and the federal application for free and
reduced-price meals in non-CEP schools and count all students in CEP schools as low income. The total number of low-income students equals the sum of the number of students identified as low-income through direct certification and the federal application in non-CEP schools and the total enrollment of students in CEP schools.
• Hybrid 1.8. School districts use direct certification and the federal application for free and reduced-price meals in non-CEP schools and multiply the number of direct certified students by Maryland’s statewide average multiplier of 1.89 in CEP schools. The total number of low-income students equals the sum of the number of students identified as low-income through direct certification and the federal application in non-CEP schools and the product of the number of identified or direct certified students and 1.8 in CEP schools.
8 The research team did not simulate the effects on school district shares of Maryland’s recently passed Hungry-Free Schools Act, 2015. The Act allows schools districts to estimate the number of FRPM-eligible students in CEP schools through the use of an alternative income form or through calculating the product of the FRPM rate the year prior to adopting CEP and the current enrollment. These shares are unlikely to differ from the baseline model with use in these simulations. 9 1.8 is the ratio of the number of students eligible for free and reduced-price meals to the number of direct certification students statewide in Maryland. The study team used 2013-14 program enrollment data to calculate the ratio.

Evaluation of the Use of Free and Reduced-Price Meal Eligibility
9
• Hybrid 1.6. School districts use direct certification and the federal application for free and reduced-price meals in non-CEP schools and multiply the number of direct certified students by the national reimbursement rate of 1.6 in CEP schools. The total number of low-income students equals the sum of the number of students identified as low-income through direct certification and the federal application in non-CEP schools and the product of the number of identified or direct certified students and 1.6 in CEP schools.
• Hybrid 1.4. School districts use direct certification and the federal application for free and reduced-price meals in non-CEP schools and multiply the number of direct certified students by Maryland’s CEP-eligible average multiplier of 1.410 in CEP schools. The total number of low-income students equals the sum of the number of students identified as low-income through direct certification and the federal application in non-CEP schools and the product of the number of identified or direct certified students and 1.4 in CEP schools.
Alternative Indicator Simulations • Free Only. School districts use direct certification and the federal application for free and
reduced-price meals in non-CEP schools and direct certification and an alternative household income form in CEP schools to determine the number of low-income students. However, only students eligible for free meals are counted as economically disadvantaged. The total number of low-income students equals the sum of the number of students identified as eligible for free meals through direct certification and the federal application in non-CEP schools and the total number of students identified as eligible for free meals through direct certification and an alternative household income form in CEP schools.
• Direct certification (DC). School districts use the counts derived from direct certification in non-CEP schools and CEP schools. Students are identified as low-income only through direct certification. The total number of low-income students equals the total number of students identified through direct certification in non-CEP and CEP schools.
• Title I. School districts use the counts derived from students who receive Title I services or attend Title I schools. Students are identified as low-income only using Title I criteria. The total number of low-income students equals the total number of students identified as Title I students in non-CEP and CEP schools.
• U.S. Census Estimates of Poverty. The state uses estimates of poverty for children ages five to 17, obtained from the U.S. Census Bureau, to calculate compensatory aid. The total number of low-income students in a school district equals the school district’s enrollment multiplied by the county poverty rate.
• Weighted U.S. Census Estimates of Poverty. The state uses estimates of poverty for children ages five to 17, obtained from the U.S. Census Bureau, to calculate compensatory aid. However, the total number of low-income students in a school district equals the school district’s enrollment
10 1.4 is the ratio of the number of students eligible for free and reduced-price meals to the number of direct certified students in CEP-eligible schools statewide in Maryland. This ratio is smaller than the statewide average because CEP schools have a higher proportion of their students directly certified as eligible for free and reduced-price meals than students statewide.

Evaluation of the Use of Free and Reduced-Price Meal Eligibility
10
multiplied by the square of the county’s poverty rate divided by the state poverty rate. The weighted U.S. estimate of poverty modifies counts in school districts relative to the state’s poverty.
All simulations are based on data provided by the Maryland State Department of Education or the U.S. Census Bureau. The study team used program enrollment data reported in October 2013 and March 2014 to estimate the number of students in each school eligible for free and reduced-price meals, either through direct certification or through an alternative form. The study team adjusted these estimates for the number of pre-kindergarten students enrolled in schools and for the number of pre-kindergarten students receiving school meals, based on March 2014 enrollment data.11 Census Bureau estimates of children living in poor households, by county, come from 2013 Census data and can be obtained at http://www.census.gov/did/www/saipe/downloads/sd13/index.html.
When running the FRPM-based simulations, the study team used October 2013 program enrollments to identify schools with 40 percent or more students eligible for school meal programs through direct certification. The study team identified a total of 317 schools eligible to adopt CEP for the 2014-2015 school year. To estimate the count of low-income students in school districts with non-CEP eligible and CEP eligible schools, the simulation used program enrollment data to identify the total number of students eligible for free and reduced-price meals in non-CEP schools and added the number of students identified as eligible using the hybrid model in CEP schools. For the 1.8, 1.6 and 1.4 multipliers, the study team capped the product of the multiplier and number of direct certified students to the total school enrollment minus prekindergarten children in each CEP school.
The study team used free and reduced-price meal counts as the baseline for each simulation to estimate how a different indicator would affect a school district’s share of the state count. The baseline assumes that the state would continue to determine the number of low-income students through direct certification and the use of the federal application in non-CEP schools and the use of direct certification and an alternative household income form in CEP schools. The total number of low-income students equals the unduplicated sum of the number of students identified as low-income through the federal application, the number students identified as low-income through the alternative income form, and the number of students identified as low-income through direct certification.
The results of the simulations are shown in Tables 1 through 9. The first column identifies the county, with the exception of the last row that provides statewide counts and percentages. The second and third columns present the estimated count associated with the hybrid or alternative indicator, along with the percent of total enrollment represented by that count. Columns four and five present the
11 The study team’s final estimate of the total enrollment and the free and reduced-price meal enrollment is within .003 percent of the statewide figures reported in Exhibit 3.8: Compensatory Education Formula Calculation, Fiscal 2015, included in the 2014 Legislative Handbook: Education in Maryland (Library of Information Services, Office of Policy Analysis, Legislative Services, 2014, p. 99).

Evaluation of the Use of Free and Reduced-Price Meal Eligibility
11
estimated 2013 free and reduced-price meals count, followed by the percent of the total enrollment represented by that count. Column six presents the share of the state count represented by the estimated hybrid count or alternative indicator count for each county. Column seven presents the share of the state count represented by the FRPM count for each county. The last column presents the percentage point difference between the hybrid or alternative indicator share and the FRPM share. A positive percent indicates an increase in share; a negative percent indicates a decrease in share.12
As these simulations indicate, school district shares of the state count of low-income students vary with the proxy used to identify economically disadvantaged students. The smaller changes occur for the FRPM-based simulations, while larger changes in shares occur for alternative indicator simulations. These shifts in shares, however, cannot be interpreted as percent shifts in the compensatory aid that school districts would receive using a particular model. For example, each of the alternative indicators results in a reduction of the state count for low-income students, because each of these indicators is based on a more restrictive threshold for identifying economic need; without any adjustment these proxies would result in lower levels of compensatory aid for all school districts. While school district shares of the state count provide a good picture of how students identified as low-income for each proxy are distributed across the state’s school system, the actual effect of these proxies on compensatory aid depends on the specifics of the funding formula used, including the compensatory allocation per pupil, wealth adjustment and minimum grant or hold harmless provision.
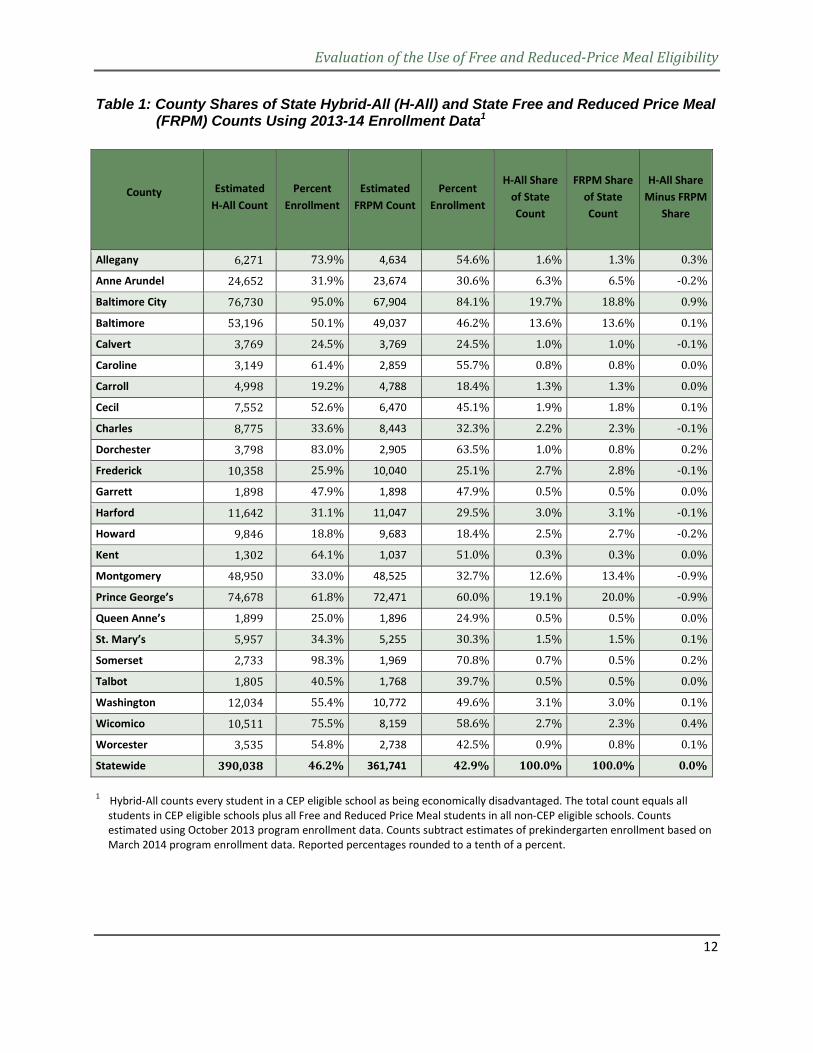
Hybrid-All vs. Free and Reduced-Price Meals Table 1, below, presents a comparison of using a hybrid model that identifies all students in CEP schools as low-income versus using FRPM counts to identify low-income students in non-CEP and CEP schools. The overall state count for low-income students increases by 3.3 percentage points using this model, from 42.9% low-income students to 46.2% low-income students. Ten school districts see an increase in their share of the state count compared to their share of the state count using FRPM eligibility; eight school districts see a decrease in their share of the state count. Baltimore City has the largest increase (0.9 percentage points), followed by Wicomico County (0.4 percentage points). Montgomery County and Prince George’s County have the largest decreases in shares (-0.9 percentage points, each). Most changes in shares are less than one half of a percentage point. In general, the Hybrid-All model increases the state share of low-income students in school districts with larger CEP eligible enrollments and decreases the state share of low-income students in school districts with smaller CEP enrollments.
12 Using Table 1 as an example, the estimated number of low-income students in Allegany County using the Hybrid-All model is 6,271. Allegany’s share of the state count for that model is 1.6% (6,271/390,038). Allegany’s share of the state count for students eligible for FRPM is 1.3% (4,634/361,741). Allegany’s share of the state count would increase by 0.3 percentage points if the state used the Hybrid-All model to estimate the number of low-income students in the state.
Evaluation of the Use of Free and Reduced-Price Meal Eligibility
12
Table 1: County Shares of State Hybrid-All (H-All) and State Free and Reduced Price Meal (FRPM) Counts Using 2013-14 Enrollment Data1
1 Hybrid-All counts every student in a CEP eligible school as being economically disadvantaged. The total count equals all students in CEP eligible schools plus all Free and Reduced Price Meal students in all non-CEP eligible schools. Counts estimated using October 2013 program enrollment data. Counts subtract estimates of prekindergarten enrollment based on March 2014 program enrollment data. Reported percentages rounded to a tenth of a percent.
County Estimated H-All Count
Percent Enrollment
Estimated FRPM Count
Percent Enrollment
H-All Share of State Count
FRPM Share of State Count
H-All Share Minus FRPM
Share
Allegany 6,271 73.9% 4,634 54.6% 1.6% 1.3% 0.3%
Anne Arundel 24,652 31.9% 23,674 30.6% 6.3% 6.5% -0.2%
Baltimore City 76,730 95.0% 67,904 84.1% 19.7% 18.8% 0.9%
Baltimore 53,196 50.1% 49,037 46.2% 13.6% 13.6% 0.1%
Calvert 3,769 24.5% 3,769 24.5% 1.0% 1.0% -0.1%
Caroline 3,149 61.4% 2,859 55.7% 0.8% 0.8% 0.0%
Carroll 4,998 19.2% 4,788 18.4% 1.3% 1.3% 0.0%
Cecil 7,552 52.6% 6,470 45.1% 1.9% 1.8% 0.1%
Charles 8,775 33.6% 8,443 32.3% 2.2% 2.3% -0.1%
Dorchester 3,798 83.0% 2,905 63.5% 1.0% 0.8% 0.2%
Frederick 10,358 25.9% 10,040 25.1% 2.7% 2.8% -0.1%
Garrett 1,898 47.9% 1,898 47.9% 0.5% 0.5% 0.0%
Harford 11,642 31.1% 11,047 29.5% 3.0% 3.1% -0.1%
Howard 9,846 18.8% 9,683 18.4% 2.5% 2.7% -0.2%
Kent 1,302 64.1% 1,037 51.0% 0.3% 0.3% 0.0%
Montgomery 48,950 33.0% 48,525 32.7% 12.6% 13.4% -0.9%
Prince George’s 74,678 61.8% 72,471 60.0% 19.1% 20.0% -0.9%
Queen Anne’s 1,899 25.0% 1,896 24.9% 0.5% 0.5% 0.0%
St. Mary’s 5,957 34.3% 5,255 30.3% 1.5% 1.5% 0.1%
Somerset 2,733 98.3% 1,969 70.8% 0.7% 0.5% 0.2%
Talbot 1,805 40.5% 1,768 39.7% 0.5% 0.5% 0.0%
Washington 12,034 55.4% 10,772 49.6% 3.1% 3.0% 0.1%
Wicomico 10,511 75.5% 8,159 58.6% 2.7% 2.3% 0.4%
Worcester 3,535 54.8% 2,738 42.5% 0.9% 0.8% 0.1%
Statewide 390,038 46.2% 361,741 42.9% 100.0% 100.0% 0.0%

Evaluation of the Use of Free and Reduced-Price Meal Eligibility
13
Hybrid-1.8 vs. Free and Reduced-Price Meals Table 2, below, presents a comparison of using a hybrid model that identifies low-income students in CEP schools by multiplying direct certification counts by 1.8, the statewide ratio of FRPM counts to direct certification counts, versus using FRPM counts to identify low-income students in non-CEP and CEP schools. Although 1.8 is the statewide ratio in Maryland, under this simulation, the state count of low-income students increases by 1.9 percentage points, from 42.9% to 44.8%. Eight school districts see an increase in their share of the state count, while eight school districts see a decrease in their share of the state count. Baltimore City has the largest increase in shares (1.2 percentage points) followed by Wicomico County (0.3 percentage points). Prince George’s County has the largest decrease in state shares (-0.7 percentage points), followed by Montgomery County (-0.6 percentage points). Changes in state shares are roughly the same or smaller comparing the Hybrid-All model to the Hybrid 1.8 model, with the exception of Baltimore City.
Table 2: County Shares of State Hybrid-1.8 (H-1.8) and Free and Reduced Price Meal (FRPM) Counts Using 2013-14 Enrollment Data1
County Estimated H-1.8 Count
Percent Enrollment
Estimated FRPM Count
Percent Enrollment
H-1.8 Share of State Count
FRPM Share of State Count
H-1.8 Share Minus FRPM
Share
Allegany 5,503 64.8% 4,634 54.6% 1.5% 1.3% 0.2%
Anne Arundel 24,049 31.1% 23,674 30.6% 6.4% 6.5% -0.2%
Baltimore City 75,422 93.4% 67,904 84.1% 19.9% 18.8% 1.2%
Baltimore 50,337 47.4% 49,037 46.2% 13.3% 13.6% -0.2%
Calvert 3,769 24.5% 3,769 24.5% 1.0% 1.0% 0.0%
Caroline 3,005 58.6% 2,859 55.7% 0.8% 0.8% 0.0%
Carroll 4,897 18.8% 4,788 18.4% 1.3% 1.3% 0.0%
Cecil 7,078 49.3% 6,470 45.1% 1.9% 1.8% 0.1%
Charles 8,550 32.7% 8,443 32.3% 2.3% 2.3% -0.1%
Dorchester 3,571 78.1% 2,905 63.5% 0.9% 0.8% 0.1%
Frederick 10,096 25.2% 10,040 25.1% 2.7% 2.8% -0.1%
Garrett 1,898 47.9% 1,898 47.9% 0.5% 0.5% 0.0%
Harford 11,275 30.1% 11,047 29.5% 3.0% 3.1% -0.1%
Howard 9,742 18.6% 9,683 18.4% 2.6% 2.7% -0.1%
Kent 1,199 59.0% 1,037 51.0% 0.3% 0.3% 0.0%
Montgomery 48,431 32.6% 48,525 32.7% 12.8% 13.4% -0.6%
Prince George’s 73,131 60.5% 72,471 60.0% 19.3% 20.0% -0.7%
Queen Anne’s 1,897 24.9% 1,896 24.9% 0.5% 0.5% 0.0%
St. Mary’s 5,640 32.5% 5,255 30.3% 1.5% 1.5% 0.0%
Somerset 2,623 94.3% 1,969 70.8% 0.7% 0.5% 0.1%

Evaluation of the Use of Free and Reduced-Price Meal Eligibility
14
Talbot 1,784 40.1% 1,768 39.7% 0.5% 0.5% 0.0%
Washington 11,553 53.1% 10,772 49.6% 3.1% 3.0% 0.1%
Wicomico 9,480 68.1% 8,159 58.6% 2.5% 2.3% 0.3%
Worcester 3,183 49.4% 2,738 42.5% 0.8% 0.8% 0.1%
Statewide 378,113 44.8% 361,741 42.9% 100.0% 100.0% 0.0%
1 Hybrid-1.8 estimates the number of economically disadvantaged students in CEP eligible schools as being equal to the number of directly certified students times 1.8 in each CEP school, the state ratio of the Free and Reduced Price Meal count to the Direct Certification count. The total count equals the estimated count in CEP eligible schools plus the count for Free and Reduced Price Meal students in all non-CEP eligible schools. Counts estimated using October 2013 program enrollment data. Counts subtract estimates of pre-kindergarten enrollment based on March 2014 program enrollment data. Reported percentages rounded to a tenth of a percent.
Hybrid 1.6 vs. Free and Reduced-Price Meals Table 3, below, presents a comparison of using a hybrid model that identifies low-income students in CEP schools by multiplying direct certification counts by 1.6, the national reimbursement multiplier, versus using FRPM counts to identify low-income students in non-CEP and CEP schools. Using this model, the state count of low-income students still increases, but only slightly, from 42.9 percent to 43.9 percent (an increase of 1 percentage point). Six schools districts see an increase in state shares while seven school districts see a decrease in state shares. Once again, Baltimore City has the largest increase in state shares (1.1 percentage points), followed by Wicomico County (0.2 percentage points). Prince George’s County and Montgomery Count have the largest decreases in state shares (-0.5 and -0.4 percentage points, respectively).
Table 3: County Shares of State Hybrid-1.6 (H-1.6) and Free and Reduced Price Meal (FRPM) Counts Using 2013-14 Enrollment Data1
County Estimated H-1.6 Count
Percent Enrollment
Estimated FRPM Count
Percent Enrollment
H-1.6 Share of State Count
FRPM Share of State Count
H-1.6 Share Minus FRPM
Share
Allegany 5,201 61.3% 4,634 54.6% 1.4% 1.3% 0.1%
Anne Arundel 23,724 30.7% 23,674 30.6% 6.4% 6.5% -0.1%
Baltimore City 73,421 90.9% 67,904 84.1% 19.8% 18.8% 1.1%
Baltimore 48,874 46.1% 49,037 46.2% 13.2% 13.6% -0.4%
Calvert 3,769 24.5% 3,769 24.5% 1.0% 1.0% 0.0%
Caroline 2,925 57.0% 2,859 55.7% 0.8% 0.8% 0.0%
Carroll 4,854 18.7% 4,788 18.4% 1.3% 1.3% 0.0%
Cecil 6,802 47.4% 6,470 45.1% 1.8% 1.8% 0.0%
Charles 8,481 32.5% 8,443 32.3% 2.3% 2.3% 0.0%
Dorchester 3,384 74.0% 2,905 63.5% 0.9% 0.8% 0.1%
Frederick 9,924 24.8% 10,040 25.1% 2.7% 2.8% -0.1%
Garrett 1,898 47.9% 1,898 47.9% 0.5% 0.5% 0.0%

Evaluation of the Use of Free and Reduced-Price Meal Eligibility
15
Harford 11,078 29.6% 11,047 29.5% 3.0% 3.1% -0.1%
Howard 9,715 18.5% 9,683 18.4% 2.6% 2.7% -0.1%
Kent 1,138 56.0% 1,037 51.0% 0.3% 0.3% 0.0%
Montgomery 48,195 32.4% 48,525 32.7% 13.0% 13.4% -0.4%
Prince George’s 72,220 59.8% 72,471 60.0% 19.5% 20.0% -0.5%
Queen Anne’s 1,897 24.9% 1,896 24.9% 0.5% 0.5% 0.0%
St. Mary’s 5,504 31.7% 5,255 30.3% 1.5% 1.5% 0.0%
Somerset 2,430 87.4% 1,969 70.8% 0.7% 0.5% 0.1%
Talbot 1,775 39.9% 1,768 39.7% 0.5% 0.5% 0.0%
Washington 11,176 51.4% 10,772 49.6% 3.0% 3.0% 0.0%
Wicomico 8,992 64.6% 8,159 58.6% 2.4% 2.3% 0.2%
Worcester 3,009 46.7% 2,738 42.5% 0.8% 0.8% 0.1%
Statewide 370,385 43.9% 361,741 42.9% 100.0% 100.0% 0.0%
1 Hybrid-1.6 estimates the number of economically disadvantaged students in CEP eligible schools as being equal to the number of directly certified students times 1.6 in each CEP school, the national reimbursement rate. The total count equals the estimated count in CEP eligible schools plus the count for Free and Reduced Price Meal students in all non-CEP eligible schools. Counts estimated using October 2013 program enrollment data. Counts subtract estimates of pre-kindergarten enrollment based on March 2014 program enrollment data. Reported percentages rounded to a tenth of a percent.
Hybrid 1.4 vs. Free and Reduced-Price Meals Table 4, below, presents a comparison of using a hybrid model that identifies low-income students in CEP by multiplying direct certification counts by 1.4, the statewide average multiplier of FRPM counts to direct certification counts in CEP schools, versus using FRPM counts to identify low-income students in non-CEP and CEP schools. This Hybrid model more closely approximates the state share of low-income students using FRPM counts, 42.6 percent compared to 42.9% (a difference of only -0.3 percentage points). Only four school districts see an increase in state shares, with Baltimore City seeing an increase of 0.5 percentage points. All of the other increases are no greater than 0.1 percentage point. Baltimore County sees that greatest decrease in state shares (-0.4 percentage points) followed by Prince George’s County (-0.2 percentage points). All other decreases in state shares are no greater than 0.1 percentage points. Of the four hybrid models, this model most closely approximates the shares based on the free and reduced-price meal eligibility.

Evaluation of the Use of Free and Reduced-Price Meal Eligibility
16
Table 4: County Shares of State Hybrid-1.4 (H-1.4) and Free and Reduced Price Meal (FRPM) Counts Using 2013-14 Enrollment Data1
County Estimated H-1.4 Count
Percent Enrollment
Estimated FRPM Count
Percent Enrollment
H-1.4 Share of State Count
FRPM Share of State Count
H-1.4 Share Minus FRPM
Share
Allegany 4,824 56.8% 4,634 54.6% 1.3% 1.3% 0.1%
Anne Arundel 23,339 30.2% 23,674 30.6% 6.5% 6.5% -0.1%
Baltimore City 69,148 85.6% 67,904 84.1% 19.2% 18.8% 0.5%
Baltimore 47,355 44.6% 49,037 46.2% 13.2% 13.6% -0.4%
Calvert 3,769 24.5% 3,769 24.5% 1.0% 1.0% 0.0%
Caroline 2,828 55.1% 2,859 55.7% 0.8% 0.8% 0.0%
Carroll 4,811 18.5% 4,788 18.4% 1.3% 1.3% 0.0%
Cecil 6,526 45.5% 6,470 45.1% 1.8% 1.8% 0.0%
Charles 8,412 32.2% 8,443 32.3% 2.3% 2.3% 0.0%
Dorchester 3,132 68.5% 2,905 63.5% 0.9% 0.8% 0.1%
Frederick 9,751 24.4% 10,040 25.1% 2.7% 2.8% -0.1%
Garrett 1,898 47.9% 1,898 47.9% 0.5% 0.5% 0.0%
Harford 10,832 28.9% 11,047 29.5% 3.0% 3.1% 0.0%
Howard 9,688 18.5% 9,683 18.4% 2.7% 2.7% 0.0%
Kent 1,076 53.0% 1,037 51.0% 0.3% 0.3% 0.0%
Montgomery 47,959 32.3% 48,525 32.7% 13.3% 13.4% -0.1%
Prince George’s 71,286 59.0% 72,471 60.0% 19.8% 20.0% -0.2%
Queen Anne’s 1,896 24.9% 1,896 24.9% 0.5% 0.5% 0.0%
St. Mary’s 5,324 30.7% 5,255 30.3% 1.5% 1.5% 0.0%
Somerset 2,133 76.7% 1,969 70.8% 0.6% 0.5% 0.0%
Talbot 1,766 39.7% 1,768 39.7% 0.5% 0.5% 0.0%
Washington 10,717 49.3% 10,772 49.6% 3.0% 3.0% 0.0%
Wicomico 8,370 60.1% 8,159 58.6% 2.3% 2.3% 0.1%
Worcester 2,835 44.0% 2,738 42.5% 0.8% 0.8% 0.0%
Statewide 359,678 42.6% 361,741 42.9% 100.0% 100.0% 0.0%
1 Hybrid-1.4 estimates the number of economically disadvantaged students in CEP eligible schools as being equal to the number of directly certified students times 1.4 in each CEP school, the state ratio of the Free and Reduced Price Meal count to the Direct Certification count in CEP schools only. The total count equals the estimated count in CEP eligible schools plus the count for Free and Reduced Price Meal students in all non-CEP eligible schools. Counts estimated using October 2013 program enrollment data. Counts subtract estimates of pre-kindergarten enrollment based on March 2014 program enrollment data. Reported percentages rounded to a tenth of a percent.

Evaluation of the Use of Free and Reduced-Price Meal Eligibility
17
Free Only vs. Free and Reduced-Price Meals Table 5, below, presents a comparison for using free only counts versus the free and reduced-price meals counts to identify low-income students in all schools. Because the income threshold for qualifying for free meals is lower than the income threshold for qualifying for reduced-price meals, this model reduced the state count of low-income students from 42.9% to 37.0%, a decrease of 5.9 percentage points. Nonetheless, shifts in state shares are relatively small for most school districts. Two school districts see an increase in state shares, with Baltimore City seeing the greatest increase (1.5 percentage points), followed by Wicomico County (0.2 percentage points). Seven school districts see decreases in state shares. Montgomery County has the largest decrease (-0.9 percentage points), followed by Anne Arundel County (-0.3 percentage points) and Baltimore County (-0.2 percentage points). All other decreases are no greater than 0.1 percentage points. In general, this model increases the state shares of school districts with a higher ratio of students who qualify for free meals to students who qualify for reduced-price meals; the model decreases the state shares of school districts with a lower ratio for these students.
Table 5: County Shares of State Free Only and Free and Reduced Price Meal (FRPM) Counts Using 2013-14 Enrollment Data1
County Estimated Free Count
Percent Enrollment
Estimated FRPM Count
Percent Enrollment
Free Share of State Count
FRPM Share of State Count
Free Share Minus FRPM
Share
Allegany 3,995 47.1% 4,634 54.6% 1.3% 1.3% 0.0%
Anne Arundel 19,656 25.4% 23,674 30.6% 6.3% 6.5% -0.3%
Baltimore City 63,318 78.4% 67,904 84.1% 20.3% 18.8% 1.5%
Baltimore 41,553 39.2% 49,037 46.2% 13.3% 13.6% -0.2%
Calvert 3,254 21.2% 3,769 24.5% 1.0% 1.0% 0.0%
Caroline 2,497 48.7% 2,859 55.7% 0.8% 0.8% 0.0%
Carroll 4,069 15.6% 4,788 18.4% 1.3% 1.3% 0.0%
Cecil 5,655 39.4% 6,470 45.1% 1.8% 1.8% 0.0%
Charles 7,051 27.0% 8,443 32.3% 2.3% 2.3% -0.1%
Dorchester 2,641 57.7% 2,905 63.5% 0.8% 0.8% 0.0%
Frederick 8,451 21.1% 10,040 25.1% 2.7% 2.8% -0.1%
Garrett 1,546 39.1% 1,898 47.9% 0.5% 0.5% 0.0%
Harford 9,164 24.5% 11,047 29.5% 2.9% 3.1% -0.1%
Howard 7,934 15.1% 9,683 18.4% 2.5% 2.7% -0.1%
Kent 942 46.4% 1,037 51.0% 0.3% 0.3% 0.0%
Montgomery 39,124 26.3% 48,525 32.7% 12.5% 13.4% -0.9%
Prince George’s 62,496 51.7% 72,471 60.0% 20.0% 20.0% 0.0%
Queen Anne’s 1,638 21.5% 1,896 24.9% 0.5% 0.5% 0.0%

Evaluation of the Use of Free and Reduced-Price Meal Eligibility
18
St. Mary’s 4,534 26.1% 5,255 30.3% 1.5% 1.5% 0.0%
Somerset 1,814 65.2% 1,969 70.8% 0.6% 0.5% 0.0%
Talbot 1,600 35.9% 1,768 39.7% 0.5% 0.5% 0.0%
Washington 9,353 43.0% 10,772 49.6% 3.0% 3.0% 0.0%
Wicomico 7,559 54.3% 8,159 58.6% 2.4% 2.3% 0.2%
Worcester 2,439 37.8% 2,738 42.5% 0.8% 0.8% 0.0%
Statewide 312,283 37.0% 361,741 42.9% 100.0% 100.0% 0.0%
1 Free Only and Free and Reduced Price Meal counts estimated using October 2013 program enrollment data. Counts subtract estimates of pre-kindergarten enrollment based on March 2014 program enrollment data. Reported percentages rounded to a tenth of a percent.
Direct Certification vs. Free and Reduced-Price Meals Table 6, below, presents a comparison for using free and reduced-price meals counts versus direct certification counts to identify low-income students in all schools. Because the direct certification uses a lower income threshold to identify low-income students, the direct certification count is substantially lower than the FRPM count, from 42.9% to 24.2%, or 18.7 percentage points lower. However, using this model, seventeen school districts see an increase in shares of the state’s low-income count. Baltimore City has the largest increase (6.2 percentage points), followed by Wicomico County (0.6 percentage points), and four school districts have increases of 0.4 percentage points (Allegany, Cecil, St. Mary’s and Washington counties). Prince George’s County has the largest decrease (-5.9 percentage points), followed by Montgomery County (-3.2 percentage points) and Baltimore County (-0.4 percentage points). Using direct certification as the indicator for low-income increases, the share of the state count for school districts that have a higher ratio of direct certified students to students who qualify for free and reduced-price meals – that is, school districts with a higher proportion of more severely economically disadvantaged students.
Table 6: County Shares of State Direct Certification (DC) and Free and Reduced Price Meal (FRPM) Counts Using 2013-14 Enrollment Data1
County Estimated DC Count
Percent Enrollment
Estimated FRPM Count
Percent Enrollment
DC Share of State Count
FRPM Share of State Count
DC Share Minus FRPM
Share
Allegany 3,411 40.2% 4,634 54.6% 1.7% 1.3% 0.4%
Anne Arundel 12,964 16.8% 23,674 30.6% 6.3% 6.5% -0.2%
Baltimore City 51,068 63.3% 67,904 84.1% 25.0% 18.8% 6.2%
Baltimore 26,951 25.4% 49,037 46.2% 13.2% 13.6% -0.4%
Calvert 2,423 15.0% 3,769 24.5% 1.2% 1.0% 0.1%
Caroline 1,731 33.8% 2,859 55.7% 0.8% 0.8% 0.1%
Carroll 3,209 12.3% 4,788 18.4% 1.6% 1.3% 0.2%
Cecil 4,398 28.5% 6,470 45.1% 2.2% 1.8% 0.4%

Evaluation of the Use of Free and Reduced-Price Meal Eligibility
19
Charles 5,025 19.2% 8,443 32.3% 2.5% 2.3% 0.1%
Dorchester 2,216 48.3% 2,905 63.5% 1.1% 0.8% 0.3%
Frederick 6,032 15.1% 10,040 25.1% 3.0% 2.8% 0.2%
Garrett 951 24.0% 1,898 47.9% 0.5% 0.5% -0.1%
Harford 5,963 15.9% 11,047 29.5% 2.9% 3.1% -0.1%
Howard 4,920 9.4% 9,683 18.4% 2.4% 2.7% -0.3%
Kent 757 37.3% 1,037 51.0% 0.4% 0.3% 0.1%
Montgomery 20,894 14.1% 48,525 32.7% 10.2% 13.4% -3.2%
Prince George’s 28,918 23.9% 72,471 60.0% 14.2% 20.0% -5.9%
Queen Anne’s 1,225 16.1% 1,896 24.9% 0.6% 0.5% 0.1%
St. Mary’s 3,685 21.2% 5,255 30.3% 1.8% 1.5% 0.4%
Somerset 1,528 54.9% 1,969 70.8% 0.7% 0.5% 0.2%
Talbot 1,186 26.6% 1,768 39.7% 0.6% 0.5% 0.1%
Washington 6,857 31.5% 10,772 49.6% 3.4% 3.0% 0.4%
Wicomico 5,928 42.6% 8,159 58.6% 2.9% 2.3% 0.6%
Worcester 1,966 30.5% 2,738 42.5% 1.0% 0.8% 0.2%
Statewide 204,207 24.2% 361,741 42.9% 100.0% 100.0% 0.0% 1 Direct Certification and Free and Reduced Price Meal counts estimated using October 2013 program enrollment data. Counts
subtract estimates of pre-kindergarten enrollment based on March 2014 program enrollment data. Reported percentages rounded to a tenth of a percent.
Title I vs. Free and Reduced-Price Meals Table 7, below, presents a comparison for using Title I counts versus free and reduced-price meals counts to identify low-income students in all schools. Using this model, the state count of low-income students is 20.3%, a decrease in the state count of 22.6 percentage points compared to the state FRPM count. Eleven school districts have an increase in state shares while thirteen school districts have a decrease in state shares. Once again, Baltimore City has the largest increase (9.2 percentage points). All other increases are relatively small, less than one percentage point. For example, Caroline County has the next largest increase in state shares (0.9 percentage points), followed by Kent County (0.5 percentage points). Anne Arundel Count and Montgomery County have the largest decreases in state shares (-3.3 and -3.0 percentage points, respectively), followed by Harford County (-1.5 percentage points) and Washington County (-1.4 percentage points). Title I counts increase the share of the state count for school districts that have higher numbers of students identified as low income, particularly school districts that have more schools with higher concentrations of low-income students (40 percent or more) that qualify for schoolwide programs.

Evaluation of the Use of Free and Reduced-Price Meal Eligibility
20
Table 7: County Shares of State Title I and Free and Reduced Price Meal (FRPM) Counts Using 2013-14 Enrollment Data1
County Estimated Title I Count
Percent Enrollment
Estimated FRPM Count
Percent Enrollment
Title I Share of State Count
FRPM Share of State Count
Title I Share Minus FRPM
Share
Allegany 2,878 33.9% 4,634 54.6% 1.7% 1.3% 0.4%
Anne Arundel 5,511 7.1% 23,674 30.6% 3.2% 6.5% -3.3%
Baltimore City 47,999 59.5% 67,904 84.1% 28.0% 18.8% 9.2%
Baltimore 23,610 22.3% 49,037 46.2% 13.8% 13.6% 0.2%
Calvert 237 1.5% 3,769 24.5% 0.1% 1.0% -0.9%
Caroline 2,835 55.3% 2,859 55.7% 1.7% 0.8% 0.9%
Carroll 1,051 4.0% 4,788 18.4% 0.6% 1.3% -0.7%
Cecil 3,528 24.6% 6,470 45.1% 2.1% 1.8% 0.3%
Charles 2,942 11.3% 8,443 32.3% 1.7% 2.3% -0.6%
Dorchester 1,862 40.7% 2,905 63.5% 1.1% 0.8% 0.3%
Frederick 3,569 8.9% 10,040 25.1% 2.1% 2.8% -0.7%
Garrett 784 19.8% 1,898 47.9% 0.5% 0.5% -0.1%
Harford 2,649 7.1% 11,047 29.5% 1.5% 3.1% -1.5%
Howard 4,709 9.0% 9,683 18.4% 2.7% 2.7% 0.1%
Kent 1,334 65.6% 1,037 51.0% 0.8% 0.3% 0.5%
Montgomery 17,827 12.0% 48,525 32.7% 10.4% 13.4% -3.0%
Prince George’s 34,052 28.2% 72,471 60.0% 19.9% 20.0% -0.2%
Queen Anne’s 522 6.9% 1,896 24.9% 0.3% 0.5% -0.2%
St. Mary’s 2,392 13.8% 5,255 30.3% 1.4% 1.5% -0.1%
Somerset 1,466 52.7% 1,969 70.8% 0.9% 0.5% 0.3%
Talbot 1,179 26.5% 1,768 39.7% 0.7% 0.5% 0.2%
Washington 2,775 12.8% 10,772 49.6% 1.6% 3.0% -1.4%
Wicomico 4,614 33.1% 8,159 58.6% 2.7% 2.3% 0.4%
Worcester 1,209 18.8% 2,738 42.5% 0.7% 0.8% -0.1%
Statewide 171,534 20.3% 361,741 42.9% 100.0% 100.0% 0.0%
1 Title I counts based on March 2014 program enrollment data; Free and Reduced Price Meal counts based on October 2013 program enrollment data. Counts for Free and Reduced Price Meal subtract estimates of pre-kindergarten enrollment based on March 2014 program enrollment data. Reported percentages rounded to a tenth of a percent.
County Poverty Rates vs. Free and Reduced-Price Meals Table 8, below, presents a comparison of using U.S. Census estimates of children living in poverty in each county versus free and reduced-price meal counts to identify low-income students in all schools. Because the Census poverty rate uses a lower threshold than all the proxies to identify children as low-income, the Census count of low-income students in the state is substantially lower than the FRPM

Evaluation of the Use of Free and Reduced-Price Meal Eligibility
21
count of students in the state, roughly 30.9 percentage points lower (12.0% vs. 42.9%). Using this model, the state share increase in seventeen school districts and decreases in six school districts. The largest increase in state shares is for Baltimore City (4.3 percentage points) while the largest decrease in state shares is for Prince George’s County (-5.1 percentage points). No other increase in state shares exceeds 0.5 percentage points (Wicomico and Worcester counties). Baltimore County has the next largest decrease in state shares (-1.5 percentage points) followed by Anne Arundel and Montgomery counties (-0.7 percentage points, each). As with the use of direct certification counts, this model increases the share of the state count for school districts with greater numbers of students at higher levels of economic need.
Table 8: County Shares of State Poverty and Free and Reduced Price Meal (FRPM) Counts Using 2013-14 Enrollment Data1
County Estimated
Poverty Count
Percent Enrollment
Estimated FRPM Count
Percent Enrollment
Poverty Share of
State Count
FRPM Share of State Count
Poverty Share Minus FRPM Share
Allegany 1,698 20.0% 4,634 54.6% 1.6% 1.3% 0.3%
Anne Arundel 6,183 8.0% 23,674 30.6% 5.9% 6.5% -0.7%
Baltimore City 24,221 30.0% 67,904 84.1% 23.0% 18.8% 4.3%
Baltimore 12,732 12.0% 49,037 46.2% 12.1% 13.6% -1.5%
Calvert 1,230 8.0% 3,769 24.5% 1.2% 1.0% 0.1%
Caroline 1,128 22.0% 2,859 55.7% 1.1% 0.8% 0.3%
Carroll 1,561 6.0% 4,788 18.4% 1.5% 1.3% 0.2%
Cecil 1,866 13.0% 6,470 45.1% 1.8% 1.8% 0.0%
Charles 2,612 10.0% 8,443 32.3% 2.5% 2.3% 0.1%
Dorchester 1,235 27.0% 2,905 63.5% 1.2% 0.8% 0.4%
Frederick 2,800 7.0% 10,040 25.1% 2.7% 2.8% -0.1%
Garrett 831 21.0% 1,898 47.9% 0.8% 0.5% 0.3%
Harford 2,994 8.0% 11,047 29.5% 2.8% 3.1% -0.2%
Howard 3,149 6.0% 9,683 18.4% 3.0% 2.7% 0.3%
Kent 406 20.0% 1,037 51.0% 0.4% 0.3% 0.1%
Montgomery 13,370 9.0% 48,525 32.7% 12.7% 13.4% -0.7%
Prince George’s 15,704 13.0% 72,471 60.0% 14.9% 20.0% -5.1%
Queen Anne’s 685 9.0% 1,896 24.9% 0.7% 0.5% 0.1%
St. Mary’s 1,736 10.0% 5,255 30.3% 1.7% 1.5% 0.2%
Somerset 918 33.0% 1,969 70.8% 0.9% 0.5% 0.3%
Talbot 668 15.0% 1,768 39.7% 0.6% 0.5% 0.1%
Washington 3,260 15.0% 10,772 49.6% 3.1% 3.0% 0.1%
Wicomico 2,924 21.0% 8,159 58.6% 2.8% 2.3% 0.5%

Evaluation of the Use of Free and Reduced-Price Meal Eligibility
22
Worcester 1,289 20.0% 2,738 42.5% 1.2% 0.8% 0.5%
Statewide 105,201 12.0% 361,741 42.9% 100.0% 100.0% 0.0%
1 Poor count based on 2013 U.S. Census Bureau estimate of the number of children ages 5-17 living in poverty in each county; FRPM count estimated using October 2013 program enrollment data. Counts for Free and Reduced Price Meal subtract estimates of pre-kindergarten enrollment based on March 2014 program enrollment data. Reported percentages rounded to a tenth of a percent.
Weighted County Poverty Rates vs. Free and Reduced-Price Meals Table 9, below, presents a comparison of using a weighted count based on U.S. Census estimates of children living in poverty in each county versus free and reduced-price meal counts to identify low-income students in all schools. The difference between this model and the previous model is that it weights the county’s estimated poverty count by the square of the ratio of the county’s poverty rate to the state’s poverty rate. The weight increases the poverty count in school districts that have a poverty rate greater than the state’s rate and decreases the poverty count in school district’s that have a poverty rate lower than the state’s rate. Using this model, the state poverty count increases to 20.1% compared to the previous simulation, still lower than the state FRPM count by 22.8 percentage points but nearly double the poverty count without the weight. State shares increase in ten school districts and decrease in thirteen school districts. Baltimore City has the largest increase in state shares (28.7 percentage points), followed by Wicomico County (3.0 percentage points), Dorchester County (1.9 percentage points), Allegany County (1.5 percentage points) and Caroline County (1.4 percentage points). Prince George’s County and Montgomery counties have the largest decreases in state shares (-9.2 and -9.0 percentage points, respectively). Noticeable decreases in state shares occur also for Baltimore County (-6.1 percentage points), Anne Arundel County (-4.9 percentage points), Harford’s County (-2.3 percentage points), Frederick County and Howard County (2.2 percentage points, each). Of all the models, this model affects the distribution of state shares the most, shifting more shares to school districts with the greatest economic need.
Table 9: County Shares of State Weighted Poverty and Free and Reduced Price Meal (FRPM) Counts Using 2013-14 Enrollment Data1
County
Estimated Weighted Poverty Count
Percent Enrollment
Estimated FRPM Count
Percent Enrollment
Weighted Poverty Share of
State Count
FRPM Share of State Count
Weighted Poverty
Share Minus FRPM Share
Allegany 4,717 55.6% 4,634 54.6% 2.8% 1.3% 1.5%
Anne Arundel 2,748 3.6% 23,674 30.6% 1.6% 6.5% -4.9%
Baltimore City 80,738 100.0% 67,904 84.1% 47.5% 18.8% 28.7%
Baltimore 12,732 12.0% 49,037 46.2% 7.5% 13.6% -6.1%
Calvert 546 3.6% 3,769 24.5% 0.3% 1.0% -0.7%
Caroline 3,793 73.9% 2,859 55.7% 2.2% 0.8% 1.4%
Carroll 390 1.5% 4,788 18.4% 0.2% 1.3% -1.1%

Evaluation of the Use of Free and Reduced-Price Meal Eligibility
23
Cecil 2,190 15.3% 6,470 45.1% 1.3% 1.8% -0.5%
Charles 1,814 6.9% 8,443 32.3% 1.1% 2.3% -1.3%
Dorchester 4,575 100.0% 2,905 63.5% 2.7% 0.8% 1.9%
Frederick 953 2.4% 10,040 25.1% 0.6% 2.8% -2.2%
Garrett 2,546 64.3% 1,898 47.9% 1.5% 0.5% 1.0%
Harford 1,330 3.6% 11,047 29.5% 0.8% 3.1% -2.3%
Howard 787 1.5% 9,683 18.4% 0.5% 2.7% -2.2%
Kent 1,129 55.6% 1,037 51.0% 0.7% 0.3% 0.4%
Montgomery 7,521 5.1% 48,525 32.7% 4.4% 13.4% -9.0%
Prince George’s 18,430 15.3% 72,471 60.0% 10.8% 20.0% -9.2%
Queen Anne’s 385 5.1% 1,896 24.9% 0.2% 0.5% -0.3%
St. Mary’s 1,206 6.9% 5,255 30.3% 0.7% 1.5% -0.7%
Somerset 2,781 100.0% 1,969 70.8% 1.6% 0.5% 1.1%
Talbot 1,044 23.4% 1,768 39.7% 0.6% 0.5% 0.1%
Washington 5,094 23.4% 10,772 49.6% 3.0% 3.0% 0.0%
Wicomico 8,955 64.3% 8,159 58.6% 5.3% 2.3% 3.0%
Worcester 3,581 55.6% 2,738 42.5% 2.1% 0.8% 1.3%
Statewide 169,985 20.1% 361,741 42.9% 100.0% 100.0% 0.0%
1. Poor count based on 2013 U.S. Census Bureau estimate of the number of children ages 5-17 living in poverty in each county; FRPM count estimated using October 2013 program enrollment data. Weighted poverty count is the count equal to the estimated poverty county times the square of the ratio of the county percent poverty to the state percent poverty. Counts for Free and Reduced Price Meal subtract estimates of pre-kindergarten enrollment based on March 2014 program enrollment data. Reported percentages rounded to a tenth of a percent.
Discussion & Recommendations Tables 10 and 11, below, compare the indicators of economically disadvantaged students by accessibility, predictive validity, face validity, and distributional effects. Table 10 compares proxies that are FRPM based, while Table 11 compares the alternative indicators that use the same method for estimating the number of low-income students for non-CEP and CEP schools.
Each table has six columns. The first column identifies the proxy for economic disadvantage. The next four columns compare indicators by accessibility, predictive validity, face validity, and distributional effects. The final column provides additional comments addressing other aspects of the strengths and weaknesses of each indicator as a proxy for economically disadvantaged students. For the purpose of comparison, the study team defines accessibility as the ease with which Maryland school districts and the state could acquire data relevant to the indicator. Predictive validity refers to how strongly an indicator correlates with the U.S. Census Bureau’s estimates of children living in poverty for each county and the City of Baltimore, another measure of economic need. Face validity is a more subjective trait, referring to the extent to which the public and policymakers are likely to see an indicator as a legitimate or meaningful indicator of economic need. Distributional effects are based on Tables 1 through 9 and

Evaluation of the Use of Free and Reduced-Price Meal Eligibility
24
show, compared to CRPM-eligible counts, school district shares of the of the state count of low-income students for each indicator.
FRPM-Based Simulations Table 10, below, compares the counts for the four simulations of FRPM-based methods for estimating economically disadvantaged students in non-CEP and CEP schools: Hybrid-All, Hybrid 1.8, Hybrid 1.6 and Hybrid 1.4. The baseline for these simulations is the free and reduced-price meal count, the current proxy for identifying economically disadvantaged students in the state. Each of these simulations estimates the number of students eligible for free and reduced-price meals, using a different estimation method in non-CEP and CEP schools.
Accessibility. The data for each of the FRPM-based indicators simulated by the study team are reasonably accessible to school districts and to the state. School districts in Maryland already use an alternative form to collect household income for students in CEP schools, though the state may want to consider ways to improve the forms and enhance the response rate for the collection of household income data. The hybrid counts have the advantage of not requiring the collection of household income through an alternative form, especially the Hybrid-All model, which designates all students in CEP schools as economically disadvantaged, and the Hybrid 1.6 model, which is a multiplier set by the U.S. Department of Agriculture. Only the Hybrid 1.8 and Hybrid 1.4 models would require periodic collection of household income using an alternative form in CEP schools to adjust these models to reflect any changes in the ratio of free and reduced-price counts to direct certified counts in the state and in CEP schools.
Predictive Validity. Each of the FRPM-based indicators has strong predictive validity as judged by each indicator’s correlation with the U.S. Census Bureau’s 2013 estimates of children living in poverty in the counties. Because the poverty rate provides a broadly accepted estimate of economic need, the study team used the correlation of each indicator with the poverty rate as a measure of predicative validity. Pearson r ranges between .91 and .95, indicating a very strong positive correlation between the indicators and the corresponding county poverty rates. Differences in the correlation coefficients for the different indicators are negligible, meaning each indicator provides a strong proxy for poverty or economic need in a school district. These correlations are similar to those reported by other researchers for other states for the relationship between the percent of students eligible for free and reduced-price meals and school district poverty rates. In general, roughly 90% of the variation in FRPM counts can be “explained by” the variation in children’s poverty rates (Baker, 2013, p. 3).
Face Validity. School administrators have long expressed fears that the FRPM counts underestimate the number of low-income students in schools because not all households complete the federal application for the meals program. This is especially of concern in schools that serve poorer neighborhoods. On the other hand, as the proportion of students identified as eligible to receive free and reduced-price meals continues to grow in the state and in the nation, public confidence in eligibility for free and reduced-price meals as an indicator of low-income status may begin to erode. In a number of states, most recently Indiana, which eliminated the use of FRPM-eligibility counts for the school funding formula,

Evaluation of the Use of Free and Reduced-Price Meal Eligibility
25
policymakers have argued that eligibility to participate in the National School Lunch Program over-estimates the number of students with economic need (Baker, 2011, 2013). None of the hybrid models address these concerns directly. The use of an alternative form to collect household income is likely to have more face validity than any of the hybrid models, because it provides an actual count of students (and not an estimate) in CEP schools. The one exception is the Hybrid-All model that counts every student as economically disadvantaged in CEP schools.
Distributional Effects. When compared to current practices – the use of free-and reduced price meals as a proxy for economic disadvantage – the hybrid models have only modest effects on the distribution of state shares. The largest distributional effects are associated with the Hybrid-All model, which increases shares for school districts that have larger CEP enrollments. Hybrid 1.4 has the smallest distribution effects, both in terms of the range of change in state shares (0.5 to -0.2 percentage points) and the number of affected school districts (nine).
Additional Comments. Although U.S. Department of Education (2015) guidelines permit the classification of all students attending CEP schools as low income for the purpose of accountability, doing so means that low-income students will be identified differently in non-CEP and CEP schools. Students classified as low income in non-CEP schools are likely to come from households that have slightly lower incomes than students classified as low income in CEP schools. Only the use of an alternative form to collect household data would ensure that the same classification of low-income students for the purpose of accountability or determining eligibility for programs within and across school districts in the state.
Table 10: Comparison of Indicators Based on Free and Reduced Price Meal (FRPM) Count
Indicator Accessibility Predictive
Validity Face Validity
Distributional Effects
Additional Comments
FRPM Count Requires use of alternative form in CEP schools.
Correlation between school district percent FRPM and county or city percent poverty (r = .91).
Traditional indicator of low- income in state and nation.
No change in share of state count between school districts.
May require enhanced collection procedures to encourage completion of alternative form.
Hybrid-All Count
Does not require use of alternative form in CEP schools.
Correlation between school district percent FRPM and county or city percent poverty (r = .94).
Determination of count different in CEP and non-CEP schools.
Increases shares for ten school districts; decreases shares for eight school districts (Range of change = 0.9 to -0.9 percentage points).
If all CEP students used for accountability purposes, classification of students different in CEP and non-CEP schools.

Evaluation of the Use of Free and Reduced-Price Meal Eligibility
26
Hybrid 1.8 Count
Does not require use of alternative form in CEP schools.
Correlation between school district percent FRPM and county or city percent poverty (r = .95).
Ratio of FRPM to direct certification (DC) counts specific to state; not actual count in CEP schools.
Increases shares for eight school districts; decreases shares for eight school districts (Range of change = 1.2 to -0.7 percentage points).
If all CEP students used for accountability purposes, classification of students different in CEP and non-CEP schools.
Hybrid 1.6 Count
Does not require use of alternative form in CEP schools.
Correlation between school district percent FRPM and county or city percent poverty (r = .94).
Used nationally but not specific to state; not actual count in CEP schools.
Increases shares for six school districts; decreases shares for seven school districts (Range of change = 1.1 to -0.5 percentage points).
If all CEP Students used for accountability purposes, classification of students different in CEP and non-CEP schools.
Hybrid 1.4 Count
Does not require use of alternative form in CEP schools.
Correlation between school district percent FRPM and county or city percent poverty (r = .93).
Specific to CEP eligible schools in state; not actual count on CEP schools.
Increases shares for four school districts; decreases shares for five school districts (Range of change = 0.5 to -0.2 percentage points).
If all CEP Students used for accountability purposes, classification of students different in CEP and non-CEP schools.
Alternative Indicator Simulations Table 11 compares the results for the five simulations of alternative indicators for estimating counts of economically disadvantaged students in non-CEP and CEP schools: Free Only, Direct Certification, Title I, Poverty and Weighted Poverty. The baseline for these simulations is the same baseline used for the FRPM-based simulations, the FRPM count. Unlike the hybrid models, each of these simulations estimates the number of economically disadvantaged students using the same method in non-CEP and CEP schools. Each alternative indicator also results in a lower state count of economically disadvantaged students, because each indicator relies on a more restrictive income threshold to identify students who come from low-income households.
Accessibility. As with the FRPM-based indicators, the data for the alternative indicators simulated by the study team are reasonably accessible to school districts and to the state. The most burdensome indicator would be the use of free-meal eligible students as the proxy for economically disadvantaged students, because this proxy requires the continued use of an alternative household income form in CEP schools (a requirement that could be dropped if one of the other proxies was used for the compensatory funding formula). Direct Certification counts require social services agencies and school districts to link social service program data with enrollment data, but these linkage procedures are not new and are required by federal regulations. The same is true for Title I reporting. Data for Poverty counts and the Weighted Poverty counts are readily available and school districts and the state can acquire them at any time, and at no cost, online, through the U.S. Census Bureau’s Small Area Income and Poverty Estimates program (SAIPE).
Predictive Validity. Each of the alternative indicators has strong predictive validity as judged by each indicator’s correlation with the U.S. Census Bureau’s 2013 estimates of children living in poverty in the

Evaluation of the Use of Free and Reduced-Price Meal Eligibility
27
counties. Pearson r ranges between .85 and .98. Although differences in the correlation coefficients are greater for the alternative indicators compared to the FRPM-based indicators, each indicator still provides a strong proxy for poverty or economic need in a school district. The slightly lower correlation between Title I counts and children’s poverty rates likely reflects the fact the Title counts are not exclusively based on economic need but also include students classified as at risk of failure.
Face Validity. Each of the alternative indicators has reasonable face validity, though each may also raise concerns about whether the indicator underestimates the number of students with economic need. While a strength of the alternative indicators is that they use more restrictive, though generally accepted, income criteria for identifying students as economically disadvantaged, these indicators also reduce the state count for students identified as low income. 13 The use of Free Only counts may raise some of the same concerns associated with FRPM eligibility – that is, concerns about whether the self-reporting of income by families under- or over-estimates needs, and the use of Title I counts confounds economic and educational needs. Nonetheless, each of these indicators is used by other states as part of their compensatory aid formula.14
Counts of students identified through direct certification have an advantage in that they require documentation of students’ eligibility for various social services and social services agencies evaluate this documentation. However, not everyone eligible to receive social services applies for such services, because of the stigma attached to being a recipient of public assistance or the burdens that federal regulations place on recipients of public assistance. Moreover, because public services may be contingent on the recipients’ legal status, a student’s household may not be able to participate in specific programs despite meeting the income eligibility requirement.15
Estimates of children in poverty provide the most direct indicator of economic need, but even this indicator may raise some concerns. Only poverty rates estimated using decennial census data are based on actual counts of individual children and family members and reported household income. SAIPE’s estimates of poverty, though demonstrated to be reliable,16 are based on economic and demographic statistical models without new data collection. Moreover, in school systems surrounded by well-established private schools, the actual poverty rate in a school district could be higher than that reported for the county.
Distributional Effects. When compared to FRPM-based models, the alternative indicators have stronger effects on the distribution of state shares. The smallest distributional effects are associated with the Free Only model, which increases shares for school districts that have larger proportions of students
13 Although not the focus of this report, a higher weight could be used in the compensatory aid formula to compensate for a lower state count if one of the alternative indicators was used as the proxy for economically disadvantaged students. According to Baker (2013), more restrictive or stringent count methods require larger weights than less restrictive or stringent methods. 14 Seven states use Free Only counts while three states use Title I counts. 15 Five states and the District of Columbia use Direct Certification counts in their compensatory aid formula. 16 Maples J., & Bell, R. (Undated). Evaluation of school district poverty estimates. Predictive models using IRS income tax data. Retrieved from http://www.census.gov/did/www/saipe/publications/files/asa05finalmaples.pdf

Evaluation of the Use of Free and Reduced-Price Meal Eligibility
28
eligible for free meals than reduced-price meals. This model affects the state shares of nine school districts, ranging from an increase in state shares of 1.5 percentage points to a decrease in state shares of -0.9 percentage points. All of the other models affect state shares in 23 of the school districts. In the case of Direct Certification counts, Poverty counts and Weighted Poverty counts, the indicators clearly increase the state shares in school districts that enroll students with greater economic need. The distributional effects are greatest for the Weighted Poverty counts, which increases state shares by 28.7 percentage points in one school district and decreases state shares by -9.2 and -9.0 percentage points in in two other school districts.
Additional Comments. Free Only counts, Direct Certification counts and Title I counts permit the classification of individual students as low income for the purpose of accountability or qualification for programs. These indicators have the advantage of uniform classification methods within and across school districts in the state. Match rates for direct certification are relatively high in Maryland, though some counties are more successful matching social service records with school enrollment records (the range is 79 % to 100%). Poverty rates do not provide an individual indicator for the purpose of accountability or determining eligibility for other programs, so school officials and policymakers would still need to decide how to classify students as low income if the Poverty count or Weighted Poverty count indicators were adopted. Decennial Census results could also require substantial adjustments to these counts and Title I counts, which are partially based on decennial census data. However, any disruption caused by new estimates of poverty for each county could be addressed through a “hold harmless” provision, which would limit the annual change in compensatory aid for school districts.
Table 11: Comparison of Alternative Indicators of Economic Disadvantage
Indicator Accessibility Predictive
Validity Face Validity
Distributional Effects
Additional Comments
Free Only Requires use of alternative form in CEP schools.
Correlation between school district percent FRPM and county or city percent poverty (r = .92).
More restrictive classification of economic need. Precedent U in six states.
Increases shares for two school districts; decreases shares for seven school districts (Range of change = 1.5 to -0.9 percentage points).
May require enhanced collection procedures to encourage completion of alternative form.
Direct Certification Count
Does not require use of alternative form in CEP schools.
Correlation between school district percent FRPM and county or city percent poverty (r = .94).
More restrictive classification of economic need. Precedent in five states and District of Columbia.
Increases shares for seventeen school districts; decreases shares for six school districts (Range of change = 6.2 to -5.9 percentage points).
Counties and city vary in match rates for direct certification (Range in rates = 0.79 to 1.00).
Title I Count
Does not require use of alternative form in CEP schools.
Correlation between school district percent FRPM and county or city percent poverty
Combines economic and educational need. Precedent in three states.
Increases shares for eleven school districts; decreases shares for thirteen school districts (Range of change =
Decennial Census may require substantial adjustments in count.

Evaluation of the Use of Free and Reduced-Price Meal Eligibility
29
(r = .85). 9.2 to -3.0 percentage points).
U.S. Census Poverty Estimate for Children Ages 5-17
Estimates provided by U.S. Census Bureau.
Not Applicable
More restrictive classification of economic need. Not actual count most years. Precedent in two states.
Increases shares for seventeen school districts; decreases shares for six school districts (Range of change = 4.3 to -5.1 percentage points).
Does not provide individual indicator for purpose of accountability; decennial Census may require substantial adjustments in count.
Weighted U.S. Poverty Estimate for Children Ages 5-17
Estimates provided by U.S. Census Bureau.
Correlation between school district percent FRPM and county or city percent poverty (r = .98).
Weights school district counts relative to state poverty rate. Not actual count most years. Precedent in one state.
Increases shares for ten school districts; decreases shares for thirteen school districts (Range of change = 28.7 to -9.2 percentage points).
Does not provide individual indicator for purpose of accountability; decennial Census may require substantial adjustments in count.
Recommendations All nine indicators examined in this report have strong predictive validity, so each provides a reasonable proxy for economic need or low-income status in school districts and across the state. Although for each of the hybrid models, all students in CEP schools could be classified as low income for the purposes of accountability and determining eligibility for programs, doing so results in a different method of classification for non-CEP and CEP schools. Only Free and Reduced-price Meal counts, Free Only counts, Direct Certification counts and Title I counts provide an individual indicator of low-income status, so the study team believes these four options are superior to each of the hybrid indicators and the Census estimates of poverty rates that were examined. Of the three hybrid indicators, the Hybrid 1.4 count provides the best estimate of what the free and reduced-price meals count would be in a CEP school if the federal application for school meals were used. However, the Hybrid 1.4 count still fails to provide an actual individual indicator of low-income status for students that would be the same in all schools.
Of the four options that provide an individual indicator of economic need, the study team considers the continued use of free and reduced-price meals and the use of Direct Certification as being the best proxies for identifying economically disadvantaged students. Neither free meal eligibility nor Title I counts provide a distinct advantage over the current practice of using FRPM-eligibility counts to determine compensatory aid to school district. The study team’s first option, continuing to use eligibility for free and reduced-price meals, maintains the status quo and has precedent in 20 states that use this indicator exclusively in their compensatory aid formula. School districts already have experience collecting income data using the federal application in schools. As more schools opt for CEP, school districts will have more experience collecting income data with alternative forms.

Evaluation of the Use of Free and Reduced-Price Meal Eligibility
30
If the state continues to use FRPM eligibility as a proxy for economically disadvantaged students, the study team recommends that the state collaborate with school districts to develop strategies for improving response rates for alternative forms. The state could facilitate the sharing of best practices across school districts and experimentation with collection protocols. A repository of alternative forms and collection strategies could be created online, much like the California State Department of Education’s repository. Creating this sort of repository would provide guidance to school districts on developing clear household income forms and efficient collection procedures, particularly for schools that serve poorer neighborhoods. This seems to be the most prevalent response to HHFKA and CEP by states across the nation.
The study team’s second option, using direct certification counts to determine compensatory aid, would represent a major change in the state’s funding formula. Although less common across the nation, the use of direct certification as the primary indicator for determining compensatory aid has been adopted by five states and the District of Columbia, most recently Massachusetts. Given the distributional effects reported in Table 6, shifting from free and reduced-price meals counts to direct certification counts would have to occur over time, with provisions to limit the annual shifts in compensatory aid to school districts. The study team recommends that the number of social services used to identify low-income students be expanded to include children in households that receive Medicaid support or participate in the Children’s Health Insurance program. This would help to capture a larger number of students who qualify for means-tested social services. Efforts could also be made to improve the matching procedures social service agencies and school districts use to directly certify students’ eligibility for school meals. Although the successful matching rate is relatively high in the state (91 percent), the rate varies across school districts, Montgomery County reports a matching rate of 99 percent while Baltimore County reports a matching rate of 79 percent. While shifting to direct certification, over time, would disrupt the status quo, it would also direct greater aid to school districts that serve more economically needy students.

Evaluation of the Use of Free and Reduced-Price Meal Eligibility
31
References
Baker, B. (2011, March 25). School finance 101: Measuring poverty in education policy research. Retrieved from https://schoolfinance101.wordpress.com/2011/03/25/measuring-poverty-in-education-policy-research/.
Baker, B. (2013, July 18). A poverty of thinking about poverty measures in New Jersey school finance. Retrieved from https://njedpolicy.files.wordpress.com/2013/07/poverty_counts_july_20131.pdf.
Carey, K. (2002, November 7). State poverty-based education funding: A survey of current programs and options for improvement. Retrieved from https://schoolfinancesdav.wordpress.com/.
Center on Budget and Policy Priorities. (2015, February 25). Take up of community eligibility this year. Retrieved from http://www.cbpp.org/research/take-up-of-community-eligibility-this-school-year?fa=view&id=5273.
Cowan, C., Hauser, R., Kominski, R., Levin, H., Lucas, S., Morgan. S. et al. (2012, November). Improving the measurement of socioeconomic status for the National Assessment of Education Progress. Recommendations to the National Center for Education Statistics. Retrieved from https://nces.ed.gov/nationsreportcard/pdf/researchcenter/Socioeconomic_Factors.pdf.
Education Law Center (February 2013), Funding formulas and fairness: What Pennsylvania can learn from other state education funding formulas. Philadelphia, PA: Author.
Harwell, M., & LeBeau, B. (2010). Study of eligibility for free lunch as a SES measure in education research. Educational Researcher, 39(2), 120-131.
Healthy, Hunger-Free Act of 2010. Retrieved from http://www.gpo.gov/fdsys/pkg/BILLS-111s3307enr/pdf/BILLS-111s3307enr.pdf.
Hewins, J., & Levin, M. (2014, June 19). The community eligibility provision: Alternatives to school meal applications. Retrieved from http://frac.org/pdf/cep_and_eliminating_school_meal_applications.pdf.
Hunger-Free Schools Act 2015. Retrieved http://mgaleg.maryland.gov/2015RS/fnotes/bil_0004/sb0334.pdf.
Levin, M., & Neuberger, Z. (2013, October 1). Community eligibility: Making high-poverty schools hunger free. Washington, DC: Food Research and Action Center and Center on Budget and Policy Priorities.
Library and Information Services, Office of Policy Analysis, Legislative Services. (2014). Legislative handbook series: Education in Maryland (Vol. IX). Annapolis, MD: Author.

Evaluation of the Use of Free and Reduced-Price Meal Eligibility
32
Southern Education Foundation (2015, January). Research Bulletin: A new majority. Low income students now majority in nation’s public schools. Retrieved from http://www.southerneducation.org/getattachment/4ac62e27-5260-47a5-9d02-14896ec3a531/A-New-Majority-2015-Update-Low-Income-Students-Now.aspx.
Sparks, S. (2014, August 20). Popular child poverty measure gets another look. Retrieved from http://www.edweek.org/ew/articles/2014/08/20/01povertymeasures.h34.html.
Sunderman, G., & Dayhoff, J. (2014, November 13). Policy Research: Creating opportunities or settling for inequalities. Two decades of change in Maryland’s public schools. College Park, MD: University of Maryland, College Park, Maryland Equity Project.
Ushomirsky, N., & Williams, D. (2015, March). Funding gaps 2015: Too many states still spend less on educating students who need the most. Washington, DC: The Education Trust.
U.S. Department of Agriculture, Food and Nutrition Services. (2015, July). Eligibility annual for school meals. Retrieved from http://www.fns.usda.gov/sites/default/files/cn/SP40_CACFP18_SFSP20-2015a.pdf.
U.S. Department of Education, Office of Elementary and Secondary Education. (2015, March). Guidance. The Community Eligibility Provision and selected requirements under Title I, Part A, of the Elementary and Secondary Education Act of 1965, as amended. Washington, DC: Author
Verstegen, D. A. (2015). A quick glance at school finance: A 50 state survey of school finance policy. Retrieved from https://schoolfinancesdav.wordpress.com/.

Evaluation of the Use of Free and Reduced-Price Meal Eligibility
33
Appendix Indicators of Low-Income Status Used by State Funding Formulas1
State Indicator Comments or Additional Sources
Alabama Free and Reduced-Price Meal count
Alaska None No indicator of low-income status used in state school funding formula.
Arizona None No indicator of low-income status used in state school funding formula. Supplemental funding provided for broad categories of compensatory aid.
Arkansas Free and Reduced-Price Meal count
Draft legislation designates all students in CEP schools as economically disadvantaged for the purpose of accountability. http://adesharepoint2.arkansas.gov/memos/Lists/Approved%20Memos/Attachments/1488/Draft%20Community%20Eligibility%20%20Provision%20(CEP)%20National%20School%20Lunch%20(NSL)%20Procedures%20(3).pdf
California Free and Reduced-Price Meal count http://www.cde.ca.gov/Fg/aa/lc/lcfffaq.asp#PROV2and3
Colorado Free only count http://www.colorado.gov/cs/Satellite?blobcol=urldata&blobheader=application%2Fpdf&blobkey=id&blobtable=MungoBlobs&blobwhere=1251699592646&ssbinary=true
Connecticut Title I count http://www.cga.ct.gov/2012/rpt/2012-R-0101.htm
Delaware None No indicator of low-income status used in state school funding formula. Supplemental funding provided for broad categories of compensatory aid.
District of Columbia
Unduplicated count of homeless students, foster care children, and children who receive services from Supplemental Nutritional Assistance or Temporary Assistance for Needy Families.
http://dme.dc.gov/sites/default/files/dc/sites/dme/publication/attachments/Frequently%20Asked%20Questions%20Proposed%20FY15%20UPSFF%20with%20appendices.pdf
Florida None No indicator of low-income status used in state school funding formula.
Georgia None No indicator of low-income status used in state school funding formula.
Hawaii Free and Reduced-Price Meal count
Idaho None No indicator of low-income status used in state school funding formula.

Evaluation of the Use of Free and Reduced-Price Meal Eligibility
34
State Indicator Comments or Additional Sources
Illinois
Unduplicated count of children who receive services from Medicaid, Supplemental Nutritional Assistance, Children’s Health Insurance Program or Temporary Assistance for Needy Families services.
http://www.isbe.net/funding/pdf/gsa_overview.pdf
Indiana
Unduplicated count of children who receive services from Supplemental Nutritional Assistance, Children’s Health Insurance Program, foster care or other (unspecified) public assistance programs.
http://in.chalkbeat.org/2015/04/30/wealthiest-schools-thrive-under-new-state-budget-while-poor-ones-mostly-get-less/#.VWcy0GTBwXA
Iowa Free and Reduced-Price Meal count
Kansas Free only count Transitioning to supplemental funding for broad categories of compensatory aid. http://www.kansas.com/news/politics-government/article16333310.html
Kentucky Free only count
Louisiana Free and Reduced-Price Meal count
Maine Free and Reduced-Price Meal count http://www.pressherald.com/2013/12/11/education_committee_hopes_to_introduce_school_funding_reform_bill_/
Maryland Free and Reduced-Price Meal count
Massachusetts
Unduplicated count of children who receive services from Supplemental Nutritional Assistance, Transitional Assistance for Families with Dependent Children, foster care and MassHealth (Medicaid).
Recently adopted. http://www.doe.mass.edu/infoservices/data/ed.html
Michigan
Unduplicated count of abused children, pregnant teens, homeless children, migrant children, children who have immigrated within the last three years or children who receive free lunches.
http://www.michigan.gov/documents/Section_31a_Legislation_37026_7.pdf
Minnesota Free and Reduced-Price Meal count
Mississippi Free only count
Missouri Free and Reduced-Price Meal count
Montana Title I count

Evaluation of the Use of Free and Reduced-Price Meal Eligibility
35
State Indicator Comments or Additional Sources
Nebraska Free only count
Nevada None No indicator of low-income status used in state school funding formula.
New Hampshire Free and Reduced-Price Meal count
New Jersey Free and Reduced-Price Meal count http://www.nj.gov/education/stateaid/1213/report.pdf
New Mexico None No indicator of low-income status used in state school funding formula.
New York Free and Reduced-Price Meal count https://stateaid.nysed.gov/publications/handbooks/handbook_2012.pdf
North Carolina Title I count Supplemental grants provided for low-income counties. http://www.dpi.state.nc.us/fbs/allotments/state/
North Dakota Free and Reduced-Price Meal count
Ohio
Weighted U.S. Census estimate of children’s poverty rate. Equal to the estimated poverty count in a school district times the square of the poverty rate in a school district divided by the poverty rate in the state.
https://education.ohio.gov/getattachment/Topics/Finance-and-Funding/State-Funding-For-Schools/Traditional-Public-School-Funding/SFPR-Funding-Form-Line-by-Line-Explanation-FY2014-1.pdf.aspx
Oklahoma Free and Reduced-Price Meal count
Oregon
Count of students who receive services from parenting and pregnancy programs, neglected or delinquent youth, foster care or identified as living in poverty.
Not capped by school enrollment.
Pennsylvania None No indicator of low-income used in state school funding formula.
Rhode Island Free and Reduced-Price Meal count
South Carolina Free and Reduced-Price Meal count and Medicaid eligibility count https://ed.sc.gov/agency/rda/PovertyIndex.cfm
South Dakota None No indicator of low-income status used in state school funding formula.

Evaluation of the Use of Free and Reduced-Price Meal Eligibility
36
State Indicator Comments or Additional Sources
Tennessee Free and Reduced-Price Meal count
Texas Free and Reduced-Price Meal count
Utah Poverty and mobility rates Funding restricted for use in a gang prevention program.
Vermont
Count of children who receive services from Supplemental Nutritional Assistance Program.
Virginia Free only count
Washington Free and Reduced-Price Meal count
West Virginia None No indicator of low-income status used in state school funding formula.
Wisconsin Free and Reduced-Price Meal count Used primarily to offset wealth adjustments and provide supplemental funding for achievement programs in districts with high concentrations of low-income students.
Wyoming Unduplicated free and reduced-price meals count and mobile students (grades 6-12) count.
1 Unless stated otherwise, information drawn from D. A. Verstegen, A quick glance of school finance: A 50 state survey of school finance policy (2015). Retrieved from https://schoolfinancesdav.wordpress.com/.
Related Documents


