EVALUATION OF THE TESTS OF SENSORY INTEGRATION FUNCTION USED WITH INFANTS. Marica Botha A dissertation submitted to the Faculty of Health Sciences, University of the Witwatersrand, Johannesburg, in fulfilment of the requirements for the degree of Master of Science in Occupational Therapy Johannesburg October 2015

Welcome message from author
This document is posted to help you gain knowledge. Please leave a comment to let me know what you think about it! Share it to your friends and learn new things together.
Transcript

EVALUATION OF THE TESTS OF SENSORY INTEGRATION
FUNCTION USED WITH INFANTS.
Marica Botha
A dissertation submitted to the Faculty of Health Sciences, University
of the Witwatersrand, Johannesburg, in fulfilment of the requirements
for the degree
of
Master of Science in Occupational Therapy
Johannesburg
October 2015

ii
DECLARATION
I, Marica Botha, declare that this dissertation is my own work. It is being submitted
for the degree of Master of Science in Occupational Therapy at the University of
the Witwatersrand, Johannesburg. It has not been submitted before for any
degree or examination at this or any other University.
M. Botha
on the day of , 2015

iii
DEDICATION
This research study is dedicated to my husband Francois Botha,
whom supported me throughout the process of writing this dissertation,
and to my two daughters Nadia and Ciska.

iv
ABSTRACT
Sensory integrative dysfunction occurs in 5-10% of children. Various tests are
used to identify sensory dysfunction in infants in South Africa but they have not
been validated in this context. The purpose of this study was to explore the
comparison of normative scores, construct validity and diagnostic accuracy of two
standardised assessments: the Infant/Toddler Sensory Profile (ITSP), a parent
report tool and the Test of Sensory Functions in Infants (TSFI), a therapist
administered test on 60 infants. The sample was recruited from child day care
facilities in the East Rand. Overall reliability of the ITSP was found to be within an
acceptable range, while for the TSFI it was below an acceptable range. The TSFI
had poor diagnostic accuracy for the total score on a number of sections. The
divergent validity found between the sections of the two tests confirmed that they
do not measure the same constructs of sensory processing.

v
ACKNOWLEDGEMENT
My sincere gratitude goes to the following people:
• My supervisors Denise Franzsen and Lyndsay Koch for their input,
support and guidance with this dissertation.
• Me. A. van Jaarsveld for her guidance and support.
• All the supervisors and staff at the various child day care facilities that
was used during the data collection phase of this study.
• The South African Institute for Sensory Integration (SAISI), for their
financial support in the form of a research grant.
• My family, for their patience and continues support throughout this
process.
vi
TABLE OF CONTENT
DECLARATION.....................................................................................................................................II
DEDICATION ....................................................................................................................................... III
ABSTRACT ........................................................................................................................................... IV
ACKNOWLEDGEMENT .................................................................................................................. V
TABLE OF CONTENT ...................................................................................................................... VI
LIST OF FIGURES ............................................................................................................................. X
LIST OF TABLES ............................................................................................................................... XI
DEFINITION OF TERMS ............................................................................................................... XII
ABBREVIATIONS ............................................................................................................................. XV
CHAPTER 1: INTRODUCTION ............................................................................. 1
1.1 INTRODUCTION ........................................................................................................................ 1
1.2 PROBLEM STATEMENT ....................................................................................................... 4
1.3 RESEARCH QUESTION ........................................................................................................ 5
1.4 PURPOSE OF THE STUDY ................................................................................................. 5
1.4.1 Aim of the study .................................................................................... 6
1.4.2 Objectives ............................................................................................. 6
1.5 JUSTIFICATION FOR THE STUDY .................................................................................. 6
1.6 OVERVIEW OF THE STUDY ............................................................................................... 7
CHAPTER 2: LITERATURE REVIEW .................................................................. 8
2.1 INTRODUCTION ........................................................................................................................ 8
2.2 NORMAL DEVELOPMENT ................................................................................................... 8
2.2.1 Normal development of sensory systems ............................................. 9
2.3 SENSORY INTEGRATION ................................................................................................... 9
2.3.1 Sensory Integration Theory................................................................. 10
2.3.2 Sensory Integrative Dysfunction ......................................................... 12
2.3.3 Sensory Modulation ............................................................................ 15
2.3.4 Dunn’s Model of Sensory Processing ................................................. 17
2.4 ASSESSMENT......................................................................................................................... 20
2.4.1 Concepts of assessment..................................................................... 20
2.4.2 Use of standardised tests for assessment. ......................................... 21
2.4.3 Assessment of Sensory Integrative Dysfunction (SID). ...................... 22

vii
2.4.3.1 Infant/Toddler Sensory Profile (ITSP) .......................................... 23
2.4.3.2 Test of sensory functions in infants (TSFI) .................................. 25
2.4.4 Use of Parent Questionnaire and Therapist Observation tests. .......... 26
2.4.4.1 Parent Questionnaire ................................................................... 26
2.4.4.2 Therapist administered test ......................................................... 27
2.4.5 Critical review of tests ......................................................................... 28
2.5 EARLY INTERVENTION ..................................................................................................... 29
2.5.1 South African policy on early intervention ........................................... 30
2.5.2 Importance of early intervention in sensory integration ....................... 31
2.6 CONCLUSION ......................................................................................................................... 33
CHAPTER 3: RESEARCH METHODOLOGY ...................................................... 34
3.1 STUDY DESIGN ...................................................................................................................... 34
3.2 POPULATION .......................................................................................................................... 34
3.2.1 Sampling ............................................................................................. 34
3.2.2 Sample size ........................................................................................ 36
3.3 RESEARCH TOOLS ............................................................................................................. 37
3.3.1 Demographic sheets: Compiled by researcher (Appendix A) ............. 37
3.3.2 Infant/Toddler Sensory Profile: by Dunn,W. (Appendix B) .................. 37
3.3.3 Test of Sensory Functions in Infants (TSFI) by De Gangi & Greenspan
(Appendix C) ...................................................................................... 39
3.4 PROCEDURE ........................................................................................................................... 40
3.4.1 Data collection procedure ................................................................... 40
3.4.2 Data Analysis procedure ..................................................................... 42
3.5 ETHICAL CONSIDERATIONS: ........................................................................................ 43
CHAPTER 4: RESULTS ...................................................................................... 45
4.1 INTRODUCTION ..................................................................................................................... 45
4.2 DEMOGRAPHICS .................................................................................................................. 45
4.2.1 General Demographics ......................................................................... 45
4.2.2 Birth History of Infant participants ......................................................... 46
4.3 COMPARISON OF NORMATIVE DATA OF THE INFANT/TODDLER
SENSORY PROFILE (ITSP) AND TEST OF SENSORY FUNCTIONS IN
INFANTS (TSFI) ...................................................................................................................... 47
viii
4.3.1 Infant/Toddler Sensory Profile (ITSP) ................................................. 47
4.3.1.1 Comparison to normative data and typical range ........................ 47
4.3.1.2 Frequency of typical, probable and definite differences ............... 51
4.3.2 Test of Sensory Functions in Infants (TSFI) ..................................................... 57
4.3.2.1 Comparison to typical range ........................................................ 57
4.3.2.2 Frequency of typical, probable and definite differences ............... 58
4.3.3 Sensitivity and Specificity.................................................................... 62
4.3.4 Construct validity correlation scores for Test of Sensory Functions in
Infants (TSFI) and Infant/Toddler Sensory Profile (ITSP). ................. 64
4.3.5 Reliability ............................................................................................ 66
4.4 SUMMARY .................................................................................................................................. 67
CHAPTER 5: DISCUSSION ................................................................................. 70
5.1 INTRODUCTION ..................................................................................................................... 70
5.2 DEMOGRAPHICS .................................................................................................................. 70
5.3 ASSESSMENT OF SENSORY INTEGRATIVE TESTS FOR INFANTS FOR
THE SOUTH AFRICAN CONTEXT ................................................................................ 72
5.3.1 Infant/Toddler Sensory Profile (ITSP) ................................................. 73
5.3.2 Test of Sensory Function in Infants (TSFI) ......................................... 81
5.4 DIAGNOSTIC ACCURACY OF TESTS ........................................................................ 85
5.4.1 Infant/Toddler Sensory Profile (ITSP) ................................................. 86
5.4.2 Test of Sensory Functions in Infants (TSFI) ........................................ 88
5.5 CONSTRUCT VALIDITY AND INTERNAL CONSISTENCY OF TESTS FOR
SENSORY INTEGRATION FUNCTION IN INFANTS. .......................................... 91
5.5.1 Construct validity ................................................................................ 91
5.5.2 Internal Consistency ........................................................................... 92
5.6 OTHER VARIABLES AFFECTION THE USE OF THE STANDARDISED
TESTS IN SOUTH AFRICA ................................................................................................ 93
5.7 LIMITATIONS OF THE STUDY ........................................................................................ 95
5.8 SUMMARY .................................................................................................................................. 96
CHAPTER 6: CONCLUSION ............................................................................... 99
6.1 RECOMMENDATIONS ...................................................................................................... 103
REFERENCES ................................................................................................... 105

ix
APPENDICES .................................................................................................... 116
APPENDIX A1 ................................................................................................................................. 117
APPENDIX A2 ................................................................................................................................. 118
APPENDIX A3 ................................................................................................................................. 120
APPENDIX B1 ................................................................................................................................. 121
APPENDIX B2 ................................................................................................................................. 122
APPENDIX C .................................................................................................................................... 126
APPENDIX D .................................................................................................................................... 130
APPENDIX E .................................................................................................................................... 131
APPENDIX F1 .................................................................................................................................. 134
APPENDIX F2 .................................................................................................................................. 137

x
LIST OF FIGURES
Figure 2.1 Continuum of sensory registration and responsivity. ........................... 16
Figure 2.2 Relationships between Behavioural Response and Neurological
Thresholds ............................................................................................................ 18
Figure 3.1 Instructions to parents ......................................................................... 41
Figure 4.1 Raw scores of processing sections compared to normative data. ....... 48
Figure 4.2 Raw scores of quadrants compared to normative data ....................... 48
Figure 4.3 Distribution of scores for visual processing section ............................. 53
Figure 4.4 Distribution of scores for quadrant 2: sensation seeking ..................... 53
Figure 4.5 Distribution of scores for vestibular processing section ....................... 54
Figure 4.6 Distribution of scores for auditory, tactile and oral sensory processing
sections................................................................................................ 55
Figure 4.7 Distribution of quadrant scores for quadrant 1: low registration,
quadrant 3: sensory sensitivity, and quadrant 4: sensation avoiding ... 56
Figure 4.8 Distribution of scores for combined quadrant: low threshold ............... 57
Figure 4.9 Raw scores compared to normative data (TSFI) ................................. 58
Figure 4.10 Distribution of scores for reactivity to vestibular stimulation............... 59
Figure 4.11 Distribution of scores for adaptive motor functions ............................ 60
Figure 4.12 Distribution of scores for reactivity to tactile deep pressure, visual-
tactile integration, and ocular-motor control subtests ........................ 61
Figure 4.13 Distribution of total test scores ........................................................... 62

xi
LIST OF TABLES
Table 3.1 Distribution of test participants .............................................................. 36
Table 4.1 General Demographics ......................................................................... 46
Table 4.2 Birth History .......................................................................................... 47
Table 4.3 Means Standard deviations, confidence intervals and effect size on raw
score analysis for ages of 7-12 months on the Infant/Toddler Sensory
Profile (ITSP) ......................................................................................... 49
Table 4.4 Means Standard deviations, confidence intervals and effect size on raw
score analysis for ages of 13-18 months on the Infant/Toddler Sensory
Profile (ITSP) ....................................................................................... 50
Table 4.5 Frequency data for Infant/Toddler Sensory Profile (ITSP) .................... 52
Table 4.6 Frequency data for the Test of Sensory Functions in Infants (TSFI) ..... 59
Table 4.7a Sensitivity and Specificity of Infant/Toddler Sensory Profile (ITSP) .... 63
Table 4.7b Sensitivity and Specificity of Test of Sensory Functions in Infants
(TSFI)................................................................................................... 64
Table 4.8 Correlation scores of Test of Sensory Functions in Infants (TSFI), and
Infant/Toddler Sensory Profile (ITSP) .................................................. 65
Table 4.9 Reliability scores for the Infant/Toddler Sensory Profile (ITSP) and Test
of Sensory Functions in Infants (TSFI) ................................................ 66

xii
DEFINITION OF TERMS
Bilateral integration and sequencing - An individual’s ability to use two sides of
the body in a coordinated manner, using correct timing and being able to
complete projected action sequences during motor activities (1).
Child - “Every human being below the age of eighteen years unless, under the
law, applicable to the child majority is attained earlier” (art.1) (2).
Diagnostic accuracy – “It relates to the ability of a test to discriminate between
the target condition and health. This discriminative potential can be
quantified by the measures of diagnostic accuracy such as sensitivity and
specificity, predictive values, likelihood ratios, the area under the ROC
curve, Youden’s index, and diagnostic odds ratio” (p. 1) (3)
Early childhood - The period between birth and eight years of age which is
considered a crucial period of development for later outcomes (General
comment No. 7) (2).
Early childhood development - “An umbrella term which applies to the
processes by which children from birth to at least 9 years grow and thrive,
physically, mentally, emotionally, spiritually, morally and socially” (p. 31, par
73) (4).
Early intervention - “A process of assessment and therapy provided to children,
especially those younger than age 6, to facilitate normal cognitive and
emotional development and to prevent developmental disability or delay.”
(5).
Gold standard – Any method, intervention, standardised clinical assessment,
measurement or procedure of known validity and reliability which is
generally regarded to be the best available. It is used to compare new tests
and/or results against (6).
Habituation – The simplest form of learning in the CNS and is the process
whereby the nerve cells recognize a stimulus as familiar and therefore
decrease the transmission of the stimulus as there is no perceived need to
continue to respond to the stimulus (7).

xiii
Infant – An infant is regarded as a child who is in the early stages of life. This is
generally from the first month after birth until the end of the first year (12
months), but sometimes this period can be extended to the age of 24
months (8) (9). For the purpose of this study, infant will indicate children
below the age of 18 months.
Postural-ocular control - The activation as well as coordination of muscles in
response to the position of the body relative to gravity in order to sustain
functional positions while moving and during transitions (1).
Praxis - The ability to conceptualise, plan and execute novel motor actions as well
as to organise the sequence of goal directed motor actions. Praxis affords
us to adapt and react quickly and in a meaningful manner to new
environmental demands (1).
Sensitization - The process whereby stimuli are recognized as important, or
potentially harmful, which result in the generation of a heightened response
(10).
Sensory discrimination - The ability to differentiate and interpret between the
spatial and temporal qualities of sensory information. This can also be
described as the “where is it”, “what is it” and “when did it occur” response
(1). Discrimination takes place in all sensory systems (tactile, vestibular,
proprioceptive, auditory, visual, taste and smell).
Sensory integration - “It is the neurological process that organises sensation
from the body and environment, and enables us to use our body effectively
within the environment” (p.11) (11).
Sensory integration function – Ability of an individual to register, process,
integrate, and respond to sensory input (12) as well as organise and
process the flow of sensory impulses in a manner that lead to precise
information about oneself and the world (13).
Sensory integrative dysfunction (SID) - Difficulty with central nervous system
(CNS) processing of sensation, especially tactile, proprioceptive, or
vestibular. This manifests as poor praxis and/or poor modulation (14). Thus,

xiv
it involves difficulties with processing or organising the sensory information
that helps us understand our bodies and the world around us (15).
Sensory modulation - An individual’s ability to respond adaptively to sensation
over a broad range of intensity and duration (16). The individual therefore
needs the ability to regulate the intensity, degree and nature of sensory
stimuli and have the capacity to process sensory information in order to
generate responses that are appropriately graded in relation to the
incoming sensations (11) (17) (18).
Sensory processing – “A process in humans that involves reception of a physical
stimulus, transduction of the stimulus into a neural impulse, and the
interpretation or conscious experience of that sensation. Sensory
processes are foundational to any individual’s learning, perception, and
action” (19).
Sensory processing disorder – A term used to describe difficulties, with any part
of sensory processing, that lead to impairment of daily roles and routines.
There are three categories of sensory processing disorder: sensory
modulation disorder, sensory based motor disorder and sensory
discrimination disorder (20).
xv
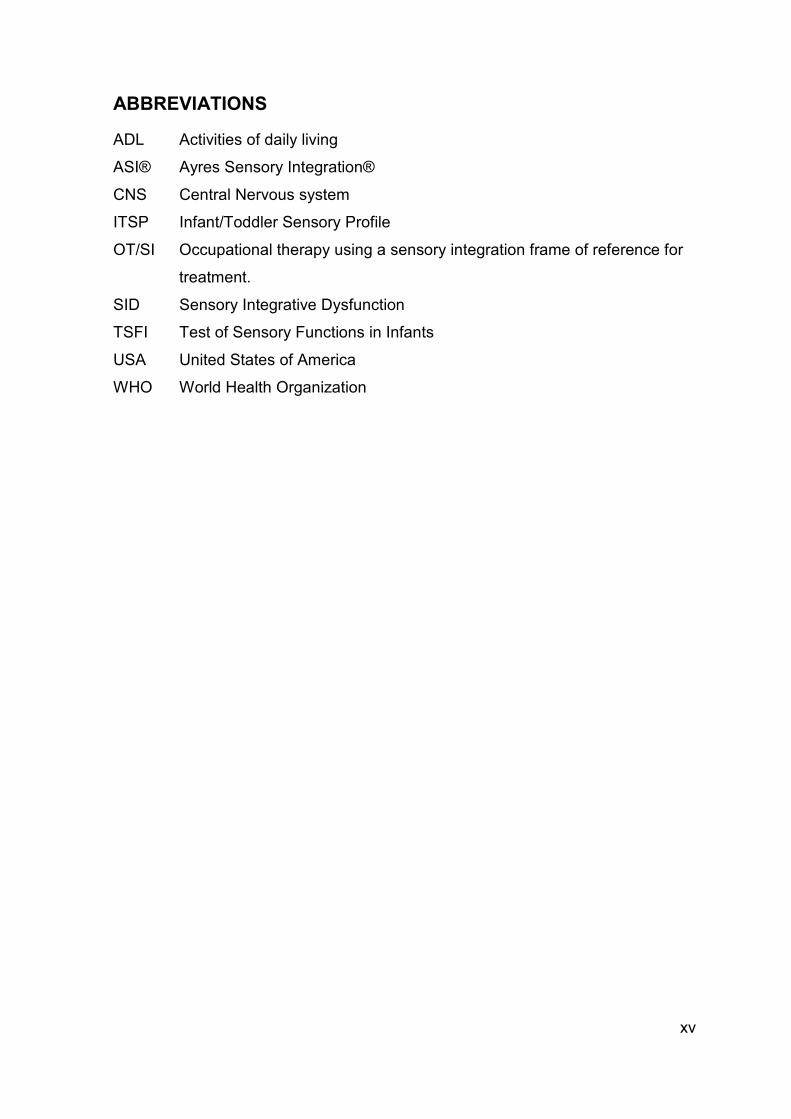
ABBREVIATIONS
ADL Activities of daily living
ASI® Ayres Sensory Integration®
CNS Central Nervous system
ITSP Infant/Toddler Sensory Profile
OT/SI Occupational therapy using a sensory integration frame of reference for
treatment.
SID Sensory Integrative Dysfunction
TSFI Test of Sensory Functions in Infants
USA United States of America
WHO World Health Organization
1
CHAPTER 1: INTRODUCTION
1.1 INTRODUCTION
When delivering services to clients, occupational therapists follow a specific
process. This process, according to the Practice Framework 3rd edition (21) is
called the ‘occupational therapy process’. This is the client-centred process of
assessing and treating in order to achieve targeted outcomes. All this is facilitated
by the specific perspective of occupational therapists while using clinical
reasoning, activity analysis and collaborating with the client (21).
In order to provide effective treatment to clients, occupational therapists need to
be able to accuratly assess and identify the client’s specific problems. When using
standardised tests it is important to know if the test can be used to provide
accurate results for the specific population with which it is used.
Therapists often use standardised tests that have norms for the population for
which the test was developed, but never question if the test achieves the same
results on different populations. Research on the standardisation of tests has
shown different populations often have different normative data, because the
environments and culture may influence response in different assessments. It
cannot be assumed that norms from the assessment manual can be transferred to
a different population (22). It is appropriate however to investigate the applicability
of the published norms to a new population to determine if they differ before
embarking on a substantial re-norming of any assessment (23). A study done by
Van Jaarsveld et al. on the Sensory Integration and Praxis Test (SIPT) on a South
African population (24) supported this concept. This study found that on five of the
17 subtests of the SIPT, the South African population achieved higher normative
scores than the US population, and therefore the SIPT was under diagnosing
children in South Africa (24).
Researchers have indicated that it is important for independent investigators to
continue to complete studies and gather psychometric data on existing
standardised tests. This applies to any standardised test and should be done in
addition to the studies completed by the test authors (25) (26) (27). This type of
research can assist in allowing the appropriate early identification of abnormal

2
development and has been documented as important by DeGangi et al. (28),
Wiener et al. (29) and Harris and Daniels (30).
Worldwide there has been an increased emphasis placed on early intervention
due to an increased awareness regarding the rights of children (31). Early
intervention programs are aimed at both prevention and treatment of
developmental disabilities in young children and are relevant in occupational
therapy (32). However, standardised tests used by occupational therapists to
assess very young children present additional challenges as infants cannot
provide information directly, and according to the authors of the Test of Sensory
Functions in Infants (TSFI), the wide range of coefficient scores reflects some
instability of infant behaviour (33).
The standardised tests used with infants therefore rely on the observation of
behaviour by therapists or self-report by parents. The results of these tests are
often reliant on comparison to norms established by the test developers. It is
important to establish if the norms against which the results of these tests are
being compared are relevant in different contexts and populations, as children
displaying mild or moderate dysfunction may be left undetected and therefore do
not receive early intervention as needed.
Sensory integrative functioning is one of the performance skills which occupational
therapists assess from an early age. Sensory processes are foundational to any
individual’s learning, perception, and action (19) and sensory integrative function
includes the registration, modulation and discrimination of sensory input as well as
the process of integrating all the information in order to create purposeful,
adaptive behaviours in response to the environment we live in (34). When a
problem occurs in any area of sensory integrative function, it is called Sensory
Integrative Dysfunction (SID) and in order to accurately treat SID, it is important to
establish what areas of sensory integrative function is problematic and how it
affects the individual’s daily functioning.
The presence of SID may be evident very early in life. In a study of eight-month
old infants, a high percentage of infants showed sleeping problems, eating
difficulties, temper tantrums, and other symptoms. When these difficulties are
present from birth, they appear to contribute to development of dysfunctional

3
parent–infant interaction patterns. These, in turn, can affect the infants’ personality
development (35). It is possible that some infants are born vulnerable and stay
vulnerable. In other instances, toddlers by the age of three years that are regarded
as being behind with their development in comparison to the expectations of the
developmental curve are more likely to develop some type of SID (36). According
to DeGangi et al., when SID is present at an early age, it is very difficult to
accurately establish the impact on later learning and emotional development (37).
When testing for SID, the Sensory Integration and Praxis test (SIPT) (38), is
considered the ‘gold standard’ for testing. This test, however, can only be used on
children four years of age through eight years eleven months. The SIPT is usually
also used together with clinical observations (39) and a test or questionnaire to
determine the child’s modulation abilities.
At present two standardised tests for infants, the Infant/Toddler Sensory Profile
(ITSP) (40) and the TSFI (9), both of which assess components of sensory
processing within sensory integrative function, are available and used in research
in South Africa (41) (42) (43). Sensory processing according to the new
nomenclature is divided into three categories namely sensory discrimination
disorder (SDD), sensory modulation disorder (SMD) and sensory-based motor
disorder (SBMD). Sensory discrimination disorder is when there is an inability to
interpret the qualities of sensory stimuli. Sensory modulation disorder on the other
hand is when there is a mismatch between a person’s emotional and attentional
response towards and environmental demand. Sensory modulation disorder is
divided into three subtypes namely sensory over –responsivity, sensory under-
responsivity and sensory seeking (20) (44). According to Eeles et al. (2013) the
TSFI was designed to be used in research and clinically to assess sensory
defensive behaviours including avoiding and sensitivity to input. This indicates
testing of sensory discrimination. On the other hand the ITSP assesses the
sensory processing ability and the effect on occupational performance based on
Dunn’s model of sensory processing, thus measuring sensory modulation (45).
Neither of these tests have psychometric properties that have been developed to
the extent where the tests can be considered as a ‘gold standard’ for testing in
infants and younger children. Due to the absence of a ‘gold standard’, careful
4
evaluation of multiple sources of information is needed as there is an absence of
one single test or screening measure that can be used to identify SID. This is
particularly important as the detection of SID early in life, is also difficult due to the
fact that SID is often co-morbid to other diagnoses like Autism Spectrum Disorder
(ASD), developmental delay, attention deficit hyperactivity disorder (ADHD),
developmental coordination disorder (DCD), Fragile-X syndrome, Asperger’s
syndrome, and learning disability (46) (47).
There appear to be no other published studies on the normative data for the ITSP
(40) and the TSFI (9) for populations other than that in the United States of
America (USA) where the tests were developed. Other international studies have
been published on the Sensory Profile (48) for older children however. A study
done in Australia, looked at internal consistency results for the Sensory Profile and
Sensory Processing Measure and compared their results to the data reported in
the test manual. It was found that differences between the norms reported in the
test manual and their study group did exist, indicating that norms differ when used
on different populations (49). A study in Israel however found similar norms for the
Israeli and USA samples (50). Only one study determining diagnostic accuracy of
the Sensory Profile has been published to determine how accurate SID can be
identified in older children in India (51). Therefore, it is important and necessary to
look at the available tests used at an early age, and evaluate their diagnostic
properties in the population in which the therapist is working in order for evidence
for practice in that population to be established (52).
1.2 PROBLEM STATEMENT
Standardised tests being used to test sensory integration function in infants rely
on observation using either parent report of behaviour, or observation by a trained
sensory integration therapist. These tests are instruments used to determine early
signs of SID in order to determine if further assessment and preventative or
remedial treatment is required.
Research shows that observation tests have limitations as usually the therapist
administered tests require a great deal of training and since the infant is often only
observed for a short period, components of behaviour may be missed. Parent
report questionnaires on the other hand can be limited by the parent’s perception

5
of their child, and the validity of parent report questionnaires is also affected by
reading ability and ability to interpret lengthy questions (53). It is also important to
know the standardised tests being used have been adequately researched for the
specific population they are being used on.
The Infant/Toddler Sensory Profile (40), a parent questionnaire, and the Test of
Sensory Functioning in Infants (9), a therapist observation test have both been
researched and studies have reported the reliability and validity of both tests.
There are still some concerns however regarding internal consistency in the birth
to six month version of the Infant/Toddler Sensory Profile (ITSP) developed by
Dunn in 2002 (40).
The Test of Sensory Functioning in Infants developed by De Gangi in 1988 (37),
has validity and reliability that is described as acceptable except for internal
consistency scores which have been reported (37). The face and content validity
for both tests have been well documented (37) (54) and both tests have
acceptable levels of inter-rater and test-retest reliability that have been shown to
be consistent in different countries and contexts (55) (56).
The ability of standardised tests to determine SID in infants has been found to
differ depending on the infants’ age, and no research regarding the norms or
diagnostic accuracy of the tests in South African has been completed.
Although both the ITSP (40) and TSFI (9) measure sensory integration function,
the tests have been associated with different aspects of sensory processing and it
is not known if any association between the constructs of sensory modulation
assessed by the ITSP and sensory discrimination assessed by the TSFI exists.
1.3 RESEARCH QUESTION
Can the normative data established in the USA on the standardised tests for
assessing sensory integrative function in infants, be applied to infants between the
ages of seven to 18 months, in a South African sample?
1.4 PURPOSE OF THE STUDY
The purpose of this study was to determine whether the sensory integration
function of full term infants, between the ages of seven to 18 months, in a South
6
African sample aligns with the normative data established in the USA on two
standardised tests - the Infant/Toddler Sensory Profile (ITSP) (40) and the Test of
Sensory Functions in Infants (TSFI) (9). Other psychometric data including the
construct validity, the diagnostic accuracy and internal consistency were
established for the same sample of infants to support the use of these tests in the
South African context.
1.4.1 Aim of the study
The aim of this study was to determine the normative data, for a South African
sample of full term infants between the ages of seven to 18 months, on the
Infant/Toddler Sensory Profile (ITSP) (40), and the Test of Sensory Functions in
Infants (TSFI) (9), as well as other psychometric data on the tests that support
their ability to identify SID in South African infants and guide the clinical use of the
tests with these infants.
1.4.2 Objectives
The objectives of the study were:
1. To compare the scores obtained from the Infant/Toddler Sensory Profile (ITSP)
(40), and the Test of Sensory Functions in Infants (TSFI) (9), for infants
between the ages of seven to 18 months, in a South African sample to the
normative data in the manuals for these tests from United States of America
(USA).
2. To determine the diagnostic accuracy of the Infant/Toddler Sensory Profile
(ITSP) (40), and the Test of Sensory Functions in Infants (TSFI) (9), on infants
between the age of seven and 18 months in a South African sample.
3. To establish the construct validity and internal consistency of the Infant/Toddler
Sensory Profile (ITSP) (40), and the Test of Sensory Functions in Infants
(TSFI) (9), for this group of infants between the ages of seven and 18 months.
1.5 JUSTIFICATION FOR THE STUDY
The results of this study will determine if the normative data of the tests used to
assess sensory integration function developed in the USA, can be used for infants
between the ages of seven to 18 months, in a South African sample. This may

7
assist in the accurate identification of SID earlier in a child’s life allowing for early
intervention of at risk infants and preventing the requirement for longer periods of
therapy later in the child’s life. Appropriate therapeutic interventions to reduce the
developmental effects of SID and the accompanying behavioural difficulties can
be implemented timeously if the dysfunction is recognised early. More positive
outcomes may be achieved by targeting infants at risk with early intervention when
the brain is more receptive to sensory integration therapy. Knowledge of a child’s
SID can also help the parent or caregiver with handling of the child (56).
1.6 OVERVIEW OF THE STUDY
This dissertation has six chapters as follows:
Chapter 1 – Introduction.
Chapter 2 – Literature review.
Chapter 3 – Research Methodology.
Chapter 4 – Results.
Chapter 5 – Discussion.
Chapter 6 – Conclusions and recommendations.
8
CHAPTER 2: LITERATURE REVIEW
2.1 INTRODUCTION
In this literature review, normal development and sensory development will be
discussed. Sensory integration will be explored with reference to the development
of Ayres sensory integration® theory and assumptions of the framework. The
model on which the ITSP is based as well as the development of the ITSP and the
TSFI will be considered. Early intervention, as well as assessment and the
importance thereof, will be reviewed. Particular attention will be given to methods
of assessment, the use of standardised tests in assessment, and the importance
of the critical review of tests used for assessment and validation of tests on local
populations.
2.2 NORMAL DEVELOPMENT
The understanding of normal development is important for occupational therapy
intervention with children, as although there is variety in the age at which
normative behaviour is reached, normal development forms the basis for both
assessment and intervention. Developmental theories typically describe patterns
and sequences of development that is found to be accepted as being
characteristic for children (57). As described by Kramer and Hinojosa (57), there
are many different views and theories on development, with iconic theories having
been described by Ayres (11), Freud (58), Skinner (59), and Lerner (60), to name
but a few.
It is important for an occupational therapist, to realise that a child does not develop
in a vacuum. There are therefore a vast number of factors that are now believed to
influence development, and these need to be considered when providing therapy
for infants and children. This includes neurological factors, physical aspects, early
sensory and cognitive experiences, interaction with the environment and
caregivers as well as the cultural climate. The internal environment (child’s body
and mind) and external environment (human and non-human objects) all influence
development. It is clear that although many different areas are assessed
independently, motor, psychological, and social development are interrelated and
dependent on each other (57).

9
Child development is currently therefore thought of as multidimensional with many
influences and not just a set of age-specific and stage-specific skills and
behaviours (57). Ayres in her theory of sensory integration described the effect of
sensory experiences and the influence they have on normal development. She
believed that the proximal senses, which are vestibular, tactile, and proprioception,
should be emphasised because they are primitive and primary, and they are the
foundation on which complex occupations scaffolds (11). Sensory input is critical
to normal brain function, and if the brain does not get the needed sensory
stimulation at certain developmental ages, it leads to brain abnormalities that can
lead to behavioural disorders (61) (62).
2.2.1 Normal development of sensory systems
Just as sensory experiences have an influence on normal development, the
normal development of the sensory system and aspects which can influence the
development of the sensory system need to be considered. If a problem occurs in
the development of the sensory system, it will influence the development of other
client factors and performance skills.
Sensory development begins during the prenatal period, with the tactile and
vestibular systems playing primary roles in the early development of sensory
integration. The neonate’s primary sensory systems are thought to be associated
with responses to both touch and movement (63).
Sensory development occurs as the Central Nervous System (CNS) organises
sensory information and adaptive responses occur. The adaptive responses occur
as a result of sensory integration which increases in complexity as the child
matures. Adaptive responses, in turn, help with the development of sensory
integration and the emergence of occupational engagement and social
participation (63) (64). Since sensory integration has a significant influence on
development, it is important to look at sensory integration in more detail.
2.3 SENSORY INTEGRATION
In 1972, Ayres defined sensory integration as: “the neurological process that
organizes sensation from one’s own body and from the environment and makes it
possible to use the body effectively within the environment” (p.11) (11).

10
In later years, other authors like Bundy, Lane and Murray (14) and Parham and
Mailloux (63), provided amended definitions for sensory integration. The
commonality in all the definitions is the description of sensory integration as a
process involving the use the sensory information, gathered through the senses,
by the body’s nervous system to allow adaptation of responses according to what
is happening in the environment in that moment.
The term sensory integration is often also used to refer to the frame of reference
applied in the occupational therapy process for individuals with a functional
disorder in the sensory integration process. The theory of sensory integration will
be described in further detail.
2.3.1 Sensory Integration Theory
In the late 1950s and early 1960s, the sensory integration theory was developed
by Ayres. Due to the importance of her work, it was trademarked in 2007 as Ayres
Sensory Integration® (ASI). This was also done in order to distinguish the
concepts of ASI® from publications not related to the core principles of the ASI®
framework (65), as there have been an increase in publications that have been
mistakenly linked to sensory integration as described in the work of Ayres,
although they do not truly reflect the principles of her work (66).
Sensory integration theory is a combination of concepts from neuroscience,
human development, psychology, and occupational therapy combined into one
framework in order to view behaviour and learning (1) (38) (67). Ayres regarded
the sensory integrative process as a brain behavioural process and, according to
her there are seven theoretical postulates that forms the basis for the sensory
integration framework (1).
The three major hypotheses in the sensory integration theory are:
i. Learning is dependent on a person’s ability to register and process
sensations both from the environment, as well as, movement and to use it
in order to plan and organise behaviour.
ii. People with a decreased ability to process sensation may also have
problems producing appropriate actions. This may lead to interference with
behaviour, as well as, learning.

11
iii. Increased sensation as part of a meaningful activity, leading to an adaptive
interaction, will improve the individual’s ability to process sensations. This
will in turn enhance learning and behaviour (14).
The main components of ASI® theory were reported by Bundy, Lane, and Murray
(14) and include a description of typical sensory integration development, the
defining of sensory integration dysfunction and guidance for intervention
programs. Only once these three concepts are understood and implemented, can
an occupational therapist apply this approach effectively and appropriately.
In order to fully understand ASI®, it is important to understand some of the
concepts and definitions. There is currently no consensus regarding the use of
terminology in the field of sensory integration especially terminology describing
dysfunction. This is causing confusion amongst therapists and the public. There
appear to be two different main views. The first view uses the term Sensory
Integrative Dysfunction (SID) (1) (11) (14) (65) (68), while the other view uses the
term Sensory Processing Disorder (20). It has been proposed to use only the term
sensory processing disorder, yet this has not been universally accepted (69).
Although sensory processing disorder/sensory integrative dysfunction has not yet
been accepted as a medical diagnosis, SID is accepted and used in the
occupational therapy community in order to ensure best practise when treating
infants and children. Currently, the sensory processing disorder foundation (70) is
leading the research regarding sensory processing disorder and efforts are being
made to include it in the Diagnostic and Statistical Manual of Mental
Disorders (DSM) (70).
In South-Africa, the training of therapists in sensory integration is done by the
South African Institute for Sensory Integration (SAISI). Their vision clearly states:
“To provide training and education in Ayres Sensory Integration® of an
internationally accepted standard in order to provide a service of excellence to the
ultimate benefit of the client” (71).
In order to stay true to training and views on sensory integration used in South-
Africa, for the purposes of this study, terminology associated with ASI® will be
used. Therefore, the term Sensory Integrative Dysfunction (SID) will be used
instead of Sensory Processing Disorder.
12
The key abilities that are consistent with function and dysfunction in sensory
integration are sensory discrimination, sensory modulation, postural-ocular control,
praxis, and bilateral integration and sequencing. Another concept that is important
to understand is sensory processing.
Smith-Roley et al. described sensory processing as a term to describe the way
sensation is detected, transduced and transmitted through the nervous system
(65). According to Miller and Lane (2000), sensory processing is a term that
describes the complete process whereby the CNS and peripheral nervous system
manage sensory information and includes the reception, modulation, integration,
and organisation of stimuli. It also includes the behavioural response to the
sensory input. They concluded that the term sensory integration and sensory
processing are not interchangeable as sensory integration is only one part of the
complete sensory processing process (72).
Ayres Sensory Integration® theory is not just about concepts and definitions, but it
also describes dysfunction together with ways to assess and treat the dysfunction.
This will therefore now be described in more detail.
2.3.2 Sensory Integrative Dysfunction
Dysfunction can occur in all or just some of the sensory systems, namely the
gustatory, olfactory, auditory, visual, tactile, proprioceptive, and vestibular systems
resulting in Sensory Integrative Dysfunction (SID) (14). Ayres Sensory
Integration® does not only include the theory to help understand sensory
development, but it also includes a body of research that validates the presence
and existence of different patterns of SID.
Due to the findings of continued research as well as the experience gained by
clinicians, sensory integration theory has evolved and has been refined over the
years. This has also led to different ways of categorising SID. Ayres described
diagnostic patterns based on testing with first the Southern California Sensory
Integration Test (SCSIT) and later on the Sensory Integration and Praxis test
(SIPT) (38) while Mulligan did research on the diagnostic patterns for SID using
the Sensory Integration and Praxis test (73) (74) (75).

13
Consensus has still not been reached regarding the categorisation of SID,
however there are themes and overlapping of taxonomies that occur in all the
proposed views on dysfunction. Bundy and Murray indicate SID occurs in two
major areas namely poor modulation and poor praxis (76). Miller et al, on the other
hand proposed the taxonomy of sensory processing disorder that included three
major areas namely sensory modulation disorder, sensory based motor disorder
and sensory discrimination disorder (20).
In their article, Mailloux et al. (68), aimed to clarify the patterns of SID in order to
assist therapists in the interpretation of assessment information and planning of
intervention. The different patterns of SID identified by Mailloux et al. were:
Visuodyspraxia and Somatodyspraxia; Vestibular and Proprioceptive Bilateral
Integration and Sequencing; Tactile and Visual Discrimination; as well as Tactile
Defensiveness and Attention Problems. The identification of these patterns
showed a significant relationship to earlier studies by Ayres (38). This reinforced
the long held idea that there is a specific association among the sensory system,
motor system, and praxis. These associations support the concept that sensory
systems function in a synergy rather than in isolation. It was also concluded that
ASI® is one of the most developed frames of references to emanate from the
profession of occupational therapy. Ayres Sensory Integration® offers
occupational therapist a unique understanding of the different ways in which
functions, such as praxis, vestibular processing, and tactile perception contribute
to and influence participation in daily life and success (68).
In the model for clinical reasoning on possible sensory integration difficulties and
dysfunction, van Jaarsveld (77) described how difficulties and dysfunction can
occur in sensory modulation and sensory discrimination. Modulation is needed for
an individual to sustain engagement in activities regardless variabilities that occur
in the body and/or environment. It also contributes to stability in emotions and
behaviour as well as supports optimal levels of arousal needed to engage in
activities. Difficulties and dysfunction of sensory modulation can be present in one
or more of the sensory systems and is reflected in behaviour. In South Africa the
Sensory Profile (48), Infant/Toddler Sensory Profile (40) as well as the Sensory
Processing Measure (78) is used as standardised tests to identify sensory
modulation difficulties and dysfunction (77).

14
Sensory discrimination is about the quality of the sensory experience. It is about
the process of interpreting the qualities of the sensory information in order to add
meaning to it. This is done by using past experiences and memories and forming
associations about the temporal and spatial qualities of experiences (77). In South
Africa the Sensory Integration and Praxis test (38) as well as the Test of Sensory
Functions in Infants (TSFI) (9) is used as standardised tests to identify sensory
discrimination difficulties and dysfunction.
Because SID has been linked with developmental dysfunction occupational
therapists are particularly concerned with SID in infants and children, where the
condition interferes with daily functioning at home, in school, and in interactions
with peers or adults. Sensory integrative dysfunction also affects routine functions,
such as self-care, sleeping, and eating (69). The functional problems associated
with SID have been described in detail in the literature by Parham and Mailloux,
who outlined seven general categories of expected outcomes for occupational
therapy. These outcomes are related to the child’s performance skills and
occupational engagement and include social participation, adaptive responses,
self-confidence and self-esteem, family life, motor skills as well as cognitive,
language, and academic performance (63).
DeGangi & Greenspan, described that young children with SID often exhibit
delays in the development of skills like balance, coordination, and fine and gross
motor skills. Problems with language and visual-spatial skills as well as
problematic development of behaviour were also noted, with children displaying
distractibility and tactile defensiveness (37). Parham and Mailloux also noted that
children with SID are referred for occupational therapy due to concerns regarding
behaviour, social functioning, academic functioning, or motor coordination.
Sensory integrative Dysfunction leads to problems in all areas of occupational
performance as children with this condition tend to avoid sensory or motor
challenges. They then often respond with tantrums or refusal to participate when
pushed to perform (63).
Research on the prevalence of SID is limited and according to findings of available
research Baranek et al. estimated that 40%-80% of children (79) and 3%-11% of
adults (80) who also have developmental disabilities, show significant signs of
SID. Although the condition is seen in infants and children with and without other

15
diagnoses, it is estimated that 10%-12% of individuals in the general population,
have SID, despite having no identified diagnostic condition (81). In 2004, Ahn et
al. (82) did a study on the prevalence of SID in a typically developing kindergarten
age population. The outcome of the study indicated that 5.3% of the study
population met the criteria for SID.
The literature as described above shows that SID can lead to functional problems
in infants, and children are unable to develop client factors, performance skills,
and occupational performance areas needed for normal functioning. Looking at
the prevalence, SID is seen in infants and children with and without other
diagnoses.
2.3.3 Sensory Modulation
The ability to modulate sensory input is vital for our ability to participate in daily
occupation. Modulation allows us to filter sensations in order to attend to the
relevant input, maintain attention to relevant tasks and also allow us to maintain
an optimal arousal level. Inadequate modulation leads to attention diverting to
ongoing changes in the sensory environment. Attending to all sensory input
changes the arousal level and causes it to not be optimal any more (16).
Early thoughts on sensory modulation dysfunction were that a continuum
represented by over- and under responsiveness existed (83) (84). This is
illustrated in Figure 2.1 (below). This simplification, although useful, is not
adequate to reflect the sensory processing seen in infants and children and was
therefore no longer supported by later research.
Failure in orientation Normal orientation Over orientation
SENSORY
DORMANCY
SENSORY DEFENSIVENESS
Hypo responsivity Hyper responsivity

16
Figure 2.1 Continuum of sensory registration and responsivity.
From: Royeen, C.B., & Lane, S.J. (1991). Tactile processing and sensory defensiveness. In Fisher, A.B., Murray, E.A., & Bundy A.C., Sensory integration: Theory and practice. Philidelphis: F.A. Davis.
In 1991, Royeen and Lane proposed that the over responsiveness might be
circular and not linear. Therefore they hypothesised that sensory defensiveness
and sensory dormancy are related under sensory modulation disorder. The
circular concept allows for a child to shift from over responsiveness to under
responsiveness without reaching a state of normal orientation (arousal) between
them. They also suggested that a child might display an over responsive reaction
to the point of shutting down all sensory input. Once in shut down, the child will
display behaviour associated with under responsiveness (85).
In 1997, Dunn proposed a model for sensory modulation disorder that links the
neurological threshold to the behavioural response (48) (86). This model will be
discussed later in detail as it is the model on which the Infant/Toddler Sensory
Profile (ITSP) is based. Wilbarger together with Dunn, made the suggestion,
based on their clinical experiences, that sensory modulation, instead of being on a
continuum, is multidimensional. They indicated that shifts in the child’s
responsiveness are due to their inability to find the middle ground of optimal
arousal. Therefore, they are unable to interact adaptively to the environment, and
this affects their attention, arousal, cognitive processing, and emotional stability
(86) (87).
In 2001, Miller, Reisman, McIntosh and Simon proposed yet another model for
sensory modulation. It is called the Ecological Model of Sensory Modulation where
they differentiate between physiological and behavioural elements of sensory
modulation dysfunction. The model includes external and internal dimensions.
The external dimensions include task, environment, culture, and relationships.
These are all regarded as contextual. The internal dimensions however are
emotion, attention, and sensation. These are regarded as personal. The
contextual external dimensions influence the personal internal dimensions. When
a perfect fit is seen between the task demands, relationships, culture, and
environment, as well as, the individual’s ability to process emotion, sensation, and

17
attention, an adaptive performance occurs. However, when the external
dimensions impede performance, problems occur (88).
Although there are different models to describe sensory modulation dysfunction,
they provide a platform for further research on sensory modulation and sensory
modulation dysfunction. Experts in the field of sensory modulation do, however,
agree that there are certain behaviours that characterise different kinds of
difficulties in sensory modulation (63). These are:
i. Sensory registration problems;
ii. Sensation-seeking behaviours;
iii. Over responsiveness / hyper responsiveness / sensory defensiveness;
a. Tactile defensiveness (over responsiveness to touch);
b. Gravitational insecurity (over responsiveness to vestibular
sensation);
c. Over responsiveness in other sensory modalities (auditory,
olfactory, taste).
2.3.4 Dunn’s Model of Sensory Processing
Winnie Dunn proposed in her conceptual model that both neuroscience and
behavioural science can provide information regarding an infant or child’s
response to sensory events. She proposed that there is an interaction between
the neurological threshold and the behavioural response (86). Figure 2.2 shows
the conceptual model and the components thereof.

18
Figure 2.2 Relationships between Behavioural Response and Neurological Thresholds
Based on: Dunn W. The Impact of Sensory Processing Abilities on the Daily Lives of Young Children and Their Families: A Conceptual Model. Infants and Young Children.1997; 9(4): p. 23-35.
In Dunn’s model, (Figure 2.2), the neurological threshold refers to the amount of
stimuli needed for the central nervous system (CNS) to notice or react to stimuli,
while the behavioural response indicates the manner in which the infant/child
responds in relation to the thresholds.
At one end of the continuum, thresholds are high and require a lot of stimuli to
react. On the other end of the continuum the thresholds are low and therefore
require very little stimuli to react (48) (86). According to Dunn, neuroscience
provides the background for understanding how sensory receptors receive and
transmit stimuli, how the central nervous system interprets the information, how
the information is used to create motor output, and the importance of modulation
of sensory input (48) (86).
In order to be able to modulate effectively, the neurophysiological processes of
habituation and sensitization are essential. Habituation is needed in order for a
person to focus their attention on a task at hand. It helps young children to focus
only on important information. Difficulties in habituation may lead to a person

19
appearing distractible, agitated or inattentive (48). Sensitization, on the other
hand, is important as it enables the child to stay aware of their surroundings.
Children use life experiences to develop sensitization as they grow up in order to
stay attentive to their surroundings while engaged in learning tasks and play. In
order to produce functional behaviours, a continuous interchange between
habituation and sensitization is required. The patterns for these interchanges are
called thresholds and are established through the experiences of the child (48).
An appropriate adaptive response will be generated when modulation is intact as
the nervous system will respond to some stimuli while ignoring other stimuli (48).
Maladaptive behaviours are the product of poor modulation between habituation
and sensitization. Typically seen maladaptive behaviours can be such as being
overly excitable or hyperactive (i.e. too much sensitization – low thresholds), or
overly lethargic and inattentive (i.e. too much habituation – high thresholds).
When children respond in accordance with their thresholds, a child with high
thresholds would respond to very few stimuli, while a child with low thresholds
would respond to many stimuli. However, children can also respond in order to
counteract their thresholds. In this case a child will either try to exert excessive
energy, seeking stimuli to try and meet high thresholds, or exert energy to avoid
triggering low thresholds (86).
The behavioural science model provides us with the means to understand that
young children are human beings with interests, motivations, skills, and
behavioural patterns to support their performance needs. They are not just simply
a collection of neurons and cells (89). In order to produce goal-directed behaviour,
several conditions are needed. Stellar and Stellar described these as the internal
environment that supports behaviour (CNS processing and modulating sensory
input); the external environment that provides opportunities (sensory experiences);
and the stimulus that trigger behaviour and learning opportunities (90).
Dysfunctions in any of the mentioned areas, will lead to difficulties in performance
in daily life. If the CNS is unable to process sensory information, it may affect the
child’s ability to learn about the environment, and they then may appear
unresponsive or clumsy. Results from sensory modulation research, for example
McIntosh, et al. (81), Reynolds & Lane (91), and DeSantis et al. (92), suggest that
20
sensory modulation difficulties may have an influence on the development of
behavioural problems. Suggestions that sensory modulation can affect social
interaction have also been made. According to Parham (63), social interaction
may be avoided by children who are sensation avoiding, but on the other side,
children who are sensation seeking may initiate interactions in an inappropriate
manner.
Sensory integration and sensory modulation are important aspects of normal
development, and if problems with any aspect of this occur, it can lead to
functional problems. In order to prevent problems later in life, early identification
through accurate testing is needed as well as early intervention to correct
problems and prevent further developmental delays.
2.4 ASSESSMENT
2.4.1 Concepts of assessment
Assessment (evaluation) is the first step in the occupational therapy process (p.
S10) (21). This process as described by the Occupational Therapy Practice
Framework, 3rd edition (21) consists of three steps: 1) Assessment, looking at the
occupational profile and analysis of occupational performance. 2) Intervention,
consisting of creating the intervention plan and implementation of the planned
intervention. 3) Targeting of outcomes. Step1 (assessment) of this framework, will
be discussed in further detail (21).
The first step in the assessment process is the occupational profile. This supplies
the therapist with an understanding of the client’s interests, experiences, values,
needs, occupational history, and patterns of daily living. Information regarding the
client’s reasons for seeking services, concerns, support system, strengths, as well
as priorities are also identified (p. S 10) (21). The client’s strengths and problems
are more specifically identified during the analysis of occupational performance,
which is the next step in the assessment process. During the assessment process
the therapist will consider client factors, environment, performance patterns,
performance skills, and activity demands, but will only specifically assess selected
aspects. In order to identify supports for, and barriers to performance, the client’s

21
actual performance is often observed in context. Throughout the process targeted
outcomes are identified (p. S10) (21).
The type and focus of assessment will depend on the practice setting and will
therefore differ from setting to setting. Assessment occurs in the initial and every
subsequent contact with the client (21). The assessment is one of the most
fundamental, but complex steps of the therapy process as the results from the
assessment will form the basis for planning the type and intensity of the
occupational therapy intervention required (93). As assessment is so fundamental,
it is very important that the tests we use are accurate and validated on the
population it is used on.
2.4.2 Use of standardised tests for assessment.
Standardised tests have a valid role in the assessment process. Therapists are
trained in the use of standardised tests due to the belief that they are more
objective and formal than other kinds of assessments which are thought of as
“informal” and therefore implying “less objective”. It is however important to
remember that there are both advantages and disadvantages to the use of
standardised tests (94).
Some of the advantages are that standardised tests have been used for a long
time and a variety of tests are readily available. Standardised tests are being
promoted as being “objective” because the examiner’s biases do not influence the
results. Once the therapist has been trained in the use of the standardised test, it
is easy to administer and convenient. Also it is easier to analyse the results from
standardised tests than to analyse the results from alternative testing procedures.
Tests also allow for comparison of results across various administrations and
examiners (94).
Some of the disadvantages of using standardised tests are that the test situation
is highly structured and formal and does not always allow for observation of more
natural behaviours. Behaviours sampled by the standardised tests may not
represent the infant’s functional behaviours. Tests often provide limited opportunity
for the infant to initiate interaction, and the role of other family members in the
assessment process may be limited by the use of standardised tests (94).
22
The norms provided by the test often do not accurately reflect the normal
population, and tests are often only designed to determine whether an infant has a
problem or not. It may not identify an infant’s weaknesses and strengths. Although
the test is designed to be objective, it is still sometimes possible that some
subjective scoring occurs and this can skew the scores a client receives. Stimulus
items or procedures used may also not be appropriate for all cultures or
socioeconomic backgrounds (94).
When using standardised tests in the assessment process it is important to
carefully select the tests being used. The therapist needs to consider the
diagnostic accuracy of the test and also, if the test would be valid for the
population it is being used on. There are also ethical considerations like that fact
that the therapist should be trained in the use of the test, both the administration
and interpretation of the results. The therapist needs to decide the role of
standardised tests in the assessment process and remember that it is only one
tool that can be used in the assessment process, but should ideally refrain from
using standardised tests as the only source of information during assessment (94).
2.4.3 Assessment of Sensory Integrative Dysfunction (SID).
As occupational therapists, the main focus when assessing and treating clients is
on functioning and participation in activities of daily living (ADL). Even infants and
children must be able to perform, function, and participate in ADL activities. It is
important to look at the child in totality, and sensory integrative functioning and
sensory modulation therefore form a part of what needs to be assessed and
treated when working with this population. Sensory integration has an influence on
a child’s ability to function and partake in ADL activities (37) (63).
As the theory of ASI® is still in a state of evolution, there are very few tests
available to assess infants for SID. There are tests available that can be
interpreted from an ASI® frame of reference, but they might not be specifically
designed to assess SID. In order to accurately measure a construct, an
appropriate test is needed that is ideally standardised and supported by strong
psychometric properties. Provost and Oetter stated that adequate identification of
sensorimotor problems in the naught to three years age bracket requires
comprehensive assessment of both the motor systems and abilities as well as the

23
sensory functions, or the infant’s ability to register, process, integrate, and respond
to sensory input (12).
Eeles et.al, set out to determine which tests were most accurate to measure SID
in the first two years of life. A systematic review of available tests was done, and it
was found that only three tests can be used to evaluate SID at this early stage of
life. They were the Sensory Rating Scale (12), the Infant/Toddler Sensory Profile
(ITSP) (40), and the Test of Sensory Function in Infants (TSFI) (9).
They found it difficult to determine which of the above tests were best to evaluate
SID due to challenges of defining constructs in sensory integration as well as the
fact that the tests measured slightly different components of SID. The Sensory
Rating Scale and ITSP are both parent-report questionnaires, whereas the TSFI is
a performance-based assessment.
Eeles et al. recommended that, if the clinician needed to use a questionnaire, the
ITSP would be the better choice due to the fact that it has undergone more
rigorous evaluation. Further recommendations are that, if time allows, ideally one
would administer both the ITSP questionnaire and the TSFI to reliably determine
problem areas of sensory integration during infancy, and match parent report with
a performance-based standardised test. The information from these tests also
need to be analysed alongside other measures of performance, such as parent
interviews, observation of behaviour, neurodevelopmental testing, and other
relevant background information (95).
2.4.3.1 Infant/Toddler Sensory Profile (ITSP)
The ITSP is a caregiver questionnaire for infants and toddlers, developed from the
Sensory Profile (48) and is based on Dunn’s conceptual model for understanding
sensory processing in daily life (86), as discussed earlier. The Sensory Profile is a
judgement-based caregiver questionnaire specifically looking at modulation.
During studies of the Sensory Profile, it was found that age does not have a
significant influence on the scores. 1,037 children between the ages of three and
ten years were tested during the development of the Sensory Profile. Most scores
remained constant across all ages tested (48).
However, during the development of the ITSP, it was found that age had an
important effect. This was due to the fact that, parents of infants younger than six

24
months found it difficult to report on many of the behaviours as described in the
pilot version of the ITSP. This can be attributed to the fact that, in general,
younger infants have a smaller repertoire of behaviours. It was then decided that a
smaller set of behaviours will be used in the age group under six months than in
the age group of seven to 36 months. 36 items and 48 items were decided on
respectively for the two age groups. This was done in order not to miss the
opportunity to interpret and identify the more complex behaviours of the older
infants and toddlers (54).
The initial studies to develop the ITSP were done in 2002, and during this, Dunn &
Daniels highlighted the importance of having some method to identify potentially
challenging behaviours in very young infants (below six months of age) in order for
early intervention programs to address the problems before they interfere with the
infant’s developmental experiences (54). A total of 401 infants between the ages
of birth and 36 months, were used to collect data for the development. They all
completed the pilot version consisting of 48 items. The developers tested the
reliability of the ITSP and found that for the sensory sections the standardised item
alpha coefficients ranges between 0.37 and 0.77. For the component groupings
the standardised item alpha coefficients ranged between 0.60 and 0.82. They also
looked at the alpha coefficients for the quadrants form Dunn’s model and this
ranged from 0.60 to 0.84. After this study, it was decided to do two different
sections for the birth to six month age group and the seven to 36 month age group
(54).
The ITSP consists of items divided into sensory systems. For children age seven
to 36 months, there are five sensory processing section scores, four quadrant
scores and a combined quadrant score. The quadrant scores reflect an
infant/toddler’s responsiveness to sensory experiences. This is based on Dunn’s
Model of Sensory Processing, as described earlier. Quadrant 1: low registration
and quadrant 2: sensation seeking both indicate different high threshold
responses. Quadrant 3: sensory sensitivity and quadrant 4: sensory avoiding both
indicates different low threshold responses. A score is also provided for a
combined quadrant of low threshold which is a combination of quadrant 3 and
quadrant 4. The sensory processing scores indicate the infant/toddler’s response
to the basic sensory systems. The ITSP is described as a tool to link performance
25
strengths and barriers with the infant/toddler’s sensory processing patterns. The
test’s purpose is to evaluate the possible involvement of sensory processing with
the infant/toddler’s daily performance patterns. It also provides information
regarding the infant/toddler’s tendencies to respond to stimuli, and indicate which
sensory systems might be contributing to creating barriers to functional
performance (40).
The ITSP is widely used for research in infants/toddlers. Studies recently were
done by Mulligan & White (96), Ben-Sasson et al. (97), Eeles et al. (45), Germani
et al. (98), and Samago-Sprouse et al. (99), to name but a few. These studies
however, did not focus on the psychometric properties of the tests. In these
studies the tests were used to collect data. There is, however, no known study
done in South Africa looking at the normative data of the ITSP and the use of the
test on the South African population.
2.4.3.2 Test of sensory functions in infants (TSFI)
According to the authors of the TSFI, the test is designed for infants as young as
four months of age, but it is most reliable and valid with infants from seven months
to 18 months. It is also better to use the TSFI in conjunction with other
developmental assessments, parent interview and clinical observations (100).
The TSFI was developed as a diagnostic tool. On page 1 of the test manual, the
TSFI is described as a test that “provides an overall measure of sensory
processing and reactivity in infants” (p.1 ) (9). It also tests five subdomains namely
reactivity to tactile deep pressure, adaptive motor functions, visual-tactile
integration, ocular-motor control, and reactivity to vestibular stimulation. These
subdomains were specifically chosen as they are clinically significant in identifying
children with sensory integrative dysfunction and particularly children at risk of
developing learning disabilities. The TSFI was developed as both a research tool
and a clinical tool to use in the assessment of infants with regulatory disorders,
developmental delays as well as infants at risk of developing learning and sensory
processing disorders e.g. premature infants (9).
Although the authors conducted preliminary psychometric research on the test,
they recommended that further research is needed, especially on the reliability
and validity, the test-retest reliability, wider cross section of ages, and a more

26
extensive sample of infants with developmental delays. The scores obtained for
test-retest reliability for the total test scores was 0.81. The correlation coefficient
for the different domains depended on the domain and varied from 0.26 to 0.96
(9). In 1997, Jirikowic, et al. (101) did a test-retest reliability study on infants with
developmental delays. Results of this study showed that the test-retest reliability of
the total test score is borderline (ICC =0.78), and the reliability for the subtest
scores were low with the reliability coefficients ranging from 0.54 to 0.74. Their
recommendations were that the TSFI results should be interpreted with caution
and should be supported by clinical reports. This finding was consistent with
DeGangi & Greenspan’s (9) recommendations. Recent studies using the TSFI
were done by Jaegermann & Klein (102), Lin et. al. (103), and Chorna et al. (104).
These studies however, did not focus on the psychometric properties of the tests.
In these studies the tests were used to collect data. There is, again, no known
study done in South Africa looking at the normative data of the TSFI and the use
of the test on the South African population.
2.4.4 Use of Parent Questionnaire and Therapist Observation tests.
There are differences between the use of a parent questionnaire and a therapist
administered test for assessment. It is important for a therapist to be aware of the
advantages and disadvantages of both types of tests. This will help guide them as
to what test or combination of tests to use in order to be able to accurately assess
infants.
2.4.4.1 Parent Questionnaire
Research has shown that using parent report questionnaires can have various
advantages and disadvantages. Some of these advantages are that it has
consistently been shown that the use of parent reports on the child’s current skills
or deficits can be seen as a source of information that is sensitive, reliable, and
valid (105), (106), (107). Involving the parent and using their perceptions is used
as part of a client centred approach that is advocated by occupational therapists
(21) (105). It is time efficient and can possibly be more accurate than the use of
some standardised tests (108), and it can also provide qualitative, accurate
assessment of children in a naturalistic environment (105).

27
The validity of parent report questionnaires were found to be dependent on the
quality of the items included. Parent report questionnaires were found to be more
accurate if the wording was precise and if the report questionnaire was
standardised, as opposed to a non-standardised questionnaire (105). Glasco and
Dworkin have also found that information gathered through parent report
questionnaires can be influenced by socioeconomic factors, as parents from lower
socio-economic areas were found to leave out more questions. This may be due
to language problems caused by a lower level of education (105). This needs to
be taken into consideration when using parent report questionnaires and the
additional use of interviews should also be considered.
It is also found that parents tend to report the infant’s skills as better than those
found on clinician assessment. This may be due to the fact that infants display
skills in a familiar and safe home environment first, before generalisation to other
environments can occur. A study by Johnson, et al. found that the accuracy of
parent reporting was not affected by socio-demographic factors. Information
gathered from the parents was very valuable as they had more contact with the
infant and therefore knew the infant best (109).
2.4.4.2 Therapist administered test
Just as with parent report questionnaires, using therapist administered tests have
advantages and disadvantages. A disadvantage is that the test is not administered
in the infant’s natural environment. This can lead to inaccurate results due to the
fact that infants often display skills in a familiar and safe environment first before
generalisation to other environments occur (105). Sometimes, during therapist
administered testing, the infant may respond differently to applied stimuli than
when naturally being exposed to the same stimuli.
An advantage of this method of testing is that the test is administered by a trained
professional who has received training in administering and interpreting the results
of the test. This allows for greater reliability (105).
There are, therefore, clear advantages and disadvantages for using different types
of tests. As assessment is a fundamental part of the therapy process (21), it is
important for therapist to know more about the tests they use. This will allow them

28
to decide on the best combination of tests to use for a specific client in order to
accurately assess.
2.4.5 Critical review of tests
Many researchers have established that it is important for independent
investigators to complete studies and gather psychometric data regarding the
tests. This applies to any standardised test and should be done in addition to the
studies completed by the test authors (25) (26) (27).
When testing for SID, the Sensory Integration and Praxis test (SIPT) (38), is
considered the ‘gold standard’ for testing. This test, however, can only be used on
children four years of age through eight years eleven months. There is, therefore,
no one test that can be seen as the ‘gold standard’ for testing SID in infants and
younger children. Due to the absence of a ‘gold standard’, it is important to
carefully evaluate multiple sources of information as there is an absence of one
single test or screening measure that can be used to identify SID. It is, therefore,
important and necessary to look at the available tests and evaluate their
diagnostic accuracy and collect evidence to determine if the test actually
measures what the authors of the test indicated (52).
Whenever a test is used to determine the presence of a problem or the need for
therapy, it is important to look at the complex psychometric properties of that
particular test.
Accuracy indicates the closeness of estimated values to the true values (110). For
a test to be accurate, it needs to have sensitivity and specificity within acceptable
limits. The sensitivity is the ability of the test to identify the presence of a problem
when it is present, while specificity refers to the ability of the test to give negative
results when the problem is not present (111).
Many tests used in occupational therapy, however, do not result in a simple
decision if a problem is present or not. The tests often produce continuous data
that indicate where the client falls on a continuum, and that information is used to
decide if treatment is needed or not. In these tests, it is necessary to have a cut-off
point, and if the scores are beyond this point, it will be deemed a problem
requiring intervention. The sensitivity and specificity of the cut-off score will then

29
be considered important. The problem with this, however, is that if the sensitivity is
set high, the specificity will be lower and vice versa (111).
For the TSFI the reliability for the subtest scores were low with the reliability
coefficients ranging from 0.54 to 0.74 (9). For the ITSP during initial development,
it was found that for the sensory sections the standardised item alpha coefficients
ranges between 0.37 and 0.77. For the component groupings the standardised
item, alpha coefficients ranged between 0.60 and 0.82. They also looked at the
alpha coefficients for the quadrants from Dunn’s model, and this ranged from 0.60
to 0.84 (54). The alpha coefficients for the final test in the seven to 36 month age
group for the sensory processing sections range between 0.42 and 0.71. For the
quadrant scores, it ranges between 0.69 to 0.86 (40).
Construct validity refers to the capacity of a test to test the intended construct.
Construct validity is crucial when the interpretation of the scores from the test,
implies an explanation of a behaviour or trait. One method of demonstrating
construct validity is the convergent and divergent methods. Assessment of
convergent validity involves theoretically derived comparisons (111). Convergent
validity refers to the degree, two different measures designed to measure the
same underlying trait, consistently measure the same trait (111) (112). Therefore,
if there is a high correlation between the scores obtained by the two measures, it
indicates convergent validity. Divergence, also known as discriminant validity,
refers to the principle that tests that are designed to measure different traits should
be unrelated (111).
When critically reviewing a test, the internal consistency of the test should also be
considered. Internal consistency indicates whether the items that make up the test
correlate with each other. There is a close relationship between internal
consistency and validity. If internal consistency is found to be unacceptable, it is
however due to problems with reliability. Due to this, internal consistency is seen
as evidence for reliability and validity (111).
2.5 EARLY INTERVENTION
Internationally there is not yet consensus regarding what specifically early
intervention programs should entail. Programs differ from country to country due to
differences in culture, political systems in countries, available resources, and

30
societal commitment (113). The World Health Organization (WHO) and the United
Nations are involved in creating guidelines and codes regarding rights of children
and adults. In 1948, the WHO defined health as: “A state of complete physical,
mental and social well-being and not merely the absence of disease or infirmity”
(114). The definition has not been changed since, and it implies that every person
should have the opportunity and ability to function optimally within their specific
environment. Consensus exists internationally that it is within the rights of every
child to receive help in order to achieve optimal functioning. These rights of
children were codified at the “United Nations Convention on the Rights of the
Child”, held on 30 September 1990. It describes that it is the right of every child to
survive, develop, be protected from exploitation, as well as have access to health
services in order to by healthy (31).
This indicates that although early intervention programs differ from country to
country, the importance of these programs is recognised internationally.
Therefore, not only should we look at the international view on early intervention,
but it is important to look at early intervention in the South African context.
2.5.1 South African policy on early intervention
It is said that, when a nation invests in its youngest citizen, it shows foresight and
wisdom, and the nation can therefore be assured of a promising future (115). In
South Africa, the term Early Childhood Development is used to describe the
policies and programs involved with early intervention. In the interim policy for
early childhood development (116), it states that the term early childhood
development is aimed at conveying the importance of a holistic approach to child
development, and it highlights the importance of considering a child’s health,
nutrition, education, psycho-social and additional environmental factors within the
context of the family and the community (116).
Early childhood development is important in South Africa and therefore the
development of the National Integrated Plan for early childhood development was
started in May 2004 (117). In order to give children in South Africa the best start in
life, the key aim of the National Integrated Plan is to bring greater coordination to
various government departments (Department of Education, Department of Social

31
development, and Department of Health), that are running existing government
programs for early childhood development (117).
The South African Legislature provides for prevention of ill-health and disability as
well as early intervention through Chapter 8 of the Child Amendment act of 2007
(118). Section 144 describes the purposes of prevention and early intervention
programs, and states that the programs must focus on providing psychological,
rehabilitation, and therapeutic programs for children. The programmes may also
include early childhood development, promotion of the well-being of children, and
the realisation of their full potential (p.56) (118).
According to the Health Act (119), all children below the age of six years should
have access to medical care and early childhood development programs as the
State provides this free of charge. The South African Government not only values
early childhood development and the health of children by providing free medical
care, but also has a policy on the reduction of underlying causes of illness, injury,
and disability whereby it states that “Prevention is a good way to reduce the
burden of disease and improve the quality of life” (p. 5) (120). According to this
Policy on Quality of Health care for South Africa, there is a shift from treatment to
prevention as it is an important way to reduce the causes of injury, illness, and
disability (120).
From the policies and legislature, it can be concluded that there is an emphasis on
early intervention, prevention, and early childhood development in South Africa
and that it forms an important part of the health system. Emphasis is also shifting
to prevention, and in order to have effective prevention and early intervention,
accurate testing and identification of problems is vital.
2.5.2 Importance of early intervention in sensory integration
The presence of SID may be evident very early in life and measures used to
assess these difficulties, are available for use in infants from birth. In a study of
eight-month old infants, a high percentage of infants showed sleeping problems,
eating difficulties, temper tantrums, and other symptoms. When these difficulties
are present from birth, they appear to contribute to development of dysfunctional
parent–infant interaction patterns. These, in turn, can affect the infants’ personality
development (35). Assessment should be carried out as soon after birth as

32
possible, or as soon as problems are suspected in order to recognise and identify
problems early.
In their study, Dawson et al. found that early intervention in autism spectrum
disorder leads to significant gains in adaptive behaviour and language
development (121). In a systematic review of research on early intervention
programmes for children with physical disabilities, Ziviani et al. found that the early
intervention programmes did create positive outcomes for both the children and
their families (122). The importance of early identification of abnormal
development has been documented by DeGangi, et al. (28). This study found that
children displaying only moderate or mild sensory processing problems and high
levels of irritability benefit most from early intervention programs, yet they are
often undetected and therefore do not receive early intervention as needed.
According to De Gangi et al., it is very difficult to accurately establish the impact of
SID, when present at an early age, on later learning and emotional development.
This is due to a lack of assessments that can detect SID in infants, adequately and
reliably (37). In a later longitudinal study, DeGangi et al. found that 50% of infants
with moderate to severe SID, (specifically looking at regulatory disorders) at the
age of seven months also showed those problems at age 36 months (123). Ben-
Sasson et al. (36) also found that patterns of sensory sensitivity in early childhood
significantly predicted sensory over responsiveness in elementary school.
Approximately 33% of infants who had elevated levels of sensory over
responsiveness at the age of one and two years were also reported to have
elevated sensory over responsiveness in school age. It is possible that some
infants are born vulnerable and stay vulnerable or infants that fall behind the
developmental curve by the age of three years are more likely to develop some
type of SID. Their findings suggested an early acceleration in over-responsivity
may serve as a ‘red flag’ for monitoring an infant and referring to early intervention
(36).
This indicates that SID can have an impact on the infant’s functioning later in life
and can impact on scholastic ability. The early detection and accurate assessment
of SID in infants is therefore very important. If the problems can be accurately
identified and treated at an early age, the infant has a better chance that normal
development will take place and this can prevent or minimise the development of
33
scholastic problems. It is important that we take a look at available assessments to
identify SID in infants.
2.6 CONCLUSION
In conclusion, during a review of the sensory integration literature it was noted that
there is currently no concensus on the use of terminology regarding sensory
dysfunction. This is creating confusion among the public and therapist alike. The
terms sensory integrative dysfunction and sensory processing disorder are
currently being used to describe dysfunction of sensory integration. Sensory
modulation was discussed as this was primarily evaluated in infants during the
research study using the Infant/Toddler Sensory Profile and the Test of Sensory
Functions in Infants.
When testing the sensory integrative functions of infants, there is no test that can
be regarded as the “gold standard” of testing in this population. It is, therefore,
important to evaluate different tests that are currently available in order to
determine if the tests are accurate enough to effectively indicate SID in this
population as it can have an influence on their further development and scholastic
abilities later in life. Early intervention and the use thereof was also looked at as
the literature shows that early intervention is important, and also in South Africa
the government places an emphasis on early intervention.

34
CHAPTER 3: RESEARCH METHODOLOGY
This chapter describes the study design and participant sample for the study. A
detailed description of the instruments and procedure used for data collection is
provided. The ethical considerations for this study are also included at the end of
this chapter.
3.1 STUDY DESIGN
A cross-sectional, descriptive, correlation study was used. A cross-sectional study
was used as the researcher tested participants only once to collect the relevant
data. The study can be described as descriptive as no attempt was made to
manipulate any of the independent variables (124).
As the research looked at the normative data and accuracy of two standardised
tests for SID in infants, data only needed to be collected once. Due to this, a
cross-sectional research design was suitable for the study.
The researcher then also aimed to determine if there was any relationship
between the constructs of the different tests (ITSP and TSFI). This design was
suitable as all variables that were compared are tested at one point in time, and
this makes comparison of the data more reliable. Correlation research is described
as one of two types of descriptive research. This design was suitable for the study
as the research aimed to determine if there was a correlation between two
standardised tests for SID in infants.
3.2 POPULATION
Infants between the ages of seven and 18 months were included in the study. The
participant sample was recruited from child day care facilities in the East Rand
area.
3.2.1 Sampling
A cluster sampling method was used to select the participants for the study. This
is a type of probability sampling method by which a group was selected and all the
members of the group were invited to participate in the research. In this study, the

35
group identified was infants between the ages of seven and 18 months that
attended a child day care facility. All parents of infants in the target age were given
the opportunity to participate if they wished to do so. A degree of convenience was
involved as child day care facilities in a geographical area close to the researcher
were used.
The sample for the study was determined using the following inclusion and
exclusion criteria.
Inclusion criteria:
• Full term infants, born between 37 and 42 weeks gestation.
Exclusion criteria:
• Infants born before 37 weeks gestation.
• Infants with a diagnosed birth defect or gestational illness.
The sample was obtained using the following procedure:
The researcher set out to identify child day care facilities in the East Rand area.
This specific area was targeted out of convenience as this is an area well known
to the researcher and in close proximity to where the researcher resides and
works.
Child day care facilities were identified through drive-by sightings, sightings of
advertisement signs, local newspaper advertisements, internet searches, and by-
word-of-mouth.
A total of 29 child day care facilities were approached. The breakdown of
responses from the child day care facilities were as follows:
• Five child day care facilities did not have any infants in the correct age
range.
• One child day care facility had only one infant in the correct age range, but
the researcher then chose not to use the facility.
• Six child day care facilities accepted forms from the researcher, but had no
response from parents.
• 17 child day care facilities were used during the study.

36
Table 3.1 (below) indicates the distribution of test participants between the
different child day care facilities that were used during data collection for this
study.
Table 3.1 Distribution of test participants
Study Code Number of infants
Study code Number of infants
S001 6 S010 4
S002 8 S011 4
S003 3 S012 2
S004 4 S013 7
S005 2 S014 1
S006 2 S015 3
S007 1 S016 5
S008 5 S017 2
S009 1
Total: 60
3.2.2 Sample size
The sample size was determined by a sample size calculation using the
population of possible number of infants in the child day care facilities. In an article
by Bartlett (125), tables are given to determine sample size. This was used to
determine sample size for this study. The tables are calculated using Cochran’s
sample size formulas. The margin of error was set to 0.03. The population size for
this study was estimated based on 17 day care facilities and was determined to be
approximately 140 infants. The sample size was determined to be 60 participants,
which is more than the 55 participants for a population of 100 but less than the 75
participants for a population of 200. For this sample size, the alpha value is 0.05
with a t-value of 1.96 (125).

37
3.3 RESEARCH TOOLS
The following measures were used to collect all data for the study:
3.3.1 Demographic sheets: Compiled by researcher (Appendix A)
The researcher compiled two demographic sheets to gather demographical data
that were deemed important in the study.
The first sheet was used to gather demographic information from the parents of
the infant participants and was divided into two parts. Part one was personal
information (Appendix A1) from both the mother and the father. This also included
the infant’s name and date of birth. For ethical purposes, this sheet was kept
separately, and only the researcher had access to this information. Part two was a
coded sheet (Appendix A2), gathering information regarding the pregnancy and
birth, medical history of the infant as well as parental history.
The second sheet was to gather demographic information from the child day care
facilities used in the study (Appendix A3). This was completed by the head of the
facility/manager and contained information regarding location and contact
information of the child day care facility. Information was also gathered regarding
the number of infants cared for, infant-caregiver ratios and business hours.
3.3.2 Infant/Toddler Sensory Profile: by Dunn,W. (Appendix B)
The Infant/Toddler Sensory Profile (ITSP) is in the form of a parent questionnaire
(Appendix B1) that requires 15 minutes to complete. It provided a criterion-
referenced method for measuring an infant’s sensory processing behaviour. The
information gathered from the questionnaire helps to profile the effect of sensory
processing on functional performance in the daily life of the infant. Caregivers
complete a judgment-based questionnaire of 48 items (seven- to 36-months)
aimed at reporting the frequency with which infants respond to various sensory
experiences on a five point scale. The parents are asked to check the box on the
key that best describes the frequency of their infant’s behaviours on the scale as:
“When presented with the opportunity, your childR Almost Always (90% or more
of the time), Frequently (75% of the time), Occasionally (50% of the time),
Seldom (25% of the time) or Almost Never (10% or less of the time)”.

38
The ITSP provides validated and reliable scores for infants between the ages of
birth and 36 months. There are two classification systems, one for infants aged
birth to six months, and one for infants aged seven to 36 months. For the
purposes of this study, only the classification system from seven to 36 months was
used. This test was standardised in the United States of America, involving infants
from a variety of ethnic groups (40).
The reliability and validity of the ITSP has low overall consistency for the section
scores obtained for the infant group from birth to six months, therefore only
quadrant scores are available. The Coefficient Alpha for the quadrant scores vary
from 0.56 to 0.82. There is no evidence of test-retest reliability for this age group.
Due to the lack of test-retest reliability and low coefficient alpha scores, the
researcher decided to only test infants from age seven months to 18 months. The
ITSP can be used with infants/toddlers up to the age of 36 months, but the other
standardised measure (TSFI) being used in this study can only be used up to the
age of 18 months. Therefore infants older than 18 months were not included in the
study. For the age group from seven months to 36 months, section scores and
quadrant scores are provided.
The scoring procedure, as set out in the test manual (40), requires the user to
complete the Summary Score Sheet (Appendix B2) after the parents completed
the questionnaire. The Quadrant Grid is completed by assigning a score of one to
five to responses on the parent questionnaire. A score of 1 corresponded to
‘Almost always’, 2 to ‘Frequently’, 3 to ‘Occasionally’, 4 to ‘Seldom’, and 5 to
‘Almost never’. The scores are then added to obtain the total score for each
quadrant section. The total scores for quadrant 3 and quadrant 4 are also added
together to give a combined quadrant score for low threshold. The total scores are
then transferred to the Quadrant Summary which indicates the range each
quadrant score and the combined quadrant of low threshold score falls in. The
ranges are:
• ‘Typical performance’ range. Scores between +1 SD and -1 SD.
• ‘Probable difference’ less than others/ more than others. Scores between -1
SD and -2 SD is described as probable difference more than others. This
indicates over responsiveness and scores between + 1 SD and +2 SD is

39
described as probable difference less than others. This indicates under
responsiveness.
• ‘Definite difference’ less than others/ more than others. Scores less than -2
SD are described as definite difference more than others. This indicates
over responsiveness. Scores above +2 SD is described as definite
difference less than others. This indicates under responsiveness.
3.3.3 Test of Sensory Functions in Infants (TSFI) by De Gangi & Greenspan (Appendix C)
The Test of Sensory Functions in Infants (TSFI) is in the form of a therapist
administered observational test that requires 20 minutes to be completed. It is
used as a screening tool for SID in infants. It is especially valuable when used in
conjunction with other developmental tests, as it can help identify infants at risk for
learning and emotional disorders (9). It is standardised for infants between the
ages of four and 18 months, and is specifically recommended for infants with
regulatory disorders, developmental delay, and infants that might be at risk of
developing sensory processing or learning disorders.
The test consists of 24 items divided into five subtests of sensory processing and
reactivity. These subtests are: deep pressure, adaptive motor functions, visual–
tactile integration, ocular–motor control, and vestibular stimulation. For each item,
a sensory stimulus was applied to the infant, using materials and the procedure
described in the manual. The infant’s reaction was observed, and items were
scored according to criteria provided, ranging from adverse to normal – a score of
0, 1, or 2 is allocated to items depending on the infant’s response. The allocation
of the score to the response differs from item to item, and the manual is used for
scoring of each item. Subtest scores provided a profile of five domains and a total
test score for the infant’s age group. Scores below the cut off indicated potential
problems (9).
The scoring procedure as set out in the test manual (9) requires the test user to
add the scores of each subtest after administration. The subtest scores are then
transferred onto the Profile form and this categorised the score into ranges of:
• Normal. Scores above -1 SD.
• At risk. Scores below -1 SD but above -2 SD.

40
• Deficient. Scores below -2 SD.
All the scores from the different subtests are added together to calculate the Total
Test score. This score is also categorised as above.
3.4 PROCEDURE
3.4.1 Data collection procedure
Ethical clearance was obtained from the Human Research Ethics Committee
(Medical) at the University of the Witwatersrand (Appendix D). The research
sample was obtained according to the procedure described above (see sampling).
Permission from all child day care facilities involved in the study was obtained, and
managers received a written information sheet regarding the study (Appendix E)
and had an opportunity to ask questions after the study was explained to them.
Managers of the child day care facilities then completed the demographic sheet for
child day care facilities (Appendix A3). Managers and teachers at the child day
care facilities handed packages of forms to parents of infants that were in the
correct age group (seven to 18 months of age). The package was compiled by the
researcher, and was in the form of an envelope, containing the following:
• Information sheet for parents (Appendix F1) and consent form (Appendix
F2).
• Personal information sheet (Appendix A1).
• Demographic sheet (Appendix A2)
• ITSP Caregiver Questionnaire (Appendix B1).
Instructions to the parents were placed on the front of the envelope (Figure 3.1
below).

41
Instructions:
Please read enclosed information carefully. You are welcome to contact
Marica Botha on 082 335 6386 if you have any questions.
If participating:
1. Complete all forms – please complete all questions.
2. Place forms back in envelope and seal.
3. Return to school as soon as possible (within 7 days of
receiving).
If you choose not to participate:
• Please return envelope with ALL content in unsealed envelope
within 7 days of receiving.
Thank you.
Figure 3.1 Instructions to parents
The researcher collected the completed forms from the child day care facilities. All
forms were checked, and all infants meeting the requirements of the inclusion and
exclusion criteria were included in the study. On the same day that the completed
forms were collected and checked, the TSFI was administered with the help of the
infant’s caregiver. In isolated cases, the parents requested to be present during
the testing, and they then assisted the researcher, after special arrangements
were made with parents in order to accommodate their request. Assistance from
care givers and parents were in the form of them holding the child on their lap as
per the test procedure set out in the test manual.
After all completed forms were collected and tests were administered, the tests
were scored according to the procedure in the test manuals, as described earlier.
On the demographical section of the ITSP Summary score sheet (Appendix B2),
as well as the personal information section of the TSFI Administration and scoring
form (Appendix C), a study code was used instead of the infant’s name. This was
done for ethical purposes of confidentiality. If the infant was found to have definite
difference scores on test scores, parents were contacted, and they were provided

42
with a resource list in order to obtain occupational therapy treatment by a sensory
integration certified therapist if they so wished.
After scoring was done, all data were typed into Excel spreadsheets in preparation
for further analysis.
3.4.2 Data Analysis procedure
The demographical data was analysed using descriptive statistics and
percentages, ranges, and means were calculated according to the total sample of
participants.
For the data analysis of the test scores, the raw scores from both the ITSP and the
TSFI were used. Although not all the data was normally distributed the median
and mean scores were very similar and therefore the mean scores of the sample
in this study were used and compared to range of typical or normal scores given in
the manuals for the ITSP (40) and TSFI (9).
The effect size between the means presented by Dunn for the ITSP for typical
children and the means obtained in this study were also determined.
In order to compare the scores of the ITSP and the TSFI, the z-scores for
participants for both tests were determined.
Frequency data were also calculated for each component on the z-scores, -2 SD
to +2 SD for the ITSP and -2 SD to 0 SD for the TSFI. For all the sections and
subtests on the tests, the percentage of participants scoring in each of the
standard deviations was compared to the normal distribution. In order to establish
if the range of the participants observed test score frequencies differed from the
expected frequencies in each standard deviation on the normal distribution
(Gaussian curve). Chi squared tests were used.
This data were also used to establish the accuracy, sensitivity, specificity, and
misclassification of the two tests.
To determine construct validity of the tests the researcher used z-score data which
were continuous so the parametric Pearson’s correlation coefficient was
calculated in order to establish if there is any correlation between the different
sections of the two tests. This was done to determine if the tests were convergent

43
or divergent and thus measuring the same or a different construct. Convergent
validity refers to the degree, two different measures designed to measure the
same underlying trait, consistently measure the same trait (111) (112). Therefore,
if there is a high correlation between the scores obtained by the two measures, it
indicates convergent validity. Divergence, also known as discriminant validity,
refers to the principle that tests that are designed to measure different traits should
be unrelated (111).
Finally, the internal consistency of both tests was determined by calculating
Cronbach’s alpha. This measure determined the reliability of the items on each
test to measure the construct the test was designed to measure for this sample of
participants.
3.3 ETHICAL CONSIDERATIONS:
The researcher applied for ethical clearance from the Human Research Ethics
Committee (Medical) at the University of the Witwatersrand, before the start of the
research. Data collection only started once ethical clearance was obtained
(Appendix D). Permission was obtained from the child day care facilities in the
form of a signed, informed consent form (Appendix E).
All parent(s)/legal guardian(s) were provided with an information sheet (Appendix
F1) to explain the research and were requested to sign informed consent
(Appendix F2 response sheet) before entering the research project.
Participation in this project was voluntary and any parent/legal guardian was free
to withdraw their infant at any point. There were no consequences for such
withdrawal.
As infants are a particularly vulnerable group special care was taken during the
assessment of the infants. The special measures included:
Parents/legal guardians could request to be present during the testing session.
The testing sessions were conducted at the child day care facility which is a
familiar setting for the infant. This was done in order for the infant to be
comfortable and to reduce the risk of the infant being distressed during the testing
session.

44
Testing sessions were conducted in the presence of the infant’s regular caregiver.
This, again, was done in order for the infant to be comfortable and to reduce the
risk of the infant being distressed during the testing session.
If any signs of distress (like crying or pulling away from the researcher) were seen
during the testing session, the test was stopped. If the infant could be calmed
down, testing was restarted, but only continued if no signs of distress were noted.
Some parts of the standardised test (TSFI) required the tester to hold and handle
the infant. If this caused distress (crying or pulling away from the researcher), the
caregiver was instructed and received a demonstration of how to administer that
particular test item. The researcher then only observed the infant’s reaction to the
specific administered input. According to the test manual (9), this is an acceptable
manner to administer the test.
To ensure confidentiality, all participants in this research were allocated a study
code. This number was used on all data sheets. The participant’s information was
kept separate. Only the researcher had access to the participant’s information that
was kept in a separate sheet and protected by passwords. It was important that
the researcher was able to identify participants in case they needed to be
contacted. Contact with parents was needed if the infant was found to have
‘definite difference scores’ on the tests. They were provided with a resource list in
order to obtain occupational therapy treatment by a sensory integration certified
therapist if they so wished. No personal information was published.
45
CHAPTER 4: RESULTS
4.1 INTRODUCTION
For this study, the sensory integration function of 60 infants between the ages of
seven to 18 months was assessed using the Infant/Toddler Sensory Profile
(ITSP), and the Test of Sensory Functions in Infants (TSFI), which was
administered by the researcher. The sensory profile of the participants was
established for each test, and the results were compared to the normative data
from the test manuals. Diagnostic accuracy specifically looking at accuracy,
specificity, sensitivity, and misclassification rate of the two tests was determined.
Results also reflect the construct validity and internal consistency of the two tests.
4.2 DEMOGRAPHICS
4.2.1 General Demographics
Demographic data was gathered by means of a questionnaire compiled by the
researcher. The questionnaire was completed by parents of the infant participants.
Table 4.1 focuses on demographics of the infant participants as well as the age of
their mothers, at the time of testing, and duration of time the infant spends at the
day care facility each day.
The gender distribution for the infant participants was found to have slightly more
males (56.7%) than females (43.3%). The infants were divided into age bands with
a range of three months. The smallest percentage (6.7%) of infants fell in the age
group seven to nine months and the highest percentage (40.0%) in the age group
between 15 to 18 months. The lack of significant difference between the age
groups for the scores on the ITSP and TSFI, except vestibular scores on the ITSP
(p≤ 0.02), meant that the groups could be considered comparable, and therefore
no further analysis according to age groups was considered.
The highest percentage of mothers (52.5%) was between the ages of 25 to 30
years, at the time of testing, with the youngest mother being age 20 years. Only
5.0% (n=3) of the participants attended child day care facilities for half day with the
largest proportion (95.0%) of participants attending day care on a full day basis. All
the parents could afford day care facilities, and this places them in a middle

46
socioeconomic status. All the parents were English first or second language and
the day care centres all used either English/Afrikaans or both languages as the
language for education.
Table 4.1 General Demographics
n (%)
Gender Male 34 (56.7%)
Female 26 (43.3%)
Ages
Infants n = 60 Range
Mean(SD)
Mothers n = 59 Range
Mean(SD)
7 to 18 months 13.68 (3.33)
20 to 40 years 29.93 (4.29)
n (%) n (%)
7-9 months 4 (6.7%) 15 to 20 years 1 (1.7%)
10-12 months 22 (36.7%) 21 to 25 years 6 (10.2%)
13-15 months 10 (16.6%) 26 to 30 years 31 (52.5%)
16-18 months 24 (40.0%) 31 to 35 years 12 (20.3%)
36 to 40 years 9 (15.3%)
Attendance at Child Day Care Facilities
Mornings only 3 (5.0%)
Full day 57 (95.0%)
4.2.2 Birth History of Infant participants
The data relating to the infant’s birth history included birthing position, mode of
birth and birth weight. Table 4.2 indicates that most participants (68.3%) were in
the head first birthing position at the time of birth. Unfortunately quite a number of
participants (20.0%) did not indicate birthing position. Only a small percentage
(21.7%) of infants was born via normal vaginal delivery, and therefore a very large
number of infants in the sample (78.3%) were born via caesarean section, of
which 56.6% were planned caesarean sections. Looking at birth weight, the
highest number of infants (40.0%) had a birth weight between 3.0 kg and 3.5 kg,
and only a small percentage fell below 2.5 kg (5.0%: n=3) and above 4.0 kg
(1.7%: n=1).

47
Table 4.2 Birth History
n (%)
Birthing position
Head first 41 (68.3%)
Breech 7 (11.7%)
Unknown 12 (20.0%)
Mode of birth
Normal 13 (21.7%)
Planned Caesarean Section 34 (56.6%)
Emergency Caesarean Section 13 (21.7%)
Birth weight
Range Mean(SD)
2.2 to 4.05 kg 3.2 kg (0.43)
2.0 to 2.5 kg 3 (5.0%)
2.5 to 3.0 kg 17 (28.3%)
3.0 to 3.5 kg 24 (40.0%)
3.5 to 4.0 kg 15 (25.0%)
4.0 to 4.5 kg 1 (1.7%)
4.3 COMPARISON OF NORMATIVE DATA OF THE INFANT/TODDLER SENSORY PROFILE (ITSP) AND TEST OF SENSORY FUNCTIONS IN INFANTS (TSFI)
4.3.1 Infant/Toddler Sensory Profile (ITSP)
4.3.1.1 Comparison to normative data and typical range
The means of the raw score data obtained from testing a South African sample
were compared to the normative data found on the ITSP score sheet. The data
obtained for the processing sections is reflected in Figure 4.1 and data for the
quadrant scores is reflected in Figure 4.2.

48
Figure 4.1 Raw scores of processing sections compared to normative data.
In Figure 4.1 (above) it was found that for five of the six processing sections the
mean score for the South African sample was in the lower ranges of the typical
performance range. The scores for the tactile processing section were centred in
the typical performance range.
Figure 4.2 Raw scores of quadrants compared to normative data
0
10
20
30
40
50
60
70
Auditoryprocessing
VisualProcessing
Tactileprocessing
Vestibularprocessing
Oral sesoryprocessing 7-
12mnths
Oral sensoryprocessing 13-
18mnths
Raw scores
Upper range typical performance Lower range typical performance
Mean South African sample
0
20
40
60
80
100
120
Q1 LowRegisration
Q2 SensationSeeking 7-12
mnths
Q2 Sensationseeking 13-18
mnths
Q3 Sensorysensitive
Q4 SensoryAvoiding
LowThreshold
Raw scores
Upper range typical performance Lower range typical performance
Mean South African sample
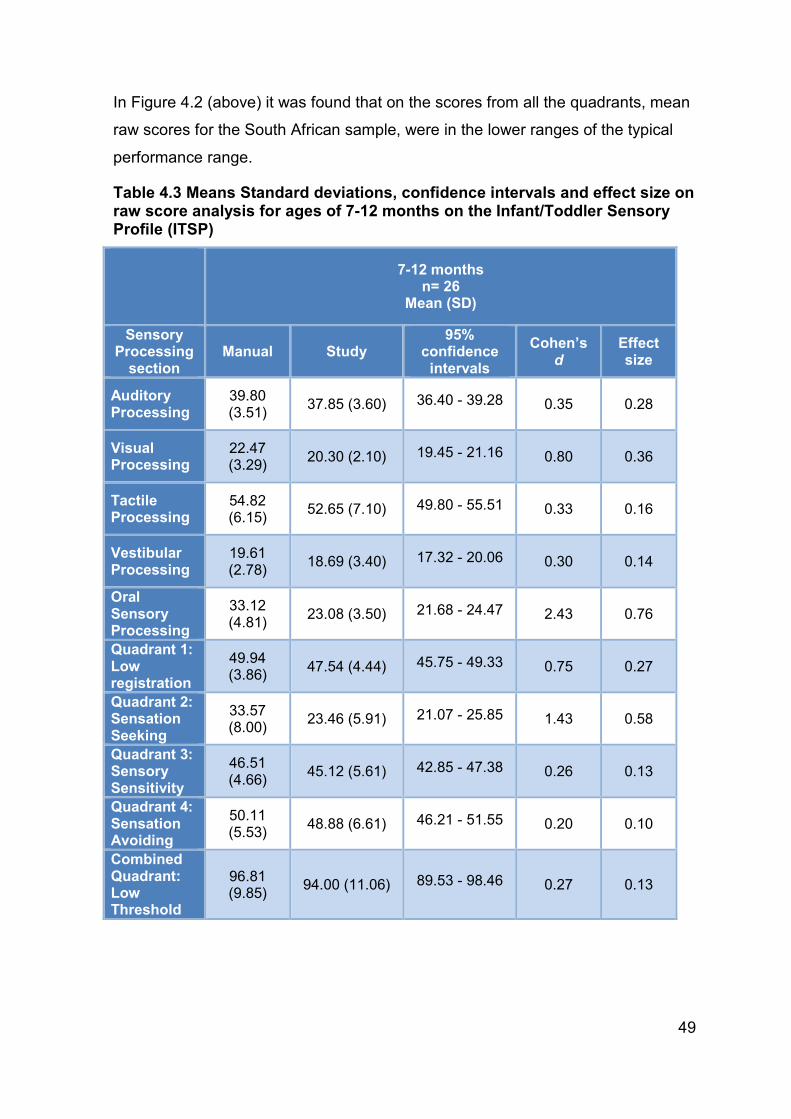
49
In Figure 4.2 (above) it was found that on the scores from all the quadrants, mean
raw scores for the South African sample, were in the lower ranges of the typical
performance range.
Table 4.3 Means Standard deviations, confidence intervals and effect size on raw score analysis for ages of 7-12 months on the Infant/Toddler Sensory Profile (ITSP)
7-12 months
n= 26 Mean (SD)
Sensory Processing section
Manual Study 95%
confidence intervals
Cohen’s d
Effect size
Auditory Processing
39.80 (3.51)
37.85 (3.60) 36.40 - 39.28 0.35 0.28
Visual Processing
22.47 (3.29)
20.30 (2.10) 19.45 - 21.16 0.80 0.36
Tactile Processing
54.82 (6.15)
52.65 (7.10) 49.80 - 55.51 0.33 0.16
Vestibular Processing
19.61 (2.78)
18.69 (3.40) 17.32 - 20.06 0.30 0.14
Oral Sensory Processing
33.12 (4.81)
23.08 (3.50) 21.68 - 24.47 2.43 0.76
Quadrant 1: Low registration
49.94 (3.86)
47.54 (4.44) 45.75 - 49.33 0.75 0.27
Quadrant 2: Sensation Seeking
33.57 (8.00)
23.46 (5.91) 21.07 - 25.85 1.43 0.58
Quadrant 3: Sensory Sensitivity
46.51 (4.66)
45.12 (5.61) 42.85 - 47.38 0.26 0.13
Quadrant 4: Sensation Avoiding
50.11 (5.53)
48.88 (6.61) 46.21 - 51.55 0.20 0.10
Combined Quadrant: Low Threshold
96.81 (9.85)
94.00 (11.06) 89.53 - 98.46 0.27 0.13

50
Table 4.4 Means Standard deviations, confidence intervals and effect size on raw score analysis for ages of 13-18 months on the Infant/Toddler Sensory Profile (ITSP)
Effect size was calculated for the mean scores provided in the manual of the ITSP
and the mean scores from this study. The oral processing section and quadrant
score for quadrant 2: sensation seeking, for both age groups had moderate effect
sizes.
13-18 months n=34
Mean (SD)
Sensory Processing section
Manual Study
95% confidence intervals of means
Cohen’s d
Effect size
Auditory Processing
38.98 (3.55) 36.47 (4.83) 34.78 - 38.15 0.77 0.28
Visual Processing
22.93 (3.40) 20.29 (2.50) 19.42 - 21.16 0.82 0.40
Tactile Processing
54.73 (6.11) 50.35 (6.54) 48.07- 52.63 0.96 0.32
Vestibular Processing
20.26 (2.44) 17.85 (3.35) 16.68 - 19.02 0.82 0.38
Oral Sensory Processing
34.70 (4.82) 24.62 (3.77) 23.30 - 25.93 2.58 0.75
Quadrant 1: Low registration
33.47 (8.22) 48.29 (4.30) 46.80 - 49.79 0.49 0.24
Quadrant 2: Sensation Seeking
47.11 (4.66) 21.47 (5.54) 19.54 - 23.04 1.71 0.65
Quadrant 3: Sensory Sensitivity
50.28 (3.78) 43.83 (5.51) 41.90 - 45.74 0.64 0.30
Quadrant 4: Sensation Avoiding
50.88 (5.30) 48.62 (5.59) 46.67 - 50.56 0.43 0.21
Combined Quadrant: Low Threshold
97.89 (9.26) 92.44 (10.26) 88.86 - 96.02
0.55 0.36

51
4.3.1.2 Frequency of typical, probable and definite differences
The frequency of the interpretation scores (z-scores) for the different sensory
processing sections and quadrant scores in the ITSP indicated some differences
from those expected according to a normative distribution. The normative
distribution, as plotted on a Gaussian curve, indicate the following distribution:
• Definite Difference – 4.2%
o Definite Difference less than others – 2.1%
o Definite Difference more than others – 2.1%
• Probable Difference – 27.2%
o Probable Difference less than others – 13.6%
o Probable Difference more than others – 13.6%
• Typical Performance – 68.2%
It was found that, in the sections and quadrants, namely visual processing
(63.3%), vestibular processing (56.7%), and low registration (66.7%), fewer
participants fell into the typical performance range than expected for the normal
distribution (Table 4.5).
More participants than expected fell into the probable difference range (more and
less than others combined) in the visual processing section (35.0%) and quadrant
2: sensation seeking (31.7%). It was only in the visual processing section (1.7%)
that fewer participants fell into the definite difference range. This aspect could not
be judged for quadrant 2: sensation seeking.
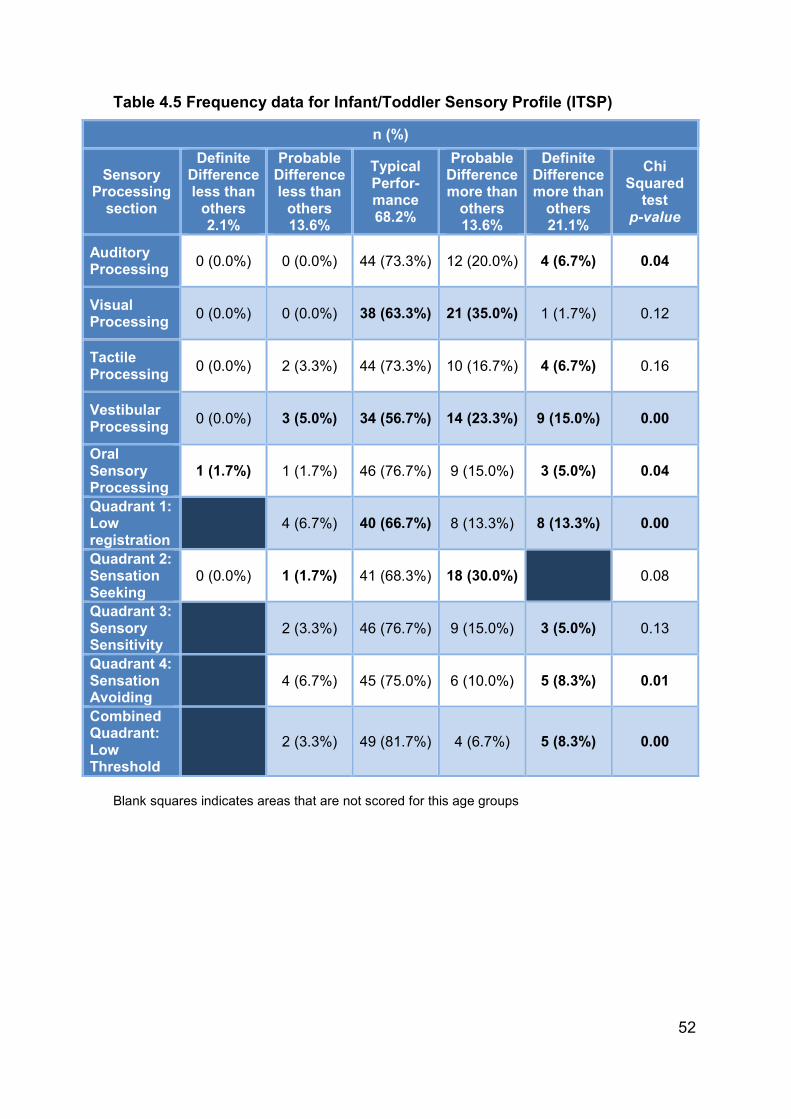
52
Table 4.5 Frequency data for Infant/Toddler Sensory Profile (ITSP)
Blank squares indicates areas that are not scored for this age groups
n (%)
Sensory Processing section
Definite Difference less than others 2.1%
Probable Difference less than others 13.6%
Typical Perfor-mance 68.2%
Probable Difference more than others 13.6%
Definite Difference more than others 21.1%
Chi Squared
test p-value
Auditory Processing
0 (0.0%) 0 (0.0%) 44 (73.3%) 12 (20.0%) 4 (6.7%) 0.04
Visual Processing
0 (0.0%) 0 (0.0%) 38 (63.3%) 21 (35.0%) 1 (1.7%) 0.12
Tactile Processing
0 (0.0%) 2 (3.3%) 44 (73.3%) 10 (16.7%) 4 (6.7%) 0.16
Vestibular Processing
0 (0.0%) 3 (5.0%) 34 (56.7%) 14 (23.3%) 9 (15.0%) 0.00
Oral Sensory Processing
1 (1.7%) 1 (1.7%) 46 (76.7%) 9 (15.0%) 3 (5.0%) 0.04
Quadrant 1: Low registration
4 (6.7%) 40 (66.7%) 8 (13.3%) 8 (13.3%) 0.00
Quadrant 2: Sensation Seeking
0 (0.0%) 1 (1.7%) 41 (68.3%) 18 (30.0%) 0.08
Quadrant 3: Sensory Sensitivity
2 (3.3%) 46 (76.7%) 9 (15.0%) 3 (5.0%) 0.13
Quadrant 4: Sensation Avoiding
4 (6.7%) 45 (75.0%) 6 (10.0%) 5 (8.3%) 0.01
Combined Quadrant: Low Threshold
2 (3.3%) 49 (81.7%) 4 (6.7%) 5 (8.3%) 0.00

53
Figure 4.3 Distribution of scores for visual processing section
Figure 4.4 Distribution of scores for quadrant 2: sensation seeking
More participants than expected fell into the definite difference range (more than
others) on nine of the ten sections and quadrants. It is important to note the
percentage of infants falling into the definite difference range on the vestibular
processing section (15.0%) as it is much higher than expected (4.2%). This was
the only section that also had a higher percentage of infants that scored in the
probable difference range (28.3%).
-10
0
10
20
30
40
50
60
70
80
DefiniteDifference morethan others
ProbableDifference morethan others
Typical Probabledifference lessthan others
DefiniteDifference lessthan others
Percentage
Visual Processing Normal distribution
-10
0
10
20
30
40
50
60
70
80
DefiniteDifference morethan others
ProbableDifference morethan others
Typical Probabledifference lessthan others
DefiniteDifference lessthan others
Percentage
Q2: Sensation Seeking Normal distribution

54
Figure 4.5 Distribution of scores for vestibular processing section
Other section that scored above the expected values in the definite difference
category were auditory processing (6.7%), tactile processing (6.7%), and oral
processing (5.0%). It can be seen that for these sections the probable difference
‘less than others’ was always lower but the probable difference ‘more than others’
was slightly higher or fell into expected ranges. For auditory processing (73.3%),
tactile processing (73.3%), and oral processing (76.7%) there was slightly more
than expected number of participants (68.2%) scoring in the typical range (Figure
4.6).
-10
0
10
20
30
40
50
60
70
80
DefiniteDifference morethan others
ProbableDifference morethan others
Typical Probabledifference lessthan others
DefiniteDifference lessthan others
Percentage
Vestibular Processing Normal distribution

55
Figure 4.6 Distribution of scores for auditory, tactile and oral sensory processing sections
For the quadrant scores, quadrant 1: low registration (13.3%), quadrant 3: sensory
sensitivity (5.0%), quadrant 4: sensation avoiding (8.3%) had a higher percentage
-10
0
10
20
30
40
50
60
70
80
DefiniteDifference morethan others
ProbableDifference morethan others
Typical Probabledifference lessthan others
DefiniteDifference lessthan others
Percentage
Auditory Processing Normal distribution
-10
0
10
20
30
40
50
60
70
80
DefiniteDifference morethan others
ProbableDifference morethan others
Typical Probabledifference lessthan others
DefiniteDifference lessthan others
Percentage
Tactile Processing Normal distribution
-10
0
10
20
30
40
50
60
70
80
90
DefiniteDifference morethan others
ProbableDifference morethan others
Typical Probabledifference lessthan others
DefiniteDifference lessthan others
Percentage
Oral Sensory Processing Normal distribution

56
of participants that scored in the definite difference ‘more than others’ (2.1%) as
well.
Figure 4.7 Distribution of quadrant scores for quadrant 1: low registration, quadrant 3: sensory sensitivity, and quadrant 4: sensation avoiding
0
10
20
30
40
50
60
70
80
DefiniteDifference morethan others
ProbableDifference morethan others
Typical Probabledifference lessthan others
DefiniteDifference lessthan others
Percentage
Q1: Low registration Normal distribution
0
10
20
30
40
50
60
70
80
90
DefiniteDifference morethan others
ProbableDifference morethan others
Typical Probabledifference lessthan others
DefiniteDifference lessthan others
Precentage
Q3: Sensory Sensitivity Normal distribution
0
10
20
30
40
50
60
70
80
DefiniteDifference morethan others
ProbableDifference morethan others
Typical Probabledifference lessthan others
DefiniteDifference lessthan others
Percentage
Q4: Sensation Avoiding Normal distribution

57
A similar result was found for the combined quadrant: low threshold where the
percentage of participants was higher for definite difference ‘more than others’ (8.3%)
although a higher percentage of participants scored in the typical range (81.7%).
Figure 4.8 Distribution of scores for combined quadrant: low threshold
It was found that six of the ten sections and quadrants were significantly different
(p≤ 0.05) from the expected normal curve. Only the results for the visual
processing (p≥ 0.12) and tactile processing (p≥ 0.16) section, as well as the
sensory seeking (p≥ 0.08) and sensory sensitivity (p≥ 0.13) quadrants were found
to fall within the normal expected range.
The majority of scores indicating problems with sensory integration function fell
into the probably more and definitely more than most range. Very few participants
scored in the probably less than most and definitely less than most range.
4.2.1 Test of Sensory Functions in Infants (TSFI)
4.3.2.1 Comparison to typical range
In Figure 4.9 below, it was found that scores for five of the subtests as well as the
total test score (seven to nine months) were in the lower ranges of the typical
performance range. The subtests were reactivity to tactile deep pressure (seven
to18 months), adaptive motor functions (seven to nine months), visual tactile
integration (seven to 18 months), ocular-motor control (seven to 18 months), and
reactivity to vestibular stimulation (seven to 12 months). The scores for three
subtests, adaptive motor functions (10 to 12 months), adaptive motor functions (13
0
10
20
30
40
50
60
70
80
90
DefiniteDifference morethan others
ProbableDifference morethan others
Typical Probabledifference lessthan others
DefiniteDifference lessthan others
Participants
Low Threshold Normal distribution

58
to 18 months), reactivity to vestibular stimulation (13 to 18 months), as well as the
total test score (eight to 18 months) were below the normal ranges.
Figure 4.9 Raw scores compared to normative data (TSFI)
4.3.2.2 Frequency of typical, probable and definite differences
The frequency of the interpretation scores (z-scores) for the different subtests and
total test score in the TSFI indicated some differences from those expected
according to a normative distribution. The normative distribution, as plotted on a
Gaussian curve, indicate the following distribution:
Deficient – 4.2%
At risk – 27.2%
Normal – 68.2%
Frequency of the interpretation scores for the different subtests and total test
scores obtained by the TSFI are represented in Table 4.6.
0
5
10
15
20
25
30
35
40
45
50Reactivity to tactile deep pressure
7-18 m
nths
Adaptive m
otor functions 7-9mnths
Adaptive m
otor functions 10-12
mnths
Adaptive m
otor functions 13 -18
mnths
Visual tactile integration 7-18 m
nths
Ocular motor control 7-18 m
nths
Reactivity to vestibular stimulation
7-12 m
nths
Reactivity to vestibular stimulation
13-18mnths m
nths
Total test 7-9 m
nths
Total test 8-18 m
nths
Raw scores
Lower Range for typical performance Upper Range for typical performance
Mean for South African sample

59
Table 4.6 Frequency data for the Test of Sensory Functions in Infants (TSFI)
Research group n = 60 n (%)
Subtest Normal 68.2%
At risk 27.2%
Deficient 4.2%
Chi Squared test
p-value
Reactivity to Tactile Deep Pressure
44 (73.3%) 6 (10.0%) 10 (16.7%) *0.00
Adaptive Motor Functions
16 (26.7%) 12 (20.0%) 32 (53.3%) *0.00
Visual-Tactile Integration 48 (80.0%) 7 (11.7%) 5 (8.3%) *0.00
Ocular-Motor Control 50 (83.3%) 9 (15.0%) 1 (1.7%) *0.01
Reactivity to Vestibular Stimulation
31 (51.7%) 7 (11.7%) 22 (36.6%) *0.00
Total Test scores 25 (41.7%) 12 (20.0%) 23 (38.3%) *0.00
* p<0.05
In one subtest, the reactivity to vestibular stimulation (51.7%), it was found that
fewer participants fell into the ‘normal’ performance range (68.2%) than expected,
with a higher percentage of participants falling into the deficient category (36.6%).
Figure 4.10 Distribution of scores for reactivity to vestibular stimulation
The score for the subtest of adaptive motor function (26.7%), less than half of the
participants tested within the expected ranges for the normal distribution (68.2%)
0
10
20
30
40
50
60
70
80
Deficient At risk Normal
Percentage
Reactivity to Vestibular Stimulation Normal distribution

60
and more participants tested within the ‘deficient’ range (53.3%) than what is
expected for the normal distribution (4.2%).
Figure 4.11 Distribution of scores for adaptive motor functions
It was found that in five of the six subtests more participants tested within the
‘deficient’ range than what is expected for the normal distribution (4.2%).
Only the ocular-motor control subtest (1.7%) had fewer participants test with in the
‘deficient’ range. Reactivity to tactile deep pressure (16.7%), and visual-tactile
integration (8.3%) subtests, tested higher than expected within the ‘deficient’
range, they had scores that were more than double the expected score of 4.2%.
These subtests also had a higher percentage of participants within the normal
ranges.
0
10
20
30
40
50
60
70
80
Deficient At risk Normal
Percentage
Adaptive Motor Functions Normal distribution

61
Figure 4.12 Distribution of scores for reactivity to tactile deep pressure, visual-tactile integration, and ocular-motor control subtests
The total test score distribution was affected by the distributions for reactivity to
vestibular stimulation and adaptive motor function, and a high percentage of the
0
10
20
30
40
50
60
70
80
Deficient At risk Normal
Precentage
Reactivity to Tactile Deep Pressure Normal distribution
0
10
20
30
40
50
60
70
80
90
Deficient At risk Normal
Percentage
Visual-Tactile Integration Normal distribution
0
10
20
30
40
50
60
70
80
90
Deficient At risk Normal
Precentage
Ocular-Motor Control Normal distribution

62
participants fell into the deficient category with a marked reduction in those scoring
in the normal category (Figure 4.13).
Figure 4.13 Distribution of total test scores
All the subtests had fewer participants that tested within the ‘At risk’ range than
what is expected for the normal distribution (27.2%).
In all five subtests and the total test score, it was found that the scores obtained
differ significantly (p≤ 0.05) from the normal distribution (Table 4.6).
4.3.3 Sensitivity and Specificity
To assess the validity of the ITSP and TSFI for the test population, the accuracy,
sensitivity and specificity was determined by using the frequency data presented
above, in comparison to the expected number of cases compared to the normal
distribution (Table 4.7a and 4.7b).
Accuracy indicates the closeness of estimated values to the true values (111). For
a test to be accurate it needs to have sensitivity and specificity within acceptable
limits. Sensitivity refers to the ability of a measurement tool to detect the presence
of a condition or problem when it is indeed present. Specificity, on the other hand,
refers to the ability of a measurement tool to produce negative results when the
condition or problem is absent. Sensitivity and specificity need to be considered to
establish the usefulness of a measurement tool or instrument in determining the
existence of a problem or whether treatment is needed (124) in order that sensory
integration dysfunction is not over or under identified in infants.
0
10
20
30
40
50
60
70
80
Deficient At risk Normal
Percentage
Total Test scores Normal distribution

63
For the sensitivity and specificity of the Infant/Toddler Sensory Profile (ITSP)
(Table 4.7a) the following were noted:
All the accuracy scores as well as the specificity scores were acceptable at above
80%. The specificity for the vestibular processing section however was just above
80%, indicating participants without a problem may have been identified with
dysfunction. A number of sections and quadrants had sensitivity rates below 80%
which indicates participants with a problem may not be identified. This was a
concern for the section of oral sensory processing (73.7%), and quadrant scores
for sensory sensitivity (73.7%), sensation avoiding (78.9%). The lowest sensitivity
was seen for combined quadrant: low threshold (57.9%). The highest
misclassification rate was for the combined quadrant: low threshold (6.7%). The
misclassification rate indicates how many children will be under/over identified by
the test. The ideal will be that a test has a 0.0%.
Table 4.7a Sensitivity and Specificity of Infant/Toddler Sensory Profile (ITSP)
Research group n = 60
Sensory Processing section
Number of
correct cases
Accuracy Sensitivity Specificity
Mis-classifi- cation rate
Auditory Processing 57 95.0% 84.2% 100.0% 2,5%
Visual Processing 57 95.0% 100.0% 92.7% 2.5%
Tactile Processing 57 95.0% 84.2% 100.0% 2.5%
Vestibular Processing
53 88.3% 100.0% 82.9% 5.8%
Oral Sensory Processing
55 91.7% 73.7% 100.0% 4.2%
Quadrant 1: Low registration
59 98.3% 100.0% 97.6% 0.8%
Quadrant 2: Sensation Seeking
60 100.0% 100.0% 100.0% 0.0%
Quadrant 3: Sensory Sensitivity
55 91.7% 73.7% 100.0% 4.1%
Quadrant 4: Sensation Avoiding
56 93.3% 78.9% 100.0% 3.3%
Combined quadrant: Low Threshold
52 86.7% 57.9% 100.0% 6.7%

64
Table 4.7b Sensitivity and Specificity of Test of Sensory Functions in Infants (TSFI)
For the sensitivity and specificity of the Test of Sensory Functions in Infants (TSFI)
(Table 4.7b), the following were noted:
The accuracy scores for the subtest of adaptive motor functions (58.3%) and the
total test score (73.3%) were below the acceptable rate of 80%. The sensitivity for
two of the six sections was below 80%. These were the subtests of visual-tactile
integration (63.2%) and ocular-motor control (52.6%), indicating that some
participants who do not have dysfunction may be identified as having a problem.
Three of the six sections had specificity scores below 80%, indicating that
participants without a problem may have been identified with dysfunction. The
sections were the subtests of adaptive motor functions (39.0%), reactivity to
vestibular stimulation (75.6%), as well as the total test score (61.0%). The
misclassification rates for adaptive motor functions (20.8%), visual-tactile
integration (58.0%), and total test score (13.3%) were all high.
4.3.4 Construct validity correlation scores for Test of Sensory Functions in Infants (TSFI) and Infant/Toddler Sensory Profile (ITSP).
In order to determine if the two tests had any constructs that were similar in terms
of sensory processing the scores for the sections and quadrants of the ITSP and
Research group n = 60
Sensory Processing section
Number of
correct cases
Accuracy Sensitivity Specificity
Mis-classifi-cation rate
Reactivity to Tactile Deep Pressure
57 95.0% 84.2% 100.0% 2.5%
Adaptive Motor Functions
35 58.3% 100.0% 39.0% 20.8%
Visual-Tactile Integration
53 88.3% 63.2% 100.0% 5.8%
Ocular-Motor Control
51 85.0% 52.6% 100.0% 7.5%
Reactivity to Vestibular Stimulation
50 83.3% 100.0% 75.6% 8.3%
Total Test scores 44 73.3% 100.0% 61.0% 13.3%

65
the subtests and total test score on the TSFI were correlated. The researcher was
aware that the developers of the tests had designed the test for different
constructs of sensory processing – sensory modulation and sensory reactivity, and
results of the correlation confirm the divergence of these two constructs.
There were no moderate correlations between the sections and quadrant scores
obtained on the ITSP, and the subtest/total test score obtained by the TSFI. All the
correlations were weak and too low to account for the test items to be considered
as measuring the same constructs. The constructs in the tests can therefore be
considered to be divergent.
Table 4.8 Correlation scores of Test of Sensory Functions in Infants (TSFI), and Infant/Toddler Sensory Profile (ITSP)
ITSP
TSFI
Reactivity to Tactile Deep
pressure
Adaptive Motor
Functions
Visual- Tactile
Integration
Ocular- Motor Control
Reactivity to
Vestibular Stimulation
Total Test Score
Auditory Processing
0.03 0.25 0.12 -0.08 0.10 0.13
Visual Processing
-0.08 0.19 -0.15 0.12 0.10 0.08
Tactile Processing
-0.12 0.04 -0.12 -0.06 -0.04 -0.14
Vestibular Processing
-0.13 0.22 0.05 0.07 -0.08 0.03
Oral Sensory Processing
-0.10 0.23 -0.00 0.16 -0.00 0.10
Quadrant 1: Low Registration
-0.02 0.03 0.03 -0.09 0.03 0.04
Quadrant 2: Sensory Seeking
-0.16 0.08 -0.17 0.26 0.09 -0.05
Quadrant 3: Sensory Sensitivity
0.04 0.16 0.02 -0.02 -0.16 0.05
Quadrant 4: Sensory Avoiding
-0.17 0.21 -0.00 -0.07 0.03 0.09
Low Thresh Hold
-0.09 0.35 0.16 -0.00 0.10 0.22

66
4.3.5 Reliability
The Cronbach alpha for this sample of participants for the TSFI was calculated as
0.69 and for the ITSP as 0.84.
Table 4.9 Reliability scores for the Infant/Toddler Sensory Profile (ITSP) and Test of Sensory Functions in Infants (TSFI)
Research group n = 60
Infant/Toddler Sensory Profile (ITSP)
Sensory Processing section
Cronbach alpha for study Cronbach alpha scores from
manuals
Auditory Processing 0.84 0.70
Visual Processing 0.84 0.55
Tactile Processing 0.81 0.72
Vestibular Processing
0.83 0.43
Oral Sensory Processing
0.82 0.55
Quadrant 1: Low registration
0.84 0.70
Quadrant 2: Sensation Seeking
0.86 0.86
Quadrant 3: Sensory Sensitivity
0.81 0.72
Quadrant 4: Sensation Avoiding
0.80 0.70
Combined quadrant: Low Threshold
0.80 0.83
Test of Sensory Functions in Infants (TSFI)
Reactivity to Tactile Deep Pressure
0.71
Cronbach alpha scores for internal consistency are not
available in the manual.
Adaptive Motor Functions
0.66
Visual-Tactile Integration
0.63
Ocular-Motor Control
0.70
Reactivity to Vestibular Stimulation
0.66
Total Test scores 0.50

67
For the ITSP (Table 4.9), all the sections and quadrants had a Cronbach alpha
within acceptable ranges of α ≥ 0.70. For the TSFI, three subtests had Cronbach
alpha below acceptable ranges. These were adaptive motor functions (0.66),
visual-tactile integration (0.63), and reactivity to vestibular stimulation (0.66). The
Cronbach alpha for the total test score (TSFI) was also below acceptable ranges
(0.50).
For the scores of the Infant/Toddler Sensory Profile (ITSP), the Cronbach alpha
scores obtained in this study were higher that the scores indicated in the test
manual. This was for all the sections and quadrants except for quadrant 2:
sensation seeking where the score in both cases were the same (0.86), and the
combined quadrant: low threshold where the score in the manual (0.83) is higher
than in this study (0.80).
4.4 SUMMARY
In this chapter, the demographics of the infant participants in this study and their
mothers were presented showing the sex, age and birth history. It was found that
there were slightly more male than female participants. The ages of the
participants ranged from seven to 18 months, and the highest percentage of
infants fell in the age group of 15 to 18 months with a mean age of 13.68 months.
The age of the mothers, at the time of birth, ranged between 20 years and 40
years with a mean age of 29.93 years. The highest percentage of mothers was
between the ages of 25 and 30 years.
The birth history showed that most infants were in the head first birth position
during birth. Unfortunately, there were participants that were unable to give
information regarding birth position. A very high percentage of infants in the
sample were born via caesarean section, with only a small percentage of normal,
vaginal deliveries.
The sensory integration function of the participants was tested using a parent
questionnaire, the Infant/Toddler Sensory Profile (ITSP) and a therapist
observation test, the Test of Sensory Functioning in Infants (TSFI).
The data for both the ITSP and TSFI were compared to the normative data and
typical range. This was done by comparing the means of the raw score data

68
obtained from testing a South African sample. All the section and quadrant scores
for the ITSP were found to be within the lower ranges of the typical performance
ranges, except for the tactile processing section score that was centred in the
typical performance ranges. For the TSFI it was found that the scores for the
subtests of adaptive responses (10 to 12 months), adaptive motor response (13-
18 months), as well as the total test score (10 to 18 months) was below the typical
ranges.
Overall the mean scores and frequency distributions for the South African sample
indicate a higher percentage of participants fell into the definite difference ‘more
than others’ on the ITSP and frequency results of the ITSP showed a significant
difference from what is expected to be a normal distribution on six of the ten
section and quadrant scores. In five of these a higher percentage of participants
fell into the typical range.
Frequency data for the test showed that significantly more infants tested within
definite difference/deficient ranges on the ITSP and the TSFI. For the TSFI, it was
found that there was a significant difference from the normal distribution in all five
the subtests as well as the total test score. For both tests it was noted that the
sections that relate to vestibular processing, had high percentages of infants that
tested within the definite difference/deficient ranges.
The sensitivity, specificity of the two tests was determined based on the frequency
of the results against the expected normal distribution. It was found that, for the
ITSP, there were four sections with sensitivity below 80%. This indicates that
some participants with a problem may be identified as having no dysfunction.
These were the section for oral sensory processing and the quadrants for sensory
sensitivity, sensation avoiding, and combined quadrant of low threshold. In this
study group, if the interpretation criteria are applied to the results, 15% (n = 9) of
infants are identified with problems that need further assessment. For the TSFI, it
was found that there was one subtest, namely adaptive motor functions as well as
the total test score, with very low accuracy and low specificity, which indicates that
participants without a problem may be identified as dysfunctional. Two subtests
had low sensitivity indicating that participants with a problem may be identified as
having no dysfunction. These were the sections for visual-tactile integration and
ocular-motor control. When applying the interpretation criteria to the TSFI tests

69
done on the study population, it was found that 33.3% (n = 20) of infants are
identified as having difficulties that require further assessment.
The correlation scores used to determine the construct validity indicates that there
is no significant correlation between the sections of the two tests. This indicates
divergent validity and that the tests do not measure the same constructs and
cannot be used interchangeably.
Reliability of the ITSP (α = 0.84) was found to be within acceptable ranges, and all
the sections and quadrants also had reliability within acceptable ranges for this
sample. For the TSFI, the overall reliability was below acceptable ranges (α =
0.69). The TSFI subtest scores for adaptive motor functions (α = 0.66), visual-
tactile integration (α = 0.63), and reactivity to vestibular stimulation (α = 0.66) it
was found that reliability was below acceptable ranges. The total test score
reliability (α = 0.50) is low.

70
CHAPTER 5: DISCUSSION
5.1 INTRODUCTION
In this chapter, the demographic information of the total participant group will be
discussed. The results of assessing 60 infants between the ages of seven to 18
months using the Infant/Toddler Sensory Profile (ITSP) and the Test of Sensory
Functions in Infants (TSFI) in the context of this South African sample will be
considered in comparison to the normative data from the test manuals and normal
distribution. The diagnostic accuracy specifically looking at accuracy, specificity,
and sensitivity of the two tests will be discussed. The results from analysing the
construct validity and internal consistency of the two tests will also be discussed.
5.2 DEMOGRAPHICS
During the study, the researcher made use of 17 child day care facilities to recruit
participants. Many more day care centres were approached, but participants could
not be recruited as they did not meet the inclusion criteria in terms of age, or the
facilities were not willing to participate in a research study, or parents did not give
informed consent. Data was collected over a period of 11 months.
The total of 60 infants included in the study, of which 34 are males and 26
females, were amongst the 45.0% of children below the age of five years reported
as attending a pre-school facility in Gauteng (126). The participants’ ages range
between seven months and 18 months with a mean age of 13.68 months. The
smallest group of participants were between the ages of seven months and nine
months, and this is due to the fact that the child day care facilities had fewer
infants in this age group. This is an age group that requires a higher infant to care
giver ratio, and many of the facilities have limited space and resources and
therefore had fewer infants in this age group. The largest percentage of infants in
the study was between the ages of 16 and 18 months (Table 4.1).
The ages of the mothers at the time of the study ranged between 20 years and 40
years with a mean age of 29.93 years. There is a worldwide trend that the age of
mothers giving birth is increasing. A news report published in the Mail online
(2014) reported that the average age of woman giving birth in England and Wales

71
is now 30 years compared to 29.8 in 2012 (127). In the 1970’s, more mothers
were under the age of 25 when giving birth than above the age of 25. In 2006, the
average age of woman giving birth in South Africa was 28.7 years (128). The
average age of the mothers in this study would be close to this range as the mean
age of 29.93 years is calculated at the time of the study when the infants were
between seven and 18 months old, and not the age of mothers at time of birth
(Table 4.1).
Of the infants participating in the study, 95% attended child day care facilities for
the duration of a full day. Child day care facilities that participated in the study
accommodated infants from between 06h00 and 07h00 in the morning until 17h30
to 18h00 in the evening. The high percentage of infants attending full day can
probably be attributed to the fact that day care facilities are specifically used by
working parents to take care of their infants (Table 4.1). This is supported by the
fact that all the child day care facilities are privately run so the participants’ parents
had the financial security to afford these facilities for their infants.
Information regarding birth demographics indicated that 68.3% of participants
assessed in this study were born in the normal head first presentation and 11.7%
were born in breach birth presentation, The breech birth presentation was higher
than reported in the literature (Table 4.2) where Impey and Pandit (129) as well as
Hofmeyr and Gyte (130) indicate an occurrence of 3-4% for full term births.
Moodley et al. (131) reported only a 2.4% incidence of breech births in a district
hospital in South Africa. This question was not completed for 20% of the
participants possibly due to the mothers not understanding the term “birth position”
or the parents being unsure of the birth position.
The mode of birth reported indicates that 21.7% of participants were born via
normal vaginal delivery, and 78.3% were born via caesarean section (Table 4.2) a
rate much higher than the WHO’s suggested acceptable caesarean rate of 10% to
15%. When only looking at the caesarean section, it is seen that 72.3% were
planned caesarean sections and 21.7% were emergency caesarean sections
(Table 4.2).
In South Africa, a very high caesarean rate has been reported in the private health
sector (132), with 72.8% of all the births paid for by the medical scheme being

72
caesarean section. Tshibangu et al. (133) found a steady increase in caesarean
sections over the period between 1998 and 2000. They suggest the high rate of
caesarean sections found in South Africa might be due to either fear for litigation
due to an increase of malpractice cases; maternal requests for caesarean sections
or the HIV status of the patient (133).
The 78.3% of participants born via caesarean section seen in the small sample of
this study was slightly higher than the average for South Africa, which may be
accounted for by the fact that all the parents in this sample were from an urban,
middle to high income setting. Cavallaro et al. (134) also found that there is an
increase in caesarean section rate in urban, higher income setting due to easier
access to medical care, as well as the people’s ability to pay for the cost of the
caesarean section.
The birth weight of participants in the study ranges from 2.2 kg to 4.05 kg, with a
mean of 3.2 kg. Forty percent of the participants had a birth weight between 3.0 kg
and 3.5kg. The mean birth weight reflected in this study is within the ranges
considered as a normal birth weight for full term infants. The normal birth weight,
according to the Atlas of neonatal pathology (135), is a weight between 2.5 kg and
4.0 kg.
The participants in this study were all born at full term (between 37 and 42 weeks
gestation), as per the inclusion and exclusion criteria. They also had no diagnosed
birth defect or gestational illness, as stipulated in the exclusion criteria. There were
also no reports of any major medical difficulties since birth. Due to these inclusion
and exclusion criteria the participants were therefore, considered to be typical
infants.
5.3 ASSESSMENT OF SENSORY INTEGRATIVE TESTS FOR INFANTS FOR THE SOUTH AFRICAN CONTEXT
The first objective of this study was to compare the results of a South African
sample of infants on tests of sensory integration function in infants, namely the
Infant/Toddler Sensory Profile (ITSP) and the Test of Sensory Functions in Infants
(TSFI), to the USA norms for these tests. The participants in South African sample
were full term infants between the ages of seven to 18 months, attending child day
care facilities in the East Rand of Gauteng.

73
It is important to consider two aspects when reviewing standardised tests for other
populations or samples, that is whether the population norms differ significantly
from the norms of the individuals the test was standardised on, due to differences
in the context and culture or whether the test items are not valid for the new
population or sample and need to be changed or rescored for these individuals.
The raw score data obtained from testing the South African sample was therefore
compared to the normative data in the test sample as no “gold standard” is
available to assess sensory integration function in infants. The results for the ITSP
and TSFI were compared to both the normative data found in the test manuals,
and to a normal Gaussian distribution on which the interpretation of these tests is
based.
5.3.1 Infant/Toddler Sensory Profile (ITSP)
According to the ITSP manual, the sensory processing section summary sheet
provides a visual representation of the infant’s sensory processing abilities (40).
For the interpretation of the quadrant scores, the theoretical model of sensory
processing, based on the infant’s neurological thresholds (Figure 2.2) is used.
Different behavioral responses to thresholds are seen. Infants can act passively
(low registration and sensory sensitivity), thus the infant responds in accordance
with their threshold, or infants can act actively (sensory seeking and sensation
avoiding), thus their response is counteracting the threshold. Tendencies to
respond are influenced by genetics, environmental demands, task, and
experience.
There is interaction between the continua, and it is important to remember that
every infant has some of each of these responsiveness characteristics. They can,
therefore, have sensation seeking for touch and sensory sensitivity for sound.
Although one quadrant may appear to dominate, the other patterns of
responsiveness can still be present.
It is also important to remember that when an infant/toddler has behaviors
consistent with one of the quadrants, that on its own does not provide a reason to
conclude that the infant/toddler is dysfunctional. When an infant has performance
difficulties in activities of daily living, behavior consistent with the quadrants can

74
help to identify reasons for their behavior and also help to find ways to address the
problem (40).
The raw scores for the South African sample were compared to the means in the
ITSP manual. In the ITSP manual (40), the mean and standard deviation scores
are given in age bands of seven to 12 months and 13 to 18 months. Infants from
the South African sample were also divided into these age groups in order to
compare the data.
When reviewing the results for the six processing sections of the ITSP the
comparison of the raw scores obtained from testing the South African sample in
five of the six processing sections the mean scores for this sample were in the
lower ranges of the typical performance range for the normative data found on the
ITSP score sheet. Only the score for the tactile processing section were centred in
the typical performance range (Figure 4.1). For the quadrant scores, it was found
that the mean raw scores from all the quadrants were in the lower ranges of the
typical performance range (Figure 4.2).
It was necessary to determine therefore how important these differences were
clinically in terms of interpreting dysfunction in infants in South Africa. It was
therefore also necessary to determine if these differences indicated a probable or
definite difference. This was achieved by calculating effect sizes between the
South African and USA means as well as comparing the South African data to
normal Gaussian curves.
Effect sizes (d, Cohen) (136) were then calculated to confirm the standardised
differences between the South African sample and the USA norms which are
independent of the sample sizes used. The magnitude of d was explored to
determine if the norms in the manual, from the USA standardisation group, provide
an adequate measure of performance on the South African test population. Effect
size (d) can be described as small (d ≤ 0.2), medium (d = 0.5) or large (d = 0.8)
(136).
An effect size of d ≤ 0.2 is considered to be clinically insignificant as the groups
overlap by 85.2%. It is suggested that even an effect size of d = 0.4 can be
considered as small as the overlap between the groups is more than 70% this can
be accepted and thus does not require separate norms for interpretation. This was

75
supported in a study on the use of the SIPT on the South African population. Van
Jaarsveld et al. indicated that an effect size of d ≤ 0.4 was acceptable whereas
effect size d > 0.4 presents challenges in terms of interpretation of results (24)
The positive effect sizes of the South African sample mean that scores were all
lower than those of the American sample. Relative to the American sample the
South African sample tends towards the “more than others” scores on the
Infant/Toddler sensory profile.
Looking at the effect sizes for the section and quadrant scores on the ITSP (Table
4.3), it was found that in the younger age group (seven to 12 months), scores on
only one of the six sections showed a medium effect size of above 0.4 (Table 4.3).
This was for oral sensory processing (0.76). One quadrant, quadrant 2: sensation
seeking (0.58) also showed a medium effect size.
The same results were found for the older age group (13 to 18 months), where the
scores for the oral sensory processing section (0.75) and quadrant 2: sensation
seeking (0.65) both also had medium effect sizes (Table 4.4).
Looking at the medium effect size in the oral processing section, the norms
reported by Dunn in the ITSP manual (40) fall into the probable difference ‘less
than others’ range, while the means for the sample in this study fall into the typical
range which accounts for the difference found.
For quadrant 2: sensation seeking it was clear that while the means reported by
Dunn fall on the upper limit of typical the mean for the sample in this study fell in
the lower end of the typical range. This accounts for the difference which may
need to be considered when assessing infants in the South African context.
If we consider that effect size d > 0.4 presents challenges in terms of interpretation
of results (24), the results of this study found that in most sections and quadrants,
in both age groups, the effect sizes were below 0.4 (Table 4.3 and Table 4.4)
indicating the assessment can be used with children in the South African sample
with little concern as there is less than half a standard deviation between the
means.
Mean scores cannot be considered ideal on the type of ordinal data obtained on
the ITSP and therefore the frequency distribution of the scores was determined

76
and the results were considered based on the Gaussian curve as suggested in the
test manual. A significant difference was found for five of the nine quadrants and
sections when compared to the expected normal distribution (Table 4.5). For
infants aged seven months to 36 months, scores are classified as ‘Typical
performance’ with scores between +1 SD and –1 SD from the mean. Scores on
the left of the graphs between -1 SD to -2 SD ranges, are described as probable
difference “more than others”, indicating over responsiveness. Scores on the right
of the graphs within +1 SD to +2 SD ranges, are described as probable difference
“less than others”, indicating under responsiveness. Scores on the left of the
graph, below -2 SD are described as definite difference “more than others”
indicating severe over responsiveness and scores on the right of the graph, higher
than +2 SD are described as definite difference “less than others”, indicating
severe under responsiveness (40). All the differences in the section and quadrant
scores will now be discussed:
The Vestibular processing section showed the greatest deviation from the normal
expected values (Table 4.5 and Figure 4.5). Frequency results for this section that
test the infant’s ability to process movement inputs and the infant’s response to
movement (40) indicated that less participants than expected, in this study, tested
in the typical performance range (56.7%). The percentage of participants with a
probable difference range (28.3%) tested very close to the 27.2% expected range
when the sections for probable difference “more than others” and probable
difference “less than others” are combined. The definite difference range
(combined frequency for “more than others” and “less than others”) for vestibular
processing was 15.0% which significantly exceeds the expected 4.2%. All of the
participants tested within the definite difference “more than others” range and
could be considered as over-responsive to vestibular input and movement. Since,
for this section of the ITSP the sensitivity, specificity, and accuracy were within
acceptable limits (Table 4.7a), it can therefore be assumed that it is the
participants themselves in this sample that present with a difference in vestibular
processing when compared to the USA norms. This was confirmed by a
misclassification rate of 5.8%. This aspect therefore needs to be further
researched as the norms for this section did not indicate a large effect size when
the means of raw scores were compared.
77
These findings indicate that the vestibular processing results on the ITSP should
be interpreted with caution in the South African context.
In two other sections a significant difference was found between the expected and
actual frequency, as more participants (6.7%) tested within the definite difference
range when the definite difference “more than others” and definite difference “less
than others” were combined (Table 4.5). These were the auditory and tactile,
processing sections (Figure 4.6). For both these sections it was found that the
percentage of participants that tested in the typical range (73.3%) was higher than
the expected 68.2%. Since the diagnostic accuracy was within acceptable limits
(Table 4.7a), it can be assumed that the slightly higher percentage of participants
in this sample who had a problem with auditory and tactile processing means that
the scoring and items for this section of the test are suitable for use on the South
African sample. It was found that all the participants tested within the definite
difference “more than others” range, which indicated that they have dysfunctional
over-responsiveness compared to their peers (54).
Difficulties with oral sensory processing can lead to feeding problems, as it is
found that children with these difficulties often have a diet with limited variety as
they avoid food with certain textures (14) (63). Although the results for the oral
sensory processing section, which tests the infant’s ability to process sensations
within the mouth and the infant’s response to taste, touch, and smell stimuli to the
mouth (40), were similar to those for auditory and vestibular processing (Table 4.5
and Figure 4.6), the specificity for this section of the test was not within acceptable
levels (Table 4.7a). Thus, as discussed in 5.4.1 some of the participants with
dysfunction may not have been identified as having difficulties. The means for the
oral sensory processing section, as indicated in the ITSP test manual, also fall into
an atypical range so there may be some problem with the test items themselves
for this section.
For the last section of the ITSP visual processing, which tests the infant’s ability to
process visual inputs or ability to react to things seen (40), no significant difference
from the expected distribution of scores was found. The number of participants
that fell within the typical range (63.3%) was lower than the expected range
(68.2%). This was due to a higher than expected number of participants (35.0%)
that scored within the probable differences “more than others” range (Table 4.5

78
and Figure 4.3). This indicates that the infants in the South African sample were
over responsive to visual input when compared to the USA norms. These
participants would only be at risk for visual processing problems but show no
definite dysfunction as the sensitivity, specificity, and accuracy for this section was
within acceptable limits (Table 4.7a).
Significant differences between the expected frequencies on the normal
distribution and those found differed for the quadrant scores except for quadrant 2:
sensation seeking and quadrant 3: sensory sensitivity.
The scores for quadrant 1 refer to low registration which assesses the infant’s
awareness of all types of sensation available (40). Low registration indicates that
the infant registers less sensory input, and this can lead to an infant appearing
overly lethargic and inattentive (86). In this quadrant, a significant difference was
found between the expected and observed frequency for the definite difference
range (13.3%), where all the participants fell into the definite difference “more than
others” range as scores cannot be obtained in the definite difference “less than
other” range for this quadrant. Fewer participants (66.7%) fell into the typical range
than the expected 68.2% (Table 4.5 and Figure 4.7). Since the sensitivity,
specificity, and accuracy for this quadrant (Table 4.7a) was within acceptable
limits, it can be assumed that participants themselves in this sample showed
slightly more dysfunction with low registration and this aspect should be
researched further for a South African population or sample.
According to Dunn’s theoretical model of sensory processing (40) infants that
present with dysfunction in quadrant 1: low registration can appear uninterested
with a flat or a dull affect. This is due to the brain not getting what it needs to
generate responses, and this leads to the apathetic, self-absorbed appearance.
Within the context of the infants being in child day care facilities, it is worrying that
more infants test with a definite difference within quadrant 1. These infants will
appear quiet, and the caregivers might therefore interpret this as the infants being
content and not needing attention. This might result in the infants receiving less
stimulation, when in fact they need more stimulation. Dunn suggests that
intervention planning for infants in quadrant 1 should focus on enhancing task
features and contextual cues by increasing the contrast of stimuli or by decreasing
the predictability of routine (40). In the setting of the child day care facility, the

79
infants are constantly exposed to a set routine, and this will therefore not help the
infant to overcome these deficits.
There was no significant difference in the expected frequencies of participants with
probable and definite differences for quadrant 2: sensory seeking, although
slightly more participants tested within the probable difference range (31.7%) than
expected (27.2%) for the normal distribution, when the probable difference “more
than others” and probable difference “less than others” scores where combined
(Table 4.5 and Figure 4.4), probably because there is no definite difference “more
than others” for this quadrant. In this quadrant, sensory seeking specifically
measures the infant’s interest in and pleasure with all types of sensation (40) and
indicates that the infant will seek more sensory input, leading to the infant
appearing overly excitable or hyperactive (86). The sensitivity, specificity, and
accuracy were within acceptable limits (Table 4.7a), and therefore the distribution
of the scores for participants in this quadrant can be accepted as typical.
In quadrant 3: sensory sensitivity, which indicates that the infant is more sensitive
to sensory input and will often display avoiding behaviours (86) and specifically
measures the infant’s ability to notice all types of sensations (40). In this quadrant,
only a slightly higher than expected percentage of participants tested within a
definite difference “more than others” category (5.0%) for the normal distribution
(Table 4.5 and Figure 4.7). Again in this quadrant, scores cannot fall into the
definite difference “less than others” ranges. These participants were, therefore,
over-responsive and noticed more sensations than their peers. In this quadrant it
was also found that more infants tested in the typical range (76.7%) than the
expected 68.2% (Table 4.5 and Figure 4.7). According to Dunn’s theoretical model
of sensory processing (40) (86), it can be hypothesised that infants with sensory
sensitivity have over-reactive neural systems, and they are therefore aware of
every sensory stimulus around them. They are unable to habituate to input. Infants
testing in quadrant 3 should be provided with sensory experiences that support
them to continue tasks and to minimise the chances for the threshold to be fired
repeatedly. The specificity and accuracy for quadrant 3: sensory sensitivity were
within acceptable limits, but the low sensitivity (Table 4.7a) means that participants
may not be identified as having difficulties as the test under identified dysfunction.

80
This is supported by the results with a higher number (76.7%) of participants
testing in the typical range (Table 4.5 and Figure 4.7).
A significant difference from the normal distribution and an unacceptable low level
of sensitivity was also found for quadrant 4: sensation avoiding as well as the
combined quadrant: low threshold indicating the test may be under identifying
participants with difficulties in these quadrants (Table 4.7a) in the South African
sample. Both the quadrants had more infants test in the typical range than the
expected 68.2%. In quadrant 4: sensation avoiding the results for the typical range
was 75.0% and for the combined quadrant: low registration it was 81.7% (Table
4.5 and Figure 4.7). Even so, there was a significant difference from the expected
frequencies on a normal distribution with a higher percentage of participants
(8.3%) testing with a definite difference in the “more than other” category on both
quadrants (Table 4.5 and Figure 4.7). In both quadrants 4 and the combined
quadrant scores cannot fall into the definite difference “less than others” range.
Quadrant 4: sensation avoiding relates to an infant avoiding contact with
sensations as they overwhelm their systems. Quadrant 4 specifically measures
the infant’s need for controlling the amount and type of sensations available to
them (40). The combined quadrant: low threshold indicates that neurons trigger
more often and thus cause more frequent reactions to stimuli in the environment
(86). For quadrant 4, the researcher did not identify any questions that may have
affected the results.
The combined quadrant: low threshold is a score obtained from the combined
scores of quadrant 3 and quadrant 4. It is relevant to aspects of poor sensory
processing (40) and infants who react to stimuli whether they are important or not.
According to Dunn’s theoretical model of sensory processing (40) (86), it can be
hypothesised that infants with sensory avoiding (quadrant 4), might display very
disruptive behaviours as meeting their thresholds are uncomfortable and
frightening. They might engage in emotional outburst in order to get out of
situations that they find threatening. They might be perceived as being stubborn or
controlling as they often create rituals for behaviour as it allows for familiar
patterns of input. In intervention with infants in quadrant 4, the infant’s need to
avoid sensations should be honoured and opportunities for the infant to
experience new sensations should be planned very carefully.
81
According to Dunn, the score for the combined quadrant of low threshold can only
be taken into account if both the quadrant 3 (sensory sensitivity) and the quadrant
4 (sensory avoiding) scores are outside the typical performance range (40).
In summary significant differences from the normal distribution were seen in three
of the six section scores and two of the four quadrants scores as well as the
scores for the combined quadrant. Those of greatest concern are the section for
visual and vestibular processing and quadrant 1: low registration where the typical
scores were significantly lower than expected. The vestibular processing section
and quadrant 1: low registration had a much higher percentage of participants in
the definite difference category while vestibular and visual processing sections
had a high percentage of participants in the probable difference category. The
vestibular processing section was the most divergent and results from this section
should be considered with care in the South African sample.
Therefore these are the sections and quadrants of the test that should be of
concern and probably need to be further researched on a South African
population.
5.3.2 Test of Sensory Function in Infants (TSFI)
When scoring the TSFI the scoring procedure as set out in the test manual (9)
requires the test user to add the scores of each subtest after administration as well
as to calculate the Total Test score, by adding the totals of all the subtests
together. The subtest scores and total score are then transferred onto the Profile
form and this categorised the score into ranges of:
• Normal. Scores above -1 SD.
• At risk. Scores below -1 SD but above -2 SD.
• Deficient. Scores below -2 SD.
According to the test developer, if an infant obtains scores below the cut off scores
for the ‘normal’ range on the total test score, it is indicative of potential problems.
These can be considered to be suspect or even abnormal sensory reactivity and
processing. If together with this an infant also has delays in cognitive or motor
skills, they should be referred to an occupational therapist to determine if
intervention is needed. It is also recommended that infants with ‘deficient’ scores

82
on the total test score or particular subtest scores, should be monitored throughout
their preschool years for deficits in other areas of sensory integration such as
motor planning, visual-motor skills or bilateral motor coordination (9).
Firstly the raw scores obtained from testing the South African sample were
compared to the normative data found on the TSFI score sheet (Figure 4.9). Since
no mean scores have been published except those for dysfunctional infants (101),
for the TSFI the means of this study were compared to the normal score ranges
from the TSFI manual (9). It was found that five of the sections as well as the total
test score (seven to nine months) were in the lower ranges of the typical
performance range. These sections were reactivity to tactile deep pressure (seven
to 18 months), adaptive motor functions (seven to nine months), visual tactile
integration (seven to 18 months), ocular-motor control (seven to 18 months), and
reactivity to vestibular stimulation (seven to 12 months). The scores for three
sections namely, adaptive motor functions (10 to 12 months), adaptive motor
functions (13 to 18 months), reactivity to vestibular stimulation (13 to 18 months),
as well as the total test score (eight to 18 months) were below the normal range
(Figure 4.9).
Due to a lack of published mean scores for the population the TSFI was
developed on, the researcher was unable to calculate the effect sizes (d, Cohen)
(136) for the raw score data. Calculation of d requires means and standard
deviations and this was not available.
When looking at the frequency results for the TSFI compared to the normal
distribution, a significant difference for all five subtests as well as the total test
score from the expected normal distribution (Table 4.6) is seen. The differences in
the subtest and total test scores will now be discussed.
In the reactivity to tactile deep pressure subtest, which refers to the infants ability
to react to deep pressure applied to the arms, hands, stomach, soles of the feet,
mouth, and total body when held at the shoulder (9), a significant difference is
noted (Table 4.6 and Figure 4.12). More infants were found to be in the deficient
ranges (16.7%) than the expected 4.2%. There were also more participants that
tested in the normal ranges (73.3%). The accuracy, sensitivity and specificity for
this subtest were within normal ranges. According to the information used for

83
interpretation of the test scores, an infant with scores that fall in the deficient
ranges should be considered to be tactile defensive (9).
Percentages in the adaptive motor functions subtest, which reflects the infant’s
ability to initiate and motor plan exploratory movements when handling textured
toys (9), were significantly higher than expected with 53.3% of participants that
tested within the deficient range (Table 4.6 and Figure 4.11). The accuracy and
specificity of this subtest was found to be below acceptable levels indicating
infants without deficits may be identified with deficits and (Table 4.7b), this will be
discussed in 5.4.2.
According to the information used for interpretation of the test scores, infants with
poor adaptive motor functions should be further tested for abnormal neuro-motor
functions and delayed motor skills (9). When all the results of this subtest are
reviewed, the researcher feels that the high number of infants testing in the
deficient range in this case was probably due to the criteria for the scoring on the
test item which means this may not be a true reflection of the functions of the test
population.
In the results for the visual-tactile integration subtest, there appears to be a slight
move towards the deficient range in the test which affects the frequency data for
this subtest. A significantly higher percentage of participants (8.3%) testing within
the deficient range as well as in the normal range (80.0%), when compared to the
normal distribution (Table 4.6 and Figure 4.12). This subtest assesses the infant’s
ability to tolerate and visually orientate to tactile input (9). For this subtest, the
accuracy and specificity of the test was found to be within acceptable ranges, but
the sensitivity (63.2%) was lower than the acceptable range (Table 4.7b) indicating
that the test may identify children with a deficit when there is none.
In the ocular-motor control subtest, again significant differences from the normal
distribution were seen (Table 4.6 and Figure 4.12). More infants (83.3%) tested in
the normal range than the expected 68.2%. This subtest, according to the manual
(9), tests lateralization of the eyes as well as visual tracking. This is not an area
treated by occupational therapists and infants with problems in this area should
therefore be referred to a developmental optometrist or ophthalmologist. The
sensitivity of this test (Table 4.7b) was found to be well below acceptable levels

84
indicating infants with this deficit may be underdiagnosed which in this case was
related to problems with the test items rather than the infant’s response.
In the reactivity to vestibular stimulation subtest, a significant difference was also
found with a higher percentage (36.3%) of participants testing within the deficient
range than the expected 4.2% for the normal distribution (Table 4.6 and Figure
4.10). There were also fewer participants (51.7%) that tested in the normal ranges.
This subtest assesses the infant’s reaction to different movements. During testing,
participants are moved in a vertical plane (up and down), circular motion (to right
and to left) as well as inverted (prone and supine). The occurrence of nystagmus
is also noted after the circular movement. According to the interpretation
information in the manual, an infant with a deficient score may be considered
posturally insecure and should be referred to an occupational therapist for further
testing of the neuro-motor functions and other vestibular based functions (9). This
subtest had specificity below acceptable levels. This again indicates that infants
may be found to have deficiencies when there were none, a finding that was true
for the total test score as well.
The total test score is derived from adding up the totals of all the subtests (9). For
the total test score again a significant difference is found from the normal
distribution. It was found that there were fewer participants (41.7%) in the normal
ranges and more participants in the deficient range (38.3%) than what would be
expected (Table 4.6 and Figure 4.13). In summary the TSFI showed significant
differences for all sub tests from the expected normal with the adaptive motor
functions subtest, the reactivity to vestibular stimulation subtest and the total score
having significantly less participants than expected in the typical category and
significantly more than expected in the deficient category. For this test this
appears to be related to both differing function in the participants and items on the
test that affect the scores they obtained. When using the test results to determine
if an infant requires intervention the researcher used the interpretation information
as described in the TSFI manual (pp. 16 to 21) (9). The principles used in the
example were followed where the infant tested within deficient ranges on the total
test score as well as three sections scores. In this South African sample, 33.3% of
the infants tested with the TSFI would according to the results need to be referred
for further testing and intervention. However, due to problems with the sensitivity,

85
specificity and accuracy of the test, this is inaccurate as the test was found to over
identify problems in this sample. In order to use the TSFI with accuracy in a South
African sample, the subtests need to be standardised on the population.
Although more participants than expected scored in the deficient category in the
reactivity to tactile deep pressure subtest this subtest accuracy results show that it
is acceptable for use with this sample.
5.4 DIAGNOSTIC ACCURACY OF TESTS
The second objective of this study was to determine the diagnostic accuracy of
tests for sensory integration function on a sample of South African infants between
seven and 18 months. The researcher made use of two tests, namely the
Infant/Toddler Sensory Profile (ITSP), and the Test of Sensory Functions in Infants
(TSFI) as limited information on the discriminative indexes of these tests is
available.
Since these tests are used clinically to assess infants as well as for research
purposes in South Africa (41) (42) (43), it was important to take a critical look at
the tests to determine the diagnostic accuracy for their use in this context. Many
researchers like Anastasi & Urbina (25), Downing (26), as well as Steiner &
Norman (27) have established that it is important for independent investigators to
complete studies in different contexts and gather psychometric data regarding
standardised tests to ensure their validity, to compliment the studies completed by
the test authors.
This is because assessment is one of the most fundamental, but complex steps in
the occupational therapy process which forms the basis for planning the type and
intensity of the intervention required (93). As assessment is so fundamental, it is
very important for the tests used to have acceptable diagnostic accuracy, and the
complex psychometric properties of the tests should therefore be examined. Some
aspects of the psychometric properties, namely the accuracy, sensitivity, and
specificity of the ITSP (40) and the TSFI (9) were established for the South African
sample against the expected normal distribution of scores for typical
performance/normal, probable difference/at risk, and definite difference/deficient
categories.

86
In a number of sections and subtests on both tests, the frequency of participants
scoring definite and probable differences was higher than expected. It was
necessary to consider if the results found were due to accuracy, sensitivity or
specificity of the test for this sample or the presence of dysfunction in the
participants.
5.4.1 Infant/Toddler Sensory Profile (ITSP)
While the accuracy scores for the ITSP were within the acceptable level of 80% as
determined by McCauley & Swisher (137), one section and three quadrants
showed sensitivity below the acceptable level (Table 4.7a). It is possible,
therefore, that this test may under identify sensory integration dysfunction in
infants for oral sensory processing (73.7%), quadrant 3: sensory sensitivity
(73.7%), quadrant 4: sensation avoiding (78.9%), and the combined quadrant: low
threshold (57.9%). This occurred due to the greater than expected percentage of
participants who scored in the typical category for these sections and quadrants
and therefore according to the USA norms infants displaying atypical behaviour
associated with this section and quadrants might not be identified as having
problems.
For quadrant 3: sensory sensitivity the scores were not statistically significantly
different from the expected normal distribution. The misclassification rates for for
oral sensory processing and all three quadrants were from 3% - 7% which means
this is the percentage in the group of those with a problem that may be missed.
The miscalculation may be related to the questions on the ITSP and for the oral
sensory processing section, the low sensitivity may be related to the test questions
answered by the parents for this section. For this section, the researcher identified
two of the questions that might have been difficult for the parents of the infants
between seven to 12 months to answer, and this may have affected the results.
These were:
• “My child resists having teeth brushed.”
• “My child refuses to drink from a cup” (138).
Developmentally, the skill of drinking from a cup does not fully develop until the
age of 12 months (139), and teeth emergence in infants vary widely, with the first

87
teeth sometimes emerging before the age of four months, but sometimes as late
as 12 months (140). If the infant has not yet teethed or cannot yet drink from a
cup, the question will be very difficult to answer and might skew the results of this
section of the test.
For quadrant 3: sensory sensitivity, the low sensitivity may have been related to
one question of the 12 questions included in this quadrant, that might have been
difficult for the parents of the infants between seven to 11 or 12 months to answer
and this may have affected the results. The question was:
• “My child bumps into things, seeming to not notice objects in the
way” (138).
This question will be difficult to answer if the infant has not yet started crawling, a
skill that emerges roughly at age nine months depending on the infant (141).
Another section that had a high misclassification rate indicating over identification
of dysfunction by the test was vestibular processing with a 5.8% misclassification
rate and due to this section having lower specificity (82.9%) than sensitivity
(100%) although both were in acceptable limits, it indicates that it will over identify
6% of infants of those with no problems as dysfunctional, based on USA norms.
Based on these results on the ITSP in the context of this South African sample,
the difference in the functioning seen in the participants when compared to infants
in the USA were in acceptable limits for most sections and quadrants. Even so,
only the sensitivity was below the acceptable 80% for one section and three
quadrants. The ITSP can be considered valid in terms of accuracy and specificity
for this sample but it is clear that the scores for these sections and quadrants need
to be interpreted with care clinically if a small percentage of infants are not to be
underdiagnosed on one section and three quadrants which under identified SID
for the small sample.
Although extensive research has been done on the ITSP by the author and
independent researchers (54) (86) (96) (97) (98), and the test has been found to
be a valid tool to use in this South African context, therapists need to be aware of
discrepancies in the psychometric properties and that like the SIPT the ITSP may
result in under diagnosing of SID (24).

88
5.4.2 Test of Sensory Functions in Infants (TSFI)
For the TSFI it was found that only one subtest, namely reactivity to tactile deep
pressure had no problems with accuracy, sensitivity and specificity (Table 4.7b).
The misclassification rate was also low at 2.5% (Table 4.7b). As the sensitivity is
lower than the specificity, it indicates that misclassifications were due to under
identification of problems but within acceptable limits of two to three infants in 100.
The subtests of visual-tactile integration (63.2%) and ocular-motor control (52.6%)
both had sensitivity below acceptable ranges (Table 4.7b) and the subtest of
visual tactile integration had a misclassification rate of 5.8% (Table 4.7b). Thus
approximately 6% of infants with dysfunction may go unrecognised and be
misclassified as the low sensitivity indicated that the test is under identifying
infants with problems. This is supported by the frequency scores (Table 4.6 and
Figure 4.12) that indicated a high number of infants (80.0%) testing in the ‘normal’
range.
The scoring criteria for items 6b to 10b on the test were found to be a problem
which affected the sensitivity and misclassification rate as very few infants did not
respond to the object presented even though the researcher presenting it was a
stranger (141).
0 = Hyper-reactive response: This is when the infant shows panic, expresses
severe discomfort or cries.
1 = Hypo-reactive response: This is when the infant does not appear to
notice the specific object used in that item on their body.
2 = Normal response: This is when the infant tolerates and notices the
specific object (9).
In the ocular-motor control subtest, the even lower sensitivity also indicated the
test was under identifying infants with a problem based on the expected frequency
of dysfunction. This finding is supported by the frequency scores where a
significantly higher than expected percentage (83.3%) of infants were found in the
‘normal’ range (Table 4.6 and Figure 4.12). This subtest reflects the infant’s ability
to control eye movements with only two items being tested - whether an infant
notices an object being moved in their peripheral visual field as well as their

89
tracking of a moving object. It is possible that these two items do not allow enough
information to accurately discriminate problems with ocular-motor control although
for this section the misclassification rate (Table 4.7b) was much lower at 7.5%.
The subtest reactivity to vestibular stimulation (75.6%) had a specificity score
below an acceptable range, while the subtest of adaptive motor functions (39.0%)
and the total test score (61.0%) showed specificity as well as accuracy below
acceptable ranges (Table 4.7b).
The subtest of adaptive motor functions had the lowest specificity in the TSFI with
a misclassification rate of 20.8% indicating approximately 12 infants in the study
group without dysfunction would be identified with dysfunction. This indicates that
this subtest is over identifying problems in infants who do not have difficulties. This
is supported by the frequency scores (Table 4.6 and Figure 4.11) where more
infants were found to have scores in the deficient range (53.3%).
In this subtest, the scoring criteria for items 6a to 10a on the test were found to
affect the specificity, accuracy and misclassification rate of the test. For these
items, the scoring is as follows:
0 = No response: The infant does not notice the object placed on them
(adhesive tape on dorsum of hand, furry mitt on foot, rubber squeak toy on
stomach, paper on face, yarn bound loosely around both hands in midline),
and makes no attempt to remove it.
1 = Disorganised response: The infant show flailing disorganised movements
in reaction to objects placed on them.
2 = Partial response: There is an attempt to remove the object, but the infant
fails.
3 = Organised response: The infant easily removes the object from their
body parts (9).
During testing, the researcher observed varied reactions from the infants and
found that the younger infants (7 to 9 months) found motor reactions required to
especially remove the sticky tape from their hand and furry mitt from their foot very
difficult. This might be due to the infants not having developed these skills yet or
not have been exposed to similar situations, and therefore they do not know how

90
to react. A lot of the infants looked confused by the items and did not know how to
react, although they were encouraged by the researcher to remove the objects. It
is also felt that learned responses might have an influence on the scoring of this
test as it is unknown to what extend the infants are taught to leave clothing items
alone and not to remove them. The researcher feels this influenced the infant’s
responses resulting in the high identification of problems.
The low specificity for the reactivity to vestibular stimulation also indicates a
possible over identification of vestibular problems in the TSFI. The
misclassification rate (Table 4.7b) indicated that 8.3% of infants tested in the
group without dysfunction were over identified. This is supported by the frequency
scores (Table 4.6 and Figure 4.10) where significantly more infants tested in the
deficient range (38.3%). Some cognisance must be taken here of the high
percentage of participants with vestibular processing problems on the ITSP and
this result lends credence to the need to further investigate the vestibular norms
for this South African sample, even though the reactivity to vestibular stimulation
and vestibular processing subtests show no correlation.
The low specificity and accuracy rates for the total test were influenced by the
results on the subtest of adaptive motor functions and indicated that the total test
score was over identifying infants as having problems. The total test score is
calculated by adding the scores for all the subtests, therefore this score is affected
by the diagnostic accuracy of the subtests. As there were problems with the
diagnostic accuracy of all the subtests, the diagnostic accuracy of the total test
score cannot be expected to be within acceptable limits.
The misclassification rate indicated that approximately 13% of infants with no
dysfunction will be misclassified as having a problem (Table 4.7b). This is
supported by the frequency scores (Table 4.6 and Figure 4.13) where more infants
fell in the ‘deficient’ range (38.3%) and fewer in the ‘normal’ range (41.7%).
The finding that the TSFI over identifies children as having problems is supported
by the test developers DeGangi and Greenspan (37) who have recommended
further testing on the reliability and validity of the test. They report that the test is
better for normal infants between four to 10 months and sensory defensiveness in

91
older infants. This was not found for this study as the younger infants were those
who could not remove the items in the subtest of adaptive motor functions.
A discriminative index showing false normal results of between 14% and 45% is
contrary to the findings of this study where the false delayed percentage was
much higher at 4.1% to 38.1% above the expected deficient ranges. The reported
false delay rate is 7%-19% (9) (142).
Jirikowic et al. (101) who researched the test-retest reliability as well as the
reliability of the TSFI on dysfunctional infants also found the reliability of the
subtests to be low, therefore recommending that the results from the TSFI should
be interpreted with caution and should be supported by clinical reports. These
findings are supported by this study where the accuracy, sensitivity, specificity and
misclassification rate of the TFSI cannot be considered acceptable for this small
sample. The results indicate problems with the construction and scoring of the
test, so the sensory integration difficulties within the sample have not been clearly
identified.
5.5 CONSTRUCT VALIDITY AND INTERNAL CONSISTENCY OF TESTS FOR SENSORY INTEGRATION FUNCTION IN INFANTS.
The third objective of the study was to establish the construct validity as well as
the internal consistency ITSP and TSFI.
5.5.1 Construct validity
The construct validity of the ITSP and the TSFI was assessed to establish whether
the two tests, which both assess sensory function, measure the same or different
characteristics. This was done as the manuals for both tests state that they test
sensory processing (9 p. 1) (45 p. 1) but not necessarily whether it is the
reception, transduction and interpretation of a stimulus (19). One method of
demonstrating construct validity is to determine if a test is convergent or divergent
with another test measuring the same or a different construct. Assessment of
convergent validity involves theoretically derived comparisons (111). Convergent
validity refers to the degree, two different measures designed to measure the
same underlying trait, consistently measure the same trait (111) (112). Therefore,

92
if there is a high correlation between the scores obtained by the two measures, it
indicates convergent validity. Divergence, also known as discriminant validity,
refers to the principle that tests that are designed to measure different traits should
be unrelated (111).
The principle of construct validity was tested for the sections, quadrants, and
subtests of the ITSP and TSFI (Table 4.9). There was however no significant
correlations between the sections and quadrant scores obtained on the ITSP and
the subtest/total test score obtained by the TSFI. There was only a weak
correlation (r = 0.35) between the combined quadrant score of low threshold
(ITSP) and the subtest score of adaptive motor functions (TSFI). Since this subtest
and quadrant both had some indication of either sensitivity or specificity problems
and were significantly different from the expected norms this association has been
disregarded. The correlation however, is also too low to account for the variability
in the test items to be considered as measuring the same constructs. It can
therefore be concluded that although the test manuals indicate that both tests
assess sensory processing, the construct validity indicates divergent validity and
they are not measuring the same areas of sensory processing.
The Sensory Rating Scale (12), another test of infants’ sensory processing has
been correlated with 28 items on the ITSP (five items had a correlation above
0.50). There was a low correlation between items related to sensation seeking
(ITSP) and this suggests that this is an area that can be considered unique to the
ITSP. The researcher is currently unaware of any other studies that looked at the
convergent validity of the ITSP and the TSFI. The results of this study confirmed
that for this sample the ITSP and the TSFI measures different constructs of
sensory processing, modulation and discrimination, although from the description
in the manuals this is not clear.
5.5.2 Internal Consistency
Internal consistency refers to the extent to which all items in a test work together
to create a homogeneous test that measures a specific construct (95) (143).
Evaluating the internal consistency of a test is important as it indicates the validity
of the test and to ensure reliability, it is important to determine the internal
consistency before a test can be used for assessment and/or research purposes

93
(144). Investigators should not rely on alpha estimates as published in the manual,
but should measure Cronbach’s alpha each time the test is researched on a
different sample (144). Acceptable ranges for Cronbach’s alpha differ in the
literature, but according to Nunnaly (145), α ≥ 0.7 is acceptable.
Using the data compared to the normal distribution, the Cronbach’s alpha for the
ITSP was calculated to be 0.84. The Cronbach’s alpha for the sensory processing
sections and quadrants ranged from 0.80 to 0.86 in this sample. This indicates
that the ITSP has good internal consistency when used on a South African
sample. Looking at the reliability of the section and quadrant scores for the ITSP
(Table 4.9), it was found that Cronbach’s alphas were all above acceptable levels
and found to be better than those reported by Dunn (40) found from 0.43 to 0.86.
The Cronbach alpha for quadrant 2: sensation seeking was the same as that
reported by Dunn and was lower in the South African sample for the combined
quadrant: low threshold.
The internal consistency of the TSFI was moderate and was calculated as 0.69 for
the total test (Table 4.9) and the Cronbach’s alpha scores for the subtests ranged
from 0.50 to 0.71 with three subtests and the total test score obtaining scores
below the acceptable rate of 0.70 (145). Unfortunately there are no Cronbach’s
alpha scores for internal consistency available in the test manual, and the scores
from the South African sample could therefore not be compared to the USA
sample used for standardisation. In the study done by Eeles et al. in 2013 (95)
they also commented that no reliability studies on the internal consistency of the
TSFI have been conducted (95).
Currently, no study can be found where the TSFI was standardised on the South
African population or where scores on a South African population is compared to
the results obtained on the original population used to standardise the test.
5.6 OTHER VARIABLES AFFECTION THE USE OF THE STANDARDISED TESTS IN SOUTH AFRICA
Another variable that affects the use the ITSP for assessment is that of it being a
parent report questionnaire. In this study the parents of the participants all spoke
English as a first or second language so this did not affect their ability to complete
the questionnaire as indicated by the high internal consistency scores.
94
Research has shown that using parent report questionnaires as part of
assessment can have various advantages and disadvantages. Some of these
advantages are that it has consistently been shown that the use of parent reports
on the child’s current skills or deficits can be seen as a source of information that
is sensitive, reliable, and valid (105) (106) (107). Results from this study also
showed that most sections and quadrants of the ITSP had acceptable internal
consistency when used with the South African parents, and this parent report can
be used for assessment. Involving the parent and using their perceptions is used
as part of a client centred approach that is advocated by occupational therapists
(21) (105). It is time efficient and can possibly be more accurate than the use of
some standardised tests (108). It can also provide qualitative, accurate
assessment of children in a naturalistic environment (105).
Research further indicated that the validity of parent report questionnaires was
found to be dependent on the quality of the items included (105). Glasco and
Dworkin have also found that information gathered through parent report
questionnaires can be influenced by socioeconomic factors, as parents from lower
socio-economic areas were found to leave out more questions. This may be due
to language problems caused by a lower education (105). This was not the case in
this study as the parents came from a middle class socioeconomic group as all the
parents were working. The professions varied, but most parents were in
professions requiring at least completion of schooling (Gr. 12). All questionnaires
included in the study were fully completed by the parents.
It is also found that parents tend to report the infant’s skills as better than those
found on clinician assessment. This may be due to the fact that infants display
skills in a familiar and safe home environment first before generalisation to other
environments can occur. A study by Johnson, et al. found that the accuracy of
parent reporting was not affected by socio-demographic factors. Information
gathered from the parents was very valuable as they had more contact with the
infant and therefore knew the infant best (109).
Using therapist administered tests like the TSFI also has advantages and
disadvantages. Disadvantages are that the test is not administered in the infant’s
natural environment. This can lead to inaccurate results due to the fact that infants
often display skills in a familiar and safe environment first before generalisation to

95
other environments occur. Sometimes during therapist administered testing, the
infant may respond differently to applied stimuli than when naturally being
exposed to the same stimuli (105). During this study, the infants were all tested at
the child day care facilities they attend daily, with their caregivers/parent present.
The test administrator (researcher) however was unfamiliar to the infants, and this
can still have an influence on the results of the test. The advantage of using the
TSFI is that the researcher is very familiar with the test and its administration. She
was able to observe the problematic subtest scoring and interpret the results of
the test. This allow for greater reliability (105).
There are, therefore, clear advantages and disadvantages for using different types
of tests. As assessment is a fundamental part of the therapy process (21), it is
important for therapist to know more about the tests they use. This will allow them
to decide on the best combination of tests to use for a specific client in order to
accurately assess. It is also important to use tests with acceptable validity. Using
tests that over identify infants with problems will lead to infants not needing
services, being treated, and over servicing will occur. The opposite, however, can
also occur where, if a test under identify, infants with problems might not receive
the intervention they need. This study has supported the notion that when
assessing specifically infants under certain circumstances, parent report
questionnaires can be as sensitive and reliable than therapist administered tests.
5.7 LIMITATIONS OF THE STUDY
The study was limited by the very specific homogeneous sample as all participants
attend child day care facilities in a geographical area with middle to high income.
This makes it difficult to generalize findings to other infant groups in South Africa.
Due to the lack of any gold standard, the tests were compared to scoring on a
normal distribution based on research on a sample based in the United States of
America, and therefore not scores standardised on a sample in South Africa. This
may account for the issues with sensitivity seen for some sections, quadrants, and
subtests on the ITSP and TSFI.
The sample size was also small and the results should therefore be interpreted
with caution and cannot be generalised. The study warrants further investigation

96
into the psychometric properties of the ITSP and TSFI with different South African
samples.
The identification of sensory dysfunction in the infants was affected by the validity
of the TSFI in particular, and the difficulties found cannot be considered as
accurate for some subtests. Therefore, follow up for difficulties identified on the
TSFI must be made with care as a number of problems appear to be over
identified.
5.8 SUMMARY
Normative data of the ITSP and TSFI were compared to the results for the South
African test population, and frequency scores were also compared to the normal
distribution. The accuracy of the ITSP and the TSFI in terms of the accuracy,
sensitivity, specificity, and misclassification rate of the tests as well as the
construct validity and internal consistency on a sample of South African infants
between the ages of seven to 18 months, was examined.
When comparing the means of the raw score data obtained from testing a South
African sample, it was found that all the section and quadrant scores on the ITSP
was within the lower ranges of the typical, except for one section score (tactile
processing) which was found to be centred in the typical performance range
(Figure 4.1). For the TSFI the mean scores from the South African sample were
compared to the normal score range of the test manual and it was found that five
of the subtest scores and the total test score (seven to nine months) were within
the lower ranges of the typical performance range. The other three subtest and
total test score (13 to 18 months) were below the typical performance range
(Figure 4.9).
In order to establish the specificity and sensitivity of these tests (Table 4.7a and
Table 4.7b), the frequency scores (Table 4.5 and Table 4.6) of the interpretation
data for both tests are compared to what would be expected on a normal
distribution. The accuracy, sensitivity, specificity and misclassification rate (Table
4.7a) on the ITSP was found to be within acceptable limits for auditory processing
section, visual processing section, tactile processing section, vestibular processing
section, quadrant 1: low registration, and quadrant 2: sensory seeking. Sensitivity
below acceptable levels is seen for oral sensory processing section, quadrant 3:

97
sensory sensitivity, quadrant 4: sensation avoiding, and combined quadrant low
threshold. On the TSFI, the sensitivity, specificity, and accuracy (Table 4.7b) were
found to be within acceptable limits for only the reactivity to tactile deep pressure
subtest. Accuracy was found to be low for the subtest of adaptive motor functions
and total test score. Specificity was found to be low for the subtests of adaptive
motor functions, reactivity to vestibular stimulation, and the total test score. The
sensitivity was found to be below acceptable levels in the subtests for visual-tactile
integration and ocular-motor control. The misclassification score was found to be
high for adaptive motor functions, visual-tactile integration and the total test score.
The validity of the tests may have been affected by questions in some sections of
the ITSP being difficult for parents of the younger infants to answer as the infants
might not have developed certain skills yet. On the TSFI, specific scoring criteria
for some test items might have had an influence on the test scores. The use of the
tests on a South African population when it was standardised on an American
population, might also have an influence.
Based on the results where the tests were found to have acceptable validity in
terms of accuracy and specificity, the sensory integration function of the
participants that differed significantly from the expected normal distribution were
considered (Table 4.5 and Figure 4.3 to Figure 4.9). Since low sensitivity under
identifies problems, the sections and quadrants with low sensitivity were not
excluded when considering the identification of dysfunction by the ITSP.
Significant differences were seen in the sections of auditory processing, vestibular
processing, oral sensory processing, quadrant 1: low registration, quadrant 4:
sensation avoiding, and combined quadrant of low threshold, as more participants
test within the definite difference range.
The low accuracy and specificity on the TSFI affected all subtests and the total
test scores, which indicated significant differences from the expected normal
values (Table 4.6 and Figure 4.9 to Figure 4.13). Only the results on the reactivity
to tactile deep pressure subtest could be considered valid. Again, subtests with
low sensitivity cannot be excluded as difficulties present may not have been
indented in the visual-tactile integration and ocular-motor control subtests. These
difficulties may be related to environmental influences on the development of
sensory integration function in the infants in the child day care setting.

98
The construct validity of the ITSP and the TSFI (Table 4.8) indicated divergent
validity. It is therefore confirmed that the tests cannot be considered as measuring
the same constructs within sensory processing. The results indicate that, although
the manuals indicate that both tests measure sensory processing, the way that the
constructs have been designed in the tests assess a different combination of
sensory processing constructs.
The internal consistency (Table 4.9) for the ITSP was found to be acceptable as
Cronbach alpha for the sample were calculated to be 0.84. When comparing the
internal consistency of the sections and quadrants with the Cronbach alpha scores
in the manual, the scores for the South African sample was found to be higher
than that of the test manual for all the sections and quadrants except for quadrant
2: sensation seeking where in both cases scores were found to be the same, and
the combined quadrant: low threshold where the score in the manual is higher
than in this study. Internal consistency for the TSFI was found to be moderate as
the Cronbach alpha for the sample were calculated to be 0.69. Scores could not
be compared to the manual as the internal consistency is not published. Eeles et
al. hypothesized that the ITSP is a more comprehensive measure and
recommended that if the clinician needed to use a questionnaire, the ITSP would
be the better choice due to the fact that it has undergone more rigorous evaluation
(95).

99
CHAPTER 6: CONCLUSION
The purpose of this study was to establish if the Infant/Toddler Sensory Profile
(ITSP) (40) and the Test of Sensory Functions in Infants (TSFI), used to determine
the sensory integration function of infants in a sample of full term South African
infants, between the ages of seven to 18 months aligned with the normative data
established in the USA for the tests. Other psychometric data including the
construct validity, the diagnostic accuracy and internal consistency on both tests
were established for the same sample of infants to support the use of these tests
in the South African context.
A total of 60 infants were included in the study, and all infants attended child day
care facilities. Inclusion criteria for the study stipulated that infants should be born
after a full term pregnancy, thus born between 37 and 42 weeks gestation.
Since no ‘gold standard’ is available to assess sensory integration function in
infants the results for the ITSP and TSFI were compared to the raw score
normative data found in the test manuals. The z-scores were also, compared to a
normal Gaussian distribution on which the interpretation of these tests is based.
The validity of the two tests based on accuracy, sensitivity, specificity, and
misclassification rate was analysed based on the frequency scores of a normal
distribution. Both tests were interpreted based on standard deviations from the
mean.
The mean raw scores for the South African sample fell into the range of scores for
the typical USA sample reported in the test but mostly at the lower range
indicating a trend towards ‘more than others’ scores. Effect sizes (d, Cohen) (136)
calculated using the raw score data showed the test provided an adequate
measure of performance for most sections and quadrants on the South African
test population. The South African sample was divided into age bands of seven to
12 months and 13 to 18 months, in order to compare the means in the test
manual.
An affect size of d ≤ 0.4 is considered acceptable indicating the norms provided for
the USA sample can be applied to the South African sample, whereas an effect
size of d > 0.4 presents challenges in terms of interpretation of results (24). It was

100
found that in both the younger age group (seven to 12 months) as well as the
older age group (13 to 18 months), scores on one of the six sections and one
quadrant showed a medium effect size. This was for oral sensory processing
section (0.76 and 0.75 respectively) and quadrant 2: sensation seeking (0.58 and
0.65 respectively). This indicated that the scores from the oral sensory processing
section and quadrant 2: sensation seeking needed to be interpreted with caution
on this South African sample.
When looking at the frequency results for the ITSP compared to the normal
distribution, a significant differences for five of the nine quadrants and sections
from the expected normal distribution is seen. A significantly higher percentage of
participants had scores in the definite difference range ‘more than others’ in three
sections and three quadrants. The greatest percentage was seen for the
vestibular processing section with 15% of infants, testing in this range. As this
section of the test demonstrates acceptable validity and reliability, it is felt that
there is a true problem with the normative scores in vestibular processing in this
sample which appear to differ from those reported of infants in the USA. A similar
result was found with a high percentage (13.3%) of the participants also tested in
the definite difference range ‘more than others’ for quadrant 1: low registration.
Low registration indicates that the infant registers less sensory input, and this can
lead to an infant appearing overly lethargic and inattentive (86).
The results from the validity analysis indicated that, for the ITSP, one section and
three quadrants showed sensitivity below the acceptable level of 80% as
determined by McCauley & Swisher (137). These were oral sensory processing,
quadrant 3: sensory sensitivity, quadrant 4: sensation avoiding, and combined
quadrant of low threshold. All these items therefore under identified problems.
Accuracy and specificity was within acceptable levels for all section and quadrant
scores on the ITSP. The misclassification rate for the ITSP sections and quadrants
where found to be low with the highest misclassification rate found for the
combined quadrant: low threshold at 6.7%. It was concluded therefore that this
test can be considered valid for this sample but standardisation on a South African
population would be ideal. According to interpretation criteria as indicated in the
ITSP manual (40), 15% (n = 9) of participants in the sample would have been
identified as in need of further assessment.

101
The results also indicate that a parent report questionnaire has advantages, such
as that it can be seen as a source of information that is sensitive, reliable, and
valid (105) (106) (107). Involving the parent and using their perceptions is used as
part of a client centred approach that is advocated by occupational therapists (21)
(105). It is time efficient and can possibly be more accurate than the use of some
standardised tests (108), and it can also provide qualitative, accurate assessment
of infants and children in a naturalistic environment (105).
The internal consistency of the ITSP was found to be 0.84 for the total test,
indicating the test was reliable for identifying the sensory integration functioning in
this sample. When comparing the internal consistency of the sections and
quadrants with the Cronbach alpha scores in the manual, the scores for the South
African sample was found to be higher than that of the test manual for all the
sections and quadrants except for quadrant 2: sensation seeking where in both
cases scores were found to be the same, and the combined quadrant: low
threshold where the score in the manual is higher than in this study. This is
consistent with many other studies (45) (96) (97) (98) (99) that used the ITSP and
found that it is a reliable test in this sample as well.
When the results for the TSFI were considered, due to a lack of published mean
scores for the population the TSFI was developed on, the researcher was unable
to calculate the effect sizes (d, Cohen) (136) for the raw score data from this
study.
The comparison of the mean scores for the South African sample to the range of
scores for the normal sample in the USA showed differences in the subtests of
adaptive motor functions (10 to 12 months), adaptive motor functions (13 to 18
months), reactivity to vestibular stimulation (13 to 18 months), as well as the total
test score (eight -18 months).
When looking at the frequency results for the TSFI compared to the normal
distribution a significantly higher percentage of participants had scores that
differed from the normal distribution on all the subtests and total score. Only the
reactivity to tactile deep pressure subtest had validity and reliability within
acceptable ranges. Due to the low accuracy and specificity, as well as the low
internal consistency of some of the other subtests and total test score, the

102
researcher is of the opinion that the high frequency scores might be due to
inaccuracies within the test. It is recommended that further research is needed
regarding the use of the TSFI and specifically the use thereof on a South African
sample.
The accuracy, sensitivity, specificity, and misclassification scores for the TSFI
indicate that only the reactivity to tactile deep pressure subtest had validity scores
within acceptable limits. Two subtests, namely visual-tactile integration and ocular-
motor control had low sensitivity and are therefore under identified problems. Two
subtests, namely adaptive motor functions and reactivity to vestibular stimulation
as well as the total test score had low specificity indicating they are over
identifying problems. Misclassification rates for four of the five subtests as well as
the total test score were high. It was concluded that the TSFI cannot be
considered a valid measure to use in typical infants in this South African sample
and the test needs revision before standardisation on a South African population
can be considered. The psychometric properties of certain items on the test
appear to be responsible for these results. This results in 33.3% (n = 20) of infants
in the sample as being identified in need of further assessment. This percentage is
too high and can result in waste of time and money as the test is over identifying
problems.
This especially applies to the subtest of adaptive motor functions, where the
accuracy and specificity scores were very low. This does support the findings of
the test authors DeGangi and Greenspan that the total test score can be more
accurately used to exclude normal infants than to detect delayed infants. They
suggested that the total test score can be used reliably for infants from seven to
18 months for screening decisions, and the subtest scores can be used for
diagnostic decisions except for adaptive motor functions and reactivity to
vestibular stimulation subtests (9).
The reliability of the TSFI had a moderate Cronbach’s alpha of 0.69 for the total
test for this sample and most subtests had internal consistency below acceptable
levels. The test items do not show consistency for the measurement of one
construct and cannot be considered reliable for this sample. Scores could not be
compared to the manual as the internal consistency is not published.

103
The results for the construct validity of the ITSP and the TSFI indicate there were
no significant correlation between the sections and quadrant scores obtained on
the ITSP and the subtest/total test score obtained by the TSFI. Correlation scores
ranged between -0.17 and 0.35. The construct validity of the ITSP and the TSFI
indicated divergent validity. These results confirmed that the tests measure
different constructs of sensory processing – namely modulation and
discrimination. The results indicate that, although the manuals indicate that both
tests measure sensory processing, the way that the constructs have been
designed in the tests assess a different combination of sensory processing
constructs.
The study was important as the results pertaining to psychometric data of the
tests, used to assess sensory integration function in infants, may assist in the
screening and identification of Sensory Integrative Dysfunction (SID) earlier in a
child’s life, allowing for early intervention of at risk infants and preventing the
requirement for longer periods of therapy later in the infant’s life. Appropriate
therapeutic interventions to reduce the developmental effects of SID and the
accompanying behavioural difficulties can be implemented timeously if the
dysfunction is accurately recognised early on in life. More positive outcomes may
be achieved by targeting infants at risk with early intervention when the brain is
more receptive to sensory integration therapy. Knowledge of an infant’s sensory
integration function can also help the parent or caregiver with handling of the
infant (56).
6.1 RECOMMENDATIONS
According to the findings of this study, the following recommendations are made:
• As the study had a relatively small sample, it might be inaccurate to
generalize the findings, but it is recommended that further research is
needed regarding the use of the TSFI and specifically the use thereof on a
South African population. The use of the ITSP on a South African
population should also be further researched.
• It is recommended that further research is needed regarding the influence
of the child day care environment on the development of sensory
integration function in infants.

104
• Due to the findings of this study, the researcher recommend that the TSFI
be used in conjunction with other tests, parent interviews, relevant
background information, results from neurodevelopmental testing, as well
as skilled observations of the infant’s behaviour. This is consistent with
recommendations by DeGangi (37) as well as Eeles et al. (45).

105
REFERENCES 1. Schaaf RC, Schoen SA, Smith Roley S, Lane SJ, Koomar J, May-Benson TA. A frame of Reference
for Sensory Integration. In Kramer P, Hinojosa J. Frames of References for Pediatric Occupational
Therapy. 3rd ed. Philadelphia: Lippincott, Williams & Wilkenson; 2009. p. 99-186.
2. Secretary-General UN. Status of the Convention on the Rights of the Child, Report of the
Secretary-General. United Nations, General Assembly Sixty-fifth session; 2 August 2010. Report
No.: A/65/206.
3. Simundic AM. Researchgate website. [Online].; 2008 [cited 2015 June 29. Available from:
http://www.reasearchgate.net.
4. Bengu SME, Schoema R. White Paper on Education and Training. Cape Town: South-African
Government, Department of Education; 1995.
5. Editors of the American Heritage Dictionaries. The American Heritage Medical Dictionary. New
York: Hougton Mifflin Harcourt Publishing Company; 2007 [cited 2014 July. Available from:
http://medical-dictionary.thefreedictionary.com/early+intervention.
6. Segen M. Segen's Medical Dictionary.: Farlex.Inc.; 2012 [cited 2015 06 18. Available from:
http://medical-dictionary.thefreedictionary.com/gold+standard.
7. Cohen LB. Uses and misuses of habituation and related preferences paradigms. Infant and Child
Development. 2004; 13: p. 349-352.
8. Mosby. Mosby's Dental Dictionary: Elsevier.Inc; 2008 [cited 2015 06 15. Available from:
http://medical-dictionary.thefreedictionary.com/infant.
9. DeGangi GA, Greenspan SI. Test of Sensory Functions in Infants (TSFI) User's Manual; 1989.
10. Kandel E, Schwartz J, Jessell T. Cellular mechanisms of learning and the biological basis of
individuality New York: Elsevier; 1993.
11. Ayres AJ. Sensory integration and learning disorders Los Angeles: Western Psychological Services;
1972.
12. Provost B, Oetter P. The sensory rating scale for infants and young children: development and
reliability. Physical & Occupational Therapy Pediatrics. 1993; 13: p. 15-35.
13. Ayres AJ. Sensory integration and the child. Los Angeles: Western Psychological Services; 1979.
14. Bundy AC, Lane SJ, Murray EA. Sensory integration: Theory and Practice. 2nd ed. Philadelphia:
F.A. Davis; 2002.
15. Coleman GG, Mailloux Z, Smith Roley S. Sensory integration Answers for Parents. Santa Rosa, CA:

106
Crestport Press; 2004.
16. Lane SJ. Sensory Modulation. In Bundy AC, Lane SJ, Murray EA. Sensory Integration Theory and
Practice. 2nd ed. Philidelphia: FA Davis Co.; 2002. p. 101-123.
17. Dunn W, Brown C. Factor analysis on the Sensory Profile fram a national sample of children
without disabilities. The American Journal of Occupational Therapy. 1997 July/August; 51(1): p.
490-499.
18. Kern JK, Graver CR, Carmody T, Alonzo A, Mehta JA, Trivedi MH. Examining sensory modulation in
individuals with autism as compared to community controls. Research in Autism Spectrum
Disorders. 2008; 2: p. 85-94.
19. Kandel ER, Schwartz J, Jessel TMl. Principles of neural science. 4th ed. New York: GcGraw-Hill;
2000.
20. Miller LJ, Anzalone ME, Lane SJ, Cermak SA, Osten ET. Concept Evolution in Sensory Integration: A
Proposed Nosology for diagnosis. American Journal of Occupational Therapy. 2007 March/April;
61(2): p. 135-140.
21. Association of American Occupational Therapy. Occupational Therapy Practice Framework:
Domain and Process (3rd ed.). American Journal of Occupational Therapy. 2014 March/April; 68
(Supplement1): p. S1-S48.
22. Dunn W. Perfomance of typical children on the Sensory Profile: An item analysis. American
Journal of Occupational Therapy. 1994; 48: p. 967-974.
23. Butcher JN. Translation and adaptation of the MMPI-2 for international use. In Butcher JN.
International adaptations fo the MMPI-2: Research and clinical applications. Minneapolis:
University of Minnesota Press; 1996. p. 26-43.
24. van Jaarsveld A, Mailloux Z, Herzberg DS. The use of the Sensory Integration and Praxis tests with
South African children. South African Journal of Occupaitonal Therapy. 2012 December; 42(3): p.
12-18.
25. Anastasi A, Urbina S. Psychological testing. Upper Saddle River, NJ: Prentice Hall International.;
1997.
26. Downing SM. Validity: On the meaningful interpretation of assessment data. Medical Education.
2003; 37(9): p. 830.
27. Streiner DL, Norman GR. Health measurement scales: A practical guide to their development and
use. Oxford: UK: Oxford University Press; 1995.
28. DeGangi GA, Sickel R, Wierner A, Kaplan E. Fussy babies: do treat or not do treat? British Journal
of Occupational Therapy. 1996; 56(10): p. 457-464.
107
29. Wiener A, Long T, DeGangi G, Dataille B. Sensory processing of infants born prematurely or with
regulatory disorder. Physical & Occupational Therapy in Pediatrics. 1996; 16(4): p. 1-17.
30. Harris S, Daniels L. Content validity of the Harris Infant Neuromotor Test. Physical Therapy. 1996;
76(4): p. 727-737.
31. UNICEF. Fact sheet: A summary of the rights under the Convention on the Rights of the Child.
32. Davidson DA. Psychosocial Issues Affecting Social Participation. In Case-Smith J, O'Brien JC.
Occupational Therapy for Children. Maryland Heights, Missourri: Elsevier; 2010. p. 404-433.
33. DeGangi GA,Berg RA, Greenspan SI. The clinical measurement of sensory functioning in infants: A
preliminary study. Physical & Occupational Therapy in Paediatrics. 1988; 8(2-3): p. 1-23.
34. Ayres AJ. Sensory integration and the child Los Angeles: Western Psychological Services (Original
work published 1976); 2005.
35. DeGangi GA,DiPietro JA,Greenspan SI,Porges SW. Psychophysiological caracteristics of the
regulatory disordered infant. Infant Behaviour and Development. 1991; 14: p. 37-50.
36. Ben-Sasson A, Carter AS, Briggs-Gowan MJ. The Development of Sensory Over-responsivity From
Infancy to Elementary School. Journal of Abnormal Child Psychology. 2010.
37. DeGangi GA, Greenspan SI. The development of sensory functions in infants. Physical and
Occuptational Therapy Pediatrics. 1988; 8: p. 21-33.
38. Ayres AJ. Sensory Integration and Praxis Test manual Los Angeles: Western Psychological
Services; 1989.
39. South African Iinstitute of Sensory Integration (SAISI) Research Committee. Clinical Observations
adapted from Ayres. 1986.
40. Dunn W. Infant/Toddler Sensory Profile User's Manual. In. San Antonio: Psychological
Corporation; 2002. p. 59-68.
41. Nieder-Heitmann E. Impact of a sensory developmental care programme for very low birth
weight preterm infants in the neonatal intensive care unit. Dissertation for Occupational Therapy
Masters Degree. University of Stellenbosch, Occupational Therapy Department; 2010.
42. Jorge J, de Witt PA, Franzsen D. The effect of a two-week sensory diet on fussy infants with
regulatory sensory processing disorder. South African Journal of Occupational Therapy. 2013
December; 43(3): p. 28-34.
43. Lecuona E. Sensory Integration Intervention and the Development of the Extremely Low to Very
Low Birth Weight Premature Infant. Dissertation for Master in Occupational Therapy. University
of the Free State, Occupational Therapy Department; 2012.

108
44. Mitchell AW, Moore EM, Roberts EJ, Hachtel KW, Brown MS. Sensory Processin Disorder in
Children Ages Birth-3 Years Born Prematurely: A Systematic Review. American Journal of
Occupational Therapy. 2015 January/February; 69(1): p. 1-11.
45. Eeles AL, Anderson PJ, Brown NC, Roslyn JL, Boyd N, Spittle AJ, et al. Sensory profiles of children
born before 30 weeks' gestation at 2 years of age and their environmental and biological
predictors. Early Human Development. 2013; 89(9): p. 727-732.
46. Watling R, Bodison S, Henry D, & Kuhaneck H. (2006). "Sensory Integration: It's not just for
children." AOTA's Sensory Integraion Special Interest Section Quaterly,29 (4), 1-4.
47. Koenig KP, Rudney S. Performance Challenges for children and adolescents with difficulty
processing and integrating sensory information: A Systematic Review. American Journal of
Occupational Therapy. 2010 May/June; 64(3): p. 430-442.
48. Dunn W. The Sensory Profile, User's Manual San Antonio, TX: The Psychological Corporation;
1999.
49. Brown T, Morrison IC, Stagnitti K. The Reliability of Two Sensory Processing Scales Used with
School-Age Children: Comparing the Resoponse Consistency of Mothers, Fathers and Classroom
Teaschers Rating the Same child. Journal of Occupational Therapy, Schools & Early Intervention.
2010; 3: p. 331-347.
50. Neuman A. Patterns of response to sensory stimuli encountered in daily activities: A comparison
between 3 to 10-year-old Israeli and American children without disabilities. Occupational
Therapy International. 2006 January; 25(13): p. 79-99.
51. Benjamin TE, Crasta JE, Suresh APC, Alwinesh MJT, Kanniappan G, Padankatti SM, et al. Sensory
Profile Caregiver Questionnaire: A Measure for Sensory Impairment Among Children with
Developmental Disabilities in India. Indian Journal of Pediatrics. 2014 December; Supplimnet 2: p.
S183-S186.
52. Crawford SG, Wilson BN, Dewey D. Identifying Developmental Coordination Disorder:
Consistency Between Tests. Physical & occupational therapy in paediatrics. 2001; 2(3): p. 29-50.
53. Habib E, Magalhaes L. Development of a questionnaire to detect atypical behaviour in infants.
Revista Brasileira de Fisioterapia. 2007; 11(3): p. 155-161.
54. Dunn W, Daniels DB. Initial Development of the Infant/Toddler Sensory Profile. Journal of Early
Intervention. 2002; 25(1): p. 27-41.
55. May-Benson TA,Koomaar JA,Teasdale A. Incidence of pre-, peri-, and post-natal birth and
developmental problems of children with sensory processing disorder and children with autism
spectrum disorder. Frontiers in Integrative Neurosciences. 2009; 31(November): p. 10.
56. Crepeau-Hobson M. The Relationship Between Perinatal Risk Factors and Sensory Processing

109
Difficulties in Preschool Children. Journal of developmental and physical disabilities. 2009; 21(4):
p. 315–328.
57. Kramer P, Hinojosa J. Developmental Perspective: Fundamentals of Developmental Theory. In P.
K, Hinojosa J. Frames of reference for Pediatric Occupational Therapy. 3rd ed. Philadelphia:
Lippincott Williams & Wilkins; 2009. p. 23-30.
58. Freud S. Standard Edition of the Complete Psychological works of Sigmund Freud. London:
Hogarth Press; 1966.
59. Skinner BF. About Behaviourism New York: Vintage Books; 1974.
60. Lerner RM. Concepts and Theories of Human Development. 3rd ed. Mahwah, New Jersey:
Lawrence Erlbaum Associates; 2002.
61. Hensch TK. Critical period plasticity in local cortical circuits. Nature reviews. Neuroscience. 2005;
6: p. 877-888.
62. Jacobs SE, Schenider ML. Neuroplasticity and the enviromnent. In Roley SS, Blanche EI, Schaaf RC.
Understanding the nature of sensory integratio with diverse populations. San Antonio,TX:
Therapy Skills Builder; 2001. p. 29-42.
63. Parham LD, Mailloux Z. Sensory Integration. In Case-Smith J, O'Brien JC. Occupational Therapy for
children. 6th ed. Elsevier: Mosby; 2010. p. 235-372.
64. Parham LD. Sensory integration and occupation. In Bundy AC, Lane SJ, Murray EA. Sensory
integration: Theory and practice. Philadelphia.: F.A. Davis.; 2002. p. 413-434.
65. Smith-Roley S, Mailloux Z, Miller-Kuhaneck H, Glennon E. Understanding Ayers Sensory
Integration. OT Practice. 2007; 12(17): p. CE-2.
66. Parham LD, Cohn ES, Spitzer S, Koomar JA, Miller LJ, Brett-Green B, et al. Filelity in Sensory
Integration Intervention Research. American Journal of Occupational Therapy. 2007 March/April;
61(2): p. 216-227.
67. Lane SJ, Schaaf RC. Examining the Neuroscience Evidence for Sensory-Driven Neuroplasticity:
Implications for Sensory-Based Occupational Therapy for Children and Adolenscents. The
American Journal of Occupational Therapy. 2010 May/June; 44(3): p. 375-390.
68. Mailloux Z, Mulligan S, Smith-Roley S, Blanche E, Cermak S, Coleman GG, et al. Verification and
Clarification of Patterns of Sensory Integrative Dysfunction. The American Journal of
Occupational Therapy. 2011 March/April; 65(2): p. 143-151.
69. Miller LJ, Anxalone M,Cermak SA,Lane SJ,Osten B,Wieder S,Greenspan SI. Regulatory-Sensory
Processing Disorders Work Group, Diagnotic Manual for Infancy and Early Childhood. 17399th ed.
Meryland: ICDL; 2005.

110
70. Miller LJ. Sensory Processing Disorder (SPD) Foundation. [Online]. [cited 2014 June 28. Available
from: http://spdfoundation.net/.
71. South African Institute for Sensory Integration. [Online]. [cited 2014 August 02. Available from:
http://www.instsi.co.za.
72. Miller LJ, Lane SJ. Toward a Concensus in Termonology in Sensory Integration Theory and
Practice: Part 1: Taxonomy of Neurophysiological Process. Sensory Integration Special Interest
Section Quarterly. 2000 March; 23(1).
73. Mulligan S. An analysis of score patterns of children with attention disorders on the Sensory
Integration and Praxis Tests. American Journal of Occupational Therapy. 1996; 50: p. 647-654.
74. Mulligan S. Patterns of sensory integration dysfunction: A confirmatory factor analysis. American
Journal of Occupational Therapy. 1998; 52: p. 819-828.
75. Mulligan S. Cluster analysis of scores of children on the Sensory Integration and Praxis Test. OTJR:
Occupation, Participation and Health. 2000; 20: p. 256-270.
76. Bundy AC, Murray EA. Sensory Integration: A. Jean Ayres' Theory Revisited. In Bundy AC, Lane SJ,
Murray EA. Sensory Integration Theory and Practice. 2nd ed. Philadelphia: F.A. Davis Company;
2002. p. 3-29.
77. van Jaarsveld A. Model for Clinical Reasoning on possible Sensory Integration Difficulties and
Dysfunctions. SAISI Newsletter. 2011: p. 7-12.
78. Parham LD, Ecker C, Kuhaneck HM, Henry DA, Glennon TJ. Sensory Processing Measure Torrance,
CA.: Western Psychological Services; 2007.
79. Baranek GT, Chin YH, Greiss Hess LM, Yankee JG, Hatton DD, Hooper SR. Sensory Processing
Correlates of Occupational Performance in Children with Fragile X Syndrome: Preliminary
Findings. American Journal of Occupational Therapy. 2002; 56(5): p. 538-546.
80. Baranek GT, Foster LG, Berkson H. Tactile defensiveness and stereotyped behaviours. American
Journal of Occupational Therapy. 1997; 51: p. 91-95.
81. McIntosh DN, Miller LJ, Shyu V, Hagerman RJ. Sensory-modulation disruption, electrodermal
responses, and functional behaviours. Developmental Medicine & Child Neurology. 1999; 41: p.
608-615.
82. Ahn R, Miller L, Milberger S, McIntosh.D.. Prevalence of parent's perceptions of sensory
processing disorder among kindergarten children. American Journal of Occupational Therapy.
2004; 58(3): p. 287-293.
83. Fisher AG, Murray EA. Introduction to sensory integration theory. In Fisher AG, Murray EA, Bundy
AC. Sensory Integration: Theory and Practice. Philidelphia: F.A. Davis; 1991. p. 3-26.
111
84. Knickerbocker BM. A holistic approach to learning disabilities. Thorofare, NY.: C.B. Slack.; 1980.
85. Royeen CB,& Lane SJ. Tactile processing and sensory defensiveness.. In Fisher AB,Murrya
EA,&Bundy AC. Sensory integration: Theory and practice. Philidelphis: F.A. Davis.; 1991. p. 108-
133.
86. Dunn W. The Impact of Sensory Processing Abilities on the Daily Lives of Young Children and
Their Families: A Conceptual Model. Infants and Young Children. 1997; 9(4): p. 23-35.
87. Wilbarger P, & Wilbarger J. Sensory defensiveness in children aged 2-12: An intervention guide
for parents and other caregivers. Denver: Avanti Educational Programs; 1991.
88. Miller LJ, Reisman J, McIntosh DN, Simon J. An exological model of sensory modulation:
Performance of children with Fragile X Syndrome. In Smith-Roley S, Blanche EI, Schaaf RC.
Understanding the nature of sensory integration in divers populations. San Antonio: Therapy Skill
Builders; 2001. p. 57-82.
89. Royeen C. Neuroscience Foundations of Human Performance Rockville: American Occupational
Therapy Association; 1991.
90. Stellar J, Stellar E. The Neurobiology of Motivation and Reward New York: Springer-Verlag; 1985.
91. Reynolds S, Lane SJ. Diagnostic Validity of Sensory Over-responsivity: A Review of the Literature
and Case Report. Journal of Autism & Developmental Disorders. 2008; 38: p. 516-529.
92. DeSantis A, Harkins D, Tronick E, Kaplan E, Beeghly M. Exploring an integrative model of infant
behaciour: What is the relationship among temperament, sensory processing and
neurobehavioral measures? Infant Behaviour & Development. 2011; 34: p. 280-292.
93. Stewart BK. Occupational Therapy evaluation in Pediatrics. In Case-Smith J, O'Brien JC.
Occupational Therapy for Children. Sixth Edition ed. Missouri: Mosby Elsevier; 2010. p. 193-211.
94. Hegde MN, Pomaville F. Standardized Assessment. In Hegde MN, Pomaville F. Assessment of
Communication Disorders in Children: Resources and Protocols. 2nd ed. Dan Diego: Plural
Publishing Inc.; 2012. p. 41-66.
95. Eeles AL, Spittle AJ, Anderson PJ, Brown N, Lee KJ, Boydlex RN,DW. Assessments of sensory
processing in infants: a systematic review. Developmental Medicine & Child Neurology. 2013; 55:
p. 314-326.
96. Mulligan S, White BP. Sensory and Motor Behaviors of Infant Siblings of Children with and
without Autism. American Journal of Occupational Therapy. 2012 September/October; 89(9): p.
555-566.
97. Ben-Sasson A, Soto TW, Martinez-Pedraza F, Carter AS. Early sensory over-responsivity in
toddlers with autism spectrum disorders as a predictor of family impairment and parenting

112
stress. Journal of Child Psychology and Psychiatry. 2013; 54(8): p. 846-853.
98. Germani T, Zwaigerbaum L, Bryson S, Brain J, Smith I, Roberts W, et al. Brief Report: Assessment
of Early Sensory Processing in Infants at High-Risk of Autism Spectrum Disorder. Journal of Autism
and Developmental Disorders. 2014 in print. Published online 27 June 2014.
99. Samango-Sprouse CA, Stapleton EJ, Alaibadi F, Graw R, Vickers R, Haskell K, et al. Identification of
infants at risk for autism spectrum disorder and developmental language delay prior to 12
months. Autism. 2014. In print, Published online on 18 February 2014.
100..DeGangi GA, Berk RA, Greenspan SI. The clinical measurement of sensory functioning in infants: A
preliminary study. Physical & Occupational Therapy in Paediatrics. 1988; 8(2-3): p. 1-23.
101. Jirikowic TL, Engel JM, Deitz JC. The Test of Sensory Functions in Infants: Test-Retest Reliability for
Infants with Developmental Delays. The American Journal of Occupational Therapy. 1997; 51(9):
p. 733-738.
102. Jaegermann N, Klein PS. Enhancing mothers' interactions with toddlers who have sensory-
processing disorder. Infant Mental Health Journal. 2010; 31(3): p. 291-311.
103. Lin CK, Wu HM, Wang HY, Tseng MH, Lin CH. Age as a factor in sensory integration in Taiwanese
children. Neuropsychiatric Disease and Treatment. 2013; 9: p. 995-1001.
104. Chorna O, Solomon JE, Slaughter JC, Stark AR, Maitre NL. Abnormal sensory reactivity in preterm
infants during the first year correlates with adverse neurodevelopmental outcomes at 2 years of
age. ADC Fetal & Neonatal edition. 2014 in press. Published online 22 July 2014.
105. Glasco FP, Dworkin PH. The Role of Parents in the Detection of Developmental and Behavioural
Problems. Pediatrics. 1995 June; 95(6): p. 829-836.
106. Faraone SF, Biedernam J, Milberger S. How reliable are maternal reports of their children's
psycopathology? One-year recall of psychiatric diagnoses of ADHD children. Journal of the
American Academy of Child and Adolescent Psychiatry. 1995; 34: p. 1001.
107. Wilson BN, Kaplan BJ, Crawford SG, Campbell A, Dewey D. Reliability and Validity of a Parent
questionnaire on Childhood Motor Skills. American Journal of Occupational Therapy. 2000; 54(5):
p. 484-493.
108. Fox MA, Lent B. Clumsy Children: primer on developmnetal coordination disorder. Canadian
Family Physician. 1996; 42: p. 1965-1971.
109. Johnson S, Marlow N, Wolke D, Davidson L, Marston L, O'Hare A, et al. Validation of a parent
report measure of cognitive development in very preterm infants. Developmental Medicine and
Child Neurology. 2004; 46: p. 389-397.
110. EUROSTAT EC. European Quality Assurance in Vocational Education and Training. [Online].; 2007

113
[cited 2015 January 8. Available from: http://www.eqavet.eu/qa/gns/glossary/a/accuracy-of-
measurement.aspx.
111. Kielhofner G. Developing and Evaluation Quantitative Data Collection Intruments. In Kielhofner G.
Research in Occupational Therapy: Methods of Inquiry for Enhancing Practice. Philadelphia: F.A.
Davis Company; 2006. p. 155-176.
112. Brown T, Morrison IC, Stagnitti K. The convergent validity of two sensory processing scales used
with school-age children: Comparing the Sensory Profile and the Sensory Processing Measure.
New Zealand Journal of Occupational Therapy. 2010; 57(2): p. 55-65.
113. Guralnick MJ. International Perspectives on Early Intervention: A Search for Common Ground.
Journal of Early Intervention. 2008 March; 30(2): p. 90-101.
114. World Health Organization. Preamble to the Constitution of the World Health Organization as
addopted by the International Health Conference, New York, 19 June - 22 July 1946; signed on 22
July 1946 by the representatives of 61 States. In Official Records of the World Health
Organization; 1948 no 2. p. 100.
115. Shonkoff J, Richter L, van der Gaag J, Bhutta Z. An integrated scientific framework for child
survival and early childhood development. Pediatrics. 2012; 129(2): p. 1-13.
116. Department of Education. Interim policy for early childhood development. Interam policy. South-
African Government, Department of Education; 1996.
117. UNICEF. National Integrated Plan for Early Childhood development in South Africa 2005-2010.
2005..
118. South Africa. Children's Amendment Act 2007. Government Gazette. 2007 March; 513(30884).
119. South Africa. National Health Act, 2003. Government Gazette. 2004 July; 469(26595).
120. Mseleku TD. A Policy on Quality in Health Care for South Africa. Policy. Pretoria: South African
Government, National department of Health; 2007.
121. Dawson G, Rogers S, Munson J, Smith M, Winter J, Greenson J, et al. Randomized, Controlled Trail
of an Intervention for Toddlers With Autism: The Early Start Denver Model. Pediatrics. 2010; 125:
p. e17-e23.
122. Ziviani J, Feeney R, Rodger S, Watter P. Systematic review of early intervention programms for
children from birt to nine years who have a physical disability. Australian Occupational Therapy
Journal. 2010; 57: p. 210-223.
123. DeGangi GA, Breinbauer C, Roosevelt JD, Porges S, Greenspan S. Prediction of childhood
problems at three years in children experiencing disorders of regulation during infancy. Infant
Mental Health Journal. 2000; 21(3): p. 156-175.

114
124. Kielhofner G. Research in Occupational Therapy: Methods of inquiry for Enhanching Practice
Philadelphia: F.A. Davis company; 2006.
125. Bartlett JE, Kortlik JW,Higgins CC. Organizational Research: Determining Appropriate Sample Size
in Survey research. Informatin Technology, Learing and Performance Journal. 2001; 19(1): p. 43-
50.
126. Statistics South Africa. South Africa's young children: their family and home environment, 2012.
Pretoria: Statistics South Africa; 2012. Report No.: 03-10-07.
127. Chorley M. Mailonline. [Online].; 2014 [cited 2014 September 02. Available from:
http://www.dailymail.co.uk/news/article-2694534.
128. Nation Master. South Africa Health Stats. [Online]. [cited 2014 September 02. Available from:
http://www.nationmaster.com/country-info/profiles/South-Africa/Health.
129. Impey L, Pandit M. Tocolysis for repeat external cephalic version in breech presentation at term:
A randomized, double blind, placebo-controlled trail. British Journal of Obstetrics and
Gynaecology. 2005; 112: p. 627-631.
130. Hofmeyr GJ, Gyte GML. Interventions to help external cephalic version for breech presentation at
term(Review). Cochrane Database System Review. 2010;(1).
131. Moodley J, Dhedun SM, J D. Breech presentation at a district level hospital in South Africa. SA
Family Practice. 2010; 52(1): p. 64-68.
132. Discovery Health Matters. Pregnancy - A simple guide to birth options. [Online].; 2013 [cited 2014
September 9. Available from:
http//:www.discovery.co.za/discovery_co.za/web/linked_content/pdfs/health/birth_options.pdf.
133. Tshibangu KC, De Jongh MA, De Villiers DJ, Du Toit JJ, Shah SMH. Incidence and outcome of
caesarean section in the private sector - 3 year experience at Pretoria Gynaecological Hospital.
South African Medical Journal. 2002; 92(12): p. 956-959.
134. Cavallaro FL, Cresswell JA, Franca GVA, Aluisio CGV, Barros AJD, Ronsmans C. Trends in caesarean
delivery by country and wealth quintile: Cross-sectional surveys in southern Asia and sub-Saharan
Africa. Bulletin of the Qorld Health Organization. 2013 December; 91: p. 914-922D.
135. Atlas of neonatal pathology. Classification of newborn infants by weight and gestation. [Online].
[cited 2014 November 19. Available from:
https://atlases.muni.cz/atlases/novo/atl_en/main+novorozenec+klasnov.html.
136. Cohen J. A Power Primer. Psychological Bulletin. 1992; 112(1): p. 155-159.
137. McCauley RJ, Swisher L. Psychometric review of language and articulation tests for preschool
children. Journal of Speech and Hearing Disorders. 1984; 49: p. 34-42.

115
138. Dunn W. Infant / Toddler Sensory Profile Caregiver Questionnaire. 2002.
139. Schuberth LM, Amirault LM, Case-Smith J. Feeding Intervention. In Case-Smith J, O'Brien JC.
Occupational Therapy for Children. 6th ed. Maryland Hights, Missouri: Mosby Elsevier; 2010. p.
446-473.
140. National Health Services. Teething symptoms and how babies' teeth emerge [Online]. [cited 2014
November 19. Available from: http://www.nhs.uk/conditions/pregnancy-and-
baby/pages/teething-and-tooth-care.aspx.
141. Case-Smith J. Developmet of Childhood Occupations. In Case-Smith J, O'Brien JC. Occupational
Therapy for Children. 6th ed. Maryland Heights, Missouri: Mosby Elsevier; 2010. p. 56-83.
142. Connolly BH, Montgomery P. Therapeutic exercise in Developmental Disabilities. 3rd ed. New
York: Slack incorporated; 2005.
143. Kielhofner G, Tomita MR. Appenndix B: Summary of Common Research Statistics. In Kielhofner G.
Research in Occupational Therapy. Philadelphia: F.A. Davis Company; 2006. p. 314-325.
144. Tavakol M, Dennick R. Making sense of Cronbach's alpha. International Journal of Medical
Education. 2011; 2: p. 53-55.
145. Nunnaly J. Psycometric Theory New York: McGraw-Hill; 1978.
146. Association AOT. Occupational Therapy Practice Framework: Domain and Process (3rd ed.).
American Journal of Occupational Therapy. 2014 March/April; 68 (Supplement1): p. S1-S48.

116
APPENDICES
A1 Personal information
A2 Demographic sheet for parents
A3 Demographic sheet for child day care centres
B1 Infant/Toddler Sensory Profile – caregiver questionnaire
B2 Infant/Toddler Sensory Profile – summery score sheet
C Test of Sensory Functions in Infants – Administration and Scoring Form
D Ethical Clearance
E Request for permission to conduct research – child day care facilities
F1 Information sheet for parents
F2 Informed consent from parents

117
APPENDIX A1
PERSONAL INFORMATION
(To be kept separate)
Please complete information where needed and mark appropriate box with an X
PARENT / GUARDIAN INFORMATION Study code:
FATHER: MOTHER:
Surname: Surname:
Name: Name:
Occupation: Occupation:
Age: Age:
Cell number: Cell number:
CHILD’S INFORMATION
Name of child: Child’s Surname:
Date of birth:
Child’s sex: Male Female

118
APPENDIX A2
DEMOGRAPHIC SHEET:
INFORMATION OF THE CHILD: (for office use only)
Study Code: Age:
Please complete information where needed and mark appropriate box with an X
Name of Day
Care facility
child attends:
Child is in day
care: Mornings only:
Full day:
Duration of
pregnancy:
Full term pregnancy
(37 to 42 weeks):
Premature birth
(less than 37
weeks):
Birth position: Normal, head first:
Breach (head up or
lying sideways)
Method of
delivery:
Normal, vaginal
delivery:
Planned
Caesarean
section:
Emergency
Caesarean
section:
This child is the of children in the family.
Were there any
complications, illnesses,
or stress during
pregnancy?
NO YES. Please specify:
Were there any
complications during
labor or delivery?
NO YES. Please specify:
What was your child's birth weight?
What were your child's
Apgar scores?
At 1 minute: At 5
minutes:
Please indicate age/sex of any
siblings.
Does your child have a
history of ear infections?
NO YES.
How many?

119
At what ages?
Does your child currently
take any medication?
NO YES. Please specify:
Does your child have any
allergies?
NO YES. Please specify:
Has your child
experienced any major
injuries or
hospitalisations?
NO YES. Please specify:
Does your child have a
history of seizures?
NO YES. Please specify:
Have your child
experienced any
respiratory problems?
NO YES. Please specify:
Is your child currently
being breastfed?
NO YES. Please specify:
Is your child currently
being bottle fed?
NO YES. Please specify:
Are you experiencing
any feeding difficulties?
NO YES. Please specify:
Do your child frequently
spit up or have reflux?
NO YES. Please specify:
Did your child have
problems with appetite
or weight gain?
NO YES. Please specify:
Have any of the child’s
siblings received or is
currently receiving
occupational therapy?
NO YES. Please specify:
Is there any history of
the Mother and/or
Father receiving
occupational therapy?
NO YES. Please specify:
Have your child achieved
the following skills and
at what age?
Sitting YES / NO Age:
Rolling YES / NO Age:
Belly
crawling
YES / NO Age:
Crawling YES / NO Age:
Cruising YES / NO Age:
Thank you for taking the time to complete this form.

120
APPENDIX A3
DEMOGRAPHIC SHEET: CHILD DAY CARE FACILITIES
(To be kept separate)
1. CHILD DAY CARE FACILITY INFORMATION Study code:
Name:
Tel:
E-mail:
Physical
Address:
Code:
Name of
manager:
Total
number of
children
cared for:
Number of
children
between
age of 7 to
12 months:
Total
number of
caregivers:
Number of
caregivers
per age
group/class
Hours facility
is open:
to

121
APPENDIX B1
INFANT/TODDLER SENSORY PROFILE CAREGIVER QUESTIONNAIRE

122

123

124

125
APPENDIX B2
INFANT/TODDLER SENSORY PROFILE SCORE SHEET

126

127

128
APPENDIX C
TSFI ADMINISTRATION AND SCORE SHEET

129
130
APPENDIX D
ETHICAL CLEARANCE CERTIFICATE

131
APPENDIX E
REQUEST FOR PERMISSION TO CONDUCT RESEARCH –
CHILD DAY CARE FACILITIES
The Manager,
Day care Centre
Dear Sir/Madam,
I am, Marica Botha, an occupational therapist, completing a master
degree at the University of the Witwatersrand. I am doing research
into Sensory Integration assessment of infants: Parent report
questionnaire vs clinician observation report. The normal process
of sensory integration begins before birth and continues
throughout life and involves the child’s ability to interpret and react
to sensory input in the environment. When the sensory integration
process is disordered, problems may occur with learning, motor
skills and behaviour.
In order to accurately assess the sensory functioning of infants, it
is necessary to compare the information gained through parent’s
questionnaires and information gained from therapist observation
testing. This will enable therapists to use accurate assessment for
infant sensory functioning. The study will also compare sensory
functioning of infants born via normal (vaginal) delivery and infants
born via caesarean section.
I would like permission to conduct the research at your day care
facility and request that caregivers/ you hand out information
letters to all parents whose child is between the ages of 7 months
and 12 months. The letter would include a permission slip which
the parents/guardian would fill in and sign. You will also be asked
to complete a short demographic questionnaire, regarding the
facility, with information needed for the study.

132
After the researcher have received the consent and completed forms, an
observational test will be conducted, on the infant, at the day care facility.
This will take 20 minutes to administer and the infant will not experience
any pain. The test will look at, for instance, the infant’s response to being
touched at different places on their bodies e.g. hands, feet, shoulders.
Confidentiality – All personal information will be kept confidential and
secure by the researcher. . Only the researcher will have access to
personal information, on all other documents, a numbering system will be
used to identify subjects.
Marica Botha
If further information is required, the researcher may be contacted at:
082 335 6386
E-mail: [email protected] .
In case of any complaints / problems, please report this to the secretary of
the Human Research Ethical Committee (Medical), University of the
Witwatersrand: Anisa Keshav 011 717-1234.

133
RESPONSE SHEET
I have read the proposed study letter and agree to the research can be
carried out at this day care centre and caregivers will be able to give
the information letters to parents of infants who attend the facility.
Name of Day
care facility:
Manager Name:
Signature:
Date:

134
APPENDIX F1
INFORMATION SHEET FOR PARENTS
Hello.
I am, Marica Botha, an occupational therapist, completing a master
degree at the University of the Witwatersrand. I am doing
research into Sensory integration assessment of infants: Parent
report questionnaire vs clinician observation report.
The normal process of sensory integration begins before birth and
continues throughout life and involves the child’s ability to interpret
and react to sensory input in the environment. When the sensory
integration process is disordered, problems may occur with
learning, motor skills and behaviour.
In order to further develop the assessment of the sensory
functioning of infants, I would like to compare the information
gained through parent’s questionnaires and information gained
from therapist observation testing. This will improve therapist’s
ability to ensure accurate assessments of infant sensory
functioning. The study will also compare sensory functioning of
infants born via normal (vaginal) delivery and infants born via
caesarean section.
I would like to invite you and your infant to take part in this study.
What is involved in the study – If you consent to participate in
this study, the following procedure will be followed:
• You will be asked to complete a demographic questionnaire
with information needed for the study. This information will be
treated as confidential at all times and will be available to
only the researcher who will keep it locked away. No names
or personal details will be published.
135
• You as parent will also be asked to complete a Sensory Profile –
this is a standardised questionnaire with 48 questions about your
infant’s behaviour. For each question you will tick a choice of
how often behaviour occurs (Almost Always, Frequently,
Occasionally, Seldom, or Almost Never). It will take no more
than 15 minutes to complete.
• All forms will be send home from your child’s day care facility. It
will be appreciated if you can complete the forms and send it
back to school (in a sealed envelope provided), as soon as
possible.
• After completing the questionnaire, the researcher will conduct a
standardised observational assessment on your infant. This will
be done at the day care facility. You are welcome to request to
be present, if not, the caregiver will be asked to be present and to
assist where needed. This will take 20 minutes to administer and
your infant will not experience any pain. The test will look at, for
instance, the infant’s response to being touched at different
places on their bodies e.g. hands, feet, shoulders.
• If after this testing your child is found to have problems, you will
immediately be contacted and provided with a resource list of
occupational therapists should you wish to follow up with further
assessment and treatment by a sensory integration certified
therapist.
Are there any Risks of being involved in the study?
Both measures being used in this study are non-invasive and pose no
health risk to you or your infant. All testing will be done with you, or the
caregiver present and if at any time it is felt that the infant is
uncomfortable, testing will be discontinued.
Participation is voluntary, this means that refusal to participate will
involve no penalty or loss of benefits to which the participant is
otherwise entitled, and you may discontinue participation at any time
without penalty or loss of benefits.

136
Confidentiality – All efforts will be made to keep personal information
confidential. Only the researcher will have access to personal
information, on all other documents, a numbering system will be used to
identify subjects. However, personal information may be disclosed if
required by law. All data from the study will be stored in a secure location
for 6 years according to HPCSA regulations.
Benefits of being in the study –
Benefits of participating in this study are that your child will receive
sensory integration evaluation, and if any problems are detected, you will
be immediately informed and you will have the option of following up with
therapy for your child immediately. Research has shown that early
intervention with sensory integration and developmental problems are
very important.
The participants will be given pertinent information on the study while
involved in the project and after the results are available.
Marica Botha
If further information is required, the researcher may be contacted at:
Marica Botha
082 335 6386
E-mail: [email protected]
In case of any complaints / problems, please report this to the secretary
of the Human Research Ethical Committee (Medical), University of the
Witwatersrand: Anisa Keshav 011 717-1234.

137
APPENDIX F2
INFORMED CONSENT
Study title - Parent report questionnaire vs clinician observation report.
I, (full name and surname), parent / guardian
of (full name and surname of infant) hereby
acknowledge the following:
• I have read, and fully understood the information sheet regarding the
aforementioned research project.
• I have been given the opportunity to ask questions arising from the
information, and all my questions have been answered to my
satisfaction.
• I feel that I have been given enough information regarding the
research project.
I hereby give my informed consent to the following:
• That my child may be tested by the researcher, as explained in the
information sheet, for the said research.
• That may the need arise, the session may be videotaped at the
discretion of the researcher.
Signature: Researcher:
Signature :
Date:
Date:
Witness Signature:
Date:
Related Documents


