Evaluation of the Sebia Capillarys 3 Tera and the Bio-Rad D-100 Systems for the Measurement of Hemoglobin A 1c Margaux Herpol, MD, Katrien Lanckmans, PhD, Stefaan Van Neyghem, Pascale Clement, Stefanie Crevits, Kim De Crem, MS, Frans K. Gorus, MD, PhD, and Ilse Weets, MD, PhD From the Department of Clinical Chemistry and Radio-Immunology, Universitair Ziekenhuis Brussel, Brussels, Belgium. Key Words: Analytical performance; Capillary zone electrophoresis; Hemoglobin A 1c ; HPLC Am J Clin Pathol July 2016;146:67-77 DOI: 10.1093/AJCP/AQW081 ABSTRACT Objectives: We evaluated the Bio-Rad (Irvine, CA) D-100 and the Sebia (Lisses, France) Capillarys 3 Tera for the measure- ment of hemoglobin A 1c (HbA 1c ) in venous blood samples. Methods: Whole-blood samples and control material were analyzed with the D-100 and Capillarys 3 Tera and com- pared with our routine method, HLC-723G7 (Tosoh, Tokyo, Japan). An evaluation protocol to test precision, trueness, linearity, carryover, and selectivity was set up according to Clinical and Laboratory Standards Institute guidelines. The results were presented in National Glycohemoglobin Standardization Program and International Federation of Clinical Chemistry (IFCC) units. Results: Both systems showed excellent precision (total co- efficients of variation <2%, IFCC) and bias (<0.3% or 3 mmol/mol). Linearity was demonstrated for HbA 1c values from 3.8% (18 mmol/mol) to 18.5% (179 mmol/mol). Results were correlated with the routine method using Bland- Altman analysis, showing a mean difference of 0.33% or 3.6 mmol/mol for the D-100 and of 0.25% or 2.6 mmol/mol for the Capillarys 3 Tera vs HLC-723G7. None of the auto- mated instruments were prone to interferences by labile HbA 1c (10 g/L glucose), carbamylated hemoglobin (0.5 mmol/L potassium cyanate), hemoglobin variants, bilirubin (15 mg/dL), and triglycerides (3,360 mg/dL). Conclusions: The Bio-Rad D-100 and the Sebia Capillarys 3 Tera instruments performed well for the determination of HbA 1c in terms of quality criteria as well as for sample throughput. The prevalence and incidence of diabetes are on the rise worldwide. If current trends continue, it is expected that there will be more than 592 million patients with diabetes by 2035. 1 Hemoglobin (Hb) A 1c (HbA 1c )—a result of the nonenzymatic covalent binding of glucose on N-terminal valine residues of hemoglobin b chains—is presently the most important marker for monitoring of glycemic control in daily clinical practice. It is associated with risk of chronic complications in both type 1 and type 2 diabetes mellitus. This risk rises exponentially with increasing mean HbA 1c . 2 In 2010, the American Diabetes Association (ADA) introduced HbA 1c as an additional parameter for the diagno- sis of diabetes. 3 Therefore, the role of HbA 1c as a biomarker for glycemic control and diagnosis will only become more important. Major efforts have been made to standardize the HbA 1c determination. HbA 1c values were initially aligned with the Diabetes Control and Complications Trial Research Group 2 and are currently standardized according to the International Federation of Clinical Chemistry (IFCC) reference method. 4,5 This evolution toward stand- ardization of the HbA 1c determination was paralleled by the introduction of more stringent criteria for precision and accuracy (WIV-ISP, Scientific Institute of Public Health, Brussels, Belgium), as well as for diabetes control. 6,7 In addition, point-of-care (POC) devices were introduced in second-line (diabetes clinics) and first-line (general practi- tioner) health care. Although quality of the POC systems has improved, only few devices meet acceptable perform- ance criteria. 5,8,9 Recently, Sebia (Lisses, France) and Bio- Rad (Irvine, CA) have launched new automated analyzers not only to meet the more stringent analytical © American Society for Clinical Pathology, 2016. All rights reserved. For permissions, please e-mail: [email protected] Am J Clin Pathol 2016;146:67-77 67 DOI: 10.1093/ajcp/aqw081 67 AJCP /ORIGINAL ARTICLE Downloaded from https://academic.oup.com/ajcp/article/146/1/67/1730623 by guest on 31 August 2022

Welcome message from author
This document is posted to help you gain knowledge. Please leave a comment to let me know what you think about it! Share it to your friends and learn new things together.
Transcript
Evaluation of the Sebia Capillarys 3 Tera and the Bio-RadD-100 Systems for the Measurement of Hemoglobin A1c
Margaux Herpol, MD, Katrien Lanckmans, PhD, Stefaan Van Neyghem, Pascale Clement,Stefanie Crevits, Kim De Crem, MS, Frans K. Gorus, MD, PhD, and Ilse Weets, MD, PhD
From the Department of Clinical Chemistry and Radio-Immunology, Universitair Ziekenhuis Brussel, Brussels, Belgium.
Key Words: Analytical performance; Capillary zone electrophoresis; Hemoglobin A1c; HPLC
Am J Clin Pathol July 2016;146:67-77
DOI: 10.1093/AJCP/AQW081
ABSTRACT
Objectives: We evaluated the Bio-Rad (Irvine, CA) D-100 and
the Sebia (Lisses, France) Capillarys 3 Tera for the measure-
ment of hemoglobin A1c (HbA1c) in venous blood samples.
Methods: Whole-blood samples and control material were
analyzed with the D-100 and Capillarys 3 Tera and com-
pared with our routine method, HLC-723G7 (Tosoh, Tokyo,
Japan). An evaluation protocol to test precision, trueness,
linearity, carryover, and selectivity was set up according to
Clinical and Laboratory Standards Institute guidelines. The
results were presented in National Glycohemoglobin
Standardization Program and International Federation of
Clinical Chemistry (IFCC) units.
Results: Both systems showed excellent precision (total co-
efficients of variation<2%, IFCC) and bias (<0.3% or
3 mmol/mol). Linearity was demonstrated for HbA1c values
from 3.8% (18 mmol/mol) to 18.5% (179 mmol/mol). Results
were correlated with the routine method using Bland-
Altman analysis, showing a mean difference of 0.33% or
3.6 mmol/mol for the D-100 and of 0.25% or 2.6 mmol/mol
for the Capillarys 3 Tera vs HLC-723G7. None of the auto-
mated instruments were prone to interferences by labile
HbA1c (�10 g/L glucose), carbamylated hemoglobin
(�0.5 mmol/L potassium cyanate), hemoglobin variants,
bilirubin (�15 mg/dL), and triglycerides (�3,360 mg/dL).
Conclusions: The Bio-Rad D-100 and the Sebia Capillarys
3 Tera instruments performed well for the determination of
HbA1c in terms of quality criteria as well as for sample
throughput.
The prevalence and incidence of diabetes are on the rise
worldwide. If current trends continue, it is expected that
there will be more than 592 million patients with diabetes
by 2035.1 Hemoglobin (Hb) A1c (HbA1c)—a result of the
nonenzymatic covalent binding of glucose on N-terminal
valine residues of hemoglobin b chains—is presently the
most important marker for monitoring of glycemic control
in daily clinical practice. It is associated with risk of chronic
complications in both type 1 and type 2 diabetes mellitus.
This risk rises exponentially with increasing mean HbA1c.2
In 2010, the American Diabetes Association (ADA)
introduced HbA1c as an additional parameter for the diagno-
sis of diabetes.3 Therefore, the role of HbA1c as a biomarker
for glycemic control and diagnosis will only become more
important.
Major efforts have been made to standardize the
HbA1c determination. HbA1c values were initially aligned
with the Diabetes Control and Complications Trial
Research Group2 and are currently standardized according
to the International Federation of Clinical Chemistry
(IFCC) reference method.4,5 This evolution toward stand-
ardization of the HbA1c determination was paralleled by
the introduction of more stringent criteria for precision and
accuracy (WIV-ISP, Scientific Institute of Public Health,
Brussels, Belgium), as well as for diabetes control.6,7 In
addition, point-of-care (POC) devices were introduced in
second-line (diabetes clinics) and first-line (general practi-
tioner) health care. Although quality of the POC systems
has improved, only few devices meet acceptable perform-
ance criteria.5,8,9 Recently, Sebia (Lisses, France) and Bio-
Rad (Irvine, CA) have launched new automated analyzers
not only to meet the more stringent analytical
© American Society for Clinical Pathology, 2016. All rights reserved.For permissions, please e-mail: [email protected]
Am J Clin Pathol 2016;146:67-77 67DOI: 10.1093/ajcp/aqw081
67
AJCP / ORIGINAL ARTICLE
Dow
nloaded from https://academ
ic.oup.com/ajcp/article/146/1/67/1730623 by guest on 31 August 2022
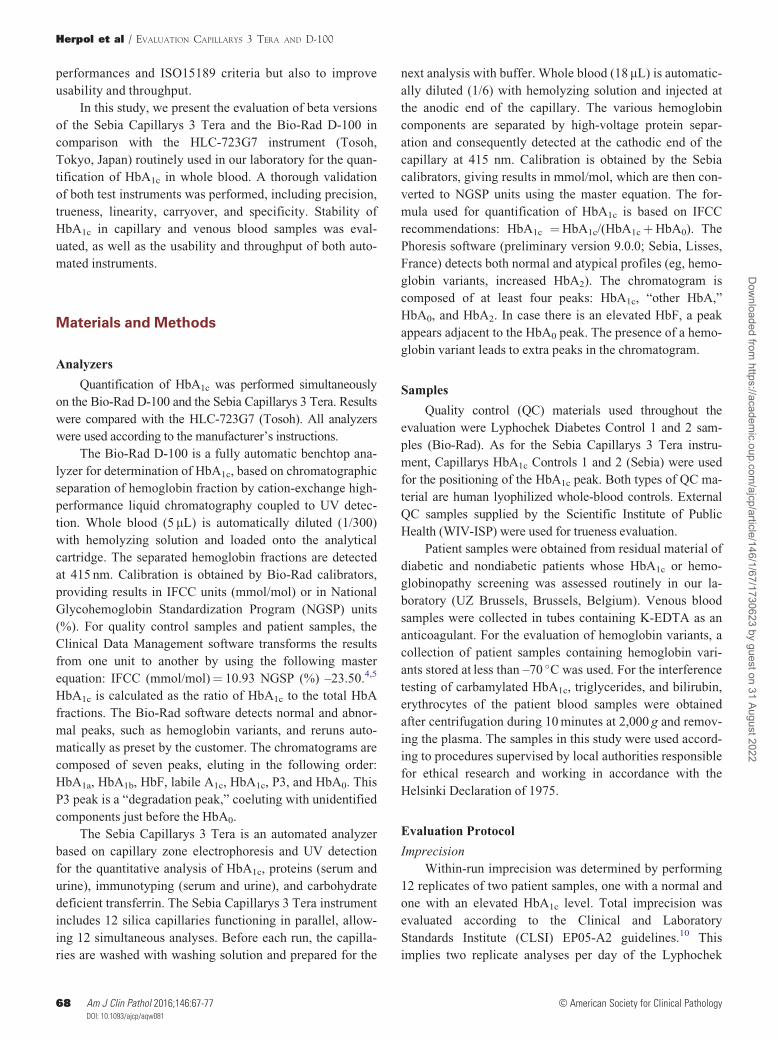
performances and ISO15189 criteria but also to improve
usability and throughput.
In this study, we present the evaluation of beta versions
of the Sebia Capillarys 3 Tera and the Bio-Rad D-100 in
comparison with the HLC-723G7 instrument (Tosoh,
Tokyo, Japan) routinely used in our laboratory for the quan-
tification of HbA1c in whole blood. A thorough validation
of both test instruments was performed, including precision,
trueness, linearity, carryover, and specificity. Stability of
HbA1c in capillary and venous blood samples was eval-
uated, as well as the usability and throughput of both auto-
mated instruments.
Materials and Methods
Analyzers
Quantification of HbA1c was performed simultaneously
on the Bio-Rad D-100 and the Sebia Capillarys 3 Tera. Results
were compared with the HLC-723G7 (Tosoh). All analyzers
were used according to the manufacturer’s instructions.
The Bio-Rad D-100 is a fully automatic benchtop ana-
lyzer for determination of HbA1c, based on chromatographic
separation of hemoglobin fraction by cation-exchange high-
performance liquid chromatography coupled to UV detec-
tion. Whole blood (5 mL) is automatically diluted (1/300)
with hemolyzing solution and loaded onto the analytical
cartridge. The separated hemoglobin fractions are detected
at 415 nm. Calibration is obtained by Bio-Rad calibrators,
providing results in IFCC units (mmol/mol) or in National
Glycohemoglobin Standardization Program (NGSP) units
(%). For quality control samples and patient samples, the
Clinical Data Management software transforms the results
from one unit to another by using the following master
equation: IFCC (mmol/mol)¼ 10.93 NGSP (%) –23.50.4,5
HbA1c is calculated as the ratio of HbA1c to the total HbA
fractions. The Bio-Rad software detects normal and abnor-
mal peaks, such as hemoglobin variants, and reruns auto-
matically as preset by the customer. The chromatograms are
composed of seven peaks, eluting in the following order:
HbA1a, HbA1b, HbF, labile A1c, HbA1c, P3, and HbA0. This
P3 peak is a “degradation peak,” coeluting with unidentified
components just before the HbA0.
The Sebia Capillarys 3 Tera is an automated analyzer
based on capillary zone electrophoresis and UV detection
for the quantitative analysis of HbA1c, proteins (serum and
urine), immunotyping (serum and urine), and carbohydrate
deficient transferrin. The Sebia Capillarys 3 Tera instrument
includes 12 silica capillaries functioning in parallel, allow-
ing 12 simultaneous analyses. Before each run, the capilla-
ries are washed with washing solution and prepared for the
next analysis with buffer. Whole blood (18mL) is automatic-
ally diluted (1/6) with hemolyzing solution and injected at
the anodic end of the capillary. The various hemoglobin
components are separated by high-voltage protein separ-
ation and consequently detected at the cathodic end of the
capillary at 415 nm. Calibration is obtained by the Sebia
calibrators, giving results in mmol/mol, which are then con-
verted to NGSP units using the master equation. The for-
mula used for quantification of HbA1c is based on IFCC
recommendations: HbA1c ¼HbA1c/(HbA1cþHbA0). The
Phoresis software (preliminary version 9.0.0; Sebia, Lisses,
France) detects both normal and atypical profiles (eg, hemo-
globin variants, increased HbA2). The chromatogram is
composed of at least four peaks: HbA1c, “other HbA,”
HbA0, and HbA2. In case there is an elevated HbF, a peak
appears adjacent to the HbA0 peak. The presence of a hemo-
globin variant leads to extra peaks in the chromatogram.
Samples
Quality control (QC) materials used throughout the
evaluation were Lyphochek Diabetes Control 1 and 2 sam-
ples (Bio-Rad). As for the Sebia Capillarys 3 Tera instru-
ment, Capillarys HbA1c Controls 1 and 2 (Sebia) were used
for the positioning of the HbA1c peak. Both types of QC ma-
terial are human lyophilized whole-blood controls. External
QC samples supplied by the Scientific Institute of Public
Health (WIV-ISP) were used for trueness evaluation.
Patient samples were obtained from residual material of
diabetic and nondiabetic patients whose HbA1c or hemo-
globinopathy screening was assessed routinely in our la-
boratory (UZ Brussels, Brussels, Belgium). Venous blood
samples were collected in tubes containing K-EDTA as an
anticoagulant. For the evaluation of hemoglobin variants, a
collection of patient samples containing hemoglobin vari-
ants stored at less than –70 �C was used. For the interference
testing of carbamylated HbA1c, triglycerides, and bilirubin,
erythrocytes of the patient blood samples were obtained
after centrifugation during 10 minutes at 2,000 g and remov-
ing the plasma. The samples in this study were used accord-
ing to procedures supervised by local authorities responsible
for ethical research and working in accordance with the
Helsinki Declaration of 1975.
Evaluation Protocol
Imprecision
Within-run imprecision was determined by performing
12 replicates of two patient samples, one with a normal and
one with an elevated HbA1c level. Total imprecision was
evaluated according to the Clinical and Laboratory
Standards Institute (CLSI) EP05-A2 guidelines.10 This
implies two replicate analyses per day of the Lyphochek
Herpol et al / EVALUATION CAPILLARYS 3 TERA AND D-100
68 Am J Clin Pathol 2016;146:67-77 © American Society for Clinical Pathology68 DOI: 10.1093/ajcp/aqw081
Dow
nloaded from https://academ
ic.oup.com/ajcp/article/146/1/67/1730623 by guest on 31 August 2022
controls (levels 1 and 2) during 20 days. Imprecision on
Capillarys 3 was measured on each of the 12 capillaries. A
Grubbs test was performed to detect outliers, followed by
calculation of the mean, standard deviation, and percent co-
efficient of variation (CV%).
Trueness
Trueness has been evaluated according to CLSI EP9-
A2 guidelines11 by analyzing 12 external QC samples of the
national health care survey, supplied by the WIV-ISP
(2014). The experimentally obtained HbA1c results were
compared with assigned values (both in IFCC and NGSP
units). Linear regression analysis was performed and bias
was estimated at HbA1c levels of 5% (31 mmol/mol), 8%
(64 mmol/mol), and 11% (97 mmol/mol).
Linearity
Linearity was assessed in two ways: first by using the
Bio-Rad Lyphochek Hemoglobin A1c linearity kit, com-
posed of lyophilized whole-blood samples, and, second, by
using patient samples according to the CLSI EP06-A guide-
lines12 and measuring HbA1c of samples prepared by pro-
portional mixing of two samples with a high (16.2%;
154 mmol/mol) and a low (5.2%; 33 mmol/mol) HbA1c. The
patient samples had similar but slightly different total hemo-
globin concentrations (14.8 and 16.3 g/dL): it is not
excluded that this could have an impact on the linearity re-
sults. Linear regression analysis was performed using the
coefficient of correlation (R), comparing expected values
with obtained values.
Carryover
Carryover was tested by analyzing blood samples with a
high (H) and low (L) concentration of HbA1c in the following
order: L, L, L, H, H, L, H, H, L, L, L, L, H, H, L, H, H, L, H,
H, L (EP Evaluator Release 9 protocol, Data Innovations,
Burlington, VT). Carryover was calculated by the mean of the
high-low results minus the mean of the low-low results. The
error limit is defined as three times the SD of the low-low
results. Carryover could be suspected if the calculated carry-
over is higher than the error limit.
Method Comparison
HbA1c results of both test instruments were compared
with the results obtained with the routine method (Tosoh
HLC-723G7). Samples from 173 patients were included.
The HbA1c range was between 3.6% (16 mmol/mol) and
16.2% (154 mmol/mol), and none of the samples contained
hemoglobin variants. The samples were analyzed over 30
operating days, followed by outlier detection according to
the CLSI EP9-A2 guidelines.11 Data were further analyzed
using Passing-Bablok regression analysis and a Bland-
Altman plot.
Interference Testing
The protocol that was used for the assessment of inter-
fering substances has been previously described by our la-
boratory.13 According to the CLSI EP7-A2 guidelines,14 the
possible error caused by potentially interfering substances
(such as labile HbA1c, carbamylated hemoglobin, bilirubin,
triglycerides, hemoglobin content, and hemoglobin variants)
was compared with an allowable error. The applied allow-
able error was derived from the national health care survey
of the WIV-ISP—namely, 0.3% NGSP units and 3 mmol/L
IFCC units7 ( Table 1 , good absolute bias).
Labile HbA1c. The interference of labile HbA1c on
HbA1c measurements was assessed with three patient sam-
ples containing a normal (5.5%; 37 mmol/mol), medium
(8.2%; 66 mmol/mol), and high (12.2%; 109 mmol) HbA1c
level. The samples were spiked with five different amounts
of glucose solution (up to 5,000 mg/dL) and incubated at
37 �C for 3 hours with mixing every 30 minutes. After dupli-
cate analysis, the absolute bias was calculated.
Carbamylated HbA1c. Erythrocytes of three patients
with a normal (5.0%; 31 mmol/mol), medium (9.0%;
75 mmol/mol), and high (13.3%; 122 mmol) HbA1c concen-
tration were incubated with various concentrations (0.15, 0.5,
and 1 mmol/L) of potassium cyanate (KCNO) to generate
in vitro carbamylation of HbA1c. After incubation at 37 �C
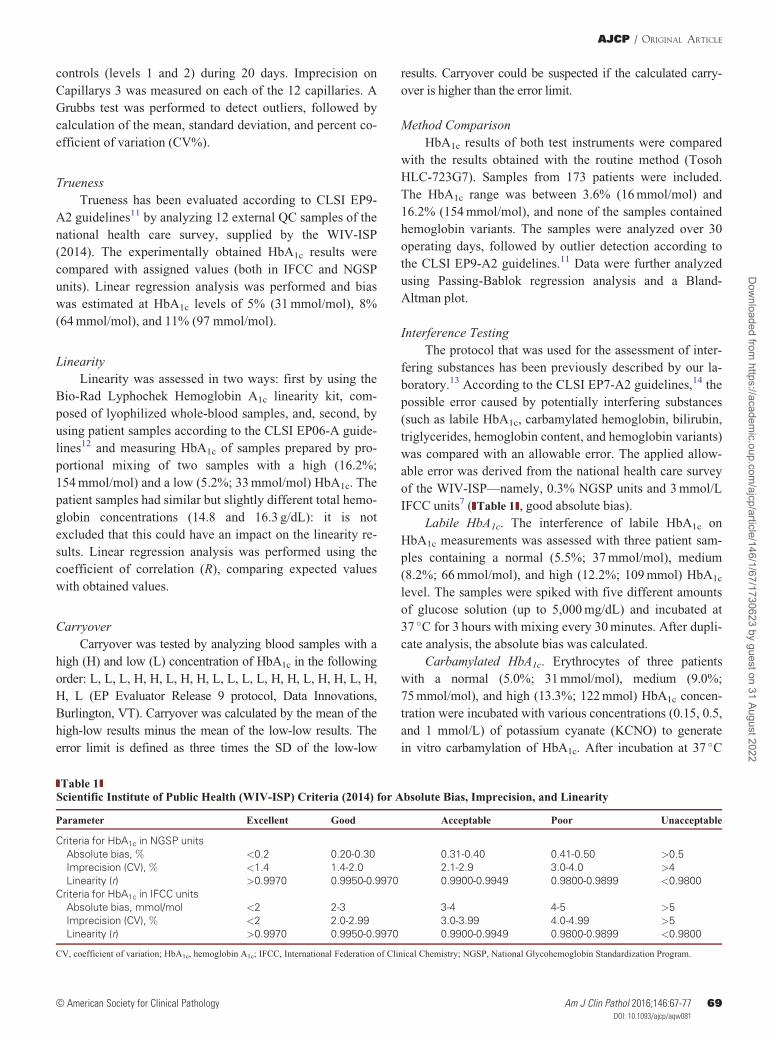
Table 1Scientific Institute of Public Health (WIV-ISP) Criteria (2014) for Absolute Bias, Imprecision, and Linearity
Parameter Excellent Good Acceptable Poor Unacceptable
Criteria for HbA1c in NGSP units
Absolute bias, % <0.2 0.20-0.30 0.31-0.40 0.41-0.50 >0.5
Imprecision (CV), % <1.4 1.4-2.0 2.1-2.9 3.0-4.0 >4
Linearity (r) >0.9970 0.9950-0.9970 0.9900-0.9949 0.9800-0.9899 <0.9800
Criteria for HbA1c in IFCC units
Absolute bias, mmol/mol <2 2-3 3-4 4-5 >5
Imprecision (CV), % <2 2.0-2.99 3.0-3.99 4.0-4.99 >5
Linearity (r) >0.9970 0.9950-0.9970 0.9900-0.9949 0.9800-0.9899 <0.9800
CV, coefficient of variation; HbA1c, hemoglobin A1c; IFCC, International Federation of Clinical Chemistry; NGSP, National Glycohemoglobin Standardization Program.
AJCP / ORIGINAL ARTICLE
© American Society for Clinical Pathology Am J Clin Pathol 2016;146:67-77 69DOI: 10.1093/ajcp/aqw08169
Dow
nloaded from https://academ
ic.oup.com/ajcp/article/146/1/67/1730623 by guest on 31 August 2022
for 3 hours and mixing every 30 minutes, the RBCs were
resuspended in their corresponding plasma. All samples were
analyzed in duplicate, and absolute bias values were
calculated.
Triglycerides and bilirubin. Interference of triglycer-
ides and bilirubin was performed with three patient sam-
ples with a normal (5.5%; 37 mmol/mol), medium (8.1%;
65 mmol/mol), and high (10.0%; 86 mmol/mol) HbA1c
concentration. Erythrocytes of these samples were mixed
(50:50 v/v) with various dilutions of triglyceride-rich
and bilirubin-rich plasma up to a final concentration of re-
spectively 3,361 mg/dL and 14 mg/dL. All samples were
analyzed in duplicate, and absolute bias values were
calculated.
Hemoglobin content. The effect of the hemoglobin con-
centration on the measurement of HbA1c was evaluated by
diluting a whole-blood sample containing a normal HbA1c
and a high hemoglobin concentration (16.8 g/dl) with saline,
obtaining hemoglobin values ranging from 5.0 to 16.8 g/dL.
After analysis, the absolute bias was calculated.
Hemoglobin variants. The influence of hemoglobin
variants on the measurement of HbA1c on both test instru-
ments was investigated using patient samples containing
HbS (n¼ 20), HbD (n¼ 5), HbE (n¼ 2), and HbC (n¼ 5).
The HbA1c concentrations of these samples were compared
with the results obtained with a Sebia Capillarys 2 Flex ana-
lyzer. This analyzer was evaluated in 2013 in our laboratory
for detection of hemoglobin variants.13 The HbA1c results
were further analyzed using Passing-Bablok regression ana-
lysis and a Bland-Altman plot.
Stability of HbA1c
The stability of venous blood samples at 2�C to 8 �C
was assessed by repeated analysis of three patient samples
with normal (5.5%; 37 mmol/mol), medium (8.0%;
63 mmol/mol), and high (12.5%; 113 mmol/mol) HbA1c
concentration during 3 weeks on both test instruments.
Room temperature stability of blood, contained in the
Bio-Rad Hemoglobin Capillary Collection System (HCCS)
for HbA1C analysis, was briefly evaluated by transferring
5 mL of venous blood samples (n¼ 5) in the HCCS. The ca-
pillary collection systems, containing a hemolyzing solu-
tion, were stored during 1 week and analyzed on days 0, 1,
3, 4, and 7. The samples were tested on the Bio-Rad D-100
analyzer. Chromatograms were visually evaluated, and ab-
solute bias was calculated.
Detection of Hemoglobin Variants
The capacity of demonstrating the presence of hemo-
globin variants in the HbA1c modus was investigated using
samples containing common hemoglobin variants such as
HbS, HbD, and HbE, as well as more rare variants or double
heterozygotes such as HbO-Arabe, HbSC, HbH, HbSS,
HbEE, HbCD, HbJ-Toronto, HbS/HbG Philadelphia,
HbA20, HbG Philadelphia, and HbH Barts.
Sample Throughput
A set of 150 patient samples was analyzed for HbA1c
on both systems. The set comprised K-EDTA tubes of dif-
ferent sizes and from different manufacturers. The duration
of the batch analysis was counted from startup of the system
and included analysis of two levels of internal quality con-
trol material at the beginning and end of the run.
Results
Imprecision
At normal and high HbA1c levels, within-run and total
CV% were below 1.4% (NGSP units) and below 2% (IFCC
units) for both analyzers Table 2 , showing excellent preci-
sion, based on the analytical goals from the national health
care survey of WIV-ISP (Table 1).7
Trueness
Twelve external QC samples ranging between 5.2%
(33 mmol/mol) and 9.5% (80 mmol/mol) were analyzed on
both systems. Absolute bias values at three HbA1c levels
are shown in Table 1. Linear regression analysis showed a
slope of 0.93 (IFCC units; slope¼ 0.93) and an intercept of
0.43 (IFCC units; intercept¼ 3.1) for the Bio-Rad D-100
and a slope of 1.02 (IFCC units; slope¼ 1.03) and intercept
of –0.27 (IFCC units; intercept¼ –2.7) for the Sebia
Capillarys 3 Tera. According to the analytical goals of the
WIV-ISP7 (Table 1), there is an excellent trueness on all
levels for the Sebia Capillarys 3 Tera, while the Bio-Rad
D-100 shows a slightly negative bias in the high concentra-
tion range but still acceptable according to the WIV-ISP
criteria.
Linearity
Using the Bio-Rad linearity kit, linearity was demon-
strated for HbA1c values ranging from 3.8% (18 mmol/mol)
to 18.5% (179 mmol/mol). For both analyzers, linearity was
excellent (R> 0.997) according to the analytical goals of
the WIV-ISP7 (Table 1). Slope, intercept, and correlation
coefficient are shown in Table 2. Since there is a significant
bias for the Bio-Rad linearity kit and no bias for routine
samples, it is likely that there is a matrix effect for this
linearity kit analyzed by capillary electrophoresis. Results
were similar when using mixtures of two patient sam-
ples with high and low HbA1c, although the range was
Herpol et al / EVALUATION CAPILLARYS 3 TERA AND D-100
70 Am J Clin Pathol 2016;146:67-77 © American Society for Clinical Pathology70 DOI: 10.1093/ajcp/aqw081
Dow
nloaded from https://academ
ic.oup.com/ajcp/article/146/1/67/1730623 by guest on 31 August 2022
slightly narrower—namely, 5.0% (31 mmol/mol) to 15.3%
(143 mmol/mol). Linearity of the Sebia method using the
sample dilution protocol was good (NGSP units) to excel-
lent (IFCC units).
Carryover
A carryover of 0.12% and –0.02% was calculated for
respectively the Bio-Rad D-100 and Sebia Capillarys 3 Tera
when analyzed in NGSP units. Both results are lower than
the respective error limits (1.16 for the Bio-Rad D-100 and
0.00 for the Sebia Capillarys 3 Tera). Therefore, there was
no significant carryover detected between high and low
HbA1c samples. Similar results (ie, no carryover) were
found when analyzing the data in IFCC units.
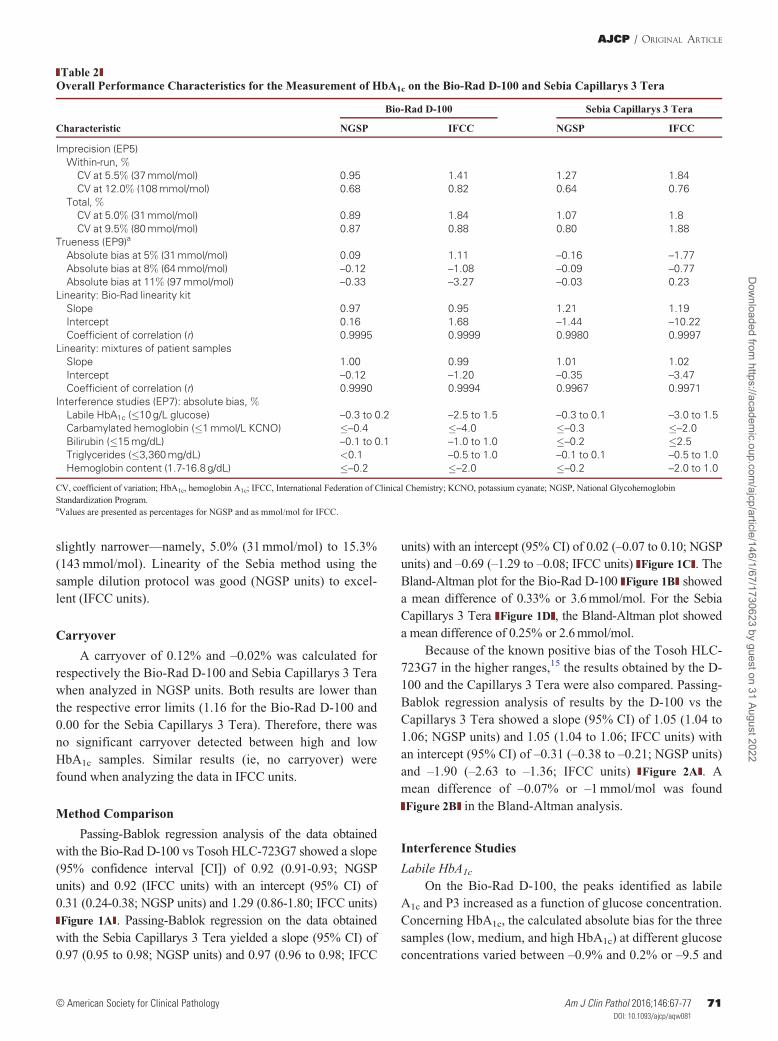
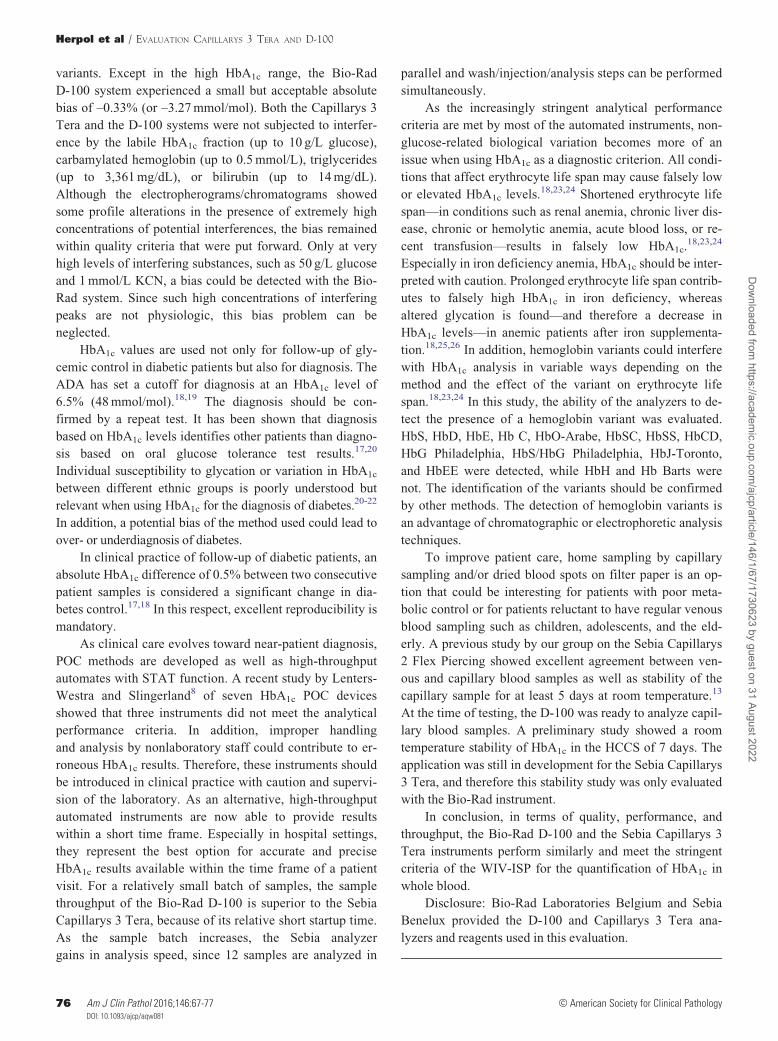
Method Comparison
Passing-Bablok regression analysis of the data obtained
with the Bio-Rad D-100 vs Tosoh HLC-723G7 showed a slope
(95% confidence interval [CI]) of 0.92 (0.91-0.93; NGSP
units) and 0.92 (IFCC units) with an intercept (95% CI) of
0.31 (0.24-0.38; NGSP units) and 1.29 (0.86-1.80; IFCC units)
Figure 1A . Passing-Bablok regression on the data obtained
with the Sebia Capillarys 3 Tera yielded a slope (95% CI) of
0.97 (0.95 to 0.98; NGSP units) and 0.97 (0.96 to 0.98; IFCC
units) with an intercept (95% CI) of 0.02 (–0.07 to 0.10; NGSP
units) and –0.69 (–1.29 to –0.08; IFCC units) Figure 1C . The
Bland-Altman plot for the Bio-Rad D-100 Figure 1B showed
a mean difference of 0.33% or 3.6 mmol/mol. For the Sebia
Capillarys 3 Tera Figure 1D , the Bland-Altman plot showed
a mean difference of 0.25% or 2.6 mmol/mol.
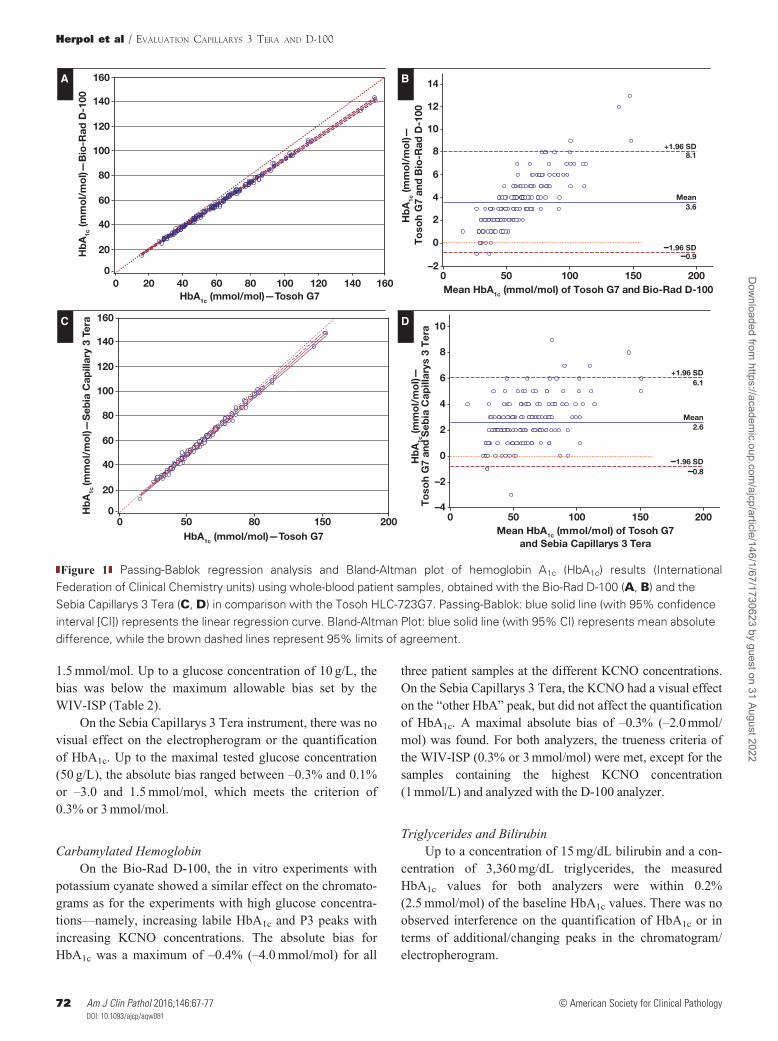
Because of the known positive bias of the Tosoh HLC-
723G7 in the higher ranges,15 the results obtained by the D-
100 and the Capillarys 3 Tera were also compared. Passing-
Bablok regression analysis of results by the D-100 vs the
Capillarys 3 Tera showed a slope (95% CI) of 1.05 (1.04 to
1.06; NGSP units) and 1.05 (1.04 to 1.06; IFCC units) with
an intercept (95% CI) of –0.31 (–0.38 to –0.21; NGSP units)
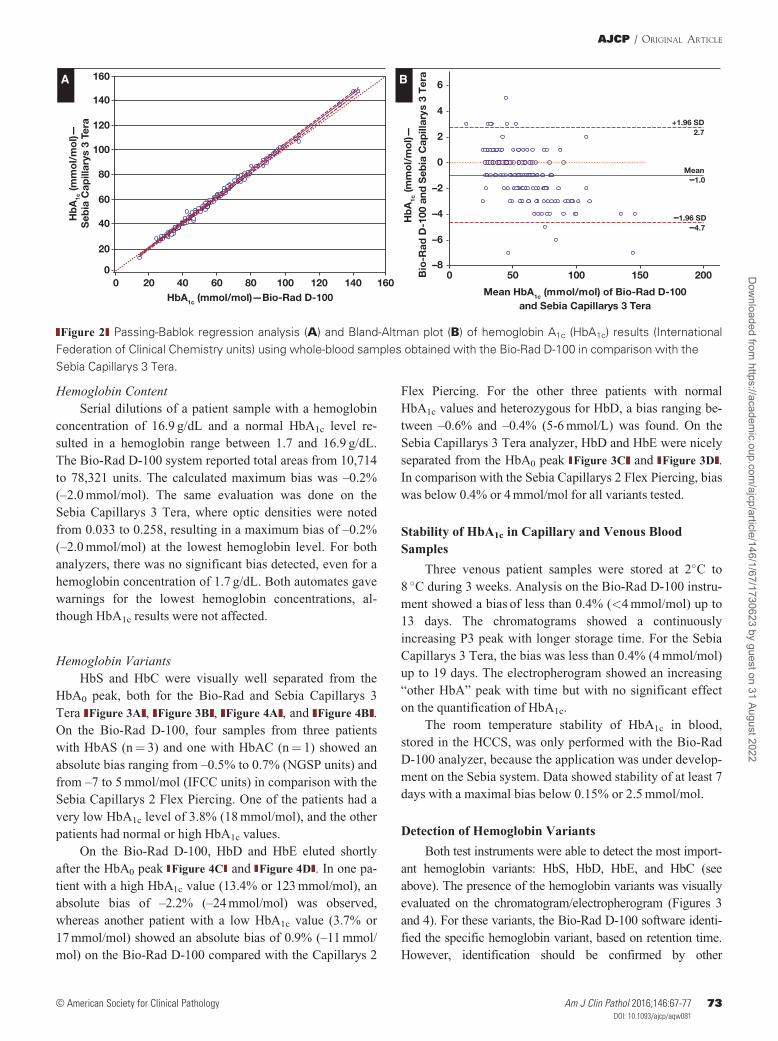
and –1.90 (–2.63 to –1.36; IFCC units) Figure 2A . A
mean difference of –0.07% or –1 mmol/mol was found
Figure 2B in the Bland-Altman analysis.
Interference Studies
Labile HbA1c
On the Bio-Rad D-100, the peaks identified as labile
A1c and P3 increased as a function of glucose concentration.
Concerning HbA1c, the calculated absolute bias for the three
samples (low, medium, and high HbA1c) at different glucose
concentrations varied between –0.9% and 0.2% or –9.5 and
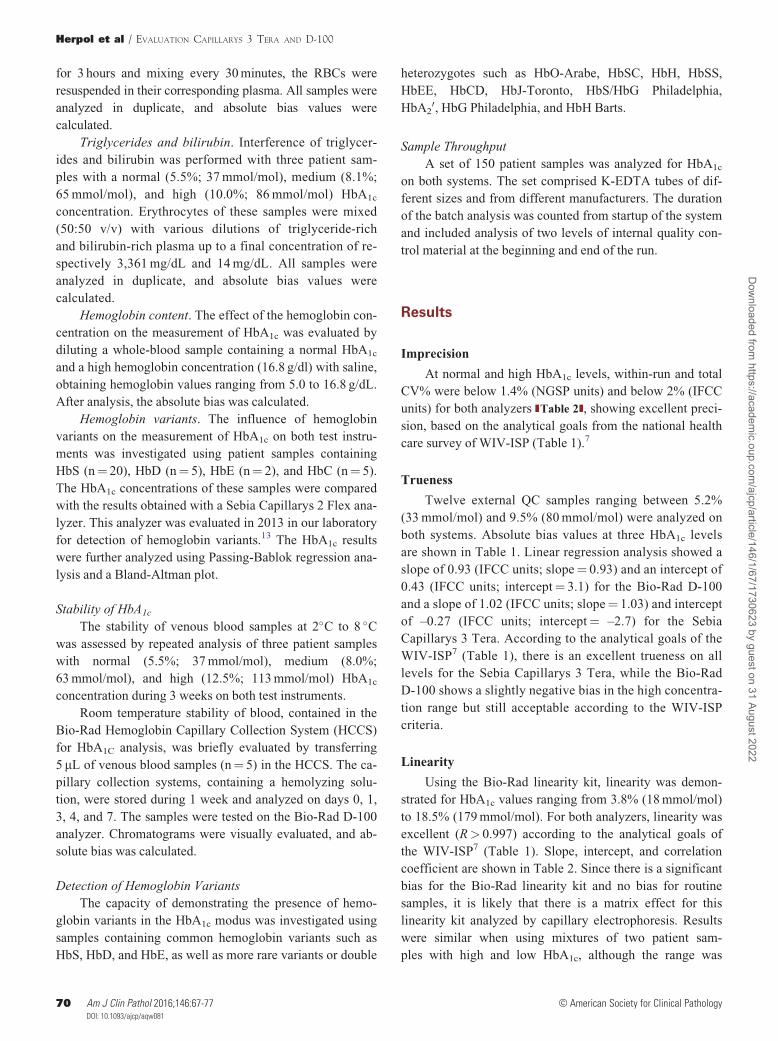
Table 2Overall Performance Characteristics for the Measurement of HbA1c on the Bio-Rad D-100 and Sebia Capillarys 3 Tera
Bio-Rad D-100 Sebia Capillarys 3 Tera
Characteristic NGSP IFCC NGSP IFCC
Imprecision (EP5)
Within-run, %CV at 5.5% (37 mmol/mol) 0.95 1.41 1.27 1.84
CV at 12.0% (108 mmol/mol) 0.68 0.82 0.64 0.76
Total, %CV at 5.0% (31 mmol/mol) 0.89 1.84 1.07 1.8
CV at 9.5% (80 mmol/mol) 0.87 0.88 0.80 1.88
Trueness (EP9)a
Absolute bias at 5% (31 mmol/mol) 0.09 1.11 –0.16 –1.77
Absolute bias at 8% (64 mmol/mol) –0.12 –1.08 –0.09 –0.77
Absolute bias at 11% (97 mmol/mol) –0.33 –3.27 –0.03 0.23
Linearity: Bio-Rad linearity kit
Slope 0.97 0.95 1.21 1.19
Intercept 0.16 1.68 –1.44 –10.22
Coefficient of correlation (r) 0.9995 0.9999 0.9980 0.9997
Linearity: mixtures of patient samples
Slope 1.00 0.99 1.01 1.02
Intercept –0.12 –1.20 –0.35 –3.47
Coefficient of correlation (r) 0.9990 0.9994 0.9967 0.9971
Interference studies (EP7): absolute bias, %Labile HbA1c (�10 g/L glucose) –0.3 to 0.2 –2.5 to 1.5 –0.3 to 0.1 –3.0 to 1.5
Carbamylated hemoglobin (�1 mmol/L KCNO) �–0.4 �–4.0 �–0.3 �–2.0
Bilirubin (�15 mg/dL) –0.1 to 0.1 –1.0 to 1.0 �–0.2 �2.5
Triglycerides (�3,360 mg/dL) <0.1 –0.5 to 1.0 –0.1 to 0.1 –0.5 to 1.0
Hemoglobin content (1.7-16.8 g/dL) �–0.2 �–2.0 �–0.2 –2.0 to 1.0
CV, coefficient of variation; HbA1c, hemoglobin A1c; IFCC, International Federation of Clinical Chemistry; KCNO, potassium cyanate; NGSP, National Glycohemoglobin
Standardization Program.aValues are presented as percentages for NGSP and as mmol/mol for IFCC.
AJCP / ORIGINAL ARTICLE
© American Society for Clinical Pathology Am J Clin Pathol 2016;146:67-77 71DOI: 10.1093/ajcp/aqw08171
Dow
nloaded from https://academ
ic.oup.com/ajcp/article/146/1/67/1730623 by guest on 31 August 2022
1.5 mmol/mol. Up to a glucose concentration of 10 g/L, the
bias was below the maximum allowable bias set by the
WIV-ISP (Table 2).
On the Sebia Capillarys 3 Tera instrument, there was no
visual effect on the electropherogram or the quantification
of HbA1c. Up to the maximal tested glucose concentration
(50 g/L), the absolute bias ranged between –0.3% and 0.1%
or –3.0 and 1.5 mmol/mol, which meets the criterion of
0.3% or 3 mmol/mol.
Carbamylated Hemoglobin
On the Bio-Rad D-100, the in vitro experiments with
potassium cyanate showed a similar effect on the chromato-
grams as for the experiments with high glucose concentra-
tions—namely, increasing labile HbA1c and P3 peaks with
increasing KCNO concentrations. The absolute bias for
HbA1c was a maximum of –0.4% (–4.0 mmol/mol) for all
three patient samples at the different KCNO concentrations.
On the Sebia Capillarys 3 Tera, the KCNO had a visual effect
on the “other HbA” peak, but did not affect the quantification
of HbA1c. A maximal absolute bias of –0.3% (–2.0 mmol/
mol) was found. For both analyzers, the trueness criteria of
the WIV-ISP (0.3% or 3 mmol/mol) were met, except for the
samples containing the highest KCNO concentration
(1 mmol/L) and analyzed with the D-100 analyzer.
Triglycerides and Bilirubin
Up to a concentration of 15 mg/dL bilirubin and a con-
centration of 3,360 mg/dL triglycerides, the measured
HbA1c values for both analyzers were within 0.2%
(2.5 mmol/mol) of the baseline HbA1c values. There was no
observed interference on the quantification of HbA1c or in
terms of additional/changing peaks in the chromatogram/
electropherogram.
0 20 40 60 80 100 120 140 160
20
40
60
80
100
120
140
160
0
Hb
A1c
(mm
ol/
mo
l)—B
io-R
ad D
-100
HbA1c (mmol/mol)—Tosoh G7
Mean3.6
–1.96 SD–0.9
+1.96 SD8.1
500 100 150 200
10
12
14
6
8
4
0
2
–2
Hb
A1c
(mm
ol/
mo
l)—
To
soh
G7
and
Bio
-Rad
D-1
00
Mean HbA1c (mmol/mol) of Tosoh G7 and Bio-Rad D-100
Mean2.6
–1.96 SD–0.8
+1.96 SD6.1
500 100 150 200
6
8
10
4
2
–2
0
–4
Hb
A1c
(mm
ol/
mo
l)—
To
soh
G7
and
Seb
ia C
apill
arys
3 T
era
Mean HbA1c (mmol/mol) of Tosoh G7 and Sebia Capillarys 3 Tera
0 50 80 150 200
20
40
60
80
100
120
140
160
0Hb
A1c
(mm
ol/
mo
l)—S
ebia
Cap
illar
y 3
Tera
HbA1c (mmol/mol)—Tosoh G7
A B
C D
Figure 1 Passing-Bablok regression analysis and Bland-Altman plot of hemoglobin A1c (HbA1c) results (International
Federation of Clinical Chemistry units) using whole-blood patient samples, obtained with the Bio-Rad D-100 (A, B) and the
Sebia Capillarys 3 Tera (C, D) in comparison with the Tosoh HLC-723G7. Passing-Bablok: blue solid line (with 95% confidence
interval [CI]) represents the linear regression curve. Bland-Altman Plot: blue solid line (with 95% CI) represents mean absolute
difference, while the brown dashed lines represent 95% limits of agreement.
Herpol et al / EVALUATION CAPILLARYS 3 TERA AND D-100
72 Am J Clin Pathol 2016;146:67-77 © American Society for Clinical Pathology72 DOI: 10.1093/ajcp/aqw081
Dow
nloaded from https://academ
ic.oup.com/ajcp/article/146/1/67/1730623 by guest on 31 August 2022
Hemoglobin Content
Serial dilutions of a patient sample with a hemoglobin
concentration of 16.9 g/dL and a normal HbA1c level re-
sulted in a hemoglobin range between 1.7 and 16.9 g/dL.
The Bio-Rad D-100 system reported total areas from 10,714
to 78,321 units. The calculated maximum bias was –0.2%
(–2.0 mmol/mol). The same evaluation was done on the
Sebia Capillarys 3 Tera, where optic densities were noted
from 0.033 to 0.258, resulting in a maximum bias of –0.2%
(–2.0 mmol/mol) at the lowest hemoglobin level. For both
analyzers, there was no significant bias detected, even for a
hemoglobin concentration of 1.7 g/dL. Both automates gave
warnings for the lowest hemoglobin concentrations, al-
though HbA1c results were not affected.
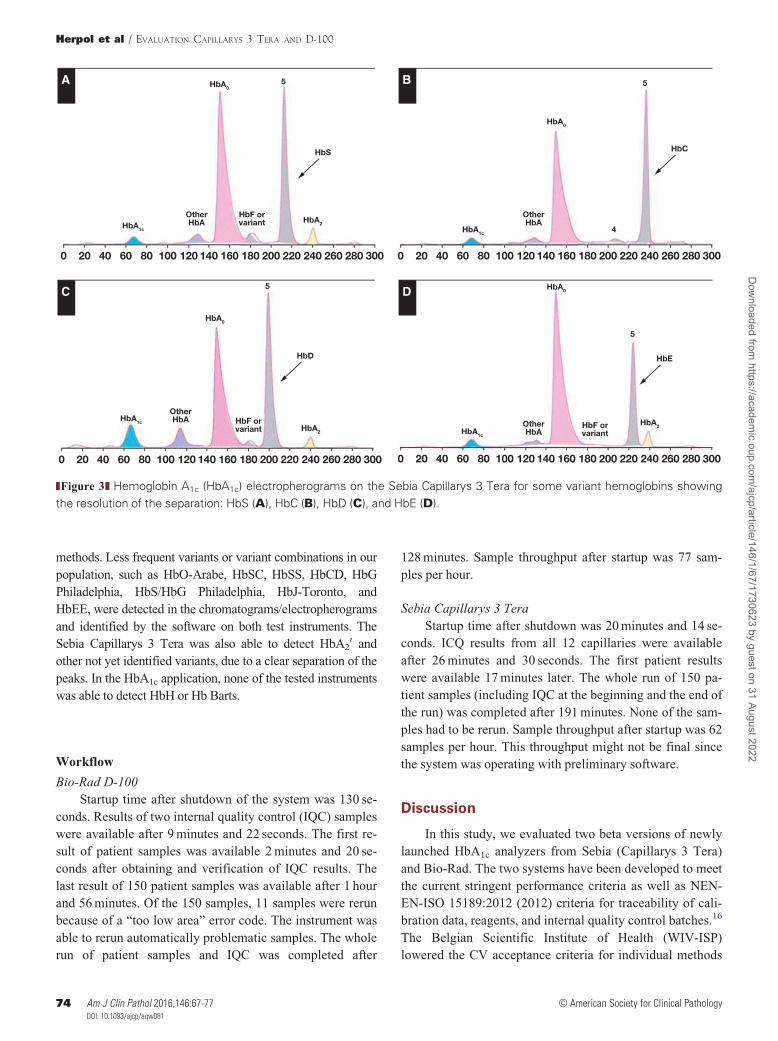
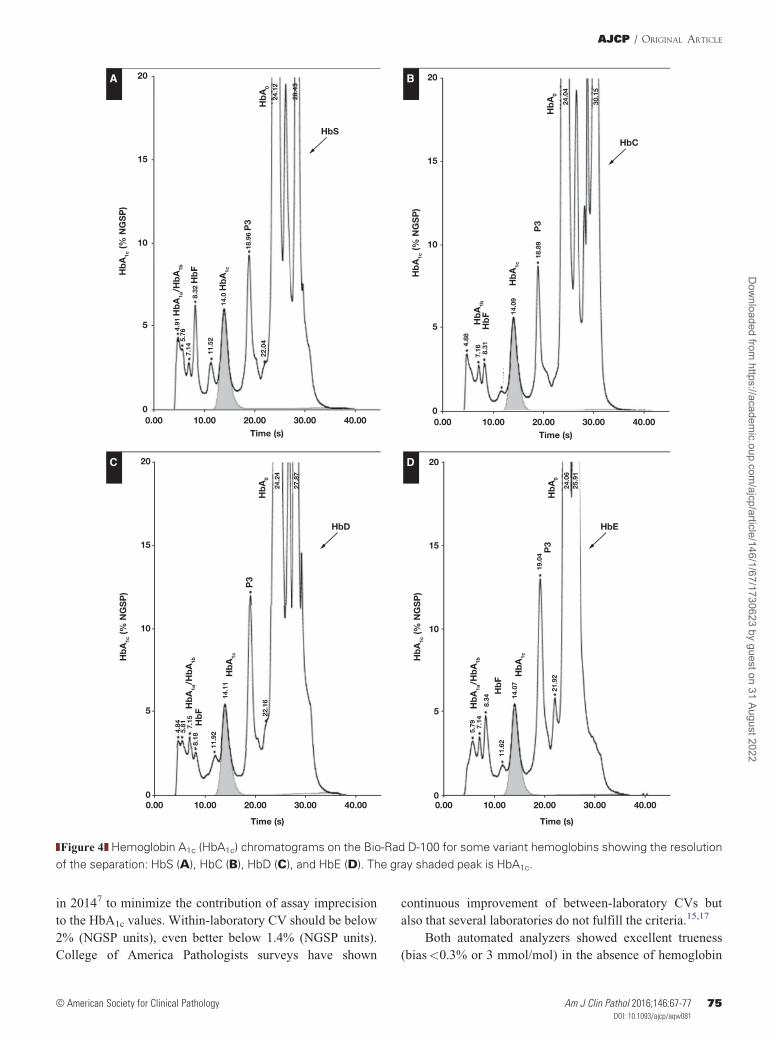
Hemoglobin Variants
HbS and HbC were visually well separated from the
HbA0 peak, both for the Bio-Rad and Sebia Capillarys 3
Tera Figure 3A , Figure 3B , Figure 4A , and Figure 4B .
On the Bio-Rad D-100, four samples from three patients
with HbAS (n¼ 3) and one with HbAC (n¼ 1) showed an
absolute bias ranging from –0.5% to 0.7% (NGSP units) and
from –7 to 5 mmol/mol (IFCC units) in comparison with the
Sebia Capillarys 2 Flex Piercing. One of the patients had a
very low HbA1c level of 3.8% (18 mmol/mol), and the other
patients had normal or high HbA1c values.
On the Bio-Rad D-100, HbD and HbE eluted shortly
after the HbA0 peak Figure 4C and Figure 4D . In one pa-
tient with a high HbA1c value (13.4% or 123 mmol/mol), an
absolute bias of –2.2% (–24 mmol/mol) was observed,
whereas another patient with a low HbA1c value (3.7% or
17 mmol/mol) showed an absolute bias of 0.9% (–11 mmol/
mol) on the Bio-Rad D-100 compared with the Capillarys 2
Flex Piercing. For the other three patients with normal
HbA1c values and heterozygous for HbD, a bias ranging be-
tween –0.6% and –0.4% (5-6 mmol/L) was found. On the
Sebia Capillarys 3 Tera analyzer, HbD and HbE were nicely
separated from the HbA0 peak Figure 3C and Figure 3D .
In comparison with the Sebia Capillarys 2 Flex Piercing, bias
was below 0.4% or 4 mmol/mol for all variants tested.
Stability of HbA1c in Capillary and Venous Blood
Samples
Three venous patient samples were stored at 2�C to
8 �C during 3 weeks. Analysis on the Bio-Rad D-100 instru-
ment showed a bias of less than 0.4% (<4 mmol/mol) up to
13 days. The chromatograms showed a continuously
increasing P3 peak with longer storage time. For the Sebia
Capillarys 3 Tera, the bias was less than 0.4% (4 mmol/mol)
up to 19 days. The electropherogram showed an increasing
“other HbA” peak with time but with no significant effect
on the quantification of HbA1c.
The room temperature stability of HbA1c in blood,
stored in the HCCS, was only performed with the Bio-Rad
D-100 analyzer, because the application was under develop-
ment on the Sebia system. Data showed stability of at least 7
days with a maximal bias below 0.15% or 2.5 mmol/mol.
Detection of Hemoglobin Variants
Both test instruments were able to detect the most import-
ant hemoglobin variants: HbS, HbD, HbE, and HbC (see
above). The presence of the hemoglobin variants was visually
evaluated on the chromatogram/electropherogram (Figures 3
and 4). For these variants, the Bio-Rad D-100 software identi-
fied the specific hemoglobin variant, based on retention time.
However, identification should be confirmed by other
Mean–1.0
–1.96 SD–4.7
+1.96 SD2.7
500 100 150 200
2
4
6
0
–2
–6
–4
–8
Hb
A1c
(mm
ol/
mo
l)—
Bio
-Rad
D-1
00 a
nd S
ebia
Cap
illar
ys 3
Ter
a
Mean HbA1c (mmol/mol) of Bio-Rad D-100 and Sebia Capillarys 3 Tera
0 20 40 60 80 100 120 140 160
20
40
60
80
100
120
140
160
0
Hb
A1c
(mm
ol/
mo
l)—
Seb
ia C
apill
arys
3 T
era
HbA1c (mmol/mol)—Bio-Rad D-100
A B
Figure 2 Passing-Bablok regression analysis (A) and Bland-Altman plot (B) of hemoglobin A1c (HbA1c) results (International
Federation of Clinical Chemistry units) using whole-blood samples obtained with the Bio-Rad D-100 in comparison with the
Sebia Capillarys 3 Tera.
AJCP / ORIGINAL ARTICLE
© American Society for Clinical Pathology Am J Clin Pathol 2016;146:67-77 73DOI: 10.1093/ajcp/aqw08173
Dow
nloaded from https://academ
ic.oup.com/ajcp/article/146/1/67/1730623 by guest on 31 August 2022
methods. Less frequent variants or variant combinations in our
population, such as HbO-Arabe, HbSC, HbSS, HbCD, HbG
Philadelphia, HbS/HbG Philadelphia, HbJ-Toronto, and
HbEE, were detected in the chromatograms/electropherograms
and identified by the software on both test instruments. The
Sebia Capillarys 3 Tera was also able to detect HbA20 and
other not yet identified variants, due to a clear separation of the
peaks. In the HbA1c application, none of the tested instruments
was able to detect HbH or Hb Barts.
Workflow
Bio-Rad D-100
Startup time after shutdown of the system was 130 se-
conds. Results of two internal quality control (IQC) samples
were available after 9 minutes and 22 seconds. The first re-
sult of patient samples was available 2 minutes and 20 se-
conds after obtaining and verification of IQC results. The
last result of 150 patient samples was available after 1 hour
and 56 minutes. Of the 150 samples, 11 samples were rerun
because of a “too low area” error code. The instrument was
able to rerun automatically problematic samples. The whole
run of patient samples and IQC was completed after
128 minutes. Sample throughput after startup was 77 sam-
ples per hour.
Sebia Capillarys 3 Tera
Startup time after shutdown was 20 minutes and 14 se-
conds. ICQ results from all 12 capillaries were available
after 26 minutes and 30 seconds. The first patient results
were available 17 minutes later. The whole run of 150 pa-
tient samples (including IQC at the beginning and the end of
the run) was completed after 191 minutes. None of the sam-
ples had to be rerun. Sample throughput after startup was 62
samples per hour. This throughput might not be final since
the system was operating with preliminary software.
Discussion
In this study, we evaluated two beta versions of newly
launched HbA1c analyzers from Sebia (Capillarys 3 Tera)
and Bio-Rad. The two systems have been developed to meet
the current stringent performance criteria as well as NEN-
EN-ISO 15189:2012 (2012) criteria for traceability of cali-
bration data, reagents, and internal quality control batches.16
The Belgian Scientific Institute of Health (WIV-ISP)
lowered the CV acceptance criteria for individual methods
300280260240220200180160140120100806040200
HbA1c
HbA2
HbS
HbA05
OtherHbA
HbF orvariant
300280260240220200180160140120100806040200
HbA1c
HbC
HbA0
4
5
OtherHbA
300280260240220200180160140120100806040200
HbA1c
HbA2
HbD
HbA0
5
OtherHbA HbF or
variant
300280260240220200180160140120100806040200
HbA1c
HbA2
HbE
HbA0
5
OtherHbA
HbF orvariant
A B
C D
Figure 3 Hemoglobin A1c (HbA1c) electropherograms on the Sebia Capillarys 3 Tera for some variant hemoglobins showing
the resolution of the separation: HbS (A), HbC (B), HbD (C), and HbE (D).
Herpol et al / EVALUATION CAPILLARYS 3 TERA AND D-100
74 Am J Clin Pathol 2016;146:67-77 © American Society for Clinical Pathology74 DOI: 10.1093/ajcp/aqw081
Dow
nloaded from https://academ
ic.oup.com/ajcp/article/146/1/67/1730623 by guest on 31 August 2022
in 20147 to minimize the contribution of assay imprecision
to the HbA1c values. Within-laboratory CV should be below
2% (NGSP units), even better below 1.4% (NGSP units).
College of America Pathologists surveys have shown
continuous improvement of between-laboratory CVs but
also that several laboratories do not fulfill the criteria.15,17
Both automated analyzers showed excellent trueness
(bias<0.3% or 3 mmol/mol) in the absence of hemoglobin
11.6
4
0.00 10.00 20.00 30.00 40.00
15
10
5
0
20
Hb
A1c
(% N
GS
P)
Time (s)
22.0
4
18.9
6 P
3
24.1
2
Hb
A0
28.4
3
14.0
Hb
A1c
11.5
2
8.32
Hb
F7.
14
4.91
Hb
A1a
/Hb
A1b
5.76
HbS
0.00 10.00 20.00 30.00 40.00
15
10
5
0
20
Hb
A1c
(% N
GS
P)
Time (s)
5.79 7.
148.
34
11.6
2
14.0
7
21.9
2
19.0
4
24.0
625
.91
Hb
A0
P3
Hb
A1a
/Hb
A1b
Hb
A1c
Hb
F
HbE
0.00 10.00 20.00 30.00 40.00
15
10
5
0
20
Hb
A1c
(% N
GS
P)
Time (s)
4.84
5.81 7.
158.
18
11.9
2
14.1
1
22.1
6
24.2
4
27.8
7
Hb
A0
P3
Hb
A1a
/Hb
A1b
Hb
A1c
Hb
F
HbD
11.6
4
0.00 10.00 20.00 30.00 40.00
15
10
5
0
20
Hb
A1c
(% N
GS
P)
Time (s)
4.88
7.16 8.31
14.0
9
18.8
9
24.0
4
30.1
5
Hb
A0
Hb
A1c
P3
Hb
A1b
Hb
F
HbC
A B
C D
Figure 4 Hemoglobin A1c (HbA1c) chromatograms on the Bio-Rad D-100 for some variant hemoglobins showing the resolution
of the separation: HbS (A), HbC (B), HbD (C), and HbE (D). The gray shaded peak is HbA1c.
AJCP / ORIGINAL ARTICLE
© American Society for Clinical Pathology Am J Clin Pathol 2016;146:67-77 75DOI: 10.1093/ajcp/aqw08175
Dow
nloaded from https://academ
ic.oup.com/ajcp/article/146/1/67/1730623 by guest on 31 August 2022
variants. Except in the high HbA1c range, the Bio-Rad
D-100 system experienced a small but acceptable absolute
bias of –0.33% (or –3.27 mmol/mol). Both the Capillarys 3
Tera and the D-100 systems were not subjected to interfer-
ence by the labile HbA1c fraction (up to 10 g/L glucose),
carbamylated hemoglobin (up to 0.5 mmol/L), triglycerides
(up to 3,361 mg/dL), or bilirubin (up to 14 mg/dL).
Although the electropherograms/chromatograms showed
some profile alterations in the presence of extremely high
concentrations of potential interferences, the bias remained
within quality criteria that were put forward. Only at very
high levels of interfering substances, such as 50 g/L glucose
and 1 mmol/L KCN, a bias could be detected with the Bio-
Rad system. Since such high concentrations of interfering
peaks are not physiologic, this bias problem can be
neglected.
HbA1c values are used not only for follow-up of gly-
cemic control in diabetic patients but also for diagnosis. The
ADA has set a cutoff for diagnosis at an HbA1c level of
6.5% (48 mmol/mol).18,19 The diagnosis should be con-
firmed by a repeat test. It has been shown that diagnosis
based on HbA1c levels identifies other patients than diagno-
sis based on oral glucose tolerance test results.17,20
Individual susceptibility to glycation or variation in HbA1c
between different ethnic groups is poorly understood but
relevant when using HbA1c for the diagnosis of diabetes.20-22
In addition, a potential bias of the method used could lead to
over- or underdiagnosis of diabetes.
In clinical practice of follow-up of diabetic patients, an
absolute HbA1c difference of 0.5% between two consecutive
patient samples is considered a significant change in dia-
betes control.17,18 In this respect, excellent reproducibility is
mandatory.
As clinical care evolves toward near-patient diagnosis,
POC methods are developed as well as high-throughput
automates with STAT function. A recent study by Lenters-
Westra and Slingerland8 of seven HbA1c POC devices
showed that three instruments did not meet the analytical
performance criteria. In addition, improper handling
and analysis by nonlaboratory staff could contribute to er-
roneous HbA1c results. Therefore, these instruments should
be introduced in clinical practice with caution and supervi-
sion of the laboratory. As an alternative, high-throughput
automated instruments are now able to provide results
within a short time frame. Especially in hospital settings,
they represent the best option for accurate and precise
HbA1c results available within the time frame of a patient
visit. For a relatively small batch of samples, the sample
throughput of the Bio-Rad D-100 is superior to the Sebia
Capillarys 3 Tera, because of its relative short startup time.
As the sample batch increases, the Sebia analyzer
gains in analysis speed, since 12 samples are analyzed in
parallel and wash/injection/analysis steps can be performed
simultaneously.
As the increasingly stringent analytical performance
criteria are met by most of the automated instruments, non-
glucose-related biological variation becomes more of an
issue when using HbA1c as a diagnostic criterion. All condi-
tions that affect erythrocyte life span may cause falsely low
or elevated HbA1c levels.18,23,24 Shortened erythrocyte life
span—in conditions such as renal anemia, chronic liver dis-
ease, chronic or hemolytic anemia, acute blood loss, or re-
cent transfusion—results in falsely low HbA1c.18,23,24
Especially in iron deficiency anemia, HbA1c should be inter-
preted with caution. Prolonged erythrocyte life span contrib-
utes to falsely high HbA1c in iron deficiency, whereas
altered glycation is found—and therefore a decrease in
HbA1c levels—in anemic patients after iron supplementa-
tion.18,25,26 In addition, hemoglobin variants could interfere
with HbA1c analysis in variable ways depending on the
method and the effect of the variant on erythrocyte life
span.18,23,24 In this study, the ability of the analyzers to de-
tect the presence of a hemoglobin variant was evaluated.
HbS, HbD, HbE, Hb C, HbO-Arabe, HbSC, HbSS, HbCD,
HbG Philadelphia, HbS/HbG Philadelphia, HbJ-Toronto,
and HbEE were detected, while HbH and Hb Barts were
not. The identification of the variants should be confirmed
by other methods. The detection of hemoglobin variants is
an advantage of chromatographic or electrophoretic analysis
techniques.
To improve patient care, home sampling by capillary
sampling and/or dried blood spots on filter paper is an op-
tion that could be interesting for patients with poor meta-
bolic control or for patients reluctant to have regular venous
blood sampling such as children, adolescents, and the eld-
erly. A previous study by our group on the Sebia Capillarys
2 Flex Piercing showed excellent agreement between ven-
ous and capillary blood samples as well as stability of the
capillary sample for at least 5 days at room temperature.13
At the time of testing, the D-100 was ready to analyze capil-
lary blood samples. A preliminary study showed a room
temperature stability of HbA1c in the HCCS of 7 days. The
application was still in development for the Sebia Capillarys
3 Tera, and therefore this stability study was only evaluated
with the Bio-Rad instrument.
In conclusion, in terms of quality, performance, and
throughput, the Bio-Rad D-100 and the Sebia Capillarys 3
Tera instruments perform similarly and meet the stringent
criteria of the WIV-ISP for the quantification of HbA1c in
whole blood.
Disclosure: Bio-Rad Laboratories Belgium and Sebia
Benelux provided the D-100 and Capillarys 3 Tera ana-
lyzers and reagents used in this evaluation.
Herpol et al / EVALUATION CAPILLARYS 3 TERA AND D-100
76 Am J Clin Pathol 2016;146:67-77 © American Society for Clinical Pathology76 DOI: 10.1093/ajcp/aqw081
Dow
nloaded from https://academ
ic.oup.com/ajcp/article/146/1/67/1730623 by guest on 31 August 2022
Corresponding author: Ilse Weets, Dept of Clinical Chemistry and
Radio-Immunology, Universitair Ziekenhuis, Laarbeeklaan 101,
Brussels, Belgium; [email protected].
References
1. International Diabetes Federation. IDF atlas. 2014. http://www.idf.org/diabetesatlas. Accessed September 15, 2015.
2. The Diabetes Control and Complications Trial ResearchGroup. The effect of intensive treatment of diabetes on thedevelopment and progression of long-term complications ininsulin-dependent diabetes mellitus. N Engl J Med.1993;329:977-986.
3. American Diabetes Association. Standards of medical carein diabetes—2010. Diabetes Care. 2010;33(suppl 1):S11-S61.
4. Hoelzel W, Weykamp C, Jeppsson J-O, et al. IFCC referencesystem for measurement of hemoglobin A1c in human bloodand the national standardization schemes in the UnitedStates, Japan, and Sweden: a method-comparison study. ClinChem. 2004;50:166-174.
5. Little RR, Rohlfing CL, Sacks DB; NationalGlycohemoglobin Standardization Program (NGSP)Steering Committee. Status of hemoglobin A1c measure-ment and goals for improvement: from chaos to order for im-proving diabetes care. Clin Chem. 2011;57:205-214.
6. Chapelle J-P, Teixeira J, Maisin D, et al. Multicentre evalu-ation of the Tosoh HbA1c G8 analyser. Clin Chem Lab Med.2010;48:365-371.
7. Wetenschappelijk Instituut Volksgezondheid. WIV informa-tion for analytical goals for measurement of HbA1c. https://www.wiv-isp.be/qml/activities/external_quality/rapports/_down/hba1c/2014/JR-2014.pdf. Accessed June 28, 2015.
8. Lenters-Westra E, Slingerland RJ. Three of 7 hemoglobinA1c point-of-care instruments do not meet generally ac-cepted analytical performance criteria. Clin Chem.2014;60:1062-1072.
9. Sanchez-Mora C, Rodriguez-Oliva MS, Fern�andez-Riejos P,et al. Evaluation of two HbA1c point-of-care analyzers. ClinChem Lab Med. 2011;49:653-657.
10. Clinical and Laboratory Standards Institute (CLSI).Evaluation of Precision Performance of QuantitativeMeasurement Methods: Approved Guideline—Second Edition.Wayne, PA: CLSI; 2004. CLSI document EP05-A2.
11. Clinical and Laboratory Standards Institute (CLSI). MethodComparison and Bias Estimation Using Patient Samples:Approved Guideline—Second Edition (Interim Revision).Wayne, PA: CLSI; 2010. CLSI document EP09-A2-IR.
12. Clinical and Laboratory Standards Institute (CLSI).Evaluation of the Linearity of Quantitative MeasurementProcedures: A Statistical Approach; Approved Guideline.Wayne, PA: CLSI; 2003. CLSI document EP6-A.
13. Heylen O, Van Neyghem S, Exterbille S, et al. Evaluation ofthe Sebia CAPILLARYS 2 flex piercing for the measurementof HbA1c on venous and capillary blood samples. Am J ClinPathol. 2014;141:867-877.
14. Clinical and Laboratory Standards Institute (CLSI).Interference Testing in Clinical Chemistry: ApprovedGuideline—Second Edition. CLSI; 2005. Wayne, PA: CLSIdocument EP7-A2.
15. College of America Pathologists. CAP survey. http://www.ngsp.org/CAP/CAP14a.pdf. Accessed September 18, 2015.
16. NEN-EN-ISO 15189:2012. https://www.iso.org/obp/ui/#iso:std:iso:15189:ed-3:v2:en. Accessed September 16, 2015.
17. Little RR, Rohlfing CL. The long and winding road to opti-mal HbA1c measurement. Clin Chim Acta. 2013;418:63-71.
18. Weykamp C. HbA1c: a review of analytical and clinical as-pects. Ann Lab Med. 2013;33:393-400.
19. American Diabetes Association. Diagnosis and classificationof diabetes mellitus. Diabetes Care. 2014;37(suppl 1):S81-S90.
20. Bonora E, Tuomilehto J. The pros and cons of diagnosingdiabetes with A1c. Diabetes Care. 2011;34(suppl2):S184-S190.
21. Hempe JM, Gomez R, McCarter RJ, et al. High and lowhemoglobin glycation phenotypes in type 1 diabetes: a chal-lenge for interpretation of glycemic control. J DiabetesComplications. 2002;16:313-320.
22. Khera PK, Joiner CH, Carruthers A, et al. Evidence for inter-individual heterogeneity in the glucose gradient across thehuman red blood cell membrane and its relationship tohemoglobin glycation. Diabetes. 2008;57:2445-2452.
23. English E, Idris I, Smith G, et al. The effect of anaemia andabnormalities of erythrocyte indices on HbA1c analysis: a sys-tematic review. Diabetologia. 2015;58:1409-1421.
24. Higgins T. HbA(1c)—an analyte of increasing importance.Clin Biochem. 2012;45:1038-1045.
25. Sundaram RC, Selvaraj N, Vijayan G, et al. Increased plasmamalondialdehyde and fructosamine in iron deficiency an-emia: effect of treatment. Biomed Pharmacother.2007;61:682-685.
26. Tarim €O, Kucukerdogan A, Gunay €U, et al. Effects of irondeficiency anemia on hemoglobin A1c in type 1 diabetes mel-litus. Pediatr Int. 1999;41:357-362.
AJCP / ORIGINAL ARTICLE
© American Society for Clinical Pathology Am J Clin Pathol 2016;146:67-77 77DOI: 10.1093/ajcp/aqw08177
Dow
nloaded from https://academ
ic.oup.com/ajcp/article/146/1/67/1730623 by guest on 31 August 2022
Related Documents