1330 Broadway, Suite 1426 Oakland, CA 94612 Tel : (510) 763-1499 Fax: (510) 763-1599 www. spra. com • • • • • • • • • • • • • • • • • • • • • • • • • • • • • • • • • • • • • • • • • • • • • • • • • • • • • • • • • • • • • • • • • • • • • • • • • • S O CIA L P O L ICY R ESEA R C H A S S O C I A T E S Prepared for: Asha Mehta San Francisco Beacon Initiative Director 1390 Market St., Suite 900 San Francisco, CA 94102 (415) 934-4848 Project No. 4441 Evaluation of the San Francisco Beacon Initiative Final Report November 13, 2008 Prepared by: Hanh Cao Yu, Ph.D. Charles Lea Jill Leufgen Anna Rubin Social Policy Research Associates With contributions from: Wally Abrazaldo

Welcome message from author
This document is posted to help you gain knowledge. Please leave a comment to let me know what you think about it! Share it to your friends and learn new things together.
Transcript

1330 Broadway, Suite 1426 Oakland, CA 94612 Tel: (510) 763-1499 Fax: (510) 763-1599 www.spra.com
• • • • • • • • • • • • • • • • • • • • • • • • • • • • • • • • • • • • • • • • • • • • • • • • • • • • • • • • • • • • • • • • • • • • • • • • • •
S O C I A L P O L I C Y R E S E A R C H A S S O C I A T E S
Prepared for:
Asha Mehta San Francisco Beacon Initiative Director 1390 Market St., Suite 900 San Francisco, CA 94102 (415) 934-4848
Project No. 4441
Evaluation of the San Francisco Beacon Initiative Final Report November 13, 2008
Prepared by:
Hanh Cao Yu, Ph.D. Charles Lea Jill Leufgen Anna Rubin
Social Policy Research Associates
With contributions from:
Wally Abrazaldo

This page intentionally left blank.
Insert blank page here when making double-sided copies

1
Acknowledgement Without the tremendous support of many individuals, this report could not have happened. We would like to acknowledge the following Beacon Directors and their staff for hosting our evaluation team’s site visits and conducting the youth surveys: Michael Funk, Sean Yeung, Mayasha Jackson, Takija Gardner, Eli Horn, Chana Kennedy, Chris Rivera, Dave Macgillis, Naomie Wright, Starr Miles, Andrew Tunai, Michelle Cusano, Shawn Brown, Carol Hill, Ben Wong, Valerie Tulier, and Elena Royale. Additionally, we would like to thank Laura Moye at the Department of Children, Youth and Families and Mark Min at Cityspan for their assistance in facilitating access to the administrative data. We would also like to thank the survey translation teams of Nancy Yu, Cynthia Tang, Aleixo Goncalvez Flores, and Sandra Harvey. Lastly, we are infinitely grateful to Beacon Initiative Director Asha Mehta and to Sylvia Hom for their guidance, patience, and wealth of knowledge and keen insights into San Francisco Beacon Initiative.

This page intentionally left blank.
Insert blank page here when making double-sided copies
ES-1
Executive Summary In 2007, the SF Beacon Initiative (SFBI) underwent a major strategic planning process to re-examine SFBI’s alignment with the Beacon vision and mission. The vision was to set a future course for the Initiative that ensures that the Beacon Centers promote youth and family centers in public schools that become beacons of activity for the surrounding neighborhood. In conjunction with this process, the goal of the 2007-2008 Evaluation of the SF Beacon Initiative was to take stock of the usefulness of the evaluation tools, data, and analysis while assuring alignment of the evaluation with the new SFBI strategic plan.1 Towards this end, Social Policy Research Associates (SPR) helped SFBI review the existing San Francisco Beacon Theory of Change (ToC), Quality Standards, evaluation methods, and processes for continuous improvement. Specific evaluation objectives included:
• Conducting in-depth interviews with Beacon Center directors to review and recommend changes to the ToC, Quality Standards, and evaluation.
• Providing SFBI with information on the eight Beacon Centers’ progress towards meeting quality standards and outcomes for youth.
• Making recommendations for future Beacon evaluations, specifically focusing on: (1) role of lead agencies, (2) role of SFBI, (3) family and adult engagement.
In addition, we were interested in examining the ways in which a number of the Beacon Centers have evolved from the original concept of the Beacon Centers as community hubs, and the impact of this on the Centers’ structure, operation, and practices.
Methodology In order to collect the data necessary to produce this report, we used a variety of data collection methods. The qualitative components included:
• Review of key documents, such as previous SFBI evaluation reports, the SFBI 2007 strategic plan, Beacon Center specific documents and websites, and the Minimum Compliance Quality Standards completed by the Beacon Directors in 2007.
• Site visits to all eight Beacon Centers to conduct (1) interviews with Beacon and Program Directors, line staff and school staff, youth (to produce mini-case studies); (2) focus groups with parents; and (3) observations.
• Focus groups with 95 middle school youth to understand motivations for their participation or non-participation in the eight Beacon Centers.
The quantitative component consisted of the following: 1 Since the 2005 San Francisco Beacon Initiative (SFBI) Evaluation by Resource Development Associates, there
has been a hiatus of evaluation activities. In December 2007, SFBI commissioned SPR to resume evaluation activities and provide recommendations for new directions in the evaluation to reflect the latest strategic plan.
ES-2
• Review and analysis of the Contract Management System (CMS) data.
• Administration of a combined Youth Individual Assessment (YIA) and Youth Satisfaction Survey (YSS), which was administered in three languages: English, Spanish, and Chinese in May of 2008.
• Review of district data on Beacon and non-Beacon participants’ school attendance, discipline, and test scores from the 2007-2008 school year.
The Beacon Centers
In Chapter 2 of the report, we provide an overview of the key characteristics of the eight Beacon Centers and the complexity of the efforts that have gone into operating the Centers. The Beacon Centers have grown tremendously over the years, operating in at least eight neighborhoods and across 27 school and other sites with budgets of approximately $7 million.
In assessing the extent to which the Centers are providing environments that are visible, accessible, and safe, a number of centers are reporting that they are “in progress” or have “not met” a few of the quality standards. For example, based on site visits and CMS data from Spring 2008, only four of eight of the Centers offered programming until 8:00 p.m. Monday through Friday. However, accessibility was a major area of focus for many of the Beacon Centers and all sites increased programming until 8 p.m. where it was possible (leaving only two sites without this cause of school issues). By the end of the year, Beacon Centers had programming at least two nights a week in 6 of 8 sites; whereas at the beginning of the school year, this was true in only in one or two sites.
The total number staffing positions funded by Beacon money varied considerably, ranging from 4.6 FTE to 10.4. The average is closer to 5.0 FTE, typically with a Beacon Director, a Program or Site coordinator, and Safety and Support staff forming the core staff.
The San Francisco Department of Children, Youth and Families provides a key funding source for Beacon centers; however, the Centers also reported receiving $2 million in ExCEL funding. Providing a diverse programming (e.g., academic support, enrichment, and recreational) is a strength of many of the Centers. However, the Centers were growing their family and community programming, and therefore, were not consistently offering adult- as youth programming.
Participation and Youth Developmental Experiences Participant Characteristics
The analysis of demographic characteristics of participants during the Summer of 2007 and the 2007-2008 school year shows that the Beacon Centers had a higher percent (44%)2 of youth in middle school than in any other grade level. Most participants (47%) were between 10 and 13 years old, and there was a slightly higher percentage (53%) of male youth. The racial/ethnic
2 Hub and satellite sites combined.

ES-3
groups with the highest percentage of youth were Asian (46%) and African American (22%), and the majority (76%) of youth were fluent English speakers. The adult participants were distributed evenly across age brackets, although 40% of them were at least 55 years old. A higher percent (61%) of adult participants were female, and the majority of adult participants were Asian (62%). While most (67%) adults were fluent English speakers, nearly 25% were not.
Participation Patterns
Attendance across all eight Beacon Centers was an impressive total of 7,650. Following are some specifics on the participation patterns:
• Total participation: Six of the eight Beacon Centers met participation quality standards by serving at least 600 participants during the combined Summer of 2007 and 2007-2008 school year. Seven of the Centers served at least 70% youth participants as compared to adults.
• Adult participation: Overall, a substantive number (100 or more) of adult participants were concentrated at half of the sites. At three sites, adults comprised 5% or less of the total participants.
• Daily participation: During the fall of the 2007-2008 school year, five out of eight Centers met the Beacon Quality Standard for daily attendance; however, only three sites met it during the Spring.3
• Hub site participation: Four of the eight Beacon Centers served a greater percentage of participants at their hub site. Overall, 58% of the total number of youth and adults participate in activities at the hub sites, although the quality standards specify that 80% of the programming should occur at the hub sites.
− Summer vs. school year participation. At Beacon hubs, more youth attended during the 2007-2008 school year than during the summer of 2007, and averaged more overall days of attendance during the school year. However, youth averaged more days of attendance per week during the Summer session.
− Adult participation. As for adult attendance at Beacon Center hubs, a greater number of adults attended during the school year. In addition, adult participants attended more days on average during the school year. This is largely due to the fact that SFUSD does not allow adequate school access to continue adult programming in summer.
• Range of program/activity participation by school levels: During the 2007-2008 school year, elementary school participants at Beacon hub sites attended more frequently and spent more total hours in group activities than middle and high school youth.
3 The average daily attendance of some sites may be higher than is shown below because of activity days with
missing attendance records. This may be especially true during the spring session, for which some sites are missing a great deal of missing attendance information.

ES-4
− Middle vs. high school youth participation patterns. During the school year, middle school participants attended Beacon Centers more frequently than high school participants did, but on the days that high school youth did attend, they spent more time at the Beacon Center than those youth in middle school.
− Academic Support & Enrichment participation. The average number of hours elementary participants spent in Academic Support & Enrichment was significantly higher than both other groups of participants. In addition, middle school youth spent a significantly higher average number of hours in Academic Support & Enrichment than hub participants in high school. Middle school participants also spent, on average, significantly fewer hours on Sports & Recreation than both elementary and high school participants.
Youth Survey Results
The survey data provided important youth feedback on the quality of their youth developmental experience at the Beacon hubs. Our analysis of the data show that the majority of youth who responded enjoyed coming to Beacon and felt safe at their Beacon Center. The majority also felt that they learned new things and did interesting activities at Beacon. In addition, most older respondents felt that Beacon encouraged them to achieve by having goals for the future. The majority of youth surveyed felt that people at Beacon respected their culture and heritage, but fewer replied that Beacon helped them know about their culture and heritage, or stated that they learned about people from different cultures. This suggests that Beacon Centers need to pay more attention to this aspect of programming, particularly given the diversity of their participants.
While higher percentages of middle/high school respondents than elementary respondents reported that they have developed supportive relationships with Beacon adults, over one-quarter of all youth felt that there was no Beacon adult who really cared about them. As for relationships with their peers, both elementary and middle/high school respondents reported having positive peer influences, and most of the older youth indicated they have friends with whom they have supportive relationships.
In the area of skill development, youth were asked about the leadership activities they participated in at Beacon. Most older respondents responded affirmatively on questions about opportunities to work with others, while lower percents of elementary respondents did so on these questions. However, fewer than half of older respondents had participated in the majority of the leadership activities.
Challenges to Achieving Beacon Mission and Quality Standards Beacon Centers throughout the San Francisco Beacon Initiative continue to experience a number of challenges achieving Beacon mission and Quality Standards that also prevent them from
ES-5
aligning with the community hub model. The most common sets of challenges that were cited include:
• Parent and community engagement: Engaging parents and the community in Beacon programs is a significant challenge for seven of the eight Beacon Centers. Many Centers continue to struggle in engaging parents in developmental, enrichment, and community activities (e.g. parenting classes, job training, violence prevention initiatives, etc.). Factors that prevent parents and the community from engaging in Beacon programming include the location of Beacon Centers and the large number of working class and immigrant families within these communities.
• Availability of school space: Five Beacon Centers reported the lack of available of space as a major issue. Key factors that affect a Center’s ability to obtain adequate space include a lack of cooperation from school teachers and construction at school sites.
• Relationship with host schools: Five of the eight Centers reported a number of challenges in operating and implementing programs at their school sites. Beyond the availability of school space, these challenges, in most cases, were related to changes in school administrators and staff, and conflicting and/or a lack of understanding of Beacon goals.
• Participant attendance requirement: As described earlier, achieving the Quality Standard attendance requirement4 is a major challenge experienced by a number of the Beacon Centers. Community violence, transportation, and types of programming were among the common factors that respondents expressed as factors associated with this challenge.
• Integration of ExCEL funds: Many Beacon directors blend the ExCEL funds with their other sources of funding to support the Beacon Center. As a result, many directors expressed some difficulty in offering programs outside of the ExCEL academic requirements. In addition, Beacon directors reported that the ExCEL funds only allow them to serve/count students who are attendees of the host school. Thus, this has limited many Centers’ ability to provide programs and services to adults and the community, which further prevent them in aligning with the community hub model.
These challenges have greatly affected some Centers’ ability to meet specific Beacon participation standards and achieve broader program outcomes. However, a number of Centers have utilized some promising practices that allow them overcome such challenges.
4 Beacon Centers are to serve at least 150 participants a day, and 600 or more children and youth, and adult family
members unduplicated per year.
ES-6
Recommendations A major focus of the 2008 Beacon evaluation was to understand the evolution of the Initiative over the past decade and the extent of mission drift as well as the development of creative practices, and provide recommendations from the Beacon directors on ways to revise both the San Francisco Beacon Theory of Change (ToC) and the Quality Standards. When asked, a number of Beacon directors and staff mentioned they had not seen the ToC model or Quality Standards in a while, or never knew they existed. However, upon closer examination most Beacon directors and staff stated that the ToC model is an accurate reflection of outcomes that they are trying to achieve at the Beacon site-level; yet, there were a few elements that they reported were missing from the ToC model. More specifically, the roles and responsibilities of Initiative-level leadership, while well laid out, do not accurately reflect who is or who needs to be responsible for ensuring that some Initiative-level or cross-site activities happen. The following are suggestions of how the ToC model can better assist Beacon Centers in achieving their outcomes.
• Develop more clarity around the roles of key leaders within the Beacon governance structure. When the ToC was developed, it did not specify that there would be an initiative-wide governance body, a role that the steering committee assumed. The role of key leadership groups, such the Steering Committee, needs to be more explicitly delineated within the ToC, particular because these groups can play a critical role in working to bring about systems accommodation and support, and also garner financial and other support from city departments and school district leaders.
• Expand and standardize the role of the lead agencies. Standard role of lead agencies are fiscal sponsorship, fiscal management, administrative oversight, and human resources. However, SFBI and Beacon directors and staff suggested that the role of the lead agencies be explicitly defined, expanded (e.g., around staff development) and standardized, so that Beacon Centers and SFBI can hold them accountable and build on their youth development and community building expertise.
• Specify and who should play the role of the TA Intermediary and how to fully support and resource the “TA Intermediary” functions. The ToC included the roles of the TA intermediary, which was formerly the role of the Community Network for Youth Development (CNYD). However, since CNYD is no longer a part of the Initiative, the SFBI Director has assumed some of the intermediary roles. However, it is not possible for SFBI’s small staff to take on all of these responsibilities. Beacon directors and staff feel that the ToC needs to be updated to include which stakeholder is responsible for fulfilling these intermediary roles.
• Strengthen and support the role of SFBI Director and staff. Beacon Center leaders suggest that the SFBI staff continue to play the multiple roles of establishing a clear vision, coordinating relationship with SFUSD as a systems advocate, fundraising, and facilitating cross-site fertilization and development. Nevertheless, Beacon Center leaders acknowledge that the SFBI staff cannot assume all of the initiative level roles and responsibilities that were left unfulfilled after CNYD’s departure.
ES-7
Additions to the Quality Standards
Beacon directors and staff mentioned a number of elements that were missing from the Quality Standards and provided suggestions as to what standards and information should be included:
• Provide more clarity on expectations for particular outcomes standards. For instance, most Beacon directors and staff acknowledged that the career development standard was underdeveloped at their center. In developing programs and activities around this standard, Beacon staff articulated that they would like to be aware of what is required of them as a Center when offering career development services.
• Create more specific standards. Beacon staff stated that some standards are in need of sub-standards. For instance, while health is included as a standard, it could be expanded to include more specific standards of mental, physical, and/or sexual health.
• Increase host schools’ accountability. A number of Beacon staff stated that they would like to see some explicit requirements for the host school to help ensure a positive relationship. For instance, one Beacon staff suggested that this standard be modified to require all school staff to be educated on the mission and purpose of a Beacon Center.
• Focus on adult and community development. A number of Beacon staff expressed that the Quality Standards heavily emphasize youth, and not adult, family, and community outcomes. Therefore, they suggest that the Quality Standards have specific outcomes for adults, the families, and communities.
Recommendations for Improving and Aligning the Evaluation and Data Collection Systems The data collection system for the Beacon sites need considerable improvement to make any conclusion about the impacts of the Beacon Centers on youth, family, school, and community outcomes. Our overarching recommendation is:
• SFBI and Beacon Centers need to invest more time and energy to improve the (1) accessibility to district data for student outcomes; (2) accuracy and usability of the CMS data; and (3) redesign of the youth surveys to improve their validity. Specifically,
− Ensure that Beacons administer properly worded permission slips that allow access to students’ district data files including test scores, grade data, attendance, disciplinary action, and obtain timely comparison group data from the SFUSD early in the program year.
− Train Beacon staff to do correct and thorough data entry of information on youth and adult participation. For example, ensure student’s grade level and the school where a student is enrolled are required fields.

ES-8
− Develop a field that identify participants’ activity location (hub vs. satellite) and ensure unique Client IDs (e.g., district HO numbers) for each Beacon participant to avoid duplicate entries when a participant moves from one center to another and from summer to school year sessions.
− Re-vamp pre- post survey so that it is more concise and better tracks to the expected outcomes of Beacon participation, and prioritize administration of surveys at hub sites because these sites are considered the core of Beacon services.
− Consider further focusing evaluation indicators of success to assure alignment with the Theory of Change, the Quality Standards, and SFUSD’s outcome goals. See Appendix C, for example of indicators of a “Beacon Scorecard.”
Conclusion The SFBI and Beacon Centers have evolved and grown considerably since their establishment in 1994. The variety of programming, number of youth and adults served, involvement of numerous stakeholders, partners, and supporters, and the presence of innovative projects such as the Beacon Young Adolescent Initiative with New York Beacons and Gateway to Fitness attest to the scale and reach of a mature Initiative that is highly complex and sophisticated. At the same time, both external and internal factors such as the complexity of the neighborhoods, populations, blended-funding streams, changing initiative-level support structures, and cross-system relationships (e.g. SFUSD space issues), that each of the Beacon Centers serve suggests that more work needs to be done to reach out to community residents in order to become a true community hub. Although the ToC needs updating to clearly reflect stakeholders responsibilities for specific roles, it generally provides a robust framework to guide the Centers’ work. The Quality Standards provide high expectations for Centers’ performance that Beacon directors need to continue to meet; however, the conversations that will occur about revisions needed to this guiding document will likely determine whether there needs to be some customization to the local neighborhood context.

i
CONTENTS
ACKNOWLEDGEMENT
EXECUTIVE SUMMARY .......................................................................................... ES-1
I. ABOUT THE EVALUATION ................................................................................. I-1 Methodology....................................................................................................................I-2 Overview of the Report ...................................................................................................I-3
II. THE BEACON CENTERS.................................................................................... II-1 SFBI and Lead Agency Roles ........................................................................................II-1 Center Structure and Setup ...........................................................................................II-3
Locations ...................................................................................................................II-3 Hours of Operation ....................................................................................................II-6
Staffing ...........................................................................................................................II-7 Budget..........................................................................................................................II-10 Funding Sources ..........................................................................................................II-10 Programming................................................................................................................II-14 Summary......................................................................................................................II-16
III. BEACON CENTER PARTICIPATION AND YOUTH DEVELOPMENTAL EXPERIENCES .................................................................. III-1
Data Sources ................................................................................................................III-1 Contract Management System Data.........................................................................III-1 Survey Data ..............................................................................................................III-2 District Data ..............................................................................................................III-3
Demographics, Participation and Attendance ...............................................................III-3 Demographics...........................................................................................................III-4 Participation ..............................................................................................................III-8 Average Daily Attendance (ADA) ...........................................................................III-12 Hub Youth Attendance............................................................................................III-14

ii
Adult Attendance at Hub Sites................................................................................III-20 Hub Survey Results ....................................................................................................III-22
Safety at Beacon ....................................................................................................III-24 Welcoming at Beacon.............................................................................................III-26 Engagement & Collaboration..................................................................................III-27 Comprehensive Programming ................................................................................III-28 Supportive Relationships ........................................................................................III-29 Meaningful Participation & Sense of Belonging......................................................III-32 Involvement in the Community ...............................................................................III-35 Challenging & Engaging Skill Building....................................................................III-36 Youth Habits ...........................................................................................................III-38 Youth Assessment of Beacon.................................................................................III-40
District Data.................................................................................................................III-41 California Standards Test (CST) Proficiency ..........................................................III-42 Average Daily Attendance (ADA) ...........................................................................III-43 Suspensions ...........................................................................................................III-44
Summary.....................................................................................................................III-45
IV. KEY CHALLENGES TO ACHIEVING BEACON MISSION AND QUALITY STANDARDS .....................................................................................IV-1
1. Parent and Community Engagement ...................................................................... IV-1 Location of Beacon Centers .................................................................................... IV-2 Working Class Families ........................................................................................... IV-3 Immigrant Families .................................................................................................. IV-3
2. Availability of School Space .................................................................................... IV-3 Cooperation of Teachers ......................................................................................... IV-4 Construction at School Sites.................................................................................... IV-4
3. Relationship with Host School................................................................................. IV-5 Changes in School Administration........................................................................... IV-5 Conflicting Goals...................................................................................................... IV-6
4. Participant Attendance Requirement ...................................................................... IV-7 Community Violence................................................................................................ IV-7 Transportation.......................................................................................................... IV-8 Program Offerings ................................................................................................... IV-8
5. Integrating ExCEL Funds ........................................................................................ IV-9

iii
Limits Program Offerings and Target Population..................................................... IV-9 Conclusion ................................................................................................................. IV-10
V. ASSESSMENT OF THE THEORY OF CHANGE, QUALITY STANDARDS AND RECOMMENDATIONS........................................................V-1
How accurately does the Beacon ToC and Quality Standards reflect the current goals, activities, and outcomes? ................................................................. V-3
Assessment of the Theory of Change & Quality Standards ..................................... V-4 Recommendations for the Theory of Change........................................................... V-5
Assessment and Recommendations for the Quality Standards.................................... V-9 Recommendations for Changes in the Quality Standards...................................... V-10 Additions to the Quality Standards ......................................................................... V-11
Recommendations for Improved Data Collection........................................................ V-13 Conclusion .................................................................................................................. V-14
APPENDIX A: PROMISING PRACTICES AND INNOVATIVE PROGRAMMING ................................................................................................ A-1
APPENDIX B: COMPLIANCE STANDARDS FOR BEACON CENTERS: COMPLIANCE STANDARDS RESULTS FOR 2007....................... B-1
APPENDIX C: SAMPLE BEACON SCORECARD TO ALIGN WITH SFUSD STRATEGIC GOALS AND SCORECARD ............................................ C-1
APPENDIX D: ANALYSES OF SELECTED ATTENDANCE BY GRADE LEVEL................................................................................................... D-1

This page intentionally left blank.
Insert blank page here when making double-sided copies
I-1
I. ABOUT THE EVALUATION
In 2007, the SF Beacon Initiative (SFBI) underwent a major strategic planning process to re-examine SFBI’s alignment with the Beacon vision and mission. The intent of this process was to set a future course for the initiative, which ensures that the Centers promote youth and family centers in public schools that become beacons of activity for the surrounding neighborhood. In conjunction with this process, the goal of the 2007-2008 Evaluation of the SF Beacon Initiative was to take stock of the focus and usefulness of the evaluation tools, data, and analysis while assuring alignment of the evaluation with the new SFBI strategic plan.1 Towards this end, Social Policy Research Associates (SPR) was engaged in 2008 to help SFBI review the existing Beacon theory of change, quality standards, evaluation methods, and processes for continuous improvement. SPR’s goal was to surface strengths and challenges of the current evaluation system and assist in the revision of the standards, measurement tools, and data collection processes to better match with the current strategic focus. Our specific evaluation objectives included the following:
• Conducting in-depth interviews with Beacon Center directors to review and recommend changes to the ToC, Quality Standards, and evaluation.
• Providing SFBI with information on the eight Beacon Centers’ progress towards meeting quality standards and outcomes for youth.
• Making recommendations for future Beacon evaluations, specifically focusing on: (1) role of lead agencies, (2) role of SFBI, (3) family and adult engagement.
In addition, we were interested in examining the ways in which a number of the Beacon Centers have evolved from the original concept of the Beacon Centers and the impact of the growth of the Initiative from 8 to 25 schools through the exponential increase in state-funding for afterschool leveraged by Beacons. We examined opportunities of this expansion and costs of a potential “mission drift” on the Centers’ structure, operation, and practices. Exhibit I-1 below
1 Since the 2005 San Francisco Beacon Initiative (SFBI) Evaluation by Resource Development Associates, there
has been a hiatus of evaluation activities. In January of 2008, SFBI commissioned with Social Policy Research Associates to resume evaluation activities and provide recommendations for new directions in this evaluation.
I-2
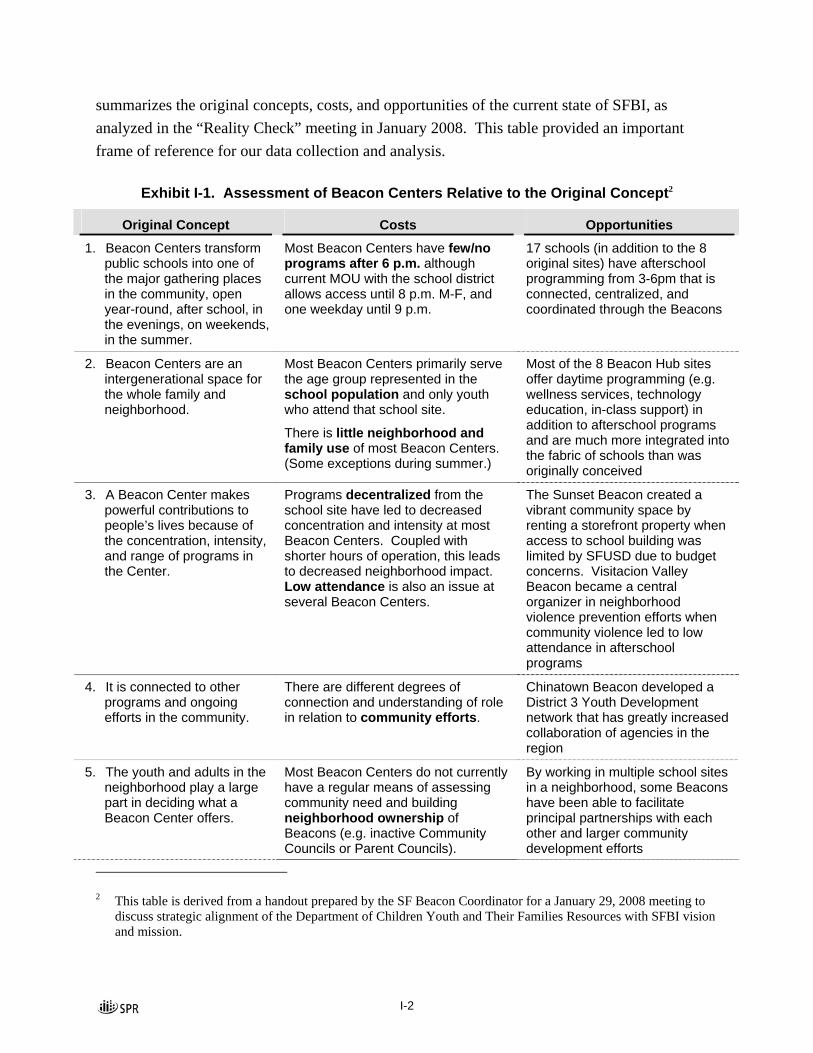
summarizes the original concepts, costs, and opportunities of the current state of SFBI, as analyzed in the “Reality Check” meeting in January 2008. This table provided an important frame of reference for our data collection and analysis.
Exhibit I-1. Assessment of Beacon Centers Relative to the Original Concept2
Original Concept Costs Opportunities
1. Beacon Centers transform public schools into one of the major gathering places in the community, open year-round, after school, in the evenings, on weekends, in the summer.
Most Beacon Centers have few/no programs after 6 p.m. although current MOU with the school district allows access until 8 p.m. M-F, and one weekday until 9 p.m.
17 schools (in addition to the 8 original sites) have afterschool programming from 3-6pm that is connected, centralized, and coordinated through the Beacons
2. Beacon Centers are an intergenerational space for the whole family and neighborhood.
Most Beacon Centers primarily serve the age group represented in the school population and only youth who attend that school site.
There is little neighborhood and family use of most Beacon Centers. (Some exceptions during summer.)
Most of the 8 Beacon Hub sites offer daytime programming (e.g. wellness services, technology education, in-class support) in addition to afterschool programs and are much more integrated into the fabric of schools than was originally conceived
3. A Beacon Center makes powerful contributions to people’s lives because of the concentration, intensity, and range of programs in the Center.
Programs decentralized from the school site have led to decreased concentration and intensity at most Beacon Centers. Coupled with shorter hours of operation, this leads to decreased neighborhood impact. Low attendance is also an issue at several Beacon Centers.
The Sunset Beacon created a vibrant community space by renting a storefront property when access to school building was limited by SFUSD due to budget concerns. Visitacion Valley Beacon became a central organizer in neighborhood violence prevention efforts when community violence led to low attendance in afterschool programs
4. It is connected to other programs and ongoing efforts in the community.
There are different degrees of connection and understanding of role in relation to community efforts.
Chinatown Beacon developed a District 3 Youth Development network that has greatly increased collaboration of agencies in the region
5. The youth and adults in the neighborhood play a large part in deciding what a Beacon Center offers.
Most Beacon Centers do not currently have a regular means of assessing community need and building neighborhood ownership of Beacons (e.g. inactive Community Councils or Parent Councils).
By working in multiple school sites in a neighborhood, some Beacons have been able to facilitate principal partnerships with each other and larger community development efforts
2 This table is derived from a handout prepared by the SF Beacon Coordinator for a January 29, 2008 meeting to
discuss strategic alignment of the Department of Children Youth and Their Families Resources with SFBI vision and mission.

I-3
Methodology In order to collect the data necessary to produce this report, we used a variety of data collection methods. The qualitative components included the following:
• Review of key documents, such as previous SFBI evaluation reports, the SFBI 2007 strategic plan, and Beacon Center specific documents and websites.
• Review of Minimum Compliance Quality Standards completed by the Beacon Directors in 2007.
• Site visits to all eight Beacon Centers to conduct day long interviews and observations. Key activities included:
− In-depth interviews with Beacon and Program Directors,
− Interviews with line staff and school staff,
− Interviews with youth to produce mini-youth case studies,
− Focus groups with parents.
− Observations of program activities (some at satellite sites).
• Incorporation of findings from a study of hard-to-reach middle school students. In May of 2007, SPR conducted a total of 16 youth focus groups across the eight Beacons sites (two focus groups per site with each focus group lasting from 20-45 minutes each over 2.5 weeks in May 2007). We interviewed a total of 95 youth who met the “low-participating” and “non-participating” criteria.
The quantitative component consisted of the following:
• Review and analysis of the CMS data.
• Administration of a combined Youth Individual Assessment (YIA) and Youth Satisfaction Survey (YSS) in May 2008. This survey was administered in three languages: English, Spanish, and Chinese.
• Review of district data from the 2007-2008 school year.
Where possible, we conducted a separate analysis of youth participants at the main “hub” Beacon site. This is to assess the primary effect of DCYF funding on youth outcomes.
Overview of the Report This report consists of six chapters. Chapter 1 provides an overview of the evaluation goals and methods. The remaining chapters aim to achieve the following:
• Chapter 2 provides an overview of the Beacon Centers. In this chapter, we review the initiative structure with specific information on the SFBI role and lead agency role. We also focus on a description of the Centers’ structure and setup, staffing, funding sources, and programming.
I-4
• Chapter 3 summarizes youth and adult participant characteristics, demographics and participation rates (at hub vs. satellite sites). In addition, we report key youth outcomes based on our quantitative analysis. Key areas of reporting include satisfaction with Beacon Center experience, activities/participation, safety, and youth development outcomes.
• Chapter 4 discusses key challenges faced by Centers, particularly as they affect their ability to achieve the original mission and vision of the Beacon initiative.
• Chapter 5 discusses the implications of the challenges on the Beacon Theory of Change and Quality Standards. We provide key recommendations for further development of specific standards that Beacon staff perceive as missing or under developed. In addition, we provide our overall recommendations for the leadership roles of SFBI, lead agencies in building the infrastructure of the Beacons initiative, and make recommendations to better prepare for future evaluations.
II-1
II. THE BEACON CENTERS
In order to assess how the Beacon Centers have evolved from the original concept of the Beacons, we begin with a review of the initiative structure with specific information on the SFBI role, and the lead agencies’ role. In addition, we also summarize several aspects of the Beacon Centers in order to address assess their alignment with the overall Beacon mission: (1) the Centers’ structure and setup (how decentralized are the Centers’ operations), (2) staffing (are the staffing positions strategic), (3) funding sources (what other funds do Centers received in addition to the DCYF funds), and (4) programming (is there a diverse range, and what is provided to youth vs. adults vs. family/community).
SFBI and Lead Agency Roles The San Francisco Beacon Initiative (SFBI) is a public-private partnership that promotes youth and family Centers in San Francisco public schools. The following delineates the roles of SFBI and the lead agencies.
Role of SFBI. Based on the Beacon’s Theory of Change, SFBI’s role encompasses the following responsibilities:
• Relationship Building – Build relationships, teamwork, and responsibility among Beacon site stakeholders.
• Leveraging existing support systems – Support and pressure service systems to accommodate the needs of Beacon Centers, facilitate the negotiation with service systems for the commitment of resources for the Beacon Centers, and facilitate establishment of long-term partnerships between service systems and Beacon Centers
• Funding – Initiate the development of a core funding strategy and cultivate donors.
• Communications – Manage the communications and public support campaigns, ensuring commitment of funding.
• Implementing Theory of Change - Institutionalize the Theory of Change and strengthen the sites’ commitment and meaningful use of the Theory of Change.

II-2
• Disseminating best practices – Ensure greater diversity and prevalence of agency use of best practices.
• Capacity building – Provide needed implementation resources and effective supports that build site capacity
• Disseminating youth development model – Build an understanding and commitment to youth development and strengthening the implementation of youth development through staff development, cross-site exchange, and individual site consultation
• Evaluation – Instigate and manage the development of evaluation strategies, manage the evaluation resulting in information that is clear, meaningful, useful and compelling to stakeholders, support ongoing use of evaluation findings by Beacon stakeholders, and broadly disseminate evaluation findings.
Our interviews with Beacon Directors confirmed that these are appropriate roles that SBFI has and continue to play. A number of additional roles and responsibilities were recommended, which we will discuss in Chapter 5.
Role of Lead Agency. The lead agency does not have responsibilities outlined in the Theory of Change. However, respondents at site visits described what they believed the lead agency’s role should be. Although each lead agency functions in a slightly different way, there was consensus that the lead agency should play the following two key roles:
• Fiscal management - Lead agencies are responsible for managing the grant, accounting, and payroll.
• Human resources – Lead agencies are charged with risk management, hiring and evaluating staff including doing background checks and medical clearance, and providing professional development and training opportunities.
Exhibit II-1: Lead Agencies
Beacon Centers Lead Agency Type of Lead Agency Bayview Hunter’s Point Urban Services YMCA Violence Prevention,
Youth Development, Social Services
Chinatown Community Educational Services Youth Development
Mission Mission Neighborhood Center Human Services
OMI-Excelsior Urban Services YMCA Violence Prevention, Youth Development, Social Services
Richmond Richmond District Neighborhood Center
Youth, adult and family programming
Sunset Moss Beach Homes Foster care

II-3
Beacon Centers Lead Agency Type of Lead Agency Visitacion Valley Visitacion Valley Community Center Multi-service, family
resource
Western Addition Buchanan YMCA Youth Development, Healthy and Fitness
In addition to these two key roles, some sites also suggested that lead agencies help connect Beacon to other youth service agencies and community groups, provide additional social services to Beacon participants, and be the “expert in the community,” ensuring that the Beacon serves participants in a culturally and linguistically appropriate manner. Several sites also said that the lead agency should help them secure additional financial resources by helping them find grants or providing a grant writer.
Center Structure and Setup
Locations
Beacon Centers are located in eight neighborhoods throughout San Francisco: Bayview, Chinatown, Mission, OMI/Excelsior, Richmond, Western Addition, Sunset, and Visitacion Valley. In 2007-2008, 13 elementary schools, 8 middle schools, 4 high schools, and 3 other types of locations held Beacon programming. In each neighborhood, one school serves as the hub and the other schools or locations are satellite sites. According to the Quality Standards on Accessibility, 80% of the programming should occur at the hub site.
• Bayview – Gloria Davis Elementary School is currently the hub for this center. The school will open to 9th and 10th graders in the beginning of the 2008-2009 school year. This site was chosen because it is in the heart of the Bayview community and the principal will allow youth from the community to attend the center. Dr. George Washington Carver Elementary School and Thurgood Marshall High School are satellite sites.
• Chinatown – This Beacon Center runs afterschool programs at 7 elementary schools in and around Chinatown and also offers programming at CES’s offices. Gordon J. Lau is designated as the hub, but they currently do not offer any programming beyond running the afterschool program there due to resistance from teachers to sharing classroom space. They also offer satellite programming at Francisco Middle School and Galileo High School
• Mission – Everett Middle School is the only site of operation..
• OMI/Excelsior – James Denman Middle School is the only site of operation.

II-4
• Richmond – George Washington Elementary School serves as the hub for the Richmond Beacon Center with satellite sites at Presidio Middle School and Roosevelt Middle School.
• Sunset – The hub for the Sunset Beacon Center is A.P. Giannini Middle School with satellite sites at 4 elementary schools. They also run programming out of West Sunset Recreation Center and have a stand alone administrative office/community center.
• Visitacion Valley – Visitacion Valley Middle School serves as the hub

II-5
Exhibit II-2: Beacon Sites
E.S. M.S. H.S. Other
Bayview Beacon Center
Gloria R. Davis Middle School (hub) X
Dr. George Washington Carver Elementary School X
Thurgood Marshall High School X
Chinatown Beacon Center
Gordon J. Lau Elementary School (hub) X
Jean Parker Elementary School X
John Yehall Chin X
Spring Valley Elementary School X
Sherman Elementary School X
Redding Elementary School X
Garfield Elementary School X
Francisco Middle School X
Galileo High School X
Community Educational Services X
Mission Beacon Center
Everett Middle School (hub) X
OMI/Excelsior Beacon Center
James Denman Middle School (hub) X
Richmond Village Beacon Center
George Washington High School (hub) X
Presidio Middle School X
Theodore Roosevelt Middle School X
Sunset Neighborhood Beacon Center (SNBC)
A.P. Giannini Middle School (hub) X
Francis Scott Key Elementary X
Sunset Elementary X
Ulloa Elementary X
Robert Louis Stevenson Elementary X
West Sunset Recreation Center X
SNBC Community Center X
Visitacion Valley Beacon Center
Visitacion Valley Middle School (hub) X
Western Addition Beacon Center
John Muir Elementary School (hub) X
Wallenberg High School X
Total 13 8 4 3 1 This school is not currently undergoing reconstruction and is not open to students.

II-6
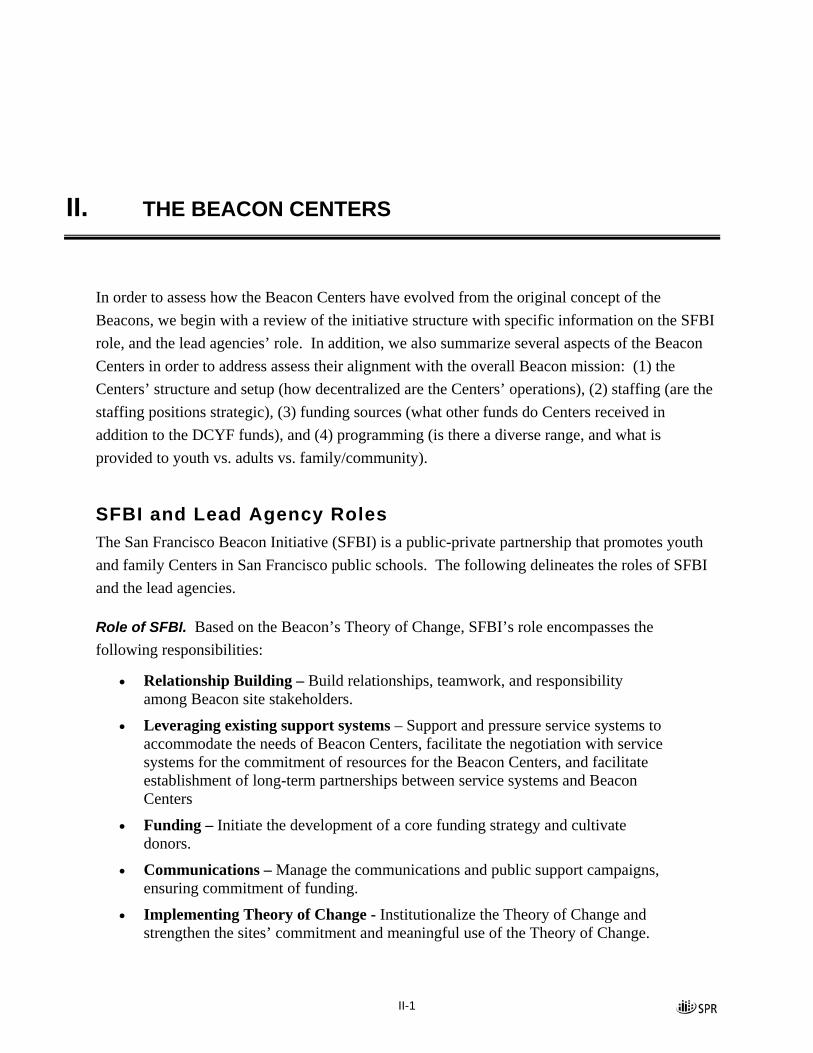
Hours of Operation
According to the Quality Standards on Accessibility, Beacon Centers should be open until 8:00 PM weekdays, offer Saturday programs at least one Saturday per month or for a total of 48 hours on Saturdays during the school year, offer programming during major breaks in the school calendar, and offer programming during the summer months. The current MOU with the school district allows Beacon Centers to be open until 8:00 PM on weekdays, with one night until 9:00 PM, one Saturday per semester, and during the summers.1 Currently, the majority of Centers are not open all of these times.
• All Beacon Centers are open Monday through Friday during afterschool hours (approx. 3-6pm). Additionally, many Centers are open during the school day for administrative tasks and offer lunchtime programming All sites except for Chinatown and Bayview due to school facilities access issues offer evening programming. Four out of 8 Beacon Centers offer programming until 8:00 PM all week from Monday through Friday. Mission is open until 8:00 PM Tuesday through Thursday, and Western Addition is open until 8:00 PM on Fridays.
• All sites except for Chinatown and Bayview offer some kind of Saturday programming, although not on a regular basis.
• Several Beacon Centers offer programming such as college field trips during winter and spring breaks, but not all of the Centers remain open due to school facilities access issues.
• All of the Centers are also open during the summer Exhibit II-3: Hours of Operation
School Year Hours Summer Hours Weekends Bayview2 M-F, 9-6 Some
programming
Chinatown M-F, hours vary according to site
M-F, 9-4
Mission M-F, 3:15-6:30,
T, Th, 3:15-8
W, 12:15-8
F, 3:15-6
M-F One Saturday per semester
1 Note that there is no school holiday access.
2 Bayview plans on being open year round, evenings, and weekends starting August ‘08
II-7
School Year Hours Summer Hours Weekends OMI-Excelsior M-F, 8-8 M-F, 9-3:30 Occasional Saturday
programming
Richmond M-F, 11-1, 3-8 M-F, 8-6 Held outreach activities on 4 Saturdays
Sunset M-Sa, 9-8 M-F, 1-6 Occasional Saturday programming
Vis Valley M-F, 9-8:30 M-F, 10:30-3 Saturdays, 9:30-12:30
Western Addition M-Th, 9-7, F, 9-8 Full summer programming
One Saturday per semester
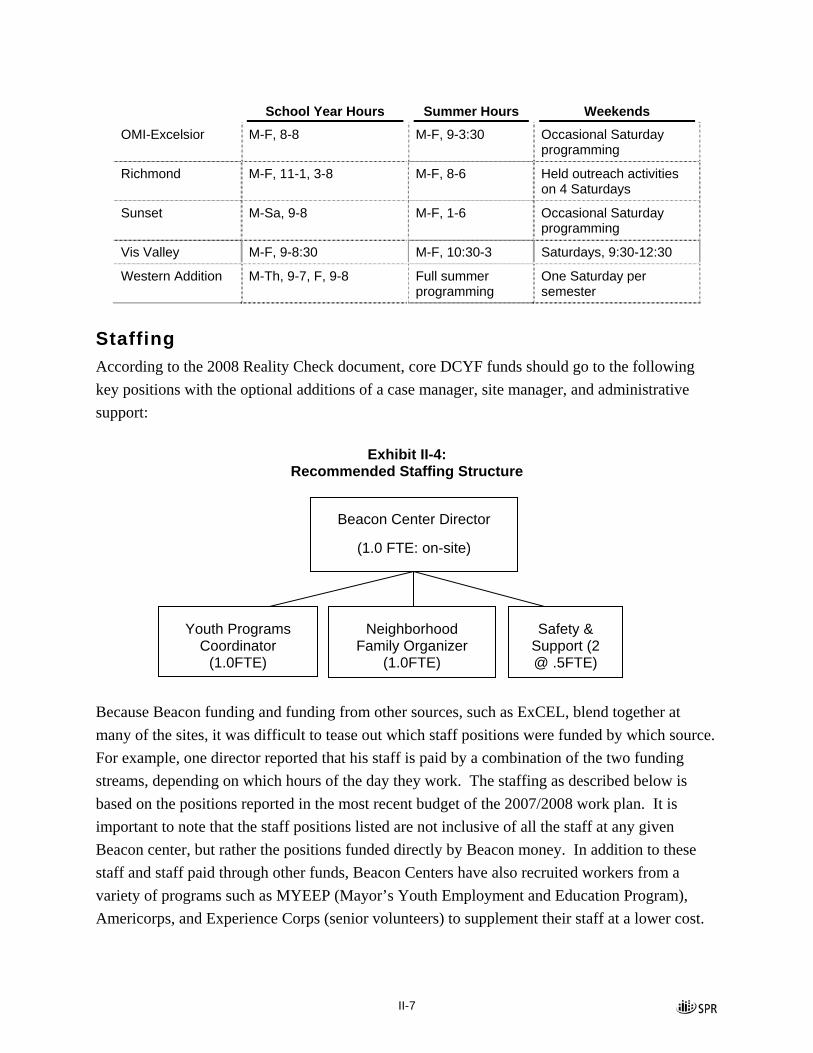
Staffing According to the 2008 Reality Check document, core DCYF funds should go to the following key positions with the optional additions of a case manager, site manager, and administrative support:
Exhibit II-4: Recommended Staffing Structure
Because Beacon funding and funding from other sources, such as ExCEL, blend together at many of the sites, it was difficult to tease out which staff positions were funded by which source. For example, one director reported that his staff is paid by a combination of the two funding streams, depending on which hours of the day they work. The staffing as described below is based on the positions reported in the most recent budget of the 2007/2008 work plan. It is important to note that the staff positions listed are not inclusive of all the staff at any given Beacon center, but rather the positions funded directly by Beacon money. In addition to these staff and staff paid through other funds, Beacon Centers have also recruited workers from a variety of programs such as MYEEP (Mayor’s Youth Employment and Education Program), Americorps, and Experience Corps (senior volunteers) to supplement their staff at a lower cost.
Beacon Center Director
(1.0 FTE: on-site)
Safety & Support (2 @ .5FTE)
Neighborhood Family Organizer
(1.0FTE)
Youth Programs Coordinator
(1.0FTE)
II-8
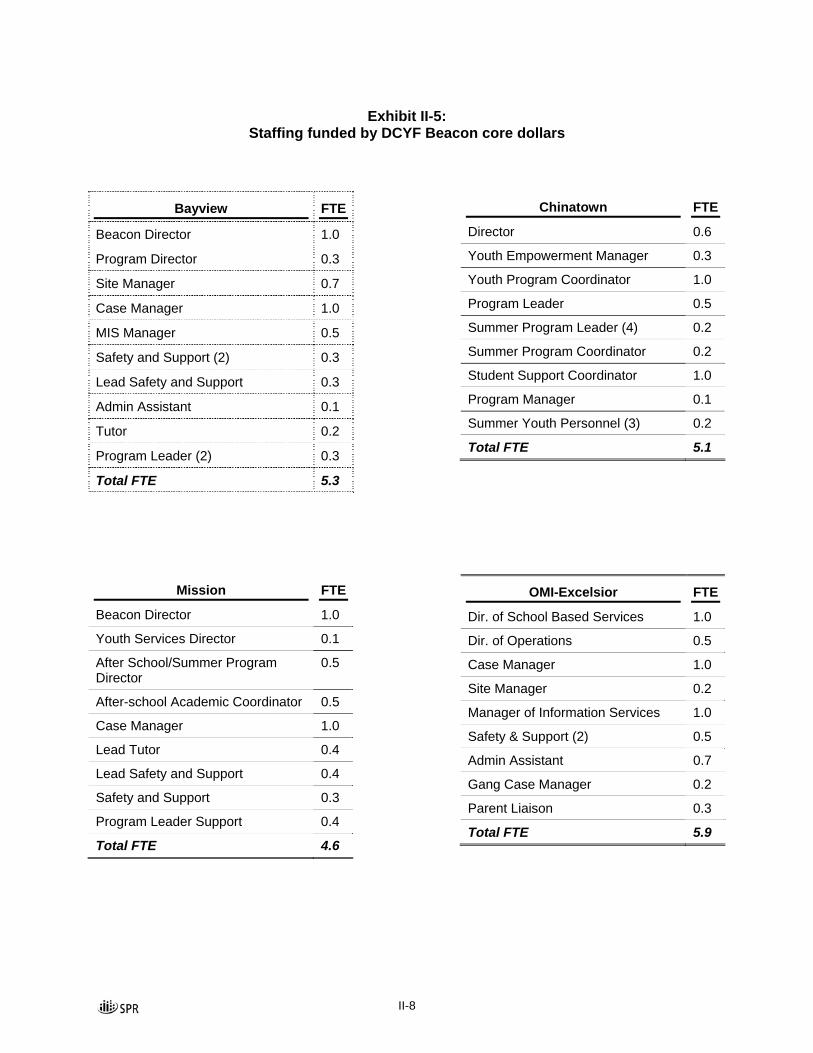
Exhibit II-5: Staffing funded by DCYF Beacon core dollars
Bayview FTE
Beacon Director 1.0
Program Director 0.3
Site Manager 0.7
Case Manager 1.0
MIS Manager 0.5
Safety and Support (2) 0.3
Lead Safety and Support 0.3
Admin Assistant 0.1
Tutor 0.2
Program Leader (2) 0.3
Total FTE 5.3
Chinatown FTE
Director 0.6
Youth Empowerment Manager 0.3
Youth Program Coordinator 1.0
Program Leader 0.5
Summer Program Leader (4) 0.2
Summer Program Coordinator 0.2
Student Support Coordinator 1.0
Program Manager 0.1
Summer Youth Personnel (3) 0.2
Total FTE 5.1
Mission FTE
Beacon Director 1.0
Youth Services Director 0.1
After School/Summer Program Director
0.5
After-school Academic Coordinator 0.5
Case Manager 1.0
Lead Tutor 0.4
Lead Safety and Support 0.4
Safety and Support 0.3
Program Leader Support 0.4
Total FTE 4.6
OMI-Excelsior FTE
Dir. of School Based Services 1.0
Dir. of Operations 0.5
Case Manager 1.0
Site Manager 0.2
Manager of Information Services 1.0
Safety & Support (2) 0.5
Admin Assistant 0.7
Gang Case Manager 0.2
Parent Liaison 0.3
Total FTE 5.9
II-9
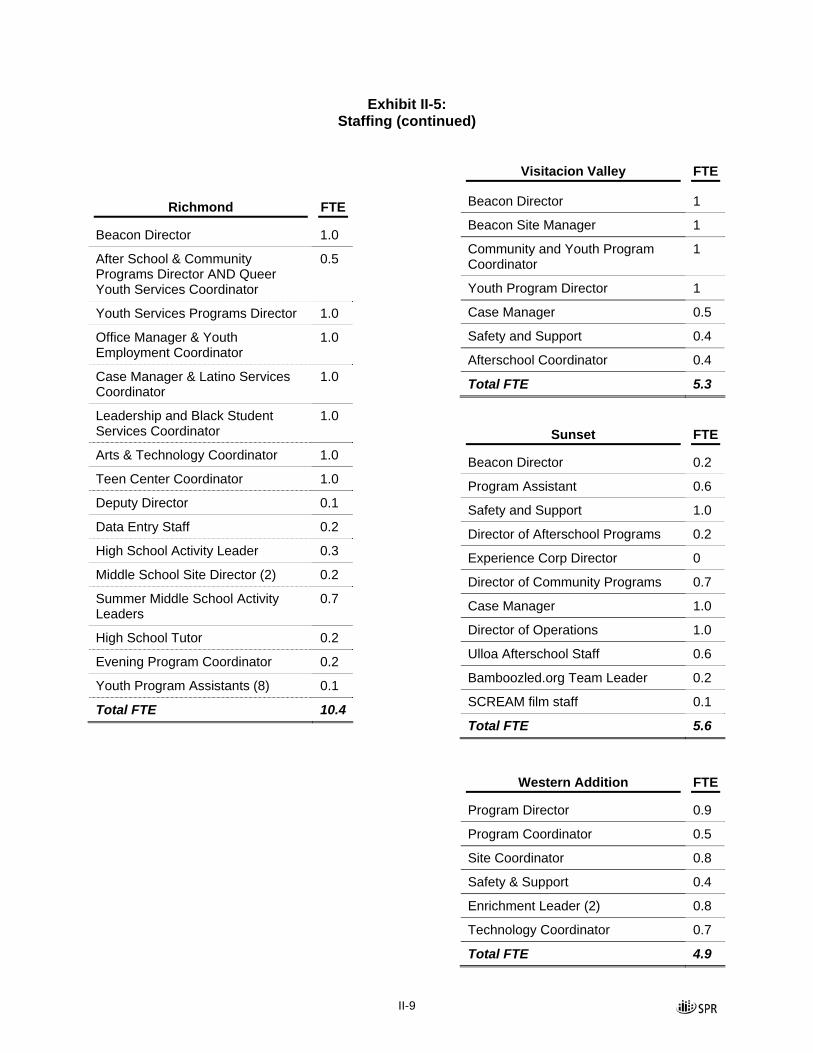
Exhibit II-5: Staffing (continued)
Visitacion Valley FTE
Beacon Director 1
Beacon Site Manager 1
Community and Youth Program Coordinator
1
Youth Program Director 1
Case Manager 0.5
Safety and Support 0.4
Afterschool Coordinator 0.4
Total FTE 5.3
Richmond FTE
Beacon Director 1.0
After School & Community Programs Director AND Queer Youth Services Coordinator
0.5
Youth Services Programs Director 1.0
Office Manager & Youth Employment Coordinator
1.0
Case Manager & Latino Services Coordinator
1.0
Leadership and Black Student Services Coordinator
1.0
Arts & Technology Coordinator 1.0
Teen Center Coordinator 1.0
Deputy Director 0.1
Data Entry Staff 0.2
High School Activity Leader 0.3
Middle School Site Director (2) 0.2
Summer Middle School Activity Leaders
0.7
High School Tutor 0.2
Evening Program Coordinator 0.2
Youth Program Assistants (8) 0.1
Total FTE 10.4
Sunset FTE
Beacon Director 0.2
Program Assistant 0.6
Safety and Support 1.0
Director of Afterschool Programs 0.2
Experience Corp Director 0
Director of Community Programs 0.7
Case Manager 1.0
Director of Operations 1.0
Ulloa Afterschool Staff 0.6
Bamboozled.org Team Leader 0.2
SCREAM film staff 0.1
Total FTE 5.6
Western Addition FTE
Program Director 0.9
Program Coordinator 0.5
Site Coordinator 0.8
Safety & Support 0.4
Enrichment Leader (2) 0.8
Technology Coordinator 0.7
Total FTE 4.9
II-10
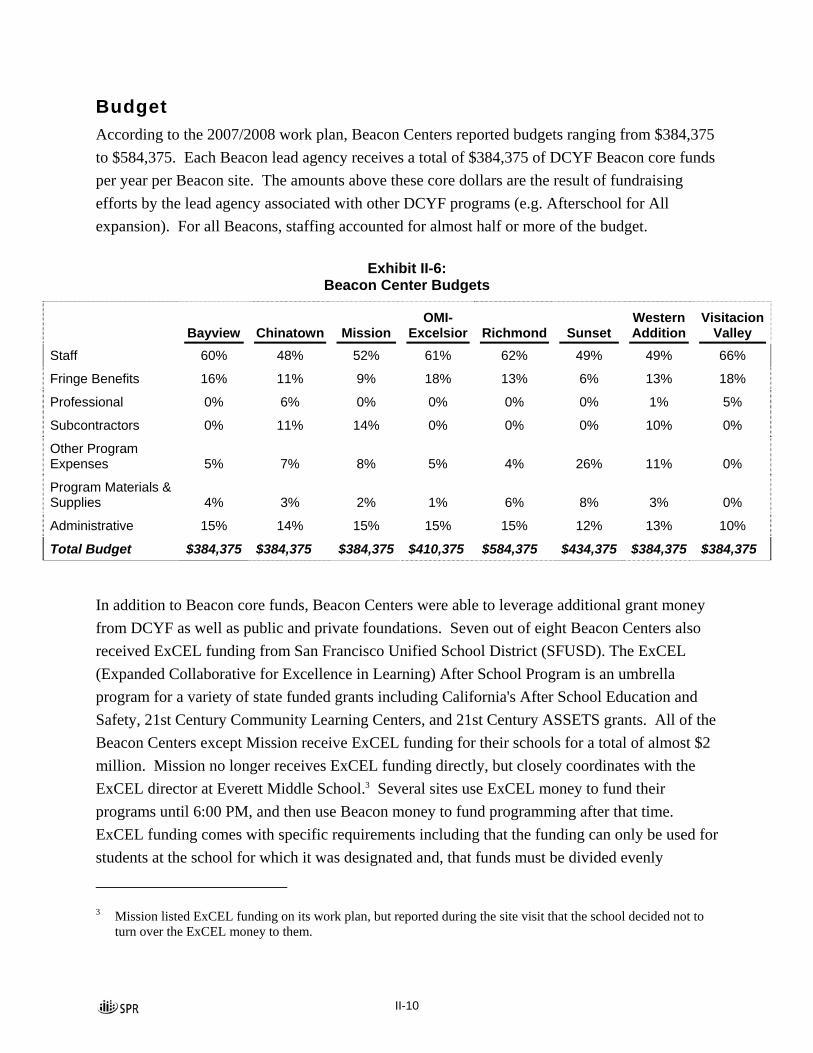
Budget According to the 2007/2008 work plan, Beacon Centers reported budgets ranging from $384,375 to $584,375. Each Beacon lead agency receives a total of $384,375 of DCYF Beacon core funds per year per Beacon site. The amounts above these core dollars are the result of fundraising efforts by the lead agency associated with other DCYF programs (e.g. Afterschool for All expansion). For all Beacons, staffing accounted for almost half or more of the budget.
Exhibit II-6: Beacon Center Budgets
Bayview Chinatown
Mission OMI-
Excelsior
Richmond
Sunset Western Addition
Visitacion Valley
Staff 60% 48% 52% 61% 62% 49% 49% 66%
Fringe Benefits 16% 11% 9% 18% 13% 6% 13% 18%
Professional 0% 6% 0% 0% 0% 0% 1% 5%
Subcontractors 0% 11% 14% 0% 0% 0% 10% 0%
Other Program Expenses 5% 7% 8% 5% 4% 26% 11% 0%
Program Materials & Supplies 4% 3% 2% 1% 6% 8% 3% 0%
Administrative 15% 14% 15% 15% 15% 12% 13% 10%
Total Budget $384,375 $384,375 $384,375 $410,375 $584,375 $434,375 $384,375 $384,375
In addition to Beacon core funds, Beacon Centers were able to leverage additional grant money from DCYF as well as public and private foundations. Seven out of eight Beacon Centers also received ExCEL funding from San Francisco Unified School District (SFUSD). The ExCEL (Expanded Collaborative for Excellence in Learning) After School Program is an umbrella program for a variety of state funded grants including California's After School Education and Safety, 21st Century Community Learning Centers, and 21st Century ASSETS grants. All of the Beacon Centers except Mission receive ExCEL funding for their schools for a total of almost $2 million. Mission no longer receives ExCEL funding directly, but closely coordinates with the ExCEL director at Everett Middle School.3 Several sites use ExCEL money to fund their programs until 6:00 PM, and then use Beacon money to fund programming after that time. ExCEL funding comes with specific requirements including that the funding can only be used for students at the school for which it was designated and, that funds must be divided evenly
3 Mission listed ExCEL funding on its work plan, but reported during the site visit that the school decided not to
turn over the ExCEL money to them.

II-11
between academic, enrichment, and recreation programs. Best practices for how Beacon Centers integrate ExCEL funding without drifting from the Beacon’s mission are discussed in Chapter 4.
Exhibit II-7: ExCEL Funding
ExCEL Sites Amount Bayview4 Dr. George Washington Carver Elementary School
Chinatown
Jean Parker Elementary School,
John Yehall Chin Elementary School
Spring Valley Elementary School,
Sherman Elementary School,
Redding Elementary School,
Garfield Elementary School,
Gordon J. Lau Elementary School
$625,000
OMI/Excelsior James Denman Middle School $158,000
Richmond
Presidio Middle School,
Theodore Roosevelt Middle School
$360,000
Sunset A.P. Giannini Middle School,
Francis Scott Key Elementary,
Sunset Elementary,
Ulloa Elementary,
Robert Louis Stevenson Elementary School
$554,945
Visitacion Valley Visitacion Valley Middle School $140,273
Western Addition
John Muir Elementary School,
Wallenberg High School
$68,000
Total $1,906,218
Programming Beacon Centers offer a variety of daytime programming, lunchtime programming, afterschool activities, evening activities, weekend activities, and activities during school breaks. By far, the majority of programming across sites occurs during the afterschool hours for youth, but Centers also offered family and community programming, The majority of programming that Beacon
4 Bayview does not list ExCEL funding on its 2007/2008 work plan, but said that they receive it during the site
visit.

II-12
Centers offers tends to serve participants who attend the schools where the site is housed. As seen in Exhibit II-2, the majority of Beacon Centers are at elementary schools, although the majority of hubs are housed at middle schools. The following delineates where each hub is located as well as the other school sites served.
• Elementary Schools
− Chinatown has its hub at and primarily serves elementary schools.
− Western Addition’s hub is at an elementary school (in which they also started a middle school program), with one satellite site at a high school.
• Middle Schools
− Mission, OMI-Excelsior, and Visitacion Valley all have their only Beacon Center housed at a middle school.
− Bayview and Sunset both serve elementary and middle schools, although their hubs are at middle schools. (However, Bayview’s hub site was not an operating school in the 2007-2008 school year.)
• High Schools
− Richmond’s hub is at a high school, with satellite sites at middle schools.
Exhibit II-8: Summary of Programming Across Beacon Sites
(not an exhaustive list)
Youth Family/Community Bayview • Afterschool academic support as well as
dance, cooking, and recreation • Hold parent workshops on topics such as
“How to Know if your Child is in a Gang”
• Recently started a community council
Chinatown • Follows the ExCEL model of academics, recreation/nutrition, and enrichment
• Run lunchtime programs at the hub
• Holds family dinners
Mission • Offers academic support and drop-in activities such as Skate Club, cooking, music, and support groups
• Recently opened a food pantry on site
• Held a community pow wow in the spring semester and have family dinners once a month
• Host a drama therapy cancer group and a martial arts club

II-13
Youth Family/Community OMI-Excelsior
• Offer various recreation, enrichment, and academic activities including a youth leadership council
• Held spring carnival, family ice skating, karaoke, and movie nights, and offered free tax help for community
Richmond • Teen Center, tutoring, music, spoken word and other programs are offered afterschool
• Programs offered in a drop in basis during lunchtime include Urban Gyrlz Read and the Black Student Union
• Classes cover life skills, computers, dance, and ESL
Sunset • Programming covers a variety of topics including academic help, dance, cooking, DJing, computers, etc.
• Community programs include Rec Connect, Safety Network Community Convener, and Community Council
• Offers computer classes, filmmaking classes, and ESL classes
Visitacion Valley
• Require youth to participate in academic programs before the enrichment or recreation programs
• Structured enrichment and recreation programs focus on sports, cooking, etc
• 2 night time programs for community youth aged 13-21
• Community programs include the Safety Network Program and Weed and Seed, a crime reduction program
• Tai Chi, basketball, badminton, soccer, and ESL
Western Addition
• Offer a variety of academic, recreation, and enrichment programs including a youth leadership council
• Youth lead community service events
• Have parent advisory council and parent potlucks
• Host and attends community events
• Computer classes, ESL, and drop in computer lab
Summary In this chapter, we provided an overview of the key characteristics of the eight Beacon Centers and the complexity of the efforts that have gone into operating the Centers. The Beacon Centers have grown tremendously over the years, operating in at least eight neighborhoods and across 27 school and other sites with budgets of approximately $7 million. In assessing the extent to which the Centers are providing environments that are visible, accessible, and safe, a number of centers are reporting that they are “in progress” or have “not met” a few of the quality standards. For example, based on site visits and CMS data from Spring 2008, only four of eight of the Centers offered programming until 8:00 p.m. Monday through Friday. However, accessibility was a major area of focus for many of the Beacon Centers and all sites increased programming until 8 p.m. where it was possible (leaving only two sites without this cause of school issues). By the

II-14
end of the year, Beacon Centers had programming at least two nights a week in 6 of 8 sites; whereas at the beginning of the school year, this was true in only in one or two sites.
The San Francisco Department of Children, Youth and Families provides a key funding source for Beacon centers; however, the Centers also reported receiving ExCEL and other funding. Providing a diverse programming (e.g., academic support, enrichment, and recreational) is a strength of many of the Centers.
III-1
III. BEACON CENTER PARTICIPATION AND YOUTH DEVELOPMENTAL EXPERIENCES
As described in the last chapter and in the Quality Standards, aspects of visibility, accessibility, safety, well-trained staff, and high quality programming are essential to attracting large number of youth and adults. In this chapter, we are interested in exploring the youth and adult demographic characteristics and their participant rates (e.g., summer vs. school session, hub vs. satellite sites, and the range of activities). In addition, we report the extent of the quality youth development experiences, specifically, youth satisfaction and developmental outcomes based on our quantitative analysis. This chapter draws from data gathered from Contract Management System (CMS) from June 2007 to June 2008 and the Youth Individual Assessment (YIA) / Youth Satisfaction Survey (YSS) administered by Beacon staff at the end of the 2007-2008 school year.
Data Sources
Contract Management System Data
The Beacon Centers use the Contract Management System (CMS), a web-based management information system, which is required by SFBI’s primary funder, the Department of Children, Youth and Families (DCYF), to record registration and service-usage data on participants. A data file was extracted from the web-based system for all Beacon participants, including both those in DCYF-funded and non-DCFY-funded activities. The file had demographic and participation data on adult and youth participants for the 2007 summer session and the 2007-2008 school year from each Beacon Center.
In reviewing the data file down loaded from the CMS, we found numerous data gaps and data entry practices that needed to be addressed in the short term and longer-term. This iterative process took 2-3 months to clean up to ensure that the dataset was valid and complete as possible. After initially extracting and reviewing the data file, we asked Beacon Directors to fill

III-2
in some of the gaps from their data entry. With their assistance, a more accurate CMS file was produced and used in the analysis for this report.
In addition, some of the CMS data file contained duplicate entries for some participants. This may have occurred because either the same participant attended two different Beacon sites or a Beacon site erroneously entered some participants more than once. Instances of duplication are difficult to detect because the participants’ CMS client identification numbers are not necessarily unique. Beacon participants at different sites may have the same number, and it is even possible that two participants at the same Beacon could have identical numbers. While we may want to think about using San Francisco Unified School District’s HO Numbers, which are unique to individual students, they are inconsistently captured in the CMS and exist only for SFUSD students and not for adult participants. Please see Chapter 5 for specific recommendations to improve CMS data quality.
Survey Data
In previous years, the Youth Individual Assessment (YIA) had been administered as a pretest-posttest assessment of Beacon youth that aimed to measure changes in youth knowledge, competencies, and behaviors from the beginning to the end of the school year. At that time, the Youth Satisfaction Survey (YSS) was administered once, at the end of the school year, as an attachment to the YIA posttest survey. The YSS questions addressed youth satisfaction with their Beacon experiences, including assessments of programming and staff, and their opportunities to engage in a range of youth development activities.
This year, due to limited time and resources,1 the YIA and the YSS from previous years were combined and administered only once at the end of the 2007-2008 school year. Beacon Centers were given two versions of the YIA/YSS, one for elementary school participants in the fourth grade or above and one for middle and high school participants. Both versions of the elementary and middle/high school surveys were translated into Spanish and Chinese and made available to students upon request. The Centers administered the surveys to Beacon participants at their hub and satellite sites during the month of May.
Across all Beacon Centers, a total of 1,467 YIA/YSS surveys were completed—848 middle and high school surveys and 617 elementary surveys. This is a response rate of approximately 36%, based on the total number of Beacon participants aged nine to 18 served in the month of
1 The evaluation began in December of 2007.
III-3
May 2008.2 However, response rates varied considerably across Beacon Centers. Some Centers had response rates of more than 60%, while others had rates below 20%. Therefore, participants from some Centers accounted for larger percentages of respondents than those of others.
District Data
San Francisco Unified School District (SFUSD) provided the SFBI with academic and behavioral data for youth enrolled in the ExCEL program for the 2007-2008 school year.3 At most SFUSD schools where there are both a Beacon Center and an ExCEL program, the ExCEL program is run through Beacon.4 Therefore, SFUSD data for these ExCEL-enrolled youth reflect a subset of Beacon youth, and do not include Beacon youth who are not enrolled in the ExCEL program.
SFUSD provided aggregate-level data on youth from each of the school sites. The youth were grouped into categories based on how many days, if any, they attended the Beacon program at each school during school year 2007-2008. With aggregate level data for each school, we are only able to sum the categories for all schools together and present the totals for each category of attendance.
Demographics, Participation and Attendance The data file extracted from the CMS provided information about Summer 2007 and School Year 2007-2008 Beacon participants, including their participation, activities, and demographics. Exhibits III-1 and III-2 display demographic information for participants at all sites (combined hub and satellite locations) and at hubs sites only. In addition, Exhibits III-3 to III-7, with overall Summer and School Year participation and average daily attendance, display results for all Beacon participants, both at the hub and satellite sites.5 However, as discussed in Chapter 2,
2 CMS data on May youth participants, age range nine to eighteen, were used to calculate the response rate instead
of grade level because of the large number of missing grade level data for youth participants.
3 SFUSD summarizes data on youth in the ExCEL programs, but was not able to provide data for all Beacon participants.
4 Mission Beacon Center does not directly run the ExCEL program, but the two programs are closely coordinated, and youth are co-enrolled.
5 Participants were coded as hub or satellite participants based on the physical location where they attended Beacon activities. Since there is currently no variable in the CMS to record the physical location of attendance, an activity code was extracted for each participant and that activity was coded as taking place at a hub or satellite location. For some participants with missing activity codes, information gathered directly from Beacon site staff was used to determine the location of their participation.

III-4
significant differences exist between the programming that takes place at Beacon hub and satellite locations. Since activities at the hubs are more likely to represent core components of the Beacon mission, the information presented on participation and attendance rates focuses primarily on the hub sites.
Demographics
The CMS contains some demographic information on Beacon participants. The following exhibits display in percentages, the demographic characteristics of adults and youth who attended Beacon hub locations from June 13, 2007 to June 13, 2008.
Youth Characteristics
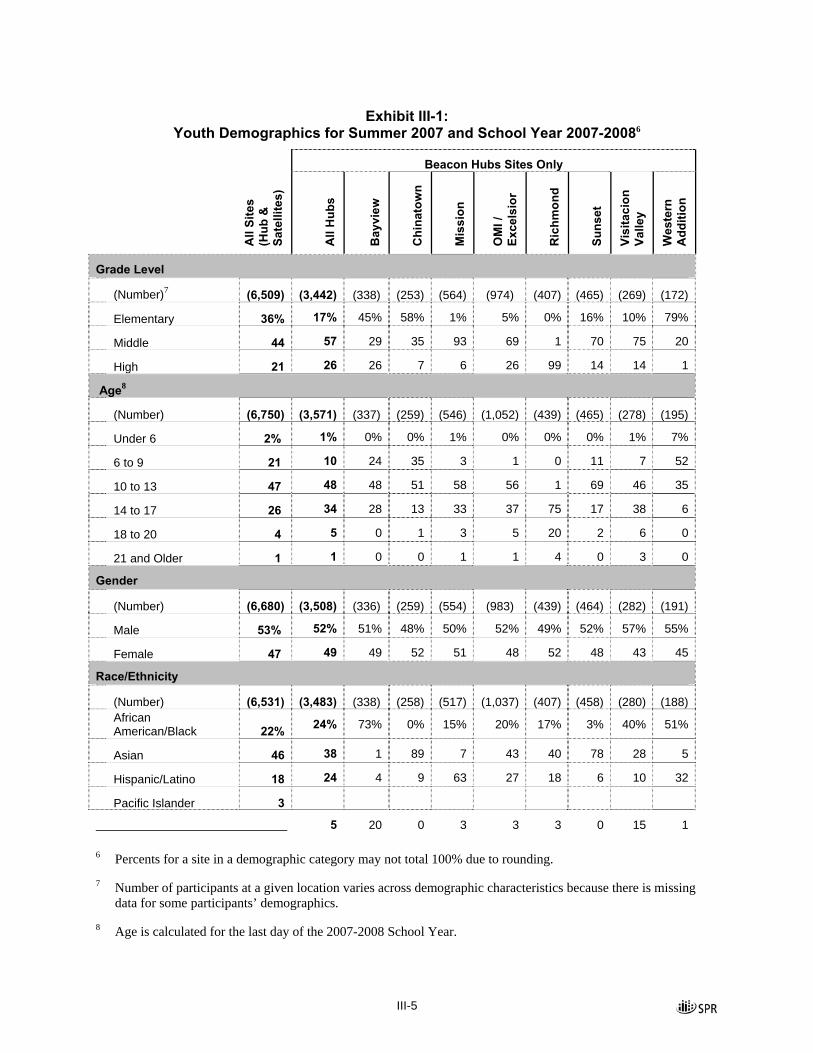
Exhibit III-1 shows the demographic characteristics for all Beacon youth participants and hub only youth. Across Beacon Centers, including hub and satellite, the percentage of youth ages in 2007-2008 are roughly similar to the summer and school year of 2006-2007, with only a slightly lower percentage of 10 to 13 year olds (50% in 2006-2007 compared to 47% in 2007-2008) and a slightly higher percentage of 14 to 17 year olds (23% in 2006-2007 compared to 26% in 2007-2008). For hub youth only, most were in middle school (57%), and the highest percentage of participants were in the age range of ten to thirteen years old (48%). Hub youth participants were split fairly even by gender, with about 52% male. The race/ethnic category with the highest percentage of hub youth was Asian (38%), followed by Hispanic/Latino and African American (both at 24%). The majority (83%) of hub youth participants were fluent English speakers. The demographic characteristics of hub youth vary across Beacon hub sites, though most sites have a fairly even gender split, and six of the eight sites had over 75% fluent English speaking participants at their hubs.
III-5
Exhibit III-1: Youth Demographics for Summer 2007 and School Year 2007-20086
Beacon Hubs Sites Only
All
Site
s
(Hub
&
Sate
llite
s)
All
Hub
s
Bay
view
Chi
nato
wn
Mis
sion
OM
I /
Exce
lsio
r
Ric
hmon
d
Suns
et
Visi
taci
on
Valle
y
Wes
tern
A
dditi
on
Grade Level
(Number)7 (6,509) (3,442) (338) (253) (564) (974) (407) (465) (269) (172)
Elementary 36% 17% 45% 58% 1% 5% 0% 16% 10% 79%
Middle 44 57 29 35 93 69 1 70 75 20
High 21 26 26 7 6 26 99 14 14 1
Age8
(Number) (6,750) (3,571) (337) (259) (546) (1,052) (439) (465) (278) (195)
Under 6 2% 1% 0% 0% 1% 0% 0% 0% 1% 7%
6 to 9 21 10 24 35 3 1 0 11 7 52
10 to 13 47 48 48 51 58 56 1 69 46 35
14 to 17 26 34 28 13 33 37 75 17 38 6
18 to 20 4 5 0 1 3 5 20 2 6 0
21 and Older 1 1 0 0 1 1 4 0 3 0
Gender
(Number) (6,680) (3,508) (336) (259) (554) (983) (439) (464) (282) (191)
Male 53% 52% 51% 48% 50% 52% 49% 52% 57% 55%
Female 47 49 49 52 51 48 52 48 43 45
Race/Ethnicity
(Number) (6,531) (3,483) (338) (258) (517) (1,037) (407) (458) (280) (188)
African American/Black 22% 24% 73% 0% 15% 20% 17% 3% 40% 51%
Asian 46 38 1 89 7 43 40 78 28 5
Hispanic/Latino 18 24 4 9 63 27 18 6 10 32
Pacific Islander 3
5 20 0 3 3 3 0 15 1 6 Percents for a site in a demographic category may not total 100% due to rounding.
7 Number of participants at a given location varies across demographic characteristics because there is missing data for some participants’ demographics.
8 Age is calculated for the last day of the 2007-2008 School Year.
III-6
Beacon Hubs Sites Only
All
Site
s
(Hub
&
Sate
llite
s)
All
Hub
s
Bay
view
Chi
nato
wn
Mis
sion
OM
I /
Exce
lsio
r
Ric
hmon
d
Suns
et
Visi
taci
on
Valle
y
Wes
tern
A
dditi
on
White 4 3 1 1 4 2 8 7 1 2
Multiracial/Multiethnic 5 5 0 0 4 6 13 4 6 6
Other 2 2 2 1 4 1 2 3 0 3
English Language Fluency
(Number) (6,655) (3,494) (338) (258) (542) (980) (439) (465) (282) (190)
Fluent 76% 83% 100% 46% 59% 95% 78% 92% 89% 84%
Somewhat Fluent 17 11 0 41 12 4 21 7 8 12
Not Fluent 7 7 0 14 29 1 2 2 3 4
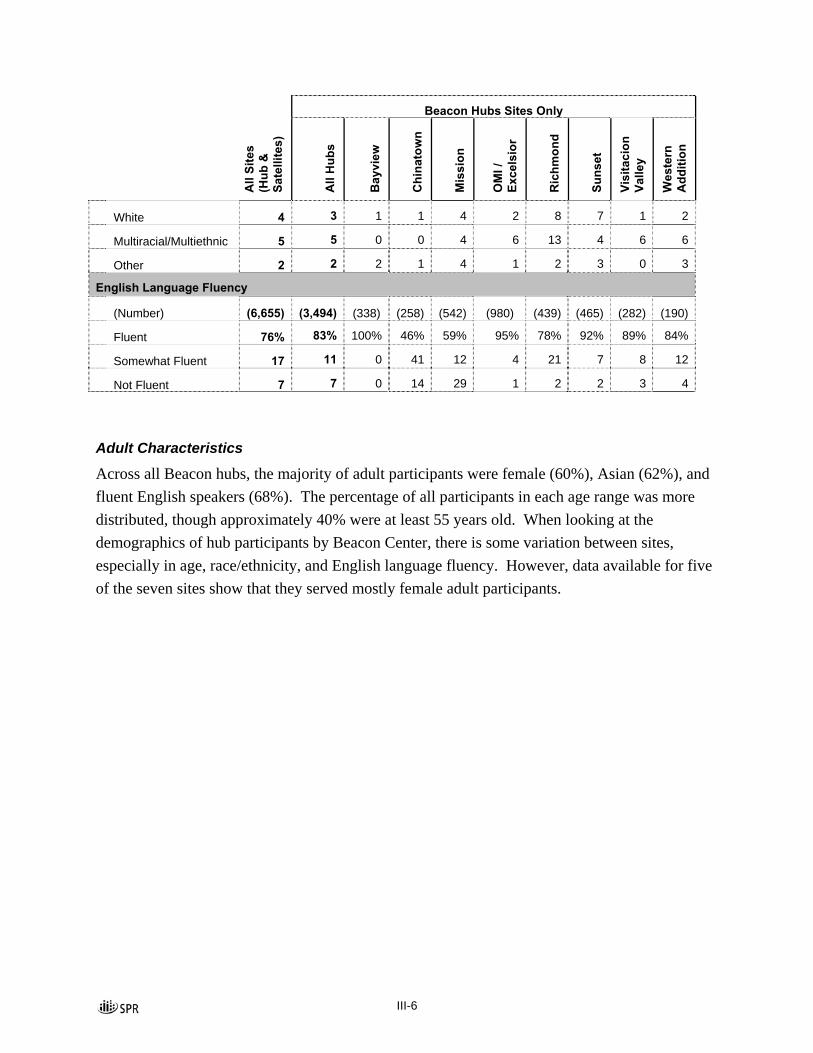
Adult Characteristics
Across all Beacon hubs, the majority of adult participants were female (60%), Asian (62%), and fluent English speakers (68%). The percentage of all participants in each age range was more distributed, though approximately 40% were at least 55 years old. When looking at the demographics of hub participants by Beacon Center, there is some variation between sites, especially in age, race/ethnicity, and English language fluency. However, data available for five of the seven sites show that they served mostly female adult participants.

III-7
Exhibit III-2: Adult Demographics for Summer 2007 and School Year 2007-20089
Hub Sites Only
All
Site
s (H
ub &
Sa
telli
te)
All
Hub
s
Bay
view
Mis
sion
OM
I /
Exce
lsio
r
Ric
hmon
d
Suns
et
Visi
taci
on
Valle
y
Wes
tern
A
dditi
on
Age10
(Number)11 (771) (756) (1) (25) (74) (214) (192) (238) (12)12 Under 25 10% 10% 100% 4% 7% 2% 9% 19% 0%
25 to 34 15 15 0 44 32 2 14 17 50
35 to 44 17 17 0 16 26 7 25 15 50
45 to 54 19 19 0 20 15 22 20 16 0
55 to 64 19 20 0 12 16 34 12 16 0
65 and Older 21 20 0 4 4 34 20 16 0 Gender
(Number) (851) (836) (1) (37) (99) (216) (216) (248) (19)
Male 40% 40% 100% 68% 40% 40% 25% 49% 21%
Female 61 60 0 32 60 60 75 51 79 Race/Ethnicity
(Number) (827) (815) (1) (34) (100) (202) (215) (246) (17)
African American/Black 13% 13% 0% 9% 9% 3% 34% 12% 13%
Asian 62 62 0 12 35 90 74 51 6
Hispanic/Latino 9 9 0 27 32 3 2 2 77
Pacific Islander 3 3 100 0 0 0 1 10 0
White 9 9 0 44 17 5 12 2 0
Multiracial/Multiethnic 4 4 0 9 7 1 7 1 6
Other 1 1 0 0 0 2 2 0 0
9 Percents for a site in a demographic category may not total 100% due to rounding. Chinatown had no adult
participants for Summer 2007 or School Year 2007-2008 and was left off this chart.
10 Age is calculated for the last day of the 2007-2008 School Year.
11 Number of participants at a given location varies across demographic characteristics because there is missing data for some participants’ demographics.
12 Based on knowledge of this site’s activities, this number should be higher. However, this was the information entered in the CMS.
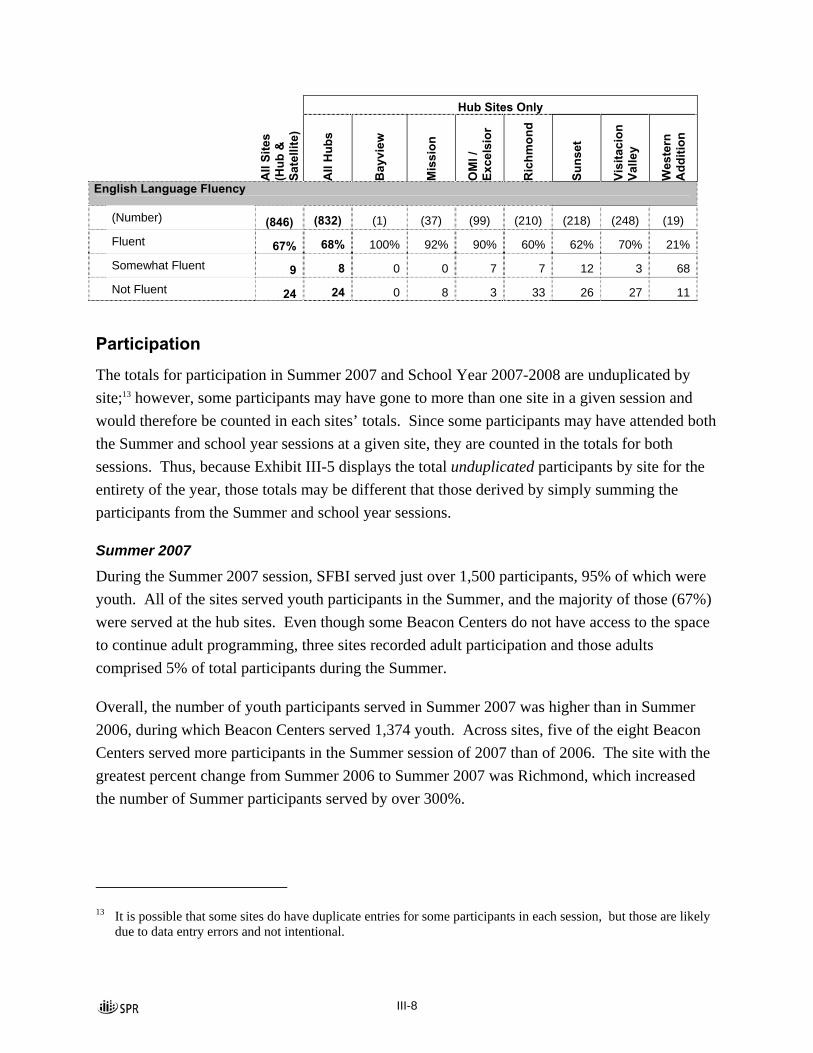
III-8
Hub Sites Only
All
Site
s (H
ub &
Sa
telli
te)
All
Hub
s
Bay
view
Mis
sion
OM
I /
Exce
lsio
r
Ric
hmon
d
Suns
et
Visi
taci
on
Valle
y
Wes
tern
A
dditi
on
English Language Fluency
(Number) (846) (832) (1) (37) (99) (210) (218) (248) (19)
Fluent 67% 68% 100% 92% 90% 60% 62% 70% 21%
Somewhat Fluent 9 8 0 0 7 7 12 3 68
Not Fluent 24 24 0 8 3 33 26 27 11
Participation
The totals for participation in Summer 2007 and School Year 2007-2008 are unduplicated by site;13 however, some participants may have gone to more than one site in a given session and would therefore be counted in each sites’ totals. Since some participants may have attended both the Summer and school year sessions at a given site, they are counted in the totals for both sessions. Thus, because Exhibit III-5 displays the total unduplicated participants by site for the entirety of the year, those totals may be different that those derived by simply summing the participants from the Summer and school year sessions.
Summer 2007
During the Summer 2007 session, SFBI served just over 1,500 participants, 95% of which were youth. All of the sites served youth participants in the Summer, and the majority of those (67%) were served at the hub sites. Even though some Beacon Centers do not have access to the space to continue adult programming, three sites recorded adult participation and those adults comprised 5% of total participants during the Summer.
Overall, the number of youth participants served in Summer 2007 was higher than in Summer 2006, during which Beacon Centers served 1,374 youth. Across sites, five of the eight Beacon Centers served more participants in the Summer session of 2007 than of 2006. The site with the greatest percent change from Summer 2006 to Summer 2007 was Richmond, which increased the number of Summer participants served by over 300%.
13 It is possible that some sites do have duplicate entries for some participants in each session, but those are likely
due to data entry errors and not intentional.

III-9
Exhibit III-3: Summer 2007 Participation
Youth Adults Total
Hub
Sate
llite
Unk
now
n14
Tota
l
Hub
Sate
llite
Unk
now
n
Tota
l
Hub
Sate
llite
Unk
now
n
Tota
l
All Sites 960 358 109 1,427 65 0 13 78 1,025 358 122 1,505
Bayview 298 90 0 338 0 0 0 0 298 90 0 338
Chinatown 107 37 97 241 0 0 0 0 107 37 97 241
Mission 127 5 0 132 0 0 0 0 127 5 0 132
OMI / Excelsior 189 33 3 225 0 0 0 0 189 33 3 225
Richmond 29 83 1 113 11 0 13 24 40 83 14 137
Sunset 100 110 2 212 34 0 0 34 134 110 2 246
Visitacion Valley 45 0 1 46 20 0 0 20 65 0 1 66
Western Addition 65 0 5 70 0 0 0 0 65 0 5 70
School Year 2007-2008
Over 6,700 participants were served across all Beacon sites during the 2007-2008 school year, and approximately 55% of them were hub attendees. Additionally, the vast majority of participants were youth (88%), however, less than half (48%) of youth who participated during the school year attended Beacon hub locations.15 In contrast, nearly 100% of adult participants served during the school year attended Beacon hubs. The percent of participants served at the hub locations during the school year varies considerably depending on the Beacon site.
During the 2006-2007 school year Beacon Centers served 4,836 youth and 970 adults. In comparison, the number of youth participants served across Beacon Centers during the 2007-2008 school year was higher (22% increase), while the number of adult participants was lower (16% decrease). Overall, the number of participants served at Beacon Centers during the 2007-2008 school year represents an increase of about 16% over school year 2006-2007. In addition, six of the eight Centers increased their numbers of total school year participants. Western Addition saw the greatest percent increase in school year participants by boosting their numbers by 82%.
14 Participants in the “unknown” category could not be placed at either a hub or satellite location due to missing
data.
15 During the 2007-2008 school year session, Bayview was without a hub location on a consistent basis.
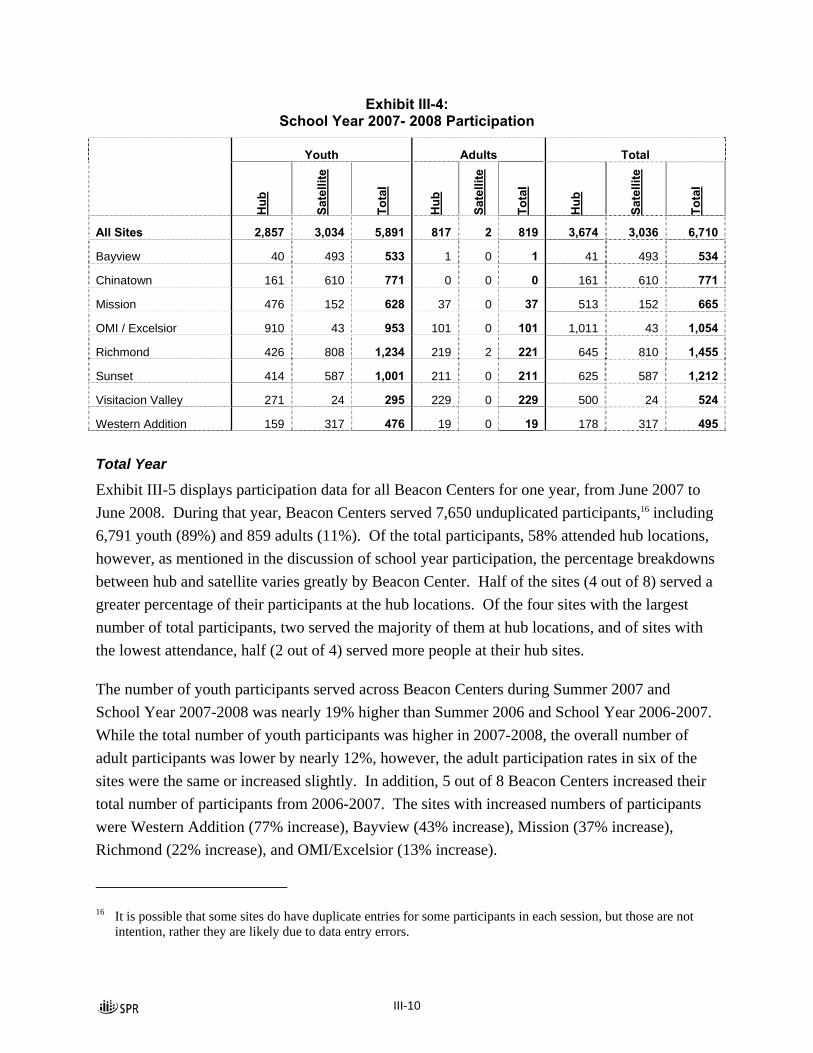
III-10
Exhibit III-4: School Year 2007- 2008 Participation
Youth Adults Total
Hub
Sate
llite
Tota
l
Hub
Sate
llite
Tota
l
Hub
Sate
llite
Tota
l
All Sites 2,857 3,034 5,891 817 2 819 3,674 3,036 6,710
Bayview 40 493 533 1 0 1 41 493 534
Chinatown 161 610 771 0 0 0 161 610 771
Mission 476 152 628 37 0 37 513 152 665
OMI / Excelsior 910 43 953 101 0 101 1,011 43 1,054
Richmond 426 808 1,234 219 2 221 645 810 1,455
Sunset 414 587 1,001 211 0 211 625 587 1,212
Visitacion Valley 271 24 295 229 0 229 500 24 524
Western Addition 159 317 476 19 0 19 178 317 495
Total Year
Exhibit III-5 displays participation data for all Beacon Centers for one year, from June 2007 to June 2008. During that year, Beacon Centers served 7,650 unduplicated participants,16 including 6,791 youth (89%) and 859 adults (11%). Of the total participants, 58% attended hub locations, however, as mentioned in the discussion of school year participation, the percentage breakdowns between hub and satellite varies greatly by Beacon Center. Half of the sites (4 out of 8) served a greater percentage of their participants at the hub locations. Of the four sites with the largest number of total participants, two served the majority of them at hub locations, and of sites with the lowest attendance, half (2 out of 4) served more people at their hub sites.
The number of youth participants served across Beacon Centers during Summer 2007 and School Year 2007-2008 was nearly 19% higher than Summer 2006 and School Year 2006-2007. While the total number of youth participants was higher in 2007-2008, the overall number of adult participants was lower by nearly 12%, however, the adult participation rates in six of the sites were the same or increased slightly. In addition, 5 out of 8 Beacon Centers increased their total number of participants from 2006-2007. The sites with increased numbers of participants were Western Addition (77% increase), Bayview (43% increase), Mission (37% increase), Richmond (22% increase), and OMI/Excelsior (13% increase).
16 It is possible that some sites do have duplicate entries for some participants in each session, but those are not
intention, rather they are likely due to data entry errors.

III-11
Exhibit III-5: Total Participation
Youth Adults Total
Hub
Sate
llite
Unk
now
n
Tota
l
Hub
Sate
llite
Unk
now
n
Tota
l
Hub
Sate
llite
Unk
now
n
Tota
l
% S
erve
d at
Hub
All Sites 3,597 3,085 109 6,791 844 2 13 859 4,441 3,087 122 7,650 58%
Bayview 338 493 0 831 1 0 0 1 339 493 0 832 41%
Chinatown 259 618 97 974 0 0 0 0 259 618 97 974 27%
Mission 564 155 0 719 37 0 0 37 601 155 0 756 79%
OMI / Excelsior 1,054 57 3 1,114 101 0 0 101 1,155 57 3 1,215 95%
Richmond 439 821 1 1,261 219 2 13 234 658 823 14 1,495 44%
Sunset 465 600 2 1,067 219 0 0 219 684 600 2 1,286 53%
Visitacion Valley 282 24 1 307 248 0 0 248 530 24 1 555 95%
Western Addition 196 317 5 518 19 0 0 19 215 317 5 537 40%
Exhibit III-6 indicates if the Beacon Centers met the SFBI Quality Standards on participation. The SFBI Quality Standards state that each Beacon Center should serve at least 600 unduplicated participants per year. The data indicate that six of the eight Beacon sites served 600 or more participants from June 2007 to June 2008, an increase from five of eight sites in 2006-2007. In addition, during 2007-2008, three Centers served double the required number of participants. However, both of the two sites that served less than the required number of participants still had well over 500 participants. When looking at hub sites only, half of the Beacon Centers served at least 600 participants at their hubs.
The Quality Standards also indicate that the majority of Beacon Center participants (70%) should be young people (under age 22). All but one of the Beacon Centers met this standard for the total of their hub and satellite sites, and five met this standard at the hub sites alone. While the majority of participants should be youth, Beacon Centers are also expected to serve adults. At half of the eight sites, 5% or less of the total participants are adults, including two sites that serve 100% youth participants.
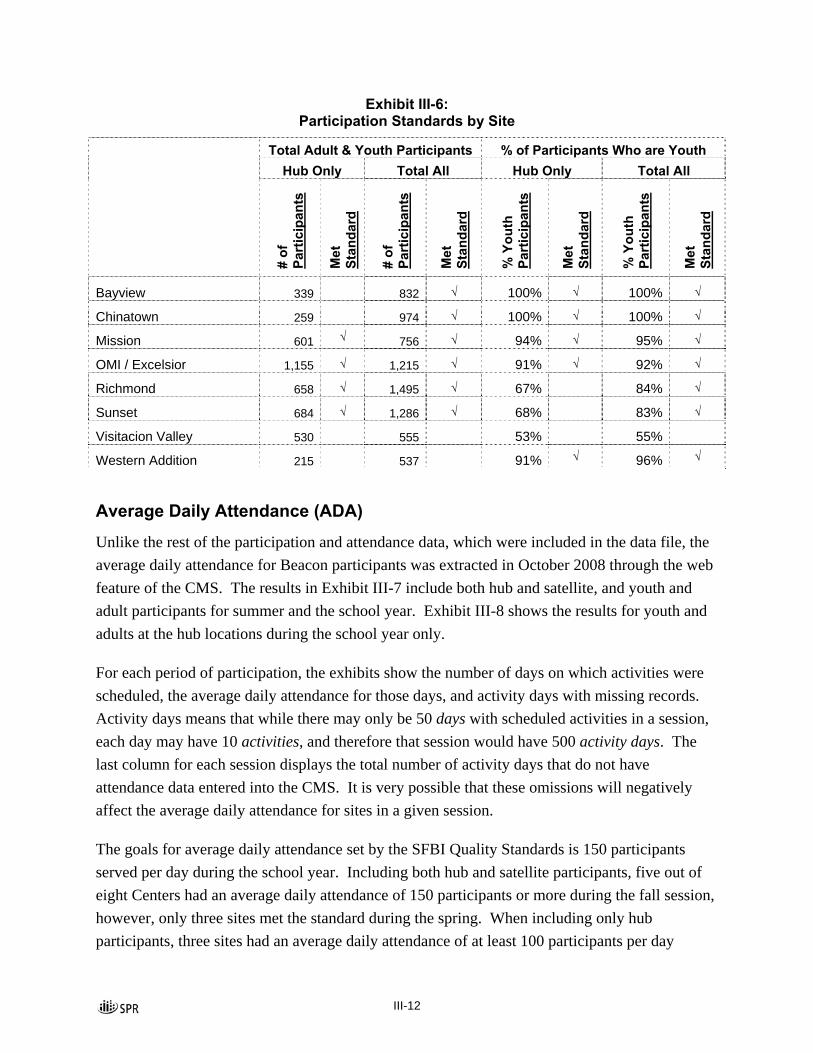
III-12
Exhibit III-6: Participation Standards by Site
Total Adult & Youth Participants % of Participants Who are Youth Hub Only Total All Hub Only Total All
# of
Pa
rtic
ipan
ts
Met
St
anda
rd
# of
Pa
rtic
ipan
ts
Met
St
anda
rd
% Y
outh
Pa
rtic
ipan
ts
Met
St
anda
rd
% Y
outh
Pa
rtic
ipan
ts
Met
St
anda
rd
Bayview 339 832 √ 100% √ 100% √ Chinatown 259 974 √ 100% √ 100% √ Mission 601 √ 756 √ 94% √ 95% √ OMI / Excelsior 1,155 √ 1,215 √ 91% √ 92% √ Richmond 658 √ 1,495 √ 67% 84% √ Sunset 684 √ 1,286 √ 68% 83% √ Visitacion Valley 530 555 53% 55%
Western Addition 215 537 91% √ 96% √
Average Daily Attendance (ADA)
Unlike the rest of the participation and attendance data, which were included in the data file, the average daily attendance for Beacon participants was extracted in October 2008 through the web feature of the CMS. The results in Exhibit III-7 include both hub and satellite, and youth and adult participants for summer and the school year. Exhibit III-8 shows the results for youth and adults at the hub locations during the school year only.
For each period of participation, the exhibits show the number of days on which activities were scheduled, the average daily attendance for those days, and activity days with missing records. Activity days means that while there may only be 50 days with scheduled activities in a session, each day may have 10 activities, and therefore that session would have 500 activity days. The last column for each session displays the total number of activity days that do not have attendance data entered into the CMS. It is very possible that these omissions will negatively affect the average daily attendance for sites in a given session.
The goals for average daily attendance set by the SFBI Quality Standards is 150 participants served per day during the school year. Including both hub and satellite participants, five out of eight Centers had an average daily attendance of 150 participants or more during the fall session, however, only three sites met the standard during the spring. When including only hub participants, three sites had an average daily attendance of at least 100 participants per day
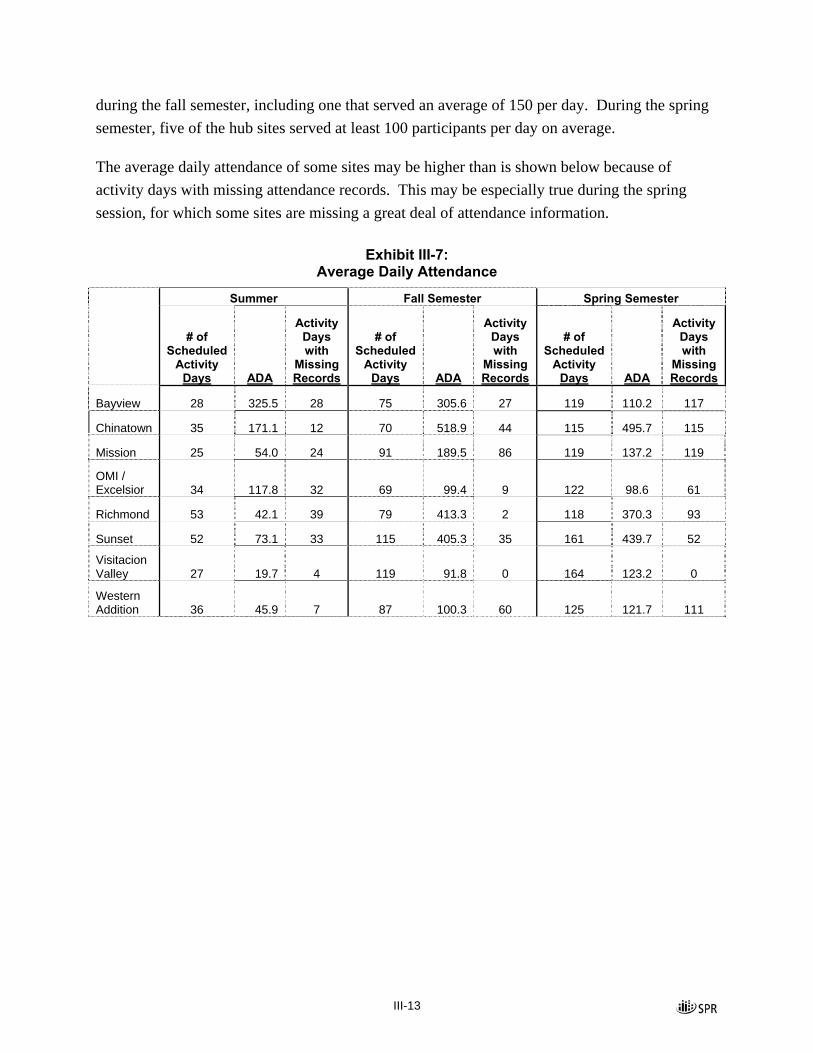
III-13
during the fall semester, including one that served an average of 150 per day. During the spring semester, five of the hub sites served at least 100 participants per day on average.
The average daily attendance of some sites may be higher than is shown below because of activity days with missing attendance records. This may be especially true during the spring session, for which some sites are missing a great deal of attendance information.
Exhibit III-7: Average Daily Attendance
Summer Fall Semester Spring Semester
# of Scheduled
Activity Days ADA
Activity Days with
Missing Records
# of Scheduled
Activity Days ADA
Activity Days with
Missing Records
# of Scheduled
Activity Days ADA
Activity Days with
Missing Records
Bayview 28 325.5 28 75 305.6 27 119 110.2 117
Chinatown 35 171.1 12 70 518.9 44 115 495.7 115
Mission 25 54.0 24 91 189.5 86 119 137.2 119
OMI / Excelsior 34 117.8 32 69 99.4 9 122 98.6 61
Richmond 53 42.1 39 79 413.3 2 118 370.3 93
Sunset 52 73.1 33 115 405.3 35 161 439.7 52
Visitacion Valley 27 19.7 4 119 91.8 0 164 123.2 0
Western Addition 36 45.9 7 87 100.3 60 125 121.7 111

III-14
Exhibit III-8: Hub Average Daily Attendance - School Year Only
Fall Semester Spring Semester
# of Scheduled
Activity Days ADA
Activity Days with Missing Records
# of Scheduled
Activity Days ADA
Activity Days with Missing Records
Bayview17 - - - 97 40.8 1
Chinatown 70 105.1 28 108 98.4 104
Mission 91 91.9 86 119 122.8 119
OMI / Excelsior18 69 99.4 9 122 98.6 61
Richmond 73 82.0 1 118 113.3 69
Sunset 98 150.0 15 136 146.6 26
Visitacion Valley 119 91.8 0 164 123.2 0
Western Addition19 87 100.3 60 125 121.7 111
Hub Youth Attendance Average Attendance
The average number of days attended, the average number of weeks attended, and the average number of days attended per week of attendance was calculated and is displayed in Exhibit III-9.20 For the 960 youth that participated at Beacon hubs during the Summer of 2007, the average attendance was about 20 days during that session. In addition, on the weeks that youth participants attended, they went an average of 3.47 days. During the school year session, the 2,857 youth participants at Beacon hubs averaged about 50 days of attendance, and 2.27 days of attendance per week attended. Since the Summer session is shorter than that of the school year, it is not surprising that the average number of days of attendance is greater during the latter session, however, attendance data indicate that participation is more concentrated during the Summer, with youth averaging a greater number of days attended per week.
17 For Hub ADA, Bayview was not considered to have a hub site during the fall semester. In the spring semester,
Thurgood Marshall HS was the temporary hub.
18 For Hub ADA only, all OMI/Excelsior activities were considered to be hub activities.
19 For Hub ADA only, all Western Addition activities were considered to be hub activities.
20 The number of days attended per week of attendance is calculated by dividing the number of days participants attended during a given session by the number of weeks during that same session in which they attended at least one day.

III-15
However, attendance between Beacon hubs varies quite a bit. For example, during the school year, the largest average number of days attended is five times greater than the smallest average number of days attended. In addition, while most sites have a greater average number of days attended per week of attendance during the Summer than in the school year, a couple of sites have greater averages during the school year session.
Exhibit III-9: Hub Youth Participation – Attendance Breakdown
Activity Attendance
As shown in Exhibit III-10, the average number of hours that hub youth participants spent in group activities was 88 hours during Summer 2007 and 122 hours during the School Year. In total, Beacon hub youth spent over 84,000 hours in group activities in the Summer and over 349,000 hours in them during the school year. Hub youth participants spent, on average, about 4 hours a day in group activities during the Summer, and an average of about 2 hours per day in group activities during the school year.21
These results seems logical given that the Summer session consists of fewer days than the school year, but may offer more hours of programming per day since the youth do not have to attend
Number of Participants
Average # of Days Attended
Average # of Weeks Attended
Average # of Days Attended per Week
of Attendance
Summer
School Year Summer
School Year Summer
School Year Summer
School Year
All Sites 960 2,857 19.5 48.7 5.3 16.5 3.47 2.27
Bayview 298 40 23.2 77.5 6.5 17.4 3.56 4.39
Chinatown 107 161 25.7 108.5 5.8 26.6 4.38 3.61
Mission 127 476 10.3 45.7 3.8 15.7 2.47 2.33
OMI / Excelsior 189 910 20.8 19.4 5.3 10.7 3.84 1.40
Richmond 29 426 14.5 31.6 5.1 13.7 2.84 1.85
Sunset 100 414 14.8 75.0 4.5 22.8 3.23 2.88
Visitacion Valley 45 271 10.0 73.0 3.3 21.4 2.74 2.92
Western Addition 65 159 22.9 92.6 5.5 24.5 3.75 3.56

III-16
school at the same time. However, two hub sites averaged more hours in group activities during the school year than during the Summer session. In addition, two of the eight sites had youth spend a greater average number of hours per day in Beacon during the school year than during the Summer.
Few sites reported hub youth spending time in individual activities, the exception is Richmond, which reported 38 hours in individual activities during the school year.
Exhibit III-10: Hub Youth Participation – Activity Hours
Number of Participants
Average # of Hours in Group Activities
Average # of Hours in Group Activities
per Day Total Hours in Group
Activities
Summer
School Year Summer
School Year Summer
School Year Summer
School Year
All Sites 960 2,857 88.0 122.3 4.1 2.2 84,447 349,344
Bayview 298 40 55.4 408.2 2.3 5.0 16,500 16,328
Chinatown 107 161 275.8 323.6 10.3 2.8 29,510 52,098
Mission 127 476 30.4 149.4 2.7 3.0 3,867 71,162 OMI / Excelsior 189 910 83.1 28.1 3.9 1.4 15,706 25,524
Richmond 29 426 107.3 102.4 5.5 2.6 3,113 43,619
Sunset 100 414 72.9 146.0 4.5 1.9 7,290 60,440
Visitacion Valley 45 271 45.6 167.1 4.1 1.9 2,050 45,272
Western Addition 65 159 98.7 219.7 4.0 2.6 6,413 34,938
Attendance by Grade Level
Statistical tests were run on the means of selected attendance categories22 for each grade level23 to assess the effect of grade level on attendance for youth at hub sites during the Summer 2007 and
21 The average number of hours spent in group activities per day is calculated by dividing the total number of hours
participants spend in group activities per session by the number of days they attended in that session.
22 Attendance categories tested were the number of days attended, average number of days attended per week of attendance, hours in group activities, and hours in group activities per day.
23 Grade levels include elementary, middle, and high school.

III-17
School Year 2007-2008.24 During Summer 2007, elementary participants at Beacon had significantly higher average number of days and of days attended per week than both middle and high school participants. These results indicate that elementary youth attended Beacon hubs more frequently in the Summer than both middle and high school participants.
While there were no significant differences in the average number of days attended between middle and high school participants, middle school youth attended a significantly higher average number of days per week of attendance. This suggests that during Summer 2007 middle school youths’ participation tended to be more concentrated in the weeks they attended than those youth in high school, whose days of participation was more spread out over the weeks they attended. There were no significant differences for grade level on the average number of hours spent in group activities or mean number of group activities per day during the Summer session.
The results of tests for differences in means of attendance by grade level for School Year 2007-2008 show that elementary participants at Beacon had significantly higher average number of days of attendance and days attended per week of attendance during the school year than both middle and high school youth. They also spent a significantly higher average number of total hours in group activities than both middle and high school participants. These results indicate elementary youth attended Beacon hubs more frequently and spent more total hours in group activities than middle and high school youth.
Middle school youth spent a significantly lower average number of hours per day in group activities than elementary and high school youth. However, when comparing the rest of the attendance categories between middle and high school participants, middle school youth had significantly higher average attendance for days attended, number of days attended per week, and total hours in group activities during the school year. This indicates that while middle school youth attended Beacon Centers more frequently than high school youth during the school year, on the days that high school youth did attend, they spent more time at the Beacon Center each day they came than those youth in middle school.
Service Categories
All Beacon activities are coded according to service categories that summarize the kinds of instruction or assistance participants receive during their participation. Some activities are given multiple service codes, and because we are unable to proportionally allocate hours for a given 24 An analysis of variance showed that the effect of grade level was significant during the Summer 2007 and
School Year 2007-2008 for the number of days attended and the average number of days per weeks attended.
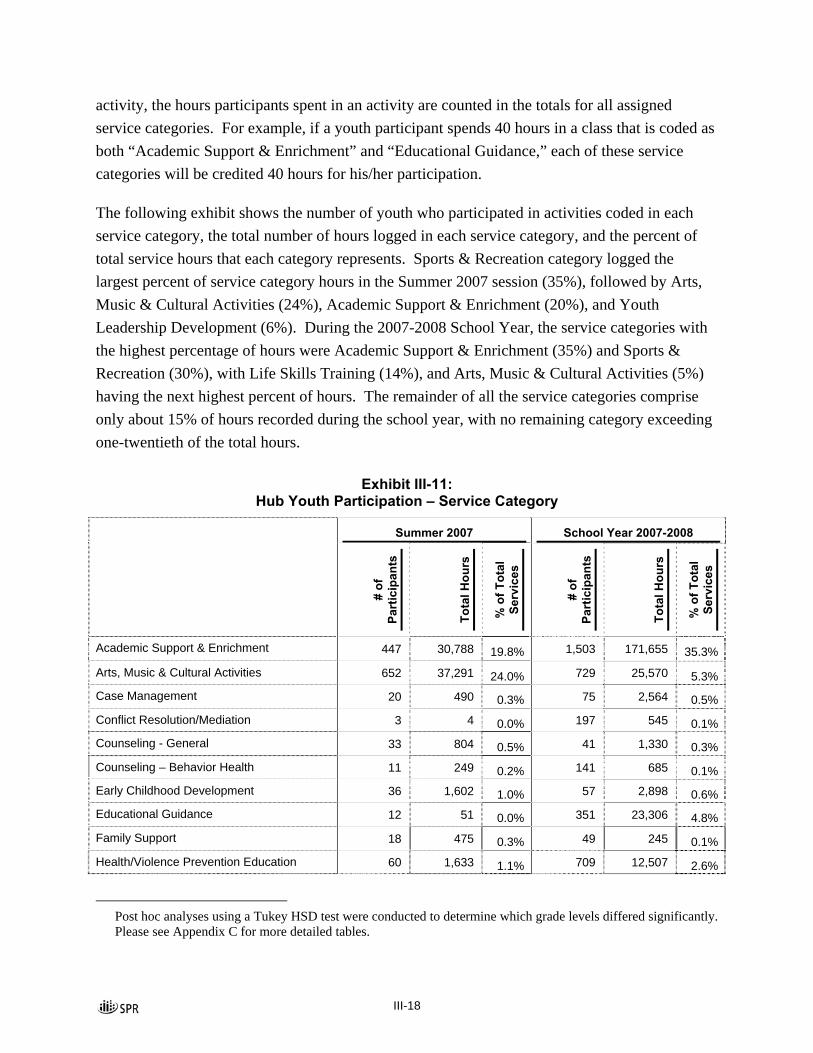
III-18
activity, the hours participants spent in an activity are counted in the totals for all assigned service categories. For example, if a youth participant spends 40 hours in a class that is coded as both “Academic Support & Enrichment” and “Educational Guidance,” each of these service categories will be credited 40 hours for his/her participation.
The following exhibit shows the number of youth who participated in activities coded in each service category, the total number of hours logged in each service category, and the percent of total service hours that each category represents. Sports & Recreation category logged the largest percent of service category hours in the Summer 2007 session (35%), followed by Arts, Music & Cultural Activities (24%), Academic Support & Enrichment (20%), and Youth Leadership Development (6%). During the 2007-2008 School Year, the service categories with the highest percentage of hours were Academic Support & Enrichment (35%) and Sports & Recreation (30%), with Life Skills Training (14%), and Arts, Music & Cultural Activities (5%) having the next highest percent of hours. The remainder of all the service categories comprise only about 15% of hours recorded during the school year, with no remaining category exceeding one-twentieth of the total hours.
Exhibit III-11: Hub Youth Participation – Service Category
Summer 2007 School Year 2007-2008
# of
Pa
rtic
ipan
ts
Tota
l Hou
rs
% o
f Tot
al
Serv
ices
# of
Pa
rtic
ipan
ts
Tota
l Hou
rs
% o
f Tot
al
Serv
ices
Academic Support & Enrichment 447 30,788 19.8% 1,503 171,655 35.3%
Arts, Music & Cultural Activities 652 37,291 24.0% 729 25,570 5.3% Case Management 20 490 0.3% 75 2,564 0.5%
Conflict Resolution/Mediation 3 4 0.0% 197 545 0.1% Counseling - General 33 804 0.5% 41 1,330 0.3%
Counseling – Behavior Health 11 249 0.2% 141 685 0.1% Early Childhood Development 36 1,602 1.0% 57 2,898 0.6% Educational Guidance 12 51 0.0% 351 23,306 4.8%
Family Support 18 475 0.3% 49 245 0.1%
Health/Violence Prevention Education 60 1,633 1.1% 709 12,507 2.6%
Post hoc analyses using a Tukey HSD test were conducted to determine which grade levels differed significantly. Please see Appendix C for more detailed tables.
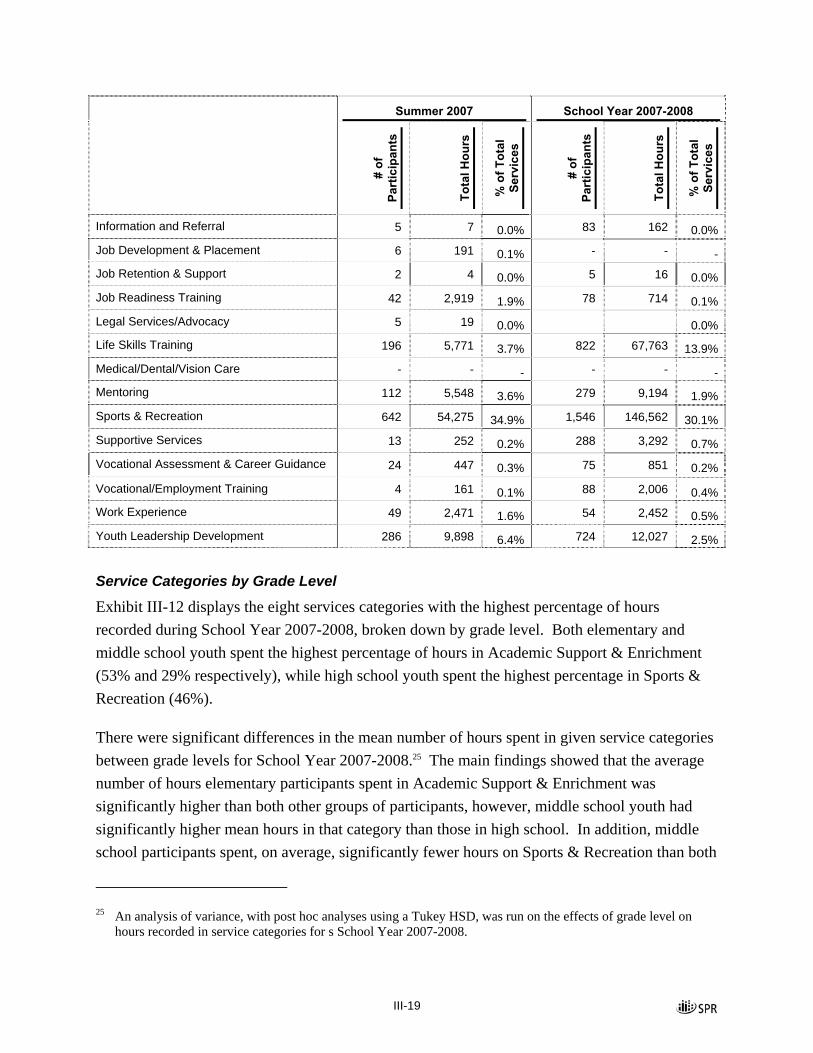
III-19
Summer 2007 School Year 2007-2008
# of
Pa
rtic
ipan
ts
Tota
l Hou
rs
% o
f Tot
al
Serv
ices
# of
Pa
rtic
ipan
ts
Tota
l Hou
rs
% o
f Tot
al
Serv
ices
Information and Referral 5 7 0.0% 83 162 0.0%
Job Development & Placement 6 191 0.1% - - - Job Retention & Support 2 4 0.0% 5 16 0.0%
Job Readiness Training 42 2,919 1.9% 78 714 0.1%
Legal Services/Advocacy 5 19 0.0% 0.0% Life Skills Training 196 5,771 3.7% 822 67,763 13.9%
Medical/Dental/Vision Care - - - - - - Mentoring 112 5,548 3.6% 279 9,194 1.9%
Sports & Recreation 642 54,275 34.9% 1,546 146,562 30.1%
Supportive Services 13 252 0.2% 288 3,292 0.7%
Vocational Assessment & Career Guidance 24 447 0.3% 75 851 0.2%
Vocational/Employment Training 4 161 0.1% 88 2,006 0.4% Work Experience 49 2,471 1.6% 54 2,452 0.5%
Youth Leadership Development 286 9,898 6.4% 724 12,027 2.5%
Service Categories by Grade Level
Exhibit III-12 displays the eight services categories with the highest percentage of hours recorded during School Year 2007-2008, broken down by grade level. Both elementary and middle school youth spent the highest percentage of hours in Academic Support & Enrichment (53% and 29% respectively), while high school youth spent the highest percentage in Sports & Recreation (46%).
There were significant differences in the mean number of hours spent in given service categories between grade levels for School Year 2007-2008.25 The main findings showed that the average number of hours elementary participants spent in Academic Support & Enrichment was significantly higher than both other groups of participants, however, middle school youth had significantly higher mean hours in that category than those in high school. In addition, middle school participants spent, on average, significantly fewer hours on Sports & Recreation than both
25 An analysis of variance, with post hoc analyses using a Tukey HSD, was run on the effects of grade level on
hours recorded in service categories for s School Year 2007-2008.

III-20
elementary and high school participants. Although high school participants spent a larger percent of their service category hours in Sports & Recreation, elementary youth, on average, spent a significantly higher mean number of hours in that category than high school youth.
Exhibit III-12: Hub Youth Participation – Top Service Categories for School Year 2007-2008
% of Total Services
Service Category
Total
Elementary Middle High
School
Academic Support & Enrichment 35.3% 52.8% 29.2% 20.5%
Sports & Recreation 30.1 38.1 21.3 46.3
Life Skills Training 13.9 0.8 25.2 2.7
Arts, Music & Cultural Activities 5.3 0.9 4.5 16.2
Educational Guidance 4.8 0.6 8.6 0.8
Health/Violence Prevention Education 2.6 1.9 1.9 6.2
Youth Leadership Development 2.5 1.3 2.5 4.7
Mentoring 1.9 0.0 3.5 0.3
Adult Attendance at Hub Sites Average Attendance
For adults that attended Beacon hub locations, the average number of days attended, the average number of weeks attended, and the average number of days attended per week of attendance was calculated and is displayed in Exhibit III-13.26 A greater number of adults attended Beacon hub sites during School Year 2007-2008 than did in Summer 2007, however this difference may be due to Beacons’ having limited facilities available to serve adults in the summer. During the school year, adult participants attended Beacon hubs on an average of 19 days per session, while during the Summer they only attended an average of 2 days. In addition, on weeks when adults participated, they attended an average of 1.42 days per week during the school year, but only 1.07 days per week during the Summer.
26 The number of days attended per week of attendance is calculated by dividing the number of days participants
attended during a given session by the number of weeks during that same session in which they attended at least one day.
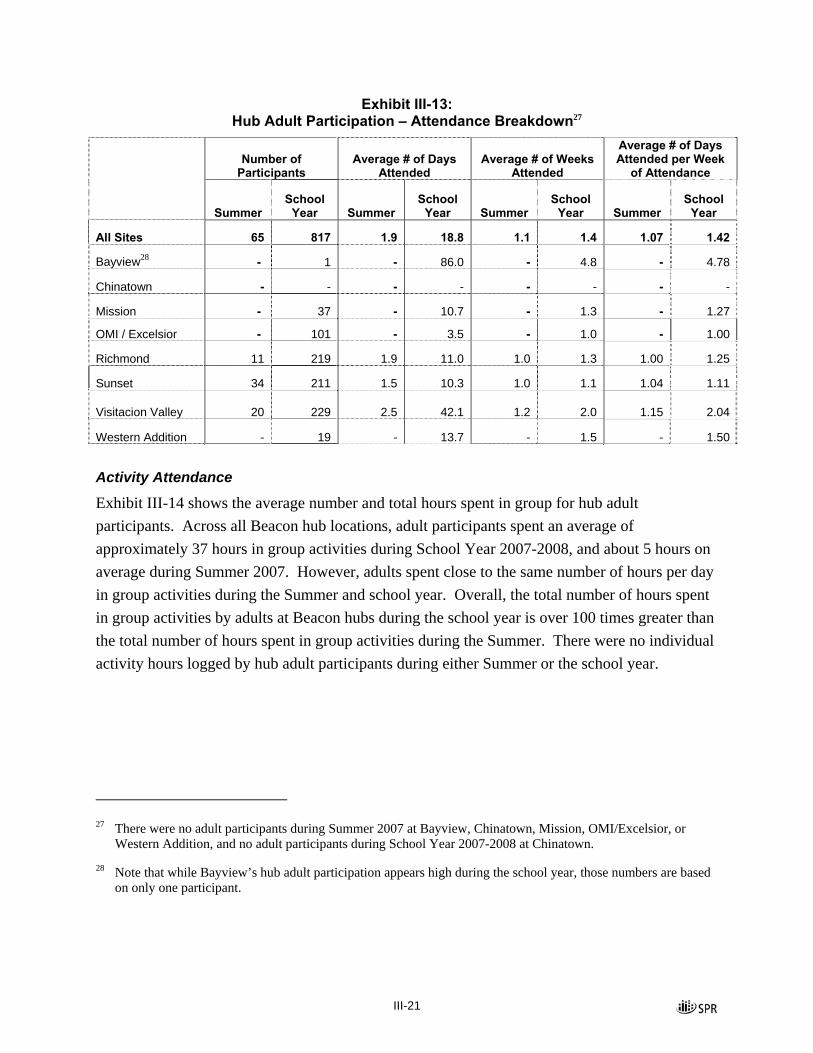
III-21
Exhibit III-13: Hub Adult Participation – Attendance Breakdown27
Number of Participants
Average # of Days Attended
Average # of Weeks Attended
Average # of Days Attended per Week
of Attendance
Summer
School Year Summer
School Year Summer
School Year Summer
School Year
All Sites 65 817 1.9 18.8 1.1 1.4 1.07 1.42
Bayview28 - 1 - 86.0 - 4.8 - 4.78
Chinatown - - - - - - - -
Mission - 37 - 10.7 - 1.3 - 1.27
OMI / Excelsior - 101 - 3.5 - 1.0 - 1.00
Richmond 11 219 1.9 11.0 1.0 1.3 1.00 1.25
Sunset 34 211 1.5 10.3 1.0 1.1 1.04 1.11
Visitacion Valley 20 229 2.5 42.1 1.2 2.0 1.15 2.04
Western Addition - 19 - 13.7 - 1.5 - 1.50
Activity Attendance
Exhibit III-14 shows the average number and total hours spent in group for hub adult participants. Across all Beacon hub locations, adult participants spent an average of approximately 37 hours in group activities during School Year 2007-2008, and about 5 hours on average during Summer 2007. However, adults spent close to the same number of hours per day in group activities during the Summer and school year. Overall, the total number of hours spent in group activities by adults at Beacon hubs during the school year is over 100 times greater than the total number of hours spent in group activities during the Summer. There were no individual activity hours logged by hub adult participants during either Summer or the school year.
27 There were no adult participants during Summer 2007 at Bayview, Chinatown, Mission, OMI/Excelsior, or
Western Addition, and no adult participants during School Year 2007-2008 at Chinatown.
28 Note that while Bayview’s hub adult participation appears high during the school year, those numbers are based on only one participant.

III-22
Exhibit III-14: Hub Adult Participation – Activity Hours29
Number of Participants
Average # of Hours in Group Activities
Average # of Hours in Group Activities
per Day30 Total Hours in Group
Activities
Summer
School Year Summer
School Year Summer
School Year Summer
School Year
All Sites 65 817 4.7 36.9 2.5 2.1 307 30,111
Bayview31 - 1 - 668.0 - 7.8 - 668
Chinatown - - - - - - - -
Mission - 37 - 22.7 - 2.2 - 841
OMI / Excelsior - 101 - 7.3 - 3.7 - 737
Richmond 11 219 3.7 17.0 2.0 1.6 41 3,722
Sunset 34 211 4.9 21.5 3.0 2.0 166 4,529
Visitacion Valley 20 229 5.0 83.7 2.0 2.0 100 19,168
Western Addition - 19 - 23.5 - 1.4 - 447
Hub Survey Results The survey results presented in this section, as with most of the participation and attendance data above, consist only of the surveys completed by hub participants. This separation of hub and satellite participants allows for an analysis of core Beacon programming. However, the exclusion of satellite participants also significantly reduces the overall number of surveys available for analysis.32
29 There were no adult participants during Summer 2007 at Bayview, Chinatown, Mission, OMI/Excelsior, or
Western Addition, and no adult participants during School Year 2007-2008 at Chinatown.
30 The average number of hours spent in group activities per day is calculated by dividing the total number of hours participants spend in group activities per session by the number of days they attended in that session.
31 Note that while Bayview’s hub adult participation appears high during the school year, those numbers are based on only one participant.
32 Statistical testing of differences among sites is limited by the small numbers of respondents at some of the Beacon hub sites. Therefore, while there may appear to be differences in respondents’ responses among sites, these percentage differences may not be statistically significant and be due to chance.

III-23
In order to present the survey data in a clear and concise manner, we have displayed survey responses as dichotomous, though some questions were originally asked with more than two response categories. Where questions had more than two response categories, we re-coded them into two.33 Where the questions already had dichotomous response categories, we left them intact.34 Thus, the percentages displayed in the tables below represent the more affirmative response: “Yes,” “True,” “Most or all of the time” or “Pretty much or very much true.” Where questions do not follow this pattern, it is noted in the tables below.
Only two of the eight Beacon hub sites had elementary school respondents—Chinatown and Western Addition. There are seven Beacon hub sites with middle and/or high school respondents – Bayview,35 Mission, OMI / Excelsior, Richmond, Sunset, Visitacion Valley and Western Addition. Due to its very small number of middle or high school respondents, Western Addition was excluded from the analysis of individual sites for those respondents. However, Western Addition respondents are included in the “Overall” category for middle and high school respondents. When discussing the results of the surveys, this chapter focuses on the overall results for all Beacon hubs.
The YIA/YSS was designed to elicit information about Beacon participants that would be indicators of Beacon Quality Standards. Therefore, the survey data presented in this chapter is grouped according to two broad categories of Quality Standards- Early Outcome and Intermediate Outcomes Standards. Long-term Outcome Standards were not used because they indicate some kind of change in performance or attitude as a result of Beacon participation. This year, since we did not administer a pretest and posttest, change over the course of Beacon participation could not be addressed.
In addition, because the survey was not administered to a randomized sample of Beacon participants, the results cannot be generalized for all Beacon participants or for all participants at individual Beacon sites. Therefore, in discussing the results of the survey, we use the term 33 The majority of the questions on the Youth Elementary and Middle/High School Surveys had four response
categories. The four response categories used on the Elementary survey were: “None of the time,” “Some of the time,” “Most of the time,” and “All of the time.” While the Middle/High School survey also used those response categories on occasion, most of its questions used the response categories: “Not at all true,” “A little true,” “Pretty much true,” and “Very much true.” For instance, the Elementary survey (and some of the Middle/High School survey) questions’ response categories are now: “None or some of the time” and “Most or all of the time.” Other Middle/High School questions now have response categories “Not at all or a little true” and “Pretty much or Very much true.”
34 For example, “Yes/No” or “True/False.”

III-24
“respondents” because these findings apply only to those youth who responded to the survey and not to all youth participants.
Safety at Beacon
Since community violence is an issue in many neighborhoods surrounding Beacon Centers, it is important that staff members work to keep the Beacon Center a safe haven for youth. During our site visits, staff members, especially those at Beacon Centers in neighborhoods with more community violence, noted that ensuring onsite safety helps in recruitment and retention efforts because youth feel comfortable at the program and parents are reassured that their children are in a secure place after school.
In Exhibit III-15 and III-16, the majority of survey respondents stated that they feel safe at their Beacon Center, with 88% of elementary and 91% of middle/high school respondents stating they felt safe. Middle/high school youth were asked whether they feel safer in Beacon or in their neighborhood, and 86% of them stated they feel as safe or safer at the Beacon Center.
In protecting the physical and emotional safety of youth, it is helpful for staff to clearly delineate their expectations to youth, take action to enforce the rules, and treat youth with respect. Most elementary and middle/high school students reported that they usually know what is expected of them at Beacon (78%, each), and that most of the time the staff take action when someone is speaking badly about them (77% and 76%, respectively). The vast majority of younger and older respondents indicated that the staff members usually treat them with respect (91% and 81%, respectively). However, only 65% of elementary respondents stated that the staff members enforce the rules.
In addition, the staff can promote safety by encouraging youth to treat each other with respect and to resolve conflicts without resorting to violence. As for peer interactions at Beacon, only 61% of elementary respondents and 69% of middle/high school respondents reported that youth at Beacon usually treat each other with respect. However, the majority of respondents (82% of elementary and 73% of middle/high school) reported that most of the time they are able to work out disagreements without using violence.
Two of the Beacon Centers with middle/high school youth had over 85% of respondents give positive assessments (in four of seven measures) of safety at Beacon. In contrast, one of the Beacon Centers stood out because its middle/high school hub respondents consistently reported 35 For the survey analysis, Bayview participants were grouped as hub if they attended after school activities at one

III-25
low percentages of positive feelings (on all measures) of staff influence on emotional safety and on their assessment of youth interactions.36 Though no Beacon Centers had over 80% of its middle/high school respondents who stated that they could work out their problems without violence, the aforementioned site and one other had low percentage of positive answers.
Exhibit III-15: Youth Safety – Elementary School Respondents
Ove
rall
Chi
nato
wn
Wes
tern
A
dditi
on
(Number) (75) (53) (22)
General Safety at Beacon
Feel Safe at Beacon Center37 88% 82% 100%
Beacon Staff Influence on Emotional Safety
The staff treat me with respect 91 92 88
I know what is expected of me at Beacon 78 78 76
The staff stop someone who is talking bad about me 77 71 90
Staff enforce rules 65 59 80
Youth Interactions at Beacon
Youth treat each other with respect 61 67 45
Can work out problems or disagreements without violence38 82 87 70
of two sites – Marshall High School or Davis Middle School.
36 For these variables, we consider percentages below two-thirds to be low.
37 Survey response categories were condensed from “Very Safe,” “Safe,” “Unsafe,” and “Very Unsafe” into two categories - “Safe” and “Unsafe.” The percent displayed in the table represents the respondents who felt “Safe.”
38 This question was originally asked: “When you have problems with others, do you push, hit, or kick them?,” but is inversed here to be consistent with displaying positive results.
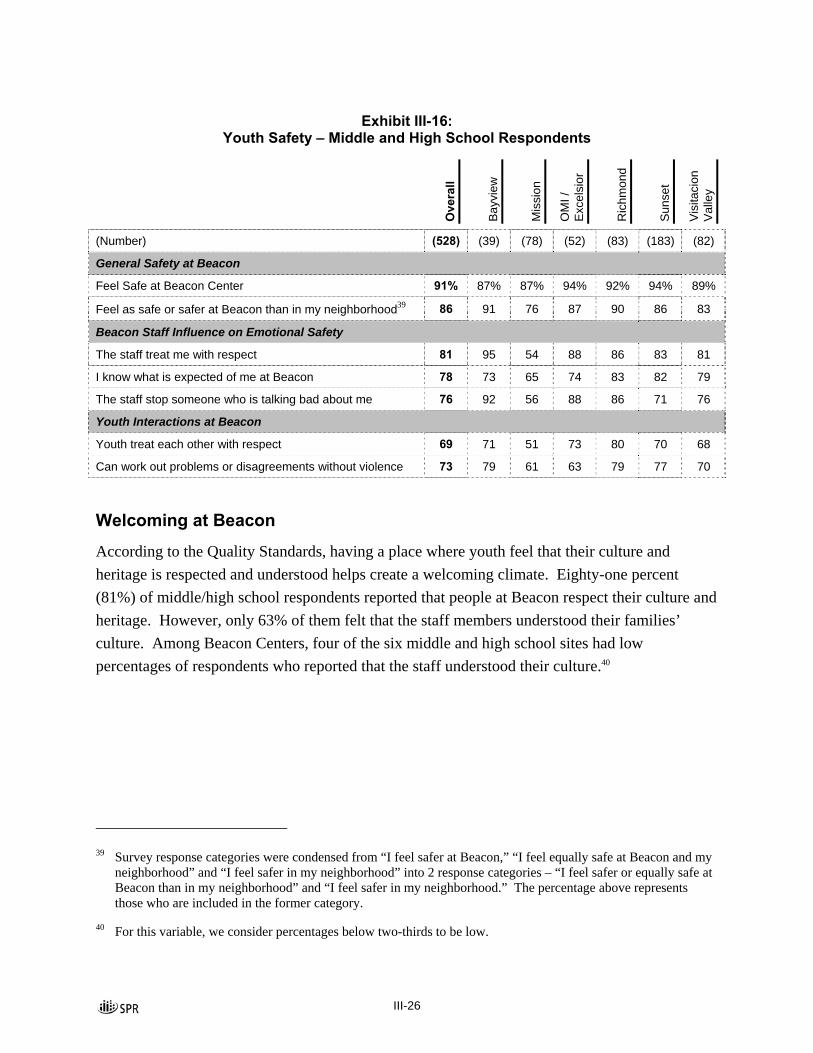
III-26
Exhibit III-16:
Youth Safety – Middle and High School Respondents
Ove
rall
Bay
view
Mis
sion
OM
I /
Exc
elsi
or
Ric
hmon
d
Sun
set
Vis
itaci
on
Val
ley
(Number) (528) (39) (78) (52) (83) (183) (82)
General Safety at Beacon
Feel Safe at Beacon Center 91% 87% 87% 94% 92% 94% 89%
Feel as safe or safer at Beacon than in my neighborhood39 86 91 76 87 90 86 83
Beacon Staff Influence on Emotional Safety
The staff treat me with respect 81 95 54 88 86 83 81
I know what is expected of me at Beacon 78 73 65 74 83 82 79
The staff stop someone who is talking bad about me 76 92 56 88 86 71 76
Youth Interactions at Beacon
Youth treat each other with respect 69 71 51 73 80 70 68
Can work out problems or disagreements without violence 73 79 61 63 79 77 70
Welcoming at Beacon
According to the Quality Standards, having a place where youth feel that their culture and heritage is respected and understood helps create a welcoming climate. Eighty-one percent (81%) of middle/high school respondents reported that people at Beacon respect their culture and heritage. However, only 63% of them felt that the staff members understood their families’ culture. Among Beacon Centers, four of the six middle and high school sites had low percentages of respondents who reported that the staff understood their culture.40
39 Survey response categories were condensed from “I feel safer at Beacon,” “I feel equally safe at Beacon and my
neighborhood” and “I feel safer in my neighborhood” into 2 response categories – “I feel safer or equally safe at Beacon than in my neighborhood” and “I feel safer in my neighborhood.” The percentage above represents those who are included in the former category.
40 For this variable, we consider percentages below two-thirds to be low.

III-27
Exhibit III-17: Welcoming – Middle and High School Respondents
Ove
rall
Bay
view
Mis
sion
OM
I /
Exc
elsi
or
Ric
hmon
d
Sun
set
Vis
itaci
on
Val
ley
(Number) (528) (39) (78) (52) (83) (183) (82)
Youth Feel Welcome at Beacon
Staff understand my family’s culture 63% 71% 60% 54% 66% 59% 73%
People respect my culture and heritage 81 97 79 75 85 80 73
Engagement & Collaboration
Part of successfully engaging youth is allowing them to feel they are active partners in Beacon programming, and having staff work collaboratively with them to address their needs and interests. When speaking with Beacon staff members, many noted that providing an outlet for youth feedback, and taking that feedback into consideration, encouraged youth participant retention.
A higher percentage of middle/high school respondents than elementary respondents stated they are involved in making decisions about activities at Beacon. This is not surprising given that they are likely to be allowed more freedom over their activities than younger participants. Still, only about half (51%) of middle/high school respondents reported helping decide class activities or rules, and 44% of elementary respondents reported usually getting to decide what kinds of activities they do at Beacon. In addition, fewer than half (49%) of middle/high school respondents stated they made suggestions on what programming to have at Beacon. On each measure of youth participation in decision-making, one Beacon Center had nearly two-third of its middle/high school respondents give a negative assessment. On the other hand, one site also had over 70% of its respondents answer affirmatively on all measures.
Exhibit III-18: Engagement and Collaboration – Elementary School Respondents
Ove
rall
Chi
nato
wn
Wes
tern
A
dditi
on
(Number) (75) (53) (22)
Youth Participate in Decision-Making
Choose what activities to do 44% 39% 58%

III-28
Exhibit III-19: Engagement and Collaboration – Middle and High School Respondents
Ove
rall
Bay
view
Mis
sion
OM
I /
Exc
elsi
or
Ric
hmon
d
Sun
set
Vis
itaci
on
Val
ley
(Number) (528) (39) (78) (52) (83) (183) (82)
Youth Participate in Decision-making
Help decide class activities or rules 51% 63% 55% 55% 36% 41% 72%
Made programming suggestions 49 79 62 62 45 32 60
Comprehensive Programming
The Quality Standards state that comprehensive programming should not only include activities that reflect the interests of Beacon youth, but also be culturally competent. Thus, programming should incorporate aspects of youth’s heritage and teach youth about the cultures and heritages of others. Most of the older youth respondents (76%) stated that they do interesting activities at Beacon.
However, the percentages of elementary and middle/high school students that report Beacon helps them learn about people from different cultures is lower (46% and 55%, respectively). Only slightly over half (54%) of older respondents stated that Beacon helped them know about their culture and heritage, and two-thirds (67%) of them reported that Beacon helped them be proud of their cultural background. Two of the six Beacon centers with middle/high school respondents had less than 60% of them give a positive assessment on each of the three items regarding cultural competency. In addition, less than 60% of elementary respondents at each Beacon Center also stated that they get to learn about people who are different. Beacon Centers may want to consider finding ways to incorporate the diverse groups of adults who attend the Beacons to enhance the cultural competency of their programming.
Exhibit III-20: Comprehensive Programming – Elementary School Respondents
Ove
rall
Chi
nato
wn
Wes
tern
A
dditi
on
(Number) (75) (53) (22)
Culturally Competent Beacon Programming
Learn about people who are different 46% 43% 55%

III-29
Exhibit III-21: Comprehensive Programming – Middle and High School Respondents
Ove
rall
Bay
view
Mis
sion
OM
I /
Exc
elsi
or
Ric
hmon
d
Sun
set
Vis
itaci
on
Val
ley
(Number) (528) (39) (78) (52) (83) (183) (82)
Assessment of Beacon Programming
Do interesting activities 76% 87% 83% 87% 53% 77% 79%
Culturally Competent Beacon Programming
Helped me know about my culture and heritage 54 84 65 64 33 41 68
Helped me be proud of my culture and heritage 67 95 76 77 55 56 73
Helped me know about other cultures 55 78 70 71 42 43 66
Supportive Relationships Relationships with Adults
Creating supportive relationships with youth entails staff providing not only guidance to youth, but also emotional and practical support. During the site visits, Beacon staff members identified the development of supportive relationships with youth as a key feature of encouraging their retention in the program.
Overall, higher percentages of middle/high school respondents than elementary respondents report that they have developed supportive relationships with Beacon adults. Seventy-three percent (73%) of older respondents report that they feel a Beacon adult really cares about them, compared to 61% of elementary school respondents. Three-fourths (75%) of middle/high school respondents indicated that an adult praises them when they do a good job, while less than two-thirds (63%) of elementary school respondents stated the same. Just over half (56%) of younger respondents reported that adults listen when they have something to say, whereas, 78% of older youth respondents stated that was the case. However, 77% of elementary respondents stated that they do know where to go for help when they have problems.
Most middle/high school respondents reported that an adult notices when they are absent, always wants them to do their best, and believes they will be a success (73%, 83%, and 80%, respectively). The Quality Standards also indicate that staff members should promote positive relationships between youth participants, which include modeling respectful behaviors for them.
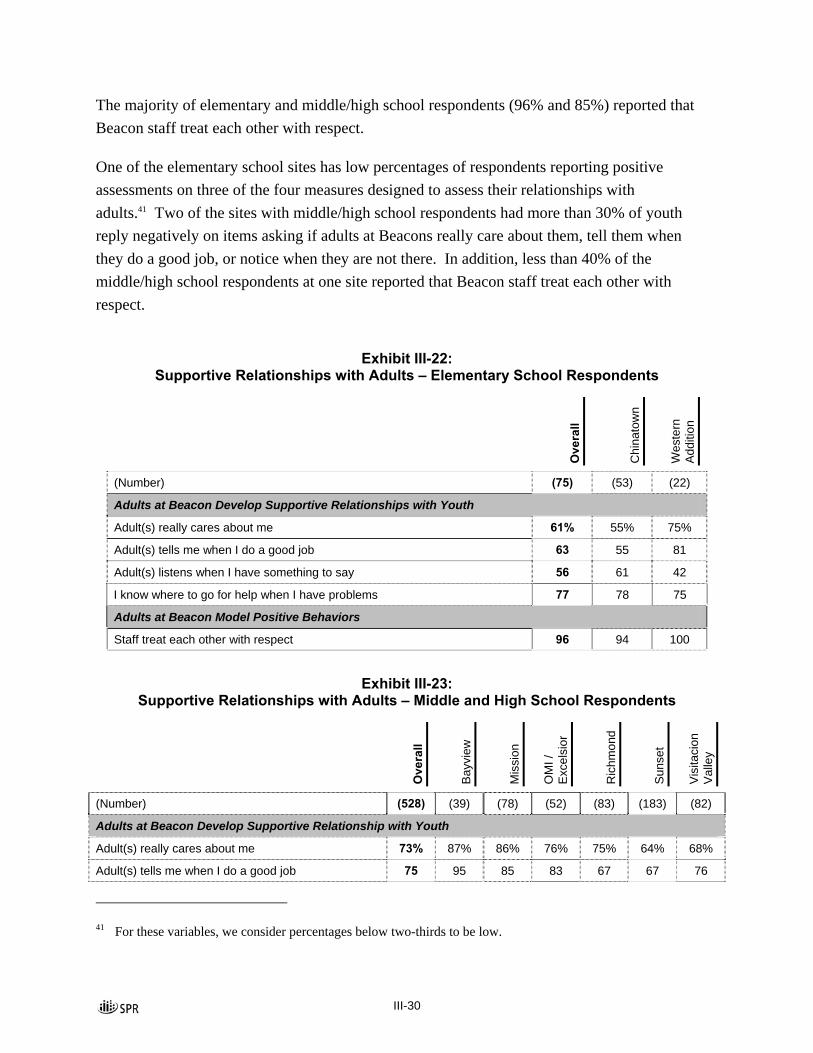
III-30
The majority of elementary and middle/high school respondents (96% and 85%) reported that Beacon staff treat each other with respect.
One of the elementary school sites has low percentages of respondents reporting positive assessments on three of the four measures designed to assess their relationships with adults.41 Two of the sites with middle/high school respondents had more than 30% of youth reply negatively on items asking if adults at Beacons really care about them, tell them when they do a good job, or notice when they are not there. In addition, less than 40% of the middle/high school respondents at one site reported that Beacon staff treat each other with respect.
Exhibit III-22: Supportive Relationships with Adults – Elementary School Respondents
Ove
rall
Chi
nato
wn
Wes
tern
A
dditi
on
(Number) (75) (53) (22)
Adults at Beacon Develop Supportive Relationships with Youth
Adult(s) really cares about me 61% 55% 75%
Adult(s) tells me when I do a good job 63 55 81
Adult(s) listens when I have something to say 56 61 42
I know where to go for help when I have problems 77 78 75
Adults at Beacon Model Positive Behaviors
Staff treat each other with respect 96 94 100
Exhibit III-23: Supportive Relationships with Adults – Middle and High School Respondents
Ove
rall
Bay
view
Mis
sion
OM
I /
Exc
elsi
or
Ric
hmon
d
Sun
set
Vis
itaci
on
Val
ley
(Number) (528) (39) (78) (52) (83) (183) (82)
Adults at Beacon Develop Supportive Relationship with Youth
Adult(s) really cares about me 73% 87% 86% 76% 75% 64% 68%
Adult(s) tells me when I do a good job 75 95 85 83 67 67 76
41 For these variables, we consider percentages below two-thirds to be low.

III-31
Ove
rall
Bay
view
Mis
sion
OM
I /
Exc
elsi
or
Ric
hmon
d
Sun
set
Vis
itaci
on
Val
ley
Adult(s) listens when I have something to say 78 95 77 82 82 75 71
Adult(s) notices when I am not there 73 90 79 61 77 67 75
Adult(s) always wants me to do my best 83 97 84 89 84 76 84
Adult(s) believes I will be a success 80 97 86 84 79 74 74
Adults at Beacon Model Positive Behaviors
Staff treat each other with respect 85 100 56 88 87 91 80
Relationships with Peers
Peers can exert a great deal of influence over youth. In Exhibits III-24 and III-25, Beacon youth describe their peer groups and the kinds of supportive relationships they have developed with friends. Both elementary and middle/high school respondents reported having positive peer influences. The majority of both groups of respondents stated they have friends that stay out of trouble (87% of elementary and 82% of middle/high school respondents). In addition, most of the respondents in both groups report having friends who try to do the right thing (81% in elementary and 78% in middle or high school). The majority of middle/high school respondents also stated that they have friends who do well in school and have a friend who is of a different race or ethnicity (80 % and 81%, respectively).
Most of the older youth respondents indicated they have friends with whom they have supportive relationships, with 83% of them stating they have a friend who really cares about them, 78% reporting their friend is there when they are in need, and 77% indicating that their friend helps the when they are having a hard time.

III-32
Exhibit III-24: Supportive Relationships with Youth – Elementary School Respondents
Ove
rall
Chi
nato
wn
Wes
tern
A
dditi
on
(Number) (75) (53) (22)
Peer Influences
Friends stay out of trouble42 87% 88% 84%
Friends try to do what is right 81 84 75
Exhibit III-25:
Supportive Relationships with Youth – Middle and High School Respondents O
vera
ll
Bay
view
Mis
sion
OM
I /
Exc
elsi
or
Ric
hmon
d
Sun
set
Vis
itaci
on
Val
ley
(Number) (528) (39) (78) (52) (83) (183) (82)
Peer Influences
Friends stay out of trouble43 82% 74% 76% 78% 81% 93% 70%
Friends try to do what is right 78 83 66 72 76 88 71
Friends do well in school 80 81 62 76 84 87 79
Have a friend who is a different race/ethnicity than me 81 92 78 90 85 79 68
Youth Develop Supportive Relationships with Peers
Friend really cares about me 83 86 88 80 88 84 73
Friend talks with me about problems 70 83 72 59 79 67 71
Friend helps me when I am having a hard time 77 92 80 71 86 76 66
Friend is there for me when I am in need 78 86 75 78 87 76 76
Meaningful Participation & Sense of Belonging
According to the Quality Standards, in promoting meaningful youth participation and a sense of belonging, it is important for staff to not only provide activities where youth can develop
42 This question was originally asked: “Do your best friends get into trouble?,” but is inversed here to be consistent
with displaying positive results.
43 This question was originally asked: “Do your friends get into a lot of trouble?,” but is inversed here to be consistent with displaying positive results.
III-33
leadership and decision-making skills, but also to encourage youth to capitalize on these opportunities. These activities include learning how to work successfully with others and developing leadership skills such as public speaking, activity planning, and collective problem solving.
The majority of middle/high school respondents reported in the affirmative on the items that asked them to assess their ability to work with others. Three-quarters (75%) of them stated that they can work with someone who has differing opinions, and 74% indicated that people usually respect what they say. Over two-thirds of middle/high school respondents reported that they were comfortable saying what they think in a group (71%) or had worked on a group project that was successful (70%). However, a lower percent of older respondents indicated that they worked with others to plan a task or solve a problem (59%).
Lower percentages of elementary respondents reported positive responses regarding their ability to work comfortably with others and in groups. Only 55% of them said they felt comfortable working with others. In addition, fewer than half of elementary respondents reported feeling comfortable saying what they think in a group setting or feeling comfortable working with a person having differing opinions (43% each). The higher percentages of older respondents who report being comfortable working with others are not unexpected, given that older youth are likely to have more developed social skills.
When speaking with Beacon staff members, some noted that when youth have strong leadership roles, it encourages their emotional investment and continued retention in the program. However, fewer than half of middle/high school respondents have participated in each of the leadership items shown in Exhibit III-27. The highest percent of respondents had participated in or attended a leadership skills development workshop or activity at Beacon (48%), followed by those that made a presentation or spoke in front of a group (47%), and respondents that helped or tutored a younger participant (44%). Forty percent (40%) of older respondents stated they had planned activities or programs, though only about one-quarter (27%) had planned or run a meeting at Beacon. Moreover, although most Beacon Centers have Youth Leadership Councils, only about one-third (34%) of middle/high school respondents had participated in or attended a Beacon Youth Council meeting.
At both Beacon Centers with elementary respondents, less than half of their respondents reported feeling comfortable saying what they think in a group or being comfortable working with someone with different opinions. Among middle/high school respondents, two of six sites had less than two-thirds of respondents report that they felt comfortable saying what they think in a group or have worked on a group project that was successful. In addition, five sites had less than

III-34
two-thirds of respondents report that they had worked with others to plan a task or solve a problem.
Most middle/high school respondents reported that they had not participated in each of the leadership activity. However, at three of the six sites at least 50% of respondents had participated in or attended a leadership skills development workshop or activity, helped/tutored younger participants, planned activities or programs, and participated in or attended a Beacon Youth Council Meeting. At two sites, at least half of the respondents reported having made a presentation or having spoken in front of a group, including one site that had 80% of respondents indicate that was the case. Two sites had less than 20% of respondents who had planned or ran meetings.
Exhibit III-26: Meaningful Participation and Sense of Belonging – Elementary School Respondents
Ove
rall
Chi
nato
wn
Wes
tern
A
dditi
on
(Number) (75) (53) (22)
Ability to Work with Others at Beacon
Comfortable working with others 55% 58% 48%
Comfortable saying what I think in a group 43 40 50
Comfortable working with someone who has different opinions than mine 43 40 48
Exhibit III-27:
Meaningful Participation and Sense of Belonging – Middle and High School Respondents
Ove
rall
Bay
view
Mis
sion
OM
I /
Exc
elsi
or
Ric
hmon
d
Sun
set
Vis
itaci
on
Val
ley
(Number) (528) (39) (78) (52) (83) (183) (82)
Ability to Work with Others at Beacon
Comfortable saying what I think in a group 71% 87% 66% 71% 72% 66% 77%
People usually respect what I say 74 79 73 75 75 75 75
Can work with someone who has different opinions than mine 75 90 70 69 76 76 76
Worked on a group project that was successful 70 81 61 60 67 75 74
Worked with other youth participants to plan a task or solve a problem 59 74 65 54 49 58 57
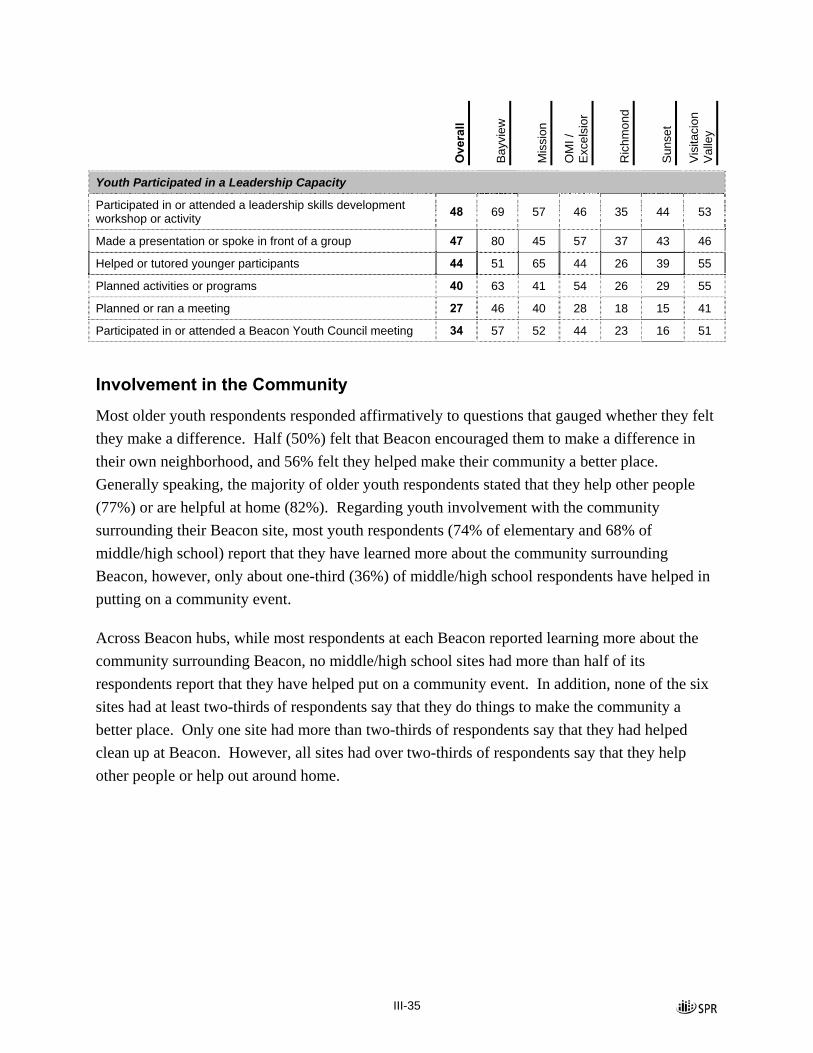
III-35
Ove
rall
Bay
view
Mis
sion
OM
I /
Exc
elsi
or
Ric
hmon
d
Sun
set
Vis
itaci
on
Val
ley
Youth Participated in a Leadership Capacity
Participated in or attended a leadership skills development workshop or activity 48 69 57 46 35 44 53
Made a presentation or spoke in front of a group 47 80 45 57 37 43 46
Helped or tutored younger participants 44 51 65 44 26 39 55
Planned activities or programs 40 63 41 54 26 29 55
Planned or ran a meeting 27 46 40 28 18 15 41
Participated in or attended a Beacon Youth Council meeting 34 57 52 44 23 16 51
Involvement in the Community
Most older youth respondents responded affirmatively to questions that gauged whether they felt they make a difference. Half (50%) felt that Beacon encouraged them to make a difference in their own neighborhood, and 56% felt they helped make their community a better place. Generally speaking, the majority of older youth respondents stated that they help other people (77%) or are helpful at home (82%). Regarding youth involvement with the community surrounding their Beacon site, most youth respondents (74% of elementary and 68% of middle/high school) report that they have learned more about the community surrounding Beacon, however, only about one-third (36%) of middle/high school respondents have helped in putting on a community event.
Across Beacon hubs, while most respondents at each Beacon reported learning more about the community surrounding Beacon, no middle/high school sites had more than half of its respondents report that they have helped put on a community event. In addition, none of the six sites had at least two-thirds of respondents say that they do things to make the community a better place. Only one site had more than two-thirds of respondents say that they had helped clean up at Beacon. However, all sites had over two-thirds of respondents say that they help other people or help out around home.

III-36
Exhibit III-28: Youth Involvement with the Community – Elementary School Respondents
Ove
rall
Chi
nato
wn
Wes
tern
A
dditi
on
(Number) (75) (53) (22)
Beacon Encouraged Youth Involvement in the Community
Learned more about the community surrounding Beacon 74% 65% 95%
Exhibit III-29: Youth Involvement with the Community – Middle and high School Respondents
Ove
rall
Bay
view
Mis
sion
OM
I /
Exc
elsi
or
Ric
hmon
d
Sun
set
Vis
itaci
on
Val
ley
(Number) (528) (39) (78) (52) (83) (183) (82)
Beacon Encouraged Youth Involvement in the Community
Learned more about the community surrounding Beacon 68% 73% 79% 77% 53% 68% 67%Youth helped put on a community event 36 50 47 60 31 22 46Encouraged youth to do things that make a difference in their neighborhood
50 57 55 50 37 46 63
Youth Feel They Make a Difference
Do things to make community a better place 56 58 54 49 55 55 64Help other people 77 84 68 79 78 81 72Help out around home 82 92 81 86 80 82 80Cleaned up at Beacon 54 67 52 68 41 49 63
Challenging & Engaging Skill Building
According to the Quality Standards, programming at Beacon should include activities that youth participants find enjoyable and engaging, but that also help them develop skills in core competencies areas such as leadership, career development, and educational support.
General Learning
The vast majority of elementary respondents stated that they learned new things at Beacon (80%) and that they felt this learning would help make them successful (80%). While still a majority of respondents, lower percentages of the older youth respondents stated they learned new things at Beacon (66%) or learned things to help them be successful (67%).

III-37
Leadership Skills
Regarding the core competency area of leadership, the majority (75%) of middle/high school respondents stated that they know how to work with others to plan a project or activity. However, less than half (45%) of them stated that they know how to run a meeting.
Career Development Skills
The percentages of older youth who reported learning about specific career development skills at Beacon varied according to the skill assessed. Overall, the highest percent of respondents reported learning about jobs they would like to do as an adult (64%) and learning appropriate work behavior (63%). Smaller percentages of middle/high school respondents indicated that they learned how to handle themselves in an interview (58%) and learned how to apply for a job (54%). In addition, only about half of older respondents stated they learned how to dress for work or completed a resume (50% and 49%, respectively). This is likely the case because the skills with the highest percentages are targeted more generally to all ages of middle/high school youth, while the skills with lower percentages are likely more specific to the eldest of those respondents. One of the Beacon sites had at least 70% of respondents reply affirmatively to five of the six questions about career development skills, and one site had less than half of respondents reply affirmatively on five of the six.
Encouragement
Overall, when middle/high school respondents were asked questions designed to assess whether Beacon encourages them to achieve, the majority of them replied affirmatively. Seventy-nine percent (79%) said they feel there are many things they do well and that Beacon encouraged them to continue their education after high school. Nearly as high percentages of older respondents indicated that they feel there is purpose to their lives (78%) and that Beacon encouraged them to have goals and plans for the future (77%). Four of the six sites with middle/high school youth had at least 80% of respondents indicate positive responses to all questions regarding Beacon encouragement of youth.
Exhibit III-30: Challenging and Engaging Skill Building – Elementary School Respondents
Ove
rall
Chi
nato
wn
Wes
tern
A
dditi
on
(Number) (75) (53) (22)
General Youth Learning at Beacon
Learned new things 80% 75% 94%Learned things that will help me be successful 80 75 95I try my best 86 86 85

III-38
Exhibit III-31:
Challenging and Engaging Skill Building – Middle and High School Respondents
Ove
rall
Bay
view
Mis
sion
OM
I /
Exc
elsi
or
Ric
hmon
d
Sun
set
Vis
itaci
on
Val
ley
(Number) (528) (39) (78) (52) (83) (183) (82)
General Youth Learning at Beacon
Learned new things 66% 65% 65% 67% 63% 62% 76%Learned things that will help me be successful 67 62 70 69 68 62 73Leadership Skills Developed at Beacon
Know how to run a meeting 45 57 56 45 44 34 59Know how to work with others to plan a project or activity 75 84 71 71 77 72 80Career Development Skills Developed at Beacon
Learned about jobs I would like to do as an adult 64 87 71 75 58 49 79Learned how to apply for a job 54 73 71 63 60 35 60Learned how to handle myself in an interview 58 90 70 58 58 42 68Learned appropriate work behavior 63 81 69 65 57 54 74Learned how to dress for work 50 79 48 52 44 37 65Completed a resume 49 58 59 53 51 37 64Beacon Encourages Youth to Achieve
Have goals and plan for the future 77 90 80 81 70 70 86Plan to go to continue education after high school 79 100 80 89 78 71 80Feel there is a purpose to my life 78 100 85 83 72 68 82Feel there are many things I do well 79 92 83 81 73 73 90
Youth Habits
The survey also asked youth respondents about their educational, health and extracurricular habits and activities. The majority of elementary respondents reported positive habits and behaviors. Most completed at least most of their homework in the last week (78%) and were helpful at school (62%). About 70% of elementary respondents exercised at least four days in the last week, and 63% watched TV or played video games for one hour or less yesterday.
Regarding their educational habits, the majority of middle/high school respondents reported positive behaviors. Eighty-six percent (86%) of them stated they skipped or cut class less than once a month in the last school year. In addition, 78% indicated that they completed their homework more than half of the time in the last month. As for their physical health habits, most (71%) of older respondents reported exercising strenuously on at least four days last

III-39
week. As far as extracurricular activities, the majority (81%) of middle/high school respondents indicated that they are involved in arts, sports or some other hobby, and 69% said they participated in extracurricular group activities. While only about one-third (34%) of middle/high school respondents stated that they have a job, this is likely because middle school youth are often too young to work.
Exhibit III-32: Youth Habits – Elementary School Respondents
Ove
rall
Chi
nato
wn
Wes
tern
A
dditi
on
(Number) (75) (53) (22)
Youth Educational Habits
Completed most or all homework in the last week 78% 85% 62%
Was helpful at school 62 68 48
Youth Health Habits
Exercised 4 or more days last week44 70 76 57
Youth Extracurricular Habits
Watched TV or played video games 1 hour or less yesterday45 63 60 71
44 Survey response categories for the question “How many days each week do you exercise, dance or play sports?”
were condensed from 7 categories - “0 days,” “1 day,” “2 days,” “3 days,” “4 days,” “5 days,” and “6 or 7 days” into 2 response categories – “Less than 4 days a week” and “4 or more days a week.” The percentages represent respondents who stated they exercised “4 or more days a week.”
45 Survey response categories for the question “Yesterday, how much time did you spend watching TV or playing video games?” were condensed from 5 categories – “None,” “Less than 1 hour,” “About 1 hour,” “about 2 hours,” and “About 3 hours,” into 2 categories – “1 hour or less” and “More than 1 hour.” The percentages represent respondents who replied “1 hour or less.”

III-40
Exhibit III-33: Youth Habits – Middle and High School Respondents
Ove
rall
Bay
view
Mis
sion
OM
I /
Exc
elsi
or
Ric
hmon
d
Sun
set
Vis
itaci
on
Val
ley
(Number) (528) (39) (78) (52) (83) (183) (82)
Youth Educational Habits
Completed homework more than half the time in last month46 78% 73% 67% 75% 75% 89% 77%Skipped or cut classes less than once a month during past school year47 86 82 73 94 73 98 82
Youth Physical Health Habits
Strenuously exercised 4 or more days last week48 71 77 72 77 68 73 66
Youth Extracurricular Habits
Participate in extracurricular group activities 69 92 58 58 77 69 65Involved in arts, sports, or other hobby 81 92 78 81 77 84 80Have a job 34 54 33 42 31 20 49
Youth Assessment of Beacon
Youth respondents were asked questions regarding their overall assessment of Beacon. Overall, about three-quarters of elementary and middle/high school respondents stated that they like coming to Beacon (75% and 74%, respectively). In addition, 73% of younger and older respondents reported that they would recommend the Beacon program to friends. One of the middle/high school sites had at least 80% of its respondents state the they like coming to Beacon and would recommend it to friends. Another of the sites had less than two-thirds of respondents say the same.
46 Survey responses were condensed from 5 response categories – “All of the time,” “Most of the time,” “About
half the time,” “Not very often,” and “Never” – into 2 response categories – “More than half the time” and “Less than half the time.” The percentages represent respondents who replied “More than half the time.”
47 Survey response categories for the question “During the past school year, about how often have you skipped school or cut class?” was condensed from 5 categories – “Never,” “A few times this year,” “Once a month,” “ 2 to 3 times a month,” and “4 or more times a month” into 2 categories – “Less than once a month” and “Once or more a month.”
48 Survey response categories for the question “During the past seven days, on how many days did you exercise or play sports for at least 20 minutes that made you sweat and breathe hard?” were condensed from 8 categories - “0 days,” “1 day,” “2 days,” “3 days,” “4 days,” “5 days,” and “6 days” and “7 days” into 2 response categories – “Less than 4 days a week” and “4 or more days a week.” The percentages represent respondents who stated they exercised “4 or more days a week.”

III-41
Exhibit III-34: Overall Assessment of Beacon – Elementary School Respondents
Ove
rall
Chi
nato
wn
Wes
tern
A
dditi
on
(Number) (75) (53) (22)
Youth Assessment of Beacon
Like coming to Beacon 75% 77% 70%
Would recommend to friends 73 71 80
Exhibit III-35: Overall Assessment of Beacon – Middle and High School Respondents
Ove
rall
Bay
view
Mis
sion
OM
I /
Exc
elsi
or
Ric
hmon
d
Sun
set
Vis
itaci
on
Val
ley
(Number) (528) (39) (78) (52) (83) (183) (82)
Youth Assessment of Beacon
Like coming to Beacon 74% 63% 71% 69% 81% 76% 73%
Would recommend to friends 73 65 68 77 83 71 71
District Data San Francisco Unified School District (SFUSD) provided the SFBI with data on academic and behavioral outcomes for youth enrolled in the ExCEL program for the 2007-2008 school year. These data are for ExCEL enrolled youth only, and therefore, represent only a subset of Beacon youth only.
SFUSD provided only aggregate level data on ExCEL youth from each school site. Since we did not get individual level data we are only able to sum the aggregate level data for each grade level, and that data are presented in the following exhibits. The exhibits show data for youth on California Standards Test (CST) Proficiency, Average Daily Attendance (ADA), and the number of suspensions, categorized by how many days, if any, they attended the Beacon program during the 2007-2008 school year. The data is intended to illustrate the change in scores or behavior from 2006-2007 to 2007-2008, dependant on Beacon attendance in 2007-2008. No statistical tests could be run on the aggregate data to find if there are significant differences in

III-42
proficiency/behavior from 2006-2007 to 2007-2008 for each level of Beacon attendance or between levels of Beacon attendance.49
California Standards Test (CST) Proficiency
Beacon ExCEL youths’ CST proficiency was matched from the 2006-2007 and 2007-2008 school years and grouped according to the frequency of after school attendance during school year 2007-2008. Exhibit III-36 displays the matched percent of Beacon ExCEL youth who were proficient on the CST English Language Arts (ELA) and Mathematics tests in 2007 and 2008 by grade level and attendance category. Non-Beacon elementary youth had higher percentages of proficiency than Beacon youth for ELA and Math. In 2008, Beacon ExCEL middle school youth with the 136+ days of Beacon attendance in 2007-2008 had higher percentages of proficient than either non-Beacon youth or Beacon youth with lower attendance on both tests. For high school youth, non-Beacon youth had higher percentages of proficiency than Beacon youth in both test categories in 2008.
Exhibit III-36: CST Proficiency – Matched Data for 2006-2007 and 2007-2008 School Year
CST English Language Arts CST Mathematics After School Attendance Breakdown
# of Test Takers
% Proficient2007
% Proficient2008
Test Takers
% Proficient 2007
% Proficient2008
Elementary TOTAL 2,088 57.3% 57.6% 2,119 76.5% 74.2% Non-Beacon 1,227 61.5 62.8 1,239 79.9 77.5 1-45 days 58 50.0 51.7 59 71.2 69.5 46-90 days 89 49.4 47.2 90 63.3 56.7 91-135 days 78 57.7 44.9 82 68.3 59.8 136+ days 636 50.8 51.3 649 73.2 72.6 Middle TOTAL 4,688 52.5 54.5 4,677 56.6 59.5 Non-Beacon 2,736 54.3 56.2 2,730 59.3 62.8 1-45 days 771 42.2 45.5 766 44.0 44.6 46-90 days 540 50.7 50.0 539 51.4 53.8 91-135 days 332 48.8 51.8 333 56.5 58.3 136+ days 309 69.3 71.8 309 73.8 78.3 High TOTAL 3,905 50.4 49.5 3,777 41.8 32.5 Non-Beacon 3,205 51.4 50.7 3,093 43.3 34.0
49 Therefore, differences between the two years may be due to chance.

III-43
CST English Language Arts CST Mathematics After School Attendance Breakdown
# of Test Takers
% Proficient2007
% Proficient2008
Test Takers
% Proficient 2007
% Proficient2008
1-45 days 663 46.0 44.6 648 35.5 25.9 46-90 days 37 45.9 35.1 36 25.0 13.9 91-135 days 0 na na 0 na na 136+ days 0 na na 0 na na
Average Daily Attendance (ADA)
The ADA of Beacon ExCEL youth was matched from the 2006-2007 and 2007-2008 school years and grouped according to the frequency of after school attendance during school year 2007-2008. Since SFUSD provided only aggregate ADAs, we had to average those percentages by the number of schools with students in each attendance category. Exhibit III-37 displays the average ADA of youth for each grade level and after school attendance category. At the elementary school level the ADA increased from 2006-2007 to 2007-2008 for all youth regardless of after school Beacon activities attendance. The ADA of middle and high school youth decreased across all levels of after school Beacon participation.
Exhibit III-37: Average Daily Attendance – Matched Data for 2006-2007 and 2007-2008 School Year50
After School Attendance Breakdown # of Schools Total Students
ADA 2006-07
ADA 2007-08
Elementary TOTAL 13 3826 95.82% 96.47% Non-Beacon 13 2518 95.53 96.11 1-45 days 13 91 95.17 95.35 46-90 days 13 177 93.71 96.20 91-135 days 13 137 94.96 95.74 136+ days 13 903 96.92 97.58 Middle TOTAL 7 4965 90.59 85.77 Non-Beacon 7 2938 89.80 84.96 1-45 days 7 813 90.85 85.60 46-90 days 7 565 91.29 86.54 91-135 days 7 339 95.65 91.95 136+ days 5 310 96.37 95.53
50 Average Daily Attendance in this chart represents the average of the ADA of each participation category for all
schools.

III-44
After School Attendance Breakdown # of Schools Total Students
ADA 2006-07
ADA 2007-08
High TOTAL 4 5643 80.71 73.13 Non-Beacon 4 4594 79.15 70.10 1-45 days 3 994 82.40 76.79 46-90 days 2 54 79.06 74.77 91-135 days 1 1 83.89 77.22 136+ days 0 na na na
Suspensions
The number of suspensions of Beacon ExCEL youth were matched from the 2006-2007 and 2007-2008 school years and grouped according to the frequency of after school attendance during school year 2007-2008. While the number of suspensions for non-Beacon elementary school youth increased, most attendance groups of Beacon participants decreased their number of suspensions, except youth who participated 1-45 days, whose number stayed constant. All groups of middle school youth, regardless of Beacon attendance, decreased their numbers of suspensions in 2007-2008.
Exhibit III-38: Suspensions – Matched Data for 2006-2007 and 2007-2008 School Year
After School Attendance Breakdown
Number of Schools
Number of Suspensions
2006-07
Number of Suspensions
2007-08 Elementary TOTAL 13 57 44 Non-Beacon 13 30 39 1-45 days 13 1 1 46-90 days 13 18 3 91-135 days 13 1 0 136+ days 13 7 1 Middle TOTAL 7 665 342 Non-Beacon 7 401 244 1-45 days 7 128 59 46-90 days 7 89 29 91-135 days 5 34 5 136+ days 5 13 5 High TOTAL 4 384 402 Non-Beacon 4 301 306

III-45
After School Attendance Breakdown
Number of Schools
Number of Suspensions
2006-07
Number of Suspensions
2007-08 1-45 days 3 70 90 46-90 days 2 13 6 91-135 days 1 0 0 136+ days 0 na Na
Summary The analysis of demographic characteristics of participants during the Summer of 2007 and the 2007-2008 school year shows that the Beacon Centers had a higher percent (44%)51 of youth in middle school than in any other grade level. Most participants (47%) were between 10 and 13 years old, and there was a slightly higher percentage (53%) of male youth. The racial/ethnic groups with the highest percentage of youth were Asian (46%) and African American (22%), and the majority (76%) of youth were fluent English speakers. The adult participants were distributed evenly across age brackets, although 40% of them were at least 55 years old. A higher percent (61%) of adult participants were female, and the majority of adult participants were Asian (62%). While most (67%) adults were fluent English speakers, nearly 25% were not.
Attendance across all eight Beacon Centers was an impressive total of 7,650. Six of the eight Beacon Centers met participation quality standards by serving at least 600 participants during the combined Summer of 2007 and 2007-2008 school year. Seven of the Centers served at least 70% youth participants as compared to adults. Overall, a substantive number of adult participants were concentrated at half of the sites. At three sites, adults comprised 5% or less of the total participants. During the fall of the 2007-2008 school year, five out of eight Centers met the Beacon Quality Standard for daily attendance; however, only three sites met it during the spring.52 With regards to hub site participation, four of the eight Beacon Centers served a greater percentage of participants at their hub site. Overall, 58% of the total number of youth and adults participate in activities at the hub sites, although the quality standards specify that 80% of the programming should occur at the hub sites.
51 Hub and satellite sites combined.
52 The average daily attendance of some sites may be higher than is shown below because of activity days with missing attendance records. This may be especially true during the spring session, for which some sites are missing a great deal of missing attendance information.

III-46
During the 2007-2008 school year, elementary school participants at Beacon hub sites attended more frequently and spent more total hours in group activities than middle and high school youth.
• Middle vs. high school youth participation patterns. During the school year, middle school participants attended Beacon Centers more frequently than high school participants did, but on the days that high school youth did attend, they spent more time at the Beacon Center than those youth in middle school.
• Academic Support & Enrichment participation. The average number of hours elementary participants spent in Academic Support & Enrichment was significantly higher than both other groups of participants. In addition, middle school youth spent a significantly higher average number of hours in Academic Support & Enrichment than hub participants in high school. Middle school participants also spent, on average, significantly fewer hours on Sports & Recreation than both elementary and high school participants.
The youth survey data provided important youth feedback on the quality of their youth developmental experience at the Beacon hubs. Our analysis of the data show that the majority of youth who responded enjoyed coming to Beacon and felt safe at their Beacon Center. The majority also felt that they learned new things and did interesting activities at Beacon. In addition, most older respondents felt that Beacon encouraged them to achieve by having goals for the future. The majority of youth surveyed felt that people at Beacon respected their culture and heritage, but fewer replied that Beacon helped them know about their culture and heritage, or stated that they learned about people from different cultures. This suggests that Beacon Centers need to pay more attention to this aspect of programming, particularly given the diversity of their participants.
While higher percentages of middle/high school respondents than elementary respondents reported that they have developed supportive relationships with Beacon adults, over one-quarter of all youth felt that there was no Beacon adult who really cared about them. As for relationships with their peers, both elementary and middle/high school respondents reported having positive peer influences, and most of the older youth indicated they have friends with whom they have supportive relationships.
In the area of skill development, youth were asked about the leadership activities they participated in at Beacon. Most older respondents responded affirmatively on questions about opportunities to work with others, while lower percents of elementary respondents did so on these questions. However, fewer than half of older respondents had participated in the majority of the leadership activities.

IV-1
IV. KEY CHALLENGES & PROMISING PRACTICES TO ACHIEVING BEACON MISSION AND QUALITY STANDARDS
As described in Chapter 1, a Beacon Center, as it was originally conceived, is a school-based oasis in high need neighborhoods that offers a range of supports and opportunities for the healthy development of young people, families, and communities. While remaining responsive to the local needs and conditions of its specific neighborhoods and host school, the Beacon Centers were created to uphold some common elements of the original vision and mission of the Beacon Centers. For the 2008 Evaluation of the Beacon Centers, these key features continue to serve as critical guideposts to assess the Beacon Centers’ alignment with the San Francisco Beacon Initiative’s mission.
Over the years, Beacon Center leaders have had to respond to the continuously changing demographic, economic, social, and political environment and turnover in partnerships in order to ensure the Centers’ survivability. While some Centers have become “beacons” in their communities, others have struggled to maintain their programming space, meet the participation requirements, and show general compliance with the Beacon Quality Standards. Moreover, it became apparent during our site visits that although most Centers focus on providing quality afterschool programming, they face considerable challenges in becoming a community hub. In this chapter, we highlight the key challenges that the Center directors have identified that impede their ability to become fully functioning “community hubs.” The most common sets of challenges that were cited include: (1) parent and community engagement, (2) availability of school space, (3) relationship with host schools, (4) participant attendance requirement, and (5) integration of ExCEL funds.
1. Parent and Community Engagement Engaging parents and the community in Beacon programs is a significant challenge for seven of the eight Beacon Centers visited. A number of Beacon directors and staff reported some success in engaging parents and adults in social and recreational activities, such as field trips, open gym,
IV-2
and family dinners. However, many Centers continue to struggle in engaging parents in developmental, enrichment, and community activities (e.g. parenting classes, job training, violence prevention initiatives, etc.). While there are a number of factors that prevent parents and the community from engaging in Beacon programming, the location of Beacon Centers and the large number of working class and immigrant families within these communities are major factors that make it more difficult for Beacon Center staff to engage families.
Location of Beacon Centers • Beacon Centers are not typically located in youth’s neighborhoods. Due to the
San Francisco Unified School District’s student assignment policy, Beacon staff mentioned that most families that have children who attend Beacons do not always live in the community where the Beacon Center is located. This has thus made it difficult for staff to engage some parents in programming. As one staff member explains,
This neighborhood itself is an interesting neighborhood because it is more of a place where students come for school and then go to their [own] neighborhoods after school.
Another staff member expanded on this problem: “One of the main challenges for us is that not all our families are from this community and, a lot of parents don’t have cars.” A number of parents, who we interviewed, confirmed that they usually do not have enough time to participate in Beacon activities because they are working late and because of the great distance from their homes to the Beacon Centers.
• Some Beacon Center are located in a very fragmented community. Staff from another Center reported their Beacon Center serves four neighborhoods within the community. An implication of this situation is major territorial issues have arisen among the neighborhoods targeted. That is, members of different neighborhoods often complain that the other neighborhoods are receiving more community support than they are. To address this issue, this Center provides staff members (e.g. case managers) to schools within those neighborhoods to offer supportive services to the youth and their families. However, because the Center’s hub is located in only one of these four neighborhoods, the Center struggles in engaging parents and community residents from the other three neighborhoods.
• Beacon Centers’ location on high security school campuses can limit access and discourage community involvement. It is also challenging for some Centers to engage parents and the community in programming, because they are located on school sites that are not always accessible to the public. Beacon staff from one Center mentioned that there is a large fence that surrounds the Center, which they feel is unwelcoming and a physical barrier that discourages community involvement. In addition, not only does the community not have access to the Center during school hours, there is no parking lot where parents and community residents who live far from the Center can park while accessing services. As a

IV-3
result, those who we interviewed stated that this makes it is difficult for the Center to remain visible and accessible to the community.
Working Class Families • Competing economic pressures make it difficult for working parents to
participate. As mentioned above, many parents are unable to participate in Beacon activities because of their demanding work schedules. A number of staff stated that parents usually rely on the Beacon Center for free childcare that they could not otherwise afford, and they never have time to take advantage of the programs and services that are available to them. One Beacon director stated:
We have some parents who, yes they live in a house, but they’re also sharing it with their brothers and sisters who also have a family and maybe have a parent and grandparents and home. For them to pick up the mortgage, everybody is working not one shift, but two… Parents are struggling. To get them to commit to coming back and helping is really, really difficult.
To address this challenge, many Centers have begun offering programs and services to parents and the community during the evening hours, on the weekend, and at partner locations. While some parents acknowledge that conducting programs during these alternate hours has allowed them to engage occasionally in Beacon-related activities, they expressed a great deal of difficulty in remaining consistently involved because of their demanding work schedules. As a result, Beacon Centers continuously struggle to engage them.
Immigrant Families • Cultural and linguistic barriers prevent immigrant families from participating.
Many Centers are also located in communities that have a large population of immigrant families. While some Centers have been effective in engaging immigrant families through either culturally relevant programs and/or staff who closely identify with the culture of these families, others continue to struggle in this area. For instance, a Beacon director from one Center reported that roughly 50 percent of parents who have youth that attend their Center are not fluent English speakers. In addition, the Center does not have enough bilingual staff who can teach an English learning class or translate information. Therefore, this prevents the Center from successfully engaging parents who do not fluently speak English.
In an effort to address the challenges associated with the lack of parent and community engagement, many centers have implemented various practices that have assisted them in engaging parents and the community in Beacon programming.
IV-4
Examples of Promising Practices in Engaging Parents and the Community
• Develop close relationships with parents and community partners. A number of staff reported that they are able to develop close relationships with parents and community partners by welcoming them when they visit the Center, and remaining in consistent contact with them through phone calls, newsletters, attending Parent Teacher Association meetings, and by collaborating with community-based organizations (CBO) on various community events and committees. This has allowed many Centers to better understand the culture and needs of parents and the community, while also increasing their visibility. Additionally, by using these practices, a number of Centers are able to inform parents and the community of programs and services offered by the Beacon Center, which has allowed them to better engage these individuals in Center activities.
• Assure easy access to programs and services. Since demanding work schedules and transportation make it difficult for parents and adults to participate in Beacon activities, one Beacon Center placed Beacon staff at schools where no satellite sites were set up. These staff members thus provide support services to youth and families within those schools and communities. In addition, another Center held parent nights at a location in the community where many of their families live. As a result, Beacon staff noted that parents were more likely to participate in Beacon activities when they could easily access them.
• Provide programs that cater to the needs of parents and the community. Beacon staff reported that by offering programs and services that are important and beneficial to adults and the community, such as computer and ESL classes, parents and adults begin engaging in other Beacon activities. For instance, one Beacon director stated the computer class they offer to adults in the community attracts roughly 15 adults per day. Once they have completed the class, they sometimes come back and use computers during open lab time, ask questions, and eventually become more engaged with the Beacons program. The Beacon director explained:
They took our beginner [computer] class, they took our intermediate [computer] class and now they’re back almost everyday. Monday through Thursday. They water our plants, they volunteer at our events, they serve food… they learn more about other programs by going to computer classes.
• Provide parents with supportive services. Beacon staff and parents reported that providing parents with supportive services, such as childcare, food, and transportation while they attend Beacon-related activities, have eliminated barriers that prevent many parents and adults from participating, and has overall encouraged them to attend activities.
• Disseminate Beacon information in multiple forms. A number of Beacon staff reported that they often send flyers and information home in the mail and with youth, update the Center’s website, maintain a newsletter, make phone calls, and informally speak with parents when they are picking up their child from the Center to provide them with information about Beacon programs and services. This has been an effective practice because parents are obtaining Beacon information from multiple sources, which keeps them informed as to what the Beacon Center is offering. Centers also make this information available in multiple languages.
IV-5
2. Availability of School Space The availability of space within the schools where Beacon Centers are located is another major challenge that a number of Beacon Centers are experiencing. While some Beacon directors reported having a dedicated space to conduct programs and provide services, directors and staff from five Beacon Centers reported the lack of available of space as a major issue. Key factors that affect a Center’s ability from obtaining adequate space include a lack of cooperation among school teachers and construction at school sites.
Cooperation of Teachers • Securing the trust and cooperation of teachers to use classroom space is an
ongoing struggle. Beacon staff from multiple Centers reported relying heavily on the use of teachers’ classrooms to house Beacon-related activities. Yet, to obtain a classroom to conduct most programs, Beacon staff often have to find a teacher who will allow them to use their classroom space. Since school staff are often protective of their space, due to concerns of theft or because of scheduling conflicts, Beacon Centers often have trouble finding regular spaces to hold programs. Beacon Centers are therefore limited in the time and space they have to conduct programming within the school day, after school, and on weekends and are often forced to utilize the schools cafeteria to conduct multiple programs. For instance, at the time of our site visit, one Center was serving 100 youth participants out of the host schools’ cafeteria because teachers did not allow them to utilize their classroom space. One Beacon director explained:
We’ve been waiting on the principal who over the past three years has promised us that we would have classroom space. And the
Examples of Promising Practices in Engaging Parents and the Community (cont’d)
• Solicit parent/community feedback and involvement in decision-making. A number of Beacon Centers have implemented this practice by administering survey’s, facilitating focus groups, hosting community meetings, utilizing a suggestion box at Beacon events, and developing a parent advisory council. Staff reported that this feedback has allowed them to better understand the needs of parents and the community, and the types of programs in which they would like to participate. One Beacon director stated:
Our newest addition is our Parent Advisory Council. It started with a parent potluck for the program, and then from there we started recruiting. The major things that the Parent Advisory Council is charged with is fundraising, and helping develop programs for youth and parents. So, now we’re getting a sense for what the actual need is out there in the community as it relates to what adults are looking for and what types of programs their looking to participate in.

IV-6
principal herself at this point in time has yet to get herself classroom space for the afterschool program…[In addition,] there’s a vocal minority [of teachers who don’t want to share classroom space]…they are afraid to be the first one to say, “I’m willing to do that” because of the vocal minority.
As a result, a number of Centers are forced to conduct multiple programs in one larger space simultaneously. This limits their ability to conduct a range of diverse, more creative, small group programming. Additionally, when space is available, Beacon Center programs are not always a priority and sometimes are given a limited amount of time to use classroom and school space, or asked to relocate to another location.
Construction at School Sites • Construction at a few school sites has also limited the space that is available to
Beacon Centers. For instance, at one site, it was mentioned that the host school has been undergoing construction for roughly two years. As a result, portable classrooms have been placed on the basketball courts, which have taken over the already limited space available for youth athletic activities. Additionally, the teachers in the portable classrooms have to rotate every few months which require Beacon staff to ask new teachers to use their classroom space. Since building rapport with teachers is crucial to secure classroom space, getting new teachers to agree to donate their classrooms has proven to be a significant challenge.
• Multiple moves have decreased the Beacon Centers’ visibility and momentum. Construction has also forced another Beacon Center to relocate to six different rooms within the school and to another school site in the past. As a result, Beacon staff from this Center expressed that they lost some momentum in the programs and services they offer to youth. They have lost some program materials. They have had to place staff development and team building activities on hold. Overall, they have struggled in assuring the Center was visible to youth, parents, and the community.
Without dedicated space to conduct programs, Beacon Centers struggle to build community for youth and adults. One Beacon director expressed, “Not having [a dedicated space has] made it really hard to have connectivity and a sense of community with the kids.”
While some centers have been unable to obtain a consistent space to conduct programs and provide services, a few Beacon Centers have implemented various practices to address the challenges associated with the lack of available of space.

IV-7
3. Relationship with Host School While a number of Beacon Centers have been operating at their host school for a number of years, Beacon staff from five of the eight Centers reported a number of challenges in operating and implementing programs at their school sites. Beyond the availability of school
Examples of Promising Practices in Addressing School Space
• Develop relationships with school administrators, staff, and stakeholders. This has been an effective practice for many Beacon Centers because as school administrators and staff become more aware of the mission and goals of the Beacon Center, they are more willing to advocate for the Beacon Center and allow them to use their space to conduct programming. One Beacon director stated:
We really connected with our district supervisor. We’re connected to other stakeholders and have a good relationship with our school principal. We have a good relationship with the Parent Teacher Association. We have a good relationship with community partners. They all help us advocate for specific things at different levels. So like the president of the PTA, she found out that we possibly have to move our site by the summer. She has already called the school district and all these other people to help us solidify a space.
To develop positive relationships with school administration and staff, Beacon staff have provided new teachers with extra help and resources their first academic year. They attended the school staff meetings, and have helped school staff with student and school-related issues, such as mediating student conflict and planning school-wide activities.
• Check in with teachers and replace classroom materials. Following the use of their classrooms, many Beacon staff reported that they check in with teachers to assure that they returned to their classroom the same way they left it. Beacon staff stated that this allows them to communicate with and build rapport with the teachers, which has led to a continued use of their classrooms. In addition, if a teacher reports that an item from their classroom is missing or stolen, the Beacons program would replace that item.
• Utilize space within the community. For Centers that have strong relationships with their community partners, they are often able to utilize their partner’s space to provide programs and services when the school space is not available. One director stated:
The benefits of not being [located] in the school is that we can do things when school is out…It gives us the opportunity to one, not have to go back to school during the break and meet up with the youth so we can do an activity, and two, do different things. Last year for example, [our school] site was closed for the summer due to construction. We moved all our summer programs down to [a community space].

IV-8
space, these challenges, in most cases, were related to changes in school administrators and staff, and conflicting and/or a lack of understanding of Beacon goals.
Changes in School Administration • Changes in school administration and staff at a number of school sites have
made it difficult for Beacon Centers to operate as a community hub. For instance, one Beacon director reported that in the past their Beacon Center received a lot of support from the school principal and staff. The director further explained that the principal was very cooperative and community minded, and understood the goals and purpose of the Beacon Center. In addition, it was mentioned that Beacon Center was included in the school activities, and that the school staff and teachers were very helpful and supportive. However, over the years, as a number of the staff has changed, the new principal has negatively affected the type of support the Center now receives. The director explained that the new principal and staff are less aware of the mission and goals of the Beacon Center, and do not always support the Center in its efforts to serve youth, adults, and the community (e.g. allowing Centers to use classroom space after school and on the weekends, etc.). The director explained:
In the beginning, there was a community of support and understanding of what a Beacons was. And then, all of those folks had left. The new principal did not recreate that or promote it. So, since then, which has been about six years, the relationships is just one of coexisting and indifference…No collaboration whatsoever.
• New school principals and staff do not understand the added-value of being a Beacon Center site nor the goal of drawing participants from other schools. As a result, school administrators and staff at a number of host schools are very resistant to collaborate with the Beacon Center, and are not always cooperative when Beacon staff is attempting to develop and implement programs. Another Beacon director explained:
After a couple of meetings with the principal, I told him what I would like to do at the school through Beacons when we are offering programs to parents and having them there on site, and he was like, ‘No! I don’t want anyone else to come on my campus. Only the kids that go to my school and the parents of the kids that go to my school.
Resistance and restrictions from school administrators and staff have therefore prevented and limited many Beacon Centers from offering a wide range of programs and services to youth, adults, and the community. As a result, many Centers have struggled in achieving program outcomes as they relate to the Quality Standards, such as Engagement and Collaboration, which has ultimately affected their ability to serve as a community hub.

IV-9
Conflicting Goals • New school leaders do not always see the alignment of Beacon Centers’ mission
with their school goals. As stated above, when changes in school administrators and staff occur, much information regarding the mission and goals of Beacons is lost. As a results, goals of the new school administration and the Beacon Center tend to vary, in which Beacon-related activities are not that important to the school administration. Beacon staff therefore expressed some concern in achieving some programs outcomes. One Beacon director explained:
We traditionally got ExCEL and 21st Century funds to support our after school programs. A few years back our principal either had pressure or wanted to create an in-house suspension program, and started talking to the school district about how to make that happen. They unfortunately suggested that he use after school dollars to do that, which he got support to do. It’s over $100,000 a year, which about $50,000 - $60,000 that used to go to after school, then went to the school to pay for a staff person to staff the timeout room.
Unfortunately, situations of this kind have caused Beacon staff to feel unappreciated and overlooked by the school administration and staff. In addition, tension between the Beacons and school staff sometimes arise because Beacon staff feel that they are not included in or considered when major decisions that affect the after school program are made. Some Centers have tried to address these challenges by attending school staff meetings and developing relationship with key school staff. However, Beacon staff expressed that they usually experience these challenges when changes in the school administration occur.
Examples of Promising Practices in Improving Beacon and School Relationship
• Develop close relationships with school administrators and staff. Beacon staff reported this practice as being effective because it allows them to inform the school administrators and staff of the Beacon mission and goals, obtain buy-in, and to convey how the goals of the Beacon Center align with those of the school. Beacon staff has strengthened their relationship with the school administrator and staff by, closely coordinating events, attending staff meetings, having safety and support staff assist the school in maintaining a safe environment, and creating a space where school and Beacon staff can dialogue. For example, one Beacon director stated:
This year we started hosting our first principals’ lunch…where all the principals [from all of our sites] came together and every Beacon staff person was in the room. They talked, introduced themselves and talked about their work. The principals got exposed to the bigger picture of what Beacon was, and several of them were quite surprised and came up with ideas about how all of these other things in the community could help increase the quality of their work whether its during the school day or after school.
IV-10
4. Participant Attendance Requirement Achieving the mandated attendance requirement1 is another challenge experienced by a number of the Beacon Centers. While Beacon directors and staff reported success in achieving attendance at the elementary level, they mentioned a number of concerns with attendance at the middle and high school level. Community violence, transportation, and types of programming were among the common factors that respondents expressed as factors associated with this challenge.
Community Violence
While youth and parent respondents reported Beacon Centers as being a safe haven, many expressed feeling unsafe within the communities they live, and those surrounding the Beacon Centers. As a result, Beacon directors and staff reported community violence as a major factor that contributes to the decreased numbers of participants their Centers are experiencing. Beacon staff from one Center explained that a week prior to the evaluation site visit, a shooting occurred in front of the school, which negatively affected their participation levels that week. One staff member stated, “We just had a shooting here last Monday in front of the school. So a lot of parents are afraid for their kids, and they want to just come grab them until things ease up a little.” In addition, a Beacon director from another site reported the death of a Beacon youth participant to violence a few days prior to another evaluation site visit.
• Community violence has contributed to the dwindling and fluctuating attendance rates that many Beacon Centers experience because many parents fear for the safety of their children and themselves. One parent stated, “Honestly if [Beacons] wasn’t here at this school I wouldn’t have my kids travelling to go somewhere else for the Beacons program…[I like that] they go to school here and they don’t have to leave.” In addition, many parents want their children at home or closer to home when participating in after school activities. One staff member stated:
I can’t underscore this enough, like, parents here want their kids to go home after school. They don’t care if the Beacon is open… [Especially] If you’re coming home and somebody is spraying bullets down on [your street] and up the hill, and you gotta walk. So, [parents] want their kids to come home, and a lot of them want their kids to go to programs that are close to the house.”
Staff from one site explained that for the past eight years, their enrollment/participation rate has dwindled from approximately 700 to a low 300.
1 Beacon Centers are to serve at least 150 participants a day, and 600 or more children and youth, and adult family
members unduplicated per year.
IV-11
While there are other factors that have contributed to this low enrollment/participation rate, Beacon staff reported community violence as being a major factor.
Transportation • Lack of accessible transportation has played a large role in Centers’ ability to
increase participation rates. Since many youth who attend the Beacon Center do not live in the communities where the Beacon Centers are located, a number of youth are forced to use public transportation. Transportation is another factor that affects a participant’s attendance, because a number of youth stated that the primary reason they do not attend the Beacon Center is that it is very far from their home. Youth also mentioned that trains and busses often take a long time to get them home, in which their parents do not always feel comfortable with them arriving home late. In addition, youth stated that they were afraid to wait at the bus stop to go home. One youth expressed, “I don’t want to wait at the bus stop. Anything can happen… [And] It’s dangerous walking home.”
Some parents participating in the parent focus groups were concerned for the safety of their children and do not allow their children to participate in Beacon after school activities. In addition, asking for transportation support from parents, especially those from working families, has been difficult and somewhat futile. One Beacon staff member stated:
One of the main challenges for us is that not all our kids are from this community. Additionally, a lot of parents don’t have cars, and a lot of parents don’t really want their kids to stay after school, and a lot of parents are not from this area.
Consequently, maintaining consistent participation of many youth has been challenging for some Centers because of factors surrounding transportation (e.g. travel, safety, etc.). In addition, Beacon staff reported a decrease in the number of participants at their Centers when changes in daylight savings time occur, especially during the months when it gets darker earlier.
Program Offerings
Interestingly, the range and types of activities Beacon Centers offer also prevent some Centers from achieving the participant attendance requirement. Following are some challenges associated with program offering and participation rates:
• Youth respondents from a number of Centers explained that they wanted to be able to select from a greater range of activities, without being required to formally enroll and commit to a specific program for an entire season or semester. Staff have therefore struggled in getting youth to attend Beacon programs regularly, as well as returning membership forms.

IV-12
• The type of schools that the Beacon Centers draw from affect program offerings and interest in participating. In addition, a staff member from one Center explained that most of their middle school satellite youth are sixth and seventh graders, and attrition of eighth graders has been an issue. This staff member explained that it is sometimes difficult to get youth who are familiar with the middle school Beacon programs to attend the high school Beacons. Even though youth reported a number of benefits from participating in Beacon programs, such as completing their homework and learning how to draw, break dance and cook, many youth did not like the fact that they have to complete school assignments in an after school program. One youth stated, “Why do we have to learn in an after school program, we’re always learning in school.” Youth thus expressed a greater interest in participating in social and recreational activities.
• Centers are challenged to provide more engaging, gender specific programming to increase participation rates among girls. Conversely, while many Centers offer social and recreational activities, a number of youth complained that these activities are more geared towards and dominated by male participants. For instance, male and female youth participants at one Beacon Center were particularly satisfied with the athletic programs that are offered (e.g. soccer, basketball, etc.). However, the female participants emphasized the need for a separate girl’s soccer team and the need for other sports/physical activities that are attractive to girls, such as dance and jump roping. To address this challenge, many Centers have separated and implemented gender-specific programs. However, Beacon directors and staff continually struggle in retaining female and male participants, due to program offerings.
Examples of Promising Practices in Addressing Participant Attendance
• Develop close relationships with parents. Parents who mentioned that the Beacon staff reached out to them (e.g. phone calls, informal conversations, etc.) expressed that they are comfortable with the Beacon staff, and as a result, feel comfortable in allowing their children to attend the Center. In addition, when Beacon staff develops close relationships with parents, parents are reassured that their children are safe while attending Beacons. One parents explained:
The staff is one of the main reason I enrolled my children in Beacons. They welcomed me. I thought that when I was going to come [to Beacons] the staff were going to be stuck up. But no, they welcomed me, they showed me around the facility, they explained the program, you know, they took their time out to make me feel comfortable in having my kids in the program.
• Solicit youth feedback. A number of Centers reported administering surveys and facilitating youth and parent focus groups. These activities have been helpful in allowing staff members to understand what types of programs and activities youth and parents are interested in, as well as effective strategies in implementing those programs.

IV-13
Examples of Promising Practices in Addressing Participant Attendance (cont’d)
• Implement and separate gender-specific programs. This practice has been effective in allowing Centers to engage “hard-to-reach” youth. For instance, one Center hired a consultant to facilitate a support group for girls. A female youth who participated in this group explained that she enjoyed this group because it was a safe place for her to share her personal experiences. In addition, she learned about issues, such as discussions about sexual health, which are helping her to transition into adulthood.
• Be consistent in the level and expectations of programming. Although many youth were resistant to having additional organized activities after school, maintaining a consistent level of expectations for program activities assisted some sites in maintaining a consistent participation level. One Beacon director explained:
If you have a high expectation for the program that you’re offering and how it’s being offered, the kids will follow that and embrace it…if it’s unstructured they become unstructured and tend not to want to do certain things in that particular program.
• Collaborate with anti-violence/gang initiatives. This strategy has allowed Beacon Centers to begin addressing the violent crime and gang activities within their communities. Beacon staff from one Center explained that collaborating with such an initiative has allowed their Center to diminish the talk about gang activity and membership at their Center, while also allowing them to actively recruit youth who want to make a change in their life.
• Implement project-based learning activities. The implementation of project-based learning was a major turning point for one Beacon Center. This change brought in a number of new youth and instigated the Center’s growth and development into what it is today. The direct from this Beacon Center explained:
We were struggling way back when. Around the first year, once we turned our program and created project-based learning as well, we doubled our number and hit basically 140-160 kids a day…Before we were struggling to get eight kids in the program everyday. Before, it was just classroom and homework. You were assigned to a classroom after school and you sat there and did your homework and then you went and played and that was it. The kids were miserable and the teachers were sad.
5. Integrating ExCEL Funds In Chapter 2, we identified the various sources of funding received by the Beacon Centers. However, the requirements of the ExCEL funds have greatly influenced the structure and nature of the Centers’ program operations. To understand the relationship between Beacon-funded activities and other sources of funding, we asked Beacon Directors about the structure and dissemination of Beacon Center funds. Beacon Directors were specifically questioned them
IV-14
about their Center’s ExCEL-funded activities, because in most cases, these funds accounted for large percentage of their program budget. Because ExCEL is a major funding source to the majority of the eight Beacon Centers, Directors explained that the ExCEL funding requirements limit the types of programs they can implement and the participants who they can serve.
Limits Program Offerings and Target Population • ExCEL funding poses difficulty in offering programs outside of its academic
requirements. A number of Beacon directors explained that their host school grants them the primary responsibility of managing the ExCEL funds that they receive from the district. Many directors therefore blend the ExCEL funds with their other sources of funding to support the Beacon Center. While this level of responsibility has given many directors the autonomy to integrate ExCEL-funded activities within the Beacon model, many directors expressed some difficulty in offering programs outside of the ExCEL academic requirements.
• ExCEL requires that Beacon Centers serve only students who are attendees of the host school. In addition, Beacon directors also reported that the ExCEL funding requirements only allow them to serve/count students who are attendees of the host school. This has thus limited many Centers in providing programs and services to adults and the community, which further prevent them in aligning with the community hub model. Additionally, a number of Beacon directors who oversee multiple satellite sites also reported that many of these sites (primarily the elementary sites) tend to follow the ExCEL mandated structure. Beacon staff from one site mentioned that while the Beacon Center provides support to each satellite site, all sites have their own ExCEL grant and are run independently. This has therefore forced this Center to move somewhat away from the community hub model, in an effort to accommodate the funding requirements placed on them by ExCEL.
Examples of Promising Practices in Integrating ExCEL Funds
• Develop collaborative partnerships. Partnering with CBOs has allowed many Centers to receive in-kind services and donations, as well as the option to refer participants to organizations for services the Beacon Center does not provide. These services and donations thus supplement the ExCEL funds, allowing Centers to meet the needs of their target populations.
• Obtain multiple funding sources. This practice has been effective for a number of Beacon Centers, because they are not restricted to the limitations the ExCEL funding requirements place on them. For example, one Center utilizes funds from the Department of Public Health to provide a number of services to not only youth enrolled at a school site, but to the community as well.

IV-15
Conclusion Beacon Centers throughout the San Francisco Beacon Initiative continue to experience a number of challenges that prevent them from aligning with the community hub model. In addition, these challenges have negatively affected some Centers’ ability to achieve specific program outcomes. However, as we will highlighted above, a number of Centers have developed practices that allow them to overcome such challenges. Appendix A also provides a summary of challenges Beacon Centers face in meeting SFBI’s mission of being community hubs and examples of promising practices that addressed these challenges. In the next chapter, we discuss the implication of the challenges described in this chapter and provide the Beacon Center staff’s feedback on the Beacon Theory of Change model and Quality Standards.

This page intentionally left blank.
Insert blank page here when making double-sided copies
` V-1
V. ASSESSMENT OF THE THEORY OF CHANGE, QUALITY STANDARDS AND RECOMMENDATIONS
A major focus of the 2008 Beacon evaluation was to understand the opportunities and costs of Beacons’ growth over the last decade and the extent of mission drift as well as provide recommendations from the Beacon Directors on ways to revise both the San Francisco Beacon Theory of Change (ToC) and the Quality Standards. As described in Chapter 4, the Beacon Centers continue to face some ongoing challenges that impede their ability to meet the Beacon Quality Standards. These include (1) barriers to parent and community engagement; (2) availability of school space; (3) relationship with the host schools, (4) participation requirements; and (5) integration of ExCEL requirements into the original Beacon concepts. These challenges suggest the need to more clearly define and reinforce roles and responsibilities and offer alternatives to meet the quality standards.
In 1997, Community Network for Youth Development (CNYD)—the SFBI intermediary—worked with partners and stakeholders to develop the SF Beacon ToC “to evaluate the quality and impact of Beacon programming, and to ensure the accountability among stakeholders.”1 The San Francisco Beacon ToC model outlined how key outcomes would be achieved at the site, intermediary, and the Initiative levels.2 Key aspects of the ToC model, presented in Exhibit V-1, include a definition of stakeholders roles and a description of multi-level youth, adult/families, school and community outcomes at each Beacon site. Note that the ToC model has not been revised since its initial creation, although there has been some major turnover of a number of leaders and key partners (e.g., CNYD, the SFBI Director, members of the Steering Committee, lead agencies, etc.).
1 San Francisco Beacon Initiative. “ Quality Standards Evaluation: Building Accountability.”
http://www.sfbeacon.org/resources/pp_qualitystandards.html.
2 The site level consists of the Beacon Centers, lead agencies, the host schools, local communities and agencies.
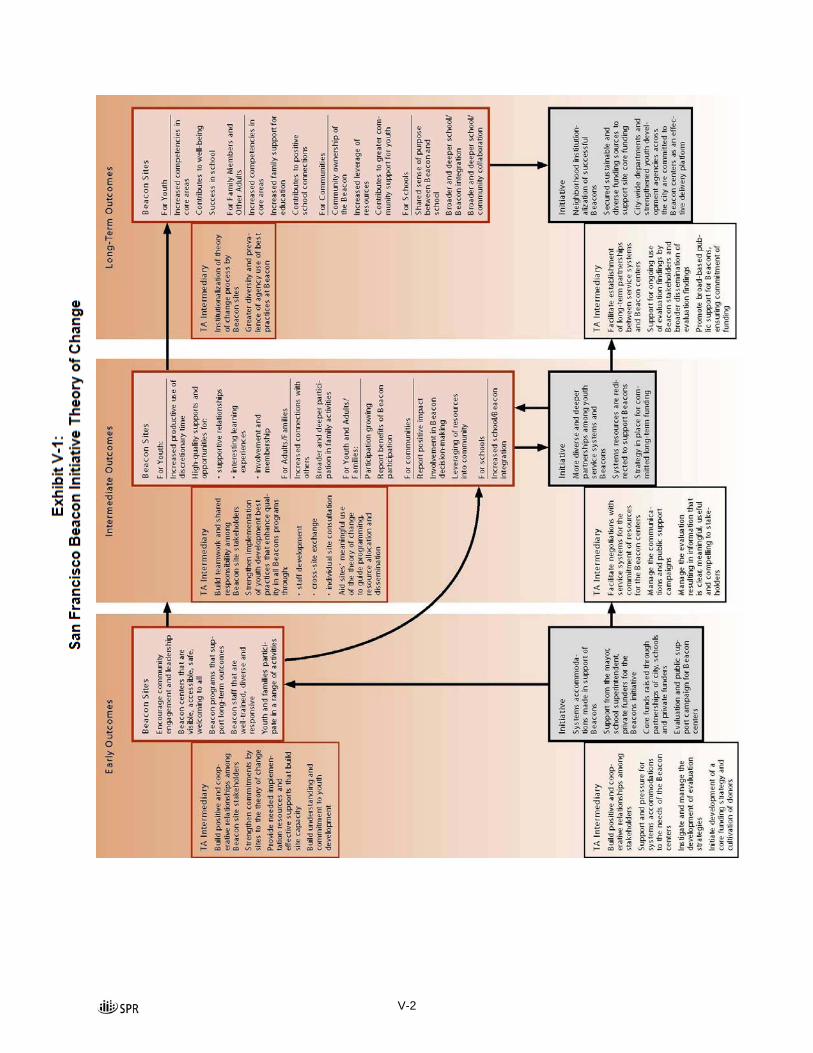
V-2

V-3
Based on the site level outcomes identified in the ToC, Beacon Center directors and staff, Initiative staff, and San Francisco Unified School District (SFUD) representatives finalized the early, intermediate, and long-term quality standards, which were implemented in the fall of 2003. These standards thus “serve as benchmarks for achieving desired outcomes for youth, adults, and the community, and provide a framework for planning and ongoing evaluation.” The following is an overview of the Beacon Quality Standards.
Exhibit V-2: Conceptual Structure of the Beacon Quality Standards
How accurately does the Beacon ToC and Quality Standards reflect the current goals, activities, and outcomes? While the Theory of Change and Quality Standards identify the organizational levels at which specific practices, services, and supports are needed to improve the lives of youth , adults, and the community, it was reported that in the past years, many Beacon Centers have drifted away
V-4
from the original mission. As a result, the SFBI underwent a major strategic planning process between 2007 and 2008, to begin assessing and realigning Beacon Centers with the original mission of serving as a hub of activity for youth, families, and the community. In Chapter 1, we identified five concepts that assisted the SFBI in determining if a Beacon Center is in line with the original mission of serving as a community hub and the various ways in which the Beacon Centers might have drifted away from its original mission.
Assessment of the Theory of Change & Quality Standards
In order to assess the extent of the mission drift, the SPR research team reviewed the ToC model and Quality Standards with Beacon directors and staff from the eight Beacon Centers we visited. These individuals were questioned about the extent to which the ToC model and Quality Standards are an accurate reflection of their center, and ways they felt these documents could be updated. However, although SPR shared these documents in advance of the site visits, a number of Beacon directors and staff mentioned they had not seen the ToC model or Quality Standards in a while, or never knew they existed. Consequently, the SPR research team received a limited amount of information and feedback regarding the effectiveness of these two key guiding Initiative documents.
Nevertheless, once Beacon directors and staff reviewed the ToC model and Quality Standards, many of them expressed that both documents are generally an accurate reflection of what their center is currently doing, and what they are attempting to do. For example, one Beacon director stated:
Most definitely, [our center reflects the Theory of Change model]…What I’ve noticed is that we’re really good at bridging connections. Meaning that we’ll go out and find someone within this community, or outside of this community that will be able to provide a particular service that’s needed.
In addition, a number of Beacon directors and staff reported that they are able to achieve most early, intermediate, and long-term outcomes for youth, such as, safety, accessibility, supportive relationships, meaningful participation and sense of belonging, educational support, and arts and recreation. However, as discussed in Chapter 4, Beacon directors and staff expressed that they continually struggle to engage and involve adults and the community in programming because of a variety of barriers including serving a largely working class and immigrant community, transportation, and the inaccessibility of Beacon space to community members.
On the other hand, while most Beacon directors and staff view the adult and community outcomes as a challenge, many expressed that they are happy to have a comprehensive ToC model that is inclusive of the whole community, and not just youth. One Beacon director
V-5
expressed that in the past, their center primarily focused on implementing programs and services that targeted youth. Yet, being more aware of the outcomes included within the ToC model and early, intermediate, and long-term Quality Standards, they are more intentional and comprehensive when developing and implementing programs.
Recommendations for the Theory of Change
While most Beacon directors and staff stated that the ToC model is an accurate reflection of outcomes that they are trying to achieve at the Beacon site-level, there were a few elements that these individuals reported as missing from the ToC model. More specifically, the roles and responsibilities of Initiative-level leadership, while well laid out, do not accurately reflect who is or who needs to be responsible for ensuring that some cross-site activities happen. The following are suggestions of how the ToC model can better assist Beacon Centers in achieving their outcomes.
• Develop more clarity around the roles of key leaders within the Beacon governance structure. When the ToC was developed, it did not specify that there would be an initiative-wide governance body, a role that the steering committee took on. While the role of the Steering Committee is not explicitly specified within the ToC, this group, with its diverse representation of city departments, private foundations, lead agencies, and Beacon Centers, has some key governance functions. This group has and continues to play a critical role in working to bring about systems accommodation and support and garner financial and other support from city departments and school district leaders. For example, although an MOU has been developed between the school district and Beacon Centers, ongoing access to adequate facilities continues to be a major challenge for many of the Beacon Centers.
• Expand and standardize the role of the lead agencies. In Chapter 2, we discussed the major roles and responsibilities of the lead agencies, in which Beacon directors and staff reported providing assistance with fiscal sponsorship, fiscal management, administrative oversight, and human resources as being lead agencies’ major functions. However, these lead agencies vary considerably with respect to their mission and their relationship with the respective Beacon Centers. When reviewing the ToC, the “Lead Agencies” are subsumed under Beacon sites; however, they are not responsible for many of the functions listed. SFBI and Beacon directors and staff suggested that the role of the lead agency be explicitly defined, expanded (e.g., around staff development) and standardized, so that Beacon Centers and SFBI can hold the lead agencies accountable and build on their youth development and community building expertise.
• Given that there has been no replacement of CNYD, specify and who should play the role of the TA Intermediary and how to fully support and resource the “TA Intermediary” functions. The ToC included the roles of the TA intermediary, which was formerly the role of CNYD. However, since CNYD is
V-6
no longer a part of the Initiative, the SFBI Director has assumed some of the intermediary roles. It is not possible, though, for SFBI’s small staff to take on all of these responsibilities. Beacon directors and staff feel that the ToC needs to be updated to include which stakeholder is responsible for fulfilling these intermediary roles. For example, in the past, CNYD has been instrumental in building cooperative relationships among Beacon site stakeholders and building sites’ understanding, commitment, and institutionalization of the ToC. Beacon Directors identified these areas as major gaps not currently being filled. Further, Beacon program directors who we interviewed expressed a great need for more staff development and cross-site exchanges of best practices. (See Exhibit V-3 for areas within the ToC Model that need further development or clarification.)
• Strengthen and support the role of SFBI Director and staff. Beacon Center leaders appreciate the multiple roles and value of the SFBI leadership and have a clear vision for how SFBI can best support them in their work. Their vision expands upon SFBI’s current responsibilities in the ToC, particularly building on the SFBI Director’s role as a consistent and dedicated leader to the initiative who can access other systems leaders and represent the Beacon Centers’ concerns and needs. Below are recommendations as to how the SFBI can further support Beacon Centers:
− Visioning and goal setting. Consistent with the current ToC, Beacon Centers reported that it was SFBI’s major responsibility to provide an overall vision and clearly delineate goals for the Beacon Centers.
− Coordinating relationships with SFUSD. Particularly because of the sometimes tumultuous relationship that some Beacon Centers have with their host schools, staff reported that SFBI should work more closely with SFUSD and expand the current MOU to ensure that there is a widespread understanding and buy-in of Beacon goals and mission as well as what is expected of host schools throughout the district. More importantly, Beacon Centers need more support in host schools cooperation and compliance of the MOU to ensure adequate space for programming and positive cooperation among principals and teachers.
− Fundraising. Staff at Beacon Center leaders also suggested that SFBI should not only secure funding for the Initiative as a whole, but assist individual Beacon Centers in finding funding sources as well by facilitating conversations with funders.
− Staff training. To fill the void left by CNYD, Beacon Center directors look to SFBI to offer training for all directors and line staff to ensure that training and protocols, such as for a school lockdown, are consistent across sites.
− Linking Beacon Centers and creating opportunities for cross-site exchanges. Although each Beacon Center operates in a unique

V-7
neighborhood with unique participants, the work that they do does not have to occur in silos. Many sites reported that they could benefit from having more contact with other Beacon Centers, and that SFBI should facilitate these connections. Staff reported that sharing best practices, recommendations around effective programming approaches, and information on youth who may have attended another Beacon Center for a short period of time would be beneficial. Appendix A include promising practices which address major challenges faced by sites.
Generally, Beacon Center leaders expressed that in updating the ToC model, each stakeholder will be better aware of their unique role in assisting the Beacon Center in achieving their short-term, intermediate, and long-term outcomes. In addition, at the heart of much of the Beacon directors feedback is that more support is needed from Initiative-level leaders to continue to shore up and expand the policy, systems, and cross-site support infrastructure so that Beacon directors can focus on youth and community engagement. Beacon directors suggest that they spend much time struggling with systemic issues over which they have no control

` V-8
Exhibit V-3.: SF Beacon Theory of Change Revisited

` V-9
Assessment and Recommendations for the Quality Standards We examined each Center’s overall compliance with quality standards, and consistent with the challenges identified in Chapter 4, the standards with the lowest rates compliance rates were those that have to do with accessibility and participation.
Exhibit V-4. Standards with the Lowest Rates of Compliance
ACCESSIBILITY
Met
In Progress
Not Met
Waiver Requested
1) Beacon Centers are open and offer programs weekday afternoons during the school calendar until 8 PM.
5 2 1
2) Beacon Centers are open and offer programs at least one Saturday per semester, or a total of 8 hours on Saturdays, during the school calendar year.
7 1
3) Beacon Centers are open and offer programs or activities during major breaks in the school calendar: winter/spring break. 3
5/7 2/7
5) Beacon Centers offer at least eighty percent (80%) of programming at the primary site or host school.
5/7 1/7 1/7
6) Beacon Center serves neighborhood youth not attending the host school.
5/7 1/7 1/7
PARTICIPATION
Met
In Progress
Not Met
Waiver Requested
1) The Beacon Center serves children and youth and adult family members from the school community and surrounding neighborhood.
7 1
2) Beacon Center serves 600 or more children and youth and adult family members unduplicated, per year.
4 3 1
3) The Beacon Center serves at least 150 participants a day.
6 2
Not surprisingly, the standard with the lowest rate of compliance is the requirement that Beacon Centers serve 600 or more children, youth and adult family members unduplicated, per year.

V-10
However, we were also surprised, given how widely the issue of availability of school space was cited and discussed, that the (self-reported) rate of compliance for coordination with school to use site facilities had all 8 of 8 centers reported meeting compliance standards. This suggested a level of over reporting compliance.
Recommendations for Changes in the Quality Standards
Similar to the ToC model, Beacon directors and staff also provided information as to what Quality Standards are not relevant and underdeveloped, and provided suggestions as to how the Quality Standards can better assist their center in implementing programs and achieving outcomes.
Early Outcome Standards • Participation. As mentioned in Chapter 4, community violence and
transportation were two factors that Beacon staff reported as contributing to the participation standard being a challenge. As a result, Beacon staff expressed that the requirement for each center to serve 600 unduplicated participants is not relevant for each center. For instance, one Beacon director stated:
We’re really struggling with our participation piece for the middle school component, in getting more youth in the door…The San Francisco Beacon Initiative wants us to serve 600 constituents a year with a strong emphasis on young adolescents. [This is hard for us] because we have so many youth that are located in so many different middle schools…and we have no major middle schools throughout our area.
While several centers reported achieving participation numbers just under the 600 requirement, three of the eight centers reported they were in progress of achieving this standard, and one center applied for a waiver.4 Beacon staff therefore expressed that this standard be modified to meet the realistic numbers that each center serves, with factors associated with participant attendance taken into account.
Intermediate Outcome Standards • Youth Involvement with the Community. Beacon staff from one center reported
that this standard is underdeveloped for their center because youth in the program are from different communities throughout San Francisco. They have therefore found it difficult to engage youth in a community where they do not live. As a result, “community” for this center has meant the after school community at the
3 Richmond’s answers were missing for accessibility standards #3, 5 and 6.
4 This information is based on the December 4, 2007 “Compliance Standards for Beacon Center Host Schools” assessment tool that each Beacon Center completed.

V-11
school their center is located. The center therefore attempts to involve youth and get them thinking about ways to improve their school and afterschool community. The Beacon director stated:
For us in the past, when we said community, it meant the afterschool community. That’s why we do “community” time. That’s our time, because we are that community. We don’t live here, but we go to school here and we go to an after school program here. So, what can we do to help our after school community.
The director therefore expressed that this standard could be improved by providing a definition of what is meant by “community,” and how it can pertain to each individual center.
Additions to the Quality Standards
Since a number of Beacon directors and staff were not fully knowledgeable of the ToC model and Quality Standards prior to the evaluation, we did not receive a substantial amount of information regarding changes to the model or early, intermediate, and long-term standards. However, many respondents mentioned a number of elements that were missing from the Quality Standards and provided suggestions as to what standards and information should be included:
• Provide more clarity on expectations for particular outcomes standards. While many Beacon directors and staff were clear on the standards their center is required to achieve, many expressed that they would like information on how these standards are measured so they can asses the extent to which their center is achieving those standards. For instance, most Beacon directors and staff discussed the career development standard as being underdeveloped at their center. In developing programs and activities around this standard, Beacon staff expressed that they would like to be aware of what is required of them as a center when offering career development services. One director stated.
[What we need to provide this service] is a basic understanding of when we do career development what is required of us, and what is required of participants to actually use this service.
• Create more specific standards. In addition to clarifying how outcomes are to be measured, Beacon staff stated that some standards are in need of sub-standards. For instance, while health is included as a standard for Increased Youth Competencies in Core Areas, it was mentioned that this standard could be expanded to include more specific standards of mental, physical, and/or sexual health. A number of Beacon staff reported that their centers need to emphasize physical and mental health more, and felt that including specific sub-standards will provide a clearer definition of the broad standards.
• Increase host schools’ accountability. In Chapter 4, we mentioned a number of factors that have negatively affected the Beacon Centers relationship with their host school. Since Engagement and Collaboration is included as a Quality
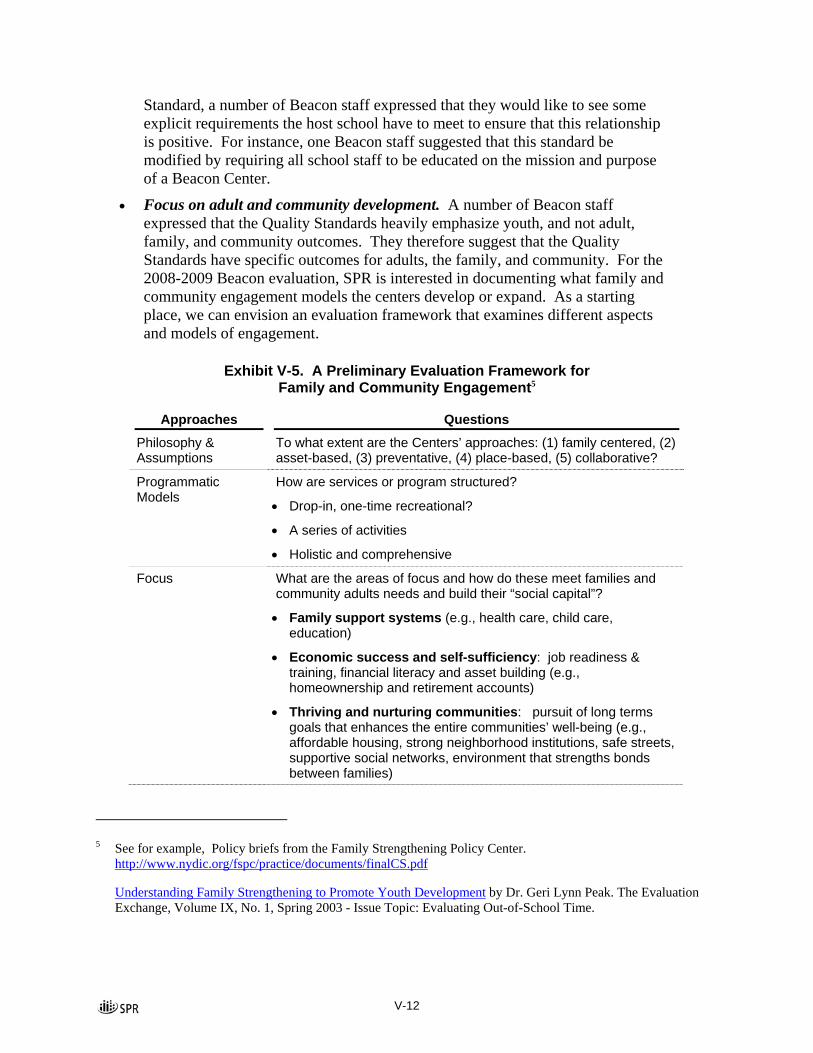
V-12
Standard, a number of Beacon staff expressed that they would like to see some explicit requirements the host school have to meet to ensure that this relationship is positive. For instance, one Beacon staff suggested that this standard be modified by requiring all school staff to be educated on the mission and purpose of a Beacon Center.
• Focus on adult and community development. A number of Beacon staff expressed that the Quality Standards heavily emphasize youth, and not adult, family, and community outcomes. They therefore suggest that the Quality Standards have specific outcomes for adults, the family, and community. For the 2008-2009 Beacon evaluation, SPR is interested in documenting what family and community engagement models the centers develop or expand. As a starting place, we can envision an evaluation framework that examines different aspects and models of engagement.
Exhibit V-5. A Preliminary Evaluation Framework for Family and Community Engagement5
Approaches Questions
Philosophy & Assumptions
To what extent are the Centers’ approaches: (1) family centered, (2) asset-based, (3) preventative, (4) place-based, (5) collaborative?
Programmatic Models
How are services or program structured?
• Drop-in, one-time recreational?
• A series of activities
• Holistic and comprehensive
Focus What are the areas of focus and how do these meet families and community adults needs and build their “social capital”?
• Family support systems (e.g., health care, child care, education)
• Economic success and self-sufficiency: job readiness & training, financial literacy and asset building (e.g., homeownership and retirement accounts)
• Thriving and nurturing communities: pursuit of long terms goals that enhances the entire communities’ well-being (e.g., affordable housing, strong neighborhood institutions, safe streets, supportive social networks, environment that strengths bonds between families)
5 See for example, Policy briefs from the Family Strengthening Policy Center.
http://www.nydic.org/fspc/practice/documents/finalCS.pdf
Understanding Family Strengthening to Promote Youth Development by Dr. Geri Lynn Peak. The Evaluation Exchange, Volume IX, No. 1, Spring 2003 - Issue Topic: Evaluating Out-of-School Time.

V-13
These recommendations suggest that a logical next step is for the SFBI Director to engage the Steering Committee, Beacon directors, and other key systems leaders in a conversation to not only clarify and expand the ToC, but also to develop ways to ensure that the operational goals of Beacon Centers are realized.
Recommendations for Improved Data Collection The data collection system for the Beacon sites need considerable improvement to make any conclusion about the impacts of the Beacon Centers on youth, families, school, and community outcomes. Our overarching recommendation is the following:
• SFBI and Beacon Centers need to invest more time and energy to improve the (1) accessibility of the district data of students; (2) accuracy and usability of the CMS data; and (3) redesign of the youth surveys to improve their validity. Exhibit V-6 below provides more specifics for each of these data collection areas.
Exhibit V-6: Data Collection and Evaluation Recommendations
Accessing and Securing District Data • Ensure that Beacons administer properly worded permission slips that allow access to students’ district
data files including test scores, grade data, attendance, disciplinary action.
• Obtaining timely comparison group data from the SFUSD early in the program year.
Accurate and Usable CMS Data • Train Beacon staff to do correct and thorough data entry of information on youth and adult participation.
• Ensure student’s grade level and school where student is enrolled are required fields.
• Have Beacon Directors or lead agencies review data periodically for clean, consistent, and accurate information.
• Develop a field that easily identifies participants’ activities location (participation at the hub vs. satellite sites)
• Ensure unique Client IDs (e.g., district HO numbers) for each Beacon participant.
• Have Beacon centers linked and use the same ID codes so that participants can be tracked from one center to another and from summer to school year sessions.6
• Consider further focusing evaluation indicators of success to assure alignment with the Theory of Change, the Quality Standards, and SFUSD’s outcome goals. See Appendix C, for example of indicators of a “Beacon Scorecard.”
6 This poses a problem in trying to estimate the dosage effect because there may be multiple records for a given
participant, especially if he or she attends different Beacon Centers during the school year.
V-14
Exhibit V-6: Data Collection and Evaluation Recommendations (cont’d)
Improving the Validity of the Survey(s) • Re-vamp pre- post survey so that it is more concise and better tracks to the expected outcomes of
Beacon participation.
• Encourage Centers cooperation in administering true pre- post- test and satisfaction survey to improve response rates so as to maximize the matching of pre- post- test surveys.
• Consider further focusing evaluation indicators of success to assure alignment with the Theory of Change, the Quality Standards, and SFUSD’s outcome goals. See Appendix C, for example of indicators of a “Beacon Scorecard.”
• Prioritize administration of surveys at hub sites because these sites are considered the core of Beacon services.
Conclusion While few Beacon directors and staff were not that familiar with the Theory of Change model and Quality Standards, many of them reported that the model serves as a great tool in guiding their center toward aligning with the community hub model. In addition, many Beacon directors and staff provided insightful suggestions as to how these models can be improved to better assist their center in achieving outcomes and in planning and implementing programs. In this chapter, we shared many of these recommendations, and lay some initial groundwork to better prepare for the 2008-2009 evaluation, with a stronger focus on family and community engagement.
APPENDIX A: Promising Practices and Innovative Programming

This page intentionally left blank.
Insert blank page here when making double-sided copies

A-1
Appendix A: Promising Practices and Innovative Programming
The following is a summary of challenges Beacon Centers face in meeting SFBI’s mission of being community hubs and examples of promising practices that addressed these challenges. These were also challenges cited in Centers’ ability to meet the Quality Standards.
Challenge Promising Practices
Parent/Community Engagement • Location of Beacon Center
• Working Class Families
• Immigrant Families
• Develop close relationships with parents and community partners
• Assure easy access to programs and services
• Provide programs that cater to the needs of parents and the community
• Provide parents with supportive services
• Solicit parent/community feedback and involvement in decision-making
• Disseminate Beacon information in multiple forms
Availability of School Space • Cooperation of Teachers
• Construction at School Sites
• Develop close relationships with school administrators, staff, and stakeholders
• Check in with teachers and replace classroom materials
• Utilize space within the community
Relationship with Host School • Changes in School Administration
• Conflicting Goals
• Build relationships with school administrators and staff
Participant Attendance Requirement • Community Violence
• Transportation
• Program Offerings
• Develop close relationships with parents
• Separate and implement gender-specific programs
• Solicit youth feedback
• Be consistent in the level and expectations of programming
• Collaborate with anti-violence/gang initiatives
Integrating ExCEL Funds • Limits Program Offerings
• Limits Target Population
• Develop collaborative partnerships
• Obtain multiple funding sources

This page intentionally left blank.
Insert blank page here when making double-sided copies

APPENDIX B: Compliance Standards for Beacon Centers

This page intentionally left blank.
Insert blank page here when making double-sided copies

Quality Standards Revised: 5/7/03 B-1
Appendix B. Compliance Standards
for Beacon Centers
Compliance Standards Results for 2007
Legend
IP = In Progress WR = Waiver Requested
Bayview = BV
Chinatown = CBC
Mission = MBC
OMI-Excelsior – OMI
Richmond – RM
Sunset – SBNC
Visitacion Valle – VV
Western Addition -
WA

Quality Standards Revised: 5/7/03 B-2
SAFETY Met IP Not WR Met 1) Beacon Center policies and procedures are in place to protect the safety _7-8_ _1-8 __ ___ ___ and health of youth participants. (docs) VV 2) All staff (including subcontractor and partner CBO staff) and volunteers have been fingerprinted and cleared required background checks. (docs) _8-8_ ___ ___ ___ 3) All youth participants have a fully completed and up-to-date emergency and medical information form, including release for treatment, on file at the _8-8_ ___ ___ ___ Beacon Center. These forms are accessible by supervising staff, and are in the possession of staff on all off-site outings. (docs) 4) All youth participants have a fully completed and up-to-date parent/caregiver permission form, granting signed permission to: _8-8_ __ ___ ___
• Participate in the program; • Participate in program evaluation; • release photos/video that include participants; and • leave the program site for site sponsored and supervised outings. (docs)
5) Beacon Center has in place a safety and support plan developed in accordance with SFUSD criteria. (docs) _8-8_ __ ___ ___ 6) Beacon Center has a system of knowing where youth participants _7-8_ _1-8__ ___ ___ are during program hours and ensuring that youth participants are always WA supervised by an adult. (docs) 7) Youth participant’s arrival is supervised. _8-8_ ___ ___ ___ 8) Youth participant’s departure is supervised. _8-8_ ___ ___ ___ 9) Beacon Center has a clearly delineated entrance. _7-8_ __ 1-8__ ___ CBC 10) TB Tests have been conducted for all employees, partners and _7-8_ _1-8__ ___ WA sub-contractors who work with or volunteer at any school sites. (docs)
ACCESSIBILITY Met IP Not WR Met 1) Beacon Centers are open and offer programs weekday afternoons during _5-8_ _2-8__ _1-8 __ the school calendar until 8 PM. WA,MBC CBC 2) Beacon Centers are open and offer programs at least one Saturday per _7-8_ ___ _1-8__ ___ semester, or a total of 8 hours on Saturdays, during the school calendar year. CBC 3) Beacon Centers are open and offer programs or activities during major breaks in the school calendar: winter/spring break. _5-7_ __ _2-7_ ___
CBC,WA 4) Beacon Centers are open and offer programs during the summer months,
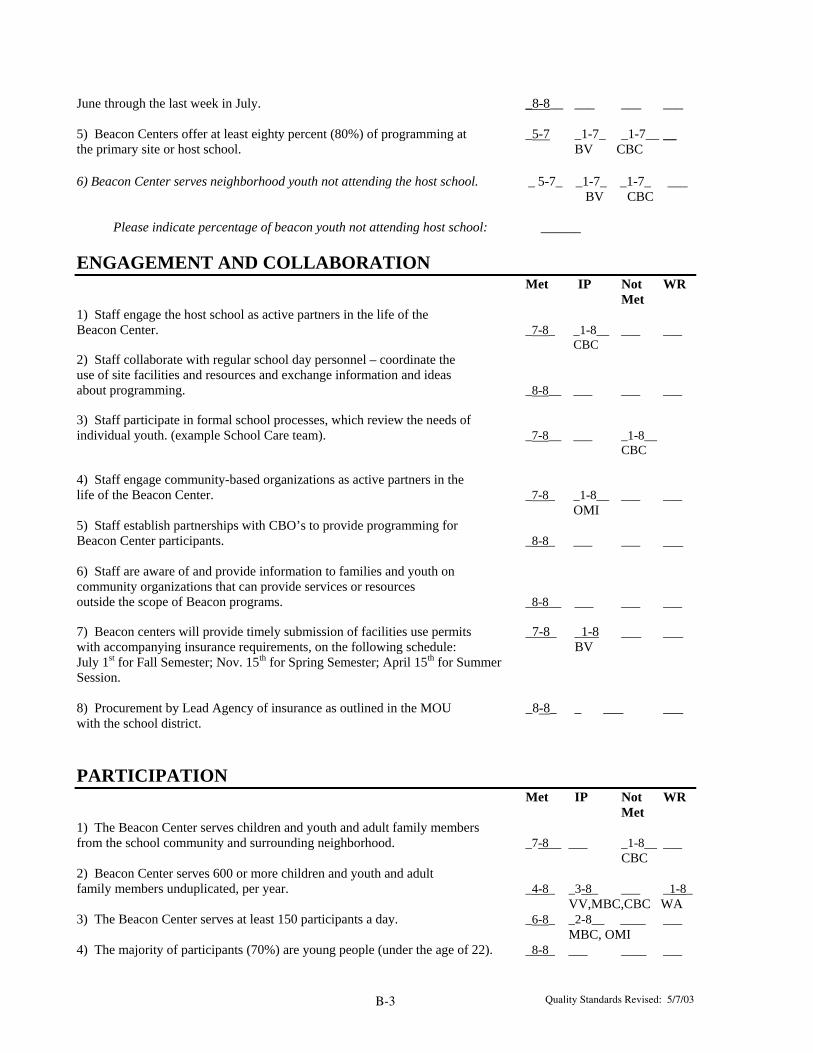
Quality Standards Revised: 5/7/03 B-3
June through the last week in July. _8-8__ ___ ___ ___
5) Beacon Centers offer at least eighty percent (80%) of programming at _5-7 _1-7_ _1-7__ __ the primary site or host school. BV CBC 6) Beacon Center serves neighborhood youth not attending the host school. _ 5-7_ _1-7_ _1-7_ ___ BV CBC Please indicate percentage of beacon youth not attending host school: ______ ENGAGEMENT AND COLLABORATION Met IP Not WR Met 1) Staff engage the host school as active partners in the life of the Beacon Center. _7-8_ _1-8__ ___ ___ CBC 2) Staff collaborate with regular school day personnel – coordinate the use of site facilities and resources and exchange information and ideas about programming. _8-8__ ___ ___ ___ 3) Staff participate in formal school processes, which review the needs of individual youth. (example School Care team). _7-8__ ___ _1-8__ CBC 4) Staff engage community-based organizations as active partners in the life of the Beacon Center. _7-8_ _1-8__ ___ ___ OMI 5) Staff establish partnerships with CBO’s to provide programming for Beacon Center participants. _8-8_ ___ ___ ___ 6) Staff are aware of and provide information to families and youth on community organizations that can provide services or resources outside the scope of Beacon programs. _8-8__ ___ ___ ___ 7) Beacon centers will provide timely submission of facilities use permits _7-8_ _1-8 ___ ___ with accompanying insurance requirements, on the following schedule: BV July 1st for Fall Semester; Nov. 15th for Spring Semester; April 15th for Summer Session. 8) Procurement by Lead Agency of insurance as outlined in the MOU _8-8_ _ ___ ___ with the school district. PARTICIPATION Met IP Not WR Met 1) The Beacon Center serves children and youth and adult family members from the school community and surrounding neighborhood. _7-8__ ___ _1-8__ ___ CBC 2) Beacon Center serves 600 or more children and youth and adult family members unduplicated, per year. _4-8_ _3-8_ ___ _1-8_ VV,MBC,CBC WA 3) The Beacon Center serves at least 150 participants a day. _6-8_ _2-8__ ____ ___ MBC, OMI 4) The majority of participants (70%) are young people (under the age of 22). _8-8_ ___ ____ ___
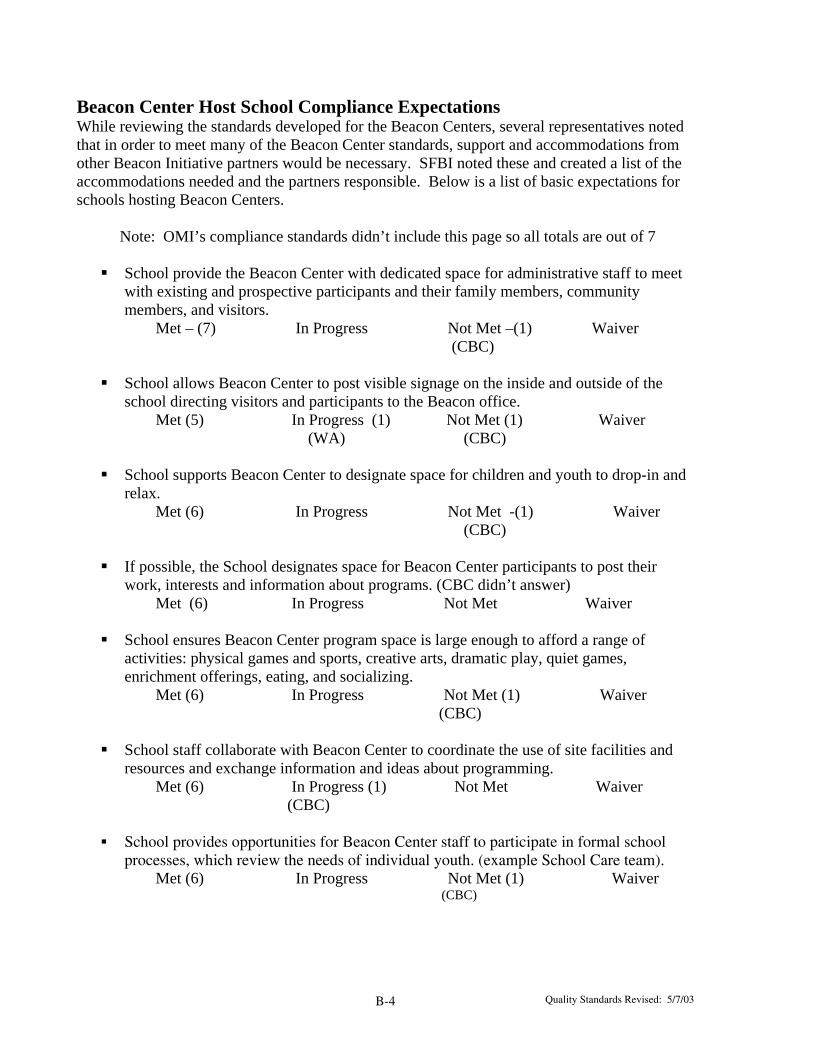
Quality Standards Revised: 5/7/03 B-4
Beacon Center Host School Compliance Expectations While reviewing the standards developed for the Beacon Centers, several representatives noted that in order to meet many of the Beacon Center standards, support and accommodations from other Beacon Initiative partners would be necessary. SFBI noted these and created a list of the accommodations needed and the partners responsible. Below is a list of basic expectations for schools hosting Beacon Centers. Note: OMI’s compliance standards didn’t include this page so all totals are out of 7
School provide the Beacon Center with dedicated space for administrative staff to meet with existing and prospective participants and their family members, community members, and visitors.
Met – (7) In Progress Not Met –(1) Waiver (CBC)
School allows Beacon Center to post visible signage on the inside and outside of the school directing visitors and participants to the Beacon office.
Met (5) In Progress (1) Not Met (1) Waiver (WA) (CBC)
School supports Beacon Center to designate space for children and youth to drop-in and relax.
Met (6) In Progress Not Met -(1) Waiver (CBC)
If possible, the School designates space for Beacon Center participants to post their work, interests and information about programs. (CBC didn’t answer)
Met (6) In Progress Not Met Waiver
School ensures Beacon Center program space is large enough to afford a range of activities: physical games and sports, creative arts, dramatic play, quiet games, enrichment offerings, eating, and socializing.
Met (6) In Progress Not Met (1) Waiver (CBC)
School staff collaborate with Beacon Center to coordinate the use of site facilities and resources and exchange information and ideas about programming.
Met (6) In Progress (1) Not Met Waiver (CBC)
School provides opportunities for Beacon Center staff to participate in formal school processes, which review the needs of individual youth. (example School Care team).
Met (6) In Progress Not Met (1) Waiver (CBC)

APPENDIX C: Sample Beacon Scorecards

This page intentionally left blank.
Insert blank page here when making double-sided copies
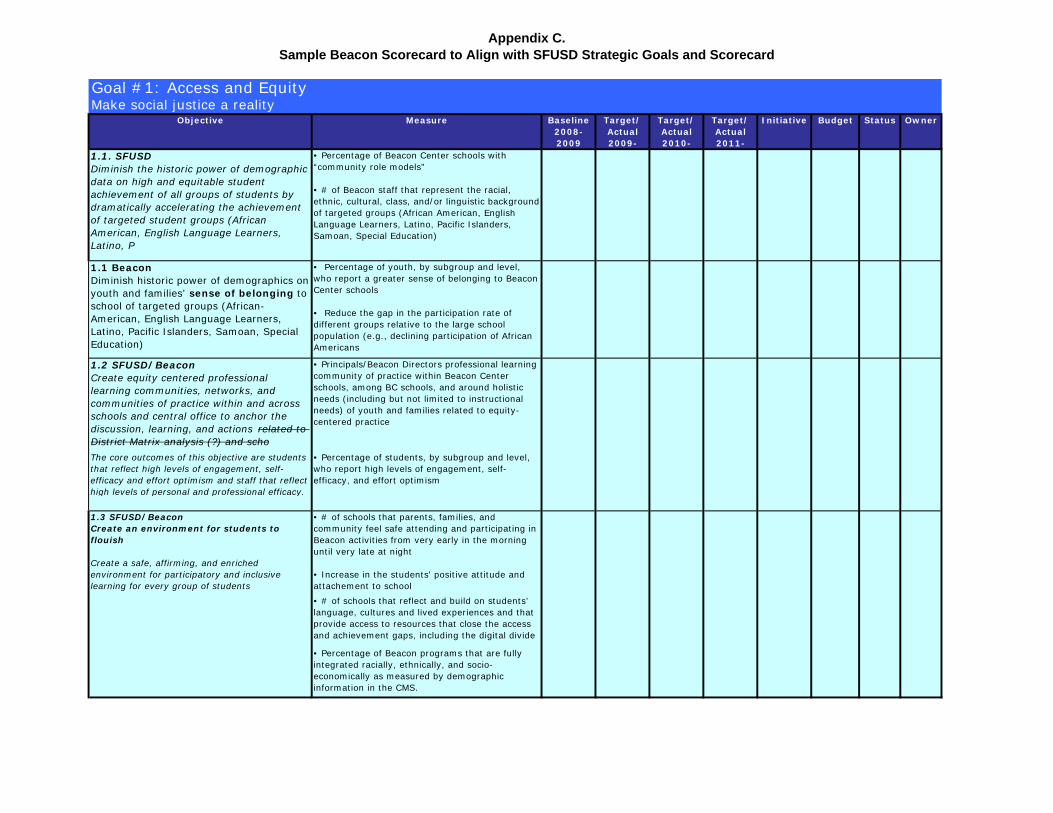
Appendix C.Sample Beacon Scorecard to Align with SFUSD Strategic Goals and Scorecard
Goal #1: Access and EquityMake social justice a reality
Objective Measure Baseline 2008-2009
Target/Actual 2009-
Target/Actual 2010-
Target/Actual 2011-
Initiative Budget Status Owner
1.1. SFUSD Diminish the historic power of demographic data on high and equitable student achievement of all groups of students by dramatically accelerating the achievement of targeted student groups (African American, English Language Learners, Latino, P
• Percentage of Beacon Center schools with “community role models”
• # of Beacon staff that represent the racial, ethnic, cultural, class, and/or linguistic background of targeted groups (African American, English Language Learners, Latino, Pacific Islanders, Samoan, Special Education)
1.1 Beacon Diminish historic power of demographics on youth and families’ sense of belonging to school of targeted groups (African-American, English Language Learners, Latino, Pacific Islanders, Samoan, Special Education)
• Percentage of youth, by subgroup and level, who report a greater sense of belonging to Beacon Center schools
• Reduce the gap in the participation rate of different groups relative to the large school population (e.g., declining participation of African Americans
1.2 SFUSD/Beacon Create equity centered professional learning communities, networks, and communities of practice within and across schools and central office to anchor the discussion, learning, and actions related to District Matrix analysis (?) and scho
• Principals/Beacon Directors professional learning community of practice within Beacon Center schools, among BC schools, and around holistic needs (including but not limited to instructional needs) of youth and families related to equity-centered practice
The core outcomes of this objective are students that reflect high levels of engagement, self-efficacy and effort optimism and staff that reflect high levels of personal and professional efficacy.
• Percentage of students, by subgroup and level, who report high levels of engagement, self-efficacy, and effort optimism
1.3 SFUSD/BeaconCreate an environment for students to flouish
Create a safe, affirming, and enriched environment for participatory and inclusive learning for every group of students
• # of schools that parents, families, and community feel safe attending and participating in Beacon activities from very early in the morning until very late at night
• Increase in the students' positive attitude and attachement to school
• # of schools that reflect and build on students’ language, cultures and lived experiences and that provide access to resources that close the access and achievement gaps, including the digital divide
• Percentage of Beacon programs that are fully integrated racially, ethnically, and socio-economically as measured by demographic information in the CMS.
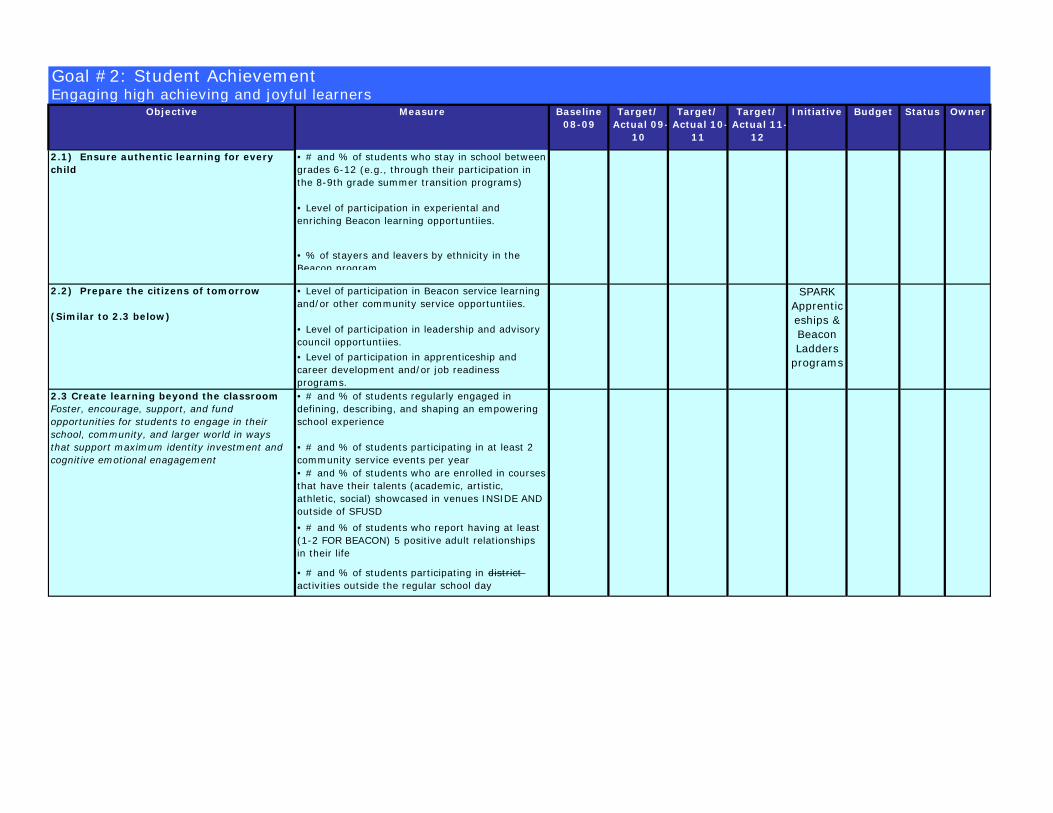
Goal #2: Student AchievementEngaging high achieving and joyful learners
Objective Measure Baseline 08-09
Target/Actual 09-
10
Target/Actual 10-
11
Target/Actual 11-
12
Initiative Budget Status Owner
2.1) Ensure authentic learning for every child
• # and % of students who stay in school between grades 6-12 (e.g., through their participation in the 8-9th grade summer transition programs)
• Level of participation in experiental and enriching Beacon learning opportuntiies.
• % of stayers and leavers by ethnicity in the Beacon program.
2.2) Prepare the citizens of tomorrow
(Similar to 2.3 below)
• Level of participation in Beacon service learning and/or other community service opportuntiies.
• Level of participation in leadership and advisory council opportuntiies.
• Level of participation in apprenticeship and career development and/or job readiness programs.• # and % of students regularly engaged in defining, describing, and shaping an empowering school experience
• # and % of students participating in at least 2 community service events per year• # and % of students who are enrolled in courses that have their talents (academic, artistic, athletic, social) showcased in venues INSIDE AND outside of SFUSD
• # and % of students who report having at least (1-2 FOR BEACON) 5 positive adult relationships in their life
• # and % of students participating in district activities outside the regular school day
2.3 Create learning beyond the classroomFoster, encourage, support, and fund opportunities for students to engage in their school, community, and larger world in ways that support maximum identity investment and cognitive emotional enagagement
SPARK Apprenticeships & Beacon Ladders
programs

Goal #3: AccountabilityKeep our promise to students and families
Objective Measure Baseline 08-09
Target/Actual 09-
10
Target/Actual 10-
11
Target/Actual 11-
12
Initiative Budget Status Owner
3.1 SFUSD Provide direction and strategic leadershipEstablish an accountability system for all stakeholders that aligns all policies, practices, and programs/staff evaluations to SFUSD’s strategic goals and objectives so that the promise to educate every student well is honored
• Completion of milestones for development and implementation of Beacon Center School within larger district-wide performance management system based on shared goals, objectives and measures of BSC2/Beacon and scorecards (starting with senior leadership to site-level leaders, Beacon Director & Principal, that engage in regular planning, assessment, and implementation)
3.1 SFUSD Provide direction and strategic leadershipEstablish an accountability system for all stakeholders that aligns all policies, practices, and programs/staff evaluations to SFUSD/Beacon strategic goals and objectives so that the promise to provide the rich and varied supports and opportunities necessary for the holistic development of every young person from childhood through adolescence to adulthood is
• Revised MOU with necessary pre-conditions for meeting goals and objectives present.
3.2 SFUSD/Beacon Create the culture of service and support
• % of YOUTH rating their teachers, principals, BEACON STAFF and schools as supportive to their academic and/OR social advancement• % of principals AND BEACON LEADERS who report central office as responsive and supportive
• % of Beacon Leaders who report principals as responsive and supportive and vice versa
• # and % of parents rating the culture of Beacon Center schools as supportive and service-oriented
• % Attendance of at least one parent meeting or event.• % of Beacon Centers who consistently meet the quality standards on safety, accessibility, visibility, welcoming, diverse and well-trained staff• % of Beacon Centers that consistently meet the quality standards on diverse and well-trained staff• % of Beacon Centers that consistently meet the quality standards on engagement and collaboraiton• % of Beacon Centers that consistently meet the quality standards on comprhensive programming• % of Beacon Centers that consistently meet the quality standards on participation.

This page intentionally left blank.
Insert blank page here when making double-sided copies

APPENDIX D: Analyses of Selected Attendance by Grade Level

This page intentionally left blank.
Insert blank page here when making double-sided copies

D-1
Appendix D: Analyses of Selected Attendance by Grade Level
The following exhibits display the means of selected attendance categories by grade level and the results of a statistical test of the effect of grade level on attendance for youth at hub sites during the Summer of 2007 and the 2007-2008 School Year.1
Hub Youth Participation – Attendance Breakdown by Grade Level for Summer 2007
Grade Level Mean Elementary2 Middle Number of Days Attended Elementary 23.14 - Middle 18.09 *** - High 19.53 *** NS Number of Days Attended per Week of Attendance Elementary 3.78 - Middle 3.40 *** - High 3.16 *** * Hours in Group Activities Elementary 93.35 - Middle 87.33 NS - High 78.53 NS NS Hours in Group Activities per Day Elementary 3.84 - Middle 4.20 NS - High 4.04 NS NS
NS Not Significant * p < 0.05 ** p < 0.01 *** p < 0.001
1 An analysis of variance showed that the effect of grade level was significant during the Summer 2007 for the
number of days attended and the average number of days per weeks attended. Post hoc analyses using a Tukey HSD test were conducted to determine which grade levels differed significantly.
2 The information in “elementary” and “middle” columns are included so that the significance of each paired comparison can be displayed.
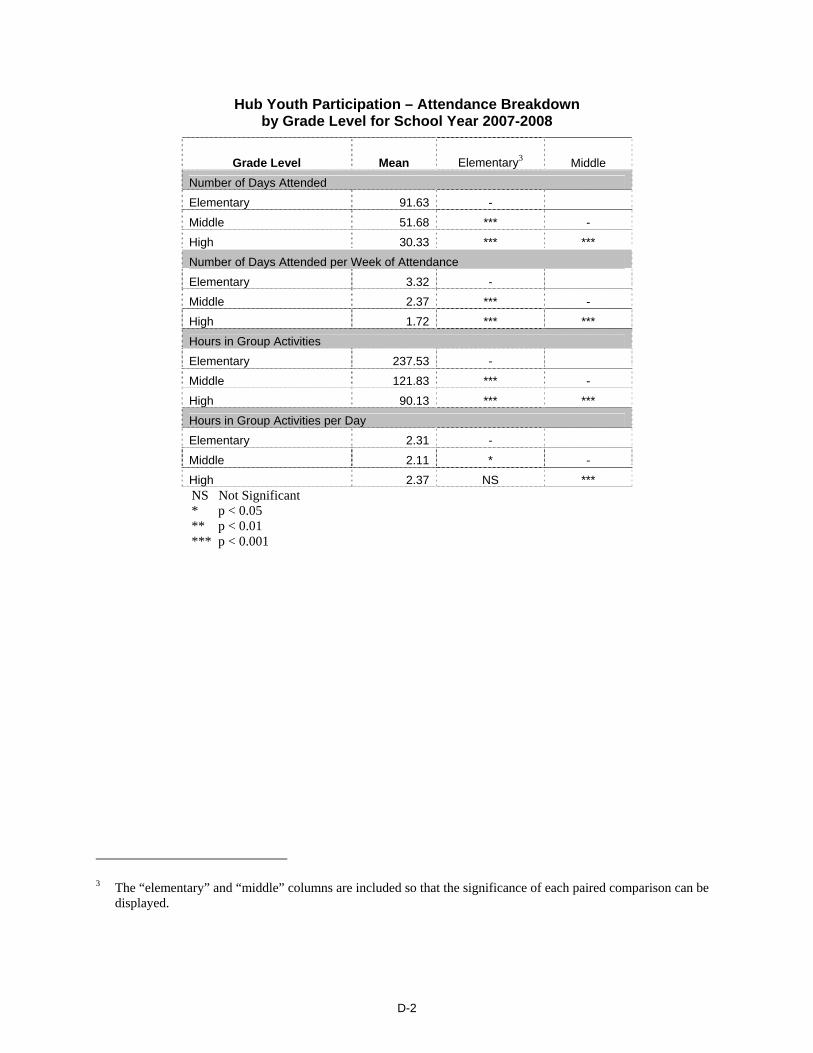
D-2
Hub Youth Participation – Attendance Breakdown by Grade Level for School Year 2007-2008
Grade Level Mean Elementary3 Middle Number of Days Attended Elementary 91.63 - Middle 51.68 *** - High 30.33 *** *** Number of Days Attended per Week of Attendance Elementary 3.32 - Middle 2.37 *** - High 1.72 *** *** Hours in Group Activities Elementary 237.53 - Middle 121.83 *** - High 90.13 *** *** Hours in Group Activities per Day Elementary 2.31 - Middle 2.11 * - High 2.37 NS *** NS Not Significant * p < 0.05 ** p < 0.01 *** p < 0.001
3 The “elementary” and “middle” columns are included so that the significance of each paired comparison can be
displayed.
Related Documents


