International Journal on Artificial Intelligence Tools Vol. 21, No. 4 (2012) 1240016 (18 pages) c World Scientific Publishing Company DOI: 10.1142/S0218213012400167 EVALUATION OF THE RISK OF STROKE WITH CONFIDENCE PREDICTIONS BASED ON ULTRASOUND CAROTID IMAGE ANALYSIS ANTONIS LAMBROU Computer Learning Research Centre, Royal Holloway, University of London, UK [email protected] HARRIS PAPADOPOULOS Computer Science and Engineering Department, Frederick University, Cyprus [email protected] EFTHYVOULOS KYRIACOU Computer Science and Engineering Department, Frederick University, Cyprus [email protected] CONSTANTINOS S. PATTICHIS Computer Science and Engineering Department, University of Cyprus, Nicosia, Cyprus [email protected] MARIOS S. PATTICHIS Electrical and Computer Engineering Department, University of New Mexico, New Mexico, USA [email protected] ALEXANDER GAMMERMAN Computer Learning Research Centre, Royal Holloway, University of London, UK [email protected] ANDREW NICOLAIDES Imperial College London, UK, Vascular screening and Diagnostic Centre, London, UK Cyprus Cardiovascular Disease Educational Research Trust, Nicosia, Cyprus [email protected] Conformal Predictors (CPs) are Machine Learning algorithms that can provide reliable confidence measures to their predictions. In this work, we make use of the Conformal Prediction framework for the assessment of stroke risk based on ultrasound images of atherosclerotic carotid plaques. For this application, images were recorded from 137 asymptomatic and 137 symptomatic plaques (symptoms are Stroke, Transient Ischaemic Attack (TIA), and Amaurosis Fugax (AF)). Two feature sets were extracted from the 1240016-1

Welcome message from author
This document is posted to help you gain knowledge. Please leave a comment to let me know what you think about it! Share it to your friends and learn new things together.
Transcript
July 26, 2012 14:24 WSPC/INSTRUCTION FILES0218213012400167
International Journal on Artificial Intelligence Tools
Vol. 21, No. 4 (2012) 1240016 (18 pages)c© World Scientific Publishing Company
DOI: 10.1142/S0218213012400167
EVALUATION OF THE RISK OF STROKE
WITH CONFIDENCE PREDICTIONS BASED ON
ULTRASOUND CAROTID IMAGE ANALYSIS
ANTONIS LAMBROU
Computer Learning Research Centre, Royal Holloway, University of London, UK
HARRIS PAPADOPOULOS
Computer Science and Engineering Department, Frederick University, Cyprus
EFTHYVOULOS KYRIACOU
Computer Science and Engineering Department, Frederick University, Cyprus
CONSTANTINOS S. PATTICHIS
Computer Science and Engineering Department, University of Cyprus, Nicosia, Cyprus
MARIOS S. PATTICHIS
Electrical and Computer Engineering Department,University of New Mexico, New Mexico, USA
ALEXANDER GAMMERMAN
Computer Learning Research Centre, Royal Holloway, University of London, UK
ANDREW NICOLAIDES
Imperial College London, UK, Vascular screening and Diagnostic Centre, London, UKCyprus Cardiovascular Disease Educational Research Trust, Nicosia, Cyprus
Conformal Predictors (CPs) are Machine Learning algorithms that can provide reliableconfidence measures to their predictions. In this work, we make use of the ConformalPrediction framework for the assessment of stroke risk based on ultrasound images of
atherosclerotic carotid plaques. For this application, images were recorded from 137
asymptomatic and 137 symptomatic plaques (symptoms are Stroke, Transient IschaemicAttack (TIA), and Amaurosis Fugax (AF)). Two feature sets were extracted from the
1240016-1

July 26, 2012 14:24 WSPC/INSTRUCTION FILE S0218213012400167
A. Lambrou et al.
plaques; the first based on morphological image analysis and the second based on im-age texture analysis. Both sets were used in order to evaluate the performance of CPs
on this problem. Four CPs were constructed using four popular classification methods,
namely Artificial Neural Networks (ANNs), Support Vector Machines (SVMs), NaiveBayes Classification (NBC), and k-Nearest Neighbours. The results given by all CPs
demonstrate the reliability and importance of the obtained confidence measures on the
problem of stroke risk assessment.
Keywords: Conformal prediction; confidence measures; assessment of stroke risk;
atherosclerotic carotid plaques; ultrasound image analysis.
1. Introduction
Visual classification of high-resolution ultrasound has made the non-invasive visu-
alisation of the carotid bifurcation possible, and has thus been used in the study of
arterial wall changes. Clinical applications of carotid bifurcation ultrasound include:
(i) identification and grading of stenosis of extracranial carotid artery disease often
responsible for ischaemic strokes, Transient Ischaemic Attacks (TIAs) or Amaurosis
Fugax (AF); (ii) follow-up after carotid endarterectomy; (iii) evaluation of pulsatile
neck mass; (iv) investigation of asymptomatic neck bruits where severe internal
carotid artery stenosis is used as a predictive factor for future stroke; (v) cardio-
vascular risk assessment where the presence of carotid bifurcation of atheroscle-
rotic plaques is associated with increased cardiovascular mortality. During the last
20 years, the introduction of computer aided methods and image standardisation
has improved the objective assessment of carotid plaque echogenicity and hetero-
geneity,1 and has largely replaced subjective assessment that had been criticised for
its poor reproducibility.20
Until now several studies presenting classification models for carotid ultrasound
images have been presented, see for example Refs. 5, 10, 12, 19, but none of these
methods provide any valid confidence measures on this problem. In order to address
this, we have proposed the use of Conformal Prediction32 in a previous study,16
where Conformal Prediction was used to assess the risk of stroke based on mor-
phological ultrasound images. Conformal Predictors (CPs) can provide prediction
regions which guarantee, under the i.i.d. assumption, that the error rate of these
regions will be bounded by a desirable significance level. For example, if the confi-
dence level is 95%, then the error rate will not exceed the 5% that is expected in
the long run.
In this work, we extend our work presented in Ref. 16 by examining datasets
with both morphological and texture features. Our system is based on a set of
morphological features and a set of classical image texture features, extracted from
274 ultrasound images of carotid plaques. Images used are base-line images, which
means that they were collected before any event happened. From these images, 137
were classified as asymptomatic, while 137 are symptomatic (an event of Stroke,
Transient Ischaemic Attack (TIA) or Amaurosis Fugax (AF) happened). We apply
the Conformal Prediction framework on both categories of features, using four dif-
1240016-2

July 26, 2012 14:24 WSPC/INSTRUCTION FILE S0218213012400167
Evaluation of the Risk of Stroke with Confidence Predictions
ferent classifiers: Artificial Neural Network (ANN); Support Vector Machine (SVM);
Naive Bayes Classifier (NBC); and k-Nearest Neighbours (k-NN). We compare the
results and show the reliability and practicality of the confidence measures obtained
for the classification of atherosclerotic carotid plaques.
The rest of the paper is structured as follows. In section 2, we give a brief review
of the relevant literature. In section 3, we describe the data used, we give an overview
of the Conformal Prediction framework, and explain how we have transformed four
machine learning classifiers into CPs. In section 4, we describe our experimental
settings and we give results. Moreover, we discuss and compare our results with the
results in Refs. 14 and 5 which have conducted previous studies on the same data.
In section 5, we conclude and outline our future work.
2. Related Work
Several efforts for automatic classification of ultrasound carotid plaque images have
been developed over the years (see Ref. 12). Earlier studies have been primarily
focused on basic statistical features such as the gray scale median (GSM), the mean,
the median, the standard deviation, skewness and Kurtosis. In these earlier studies,
the GSM was found to be very successful in differentiating between symptomatic
and asymptomatic cases. Depending on the image pre-processing method, threshold
values for the GSM were provided for differentiating between symptomatic and
asymptomatic cases. Here, brighter plaques tended to be asymptomatic.12 Standard
texture features have been extensively used for the classification of carotid plaques.
More recently, we have the introduction of morphological features that have given
promising results. The most successful morphological features were based on a multi-
level decomposition that are associated with different plaque image components. In
the multi-level approach, each normalized plaque is thresholded at three different
intensity ranges (low, medium, high). The darkest (low) components are associated
with unstable plaque components such as lipid and hemorrhages. On the other hand,
more stable plaque components are captured at higher brightness levels.12
Conformal Prediction (CP)32 is a novel technique for obtaining reliable confi-
dence measures. The technique was first proposed in Ref. 8 and later improved in
Refs. 30 and 31. CPs are built using classical machine learning algorithms, called un-
derlying algorithms. CPs complement the predictions of the underlying algorithms
with measures of confidence. Many CPs have been built to date, based on various
algorithms such as Support Vector Machines,30 k-Nearest Neighbours for classi-
fication29 and for regression,26 Random Forests,6 and Genetic Algorithms.15 The
computational efficiency of CPs has also been greatly improved using Inductive Con-
formal Prediction (ICP),22 as demonstrated in applications to Ridge Regression,25
k-Nearest Neighbours,27 and more recently in applications to Neural Networks.28,24
The CP framework has been successfully applied to medical problems, such as ovar-
ian cancer diagnosis,3 breast cancer diagnosis,9 classification of leukaemia subtypes,2
and acute abdominal pain diagnosis.23
1240016-3

July 26, 2012 14:24 WSPC/INSTRUCTION FILE S0218213012400167
A. Lambrou et al.
Other approaches that can provide some kind of confidence measures include
Bayesian methods and the Probably Approximately Correct (PAC) theory. Nev-
ertheless, these approaches have some important drawbacks that can hinder ap-
plication. For Bayesian theory, a priori assumptions need to be made about the
data. If prior knowledge is not available, and especially for limited data sets, the
Bayesian estimated confidence intervals can be misleading. For example, at the 95%
of confidence, the error rate can be much more than the expected 5%. An elabo-
rate comparison of the Bayesian framework with Conformal Prediction is made in
Ref. 18. In the case of applying PAC theory, the data used must be particularly
clean, something that is not always true in practical applications. The weakness of
the bounds of PAC methods is demonstrated in Ref. 21.
Several classification techniques have been used for the classification of carotid
plaques, such as Multilayer Perceptron (MLP) Neural Networks,19 Self Organiz-
ing Map (SOM) Networks,5,4 Radial Basis Function (RBF) Networks, Probabilis-
tic Neural Networks (PNNs), Support Vector Machines (SVMs)13,14 and k-Nearest
Neighbours.5,4 In addition, research has been done on simple statistical analysis of
the plaque characteristics.10,7,11,33 For validation, the leave-one-out method is com-
monly used. Receiver operating characteristic (ROC) curves have also been used for
measuring performance.5,19 A summary of these methods can be found in Ref. 12.
3. Material and Methods
3.1. Atherosclerotic carotid plaque data
A total of 274 carotid plaque ultrasound images associated with retinal or hemi-
spheric symptoms (33 stroke, 60 TIA, and 44 AF) were used in this work. Patients
with cardioembolic symptoms or distant symptoms (more than 6 months) were
excluded from the study. Asymptomatic plaques were truly asymptomatic if they
had never been associated with symptoms in the past, or symptomatic if they had
been associated with retinal or hemispheric symptoms (Stroke, TIA or AF). The
ultrasound images were collected in the Irvine Laboratory for Cardiovascular Inves-
tigation and Research, Saint Mary’s Hospital, UK, using an Advanced Technology
Laboratories (ATL model HDI 3000, Seattle, USA) duplex scanner with a linear
broadband width 4–7 MHz (multifrequency) transducer, at a resolution of 20 pix-
els/mm. The gray scale images (gray levels 0–255) were normalized manually by
adjusting the image linearly. The plaque identification and segmentation tasks are
quite difficult and were carried out manually by a physician or vascular ultrasono-
grapher who are experienced in scanning, both actions are described in Ref. 17.
3.1.1. Texture features
Texture features, shape parameters, and morphological features were extracted from
the manually segmented ultrasound plaque images. Seven different texture features
sets were extracted from the plaque segments using the algorithms described in
1240016-4
July 26, 2012 14:24 WSPC/INSTRUCTION FILE S0218213012400167
Evaluation of the Risk of Stroke with Confidence Predictions
Ref. 5. The algorithms used in these studies namely are (1) Statistical Features (SF),
(2) Spatial Gray Level Dependence Matrices (SGLDM), (3) Gray Level Difference
Statistics (GLDS), (4) Neighbourhood Gray Tone Difference Matrix (NGTDM),
(5) Statistical Feature Matrix (SFM) method, (6) Laws Texture Energy Measures
(TEM), (7) Fractal Dimension Texture Analysis (FDTA), (8) Fourier Power Spec-
trum (FPS) features, (9) Run Length Statistics (RUNL).
3.1.2. Morphological features
Morphological features are motivated from the need to study the basic structure
of the plaque. We have used two morphological analysis methods in order to quan-
tify morphological features of the plaques. The first one was based on a multilevel
approach where the image intensity was thresholded at three different levels, while
the second one was based on gray scale morphological analysis.
Morphological features of plaques are strongly associated with events. For ex-
ample black (echolucent) plaques with white big blobs are considered to be very
dangerous. From a structural perspective, morphological methods allow us to pro-
vide size distributions for different components of the plaque. A detailed analysis of
morphological features extracted from the plaques can be found in Ref. 14. In this
work, we have used the group of L-images as described in Ref. 14. This group gave
the best accuracy results.
3.2. Conformal prediction
Provided a training dataset, Conformal Predictors (CPs) output predictions for new
instances together with valid confidence measures, based on the assumption that
the data are identically and independently distributed (i.i.d.). Additionally, CPs can
provide prediction regions (more than one possible predictions for a new instance),
such that the error rate of the prediction regions will not exceed a given significance
level in the long run. We explain how this is done in the following paragraphs.
A training set is of the form {(x1, y1), . . . , (xn, yn)}, where xi is a vector of real-
valued attributes and yi ∈ {Y1, Y2, . . . , Yc} is a label given to the instance xi. Given a
new instance xn+1, we intend to predict the label yn+1 (i.e. the class of the instance).
In order to make a prediction, we assume all possible labels Yh ∈ {Y1, Y2, . . . , Yc}of the new instance, and we test for each assumed label the likelihood of being
correct. To get the likelihood of each assumption, we append the new instance xn+1
in our training set together with the assumed label Yh, and we train an underlying
classical machine learning algorithm on the extended training set
{(x1, y1), . . . , (xn+1, Yh)} . (1)
The learning algorithm builds a model about the data and is able to make pre-
dictions. A CP employ a non-conformity measure based on the derived model to
calculate a non-conformity score for each of the instances in (1). A non-conformity
score indicates how different (or strange) an instance xi is for its given label yi,
1240016-5
July 26, 2012 14:24 WSPC/INSTRUCTION FILE S0218213012400167
A. Lambrou et al.
compared to the other instances in (1). In section 3.3, we explain how we have
used four classical machine learning algorithms in order to generate non-conformity
scores. The CP compares the non-conformity score of the new instance with the
rest of the non-conformity scores in the training set. If the assumed label is correct,
we expect to get a low non-conformity score for the new instance (a score that is
comparable with the rest). We use the following p-value function to calculate how
likely the assumed label is of being correct:
p(Yh) =#{i = 1, . . . , n+ 1 : ai ≥ an+1}
n+ 1, (2)
which compares the non-conformity score an+1 of (xn+1, Yh) with all the other non-
conformity scores of the rest of the instances in the extended training set. We call
the output of this function the p-value of the class Yh.
Given the true label yn+1, the p-value function in (2), satisfies the following
property for all probability distributions P , and for any significance level ε:
P (p(yn+1) ≤ ε) ≤ ε . (3)
In fact, the p-value function is a test function which measures how likely the dataset
is of being i.i.d. If the p-value is lower than a given ε, it is because we either have non
i.i.d. data, or because some event has happened with probability less than or equal
to ε. Based on the assumption that our data are i.i.d., we know that if we include
in our predictions all assumed labels that provide a p-value greater than a given
significance level ε, then the probability of missing the true label of an instance will
be less than or equal ε. In the case that all p-values are less than ε we then include
the label with the highest p-value to ensure that our regions will always contain
at least one prediction. This step does not increase the probability of error. The
definition of a prediction region is given as
R = {Yh : p(Yh) > ε} ∪{arg max
h=1,...,c(p(Yh))
}. (4)
Our predictions are now called prediction regions, since they may contain more than
one possible labels. In the long run, these regions will make errors at a rate of at
most ε. Therefore, we have 1−ε confidence in these predictions. Optionally, we may
output only a single label (forced prediction) instead of a prediction region. That
is, we output the label with the highest p-value as the prediction together with
a confidence measure which is 1 minus the second largest p-value. The confidence
measure indicates how likely the prediction is of being correct, with respect to the
rest of the labels.
In Table 1, we give an example of a prediction region which contains a single label
and a prediction region which contains both labels for the 95% level of confidence
(ε = 0.05). We call a prediction region which contains only one label a certain
prediction. That is, the algorithm can be certain for its prediction at the required
1240016-6

July 26, 2012 14:24 WSPC/INSTRUCTION FILE S0218213012400167
Evaluation of the Risk of Stroke with Confidence Predictions
Table 1. Example of prediction regions for 95% level of confidence(ε = 0.05) and forced predictions with confidence measures.
Instance x1 x2
p(Y1) 0.8623 0.1920
p(Y2) 0.0145 0.3768
Actual label Y1 Y2
Prediction region for ε= 0.05 {Y1} {Y2, Y1}Forced prediction {Y1} {Y2}Confidence 98.55% 80.80%
level of confidence. For the instance x1, the second p-value is 0.0145, which is less
than the significance level 0.05. Therefore, we can discard the second label at 95%
level of confidence and give a certain prediction, which is the label that gives the
highest p-value. In contrast, for instance x2, the second largest p-value is 0.1920
and is greater than the significance level. In this case, the second largest p-value
cannot be discarded and thus we give an uncertain prediction region with both
possible labels for the given level of confidence. If we decrease the confidence level
to 80.80% (or lower), we then have a certain prediction (or forced prediction), but
the low confidence in this case is an indication that the prediction may require more
consideration.
3.3. Non-conformity measures
A non-conformity measure is a way of scoring how strange a new instance is for its
label compared with other instances that are given in a training set. Every non-
conformity measure that we derive determines a Conformal Predictor (CP), and is
used in (2) in order to calculate p-values. In this section, we describe how we derive
non-conformity measures using Artificial Neural Networks (ANNs), Support Vector
Machines (SVMs), Naive Bayes Classification (NBC), and k-Nearest Neighbours.
3.3.1. Artificial neural networks
Artificial Neural Networks (ANNs) are networks of interconnected neurons. Each
connection is associated with a weight which determines the intensity of the signal
traveling through that connection. These weights are adjusted during training to
reduce the output error of the network. The output layer of a neural network has a
neuron oj for each possible class, and given an instance xi we predict the class Yjcorresponding to the output neuron which gives the highest value.
We expect that the more conforming an instance is for its given label, the higher
the corresponding oj value would be. As proposed in Ref. 28, we can build a CP
based on ANNs (ANN-CP) using the non-conformity measure
ai = 1− ot , (5)
1240016-7

July 26, 2012 14:24 WSPC/INSTRUCTION FILE S0218213012400167
A. Lambrou et al.
for any (xi, yi) where yi = Yt, and ot = [0, 1]. Alternatively, we can use the following
non-conformity measure which is again defined in Ref. 28:
ai =maxj=1,...,c:j 66=toj
ot. (6)
That is, we use as a numerator the maximum of the output units which do not
correspond to the label of the given instance, since a higher value from such units
also indicates a more strange instance and would give a higher non-conformity score
when divided by ot.
3.3.2. Support vector machines
Support Vector Machines (SVMs) identify boundary instances for each class, and
fix a separating hyperplane that maximises the margin between them. In the case of
a non-linear separation, SVMs use a kernel mapping function, where the instances
are mapped to a higher dimensional space such that a linear separation can be
made. For the purpose of building a CP using SVM (SVM-CP), we use the distance
of each instance from the separating hyperplane together with the class that it
belongs to, in order to produce non-conformity scores. For Y = {−1, 1}, we use the
non-conformity measure
ai = −yih(xi) , (7)
where h(xi) is the output of the SVM for the given instance xi. The output h(xi) is
negative if the instance belongs to class −1, and positive if it belongs to class 1. If
the prediction is correct, then the further the instance is from the hyperplane, the
less the non-conformity score will be. In contrast, if the prediction is incorrect, the
non-conformity score will increase as the distance from the hyperplane increases.
The original SVM works only for binary classification problems. In this work, we
have optionally used a more general SVM-CP (defined in Ref. 32), which can work
for both binary and multi-class problems. We have used the one-against-the-rest
procedure, which transforms a multi-class problem into several binary sub-problems.
A class is selected for each sub-problem, and the instances are labeled with {−1, 1}depending on whether they belong to the selected class. A non-conformity score is
generated for each instance in each sub-problem, using (7). Finally, the average of
the scores of each instance is calculated to get a final non-conformity measure.
3.3.3. Naive Bayes Classifier
The Naive Bayes Classifier (NBC) is named after Bayes’ Theorem, and the “naive”
assumption of attribute independence. The assumption that attributes are inde-
pendent is a simplistic one. Nevertheless, Naive Bayes works very well on many
real-world datasets, particularly when combined with attribute selection procedures
that remove redundant, and hence nonindependent, attributes. The classifier multi-
plies the probabilities of the attributes given their class, and outputs the probability
1240016-8
July 26, 2012 14:24 WSPC/INSTRUCTION FILE S0218213012400167
Evaluation of the Risk of Stroke with Confidence Predictions
of label yi given instance xi. We can use the output probability to define a non-
conformity measure and build a CP based on the NBC (NBC-CP):
ai = 1− P (yi|xi) . (8)
As P (yi|xi) increases the example is less strange, since the probability assigned by
the NBC to the correct class is higher.
3.3.4. Nearest Neighbours
The k-Nearest Neighbours (k-NN) method computes the distance of a test instance
from the other instances that are provided in the training set, and finds its k near-
est instances. The prediction of the algorithm is the class of the majority of the k
instances. In the case of building a CP based on k-NN (k-NN-CP), we use the dis-
tances of the k nearest instances to define a non-conformity measure. The simplest
approach is to calculate the total of distances of the k instances that belong to the
class of instance xi, since the nearer the instance is to its class, the less strange
it is. Nonetheless, for a more accurate non-conformity measure we also take into
consideration the distances of the k nearest instances that belong to other classes,
since the nearer the instance xi is to the other classes the more strange it is. We
build our k-NN-CP using the non-conformity measure defined in Refs. 29 and 27:
ai =
∑j=1,...,k sij∑j=1,...,k oij
, (9)
where sij is the jth shortest distance of xi from the instances of the same class, and
oij is the jth shortest distance of xi from the instances of other classes.
4. Experiments
We have experimented on both the morphological data and the texture data de-
scribed in section 3.1, and we have compared the results of all the CPs as defined in
section 3.3. Before conducting our experiments we have applied Principal Compo-
nent Analysis (PCA) on the datasets and selected the features which accounted for
98% of each dataset’s variance. For evaluating our algorithms, we have applied the
Leave-One-Out Cross Validation (LOOCV) technique. Both of these choices were
made in order to be able to have similar results with Ref. 14 which have conducted
research on the morphological data. In LOOCV, a test instance is left out from the
training set and after training a prediction is made for the left-out instance. This
experiment is repeated for every instance in the dataset, and the predictions are
then evaluated with the true labels of the instances. The ANN-CP was structured
with one hidden layer, and all units had sigmoid activation functions. We have used
a learning rate of 0.3 and a momentum rate of 0.2. In each experiment, the ANNs
were trained for 500 epochs with 10% validation set, which was used to stop training
when the performance on the validation set was deteriorating. For the SVM-CP, we
have used a Radial Basis Function (RBF) kernel mapping.
1240016-9

July 26, 2012 14:24 WSPC/INSTRUCTION FILE S0218213012400167
A. Lambrou et al.
4.1. Results
In Table 2, we show the results of the four CPs described in section 3.3 on the mor-
phological data. We have conducted experiments with different parameter values of
the underlying algorithm of each CP. The parameter for the ANN-CP is the number
of neurons of the hidden layer, for the SVM-CP the spread of the RBF kernel, and
for the k-NN-CP we set the number of nearest neighbours considered. We should
note here that the NBC-CP (also included in Table 2) has no parameters. We also
report the certainty and error rates of each CP for the confidence levels 95%, 85%,
and 75%. The certainty rates correspond to the prediction regions that contained
only a single label, and the error rates correspond to the prediction regions that did
not contain the true label. The certainty rates show the efficiency of each CP. High
rates of certainty show a better quality in our confidence measures. We highlight
the results which give the best average percentage of accuracy and certainty rates.
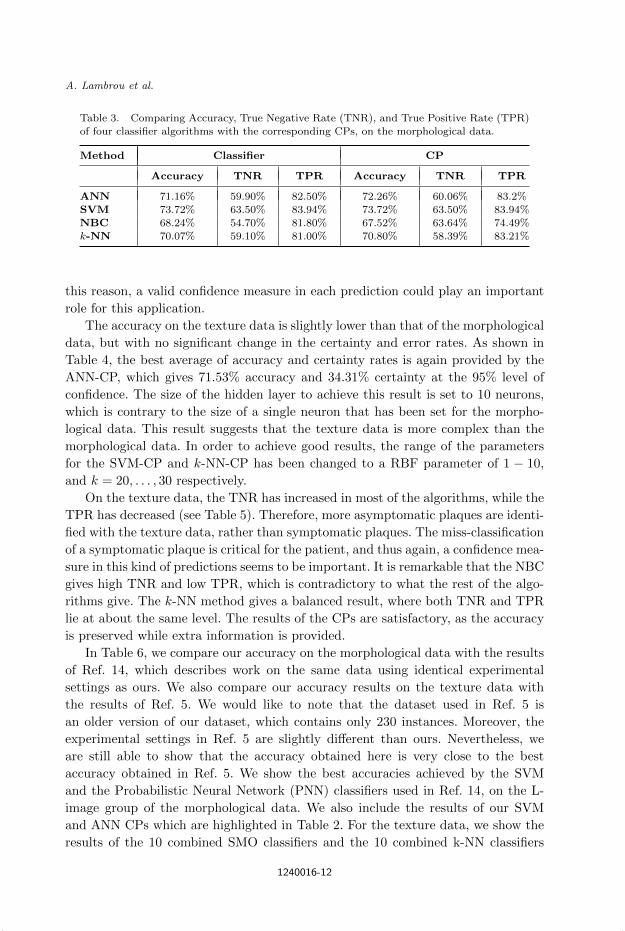
In Table 3, we compare the accuracy results of the four CPs with the results
of the corresponding classical algorithms. We have selected for each algorithm the
parameters which are highlighted in Table 2. We have also calculated the True
Positive Rates (TPR), and True Negative Rates (TNR). A TN in our case is a
plaque which has been correctly classified as asymptomatic, and a TP a plaque
which is correctly classified as symptomatic.
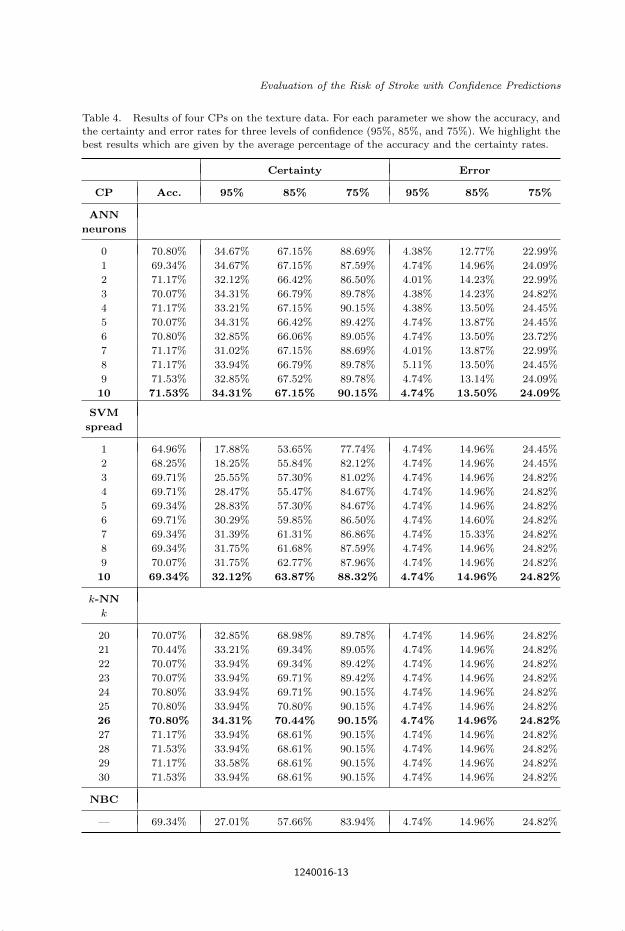
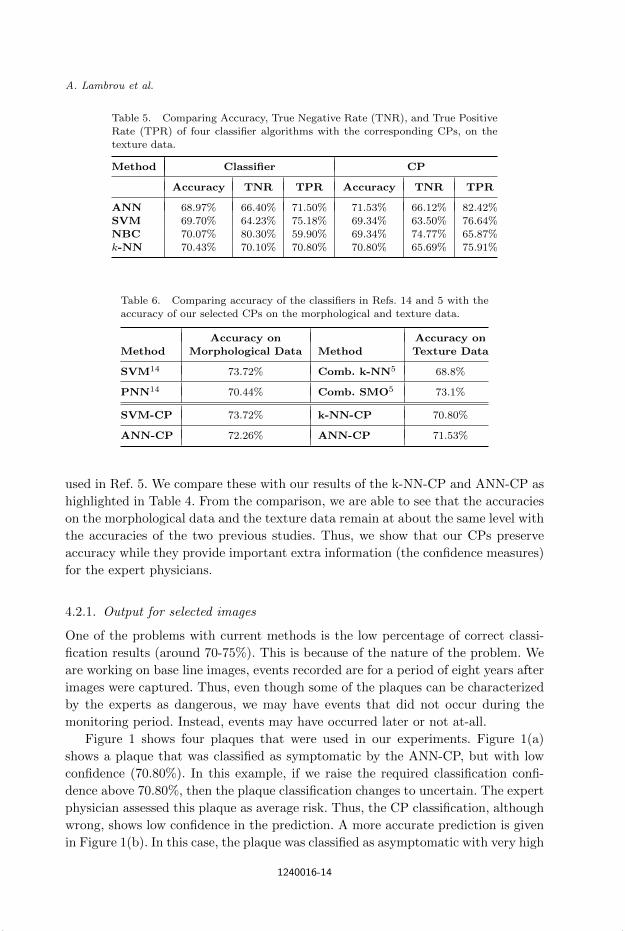
In Table 4, we give the results of the CPs on the texture data. The structure
of the results is identical to that of Table 2. In Table 5, we compare the accuracy,
TPR and TNR of the classical algorithms with the corresponding CPs.
4.2. Discussion
As expected, the error rates confirm the validity of the CPs as they are always near
the pre-set significance levels, regardless of the non-conformity measures defined and
parameters that have been chosen for each algorithm. On the morphological data,
the ANN-CP provides the best average of accuracy and certainty rates compared
with the rest of the CPs, and the results are improved even more when the size of
the hidden layer is limited to a single neuron. At 95% level of confidence the ANN-
CP gives 35.04% of certain prediction regions. This means that a significant amount
of patients will get a prediction in which the error will not exceed the 5% that is
allowed. Given the difficulty of the task, this is arguably a useful result. Moreover,
as we decrease the confidence level, the certainty rates increase dramatically.
The accuracy between the classifiers and their corresponding CPs have no sig-
nificant difference, as expected. We highlight here that our aim is not to improve
accuracy. We show that CPs can provide more information in each prediction while
accuracy is retained. As shown in Table 3, all algorithms provide higher TPRs and
lower TNRs on the morphological data. This means that patients with symptomatic
plaques will have more chance to be identified, whereas asymptomatic plaques could
be miss-classified as symptomatic. This kind of wrong predictions could yield unnec-
essary complications, such as surgery, in which other risks may be introduced. For
1240016-10

July 26, 2012 14:24 WSPC/INSTRUCTION FILE S0218213012400167
Evaluation of the Risk of Stroke with Confidence Predictions
Table 2. Results of four CPs on the morphological data. For each parameter we show the accuracy,and the certainty and error rates for three levels of confidence (95%, 85%, and 75%). We highlight
the best results which are given by the average percentage of the accuracy and the certainty rates.
Certainty Error
CP Acc. 95% 85% 75% 95% 85% 75%
ANN
neurons
0 73.36% 30.29% 67.15% 90.15% 4.74% 13.50% 22.26%
1 72.26% 35.04% 68.61% 89.42% 4.74% 14.23% 23.72%
2 70.80% 32.48% 64.96% 88.32% 4.74% 14.23% 22.26%
3 71.90% 31.02% 68.98% 90.15% 4.74% 14.60% 23.36%
4 71.90% 32.85% 66.42% 88.69% 4.74% 13.87% 22.63%
5 71.53% 33.21% 66.42% 89.05% 5.11% 14.23% 22.63%
6 71.53% 34.31% 65.69% 88.32% 5.11% 13.50% 22.26%
7 71.90% 33.21% 65.69% 88.69% 4.74% 13.87% 22.63%
8 70.80% 31.75% 63.87% 87.96% 4.74% 14.60% 22.26%
9 70.80% 32.48% 64.96% 88.32% 4.74% 13.87% 22.63%
10 70.80% 33.94% 64.60% 88.69% 5.47% 13.50% 22.26%
SVM
spread
0.10 73.72% 19.34% 54.74% 85.40% 4.74% 14.96% 24.82%
0.11 73.72% 17.52% 54.38% 85.04% 4.74% 14.96% 24.82%
0.12 72.99% 18.61% 54.01% 85.40% 4.74% 14.96% 24.82%
0.13 72.99% 19.34% 54.38% 85.04% 4.74% 14.96% 24.82%
0.14 72.26% 20.44% 54.38% 85.77% 4.38% 14.96% 24.82%
0.15 72.26% 21.53% 54.74% 84.67% 4.74% 14.96% 24.82%
0.16 71.17% 21.17% 54.01% 85.04% 4.74% 14.96% 24.82%
0.17 70.80% 20.44% 54.74% 83.94% 4.74% 14.96% 24.82%
0.18 70.07% 21.17% 55.47% 83.94% 4.74% 14.96% 24.82%
0.19 69.71% 22.26% 55.84% 82.85% 4.74% 14.96% 24.82%
0.20 69.71% 22.99% 55.84% 82.12% 4.74% 14.96% 25.18%
k-NN
k
5 67.88% 28.83% 57.30% 82.48% 4.74% 14.96% 24.82%
6 67.52% 28.83% 56.57% 86.13% 4.74% 14.96% 24.82%
7 68.25% 29.20% 58.03% 87.59% 4.74% 14.96% 24.82%
8 69.71% 29.93% 56.93% 87.96% 4.74% 14.96% 24.82%
9 71.53% 29.20% 56.93% 87.23% 4.74% 14.96% 24.82%
10 71.53% 29.20% 56.57% 87.96% 4.74% 14.96% 24.82%
11 71.17% 29.20% 58.76% 87.96% 4.74% 14.96% 24.82%
12 70.44% 29.56% 59.12% 88.32% 4.74% 14.96% 24.82%
13 70.07% 29.56% 62.41% 88.32% 4.74% 14.96% 24.82%
14 70.80% 29.56% 63.50% 89.05% 4.74% 14.96% 24.82%
15 70.07% 29.20% 63.14% 89.78% 4.74% 14.96% 24.82%
NBC
— 67.52% 21.90% 59.85% 81.75% 4.74% 14.96% 24.82%
1240016-11
July 26, 2012 14:24 WSPC/INSTRUCTION FILE S0218213012400167
A. Lambrou et al.
Table 3. Comparing Accuracy, True Negative Rate (TNR), and True Positive Rate (TPR)of four classifier algorithms with the corresponding CPs, on the morphological data.
Method Classifier CP
Accuracy TNR TPR Accuracy TNR TPR
ANN 71.16% 59.90% 82.50% 72.26% 60.06% 83.2%
SVM 73.72% 63.50% 83.94% 73.72% 63.50% 83.94%NBC 68.24% 54.70% 81.80% 67.52% 63.64% 74.49%
k-NN 70.07% 59.10% 81.00% 70.80% 58.39% 83.21%
this reason, a valid confidence measure in each prediction could play an important
role for this application.
The accuracy on the texture data is slightly lower than that of the morphological
data, but with no significant change in the certainty and error rates. As shown in
Table 4, the best average of accuracy and certainty rates is again provided by the
ANN-CP, which gives 71.53% accuracy and 34.31% certainty at the 95% level of
confidence. The size of the hidden layer to achieve this result is set to 10 neurons,
which is contrary to the size of a single neuron that has been set for the morpho-
logical data. This result suggests that the texture data is more complex than the
morphological data. In order to achieve good results, the range of the parameters
for the SVM-CP and k-NN-CP has been changed to a RBF parameter of 1 − 10,
and k = 20, . . . , 30 respectively.
On the texture data, the TNR has increased in most of the algorithms, while the
TPR has decreased (see Table 5). Therefore, more asymptomatic plaques are identi-
fied with the texture data, rather than symptomatic plaques. The miss-classification
of a symptomatic plaque is critical for the patient, and thus again, a confidence mea-
sure in this kind of predictions seems to be important. It is remarkable that the NBC
gives high TNR and low TPR, which is contradictory to what the rest of the algo-
rithms give. The k-NN method gives a balanced result, where both TNR and TPR
lie at about the same level. The results of the CPs are satisfactory, as the accuracy
is preserved while extra information is provided.
In Table 6, we compare our accuracy on the morphological data with the results
of Ref. 14, which describes work on the same data using identical experimental
settings as ours. We also compare our accuracy results on the texture data with
the results of Ref. 5. We would like to note that the dataset used in Ref. 5 is
an older version of our dataset, which contains only 230 instances. Moreover, the
experimental settings in Ref. 5 are slightly different than ours. Nevertheless, we
are still able to show that the accuracy obtained here is very close to the best
accuracy obtained in Ref. 5. We show the best accuracies achieved by the SVM
and the Probabilistic Neural Network (PNN) classifiers used in Ref. 14, on the L-
image group of the morphological data. We also include the results of our SVM
and ANN CPs which are highlighted in Table 2. For the texture data, we show the
results of the 10 combined SMO classifiers and the 10 combined k-NN classifiers
1240016-12
July 26, 2012 14:24 WSPC/INSTRUCTION FILE S0218213012400167
Evaluation of the Risk of Stroke with Confidence Predictions
Table 4. Results of four CPs on the texture data. For each parameter we show the accuracy, andthe certainty and error rates for three levels of confidence (95%, 85%, and 75%). We highlight the
best results which are given by the average percentage of the accuracy and the certainty rates.
Certainty Error
CP Acc. 95% 85% 75% 95% 85% 75%
ANN
neurons
0 70.80% 34.67% 67.15% 88.69% 4.38% 12.77% 22.99%
1 69.34% 34.67% 67.15% 87.59% 4.74% 14.96% 24.09%
2 71.17% 32.12% 66.42% 86.50% 4.01% 14.23% 22.99%
3 70.07% 34.31% 66.79% 89.78% 4.38% 14.23% 24.82%
4 71.17% 33.21% 67.15% 90.15% 4.38% 13.50% 24.45%
5 70.07% 34.31% 66.42% 89.42% 4.74% 13.87% 24.45%
6 70.80% 32.85% 66.06% 89.05% 4.74% 13.50% 23.72%
7 71.17% 31.02% 67.15% 88.69% 4.01% 13.87% 22.99%
8 71.17% 33.94% 66.79% 89.78% 5.11% 13.50% 24.45%
9 71.53% 32.85% 67.52% 89.78% 4.74% 13.14% 24.09%
10 71.53% 34.31% 67.15% 90.15% 4.74% 13.50% 24.09%
SVM
spread
1 64.96% 17.88% 53.65% 77.74% 4.74% 14.96% 24.45%
2 68.25% 18.25% 55.84% 82.12% 4.74% 14.96% 24.45%
3 69.71% 25.55% 57.30% 81.02% 4.74% 14.96% 24.82%
4 69.71% 28.47% 55.47% 84.67% 4.74% 14.96% 24.82%
5 69.34% 28.83% 57.30% 84.67% 4.74% 14.96% 24.82%
6 69.71% 30.29% 59.85% 86.50% 4.74% 14.60% 24.82%
7 69.34% 31.39% 61.31% 86.86% 4.74% 15.33% 24.82%
8 69.34% 31.75% 61.68% 87.59% 4.74% 14.96% 24.82%
9 70.07% 31.75% 62.77% 87.96% 4.74% 14.96% 24.82%
10 69.34% 32.12% 63.87% 88.32% 4.74% 14.96% 24.82%
k-NN
k
20 70.07% 32.85% 68.98% 89.78% 4.74% 14.96% 24.82%
21 70.44% 33.21% 69.34% 89.05% 4.74% 14.96% 24.82%
22 70.07% 33.94% 69.34% 89.42% 4.74% 14.96% 24.82%
23 70.07% 33.94% 69.71% 89.42% 4.74% 14.96% 24.82%
24 70.80% 33.94% 69.71% 90.15% 4.74% 14.96% 24.82%
25 70.80% 33.94% 70.80% 90.15% 4.74% 14.96% 24.82%
26 70.80% 34.31% 70.44% 90.15% 4.74% 14.96% 24.82%
27 71.17% 33.94% 68.61% 90.15% 4.74% 14.96% 24.82%
28 71.53% 33.94% 68.61% 90.15% 4.74% 14.96% 24.82%
29 71.17% 33.58% 68.61% 90.15% 4.74% 14.96% 24.82%
30 71.53% 33.94% 68.61% 90.15% 4.74% 14.96% 24.82%
NBC
— 69.34% 27.01% 57.66% 83.94% 4.74% 14.96% 24.82%
1240016-13
July 26, 2012 14:24 WSPC/INSTRUCTION FILE S0218213012400167
A. Lambrou et al.
Table 5. Comparing Accuracy, True Negative Rate (TNR), and True PositiveRate (TPR) of four classifier algorithms with the corresponding CPs, on the
texture data.
Method Classifier CP
Accuracy TNR TPR Accuracy TNR TPR
ANN 68.97% 66.40% 71.50% 71.53% 66.12% 82.42%
SVM 69.70% 64.23% 75.18% 69.34% 63.50% 76.64%NBC 70.07% 80.30% 59.90% 69.34% 74.77% 65.87%k-NN 70.43% 70.10% 70.80% 70.80% 65.69% 75.91%
Table 6. Comparing accuracy of the classifiers in Refs. 14 and 5 with theaccuracy of our selected CPs on the morphological and texture data.
Accuracy on Accuracy on
Method Morphological Data Method Texture Data
SVM14 73.72% Comb. k-NN5 68.8%
PNN14 70.44% Comb. SMO5 73.1%
SVM-CP 73.72% k-NN-CP 70.80%
ANN-CP 72.26% ANN-CP 71.53%
used in Ref. 5. We compare these with our results of the k-NN-CP and ANN-CP as
highlighted in Table 4. From the comparison, we are able to see that the accuracies
on the morphological data and the texture data remain at about the same level with
the accuracies of the two previous studies. Thus, we show that our CPs preserve
accuracy while they provide important extra information (the confidence measures)
for the expert physicians.
4.2.1. Output for selected images
One of the problems with current methods is the low percentage of correct classi-
fication results (around 70-75%). This is because of the nature of the problem. We
are working on base line images, events recorded are for a period of eight years after
images were captured. Thus, even though some of the plaques can be characterized
by the experts as dangerous, we may have events that did not occur during the
monitoring period. Instead, events may have occurred later or not at-all.
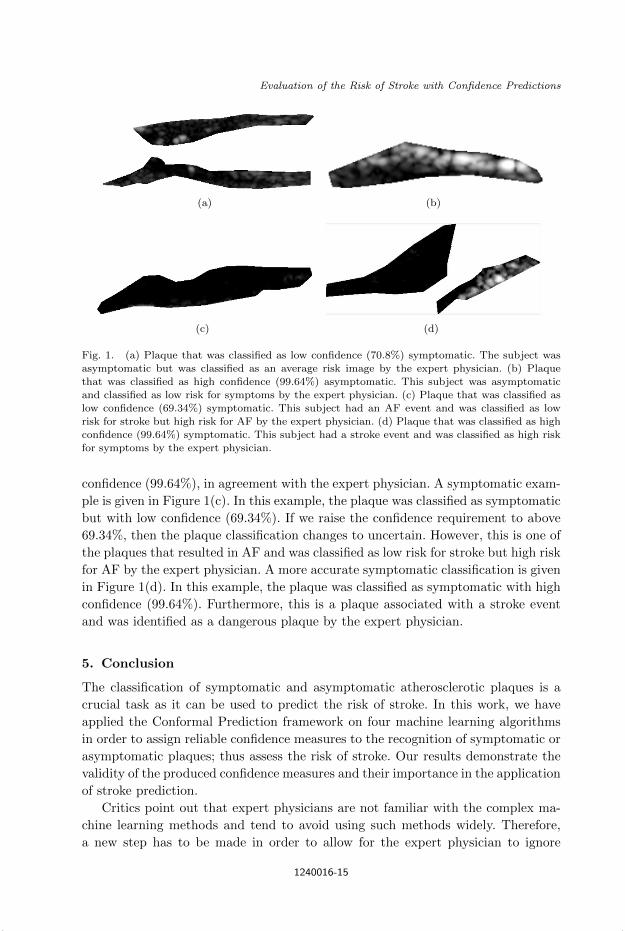
Figure 1 shows four plaques that were used in our experiments. Figure 1(a)
shows a plaque that was classified as symptomatic by the ANN-CP, but with low
confidence (70.80%). In this example, if we raise the required classification confi-
dence above 70.80%, then the plaque classification changes to uncertain. The expert
physician assessed this plaque as average risk. Thus, the CP classification, although
wrong, shows low confidence in the prediction. A more accurate prediction is given
in Figure 1(b). In this case, the plaque was classified as asymptomatic with very high
1240016-14
July 26, 2012 14:24 WSPC/INSTRUCTION FILE S0218213012400167
Evaluation of the Risk of Stroke with Confidence Predictions
(a) (b)
(c) (d)
Fig. 1. (a) Plaque that was classified as low confidence (70.8%) symptomatic. The subject was
asymptomatic but was classified as an average risk image by the expert physician. (b) Plaquethat was classified as high confidence (99.64%) asymptomatic. This subject was asymptomatic
and classified as low risk for symptoms by the expert physician. (c) Plaque that was classified as
low confidence (69.34%) symptomatic. This subject had an AF event and was classified as lowrisk for stroke but high risk for AF by the expert physician. (d) Plaque that was classified as high
confidence (99.64%) symptomatic. This subject had a stroke event and was classified as high riskfor symptoms by the expert physician.
confidence (99.64%), in agreement with the expert physician. A symptomatic exam-
ple is given in Figure 1(c). In this example, the plaque was classified as symptomatic
but with low confidence (69.34%). If we raise the confidence requirement to above
69.34%, then the plaque classification changes to uncertain. However, this is one of
the plaques that resulted in AF and was classified as low risk for stroke but high risk
for AF by the expert physician. A more accurate symptomatic classification is given
in Figure 1(d). In this example, the plaque was classified as symptomatic with high
confidence (99.64%). Furthermore, this is a plaque associated with a stroke event
and was identified as a dangerous plaque by the expert physician.
5. Conclusion
The classification of symptomatic and asymptomatic atherosclerotic plaques is a
crucial task as it can be used to predict the risk of stroke. In this work, we have
applied the Conformal Prediction framework on four machine learning algorithms
in order to assign reliable confidence measures to the recognition of symptomatic or
asymptomatic plaques; thus assess the risk of stroke. Our results demonstrate the
validity of the produced confidence measures and their importance in the application
of stroke prediction.
Critics point out that expert physicians are not familiar with the complex ma-
chine learning methods and tend to avoid using such methods widely. Therefore,
a new step has to be made in order to allow for the expert physician to ignore
1240016-15
July 26, 2012 14:24 WSPC/INSTRUCTION FILE S0218213012400167
A. Lambrou et al.
the underlying complex methodology and be able to trust the predictions of the
machine. Our contribution in this work is exactly towards this aim. The proposed
methods provide the expert physician with a reliable confidence measure for each
prediction, which can be trusted based only on the i.i.d. assumption. As the confi-
dence measures that we provide are valid (in the sense that they are proven to be
correct), the expert physician needs to have no further knowledge about the meth-
ods in order to be able to trust the confidence measure in each prediction. In the
future, we aim to improve the quality of our confidence measures by investigating
other methods, while preserving the validity and the accuracy of the predictors.
References
1. Gianni Belcaro, Andrew N. Nicolaides, Giuseppe Laurora, Maria Rosaria Cesarone,Mariateresa De Sanctis, Lucrezia Incandela, and Antonio Barsotti. Ultrasoundmorphology classification of the arterial wall and cardiovascular events in a 6-yearfollow-up study. Arterioscler Thromb Vasc Biol, 16(7):851–856, 1996.
2. Tony Bellotti, Zhiyuan Luo, and Alexander Gammerman. Reliable classification ofchildhood acute leukaemia from gene expression data using confidence machines. InProceedings of IEEE International Conference on Granular Computing (GRC ’06),pages 148–153, 2006.
3. Tony Bellotti, Zhiyuan Luo, Alexander Gammerman, Frederick W. Van Delft, andVaskar Saha. Qualified predictions for microarray and proteomics pattern diagnosticswith confidence machines. International Journal of Neural Systems, 15(4):247–258,2005.
4. Christodoulos I. Christodoulou, Efthyvoulos Kyriacou, Costantinos S. Pattichis, andAndrew Nicolaides. Multiple feature extraction for content-based image retrievalof carotid plaque ultrasound images. In Proceedings of the 5th International IEEESpecial Topic Conference on Information Technology Applications in Biomedicine,pages 26–28, 2006.
5. C.I. Christodoulou, C.S. Pattichis, M. Pantziaris, and A. Nicolaides. Texture-based classification of atherosclerotic carotid plaques. IEEE Transactions on MedicalImaging, 22(7):902–912, 2003.
6. Devetyarov Dmitry and Nouretdinov Ilia. Prediction with confidence based on a ran-dom forest classifier. In Artificial Intelligence Applications and Innovations – 6th IFIPWG 12.5 International Conference (AIAI 2010), volume 339, pages 37–44. SpringerBoston, 2010.
7. N. El-Barghouty, G. Geroulakos, A. Nicolaides, A. Androulakis, and V. Bahal.Computer-assisted carotid plaque characterisation. European Journal of Vascular andEndovascular Surgery, 9(4):389–393, 1995.
8. A. Gammerman, V. Vovk, and V. Vapnik. Learning by transduction. In Uncertaintyin Artificial Intelligence, pages 148–155. Morgan Kaufmann, 1998.
9. Alexander Gammerman, Ilia Nouretdinov, Brian Burford, Alexey Chervonenkis,Volodya Vovk, and Zhiyuan Luo. Clinical mass spectrometry proteomic diagnosis byconformal predictors. Statistical Applications in Genetics and Molecular Biology, 7(2),2008.
10. G. Geroulakos, A. Domjan, A. Nicolaides, J. Stevens, N. Labropoulos, G. Ramaswami,and G. Belcaro. Ultrasonic carotid artery plaque structure and the risk of cere-bral infraction on computer tomography. Journal of Vascular Surgery, 20(2):263–266,1994.
1240016-16

July 26, 2012 14:24 WSPC/INSTRUCTION FILE S0218213012400167
Evaluation of the Risk of Stroke with Confidence Predictions
11. Arcangelo Iannuzzi, Timothy Wilcosky, Michele Mercuri, Paolo Rubba, Fred A. Bryan,and M. Gene Bond. Ultrasonographic correlates of carotid atherosclerosis in transientischemic attack and stroke. Stroke, 26(4):614–619, 1995.
12. E.C. Kyriacou, C. Pattichis, M. Pattichis, C. Loizou, C. Christodoulou, S.K. Kakkos,and A. Nicolaides. A review of noninvasive ultrasound image processing methods in theanalysis of carotid plaque morphology for the assessment of stroke risk. InformationTechnology in Biomedicine, IEEE Transactions on, 14(4):1027 –1038, 2010.
13. E.C. Kyriacou, C.S. Pattichis, M.A. Karaolis, C.P. Loizou, C.I. Christodoulou, M.S.Pattichis, S. Kakkos, and A. Nicolaides. An integrated system for assessing stroke risk.Engineering in Medicine and Biology Magazine, IEEE, 26(5):43–50, 2007.
14. Efthyvoulos Kyriacou, Marios S. Pattichis, Constantinos S. Pattichis, A. Mavromma-tis, C. I. Christodoulou, S. Kakkos, and A. Nicolaides. Classification of atheroscleroticcarotid plaques using morphological analysis on ultrasound images. Applied Intelli-gence, 30(1):3–23, 2009.
15. Antonis Lambrou, Harris Papadopoulos, and Alexander Gammerman. Reliableconfidence measures for medical diagnosis with evolutionary algorithms. IEEE Trans-actions on Information Technology in Biomedicine, 15(1):93 –99, 2011.
16. Antonis Lambrou, Harris Papadopoulos, Efthyvoulos C. Kyriacou, ConstantinosS. Pattichis, Marios S. Pattichis, Alexander Gammerman, and Andrew Nicolaides.Assessment of stroke risk based on morphological ultrasound image analysis with con-formal prediction. In Artificial Intelligence Applications and Innovations – 6th IFIPWG 12.5 International Conference (AIAI 2010), pages 146–153, 2010.
17. M. Langsfeld, A.C. Gray-Weale, and R.J. Lusby. The role of plaque morphology anddiameter reduction in the development of new symptoms in asymptomatic carotidarteries. Journal of Vascular Surgery, 9(4):548–557, 1989.
18. Thomas Melluish, Craig Saunders, Ilia Nouretdinov, and Volodya Vovk. Comparingthe Bayes and Typicalness frameworks. In Proceedings of the 12th European Confer-ence on Machine Learning (ECML’01), volume 2167 of Lecture Notes in ComputerScience, pages 360–371. Springer, 2001.
19. Stavroula Gr. Mougiakakou, Spyretta Golemati, Ioannis Gousias, Andrew N. Nico-laides, and Konstantina S. Nikita. Computer-aided diagnosis of carotid atherosclerosisbased on ultrasound image statistics, laws’ texture and neural networks. Ultrasoundin Medicine & Biology, 33(1):26 – 36, 2007.
20. Andrew N. Nicolaides, Edward G. Shifrin, Andrew Bradbury, Surinder Dhanjil, MauraGriffin, Gianni Belcaro, and Michael Williams. Angiographic and duplex grading ofinternal carotid stenosis: Can we overcome the confusion? Journal of EndovascularSurgery, 3(2):158–165, 1996.
21. Ilia Nouretdinov, Volodya Vovk, Michael Vyugin, and Alex Gammerman. Patternrecognition and density estimation under the general i.i.d. assumption. In David Helm-bold and Bob Williamson, editors, Computational Learning Theory, volume 2111 ofLecture Notes in Computer Science, pages 337–353. Springer Berlin/Heidelberg, 2001.
22. Harris Papadopoulos. Inductive conformal prediction: Theory and application to neu-ral networks. In Paula Fritzsche, editor, Tools in Artificial Intelligence, chapter 18,pages 315–330. I-Tech, Vienna, Austria, 2008. URL http://www.intechopen.com/download/pdf/pdfs id/5294.
23. Harris Papadopoulos, Alex Gammerman, and Volodya Vovk. Reliable diagnosis ofacute abdominal pain with conformal prediction. Engineering Intelligent Systems,17(2-3):115–126, 2009.
24. Harris Papadopoulos and Haris Haralambous. Reliable prediction intervals withregression neural networks. Neural Networks, 24(8):842–851, 2011.
1240016-17
July 26, 2012 14:24 WSPC/INSTRUCTION FILE S0218213012400167
A. Lambrou et al.
25. Harris Papadopoulos, Kostas Proedrou, Volodya Vovk, and Alex Gammerman.Inductive confidence machines for regression. In Proceedings of the 13th EuropeanConference on Machine Learning (ECML’02), volume 2430 of Lecture Notes in Com-puter Science, pages 345–356. Springer, 2002.
26. Harris Papadopoulos, Vladimir Vovk, and Alex Gammerman. Regression conformalprediction with nearest neighbours. Journal of Artificial Intelligence Research, 40:815–840, 2011. URL http://dx.doi.org/10.1613/jair.3198.
27. Harris Papadopoulos, Volodya Vovk, and Alex Gammerman. Qualified predictions forlarge data sets in the case of pattern recognition. In Proceedings of the 2002 Interna-tional Conference on Machine Learning and Applications, pages 159–163, 2002.
28. Harris Papadopoulos, Volodya Vovk, and Alex Gammerman. Conformal predictionwith neural networks. In Proceedings of the 19th IEEE International Conferenceon Tools with Artificial Intelligence (ICTAI’07), volume 2, pages 388–395. IEEEComputer Society, 2007.
29. Kostas Proedrou, Ilia Nouretdinov, Volodya Vovk, and Alex Gammerman. Transduc-tive confidence machines for pattern recognition. In Proceedings of the 13th EuropeanConference on Machine Learning (ECML’02), volume 2430 of Lecture Notes in Com-puter Science, pages 381–390. Springer, 2002.
30. Craig Saunders, Alex Gammerman, and Volodya Vovk. Transduction with confidenceand credibility. In Proceedings of the 16th International Joint Conference on ArtificialIntelligence, volume 2, pages 722–726, Los Altos, CA, 1999. Morgan Kaufmann.
31. Volodya Vovk, Alex Gammerman, and Craig Saunders. Machine-learning applicationsof algorithmic randomness. In Proceedings of the Sixteenth International Conferenceon Machine Learning, pages 444–453. Morgan Kaufmann, 1999.
32. Volodya Vovk, Alexander Gammerman, and G. Shafer. Algorithmic Learning in aRandom World. New York, Springer, 2005.
33. J.E. Wilhjelm, M.-L.M. Gronholdt, B. Wiebe, S.K. Jespersen, L.K. Hansen, andH. Sillesen. Quantitative analysis of ultrasound b-mode images of carotid atheroscle-rotic plaque: correlation with visual classification and histological examination. IEEETransactions on Medical Imaging, 17(6):910–922, 1998.
1240016-18
Related Documents