Evaluation of the repeatability and reproducibility of a suite of qPCR-based microbial source tracking methods Darcy L. Ebentier a , Kaitlyn T. Hanley a,b , Yiping Cao c , Brian D. Badgley d , Alexandria B. Boehm e , Jared S. Ervin f,g , Kelly D. Goodwin h,1 , Miche `le Gourmelon i , John F. Griffith c , Patricia A. Holden f,g , Catherine A. Kelty j , Solen Lozach i , Charles McGee k,2 , Lindsay A. Peed j , Meredith Raith c , Hodon Ryu j , Michael J. Sadowsky d , Elizabeth A. Scott c , Jorge Santo Domingo j , Alexander Schriewer b , Christopher D. Sinigalliano h , Orin C. Shanks j , Laurie C. Van De Werfhorst f,g , Dan Wang e , Stefan Wuertz b,l , Jennifer A. Jay a, * a Department of Civil and Environmental Engineering, University of California Los Angeles, 5732 Boelter Hall, Los Angeles, CA 90095, USA b Department of Civil and Environmental Engineering, University of California Davis, One Shields Ave, Davis, CA 95616, USA c Southern California Coastal Water Research Project Authority, 3535 Harbor Blvd Suite 110, Costa Mesa, CA 92626, USA d BioTechnology Institute and Department for Soil, Water and Climate, University of Minnesota, St. Paul, MN 55108, USA e Environmental and Water Studies, Department of Civil and Environmental Engineering, Stanford University, Stanford, CA 94305, USA f Bren School of Environmental Science and Management, University of California, Santa Barbara, CA 93106-5131, USA g Earth Research Institute, University of California, Santa Barbara, CA 93106-3060, USA h NOAA Atlantic Oceanographic & Meteorological Laboratory, 4301 Rickenbacker Cswy, Miami, FL 33149, USA i Laboratoire de Microbiologie, MIC/LNR, De ´partement Ressources Biologiques et Environnement, Unite ´ Environnement, Microbiologie et Phycotoxines, Ifremer, ZI Pointe du diable, Plouzane ´, France j US EPA, National Risk Management Research Laboratory, Cincinnati, OH 45268, USA k Orange County Sanitation District, 10844 Ellis Ave, Fountain Valley, CA 92708, USA l Singapore Centre on Environmental Life Sciences Engineering, School of Biological Sciences, and School of Civil and Environmental Engineering, Nanyang Technological University, 60 Nanyang Drive, Singapore article info Article history: Received 3 October 2012 Received in revised form abstract Many PCR-based methods for microbial source tracking (MST) have been developed and validated within individual research laboratories. Inter-laboratory validation of these methods, however, has been minimal, and the effects of protocol standardization regimes * Corresponding author. Tel.: þ1 310 267 5365; fax: þ1 310 206 2222. E-mail address: [email protected] (J.A. Jay). 1 Stationed at SWFSC, La Jolla, CA, USA. 2 Retired. Available online at www.sciencedirect.com journal homepage: www.elsevier.com/locate/watres water research 47 (2013) 6839 e6848 0043-1354/$ e see front matter ª 2013 Elsevier Ltd. All rights reserved. http://dx.doi.org/10.1016/j.watres.2013.01.060

Welcome message from author
This document is posted to help you gain knowledge. Please leave a comment to let me know what you think about it! Share it to your friends and learn new things together.
Transcript

ww.sciencedirect.com
wat e r r e s e a r c h 4 7 ( 2 0 1 3 ) 6 8 3 9e6 8 4 8
Available online at w
journal homepage: www.elsevier .com/locate/watres
Evaluation of the repeatability and reproducibilityof a suite of qPCR-based microbial source trackingmethods
Darcy L. Ebentier a, Kaitlyn T. Hanley a,b, Yiping Cao c, Brian D. Badgley d,Alexandria B. Boehm e, Jared S. Ervin f,g, Kelly D. Goodwin h,1,Michele Gourmelon i, John F. Griffith c, Patricia A. Holden f,g,Catherine A. Kelty j, Solen Lozach i, Charles McGee k,2, Lindsay A. Peed j,Meredith Raith c, Hodon Ryu j, Michael J. Sadowsky d, Elizabeth A. Scott c,Jorge Santo Domingo j, Alexander Schriewer b, Christopher D. Sinigalliano h,Orin C. Shanks j, Laurie C. Van De Werfhorst f,g, Dan Wang e,Stefan Wuertz b,l, Jennifer A. Jay a,*aDepartment of Civil and Environmental Engineering, University of California Los Angeles, 5732 Boelter Hall,
Los Angeles, CA 90095, USAbDepartment of Civil and Environmental Engineering, University of California Davis, One Shields Ave, Davis,
CA 95616, USAcSouthern California Coastal Water Research Project Authority, 3535 Harbor Blvd Suite 110, Costa Mesa, CA 92626,
USAdBioTechnology Institute and Department for Soil, Water and Climate, University of Minnesota, St. Paul, MN 55108,
USAeEnvironmental and Water Studies, Department of Civil and Environmental Engineering, Stanford University,
Stanford, CA 94305, USAfBren School of Environmental Science and Management, University of California, Santa Barbara, CA 93106-5131,
USAgEarth Research Institute, University of California, Santa Barbara, CA 93106-3060, USAhNOAA Atlantic Oceanographic & Meteorological Laboratory, 4301 Rickenbacker Cswy, Miami, FL 33149, USAi Laboratoire de Microbiologie, MIC/LNR, Departement Ressources Biologiques et Environnement, Unite
Environnement, Microbiologie et Phycotoxines, Ifremer, ZI Pointe du diable, Plouzane, FrancejUS EPA, National Risk Management Research Laboratory, Cincinnati, OH 45268, USAkOrange County Sanitation District, 10844 Ellis Ave, Fountain Valley, CA 92708, USAlSingapore Centre on Environmental Life Sciences Engineering, School of Biological Sciences, and School of Civil and
Environmental Engineering, Nanyang Technological University, 60 Nanyang Drive, Singapore
a r t i c l e i n f o
Article history:
Received 3 October 2012
Received in revised form
* Corresponding author. Tel.: þ1 310 267 536E-mail address: [email protected] (J.A. Ja
1 Stationed at SWFSC, La Jolla, CA, USA.2 Retired.
0043-1354/$ e see front matter ª 2013 Elsevhttp://dx.doi.org/10.1016/j.watres.2013.01.060
a b s t r a c t
Many PCR-based methods for microbial source tracking (MST) have been developed and
validated within individual research laboratories. Inter-laboratory validation of these
methods, however, has been minimal, and the effects of protocol standardization regimes
5; fax: þ1 310 206 2222.y).
ier Ltd. All rights reserved.

wat e r r e s e a r c h 4 7 ( 2 0 1 3 ) 6 8 3 9e6 8 4 86840
17 January 2013
Accepted 20 January 2013
Available online 5 July 2013
Keywords:
Microbial source tracking
qPCR
Repeatability
Reproducibility
Fecal pollution
have not been thoroughly evaluated. Knowledge of factors influencing PCR in different
laboratories is vital to future technology transfer for use of MSTmethods as a tool for water
quality management. In this study, a blinded set of 64 filters (containing 32 duplicate
samples generated from 12 composite fecal sources) were analyzed by three to five core
laboratories with a suite of PCR-based methods utilizing standardized reagents and pro-
tocols. Repeatability (intra-laboratory variability) and reproducibility (inter-laboratory
variability) of observed results were assessed. When standardized methodologies were
used, intra- and inter-laboratory %CVs were generally low (median %CV 0.1e3.3% and 1.9
e7.1%, respectively) and comparable to those observed in similar inter-laboratory valida-
tion studies performed on other methods of quantifying fecal indicator bacteria (FIB) in
environmental samples. ANOVA of %CV values found three human-associated methods
(BsteriF1, BacHum, and HF183Taqman) to be similarly reproducible ( p > 0.05) and signifi-
cantly more reproducible ( p < 0.05) than HumM2. This was attributed to the increased
variability associated with low target concentrations detected by HumM2 (approximately 1
e2 log10copies/filter lower) compared to other human-associated methods. Cow-associated
methods (BacCow and CowM2) were similarly reproducible ( p > 0.05). When using stan-
dardized protocols, variance component analysis indicated sample type (fecal source and
concentration) to be the major contributor to total variability with that from replicate filters
and inter-laboratory analysis to be within the same order of magnitude but larger than
inherent intra-laboratory variability. However, when reagents and protocols were not
standardized, inter-laboratory %CV generally increased with a corresponding decline in
reproducibility. Overall, these findings verify the repeatability and reproducibility of these
MST methods and highlight the need for standardization of protocols and consumables
prior to implementation of larger scale MST studies involving multiple laboratories.
ª 2013 Elsevier Ltd. All rights reserved.
1. Introduction reproducibility of methods for the detection and enumeration
Many PCR-based methods for microbial source tracking (MST)
have been developed in an effort to characterize the sources of
fecal pollution in recreational waters (Santo Domingo et al.,
2007). They have the potential to be implemented by water
quality managers for source identification, source allocation,
total maximum daily load (TMDL) determinations, and
remediation of chronic contamination problems, as well as for
quantitative microbial risk assessment (QMRA) applications
(Soller et al., 2010). Certainly MST methods must be sensitive
and specific to their target source, but for implementation in
water quality management they also must be repeatable
(demonstrate good intra-laboratory agreement) and repro-
ducible (demonstrate good inter-laboratory agreement)
(Simpson et al., 2002; Stoeckel and Harwood, 2007). Some
qPCR-based MST methods have been validated within indi-
vidual research laboratories (Shanks et al., 2010a, 2010b).
Inter-laboratory validation of these methods, however, has
been minimal. The few comparative studies that have been
performed on repeatability have generally evaluated library
dependent methods, which have since been proven to be
largely untenable (Griffith et al., 2003; Stoeckel et al., 2004).
Despite the absence of studies evaluating the reproduc-
ibility of qPCR-based MST methods, many previous studies
have assessed the repeatability and reproducibility of other
microbiological and molecular methods, offering metrics by
which MST methods can be evaluated (Stoeckel et al., 2004;
Shanks et al., 2012; Cao et al., 2011; Langton et al., 2002;
Schulten et al., 2000; Cao et al., 2013a, b). In food safety
method validation studies, the repeatability and
of pathogens has been evaluated using the repeatability (r)
and reproducibility (R) values for quantitative data (Schulten
et al., 2000). Repeatability values represent the maximum
expected difference (with 95% probability) between two in-
dependent test results, obtained with the same method on
identical samples in the same laboratory (Schulten et al.,
2000). Reproducibility values represent the same maximum
expected difference in results across multiple laboratories. In
addition to these metrics, intra- and inter-laboratory percent
coefficients of variation (%CV) for related environmental
water quality methods have been observed and offer bench-
mark values for comparison (Shanks et al., 2012; Cao et al.,
2011).
Here, we report results from quantitative real-time PCR
(qPCR) analyses performed by ten laboratories using nine
qPCR-based MST methods. The laboratories were provided
with replicate, blinded filter sets in order to evaluate repeat-
ability and reproducibility. Repeatability was defined as the
ability of amethod to produce the same results for analyses of
identical samples under the same conditions in the same
laboratory (Schulten et al., 2000; Bustin et al., 2009). Repro-
ducibility was defined as the ability to produce the same re-
sults for analyses of identical samples under the same
conditions in different laboratories (Schulten et al., 2000;
Bustin et al., 2009). Five of the participating laboratories used
standardized protocols including centralized sources of
reference DNA standards, as well as the same manufacturer
preparations of nucleic acid isolation materials and PCR re-
agents so as to estimate repeatability and reproducibility
exclusive of deviations in protocols. The remaining

wat e r r e s e a r c h 4 7 ( 2 0 1 3 ) 6 8 3 9e6 8 4 8 6841
laboratories used a variety of deviations from the standard-
ized protocols and reagents for six of these nine methods.
Taken together, these data enabled us to assess the impor-
tance of protocol standardization to overall method
reproducibility.
The specific goals of the study were to investigate: 1) the
repeatability of each MST method within laboratories
employing standardized protocols and reagents, 2) the
reproducibility of nine MST (qPCR) methods across several
laboratories when protocols and reagents were standardized,
and 3) the effects of protocol deviations on the reproducibility
of qPCR MST methods. We also quantified the relative
contribution of intra-laboratory and inter-laboratory vari-
ability to total variability, determined the influence of plat-
form when standardized protocols and reagents were used,
and identified the most repeatable and reproducible methods
of those evaluated.
2. Materials and methods
2.1. Sample processing and analysis
Blinded sets of 64 filters, comprised of 32 duplicate samples
generated from 12 fecal sources, were prepared in replicate as
described in Boehm et al. (2013). Fresh fecal sources included
human feces, sewage, septage, cow, dog, deer, pigeon, seagull,
goose, chicken, pig, and horse. Fecal samples were collected
from multiple geographic locations across California and
composited to better approximate the microbial community
associated with each source. Geographic locations ranged
throughout southern and central California (Boehm et al.,
2013). Slurries containing composites of single sources (here-
after referred to as singletons) were prepared using sterile
artificial freshwater (distilled water with 0.3 mM MgCl2,
0.6 mM CaCl2, and 1.4 mM NaHCO3) and diluted to a concen-
tration of approximately 1000 culturable Enterococcus spp./
50 mL “based on information gleaned from the literature and
pilot studies on fecal enterococci concentrations” (Boehm
et al., 2013). Slurries containing two fecal sources (hereafter
referred to as doubletons) were prepared by combining
singleton slurries in 90%:10% ratios by volume to approximate
dominant and minor fecal pollution sources. All slurries were
filtered through 0.45 mm polycarbonate filters (Millipore, Bill-
erica, MA). Filtered volumes were adjusted depending on
desired concentrations; 50 mL was filtered for full strength
singleton and doubleton filters, while 5 mL was filtered to
achieve 1:10 strength singleton filters (Boehm et al., 2013). In
order to best evaluate the methods and source combinations
relevant to California beaches, the 32 sampleswere comprised
of 12 full strength singletons, 7 1:10 strength singletons, and
13 doubletons as described in detail in Boehm et al., (2013).
Filters were immediately flash frozen in liquid nitrogen and
stored at �80 �C. Replicate sets of frozen filters were shipped
overnight on dry ice to participating laboratories for nucleic
acid isolation and qPCR analysis.
The following ten laboratories contributed data to this
study: the Boehm laboratory at Stanford University (Stanford,
CA, USA), the Wuertz laboratory at University of California,
Davis (Davis, CA, USA), the Holden laboratory at University of
California, Santa Barbara (Santa Barbara, CA, USA), the Jay
laboratory at University of California, Los Angeles (Los
Angeles, CA, USA), the Southern California Coastal Water
Research Project (SCCWRP) (Costa Mesa, CA, USA), two par-
ticipants from U.S. EPA National Risk Management Research
Laboratory (Cincinnati, OH, USA), two participants from the
National Oceanographic and Atmospheric Administration
(NOAA) Atlantic Oceanographic and Meteorological Labora-
tory (Miami, FL, USA; one participant stationed at the South-
west Fisheries Science Center, La Jolla, CA), and the
Laboratoire de Microbiologie, EMP, at Ifremer (Plouzane,
France). Stanford, University of California Santa Barbara,
University of California Los Angeles, SCCWRP and one labo-
ratory from U.S. EPA were randomly assigned numbers 1
through 5. The remaining laboratories were randomly
assigned numbers 6 through 10.
Nine qPCR methods were selected for repeatability and
reproducibility analyses due to the fact that they were each
performed by a total of four to six different laboratories (SI
Table 1). Laboratories 1e5 (hereafter referred to as core labo-
ratories) used standardized protocols and reagents for nucleic
acid isolation and qPCR analysis, while labs 6e10 utilized
variable reagents and protocols (SI Tables 2, 3). Samples were
pre-screened by the coordinating laboratory, SCCWRP, for
inhibition in each method by spiking with a known concen-
tration of reference DNA and assaying serial dilutions
following the procedure described in Cao et al. (2012a). Core
laboratories ran each filter in triplicate and screened data
using salmon testes DNA as a sample processing control
(Haugland et al., 2005). Core laboratories also obtained all re-
agents from the same commercial vendor and all reference
DNA standards from a centralized laboratory (SI Tables 4,5).
The MST methods evaluated in this study included the
following: BacHum, HF183Taqman, HumM2, BsteriF1, Dog-
Bact, Gull2Taqman, Pig2Bac, CowM2 and BacCow (SI Table 1).
These nine methods were performed by a minimum of three
core laboratories so as to provide a large enough data set to
reveal reliable relationships and results regarding the
repeatability and reproducibility of these methods exclusive
of protocol deviations. The Enterococcus spp. qPCR method,
performed by three core laboratories, was also included for
comparison with the MST methods (USEPA et al., 2012).
2.2. qPCR data treatment
Raw qPCR quantification cycle (Cq) values from all core labo-
ratories (1e5) were treated with the same quality assurance
and quality control protocols. For each method in each labo-
ratory, standard curve data were pooled and regression ana-
lyses were used to identify outliers as those with a
standardized residual >j3j. Outliers were iteratively removed
until the adjusted standard curve data set no longer contained
values with standardized residuals >j3j. Pooled standard
curves were truncated below the standard concentration at
which 10 of 12 replicates amplified.
Three core laboratories (1, 3, and 5) performed qPCR using a
StepOnePlus� platform (Life Technologies, Carlsbad, CA)
while the remaining two (2, 4) used a CFX-96 platform (Bio-
Rad, Hercules, CA). To better allow comparison across all core
laboratories for this study, platform-specific master standard

wat e r r e s e a r c h 4 7 ( 2 0 1 3 ) 6 8 3 9e6 8 4 86842
curves were generated and used to determine the lower limit
of quantification (LLOQ) for each platform-method. These
platform-specific master standard curves were generated by
combining respective pooled standard curves and iteratively
removing outliers with standardized residuals>j3j. The LLOQ
for each platform-method was then defined as the Cq value
corresponding to 40 target copies per reaction. This concen-
tration was chosen based on the lowest standard concentra-
tion able to be consistently quantified across core laboratories
(12 of 12 replicates amplified). Laboratory sample data were
subsequently qualified as in the range of quantification (ROQ)
or below the lower limit of quantification (BLOQ) through
application of the corresponding platform-method LLOQ Cq.
Laboratory sample data with Cq 40 (no amplification) were
qualified as not detected (ND). Finally, DNA target concen-
trations for each qPCR triplicate of each filter were estimated
for each method using individual laboratory pooled standard
curves. Since the DNA extraction protocol employed by core
laboratories only resulted in partial recovery of lysate
following the physical lysis step, DNA target concentrations
were adjusted to more accurately estimate final copies/filter.
Estimated DNA target concentrations were log transformed
prior to statistical analysis. Only core laboratory replicates
within the ROQ were used in subsequent analyses unless
otherwise specified. Raw qPCR Cq values from remaining
laboratories 6e10 were treated by laboratory specific, non-
standardized protocols. All assessments below were con-
ducted using log10 transformed target concentration data,
unless otherwise specified.
2.3. Repeatability within laboratories usingstandardized protocols and reagents
Repeatability was defined as the ability of amethod to produce
the same answer for replicate qPCR analyses in the same
laboratory and was calculated for each method using log10transformed target concentration data from core laboratories.
Repeatability (r) values representing the maximum expected
difference between two qPCR replicates (with 95% probability)
obtained in the same laboratory for each method were
calculated using analysis of variance (Schulten et al., 2000).
Additionally, within-laboratory percent coefficient of varia-
tion (%CV) was calculated among triplicate concentrations for
each filter containing target source material for each MST
method in each laboratory. Minimum, maximum andmedian
of %CV were calculated.
2.4. Reproducibility among laboratories usingstandardized protocols and reagents
Reproducibility, defined as the ability of a method to produce
the same answer for analyses of replicate samples under the
same conditions in different laboratories, was assessed for
core laboratories. Reproducibility (R) values representing the
maximum expected difference between two results (with 95%
probability) obtained with the same method in different lab-
oratories were calculated using analysis of variance (Schulten
et al., 2000), as described below in Section 2.6. Additionally,
mean sample concentrations (calculated from duplicate filter
concentrations) within each laboratory were used to calculate
the inter-laboratory %CV across all core laboratories for each
MST method. Minimum, maximum, and median of %CV were
calculated.
2.5. Reproducibility among laboratories using non-standardized protocols and reagents
The use of two different thermal cycler platforms by core
laboratories described in Section 2.2 allowed for the evalua-
tion of variability contributed by platform. The role of plat-
form in terms of its contribution to variability was evaluated
by analysis of variance (ANOVA) via the GLM procedure in SAS
(SAS Institute, Cary, NC).
The effects of other protocol and reagent deviations on the
reproducibility of MST methods were determined by using
data from the six qPCRmethods for which data from both core
(1e5) and non-core (6e10) laboratories were available (SI Table
S1). Mean sample concentrations for each laboratory were
used to calculate a new inter-laboratory %CV for each sample
across all laboratories utilizing deviated protocols for each
method. %CV minimum, maximum, and median were calcu-
lated, and compared to the inter-laboratory %CV distributions
observed among core laboratories.
2.6. Relative contribution of intra- and inter-laboratoryvariability to total variability among laboratories usingstandardized protocols and reagents
The relative contributions of intra-laboratory and inter-
laboratory variability to total variability in estimated DNA
target concentrations for all ten qPCR methods was deter-
mined by performing nested ANOVA with variance compo-
nent analysis (SAS Institute, Cary, NC). Three factors and one
error term were included in the ANOVA model: SampleType,
Laboratory, Filter (nested under the Laboratory factor), and
Random Error (i.e. qPCR repeatability). Intra- and inter-
laboratory variability, defined in Sections 2.4 and 2.5 as r and
R, respectively, were estimated as the variance contribution of
Random Error and Laboratory, respectively, to the total vari-
ability. Laboratory and SampleType, which included fecal
source as well as strength, were treated as random effects to
infer the general inter-laboratory reproducibility of these
methods. To determine if SampleType influenced inter-
laboratory variability, an interaction term of the factors Lab-
oratory and SampleType was included in the ANOVA model.
Finally, the Filter factor assessed the variability contributed by
both the sample filtration and DNA isolation steps within the
laboratory.
2.7. Identification of the most reproducible methods
To identify the most reproducible methods within each host
group, inter-laboratory %CV values were ranked then
analyzed via ANOVA with multiple comparison (Tukey’s test,
family-wise error ¼ 0.05) (Cao et al., 2011). Inter-laboratory %
CV values for this analysis were calculated utilizing triplicate
target concentrations (log10 transformed) from both filter
replicates. This procedure was carried out using data from
core laboratories to identify the most reproducible methods
exclusive of protocol deviations.

Table 2 e Repeatability (r) and reproducibility (R) valuesfor each method. Values represent the maximumexpected difference (with 95% probability) betweenreplicate qPCR results within the same laboratory (r) andreplicate results in different laboratories (R).
Method r (log10 copies/filter) R (log10 copies/filter)
BacHum 0.09 0.19
HF183Taqman 0.05 0.09
BacCow 0.10 0.22
BsteriF1 0.06 0.27
CowM2 0.03 0.28
DogBact 0.12 0.21
Gull2Taqman 0.17 0.23
HumM2 0.05 0.37
Pig2Bac 0.07 0.09
Entero 0.11 0.66
wat e r r e s e a r c h 4 7 ( 2 0 1 3 ) 6 8 3 9e6 8 4 8 6843
3. Results
3.1. qPCR data treatment
All core laboratory Cq values were successfully processed ac-
cording to the quality assurance and quality control protocols
described in Section 2.2. Tabulated percentages of target
(containing fecal source targeted by a method as defined in
Boehm et al. 2013) and nontarget data, qualified as in the ROQ,
BLOQ and ND were reported (Table 1). In general, ROQ DNA
target concentrations were 3e9 log10 copies/filter for target
filters (with the exception of CowM2 and HumM2 concentra-
tions, which peaked at 7 log10 copies/filter) and between 3 and
5 log10 copies/filter for nontarget filters. BLOQ DNA target
concentrations ranged between 2 and 3 log10 copies/filter for
target filters, and 1e3 log10 copies/filter for nontarget filters.
DNA target source data were almost always in the ROQ,
with the exception of approximately 36% of the HumM2 data
(Table 1).
3.2. Repeatability within laboratories usingstandardized protocols and reagents
3.2.1. Repeatability (r) valuesRepeatability (r) values were generally low and ranged from
0.03 to 0.17 log10 copies/filter (Table 2). All human-associated
methods had r values less than 0.10 log10 copies/filter. HF183
Taqman and HumM2 had the lowest r values of the human-
associated methods with 0.05 log10 copies/filter, indicating
better intra-laboratory agreement. CowM2 had the lowest r
value and Gull2Taqman had the highest of all themethods. All
r values for MST qPCRmethods were observed to be of similar
magnitude to the r value for Enterococcus spp. qPCR, indicating
similar intra-laboratory agreement.
3.2.2. qPCR triplicate %CV analysisMedian%CVvalues between qPCR triplicates ranged from0.1 to
3.3%, indicating minimal variation in replicate qPCR measure-
ments of the same filter and thus low inherent method
Table 1 e Summary of Data Distribution Among CoreLaboratories (1e5). Results were seperated into those fortarget versus non-target filters. Target was definedaccording to Boehm et al. (2013). Some non-target (falsepositive) amplification was observed, but fell mostlyBLOQ and is discussed in depth in other publications(Boehm et al. 2013).
Target NonTarget
Method %ROQ %BLOQ %ND %ROQ %BLOQ %ND
BacCow 100.0% 0.0% 0.0% 36.6% 13.9% 49.5%
BacHum 98.2% 1.8% 0.0% 26.5% 35.9% 37.6%
BsteriF1 91.9% 8.1% 0.0% 24.9% 21.1% 54.0%
CowM2 100.0% 0.0% 0.0% 0.4% 5.4% 94.2%
DogBact 100.0% 0.0% 0.0% 8.5% 12.9% 78.6%
Gull2Taqman 100.0% 0.0% 0.0% 5.1% 10.9% 84.0%
HF183Taqman 88.9% 11.1% 0.0% 7.2% 37.5% 55.3%
HumM2 63.9% 32.1% 4.0% 3.4% 28.4% 68.2%
Pig2Bac 100.0% 0.0% 0.0% 5.2% 19.7% 75.1%
variability (Fig. 1and2).The%CVvaluesweregenerally lower for
methods targeting non-human sources compared to methods
targeting human sources. Non-human methods, with the
exception of laboratories 1 and 3 performing the Gull2Taqman
method, hadmaximum intra-laboratory%CVvalueswell below
5.0%. Humanmethods, with the exception of BacHum, showed
maximumintra-laboratory%CVvalues below6.0%. Forhuman-
associated methods, the highest %CV values were frequently
associated with doubleton samples containing sewage and/or
septage as theminor contributor or 1:10 strength singletons. For
non-human methods, the highest %CV values were associated
with 1:10 strength singleton or doubleton samples where the
DNA target source was the minor contributor.
3.3. Reproducibility among laboratories usingstandardized protocols and reagents
3.3.1. Reproducibility (R) valuesReproducibility (R) values ranged from0.09 to 0.37 log10 copies/
filter (Table 2). Among human-associated methods,
Fig. 1 e Intra-laboratory coefficients of variation (%CV) for
human-associated methods. CV values were calculated
between qPCR triplicate reactions for 38 target filters.
Boxes represent the 25th to 75th percentile range,
whiskers represent the 10th and 90th percentiles, and dots
represent outliers.

Fig. 2 e Intra-laboratory coefficients of variation (%CV) for
nonhuman-associated methods. CV values were
calculated between qPCR triplicate reactions for 8 (DogBact,
Pig2Bac, CowM2, and BacCow) to 12 (Gull2Taqman) target
filters. Boxes represent the 25th to 75th percentile range,
whiskers represent the 10th and 90th percentiles, and dots
represent outliers.
Fig. 3 e Inter-laboratory coefficients of variation (CV)
among core laboratories (1e5) and among all laboratories
(1e10). CV values were calculated between mean sample
concentrations for each laboratory. Methods lacking box
plots for laboratories 1e10 were not run in laboratories
6e10.
wat e r r e s e a r c h 4 7 ( 2 0 1 3 ) 6 8 3 9e6 8 4 86844
HF183Taqman had the lowest R value while HumM2 had the
highest (0.09 and 0.37 log10 copies/filter, respectively), indi-
cating HF183Taqman showed the highest inter-laboratory
agreement while HumM2 showed the lowest. Among non-
human methods, Pig2Bac had the lowest R value, and of the
two cow-associated methods, BacCow had a slightly lower R
value than CowM2 (Table 2). All R values for MST qPCR
methods were lower than the Enterococcus spp. qPCR R value,
indicating similar or better inter-laboratory agreement among
MST methods.
3.3.2. Inter-laboratory %CV analysisMedian inter-laboratory %CV for each method ranged from
1.9% to 7.1% (Fig. 3). Inter-laboratory %CV valueswere lower for
methods targeting non-human sources compared to methods
targeting human sources. Non-human methods, with the
exception of the Gull2Taqman method, had maximum inter-
laboratory %CV well below 10.0%, while some human
methods (BsteriF1 and HumM2) showed higher maximum
inter-laboratory %CV values (up to 15.6%). As previously
observed for qPCR triplicate %CV values, the highest %CV
values for human-associated methods were almost always
associated with doubleton samples containing sewage and/or
septage as the minor contributor or 1:10 strength singletons.
Again, for non-human methods, the highest %CV values were
commonly associatedwith 1:10 strength singleton or doubleton
samples where the DNA target source was the minor
contributor.
3.4. Reproducibility among laboratories using non-standardized protocols and reagents
Platform variability was expected to have contributed to inter-
laboratory variability based on preliminary visual inspection
of initial regression analyses between results obtained on
different platforms for the same method; a particular bias by
ABI StepOnePlus appeared for most methods. Results of the
GLM procedure in SAS showed that platform was not a sig-
nificant contributor ( p-value>0.05) to variability for any of the
nine qPCR methods analyzed. However, other factors such as
sample type (which includes both fecal source and filter
strength) and filter-to-filter variability contributed signifi-
cantly ( p-value <0.01) to the total variability associated with
these methods. These findings were consistent with the re-
sults of the variance component analysis in Section 3.5.
For the sixmethods for which data from both core (1e5) and
non-core (6e10) laboratories were available, the median inter-
laboratory %CV for each method ranged from 3.4% to 17.6%
(Fig. 3). Median %CV values and overall ranges were generally
higher for allmethodswhen protocol and reagentswere varied,
with the exception of the HumM2 method. The HumM2
method showed a slightly lowermedian%CV but a similar %CV
distribution when protocol and reagents were varied (Fig. 3).
BacHum and Gull2Taqman showed the greatest increases in %
CV when protocol and reagents were varied (Fig. 3).
3.5. Relative contribution of intra- and inter-laboratoryvariability to total variability among laboratories usingstandardized protocols and reagents
Nested ANOVA with variance component analysis showed the
relative contributions of single factors to the total variability in
the whole dataset for each qPCR method (Fig. 4). As expected,
SampleType (fecal source and strength) contributed themost to
total variability for each of these methods (Table 3, Fig. 4),
simply reflecting the fact that our challenge samples had
various concentrations of target genetic markers for any given
qPCR method. Inter-laboratory variability (i.e. the factor
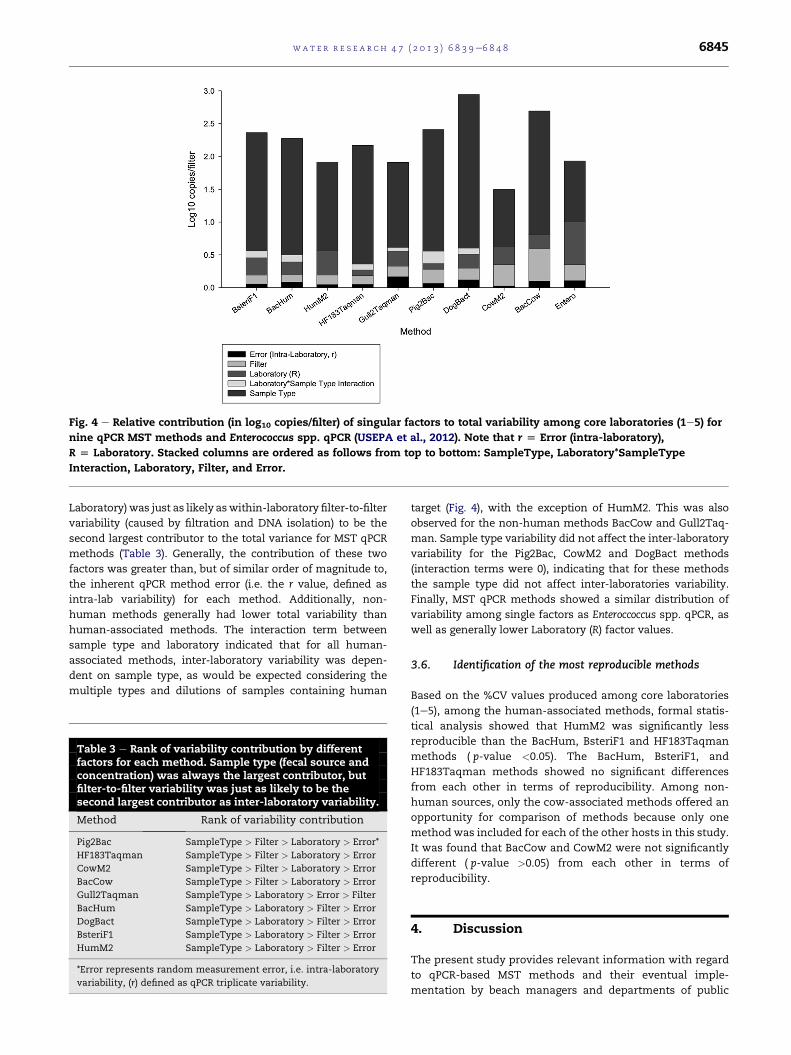
Fig. 4 e Relative contribution (in log10 copies/filter) of singular factors to total variability among core laboratories (1e5) for
nine qPCR MST methods and Enterococcus spp. qPCR (USEPA et al., 2012). Note that r [ Error (intra-laboratory),
R [ Laboratory. Stacked columns are ordered as follows from top to bottom: SampleType, Laboratory*SampleType
Interaction, Laboratory, Filter, and Error.
wat e r r e s e a r c h 4 7 ( 2 0 1 3 ) 6 8 3 9e6 8 4 8 6845
Laboratory)was just as likely aswithin-laboratory filter-to-filter
variability (caused by filtration and DNA isolation) to be the
second largest contributor to the total variance for MST qPCR
methods (Table 3). Generally, the contribution of these two
factors was greater than, but of similar order of magnitude to,
the inherent qPCR method error (i.e. the r value, defined as
intra-lab variability) for each method. Additionally, non-
human methods generally had lower total variability than
human-associated methods. The interaction term between
sample type and laboratory indicated that for all human-
associated methods, inter-laboratory variability was depen-
dent on sample type, as would be expected considering the
multiple types and dilutions of samples containing human
Table 3 e Rank of variability contribution by differentfactors for each method. Sample type (fecal source andconcentration) was always the largest contributor, butfilter-to-filter variability was just as likely to be thesecond largest contributor as inter-laboratory variability.
Method Rank of variability contribution
Pig2Bac SampleType > Filter > Laboratory > Error*
HF183Taqman SampleType > Filter > Laboratory > Error
CowM2 SampleType > Filter > Laboratory > Error
BacCow SampleType > Filter > Laboratory > Error
Gull2Taqman SampleType > Laboratory > Error > Filter
BacHum SampleType > Laboratory > Filter > Error
DogBact SampleType > Laboratory > Filter > Error
BsteriF1 SampleType > Laboratory > Filter > Error
HumM2 SampleType > Laboratory > Filter > Error
*Error represents random measurement error, i.e. intra-laboratory
variability, (r) defined as qPCR triplicate variability.
target (Fig. 4), with the exception of HumM2. This was also
observed for the non-human methods BacCow and Gull2Taq-
man. Sample type variability did not affect the inter-laboratory
variability for the Pig2Bac, CowM2 and DogBact methods
(interaction terms were 0), indicating that for these methods
the sample type did not affect inter-laboratories variability.
Finally, MST qPCR methods showed a similar distribution of
variability among single factors as Enteroccoccus spp. qPCR, as
well as generally lower Laboratory (R) factor values.
3.6. Identification of the most reproducible methods
Based on the %CV values produced among core laboratories
(1e5), among the human-associated methods, formal statis-
tical analysis showed that HumM2 was significantly less
reproducible than the BacHum, BsteriF1 and HF183Taqman
methods ( p-value <0.05). The BacHum, BsteriF1, and
HF183Taqman methods showed no significant differences
from each other in terms of reproducibility. Among non-
human sources, only the cow-associated methods offered an
opportunity for comparison of methods because only one
method was included for each of the other hosts in this study.
It was found that BacCow and CowM2 were not significantly
different ( p-value >0.05) from each other in terms of
reproducibility.
4. Discussion
The present study provides relevant information with regard
to qPCR-based MST methods and their eventual imple-
mentation by beach managers and departments of public

wat e r r e s e a r c h 4 7 ( 2 0 1 3 ) 6 8 3 9e6 8 4 86846
health. For labs employing standardized protocols, intra- and
inter-laboratory %CV values were generally low, with median
%CV for all MST methods evaluated ranging from 1.1 to 3.3%
and 1.9e7.1%, respectively. These values were similar to those
found during inter-laboratory validation of qPCR methods for
enumeration of fecal indicator bacteria (FIB), as well as those
found during inter-laboratory validation of methods for
enumeration of FIB from sand (Shanks et al., 2012; Cao et al.,
2011, 2013). The (r) and (R) values for MST qPCR methods
were also similar to those observed for the Enterococcus spp.
qPCR method. Variance component analysis showed filter-to-
filter and inter-laboratory variance contribution for MST
methods to be of similar magnitude to random error
(0.03e0.56 log10copies/filter). It is also important to note that
the filter-to-filter factor included variability associated with
the filtration of sample replicates as well as the variability
associated with nucleic acid isolation and purification.
Considering the above, these results corroborate the integrity
of both the challenge filter sets and the results of this study.
The observation that the highest %CV values were most
often associated with 1:10 strength or minor contributor
doubleton challenge samples is not surprising as these sam-
ples often contained lower concentrations of target DNA
compared to full strength singletons, and higher variability as
a function of higher Cq values would be expected (Cao et al.,
2012a). It is also important to note that the lower reproduc-
ibility observed with the HumM2method is most likely due to
a DNA target concentration effect rather than factors inherent
to the protocol: HumM2 target concentrations were typically
1e2 log10 copies/filter lower than human target concentra-
tions estimated by other methods. This may be attributed to
the fact that HumM2 targets a single-copy functional gene,
while the other human-associated methods target more
conserved genes encoding 16S rRNA (Shanks et al., 2010a).
Indeed, when the core laboratory LLOQ for HumM2 was
readjusted to 100 copies per reaction (approximately 3.7 log10copies/filter) instead of 40, the maximum inter-laboratory %
CV value was appreciably lower (11.8% compared to 15.3%),
further supporting this theory. Interaction between the Sam-
pleType and Laboratory factors in the ANOVA model also
indicated the concentration difference (BLOQ vs. ROQ)
affected inter-laboratory reproducibility. This observation
suggests that methods with higher analytical sensitivity,
which would produce results at a relatively lower Cq aremore
reproducible. However, it remains undetermined how
important the 1e2 log10 copies/filter difference in DNA target
concentration between HumM2 and other human-associated
assays is for MST applications. For example, it could be
considered an advantage or liability for a more sensitive
human-associated method to detect very low concentrations
of human fecal pollution in waters depending on the partic-
ular water quality application. Overall, though, these obser-
vations further suggest that methods with higher analytical
sensitivity, which would produce results at a relatively lower
Cq, are more reproducible.
The finding that use of these two different amplification
platforms contributed an insignificant amount of variability
when all other aspects of protocols and reagents were stan-
dardized is also consistent with recent findings (Cao et al.,
2013a, b). However, it is unclear if this finding can be
extended to platforms that have not otherwise been tested
with these protocols and would potentially need to be re-
evaluated if amplification platform was not standardized for
method implementation.
It should be considered that this study was not exclusively
designed with repeatability and reproducibility assessment in
mind. Given the logistical implications of generating replicate
challenge filter sets consisting of 64 filters for more than 25
participating laboratories, decisions had to be made regarding
priority of pollution sources. The design of the challenge filter
set was heavily weighted toward human sources: 38 of 64 fil-
ters (w60%) contained either solid human feces, sewage or
septage,while non-human sourceswere present on between 2
and 12 filters of the 64 (Boehm et al. 2013, Cao et al. 2013a, b,
2012b). Unequal sample size does influence the statistical
comparison of %CV values between human and non-human
methods (Cao et al. 2013b, 2012b). Additionally, the use of
only solid feces with relatively high marker concentrations
and no lower concentration effluent-type sources for non-
human challenge samples may explain the generally lower
%CV values (thus better reproducibility) and lower total vari-
ability observed for the non-human compared to the human-
associated methods. This situation may account for the good
reproducibility observed for the CowM2 method compared to
the HumM2 method. Like the HumM2 method, the CowM2
method detected DNA target concentrations 1e2 log10 copies/
filter lower than its comparative method (BacCow). Nonethe-
less, the CowM2 method was more reproducible compared to
the HumM2 method, which may stem from the fact that the
cow target samples were all generated from solid feces rather
than effluents may account for its performance compared to
the HumM2 method. A more balanced study design would be
required to prove that nonhuman-associated methods were
truly more reproducible than human-associated methods.
These results, however, are an important first step toward
better understanding whether some of these molecular
methods lend themselves to field applications for the accurate
identification of primary sources and the relative loadings
with which they are associated.
The findings of this study indicate that deviations from a
standardized protocol can have varying and substantial im-
pacts on the reproducibility of qPCR-based MST methods.
While this study was not designed to quantify the contribu-
tion of each protocol deviation to sample concentration vari-
ability (as in Shanks et al 2012; Cao et al., 2013a), these findings
affirm the need to establish standardized protocols in terms of
laboratory and data analysis as well as centralized sources of
reference materials to ensure successful implementation and
technology transfer. For example, for the Pig2Bac method,
laboratory 8 employed a nucleic acid isolation approach
different than the core laboratories, wherein no physical lysis
step was used, and also utilized different qPCR reagents than
core laboratories (Table 3a,b). The combination of extraction
protocol and reagent deviations appeared to translate to
appreciably higher inter-laboratory %CV values compared to
when protocol and reagents were standardized (Fig. 3).
Conversely, for the HumM2 method, laboratory 9 only devi-
ated from the protocols and reagents employed by core labo-
ratories in its use of different qPCR reagents, and was able to
produce very similar results, as indicated by the %CV

wat e r r e s e a r c h 4 7 ( 2 0 1 3 ) 6 8 3 9e6 8 4 8 6847
distributions (Fig. 3). This suggests that deviations at the
nucleic acid isolation step may have an appreciable impact on
reproducibility, which is consistent with the findings of other
studies (Pan et al., 2010), however a more structured evalua-
tion would be needed to confirm. Regardless, the data indicate
that lack of standardization is expected to increase variability
in results.
Although efforts were made to provide varying challenge
filter concentration levels, the samples analyzed in this study
were comprised of relatively concentrated fecal, sewage, and
septage source materials. For some samples, host-associated
sequences were present at concentrations upwards of 109
gene copies/filter. Concentrations this high, though not
impossible to find in some ambient waters, are not likely to
occur in the natural environment and thus evaluation of
repeatability and reproducibility at lower, more environ-
mentally realistic concentrations is necessary. Also, consid-
ering the increased variability associated with the higher Cq
values that would occur in more environmentally realistic
concentrations, evaluation of reproducibility on challenge
samples containing target concentrations at or near the LLOQ
would be especially relevant. While this challenge filter set
did contain a subset of lower strength samples that may have
offered opportunity to further investigate reproducibility in
this range, despite best effort, the actual singleton Entero-
coccus concentrations were highly variable, ranging from
148e4.7 � 106 MPN/50 ml, and did not provide sufficient data
at low enough concentrations for separate analysis (Ervin
et al. 2013). Furthermore, more complex matrices exist in
the natural environment that may lead to amplification
interference or result in false positives due to amplification of
non-target sequences. Future multiple laboratory studies
focusing on the reproducibility of MST methods should ac-
count for multiple types of sample matrices containing more
environmentally relevant target concentrations. Finally, the
relationship between target aging and reproducibility was not
explored in this study, and is an important factor for field
MST applications that must be examined in future work.
5. Conclusions
In summary, the present study determined the following:
� CV within and among laboratories for qPCR-based MST
methods were generally comparable to published values for
other methods for the enumeration of FIB, with the excep-
tion of some values produced by filters containing low levels
of target DNA.
� Reproducibility of DNA target concentration estimates de-
creases as Cq values approach the LLOQ suggesting that
accurate quantification of samples with less than 100
copies/reaction may not be feasible across multiple labora-
tories. Thus, more analytically sensitive methods will be
more reproducible across laboratories.
� Inter-laboratory variability was found to be higher than
intra-laboratory variability for most methods, however
relative contribution to total variability was typically of the
same order of magnitude as intra-laboratory error.
� An insignificant amount of the inter-laboratory variability
was attributable to thermal cycler platform differences for
all methods analyzed when protocols and reagents were
otherwise standardized.
� Observed differences between laboratories utilizing variable
protocols and reagents varied widely, but generally protocol
or reagent deviations resulted in increased %CV values and
thus lowered reproducibility.
� Overall, findings confirmed the need to further investigate
reproducibility of qPCR quantification for these MST
methods near the LLOQs, the concentration levels likely to
occur in the environment
� Findings suggest a need to standardize protocols, equip-
ment and consumables prior to routine implementation of
MST technologies.
Acknowledgments
We would like to acknowledge all participants in the Source
Identification Protocol Project (SIPP) study. Funding for this
project has been provided in part through an agreement with
the California State Water Resources Control Board. The
contents of this document do not necessarily reflect the
views and policies of the California State Water Resources
Control Board, nor does mention of trade names or com-
mercial products constitute endorsement or recommenda-
tion for use.
Appendix A. Supplementary data
Supplementary data related to this article can be found at
http://dx.doi.org/10.1016/j.watres.2013.01.060.
r e f e r e n c e s
Boehm, A.B., Van De Werfhorst, L., Griffith, J.F., Holden, P.,Jay, J.A., Shanks, O.C., Wang, D., Weisberg, S.B., 2013.Performance of forty-one microbial source tracking methods:a twenty-seven lab evaluation study. Water Research 47 (18),6812e6828.
Bustin, S.A., Benes, V., Garson, J.A., Hellemans, J., Huggett, J.,Kubista, M., Mueller, R., Nolan, T., Pfaffl, M.W.,Shipley, G.L., Vandesompele, J., Wittwer, C.T., 2009. TheMIQE guidelines: minimum information for publication ofquantitative real-time PCR experiments. Clinical Chemistry55 (4), 611e622.
Cao, Y., McGee, C.D., Griffith, J.F., Weisberg, S.B., 2011. Methodrepeatability for measuring Enterococcus in southernCalifornia beach sands. Letters in Applied Microbiology 53(6), 656e659.
Cao, Y., Griffith, J.F., Dorevitch, S., Weisberg, S.B., 2012a.Effectiveness of qPCR permutations, internal controls anddilution as means for minimizing the impact of inhibitionwhile measuring Enterococcus in environmental waters.Journal of Applied Microbiology 113 (1), 66e75.
Cao, Y., Dubinsky, E.A., Badgley, B.D., Sadowsky, M.J.,Andersen, G.L., Griffith, J.F., Holden, P.A., 2012b. Evaluation ofmolecular community analysis methods for discerning fecal
wat e r r e s e a r c h 4 7 ( 2 0 1 3 ) 6 8 3 9e6 8 4 86848
sources and human waste. Water Research. submitted forpublication.
Cao, Y., Sivaganesan, M., Kinzelman, J.L., Blackwood, A.D.,Noble, R., Haugland, R., Griffith, J.F., Weisberg, S.B., 2013a.Effect of platform, reference material, and quantificationmodel on enumeration of Enterococcus by quantitative PCRmethods. Water Research 47 (1), 233e241.
Cao, Y., Van De Werfhorst, L.C., Scott, E., Raith, M., Holden, P.A.,Griffith, J.F., 2013b. Bacteroidales terminal restrictionfragment length polymorphism (TRFLP) for fecal sourcedifferentiation in comparison to and in combination withUniversal Bacteria TRFLP. Water Research 47 (18), 6944e6955.
Ervin, J.S., Russell, T.L., Layton, B.A., Yamahara, K.M., Wang, D.,Sassoubre, L.M., Cao, Y., Kelty, C.A., Sivaganesan, M.,Boehm, A.B., Holden, P.A., Weisberg, S.B., Shanks, O.C., 2013.Characterization of fecal concentrations in human and otheranimal sources by physical, culture-based, and quantitativereal-time PCR methods. Water Research 47 (18), 6873e6882.
Griffith, J.F., Weisberg, S.B., McGee, C.D., 2003. Evaluation ofmicrobial source tracking methods using mixed fecal sourcesin aqueous test samples. Journal of Water and Health 1 (3),141e151.
Haugland, R.A., Siefring, S.C., Wymer, L.J., Brenner, K.P.,Dufour, A.P., 2005. Comparison of Enterococcusmeasurements in freshwater at two recreational beaches byquantitative polymerase chain reaction and membrane filterculture analysis. Water Research 39 (4), 559e568.
Langton, S.D., Chevennement, R., Nagelkerke, N., Lombard, B.,2002. Analysing collaborative trials for qualitativemicrobiological methods: accordance and concordance.International Journal of Food Microbiology 79, 175e181.
Pan, Y., Bodrossy, L., Frenzel, P., Hestnes, A.-G., Krause, S.,Luke, C., Meima-Franke, M., Siljanen, H., Svenning, M.M.,Bodelier, P.L.E., 2010. Impacts of inter- and intralaboratoryvariations on the reproducibility of microbial communityanalyses. Applied and Environmental Microbiology 76 (22),7451e7458.
Santo Domingo, J.W., Bambic, D.G., Edge, T.A., Wuertz, S., 2007.Quo vadis source tracking? towards a strategic framework forenvironmental monitoring of fecal pollution. Water Research41 (16), 3539e3552.
Schulten, S., in’t Veld, P., Nagelkerke, N., Scotter, S., de Buyser, M.,Rollier, P., Lahellec, C., 2000. Evaluation of the ISO 7932standard for the enumeration of Bacillus cereus in foods.International Journal of Food Microbiology 57, 53e61.
Shanks, O.C., White, K., Kelty, C., Sivaganesan, M., Blannon, J.,Meckes, M., Varma, M., Haugland, R., 2010a. Performance ofPCR-based assays targeting Bacteroidales genetic markers ofhuman fecal pollution in sewage and fecal samples.Environmental Science & Technology 44 (16), 6281e6288.
Shanks, O.C., White, K., Kelty, C.A., Hayes, S., Sivaganesan, M.,Jenkins, M., Varma, M., Haugland, R.A., 2010b. Performanceassessment PCR-based assays targeting Bacteroidales geneticmarkers of Bovine fecal pollution. Applied and EnvironmentalMicrobiology 76 (5), 1359e1366.
Shanks, O.C., Sivaganesan, M., Peed, L., Kelty, C.A.,Blackwood, A.D., Greene, M.R., Noble, R.T., Bushon, R.N.,Stelzer, E.A., Kinzelman, J., Anan’eva, T., Sinigalliano, C.,Wanless, D., Griffith, J., Cao, Y., Weisberg, S., Harwood, V.J.,Staley, C., Oshima, K.H., Varma, M., Haugland, R.A., 2012.Interlaboratory comparison of real-time PCR protocols forquantification of general fecal indicator bacteria.Environmental Science & Technology 46 (2), 945e953.
Simpson, J.M., Santo Domingo, J.W., Reasoner, D.J., 2002.Microbial source tracking: state of the Science. EnvironmentalScience & Technology 36 (24), 5279e5288.
Soller, J.A., Schoen, M.E., Bartrand, T., Ravenscroft, J.E.,Ashbolt, N.J., 2010. Estimated human health risks fromexposure to recreational waters impacted by human andnon-human sources of faecal contamination. Water Research44 (16), 4674e4691.
Stoeckel, D., Mathes, M., Hyer, K., Hagedorn, C., Kator, H.,Lukasik, J., O’Brien, T., Fenger, T., Samadpour, M., Strickler, K.,Wiggins, B., 2004. Comparison of seven protocols to identifyfecal contamination sources using Escherichia coli.Environmental Science & Technology 38, 6109e6117.
Stoeckel, D.M., Harwood, V.J., 2007. Performance, design, andanalysis in microbial source tracking studies. Applied andEnvironmental Microbiology 73 (8), 2405e2415.
USEPA, 2012. In: O.o.W.T. (Ed.), Method 1611: Enterococci in Waterby TaqMan� Quantitative Polymerase Chain Reaction (qPCR)Assay. US Environmental Protection Agency, Washington, DC.
Related Documents