This article appeared in a journal published by Elsevier. The attached copy is furnished to the author for internal non-commercial research and education use, including for instruction at the authors institution and sharing with colleagues. Other uses, including reproduction and distribution, or selling or licensing copies, or posting to personal, institutional or third party websites are prohibited. In most cases authors are permitted to post their version of the article (e.g. in Word or Tex form) to their personal website or institutional repository. Authors requiring further information regarding Elsevier’s archiving and manuscript policies are encouraged to visit: http://www.elsevier.com/authorsrights

Welcome message from author
This document is posted to help you gain knowledge. Please leave a comment to let me know what you think about it! Share it to your friends and learn new things together.
Transcript
This article appeared in a journal published by Elsevier. The attachedcopy is furnished to the author for internal non-commercial researchand education use, including for instruction at the authors institution
and sharing with colleagues.
Other uses, including reproduction and distribution, or selling orlicensing copies, or posting to personal, institutional or third party
websites are prohibited.
In most cases authors are permitted to post their version of thearticle (e.g. in Word or Tex form) to their personal website orinstitutional repository. Authors requiring further information
regarding Elsevier’s archiving and manuscript policies areencouraged to visit:
http://www.elsevier.com/authorsrights
Author's personal copy
Journal of Hazardous Materials 265 (2014) 296– 304
Contents lists available at ScienceDirect
Journal of Hazardous Materials
j o ur nal homep age: www.elsev ier .com/ locate / jhazmat
Evaluation of the phototransformation of the antiviral zanamivir insurface waters through identification of transformation products
Bozo Zonjaa, Carlos Gonc alvesb,c, Sandra Péreza,∗, Antonio Delgadod,e, Mira Petrovic f,g,Maria Fátima Alpenduradab,c, Damià Barcelóa,g
a Water and Soil Quality Research Group, IDAEA-CSIC, c/ Jordi Girona, 18-26, 08034 Barcelona, Spainb IAREN – Water Institute of the Northern Region, Rua Dr. Eduardo Torres, 229, 4450-113 Matosinhos, Portugalc Laboratory of Hydrology, Faculty of Pharmacy, University of Porto, Rua Aníbal Cunha, 164, 4050-047 Porto, Portugald University of Barcelona (UB), Faculty of Pharmacy; Unit of Medicinal Chemistry (Associated to CSIC), Avda. Joan XXIII, s/n, 08028 Barcelona, Spaine Institute of Advanced Chemistry of Catalonia (IQAC-CSIC), Research Unit on Bioactive Molecules (RUBAM), Department of Biomedicinal Chemistry,Jordi Girona 18-26, 08034 Barcelona, Spainf ICREA, Passeig Lluis Companys 23, 08010 Barcelona, Spaing ICRA, C/ Emili Grahit, 101, Edifici H2O, 17003 Girona, Spain
h i g h l i g h t s
• Sunlight photodegradation of zanamivir in surface waters was investigated.• Four new TPs were tentatively identified of which one was persistent.• A new methodology using HILIC-LTQ Orbitrap-MS for identification of the TPs was established.• Phototransformation pathways of zanamivir were mechanistically explained.
a r t i c l e i n f o
Article history:Received 29 August 2013Received in revised form 2 October 2013Accepted 4 October 2013Available online 24 October 2013
Keywords:PhotodegradationPharmaceuticalLC–MSHigh resolutionTransformation products and pathways
a b s t r a c t
The antiviral zanamivir has been recently reported to occur in surface waters where its presence maylead to the selection of resistant strains of virus in aquatic fauna. In order to evaluate the fate of zanamivirin surface waters, its susceptibility to phototransformation was evaluated using simulated and naturalsunlight. Upon exposure of aqueous solutions (20 �g L−1) to simulated sunlight, zanamivir in surfacewater degraded at t1/23.6 h. Under natural sunlight in surface water about 30% of the initial concentrationof the antiviral disappeared within 18 days. The experiments with surface water showed similar effectas humic acid addition with expected decreasing effect on degradation while nitrate addition showedincreasing effect. In the experiments with artificial sunlight at high concentrations of zanamivir, fourphotoproducts were tentatively identified by hydrophilic interaction chromatography-LTQ-Orbitrap-MS,showing [M+H]+ ions at m/z 112 (TP111), m/z 275 (TP274), m/z 323 (TP322), and m/z 333 (TP332). How-ever at 20 �g L−1 only the formation of the recalcitrant TP111 was observed. The proposed structures wererationalized by photolysis mechanisms. Photoproduct TP111 was confirmed with a commercially avail-able standard (isocytosine). In summary, the findings suggest that the photodegradation of zanamivir insurface waters proceeds with slow kinetics.
© 2013 Elsevier B.V. All rights reserved.
1. Introduction
Zanamivir is a highly potent and selective neuraminidaseinhibitor recommended by WHO for the treatment and pro-phylaxis of influenza virus A and B during pandemias. Severalcountries increased the stockpiles of zanamivir as an alternative
∗ Corresponding author at: IDAEA-CSIC, Department of Environmental Chemistry,Jordi Girona 18-26, Barcelona 08034, Spain. Tel.: +34 93 400 6100x5310;fax: +34 93 204 5904.
E-mail addresses: [email protected], [email protected] (S. Pérez).
to oseltamivir following the 2009 influenza pandemia [1]. Forinstance, the use of zanamivir rose as Tamiflu (oseltamivir)-resistant H1N1 virus was recorded during the 2008–09 flu seasonin Japan [2]. Furthermore, in the absence of suitable vaccines inthe early stages of influenza outbreaks, the first line of defence isantiviral drugs. Large amounts of these drugs are, thus, consumedworldwide and may reach the environment via human excretionsor improper disposal [3–5]. The effectiveness of these drugs willdiminish with the emergence of resistant strains of the virus causedby improper human use and undesired high levels of antivirals inthe aquatic environment in contact with wildfowl [4].
0304-3894/$ – see front matter © 2013 Elsevier B.V. All rights reserved.http://dx.doi.org/10.1016/j.jhazmat.2013.10.008
Author's personal copy
B. Zonja et al. / Journal of Hazardous Materials 265 (2014) 296– 304 297
Using Q(SAR) modelling for 2986 different compounds, Sander-son et al. [6] ranked the antiviral drugs among the eighth predictedmost hazardous therapeutic classes with regard to their toxic-ity towards algae, daphnia and fish. The reports of Cunninghamet al. [5] showed that zanamivir suffers negligible metabolismin human body (almost 100% is renally excreted) and removalby both primary and secondary wastewater treatments is alsoinsignificant. Based on the modelling carried out by these authors,zanamivir did not appear to pose an appreciable risk to humanhealth from potential environmental exposure through consump-tion of contaminated drinking water and fish. Even though worstcase scenarios were used for several variables, the predicted envi-ronmental concentrations (PEC) are average figures, not taking intoaccount neither peak seasonal or pandemic disease nor seasonaldecrease of river flow rates. Furthermore, indirect risks from devel-opment of antiviral resistance were not taken into account. The PECfor zanamivir was estimated to be 0.1 ng L−1 in surface waters [5].The same authors reckon that a number of uncertainties remain,including: the assessment of the human health risk of chronicexposures to mixtures of pharmaceuticals; relative susceptibilityof individuals and the effectiveness of existing water treatmenttechnologies in removing pharmaceutical residues [5].
Due to its high polarity, the analytical determination ofzanamivir is challenging and, as of today, few liquid chromatog-raphy–mass spectrometry (LC–MS)-based methods have beendeveloped. Most of them deal with the analysis of the antiviral agentin biological matrices. Column chemistries varied from normalphase LC [7], reversed-phase (RP) LC [8] and hydrophilic interac-tion liquid chromatography (HILIC) [9]. The attractiveness of thelatter variant arises from the fact that the mobile phase compositionis fully compatible with electrospray ionization (ESI) with an ele-vated percentage of organic solvent in the mobile phase enhancingionization efficiency and thus detection sensitivity [10].
A recent study from 2012 on the presence of zanamivir in sam-ples from wastewater treatment plants and surface waters showedthat it was detectable in river water (up to 15 ng L−1) [2]. Despitethese low levels awareness should be kept on the selection ofresistant strains of virus in the aquatic fauna. In future years itis possible that the general usage of the drug will increase, sincesome influenza virus showed resistance to alternative drugs [11].As reported [12–14] in surface waters, photochemical degradationis likely to be the most important mechanism for many pharma-ceutical pollutants loss, which would make the knowledge of thephotodegradation pathways and kinetics essential to predict thebehaviour and the environmental impact of these pollutants innatural waters. To date, there is no information about the pho-todegradation mechanisms of zanamivir in surface waters and inview of the presence of zanamivir in surface waters and havingin mind its possible increasing usage, in this work we studied thesusceptibility of zanamivir to photodegradation in surface waters,which is considered a key process governing the whereabouts oforganic micro-pollutants in surface waters. Irradiation experimentswere carried out under simulated solar irradiation using a Suntestapparatus as well as by exposure to natural sunlight during autumnof 2009. Identification of transformation products were assessed byHILIC coupled to high-resolution LTQ-Orbitrap-MS. Low resolutiontandem MS on a triple quadrupole MS was employed for studyingthe photolysis kinetics in different synthetic and natural matrices.
2. Experimental
2.1. Chemicals and reagents
Zanamivir (CAS 139110-80-8) was purchased from TorontoResearch Chemicals (Ontario, Canada) and Isocytosine (CAS
108-53-2), purity ≥99%, was purchased from Sigma–Aldrich (Belle-fonte, PA, USA). Water and acetonitrile for the LTQ-Orbitrap-MSanalysis were purchased from Fischer Scientific in case of analy-sis while methanol was Baker analyzed LC–MS reagent (JTBaker,Deventer, Netherlands). Water, acetonitrile and methanol forUPLC–tandem MS analysis were LiChrosolv grade from Merck(Darmstadt, Germany). Formic acid Suprapur (>98%) was obtainedalso from Merck. The chemical actinometer 2-nitrobenzaldehyde(CAS 552-89-6, 98% purity) was obtained from Sigma–Aldrich.
2.2. Measurement of UV spectra and quantum yield calculation
Measurement of the UV–vis spectra is included in the sup-porting information. The quantum yield was calculated using2-Nitrobenzaldehyde as a reference, for more detail see supportinginformation (SI-9).
2.3. Photodegradation experiments
The photodegradation experiments conducted under simulatedsolar irradiation conditions were performed in a Suntest CPS sim-ulator (Heraeus, Hanau, Germany). The system was equipped witha Xenon arc lamp and appropriate glass filters to restrict thetransmission of irradiation wavelengths below 290 nm, giving awavelength spectrum closely resembling solar light. The lampintensity was adjusted to an irradiance of 500 W m−2 correspond-ing to a light dose of 1800 kJ m−2 h−1. The samples irradiated inthe Suntest apparatus and the direct sunlight assays were con-tained in crimp-cap 20-mL quartz vials. At pre-defined time points2 mL aliquots were withdrawn from the vials and frozen imme-diately. Control solutions preserved in the dark with aluminiumfoil in the suntest and were sampled at the same time points asthe irradiation experiments to account for any light-independentbreakdown processes. Before LC–MS analysis, the samples werefreeze-dried overnight and thereafter reconstituted in 100 �L ofCH3CN/H2O (3:2) for the determination of zanamivir. The experi-ments intended for the identification of the phototransformationproducts were carried out at a concentration of 40 mg L−1 to assurethe generation of product ion spectra with sufficient intensity,whereas the kinetic studies were performed with zanamivir spikedat 1 mg L−1 and 20 �g L−1respectively. The low concentration wassufficient to monitor the disappearance of the test compound until99% was photolysed. For the laboratory studies and natural sun-light, zanamivir was added to surface water matrices: (i) artificialfresh water (AFW) resembling a moderately hard water (96 mg L−1
NaHCO3, 60 mg L−1 CaSO4·2H2O, 60 mg L−1 MgSO4 and 4 mg L−1
KCl; pH: 6.6), (ii) AFW containing 5 mg L−1 of NO3 (pH: 6.6) and(iii) AFW water containing humic acids with an absorbance of 0.670(equivalent to 5 mg L−1; pH: 7.3). (iv) river water collected from theLlobregat river (Table S1 [15]). The stock solution of humic acidswas prepared in water as described in the literature [15]. The latterset of experiments was conducted on the roof terrace of the CSICbuilding for a period of 21 days (starting on November 9, 2009; totalaccumulated radiation: 164 MJ m−2) for spiked and before men-tioned surface water collected from LLobregat river. The radiationconditions in the period of October to December 2009 are givenin Fig. S1. Prior to spiking, the river water was sterilized by fil-tration with 0.22 �m (Durapore) filters to prevent any microbialdegradation of zanamivir.
2.4. UPLC-LTQ-Orbitrap-MS, and UPLC-QqQ MS analysis
LTQ-Orbitrap Velos (ThermoFisher, San José, CA) was used forthe identification of the photoproducts. The parameters of theelectrospray ionization source were adjusted as follows: polar-ity (+)ESI, spray voltage +3.0 kV, heater temperature 350 ◦C, and
Author's personal copy
298 B. Zonja et al. / Journal of Hazardous Materials 265 (2014) 296– 304
capillary temperature 350 ◦C. The chromatographic separation ofthe samples was performed on a Waters Acquity UPLC BEH HILICcolumn (50 mm × 2.1 mm, 1.7 �m) (Waters, Milford, USA) precededby a pre-column of the same packing material (5 mm × 2.1 mm,1.7 �m). The mobile phases employed were: (A) acetonitrile with0.1% formic acid and (B) water (0.1% formic acid). Elution wasaccomplished with the following solvent gradient: 0 min (95% A)– 1 min (85% A) – 6 min (60% A), – 8 min (60% A) – 10 min (95% A)and stabilizing until 13 min. The flow rate was 300 �L min−1 andthe column temperature was held at 35 ◦C. The injection volumewas 10 �L.
Following the tentative identification of the major photo-transformation products of zanamivir, a quantitative method wasestablished to describe the reaction kinetics in artificial and naturalwater samples. A Waters TQD triple quadrupole MS connected toan Acquity UPLC system were used for that purpose. The parame-ters of the ESI source were set as follows: polarity (+)ESI, capillaryvoltage 3.0 kV, source temperature 120 ◦C, nebulizer gas 50 L h−1,desolvation gas 600 L h−1, and desolvation gas temperature 350 ◦C.The chromatographic separation of the samples was performedon a Waters Acquity UPLC binary solvent manager equipped witha BEH HILIC column (50 mm × 2.1 mm, 1.7 �m) (Waters, Milford,USA) preceded by a pre-column of the same packing material(10 mm × 2.1 mm, 3 �m). The mobile phases and chromatographicgradient is the same as LTQ Orbitrap Velos. The MS/MS parametersused for the acquisitions in MRM mode were individually opti-mized for zanamivir, and its respective photoproducts (see TableS2 in Supporting Information). Instrument control and data man-agement were performed by MassLynx V4.1 software (Waters) andXcalibur (Thermo Scientific).
3. Results and discussion
3.1. Optimization of the chromatographic separation
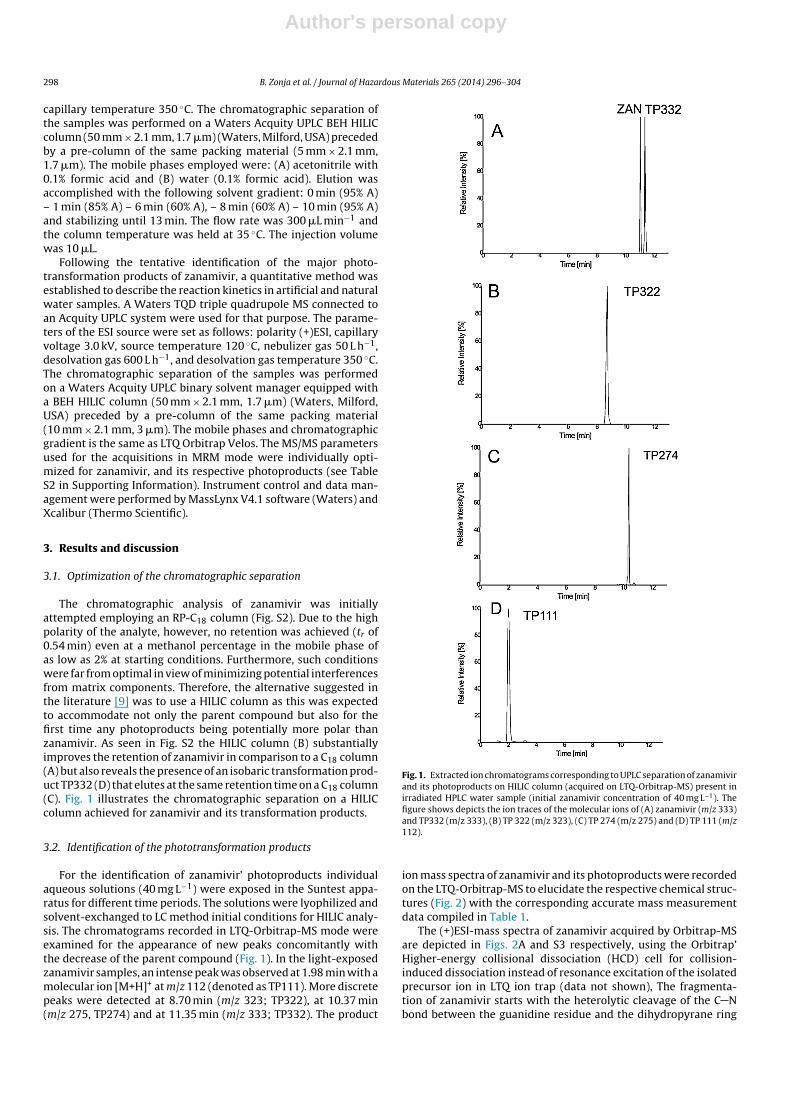
The chromatographic analysis of zanamivir was initiallyattempted employing an RP-C18 column (Fig. S2). Due to the highpolarity of the analyte, however, no retention was achieved (tr of0.54 min) even at a methanol percentage in the mobile phase ofas low as 2% at starting conditions. Furthermore, such conditionswere far from optimal in view of minimizing potential interferencesfrom matrix components. Therefore, the alternative suggested inthe literature [9] was to use a HILIC column as this was expectedto accommodate not only the parent compound but also for thefirst time any photoproducts being potentially more polar thanzanamivir. As seen in Fig. S2 the HILIC column (B) substantiallyimproves the retention of zanamivir in comparison to a C18 column(A) but also reveals the presence of an isobaric transformation prod-uct TP332 (D) that elutes at the same retention time on a C18 column(C). Fig. 1 illustrates the chromatographic separation on a HILICcolumn achieved for zanamivir and its transformation products.
3.2. Identification of the phototransformation products
For the identification of zanamivir’ photoproducts individualaqueous solutions (40 mg L−1) were exposed in the Suntest appa-ratus for different time periods. The solutions were lyophilized andsolvent-exchanged to LC method initial conditions for HILIC analy-sis. The chromatograms recorded in LTQ-Orbitrap-MS mode wereexamined for the appearance of new peaks concomitantly withthe decrease of the parent compound (Fig. 1). In the light-exposedzanamivir samples, an intense peak was observed at 1.98 min with amolecular ion [M+H]+ at m/z 112 (denoted as TP111). More discretepeaks were detected at 8.70 min (m/z 323; TP322), at 10.37 min(m/z 275, TP274) and at 11.35 min (m/z 333; TP332). The product
Fig. 1. Extracted ion chromatograms corresponding to UPLC separation of zanamivirand its photoproducts on HILIC column (acquired on LTQ-Orbitrap-MS) present inirradiated HPLC water sample (initial zanamivir concentration of 40 mg L−1). Thefigure shows depicts the ion traces of the molecular ions of (A) zanamivir (m/z 333)and TP332 (m/z 333), (B) TP 322 (m/z 323), (C) TP 274 (m/z 275) and (D) TP 111 (m/z112).
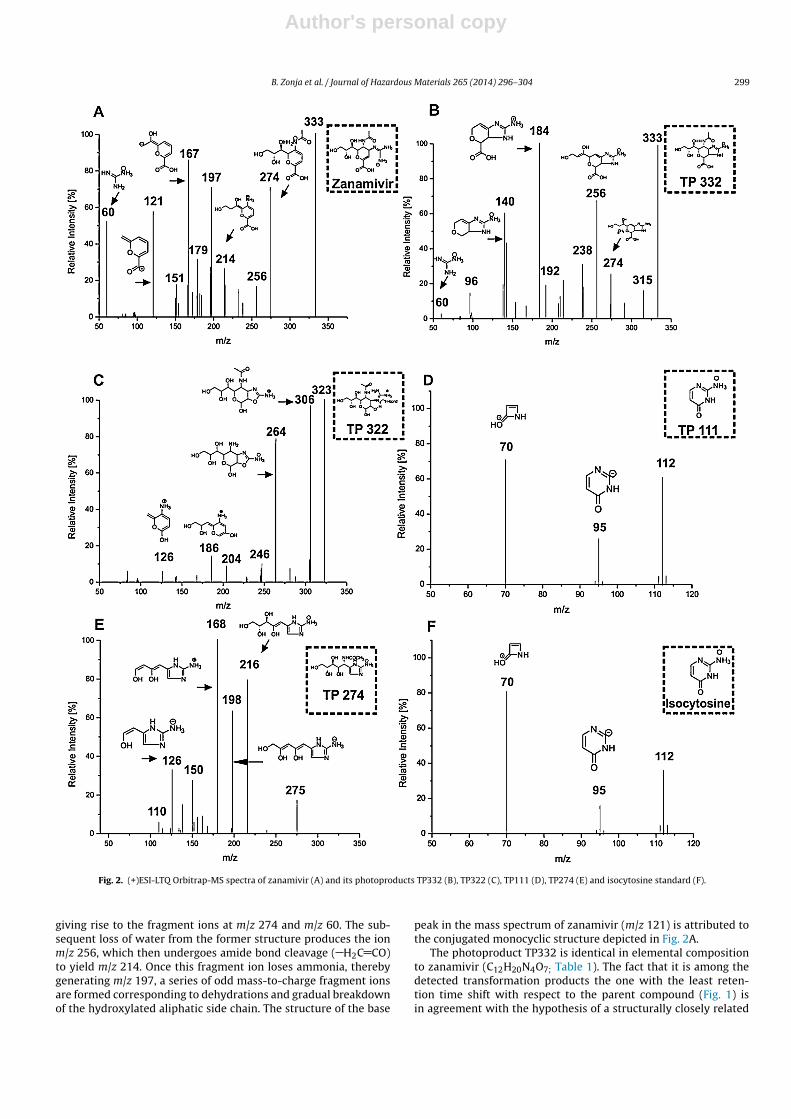
ion mass spectra of zanamivir and its photoproducts were recordedon the LTQ-Orbitrap-MS to elucidate the respective chemical struc-tures (Fig. 2) with the corresponding accurate mass measurementdata compiled in Table 1.
The (+)ESI-mass spectra of zanamivir acquired by Orbitrap-MSare depicted in Figs. 2A and S3 respectively, using the Orbitrap’Higher-energy collisional dissociation (HCD) cell for collision-induced dissociation instead of resonance excitation of the isolatedprecursor ion in LTQ ion trap (data not shown), The fragmenta-tion of zanamivir starts with the heterolytic cleavage of the C Nbond between the guanidine residue and the dihydropyrane ring
Author's personal copy
B. Zonja et al. / Journal of Hazardous Materials 265 (2014) 296– 304 299
Fig. 2. (+)ESI-LTQ Orbitrap-MS spectra of zanamivir (A) and its photoproducts TP332 (B), TP322 (C), TP111 (D), TP274 (E) and isocytosine standard (F).
giving rise to the fragment ions at m/z 274 and m/z 60. The sub-sequent loss of water from the former structure produces the ionm/z 256, which then undergoes amide bond cleavage ( H2C CO)to yield m/z 214. Once this fragment ion loses ammonia, therebygenerating m/z 197, a series of odd mass-to-charge fragment ionsare formed corresponding to dehydrations and gradual breakdownof the hydroxylated aliphatic side chain. The structure of the base
peak in the mass spectrum of zanamivir (m/z 121) is attributed tothe conjugated monocyclic structure depicted in Fig. 2A.
The photoproduct TP332 is identical in elemental compositionto zanamivir (C12H20N4O7; Table 1). The fact that it is among thedetected transformation products the one with the least reten-tion time shift with respect to the parent compound (Fig. 1) isin agreement with the hypothesis of a structurally closely related
Author's personal copy
300 B. Zonja et al. / Journal of Hazardous Materials 265 (2014) 296– 304
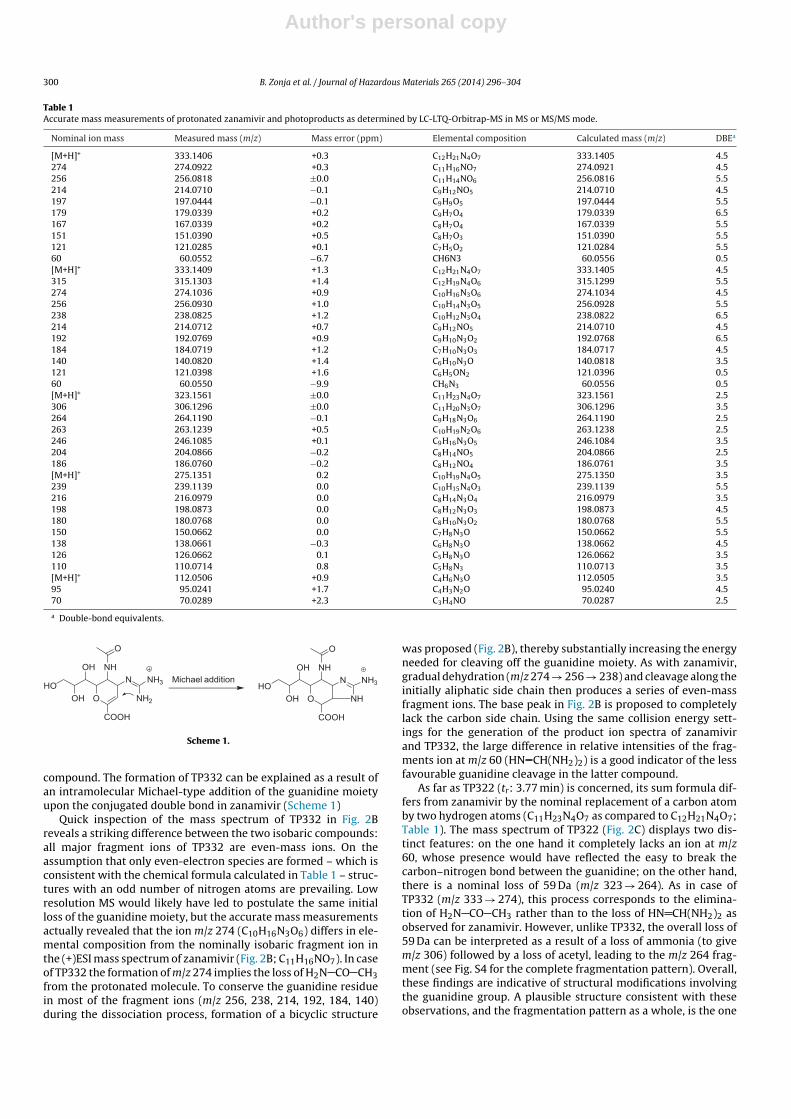
Table 1Accurate mass measurements of protonated zanamivir and photoproducts as determined by LC-LTQ-Orbitrap-MS in MS or MS/MS mode.
Nominal ion mass Measured mass (m/z) Mass error (ppm) Elemental composition Calculated mass (m/z) DBEa
[M+H]+ 333.1406 +0.3 C12H21N4O7 333.1405 4.5274 274.0922 +0.3 C11H16NO7 274.0921 4.5256 256.0818 ±0.0 C11H14NO6 256.0816 5.5214 214.0710 −0.1 C9H12NO5 214.0710 4.5197 197.0444 −0.1 C9H9O5 197.0444 5.5179 179.0339 +0.2 C9H7O4 179.0339 6.5167 167.0339 +0.2 C8H7O4 167.0339 5.5151 151.0390 +0.5 C8H7O3 151.0390 5.5121 121.0285 +0.1 C7H5O2 121.0284 5.560 60.0552 −6.7 CH6N3 60.0556 0.5[M+H]+ 333.1409 +1.3 C12H21N4O7 333.1405 4.5315 315.1303 +1.4 C12H19N4O6 315.1299 5.5274 274.1036 +0.9 C10H16N3O6 274.1034 4.5256 256.0930 +1.0 C10H14N3O5 256.0928 5.5238 238.0825 +1.2 C10H12N3O4 238.0822 6.5214 214.0712 +0.7 C9H12NO5 214.0710 4.5192 192.0769 +0.9 C9H10N3O2 192.0768 6.5184 184.0719 +1.2 C7H10N3O3 184.0717 4.5140 140.0820 +1.4 C6H10N3O 140.0818 3.5121 121.0398 +1.6 C6H5ON2 121.0396 0.560 60.0550 −9.9 CH6N3 60.0556 0.5[M+H]+ 323.1561 ±0.0 C11H23N4O7 323.1561 2.5306 306.1296 ±0.0 C11H20N3O7 306.1296 3.5264 264.1190 −0.1 C9H18N3O6 264.1190 2.5263 263.1239 +0.5 C10H19N2O6 263.1238 2.5246 246.1085 +0.1 C9H16N3O5 246.1084 3.5204 204.0866 −0.2 C8H14NO5 204.0866 2.5186 186.0760 −0.2 C8H12NO4 186.0761 3.5[M+H]+ 275.1351 0.2 C10H19N4O5 275.1350 3.5239 239.1139 0.0 C10H15N4O3 239.1139 5.5216 216.0979 0.0 C8H14N3O4 216.0979 3.5198 198.0873 0.0 C8H12N3O3 198.0873 4.5180 180.0768 0.0 C8H10N3O2 180.0768 5.5150 150.0662 0.0 C7H8N3O 150.0662 5.5138 138.0661 −0.3 C6H8N3O 138.0662 4.5126 126.0662 0.1 C5H8N3O 126.0662 3.5110 110.0714 0.8 C5H8N3 110.0713 3.5[M+H]+ 112.0506 +0.9 C4H6N3O 112.0505 3.595 95.0241 +1.7 C4H3N2O 95.0240 4.570 70.0289 +2.3 C3H4NO 70.0287 2.5
a Double-bond equivalents.
O
HO
NH
N NH3
O
NH2
OH
OH
COOH
Michael addition
O
HO
NH
N NH3
O
NH
OH
OH
COOH
Scheme 1.
compound. The formation of TP332 can be explained as a result ofan intramolecular Michael-type addition of the guanidine moietyupon the conjugated double bond in zanamivir (Scheme 1)
Quick inspection of the mass spectrum of TP332 in Fig. 2Breveals a striking difference between the two isobaric compounds:all major fragment ions of TP332 are even-mass ions. On theassumption that only even-electron species are formed – which isconsistent with the chemical formula calculated in Table 1 – struc-tures with an odd number of nitrogen atoms are prevailing. Lowresolution MS would likely have led to postulate the same initialloss of the guanidine moiety, but the accurate mass measurementsactually revealed that the ion m/z 274 (C10H16N3O6) differs in ele-mental composition from the nominally isobaric fragment ion inthe (+)ESI mass spectrum of zanamivir (Fig. 2B; C11H16NO7). In caseof TP332 the formation of m/z 274 implies the loss of H2N CO CH3from the protonated molecule. To conserve the guanidine residuein most of the fragment ions (m/z 256, 238, 214, 192, 184, 140)during the dissociation process, formation of a bicyclic structure
was proposed (Fig. 2B), thereby substantially increasing the energyneeded for cleaving off the guanidine moiety. As with zanamivir,gradual dehydration (m/z 274 → 256 → 238) and cleavage along theinitially aliphatic side chain then produces a series of even-massfragment ions. The base peak in Fig. 2B is proposed to completelylack the carbon side chain. Using the same collision energy sett-ings for the generation of the product ion spectra of zanamivirand TP332, the large difference in relative intensities of the frag-ments ion at m/z 60 (HN CH(NH2)2) is a good indicator of the lessfavourable guanidine cleavage in the latter compound.
As far as TP322 (tr: 3.77 min) is concerned, its sum formula dif-fers from zanamivir by the nominal replacement of a carbon atomby two hydrogen atoms (C11H23N4O7 as compared to C12H21N4O7;Table 1). The mass spectrum of TP322 (Fig. 2C) displays two dis-tinct features: on the one hand it completely lacks an ion at m/z60, whose presence would have reflected the easy to break thecarbon–nitrogen bond between the guanidine; on the other hand,there is a nominal loss of 59 Da (m/z 323 → 264). As in case ofTP332 (m/z 333 → 274), this process corresponds to the elimina-tion of H2N CO CH3 rather than to the loss of HN CH(NH2)2 asobserved for zanamivir. However, unlike TP332, the overall loss of59 Da can be interpreted as a result of a loss of ammonia (to givem/z 306) followed by a loss of acetyl, leading to the m/z 264 frag-ment (see Fig. S4 for the complete fragmentation pattern). Overall,these findings are indicative of structural modifications involvingthe guanidine group. A plausible structure consistent with theseobservations, and the fragmentation pattern as a whole, is the one
Author's personal copy
B. Zonja et al. / Journal of Hazardous Materials 265 (2014) 296– 304 301
Scheme 2.
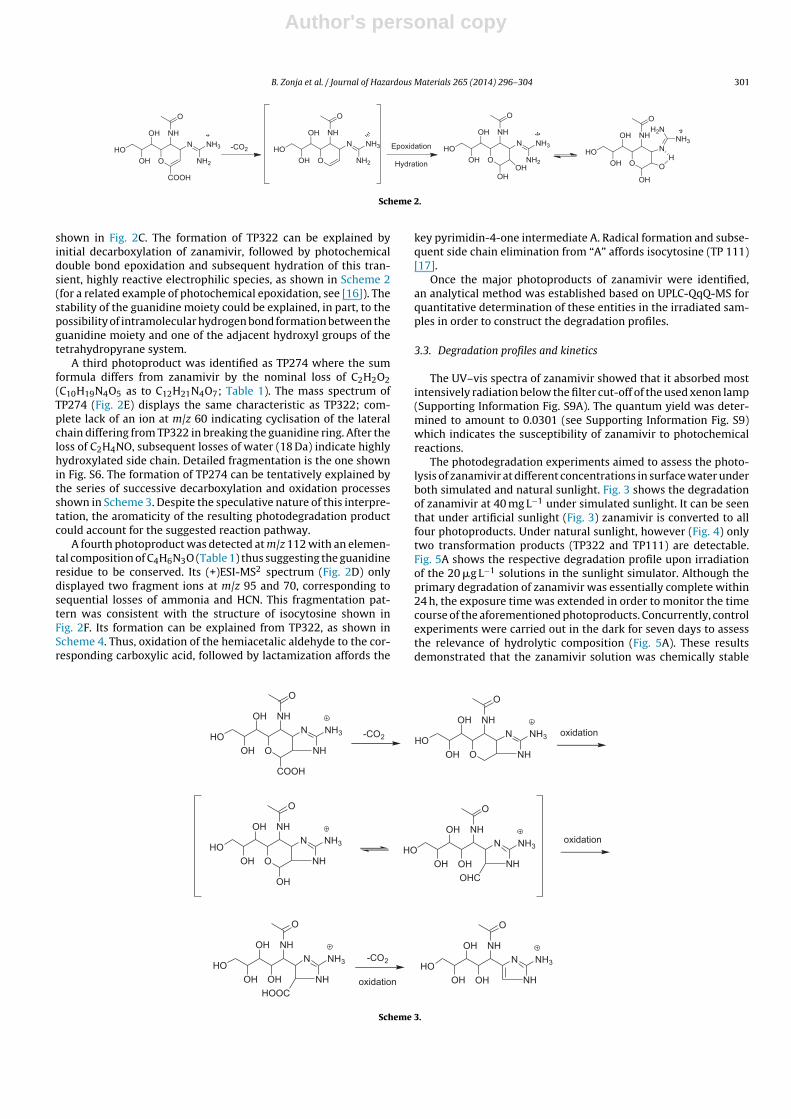
shown in Fig. 2C. The formation of TP322 can be explained byinitial decarboxylation of zanamivir, followed by photochemicaldouble bond epoxidation and subsequent hydration of this tran-sient, highly reactive electrophilic species, as shown in Scheme 2(for a related example of photochemical epoxidation, see [16]). Thestability of the guanidine moiety could be explained, in part, to thepossibility of intramolecular hydrogen bond formation between theguanidine moiety and one of the adjacent hydroxyl groups of thetetrahydropyrane system.
A third photoproduct was identified as TP274 where the sumformula differs from zanamivir by the nominal loss of C2H2O2(C10H19N4O5 as to C12H21N4O7; Table 1). The mass spectrum ofTP274 (Fig. 2E) displays the same characteristic as TP322; com-plete lack of an ion at m/z 60 indicating cyclisation of the lateralchain differing from TP322 in breaking the guanidine ring. After theloss of C2H4NO, subsequent losses of water (18 Da) indicate highlyhydroxylated side chain. Detailed fragmentation is the one shownin Fig. S6. The formation of TP274 can be tentatively explained bythe series of successive decarboxylation and oxidation processesshown in Scheme 3. Despite the speculative nature of this interpre-tation, the aromaticity of the resulting photodegradation productcould account for the suggested reaction pathway.
A fourth photoproduct was detected at m/z 112 with an elemen-tal composition of C4H6N3O (Table 1) thus suggesting the guanidineresidue to be conserved. Its (+)ESI-MS2 spectrum (Fig. 2D) onlydisplayed two fragment ions at m/z 95 and 70, corresponding tosequential losses of ammonia and HCN. This fragmentation pat-tern was consistent with the structure of isocytosine shown inFig. 2F. Its formation can be explained from TP322, as shown inScheme 4. Thus, oxidation of the hemiacetalic aldehyde to the cor-responding carboxylic acid, followed by lactamization affords the
key pyrimidin-4-one intermediate A. Radical formation and subse-quent side chain elimination from “A” affords isocytosine (TP 111)[17].
Once the major photoproducts of zanamivir were identified,an analytical method was established based on UPLC-QqQ-MS forquantitative determination of these entities in the irradiated sam-ples in order to construct the degradation profiles.
3.3. Degradation profiles and kinetics
The UV–vis spectra of zanamivir showed that it absorbed mostintensively radiation below the filter cut-off of the used xenon lamp(Supporting Information Fig. S9A). The quantum yield was deter-mined to amount to 0.0301 (see Supporting Information Fig. S9)which indicates the susceptibility of zanamivir to photochemicalreactions.
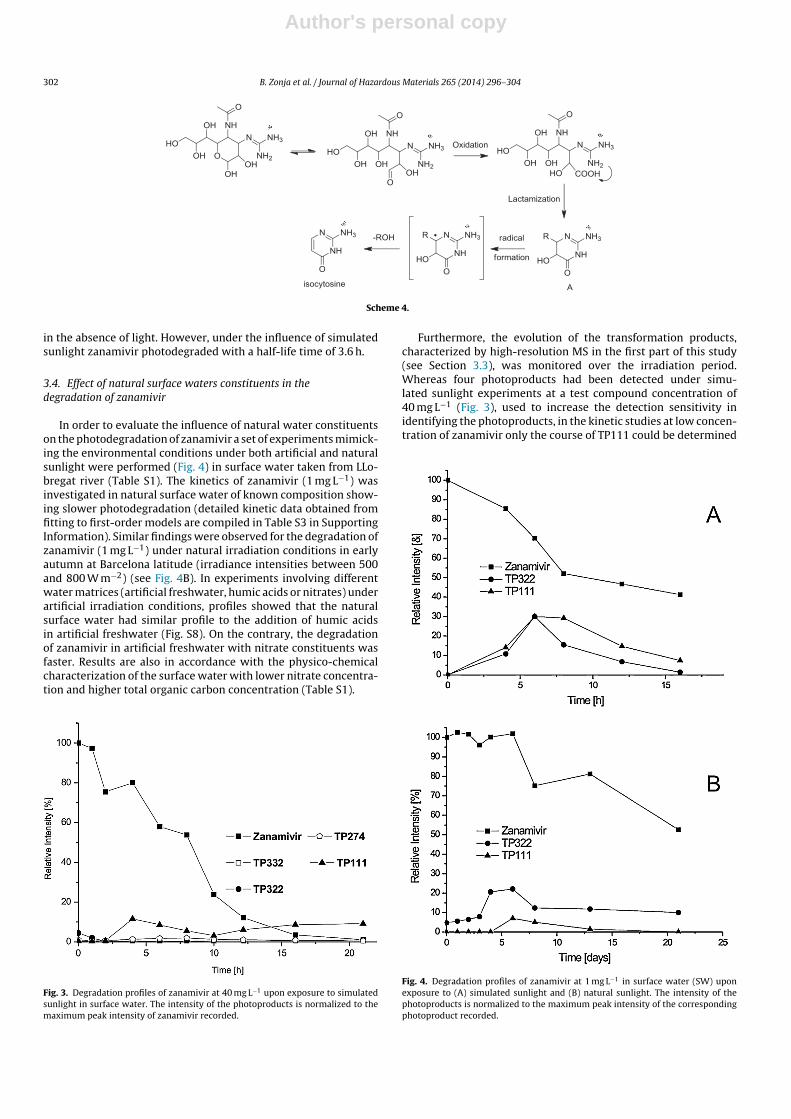
The photodegradation experiments aimed to assess the photo-lysis of zanamivir at different concentrations in surface water underboth simulated and natural sunlight. Fig. 3 shows the degradationof zanamivir at 40 mg L−1 under simulated sunlight. It can be seenthat under artificial sunlight (Fig. 3) zanamivir is converted to allfour photoproducts. Under natural sunlight, however (Fig. 4) onlytwo transformation products (TP322 and TP111) are detectable.Fig. 5A shows the respective degradation profile upon irradiationof the 20 �g L−1 solutions in the sunlight simulator. Although theprimary degradation of zanamivir was essentially complete within24 h, the exposure time was extended in order to monitor the timecourse of the aforementioned photoproducts. Concurrently, controlexperiments were carried out in the dark for seven days to assessthe relevance of hydrolytic composition (Fig. 5A). These resultsdemonstrated that the zanamivir solution was chemically stable
O
HO
NH
N NH3
O
NH
OH
OH
COOH
O
HO
NH
N NH3
O
NH
OH
OH
O
HO
NH
N NH3
O
NH
OH
OH
OH
OH
HOOC
HO
NH
N NH3
O
NH
OH
OH
oxidation
oxidation
OH
OHC
HO
NH
N NH3
O
NH
OH
OH
oxidation OH
HO
NH
N NH3
O
NH
OH
OH
-CO2
-CO2
Scheme 3.
Author's personal copy
302 B. Zonja et al. / Journal of Hazardous Materials 265 (2014) 296– 304
Scheme 4.
in the absence of light. However, under the influence of simulatedsunlight zanamivir photodegraded with a half-life time of 3.6 h.
3.4. Effect of natural surface waters constituents in thedegradation of zanamivir
In order to evaluate the influence of natural water constituentson the photodegradation of zanamivir a set of experiments mimick-ing the environmental conditions under both artificial and naturalsunlight were performed (Fig. 4) in surface water taken from LLo-bregat river (Table S1). The kinetics of zanamivir (1 mg L−1) wasinvestigated in natural surface water of known composition show-ing slower photodegradation (detailed kinetic data obtained fromfitting to first-order models are compiled in Table S3 in SupportingInformation). Similar findings were observed for the degradation ofzanamivir (1 mg L−1) under natural irradiation conditions in earlyautumn at Barcelona latitude (irradiance intensities between 500and 800 W m−2) (see Fig. 4B). In experiments involving differentwater matrices (artificial freshwater, humic acids or nitrates) underartificial irradiation conditions, profiles showed that the naturalsurface water had similar profile to the addition of humic acidsin artificial freshwater (Fig. S8). On the contrary, the degradationof zanamivir in artificial freshwater with nitrate constituents wasfaster. Results are also in accordance with the physico-chemicalcharacterization of the surface water with lower nitrate concentra-tion and higher total organic carbon concentration (Table S1).
Fig. 3. Degradation profiles of zanamivir at 40 mg L−1 upon exposure to simulatedsunlight in surface water. The intensity of the photoproducts is normalized to themaximum peak intensity of zanamivir recorded.
Furthermore, the evolution of the transformation products,characterized by high-resolution MS in the first part of this study(see Section 3.3), was monitored over the irradiation period.Whereas four photoproducts had been detected under simu-lated sunlight experiments at a test compound concentration of40 mg L−1 (Fig. 3), used to increase the detection sensitivity inidentifying the photoproducts, in the kinetic studies at low concen-tration of zanamivir only the course of TP111 could be determined
Fig. 4. Degradation profiles of zanamivir at 1 mg L−1 in surface water (SW) uponexposure to (A) simulated sunlight and (B) natural sunlight. The intensity of thephotoproducts is normalized to the maximum peak intensity of the correspondingphotoproduct recorded.
Author's personal copy
B. Zonja et al. / Journal of Hazardous Materials 265 (2014) 296– 304 303
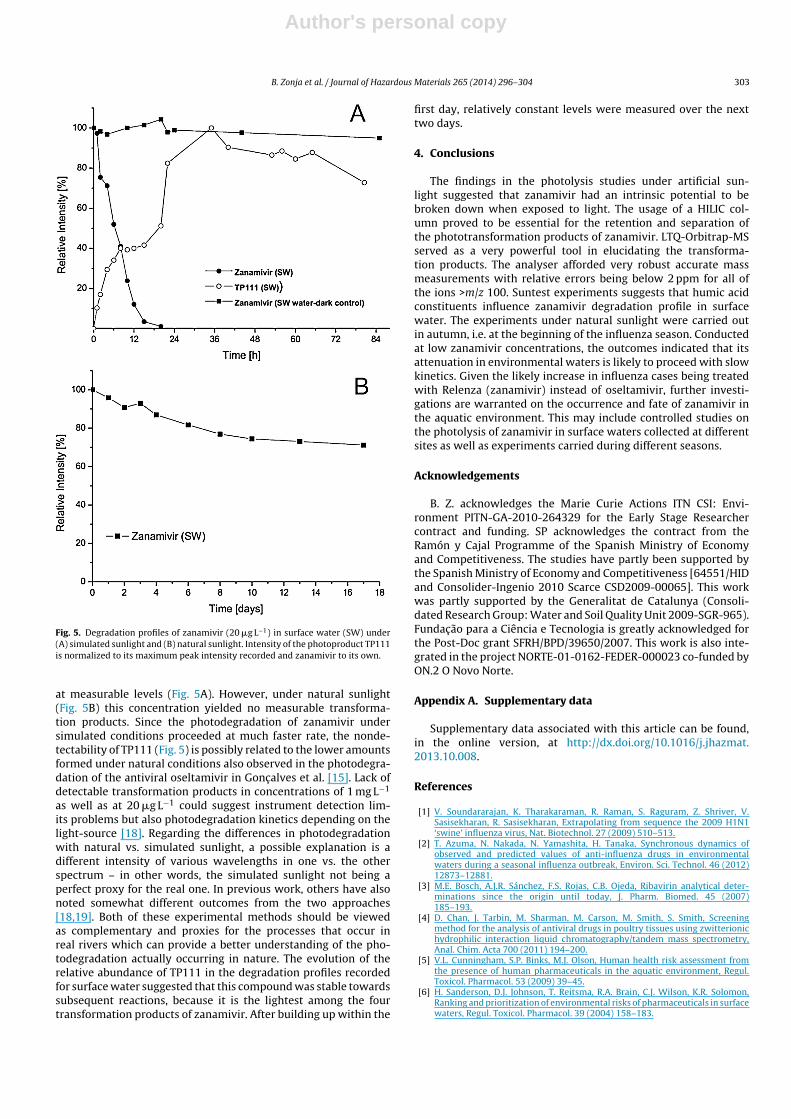
Fig. 5. Degradation profiles of zanamivir (20 �g L−1) in surface water (SW) under(A) simulated sunlight and (B) natural sunlight. Intensity of the photoproduct TP111is normalized to its maximum peak intensity recorded and zanamivir to its own.
at measurable levels (Fig. 5A). However, under natural sunlight(Fig. 5B) this concentration yielded no measurable transforma-tion products. Since the photodegradation of zanamivir undersimulated conditions proceeded at much faster rate, the nonde-tectability of TP111 (Fig. 5) is possibly related to the lower amountsformed under natural conditions also observed in the photodegra-dation of the antiviral oseltamivir in Gonc alves et al. [15]. Lack ofdetectable transformation products in concentrations of 1 mg L−1
as well as at 20 �g L−1 could suggest instrument detection lim-its problems but also photodegradation kinetics depending on thelight-source [18]. Regarding the differences in photodegradationwith natural vs. simulated sunlight, a possible explanation is adifferent intensity of various wavelengths in one vs. the otherspectrum – in other words, the simulated sunlight not being aperfect proxy for the real one. In previous work, others have alsonoted somewhat different outcomes from the two approaches[18,19]. Both of these experimental methods should be viewedas complementary and proxies for the processes that occur inreal rivers which can provide a better understanding of the pho-todegradation actually occurring in nature. The evolution of therelative abundance of TP111 in the degradation profiles recordedfor surface water suggested that this compound was stable towardssubsequent reactions, because it is the lightest among the fourtransformation products of zanamivir. After building up within the
first day, relatively constant levels were measured over the nexttwo days.
4. Conclusions
The findings in the photolysis studies under artificial sun-light suggested that zanamivir had an intrinsic potential to bebroken down when exposed to light. The usage of a HILIC col-umn proved to be essential for the retention and separation ofthe phototransformation products of zanamivir. LTQ-Orbitrap-MSserved as a very powerful tool in elucidating the transforma-tion products. The analyser afforded very robust accurate massmeasurements with relative errors being below 2 ppm for all ofthe ions >m/z 100. Suntest experiments suggests that humic acidconstituents influence zanamivir degradation profile in surfacewater. The experiments under natural sunlight were carried outin autumn, i.e. at the beginning of the influenza season. Conductedat low zanamivir concentrations, the outcomes indicated that itsattenuation in environmental waters is likely to proceed with slowkinetics. Given the likely increase in influenza cases being treatedwith Relenza (zanamivir) instead of oseltamivir, further investi-gations are warranted on the occurrence and fate of zanamivir inthe aquatic environment. This may include controlled studies onthe photolysis of zanamivir in surface waters collected at differentsites as well as experiments carried during different seasons.
Acknowledgements
B. Z. acknowledges the Marie Curie Actions ITN CSI: Envi-ronment PITN-GA-2010-264329 for the Early Stage Researchercontract and funding. SP acknowledges the contract from theRamón y Cajal Programme of the Spanish Ministry of Economyand Competitiveness. The studies have partly been supported bythe Spanish Ministry of Economy and Competitiveness [64551/HIDand Consolider-Ingenio 2010 Scarce CSD2009-00065]. This workwas partly supported by the Generalitat de Catalunya (Consoli-dated Research Group: Water and Soil Quality Unit 2009-SGR-965).Fundac ão para a Ciência e Tecnologia is greatly acknowledged forthe Post-Doc grant SFRH/BPD/39650/2007. This work is also inte-grated in the project NORTE-01-0162-FEDER-000023 co-funded byON.2 O Novo Norte.
Appendix A. Supplementary data
Supplementary data associated with this article can be found,in the online version, at http://dx.doi.org/10.1016/j.jhazmat.2013.10.008.
References
[1] V. Soundararajan, K. Tharakaraman, R. Raman, S. Raguram, Z. Shriver, V.Sasisekharan, R. Sasisekharan, Extrapolating from sequence the 2009 H1N1‘swine’ influenza virus, Nat. Biotechnol. 27 (2009) 510–513.
[2] T. Azuma, N. Nakada, N. Yamashita, H. Tanaka, Synchronous dynamics ofobserved and predicted values of anti-influenza drugs in environmentalwaters during a seasonal influenza outbreak, Environ. Sci. Technol. 46 (2012)12873–12881.
[3] M.E. Bosch, A.J.R. Sánchez, F.S. Rojas, C.B. Ojeda, Ribavirin analytical deter-minations since the origin until today, J. Pharm. Biomed. 45 (2007)185–193.
[4] D. Chan, J. Tarbin, M. Sharman, M. Carson, M. Smith, S. Smith, Screeningmethod for the analysis of antiviral drugs in poultry tissues using zwitterionichydrophilic interaction liquid chromatography/tandem mass spectrometry,Anal. Chim. Acta 700 (2011) 194–200.
[5] V.L. Cunningham, S.P. Binks, M.J. Olson, Human health risk assessment fromthe presence of human pharmaceuticals in the aquatic environment, Regul.Toxicol. Pharmacol. 53 (2009) 39–45.
[6] H. Sanderson, D.J. Johnson, T. Reitsma, R.A. Brain, C.J. Wilson, K.R. Solomon,Ranking and prioritization of environmental risks of pharmaceuticals in surfacewaters, Regul. Toxicol. Pharmacol. 39 (2004) 158–183.
Author's personal copy
304 B. Zonja et al. / Journal of Hazardous Materials 265 (2014) 296– 304
[7] J. Ge, F. Liu, E.H. Holmes, G.K. Ostrander, Q.X. Li, Aqueous normal phase liquidchromatography coupled with tandem time-of-flight quadrupole mass spec-trometry for determination of zanamivir in human serum, J. Chromatogr. B:Analyt. Technol. Biomed. Life Sci. 906 (2012) 58–62.
[8] G.D. Allen, S.T. Brookes, A. Barrow, J.A. Dunn, C.M. Grosse, Liquidchromatographic–tandem mass spectrometric method for the determinationof the neuraminidase inhibitor zanamivir (GG167) in human serum, J. Chro-matogr. B: Biomed. Sci. Appl. 732 (1999) 383–393.
[9] T.M. Baughman, W.L. Wright, K.A. Hutton, Determination of zanamivir in ratand monkey plasma by positive ion hydrophilic interaction chromatography(HILIC)/tandem mass spectrometry, J. Chromatogr. B: Analyt. Technol. Biomed.Life Sci. 852 (2007) 505–511.
[10] Y. Hsieh, Potential of HILIC–MS in quantitative bioanalysis of drugs and drugmetabolites, J. Sep. Sci. 31 (2008) 1481–1491.
[11] P.J. Collins, L.F. Haire, Y.P. Lin, J. Liu, R.J. Russell, P.A. Walker, J.J. Skehel,S.R. Martin, A.J. Hay, S.J. Gamblin, Crystal structures of oseltamivir-resistant influenza virus neuraminidase mutants, Nature 453 (2008)1258–1261.
[12] R. Andreozzi, R. Marotta, N. Paxéus, Pharmaceuticals in STP effluents andtheir solar photodegradation in aquatic environment, Chemosphere 50 (2003)1319–1330.
[13] T.E. Doll, F.H. Frimmel, Fate of pharmaceuticals – photodegradation by simu-lated solar UV-light, Chemosphere 52 (2003) 1757–1769.
[14] A. Aguera, L.A. Perez Estrada, I. Ferrer, E.M. Thurman, S. Malato, A.R. Fernandez-Alba, Application of time-of-flight mass spectrometry to the analysis ofphototransformation products of diclofenac in water under natural sunlight,J. Mass Spectrom. 40 (2005) 908–915.
[15] C. Goncalves, S. Perez, V. Osorio, M. Petrovic, M.F. Alpendurada, D. Barcelo,Photofate of oseltamivir (Tamiflu) and oseltamivir carboxylate under naturaland simulated solar irradiation: kinetics, identification of the transforma-tion products, and environmental occurrence, Environ. Sci. Technol. 45 (2011)4307–4314.
[16] G. Büchi, K.W. Fowler, A.M. Nadzan, Photochemical epoxidation of aflatoxin B1and sterigmatocystin: synthesis of guanine-containing adducts, J. Am. Chem.Soc. 104 (1982) 544–547.
[17] V. Jagannadham, S. Steenken, One-electron reduction of nitrobenzenes by OHand H radical adducts to 6-methyluracil and 6-methylisocytosine via electrontransfer and addition/elimination. Effect of substituents on rates and activationparameters for formation and heterolysis of nitroxyl-type tetrahedral interme-diates, J. Phys. Chem. 92 (1988) 111–118.
[18] L. Ge, J. Chen, X. Qiao, J. Lin, X. Cai, Light-source-dependent effects of mainwater constituents on photodegradation of phenicol antibiotics: mechanismand kinetics, Environ. Sci. Technol. 43 (2009) 3101–3107.
[19] J. Niu, Y. Li, W. Wang, Light-source-dependent role of nitrate and humic acidin tetracycline photolysis: kinetics and mechanism, Chemosphere 92 (2013)1423–1429.
Related Documents