Ref. Ares(2012) 1353779 - 16/11/2012 Institute for Business Management Evaluation of the National Strategy for sustainable operational programmes in the fruit and vegetables sector in Germany (2012) Dr Walter Dirksmeyer Dr Hildegard Garming Katrin Fluck (MSc) Braunschweig, Germany, 15 November 2012 Johann Heinrich von Thünen Institute, Federal Research Institute for Rural Areas, Forestry and Fisheries

Welcome message from author
This document is posted to help you gain knowledge. Please leave a comment to let me know what you think about it! Share it to your friends and learn new things together.
Transcript

Ref. Ares(2012) 1353779 - 16/11/2012
Institute for Business Management
Evaluation of the National Strategy for sustainable operational programmes in the fruit and vegetables sector in Germany (2012)
Dr Walter Dirksmeyer
Dr Hildegard Garming
Katrin Fluck (MSc)
Braunschweig, Germany, 15 November 2012
Johann Heinrich von Thünen Institute, Federal Research Institute for Rural Areas, Forestry and Fisheries
Institute for Business Management,
Johann Heinrich von Thünen Institute (vTi)
Federal Research Institute for Rural Areas, Forestry and Fisheries
Bundesallee 50
38116 Braunschweig, Germany
Tel.: +49 531 596-5136
Email: [email protected]

Table of contents I
Table of contents
2 Introduction 3 2.1 Purpose of the report 3 2.2 Report structure 4
3. Context of the evaluation 5 3.1 Basis of support: the National Strategy 5 3.2 Use of support 8 3.3 Subsidies policy context of the National Strategy 11 3.4 Purpose and scope of the evaluation 13
4 Methodology 15 4.1 Evaluation concept 15 4.2 Data basis 19
4.2.1 Annual reports and mid-term evaluations 19
4.2.2 Own surveys 21
4.2.3 Secondary data 22
4.3 Methodology limits 22
5 Responses to the evaluation questions 25 5.1 Common evaluation questions on specific National Strategy measures 33
5.1.1 Actions aimed at planning of production 33
5.1.2 Actions aimed at improving or maintaining product quality 40
5.1.3 Actions aimed at improving marketing, including promotion and communication activities 46
5.1.5 Training actions and actions aimed at promoting access to advisory services 52
5.1.6 Crisis prevention and management instruments 56
5.1.7 Environmental actions 60
5.1.8 Other actions 64
5.2 Common evaluation questions relating to the whole National Strategy 66
5.2.1 Promoting the placing on the market of members’ products 68
5.2.2 Ensuring that production is adjusted to demand, in terms of quality and quantity 69
5.2.3 Boosting products’ commercial value 70
5.2.4 Optimising production costs 71
5.2.5 Promoting concentration of supply 72
5.2.6 Stabilising producer prices 73
5.2.7 Improving competitiveness 74

II Table of contents
5.2.8 Improving attractiveness of producer organisation membership 75
5.2.9 Maintaining and protecting the environment 76
6 Conclusions and recommendations 77 6.1 Conclusions 77
6.1.1 Degree of utilisation of financial resources 77
6.1.2 Effects and impacts of the operational programmes in relation to the objectives, targets and overall objectives set out by the National Strategy and, where appropriate, other objectives set in Article 103c(1) of Regulation (EC) No 1234/2007 78
6.1.3 Effectiveness, efficiency and utility of the measures implemented under the operational programmes 80
6.1.4 Overall effectiveness, efficiency and utility of the operational programmes implemented 81
6.1.5. Shortcomings in the definition of overall and specific objectives or measures eligible for support 82
6.2 Recommendations based on evaluation findings, including possible proposals for adaptation of the National Strategy and EU policy 83
6.2.1 Recommendations on the system set up for the monitoring and evaluation of the National Strategy 83
6.2.2 Recommendations to address shortcomings in the objectives, targets or measures selected under the National Strategy and on needs for defining new instruments 85
6.2.3 Recommendations on coherence and complementarity with other EU and national instruments 86
6.2.4 Recommendations for the design of the future National Strategy 87
6.2.5 Recommendations on the design of the future EU policy in the fruit and vegetables sector 88
7 References 89

Index of tables III
Index of tables
Table 3.1: Expenditure on OP actions 2007 to 2011, broken down according to the
specific support objectives 11Table 4.1: Comparison of documented total expenditure in the annual reports and
PO mid-term evaluations 21Table 5.1: Overview of the changes to the impact indicators from the baseline
indicator for 2011 32Table 5.2: Share of intervention areas in the approved costs of OPs from 2007 to
2011 as a whole (%)(n=27) 34Table 5.3: Number of POs carrying out planning of production actions, and
approved expenditure from 2007 to 2011. 34Table 5.4: Approved expenditure for planning of production by PO (2007 to 2011)
(n=18) 35Table 5.5: Investment in producer organisations aimed at improving economic
performance in the pre-harvesting area 39Table 5.6: Expenditure aimed at improving quality by PO (2007 to 2011) (total) 41Table 5.7: Expenditure on improving quality by PO (2007 to 2011) (n = 18) 41Table 5.8: Volume of marketed production that meets the requirements of a
specific quality scheme (n = 27) 42Table 5.9: Totals and proportions of personnel costs for each intervention area 44Table 5.10: Expenditure on promotion and participation of the POs (2007 to 2011)
(total) 46Table 5.11: Total expenditure on actions aimed at improving marketing by PO for
2007 to 2011 47Table 5.12: PO participation in and expenditure on research and experimental
projects from 2007 to 2011 50Table 5.13: Expenditure on research and experimental projects by PO
(2007 to 2011) 51Table 5.14: PO participation and total expenditure for actions related to training
and advisory services (2007 to 2011) 53Table 5.15: Expenditure for training and advisory services and average spending
per member by PO (2007 to 2011) 54Table 5.16: PO participation in and total expenditure on actions aimed at crisis
prevention (2007 to 2011) 57Table 5.17: Expenditure on crisis prevention by PO (2007 to 2011) 58Table 5.18: PO participation in environmental actions and total expenditure
(2007 to 2011) 61Table 5.19: Expenditure on environmental measures by PO (2007 to 2011) 62Table 5.20: PO participation in other actions and total expenditure (2007 to 2011) 64

IV Index of tables
Table 5.21: Expenditure on other actions by PO (2007 to 2011) 65Table 5.22: Proportion of the expenditure spent on specific objectives under the
National Strategy by year (2007 to 2011) 67Table 6.1: Total expenditure for OPs and utilisation of the subsidies
(2007 to 2011) 77Table 6.2: Comparison of baseline indicators with the result and impact indicators
from 2011 79

Index of figures and maps V
Index of figures
Figure 3.1: Importance of the specific objectives by support amounts 10
Figure 4.1: Evaluation concept: Before-after and with/without comparisons on the impact of support 16
Figure 5.1: Vegetable harvests for marketing in Germany (2000 to 2011) 26
Figure 5.2: Fruit harvests for marketing in Germany (1998 to 2011) 26
Figure 5.3: Producer organisations’ share of vegetables produced and marketed in Germany (2010) 27
Figure 5.4: Producer organisations’ share of fruit produced and marketed in Germany (2010) 28
Figure 5.5: PO sales prices for selected types of vegetable in Euro/dt in the years 2004 to 2011 29
Figure 5.6: PO sales prices for selected types of vegetable in Euro/unit or Euro/100 bundle for the years 2004 to 2011 29
Figure 5.7: PO sales prices for selected types of fruit in Euro/dt in the years 2004 to 2011 30
Figure 5.8: Overall development of the number of affiliated producers and PO members’ land under cultivation from 2008 to 2011 31
Figure 5.9: Most important PO fruit products by year from 2008 to 2011 32
Figure 5.10: Most important PO vegetable products by year from 2008 to 2011 33
Figure 5.11: Most important actions within the National Strategy according to expenditure outlaid in the years 2007 to 2011 35
Figure 5.12: Comparison of the importance of expenditure on planning of production taking into account the change in the VMP in 2011 against the baseline indicator, by PO 37
Figure 5.13: Comparison of the relative importance of expenditure on quality improvement with the change in the average value of marketed production compared with the baseline indicator, by PO 43
Figure 5.14: Link between expenditure on improving marketing and the change in the value of marketed production 48
Figure 5.15: Total expenditure on training and advisory services according to subject area 55
Index of maps
Map 1: Support intensity by federal state: total amounts of approved PO expenditure in the years 2007 to 2011 9


Chapter 1 Executive Summary 1
(Translator’s note - Executive summary in original document is written in English. Translation resumes on page 9 of the document)


Chapter 2 Introduction 3
2 Introduction
2.1 Purpose of the report
Producer organisations (PO) for fresh fruit and vegetables that are recognised by the Member States of the European Union (EU) may develop operational programmes under the common organisation of agricultural markets (CMO) (OJ 2007). The POs may set up an operating fund to finance these operational programmes. This fund is sustained through financial contributions from the PO and its members on the one hand and financial support from the EU (as a rule of 50 % of expenditure) under the first pillar of the Common Agricultural Policy (CAP) on the other.
In accordance with the principle of subsidiarity, the EU Member States execute these support programmes. The federal states are responsible for this process in Germany and have designated competent bodies1 within their respective administrative structures for this purpose. The legal framework for support is established at national level, amongst others through a ‘National Strategy’ that the Member States must develop. In Germany, the Federal Ministry of Food, Agriculture and Consumer Protection (BMELV) published a ‘National strategy for sustainable operational programmes of producer organisations of fruit and vegetables in Germany’2 in 2008, which is valid for the 2008 to 2013 period (BMELV 2008). The objectives of the National Strategy therein are identical to the objectives defined in the CMO. Moreover, the National Strategy is very closely based on the CMO as regards eligible measures.
The overriding aims of support under the National Strategy are (1.) to boost competitiveness, (2.) to improve the attractiveness of PO membership and (3.) to protect and maintain the environment. Three general and seven specific objectives have been defined to achieve these general aims (BMELV 2008).
EU law stipulates that the Member States’ national strategies must be subject to an independent evaluation (OJ 2011). The results of this evaluation should be taken into account when developing new national strategies. The evaluation reports shall be submitted by the Member States to the European Commission by 15.11.2012 at the latest.
1 Hereafter referred to as ‘competent bodies’. 2 Hereafter referred to as the ‘National Strategy’.

4 Chapter 2 Introduction
This evaluation report shall respect the provisions of Article 127(4) of Regulation (EU) No 543/20113 (OJ 2011) and the joint guidance note that expands on it for the evaluation of the national strategies, as drafted by the European Commission, and thus make it possible for the evaluation results to be compared at European level. With the background described in mind, the evaluation allows the progress made in achieving the general and specific objectives under the POs’ operational programmes to be gauged. To this end, the use of subsidies should be quantified, the efficacy and efficiency of the implemented operational programmes checked with regard to the goals defined in the POs’ operational programmes and the results and impacts of the operational programmes judged in relation to the general and specific objectives of the National Strategy (OJ 2011). Based on this, (1.) mistakes in defining eligible measures should be highlighted, (2.) where appropriate, shortcomings in setting the general and specific objectives of the National Strategy should be identified and proposals made to address them, (3.) recommendations should be made to improve the quality of future national strategies (OJ 2011) and (4.) recommendations should be put forward regarding adaptation of the CMO (European Commission 2011). As the CMO legislation is translated unchanged into the national strategies with all but a few exceptions, the evaluation results, conclusions and recommendations that are developed for the National Strategy are also applicable to the CMO.
2.2 Report structure
In this report, Chapter 3 starts with the context of the evaluation. To begin with, background information on the National Strategy and its goals is discussed and an initial overview of use of subsidies is provided. This is followed by a description of further support instruments for the market garden sector that share the same or very similar support objectives as the National Strategy. The National Strategy is also classified in terms of how it fits into this system of subsidies. Chapter 4 of this report presents the evaluation methodology and the data basis for the evaluation. In addition to this, the problems and limitations of the methodology applied are highlighted in order to work out the limitations of the evaluation and the validity of the evaluation results. The results component in the first section of Chapter 5 answers the evaluation questions that relate to the eight intervention areas of the National Strategy and describes the application of funds for each case, discusses the benefits by using the results and impact indicators and gauges the efficacy of the measures. To this end, a description of the general development of the fruit and vegetable sector is given in the first part, along with developments regarding the situation of the POs as a whole. The second part of Chapter 5 regards the overall impacts of the National Strategy and discusses the degree to which the specific objectives have been achieved by using the benefits of the implemented measures as ascertained in the first part of this chapter. Chapter 6 contains the conclusions and provides recommendations for future national strategies and support instruments under the CMO.
3 Regulation (EU) No 543/2011 is the CMO implementing regulation (OJ 2011) as laid down in Regulation
(EU) No 1234/2007 (OJ 2007). Article 127 of Regulation (EU) No 543/2011 stipulates that the EU Member States’ strategies shall be evaluated. Further information on the evaluation procedure, content and structure of the evaluation report is provided in the guidance note on ‘Evaluation of national strategies for sustainable operational programmes in the fruit and vegetables sector’ (European Commission 2011).

Chapter 3 Context of the evaluation 5
3. Context of the evaluation
3.1 Basis of support: the National Strategy
It is the remit of the National Strategy (BMELV 2008) to support the POs in harnessing their existing growth potential thereby achieving the medium to long-term objective of the support from a societal viewpoint. This societal objective consists of improving the marketing structures and supply of fruit and vegetables produced in Germany, as well as boosting the competitiveness of German producers. In doing this, the National Strategy has to take into consideration the very different structures and orientations of POs.
The support targets recognised fruit and vegetable POs as they play a fundamental role as middlemen between production and sales (RUHM et al. 2008). In this role, they pool production and bolster the producers’ market position, which to a great extent faces concentration and rationalisation on the part of buyers. In addition, producer organisations have to satisfy significant demands both towards buyers of products and towards producers. For buyers, the services essentially encompass pooling, preparation, quality assurance, ensuring product safety, safe delivery, product line design, (i.e. managing production towards what the buyer wants) and taking over additional services. For affiliated producers, the POs take over the roles of securing sales and revenue, preparation and storage of produce, pricing and cash flow management (RUHM et al. 2008, BMELV 2008). By exercising these roles, the POs have the potential to bolster domestic fruit and vegetable production, which is where the particular social interest of producer organisations lies, as consumers show a preference for German or regional goods. RUHM et al. (2008) stress that a producer that is affiliated to a PO can concentrate on production and be relieved of marketing responsibilities, which improves the domestic supply of fruit and vegetables both in terms of quantity and quality.
With this backdrop in mind, the National Strategy has defined the general support aims (1.) to boost supply, (2.) to improve the competitive position and (3.) to assume responsibility towards consumers and society at large (BMELV 2008).
In this context, the risks and challenges for how the National Strategy is configured lie, amongst others, in the great degree of heterogeneity of POs and their members as well.

6 Chapter 3 Context of the evaluation
Actions4 receiving support have to be orientated around these objectives at producer organisation level. In this process, the starting points for concrete actions are improving the attractiveness both for PO members and buyers of products of eco-friendly production and the marketing of safer products. On this basis, the National Strategy sets out seven specific objectives of equal importance (BMELV 2008):
1. Promotion of concentration of supply, 2. Improve market orientation, 3. Increase and maintain quality, 4. Improve management of members and incentives to join, 5. Improve efficiency, 6. Develop competences and increase innovation and 7. Eco-friendly production and marketing of safer products.
In this context, establishing a conclusive catalogue of eligible measures under the National Strategy is very hard to achieve. This means that examples of potentially eligible actions are cited in the National Strategy but no positive list of eligible actions has been drawn up. These examples are grouped into eligible intervention areas and are broken down into (1.) planning of production (2.) improving or maintaining product quality (3.) improving marketing (4.) research and development projects (5.) further training actions and advisory services (6.) crisis prevention (7.) environmental actions and (8.) other actions (BMELV 2008).
Under EU law, recognised fruit and vegetable POs are eligible for support5 (OJ 2007). The POs draw up so-called operational programmes (OPs) as part of their development concept that generally run for three to five years, in which different actions from these intervention areas are carried out in accordance with the needs and goals of the respective PO. Each PO has to set up an operating fund to execute their OP, which essentially is funded in equal measure through EU resources and those of the PO or its members. In this way, support accounts for 50 % of the OP’s costs up to a maximum yearly support level of, as a general rule, 4.1 % of the respective PO’s value of marketed production (VMP). Due to the high subsidy value of 50 %, the POs generally strive to make full use of the maximum amount of support possible, meaning that the OP funding volumes are in many cases closer to 8.2 % of a PO’s VMP.
4 In the context of support programmes, it is general practice to refer to support measures. However, under the
CMO, these are referred to as actions and are grouped together in intervention areas. 5 Support is limited to the products listed in Regulation (EC) No 1234/2007, Annex I, Part IX (OJ 2007).

Chapter 3 Context of the evaluation 7
The prerequisite for receiving support is that the OP and its actions target at least one of specific objectives 1 to 3, objective 7 (environment) and one of objectives 1 to 6 (see above for the list of specific objectives). An additional condition for approval of an OP is that at least two actions in the environment intervention area are implemented or 10 % of OP expenditure is allocated to this area (BMELV 2008).
Within this framework, the so-called competent bodies are responsible for administering support at the level of the German federal states. These bodies are located in state agencies, state economic chambers and similar institutions. At the federal level, the BMELV plays a coordinating role and is responsible through the Federal Institute for Agriculture and Food (BLE) for compiling and communicating data on monitoring support.
Support for producer groups such as produce organisations under the first pillar of the CAP can only be granted in Germany to producers of fruit and vegetables. Producers of other market garden and agricultural products are excluded from receiving this support.6
According to RUHM et al. (2008), the significance of support under the National Strategy is due to the particular responsibilities of the POs compared with other suppliers of fruit and vegetables. Producers of fruit and vegetables find themselves in part in a problematic economic situation and face deficiencies in strategic and market orientation. This is particularly true of small and medium-sized producers. Moreover, producers and POs are affected by the strategic orientation of retailers changing frequently, which they are virtually powerless to influence due to the considerable concentration of market power on the part of buyers. Pooling and delivery of larger batches by POs are therefore particularly important functions that small and medium-sized producers cannot afford to perform frequently themselves.
On the other hand, the heterogeneous nature of member companies renders the democratic decision-making process more difficult and increases the cost of controls as regards product quality and unauthorised marketing by members. RUHM et al. (2008) identify possible conflicts of interest between PO members due to the heterogeneous nature of companies and highlight barriers to entry for companies, such as, for example, the level of marketing fees, the obligation to tender delivery and the way the POs select appropriate producers (RUHM et al. 2008, p.22). Support under the National Strategy should balance out the disadvantages of POs and make them more attractive to producers so as to increase the level of organisation in the sector and thus shore up the sector as a whole (RUHM et al. BMELV 2008).
6 In addition, recognised POs are eligible for subsidies to help marketing of hops under the CMO. Up to
EUR 2.277 million in support is provided annually in Germany pursuant to Article 102a of Regulation (EC) No 1234/2007, which equates to some 3 % of the current support for fruit and vegetable POs.

8 Chapter 3 Context of the evaluation
On the one hand, in the depiction of the fruit and vegetable sector in Germany by RUHM et al. (2008), the question arises as to whether there is a particular need for support for production and marketing of German fruit and vegetables, if consumers show a marked preference for domestic goods and there is more demand on the market for these goods than for identical goods from other countries. On the other hand, it is necessary to verify how significant the role of the POs is in the production of fruit and vegetables in Germany in comparison to other coordinators. Given the fact that the degree of organisation of producers in the fruit and vegetable sector has remained practically constant (RUHM et al. 2008) at 26 % of fruit and 17 % of vegetable producers, the POs cannot be seen as being especially significant in terms of bolstering the sector. The share of POs in the total supply of German products differs greatly - for historical reasons - depending on the product, without this having contributed to a drop in the production of fruit and vegetable varieties where POs play a minor role.
To make support meaningful from a societal viewpoint, the prerequisite has to be that POs provide socially-desirable services that other fruit and vegetable coordinating bodies cannot render or cannot provide to the same degree as required. In this case, from a social standpoint it would make sense to establish a line of support which could support the additional costs incurred by the POs in providing these services in comparison to other coordinators.
3.2 Use of support
In total, 23 recognised POs have produced and executed an OP under the national strategy. In addition, three POs have transferred their previous OPs to the new support structure of the national strategy and received support. The approved expenditure from 2007 to 2011 under the OPs of these 26 POs equates to some EUR 232.5 million. This amount includes support for the OPs transferred to and continued under the national strategy. POs that did not transfer their OP to the national strategy (3 POs) or which lost their recognition after 2008 (2 POs) and one PO that is part of an association of producer organisations (APO) in Belgium are not included in the calculations and therefore are also not taken into consideration in the evaluation of the national strategy.
In terms of the data basis used to describe the support programmes, there are, firstly, the annual reports provided by the BLE (German Federal Agency for Agriculture and Food) (BLE various years) and, secondly, the mid-term evaluations that the POs have to submit halfway through the duration of their OPs to the competent bodies (COMPETENT BODIES 2012). The annual reports describe the basic population of the support programmes stemming from the national strategy for the different support years to a highly aggregated degree. In contrast, the mid-term evaluations provide detailed information on support programmes for a part of the supported PO only, as not all POs have reached the halfway point of their OP.

Chapter 3 Context of the evaluation 9
Chapter 4.2 provides further information on both these data sources and the validity of the analyses that use them as a basis.
The distribution of support under the national strategy to the federal states reflects the significance of the individual federal states in fruit and vegetable production (Map 3.1). With EUR 56 million and several large established POs producing stone fruit, asparagus, mushrooms, strawberries, cabbages, and other fruit and vegetables, Lower Saxony is the frontrunner in terms of claiming and using support, followed by Baden-Württemberg where the key areas for fruit production lie around Lake Constance and fruit and vegetable production in the Upper Rhine Rift, as well as North Rhine-Westphalia and Rhineland-Palatinate. Brandenburg, Thuringia and Mecklenburg-Western Pomerania occupy the mid-table places ahead of Bavaria and Saxony. Saxony-Anhalt and Hessen are only involved to a minor degree with support under the national strategy.
Map 1: Support intensity by federal state: total amounts of approved PO expenditure in the years 2007 to 2011
Source: BLE, various years, own calculations.
Million EUR

10 Chapter 3 Context of the evaluation
The total expenditure under the approved POs of EUR 232.5 million is allocated to the 7 support objectives in very different proportions (Figure 3.1). Improving market orientation (Objective 2) and increasing and maintaining quality (Objective 3) have received the most support by far, followed by eco-friendly production and marketing of safer products (Objective 7). Less has been spent on promoting concentration of supply (Objective 1), improving management of members and incentives to join (Objective 4). Actions to improve efficiency (Objective 5) and increasing innovation (Objective 6) has seen very low levels of expenditure indeed. It could well be, in the case of the latter, that there was some overlap with other objectives when executing the programmes.
Figure 3.1: Importance of the specific objectives by support amounts
Source: Own calculations based on the mid-term evaluations of the POs (Competent bodies 2012)
The main expenses approved in order to achieve the specific objectives are, by order, actions 1. to optimise logistics, 2. to improve and maintain product quality, 3. product range design and management, 4. to reduce the amount of waste and 5. to optimise product preparation. In the eco-friendly production area, reducing waste, which includes the costs for returnable packaging systems, occupies the largest role (Table 3.1).
Objective 1: Promotion of concentration of supply
Objective 2: Improve market orientation
Objective 3: Increase and maintain quality
Objective 4: Improve management of members and incentives to join
Objective 5: Improve efficiency
Objective 6: Develop competences and increase innovation
Objective 7: Eco-friendly production and marketing of safer products
Am
ount
in m
illio
n EU
R

Chapter 3 Context of the evaluation 11
Table 3.1: Expenditure on OP actions 2007 to 2011, broken down according to the
specific support objectives Specific objective under the national strategy
Measures to achieve the objective Total number of POs 2007-2011
Expenditure 2007-2011 Euro
Objective 1: Promotion of concentration of supply
1.1. Improving cooperation 5 4 898 724
Objective 2: Improve market orientation
2.1 Optimising product preparation 2.2 Product range design and management 2.3 Sales support, marketing support 2.4 Information, communication and inventory management
systems 2.5 Optimising logistics 2.6 Greenhouse construction and assembly
15 16 15 7
11 4
17 402 283 20 305 401 6 860 210 1 295 308
28 623 495 8 652 318
Objective 3: Increase and maintain quality
3.1 Quality management and backlog management 3.2 Certification and QS training 3.3 Improving and maintaining product quality
17 15 16
15 198 033 2 902 402 23 583 919
Objective 4: Improve management of members and incentives to join
4.1 Actions to ensure sustainability 4.2 Crisis prevention and crisis management
5 10
1 036 420 8 274 852
Objective 5: Improve efficiency
5.1 Rationalisation 3 1 086 740
Objective 6: Develop competences and increase innovation
6.1 Research and test projects 6.2 Skills acquisition, advisory services and training
7 14
918 595 2 172 783
Objective 7: Eco-friendly production and marketing of safer products
7.1 Avoiding rubbish/unwanted material 7.2 Sustainable use and protection of natural resources 7.3 Contribution to climate protection 7.4 Reducing the amount of waste
8 11 5
15
2 066 199 1 442 771 1 282 659 18 760 550
Miscellaneous 18 2 720 463
Total approved costs 18 166 763 662
Source: Own calculations based on PO mid-term evaluations (Competent bodies 2012).
3.3 Subsidies policy context of the National Strategy
There are additional support measures in the agricultural sector, which, like the National Strategy, pursue the objective of increasing the competitiveness of holdings and the sector as a whole and supporting production that is eco-friendly and saves resources. These measures are largely financed through the European Agricultural Fund for Rural Development (EAFRD) and thus use resources from the 2nd pillar of the CAP. In addition, 60 % of the national share is co-funded by the Federal Government under the Joint Task for the Improvement of Agricultural Structures and Coastal Protection (German abbreviation: GAK). The most important for fruit and vegetable production are funding for individual agricultural enterprises and in particular the Agricultural Investment Programme (AFP) and support for improving market structures through funding for the processing and marketing of agricultural products (VV). Moreover, the federal states are able to offer their own support programmes in this field provided they are approved by the EU.

12 Chapter 3 Context of the evaluation
The national framework for support via the AFP and VV is laid down in the GAK (BMELV 2011). As both the AFP and the VV pursue objectives that the National Strategy also seeks to achieve, there is considerable overlap in terms of the range of funding7 available for fruit and vegetable growers that can be supported through the National Strategy or through the AFP or VV. Double funding through several support programmes is precluded in this process and verified by the granting authorities.
For instance, producer organisations can receive funding for recording, storage, cooling, sorting or preparation of products for marketing both through VV and under the National Strategy. Similarly, certain types of investment in production facilities on producer holdings belonging to PO members are eligible via the AFP or under the National Strategy. Examples of this are the construction of greenhouses or cold storage facilities.
The establishment of partially parallel support structures does not correspond to the general precept of creating streamlined, efficient administrative structures. Moreover, the amounts of funding under the aforementioned support programmes clearly differ. The GAK allows for a maximum proportion of funding of 25 % in the case of the AFP as a rule (BMELV 2011). Nevertheless, some federal states fail to achieve this rate. Schleswig-Holstein has not offered the AFP since 01.02.2010. However, the support rate can be increased by 10 % points for young farmers8. The 10 % point bonus for certain types of investment in the environment and animal welfare is not paid to market gardening. Saxony offers higher support rates in the context of individual agricultural holdings outside the GAK. In this case, the basic support rate is 30 %. Supplements of 10 % points are possible in disadvantaged areas and for selected investments in environmental protection respectively. Furthermore, support for individual enterprises in the AFP in particular is tied to strict support conditions that in principle, with regard to size and profitability, result in medium-sized holdings being able to benefit from support.
VV is restricted to undertakings that employ fewer than 750 people or that have an annual turnover of less than EUR 200 million. Support is differentiated according to the size and form of the undertaking: up to 35 % support for producer associations, up to 25 % for small and medium-sized enterprises (SMEs) and 20 % for larger SMEs that employ fewer than 750 people or that have an annual turnover of less than EUR 200 million.9
7 These are actions in the context of the National Strategy. 8 Support for young farmers is limited in the AFP to a one-off EUR 20 000 which is attained through an
eligible investment amount of EUR 200 000. 9 Recognised producer associations, that is to say associations of agricultural producers outside the fruit and
vegetable sectors, can receive up to 25 % funding for investments. Moreover, the amount of support depends on the availability of resources for support, is limited to five years, is progressively reduced and tied to both the proven annual turnover and the amount of the administrative costs (BGBL 1969).

Chapter 3 Context of the evaluation 13
VV is restricted to undertakings that employ fewer than 750 people or that have an annual turnover of less than EUR 200 million. Support is differentiated according to the size and form of the undertaking: up to 35 % support for producer associations, up to 25 % for small and medium-sized enterprises (SMEs) and 20 % for larger SMEs that employ fewer than 750 people or that have an annual turnover of less than EUR 200 million10. In contrast, the value of subsidies under National Strategy support for POs amounts to 50 % of approved expenditure and therefore is generally clearly higher than the financing rates under VV and the AFP.
The funding objective of eco-friendly/resource-saving production is a matter for both the National Strategy and the AFP as well. In this field, the funding possibilities are organised in a complementary manner in certain cases. For example, support can be received through the POs where there is a need for advisory services and training as regards integrated production or organic cultivation methods. The precondition here is that these growing methods are implemented in the holdings as well and are supported under the Rural Development Programmes. The advisory services/training must also target improvements in the environmental effects of these means of cultivation (BMELV 2008:. 57). In addition, the use of alternative methods and processes for chemical crop protection is eligible for funding under both programmes, although only one support programme can be used for a measure respectively.
3.4 Purpose and scope of the evaluation
The aim of this evaluation is to highlight the execution and effects of the National Strategy in light of these objectives and, using this information, to glean beneficial lessons learned in order to improve future National Strategies. Of particular significance in this process are any shortcomings identified in setting the general and specific objectives or intervention areas. For this reason, the evaluation assesses matters at the level of the actions under the different POs’ individual OPs, since the overall effects of these actions impact on the National Strategy. As the National Strategy essentially follows the CMO as regards the objectives and scope of eligible measures, achieving objectives under the National Strategy can be compared with the achievement of objectives under the CMO. For this reason, the recommendations drawn up for the National Strategy can also be applied to the CMO.
10 Recognised producer associations, that is to say associations of agricultural producers outside the fruit and
vegetable sectors, can receive up to 25 % funding for investments. Moreover, the amount of support depends on the availability of resources for support, is limited to five years, is progressively reduced and tied to both the proven annual turnover and the amount of the administrative costs (BGBL 1969).

14 Chapter 3 Context of the evaluation
The point in time chosen for carrying out the evaluation is a compromise between the need for evaluation results in the framework of policy programming and the validity of the results. The reason for the limited validity of the evaluation of the National Strategy at this point in time can be explained in particular due to the fact that, on the one hand, many measures are still being executed and, on the other, their full impact can only be gauged with a certain degree of hindsight. For instance, after investment in new installations, there is a learning phase as concerns their use, which has to run its course before the impacts of an investment can be fully seen. Furthermore, influences related to the year can interfere with the effects of an investment, which means that leaving as long a period as possible between making the investment and gauging its effects makes for clearer evidence. In particular, in some cases a considerable lag needs to be factored in after training and advisory activities before the effects of these actions become apparent. This means that it is still too early to make a conclusive judgement as regards the benefits of the National Strategy at the time of the evaluation. Nevertheless, this evaluation summarises the progress made in implementing the National Strategy and the effects of the individual intervention areas so that it will be possible to extrapolate results from and make initial assertions on the impacts of the National Strategy vis-à-vis its general and specific objectives.
The evaluation contains a description of the degree of usage of the financial resources and the actions carried out using them, together with an analysis of the efficacy of the OPs put into effect and a judgement of these programmes’ efficiency as a basis for judging the effects of the National Strategy as a whole. Moreover, the consistency of these effects is checked against the general and specific objectives set out in the National Strategy.

Chapter 4 Methodology 15
4 Methodology
4.1 Evaluation concept
The evaluation concept and the methodological approach followed in this evaluation are based on the provisions of the guidance note on the evaluation of national strategies (European Commission 2011). According to this note, a description of the support programmes under the national strategies is given first and then subsequently the impacts and efficacy of support are highlighted using the evaluation questions.
In order to describe the support programmes, at PO level, aggregated input and output indicators have been used which appear in the POs’ annual reports. To obtain a more precise view of the actions undertaken under the OPs, the mid-term evaluations, which are already available on many POs, have been drawn on. The actions undertaken are portrayed with regard to the respective targets sought.
So as to be able to quantify the effects of a support programme, the changes to recipients of support need to be identified that can be directly attributed to the support. When evaluating support programmes, selected indicators are used initially to investigate a recipient of support’s development under the influence of the support, based on before and after comparisons. The changes found through the before and after comparisons can nevertheless not be attributed directly to the support as in addition to the impact of the support, the recipient of support was exposed to other changing influences, such as the weather, consumer demand, events on the product and factor markets, technical progress or the regulatory environment (Figure 4.1). With/without comparisons are carried out so as to enable these additional influences that have an effect alongside those of the support to be abstracted. To do this, a comparison group is established for recipients of support with similar structures to it and that have conducted (virtually) identical actions. By comparing the changes in the group of recipients of support with those of the comparison group, the impact of support can be inferred. Last but not least, when evaluating a support programme, the windfall gain effect also still needs to be investigated. This arises from recipients of support carrying out actions using support that they would also have undertaken without funding. The effects of actions of this nature cannot be attributed to the support per se as they would have also occurred without the support.

16 Chapter 4 Methodology
Figure 4.1: Evaluation concept: Before-after and with/without comparisons on the impact
of support
Source: Own research
Before - After comparisons can be carried out successfully using the available data. However, when doing so, it is difficult to isolate the impact of individual actions as the impact indicators measure the aggregate impacts of all influences upon the respective indicators.
The situation becomes increasingly problematic with with/without comparisons as there is no appropriate comparison group. The reasons for this are due to the low number and heterogeneous nature of the POs. Although there are also other coordinators for fruits and vegetables as well as POs which cannot benefit from support under the national strategy, the structures of these undertakings are not comparable to those of the POs. Even if there were directly comparable coordinators, it would be very unlikely that they would be willing to cooperate in terms of an evaluation as they would have to supply highly detailed operating data and thereby surrender a considerable part of their corporate secrets. Nevertheless, in order to be able to take a step in the direction of a with/without comparison at the very least, the growth of POs should be compared with the market as a whole, for which statistics are available. Furthermore, expert opinion and plausibility checks play an important role in identifying the contribution made by support to achieving the objectives.
It is very difficult to research the windfall gain effect as the assessor has to rely on the assertions made by the recipient of funding. As they generally have a significant interest in the support measures under evaluation continuing, strategic response behaviour is highly probable. For this reason, evidence regarding the windfall gain from support gleaned in this way is not very credible.
Impact indicator e.g.
VMP or QMP
Before - After Comparison
Other influences
VMP with OP
VMP without OP
With/Without Comparison
Start OP Evaluation Time

Chapter 4 Methodology 17
With the problems illustrated in mind, in particular as regards the with/without comparisons and quantifying the windfall gain effect, the developments in the impact indicators suggested in the National Strategy as regards support are analysed qualitatively, as it is not possible to quantify the individual effects of support (see also Chapter 4.3). Moreover, for this qualitative impact analysis, it is necessary to verify the contribution made by the supported actions and especially the support versus the observable developments one by one. In particular, attempts should be made to identify the extent of the diverse external influences on the impact indicators. The evaluation questions, as set out in the guidance note, serve this purpose, referring as they do to the individual contributions of the different implemented actions towards achieving the objectives.
The evaluation questions respectively cover the aspects related to description of the support and the observed changes (descriptive aspect), discussion of potential correlations between effects (causal aspect), along with judgement of the efficacy of the support, i.e. a verdict on whether the observed impact has been achieved at the lowest possible cost (normative aspect).
The POs’ performance and competences as regards the specific measures are discussed individually and judged using the impact indicators, chiefly the growth in the VMP and the volume of marketed production (QMP), as well as the average value of marketed production (VMP/QMP). This corresponds to the logic behind intervention, which targets better planning of production, improvements in quality, support for marketing, crisis prevention and investment in training, research and innovation, enabling POs to increase performance levels in terms of producing qualitatively high-value products, coordinating and marketing and thereby help to boost competitiveness, resulting in a positive development in terms of the volume and value of marketed production.
As regards clarifying the question on whether the eligible actions address needs, it is first essential to specify what the underlying needs are. In the European Commission’s guidance note (European Commission 2011), reference is made to needs being an ‘Opportunity or difficulty relevant for the fruit and vegetables sector and/or producers that the National Strategy for sustainable operational programmes aims to address’. This would presumably mean the POs’ needs in the first instance. Moreover, POs’ needs may contradict those of other actors in the sector, such as, for instance, the competitors of the POs or other coordinators of fruit and vegetable products. Furthermore, taxpayers’ money is used to deliver support and therefore society at large is involved, which attaches needs to the support that could be contrary to those of the POs.

18 Chapter 4 Methodology
The needs of the POs can differ a great deal as regards the measures and support under the National Strategy. This is because the POs’ state of development varies considerably due to the different recognition dates between 1997 and 200511. Moreover, the production and marketing capacity, along with the POs’ total cultivated land of between 150 ha and 21 000 ha and turnovers of between EUR 5 million and 240 million in 2010 (BLE 2011) make for a very mixed bag. It is therefore to be expected that the type of actions executed differ greatly among the POs. Additionally, the importance of the objectives varies significantly within the respective POs for the same reason.
Public funding for support under the National Strategy can only be justified if benefits arise for society from the support that would not have occurred without state intervention. For this reason, support can only be justified when it leads to the needs and demands of society being satisfied. This applies both to the supply of high quality fruit and vegetables within a preferred market structure in conjunction with the positive development of rural areas, and to certain requirements as regards the environmental impacts of production and marketing of fruit and vegetables. Furthermore, these needs must be satisfied whilst making sure taxpayers’ money is used efficiently.
When evaluating the National Strategy using the evaluation questions in Chapter 5, attention is paid in particular to the extent to which the implemented actions and measures are effective and beneficial to the POs and their members. Moreover, the question as to whether enough has been done to address the demands of society at large and specifically as regards the efficient use of public monies is examined. Due to the existing constraints regarding the methodology and the data bases (see Chapter 4.3), clear causal relationships cannot be empirically proved between individual actions and the attainment of objectives. For this reason, expert opinion and plausibility considerations have been used for the most part so as to come as close to a with/without comparison as possible.
Further core areas for the evaluation are the consistency and efficacy of support, particularly with regard to the identification of the windfall gain effect and efficacy at PO level. Support measures are effective when they are designed in such a way that the desired effect is achieved for the least cost or for a given cost the greatest possible effect is attained. In this process, an important auxiliary condition is that an effect is achieved through the support which is desirable from a societal standpoint and which could not have occurred without the subsidy. With a view to the question on how efficiently monies have been used, the follow-up question arises as to the relationship between the effect caused by actions in this intervention area and the outcomes related to these actions. This relationship should be compared to support measures in similar areas from other support programmes. However, as the effects of the individual actions cannot be isolated, no assertions can be made on how efficiently funds have been used. For this reason, no assertions are made in this evaluation report on the efficacy of the eligible actions under the National Strategy.
11 There was however a clear emphasis on the recognition of POs in 2000 and 2001.

Chapter 4 Methodology 19
4.2 Data basis
The study is based on different data sources that stem in part from own surveys, but are primarily provided by the BLE, the competent bodies and the producer organisations themselves.
4.2.1 Annual reports and mid-term evaluations
The most important data bases for this evaluation are provided by the annual reports and mid-term evaluations of the POs. POs receiving support are obliged to compile yearly reports on the execution of the OPs, which are known as annual reports. These have to be sent to the competent bodies, which then draw up comprehensive annual reports at the federal state level. These reports are then forwarded to the BLE so it may compile an annual report for the Federal Republic of Germany, which is submitted to the European Commission. The annual reports follow a pre-ordained format and in essence cover information on the planned and executed actions, which are grouped by intervention area, the amount of transacted expenditure (input indicators) and the number of holdings involved in actions, the affected areas or the number of participants as examples for the most important output indicators. Furthermore, the annual reports also provide information on baseline indicators, such as the number of members, land under cultivation, quantity and value of marketed production, and organic and integrated cultivation areas. The baseline indicators generally represent the average values for the core figures for the three years before the start of the operational programme. The changes to these indicators are then measured against the results and impact indicators. This allows for a basis for comparison for the evaluation of the national strategy by depicting the initial situation before the support commences. The results indicators record the changes in the POs’ areas that are affected by the impacts of the actions and that are relevant for the effects of the National Strategy’s general and specific objectives. Above all, the impact indicators encompass changes in the land under cultivation, the quantity and value of marketed production and the number of active members12 (BLE various yrs.). Impact indicators are also highlighted in the annual reports for the environmental measures sector, such as on energy, water, and fertilisers and also as regards waste and packaging. However, data from the annual reports is partially incomplete for the environmental indicator area.
12 Active members of a PO are defined as those that offer their products to the PO.

20 Chapter 4 Methodology
Thus far only provisional annual reports are available for 2011, which solely contain information on certain impact indicators. This means that the indicator values for 2011 must therefore be interpreted subject to final checking. However, it should not be expected that the check will result in notable changes. Nevertheless, the preliminary annual reports as yet contain no information on the results indicators. On the whole, the annual reports refer in particular to the baseline indicators and developments to the land under cultivation, number of members, value and volume of marketed production. These figures are available for 2008 to 2011.
Due to the high level of aggregation, the annual reports do not contain a more precise illustration of the type of actions executed and the objectives sought. For this reason, the POs’ mid-term evaluations need to be used instead, as they are carried out in accordance with Article 126(3) of Regulation (EU) No 543/2011 (OJ 2011) in such time that their results can be taken into account when the next OP is prepared. This means that the mid-term evaluation has to be submitted at the latest in the third year for a three-year OP and the fifth year for a five-year OP. Some POs in fact compiled their mid-term evaluations earlier, meaning that more PO mid-term evaluations can be used for the evaluation of the National Strategy than were expected.
18 POs have provided mid-term evaluations so far. In total, there are 27 POs conducting OPs under the National Strategy and receiving funding to this effect. As regards total spending, the mid-term evaluations account for 71.7 % of funds spent from the POs’ operating funds (Table 4.1). The reporting period for the mid-term evaluations covers 2007 to 2011, because some POs that have adapted their operational programme to the National Strategy rules also incurred approved expenditure under the National Strategy in 2007 and 2008. The amounts for these years are relatively low when compared with the amounts from 2009 on, the first year in which new OPs were approved according to the provisions of the National Strategy. Even if they, for this reason, scarcely impact on the outcomes of the evaluation, they are nevertheless taken into account in this evaluation for the sake of completeness.

Chapter 4 Methodology 21
Table 4.1: Comparison of documented total expenditure in the annual reports and
PO mid-term evaluations
Total expenditure Annual report
Total expenditure Mid-term evaluation
Share (%)
2007 7 817 400 7 817 400 100.0 2008 8 857 412 8 857 412 100.0 2009 71 578 487 52 628 318 73.5 2010 72 575 569 48 371 251 66.6 2011 71 734 631 49 081 300 68.4 Total 232 563 499 166 763 662 71.7
Source: Own calculations based on annual reports (BLE various years) and the POs’ mid-term evaluations (Competent bodies 2012).
According to the recommendations in the National Strategy (BMELV 2008) and the evaluation guidance note (European Commission 2011), the mid-term evaluations are the most important data source for the evaluation as they contain the most detailed information on the use of resources. In addition, the actions are clearly attributed to one of the seven specific support objectives in the POs’ mid-term evaluations.
4.2.2 Own surveys
Selected POs were visited in the run-up to this evaluation and were asked questions on different topics related to the OPs and their execution. The main focus of the consultations was to gain better insight into the work of the POs and to understand the viewpoints and expectations of the POs better as regards EU support under the National Strategy. Of particular interest were the environmental measures receiving support, as very little empirical data is available for this area on impact indicators.
Furthermore, the federal states’ heads of department for horticulture and those responsible at the competent bodies in the federal states were asked for their feedback on the programme by means of a written questionnaire. They were especially asked to provide examples of particularly positive and negative actions. Actions where comparably low levels of spending nevertheless saw support make a particularly effective contribution to achieving the general and specific objectives of the support were deemed positive. In contrast, actions that made either only a small contribution or no contribution at all towards achieving objectives were viewed as negative, as were actions where the contribution made was particularly unfavourable in relation to the amount spent on the action. Moreover, actions where a considerable windfall gain was expected were listed as negative actions.

22 Chapter 4 Methodology
The response rate for these written questionnaires was extremely low and saw only three federal states in total reply (Bavaria, Mecklenburg-Western Pomerania and Lower Saxony).
Additional talks were carried out with experts where required, for example with market experts and with the authors of the study13, which was used when developing the bases of the National Strategy. The objective of doing this was to obtain background information and to understand better the correlation between the implemented actions and the observed outcomes and impacts. Furthermore, the results of plausibility tests were examined alongside expert knowledge to prevent misinterpretation.
The evaluation was monitored both conceptually and in terms of its content by the Federal and State Horticultural (Market Garden) Departments and members of the competent bodies.
4.2.3 Secondary data
Secondary data were also used to classify the data obtained and the analysis of general developments in the sector. This data is available, for instance, from the Statistische Bundesamt (Federal Statistical Office) and the Agrarmarkt Informations-Gesellschaft mbH - AMI (Agricultural Market Information Company). The Federal Statistical Office data include the results of the 2007 fruit tree survey and the annual information from statistics on growth and fruit and vegetable harvests (Federal Statistical Office, various years) in Germany. The data published by AMI on marketed amounts and prices at PO level is based on reports and market surveillance (AMI, various years). These data are used at various points in this report.
4.3 Methodology limits
The aforementioned evaluation concept has resulted in a well-founded evaluation outcome, taking into account the time and resources available. Nevertheless, using the evaluation approach adopted, not all results can be elaborated as would be required for a comprehensive evaluation of the National Strategy. The main reasons for this are (1.) missing data, (2.) the observation period being too short and (3.) overlapping influences which affect the observed changes to the result and impact indicators and which cannot be separated.
A robust data basis has been created by the data made available by the POs and the competent bodies, alongside additional own surveys. However, due to the timing of this evaluation this data basis cannot be entirely complete.
13 Ruhm et al. 2008: Research project on the National Strategy for Fruit and Vegetable Producer Organisations
in Germany - Options for Action for the Configuration of Sustainable Operational Programmes - Final Report.

Chapter 4 Methodology 23
Although the annual reports provide comprehensive data overall on the baseline, input, output, results and impact indicators, the results and impact indicators are fragmentary in part in the area of resource-saving production. Moreover, only selected and provisional data is supplied in the 2011 annual report. The information in the annual reports is by necessity general, meaning that they contain no information on the individual actions executed by the POs. These shortcomings do indeed tally with the POs’ mid-term evaluations, which however represent only 71.7 % of spending approved under the National Strategy. This means that a completely holistic overview of the support is lacking at the level of the actions themselves. However, it can be assumed that the clearly-recognisable main features also apply to the outstanding POs. As the differences in structures and state of development are in part so great between the POs, the results must be interpreted with caution, bearing in mind the limited data basis. This state of affairs is underscored when dealing with the relevant parts of the results and conclusions respectively.
Mention has already been made of the fact that there is a delay before the full effects of supported actions are felt (see Chapter 3.4), which means that the results and impacts of support cannot be conclusively ascertained. By the short (in time) yardstick the National Strategy is being judged, it is also to be expected that one-off external influences may overlap with the effects of the supported actions to a relatively high degree. A longer evaluation period renders such one-off effects apparent, so that they can be abstracted. Both mean that the National Strategy cannot be evaluated conclusively at the current point in time.
The most significant limitation to the applied methodology lies in the fact that the changes to the results and impact indicators always depict the aggregate of all the influences acting on them. However, these influences can only be attributed in part to the implemented actions, as other external influences are involved, which are, for instance, caused by the market or the regulatory environment. The magnitude of these effects can be identified by means of a with/without comparison, yet this cannot be carried out in this case due to the lack of a comparison group (see Chapter 4.1). In addition, it can be assumed that the impacts of different actions overlap, which may result in them having additive, mutually strengthening or contrary effects. Due to this situation, no causal relationships can be established between individual actions and the magnitude of the observable changes in the indicators. This means that the impacts of individual actions cannot be measured any further, which is nevertheless a prerequisite for evaluating individual actions. This is a problem that inherently arises when executing complex support measures and is dependent on the quality and density of available data. Therefore, additional information must be used, for example expert opinion or further considerations based on economic plausibility. Changes to the product market in particular have a major impact on the observable changes, which is why the depiction of the market context for fruit and vegetables occupies an important place in this evaluation.
The described limitations to the methodology and the data basis for evaluating the National Strategy mean that the impacts of individual actions cannot be quantified exactly. Nevertheless, the use of additional expert opinion and further economic plausibility considerations make it possible to extrapolate well-grounded assertions and recommendations.


Chapter 5 Answers to the evaluation questions 25
5 Responses to the evaluation questions
The evaluation questions refer firstly to the specific measures of the National Strategy (Chapter 5.1) and then secondly to the attainment of the objectives as a whole (Chapter 5.2). Here particular attention is paid to the impact of the measures on the performance and competences of the POs in terms of fulfilling their roles, in addition to the question of to what extent the eligible actions correspond to needs. Moreover, the extent to which the actions implemented under the POs’ OPs contribute towards reaching the National Strategy’s specific and general objectives is discussed.
In order to be able to judge the improvement in the POs’ performance using the VMP and QMP impact indicators, the changes to these key performance indicators need to be taken into account against the backdrop of the general development of fruit and vegetable production and the marketing of fruit and vegetables. For this reason, trends in this sector are highlighted here first, using production and price statistics, which are subsequently used to answer the evaluation questions.
With regard to vegetable cultivation in Germany, a slightly positive trend in quantities harvested can be seen in the period 2000 to 2011 as a whole, albeit with minor fluctuations between years (Figure 5.1). In 2005, there was a drop in vegetable production when compared with the preceding years. Then production increased again until 2009. In 2010, there was a noticeable drop in vegetable production, although this was offset the following year (FEDERAL STATISTICAL OFFICE 2012). In contrast to the long-term growth pattern, the amount of vegetables produced in Germany fluctuated to a relatively high degree during the period of time relevant for the evaluation of the National Strategy, without any recognisable short-term trend. The POs’ market share of some 24 to 25 % of total production in Germany remained rather stable during the evaluation period as a whole (AMI, various years)14.
Figure 5.1 shows that the slow growth in quantities harvested for vegetables contrasts with a tangible increase in the land under cultivation. This applies in particular to the years between 2001 and 2008. In the period that is important for this report from 2009, the statistics nonetheless show a clear decrease, which is related in part to changes to the statistics detection limits (FEDERAL STATISTICAL OFFICE 2012a)
14 In its market balance sheets, AMI indicates the total amount of production marketed through POs. This is
done based on the amounts reported by POs and is supplemented by expert knowledge. According to AMI’s estimations, these data are thus complete and paint a realistic picture of the market situation in this sector.

26 Chapter 5 Answers to the evaluation questions
Figure 5.1: Vegetable harvests for marketing in Germany (2000 to 2011)
Source: Federal Statistical Office 2012a, AMI, various years.
As regards the quantities harvested for fruit, in comparison to vegetables, there have been clearer fluctuations and no lasting trend over the last 14 years (Figure 5.2). One important reason for this is that fruit production in Germany is to a large extent shaped by apple production, which covered roughly 75 % of harvested fruit in the indicated period (BMELV, various years). This means that fluctuations in apple production have a major impact on overall fruit production in Germany. Also during the period relevant for the evaluation of the National Strategy from 2007 the quantity of fruit harvested fluctuated a great deal. With 50 to 60 % of fruit production, the POs have a clearly greater share of total production in Germany than is the case with vegetable production with 33 to 35 %. The reason for this lies once again with apples, whose producers are organised to a great extent in POs, in contrast to other products, resulting in approximately two-thirds of apples produced in Germany being marketed via POs (AMI 2012a). The land under cultivation for fruit trees has remained relatively stable since 2005 or has experienced a very slight decrease.
One can conclude that the long-term developments described for vegetable production and fruit production have continued their upward trend. However, developments may deviate from the trend in individual years.
Figure 5.2: Fruit harvests for marketing in Germany (1998 to 2011)
Source: Federal Statistical Office 2012a, AMI, various years.
4000
3000
2000
1000
0
1000
t
Vegetable harvest PO vegetable harvest Land for vegetable cultivation
120 000
110 000
100 000
90 000
80 000
ha
1,500
1,250
1,000
750
500
250
0
1000
t
Fruit harvest PO fruit harvest Land for fruit cultivation
60 000
50 000
40 000
30 000
20 000
10 000
0
ha

Chapter 5 Answers to the evaluation questions 27
Figures 5.3 and 5.4 show the proportion of German-produced fruit and vegetable varieties sold via POs. Of note are the considerable differences in the amounts of the different vegetable and fruit products that are marketed by POs. A particularly high level of organisation can be seen for vegetables for iceberg lettuce, cucumber, potherbs, tomatoes and broccoli (Figure 5.3). As for fruit, the same applies to apples, as well as plums and damsons (Figure 5.4). Barely any or no gherkins, asparagus and white cabbage are marketed via POs, and the same is true for strawberries, other berries and cherries (AMI 2012a).
Of further note for both vegetables and fruit is the fact that the quantities of some important crops are higher than their share of sales, which means that the prices here that the POs target are lower than for other suppliers. For vegetables, the difference is particularly high for cucumbers, tomatoes and courgettes, but also for cauliflower, broccoli, iceberg lettuce and radishes. On the other hand, for kohlrabi, lettuce, celeriac and dwarf beans, the share of sales is higher than the quantities, which actually leads to a higher PO share of overall sales revenue than of the overall quantity of vegetables produced. With fruit, quantities are consistently higher than share of sales. However, this finding should not be overrated. On the one hand, direct sales of fruit and vegetables with their high prices lead to the share of sales for POs inevitably being lower than the share of sales. Running counter to this is production intended for processing, which is overwhelmingly not sold via POs, with their comparably lower producer prices (BEHR 2012).
Figure 5.3: Producer organisations’ share of vegetables produced and marketed in Germany (2010)
Source: AMI 2012a, own diagram
Ove
rall
C
aulif
low
er
Bro
ccol
i
Chi
nese
cab
bage
K
ohlra
bi
Whi
te c
abba
ge
Iceb
erg
lettu
ce
Hea
d le
ttuce
A
spar
agus
(in p
rodu
ctio
n)
Cel
eria
c
Car
rots
R
adis
h
Ghe
rkin
s
Cou
rget
te
Dw
arf b
eans
O
nion
s
Leek
M
ushr
oom
s
Cuc
umbe
r
Tom
ato
Po
ther
bs
Oth
er v
eget
able
s
Amount produced
Sales revenue
Shar
e in
%

28 Chapter 5 Answers to the evaluation questions
Figure 5.4: Producer organisations’ share of fruit produced and marketed in
Germany (2010)
Source: AMI 2012a, own diagram
AMI (2012b) provides time series for the PO sales prices for vegetables (Figures 5.5 and 5.6) and fruit (Figure 5.7) for the years 2004 to 2011. A number of fluctuations can be observed for vegetables and fruit alike during this period. However, only a few trends emerge. Of the vegetable products that are important for the German POs, above all, asparagus has experienced a clear increase in price. The producer prices for tomatoes from glasshouses have risen tangibly. Cauliflowers have also witnessed a slight rise. For mushrooms, a clear downwards trend can be detected during the observed period. As regards the other vegetable products, there are differences between the years, such as for carrots, onions, cucumbers, yet no clearly recognisable upwards or downwards trend. 2010 was a year of high prices for most vegetable products, as were 2007 and 2008 for some.
The sales price of the most important fruit product in Germany and from a PO standpoint - the apple - has remained at the same level over the observed timeframe from 2004 to 2011, even though the price of apples has been subject to annual fluctuations (AMI 2012b). The price of plums/damsons – the second most important fruit species for POs - remained at a similar level as well, albeit with considerably greater fluctuations. In contrast, sweet cherries, strawberries and, to a lesser extent, pears saw a price increase between 2004 and 2011. For most of the fruit products observed, 2008 was a year of high prices, with plums/damsons experiencing a particularly clear rise, as did sweet cherries. However, stone fruit sold for higher prices in this year than in other years in the period under consideration (Figure 5.7). In the short period of relevance to the evaluation, no pronounced trends can be discerned for the products of importance to the POs in terms of the development of sales prices.
Ove
rall
App
les
Pear
s
Swee
t che
rry
Sour
che
rry
Plum
s/da
mso
ns
Stra
wbe
rrie
s (in
cl. g
lass
hous
e)
Bla
ckcu
rran
t
Oth
er fr
uit
Amount produced
Sales revenue
Shar
e in
%

Chapter 5 Answers to the evaluation questions 29
Figure 5.5: PO sales prices for selected types of vegetable in Euro/dt in the years
2004 to 2011
GP: from glasshouse production
Source: Ami 2012b, own diagram
Figure 5.6: PO sales prices for selected types of vegetable in Euro/unit or Euro/100 bundle for the years 2004 to 2011
GP: from glasshouse production
Source: Ami 2012b, own diagram
Asparagus Tomato GP Onions Mushrooms
Euro
/100
uni
ts o
r /10
0 bu
ndle
Cucumber GP Cauliflower Iceberg lettuce Head lettuce open air Head lettuce GP Radishes (Euro/100 bundle)

30 Chapter 5 Answers to the evaluation questions
Figure 5.7: PO sales prices for selected types of fruit in Euro/dt in the years 2004 to 2011
Source: Ami 2012b, own diagram
As in agriculture, a structural change is taking place in the market garden sector, where production is increasingly concentrated in fewer, larger holdings. This was already documented through the comparison of the number of concerns and productive land in the market garden surveys of 1994 and 2005 (DIRKSMEYER 2009). The number of holdings has clearly fallen, yet the total land under cultivation for fruit remained virtually constant over the time period, whereas the cultivated land for vegetables clearly rose. Over the same period, employment in fruit growing fell, compared with an increase in the vegetable sector, albeit to a lesser extent than the increase in land under cultivation. Even though no new market garden surveys are available, it can be assumed that this structural change has continued apace in the years that have elapsed since the last survey.
Reference is made to result and impact indicators for all evaluation questions, which for most of the intervention areas cover the volume of marketed production, the VMP, the average value of marketed production (VMP/QMP) and the number of active PO members and their land under cultivation. Table 5.1 provides an overview of the evolution of these indicators. For this purpose, the baseline indicators, which represent the state of play before the OPs began, are compared with the impact indicators from 2011. This enables the development that has been influenced by the support to be described. All in all, the number of members15 and land have developed in a similar fashion to the general structural change, with a clear drop in the number of producers and a slight increase in productive land (Figure 5.8) overall. The structural change for fruit and in particular for vegetables is characterised by a move towards larger holdings whilst the smallest and small holdings are simultaneously falling by the wayside. This echoes the observation that for nine of the total 27 POs that are relevant for the evaluation of the National Strategy, a drop in membership numbers has gone hand in hand with an increase in the land under cultivation.
15 In this study, the number of members refers solely to producer holdings that are active members of POs.
Sweet cherry Strawberry Plum/damson
Dessert pears Dessert apples

Chapter 5 Answers to the evaluation questions 31
Figure 5.8: Overall development of the number of affiliated producers and PO members’
land under cultivation from 2008 to 2011
Source: Own calculations based on the POs’ annual reports (BLE, various years).
Judging by the productive land, the significance of vegetable cultivation has risen for all POs, which overcompensates for the decline in land dedicated to fruit production (Table 5.1). This observation also mirrors the general trend in both sectors, as the development of land under cultivation for fruit and vegetables in Germany as a whole shows (see Figures 5.1 and 5.2).
The way the positive and negative changes are shared highlights the high degree of heterogeneity in the PO group (Table 5.1). If a summary is made of only the POs where one indicator has changed positively or negatively, the average changes reach double digit percentages. However, no direct correlation can be established between the development of the VMP or QMP and the execution of specific planning of production actions.
Num
ber o
f mem
bers
Cul
tivat
ed la
nd in
ha
Members Cultivated land
14 000
12 000
10 000
8 000
6 000
4 000
2 000
0
90 000
80 000
70 000
60 000
50 000
40 000
30 000
20 000
10 000
0

32 Chapter 5 Answers to the evaluation questions
Table 5.1: Overview of the changes to the impact indicators from the baseline indicator
for 2011 Total change PO with growth PO with decrease
Absolute % Number Average growth Number Average decrease Number of producers1) Number -2 429 -27.4 13 12.7 % 12 -33.4 %
Total land1) ha 1 373 1.8 % 13 16.9 % 10 -10.1 % Land for vegetables2)+3) ha 3 374 7.6 % 10 28.7 % 9 22.6 %
Land for fruit2) ha -1 542 -4.9 % 7 7.8 % 12 -14.6 % QMP4) t 168 277 12.5 % 16 26.4 % 7 -25.5 % VMP EUR 1000 263 881 32.4 % 17 50.5 % 9 -4.4 %
Average VMP EUR/kg 0.09 15.3 % 19 15.2 % 4 -10.1 %
1) No change among missing POs 2) Baseline value not indicated in annual reports. Reference year 2008 3) Data set incomplete for one PO 4) No information for 2011 for 3 Pos
Source: Own calculations based on the POs’ annual reports (BLE, various years).
In spite of the negative development to land under cultivation for fruit, apples remain the most important marketed product for all POs overall, with approximately 20 % of the total VMP across all POs. Nevertheless, this development is also downwards, from 25 % of total VMP in 2008. For strawberries, the second most important fruit and the third most important product in the two product groups, the share of PO VMP fluctuated between 6 % and 8 % over the years. In contrast, with regard to types of vegetable, tomatoes have gained in significance and have risen from 6th position in the most important vegetables in 2008 to 2nd in 2011 behind lettuce, which lies in 2nd place overall in the ranking of the most important products (Figures 5.9 and 5.10). Overall, the VMP, at 32.2 %, has risen higher than the QMP, at 12.5 %, causing an increase in the price level and therefore the average VMP of 15 % (Table 5.1).
Figure 5.9: Most important PO fruit products by year from 2008 to 2011
Source: Own calculations based on the POs’ annual reports (BLE, various years).
% o
f tot
al V
MP
Apple Strawberries Plums and damsons
Cherries

Chapter 5 Answers to the evaluation questions 33
Figure 5.10: Most important PO vegetable products by year from 2008 to 2011
Source: Own calculations based on the POs’ annual reports (BLE, various years).
Figures 8.4 to 8.6 in the annex demonstrate the development of land under cultivation for all POs receiving support under the National Strategy dependent on the baseline VMP, that is to say, the VMP before implementation of the current OPs started. First of all, as expected, the size of the VMP at the baseline point in time and the amount of land under cultivation is directly related. However, no correlation between the growth in land under cultivation and the amount of the baseline VMP can be established. In fact, in each of the three groups, there are POs that managed to increase their land under cultivation, demonstrating quite the opposite.
By the same token, there are POs in each group that have had to accept a decrease in land and ones where the land under cultivation has fluctuated. The rogue results for some POs indicate mistakes in the data, such as with POs DE 0057, DE 0055 or DE 0032.
5.1 Common evaluation questions on specific National Strategy measures
5.1.1 Actions aimed at planning of production
In the planning of production intervention area, there is a wide-ranging catalogue of actions that have been carried out by the POs. On the one hand, these encompass investment for product preparation and packaging and production management, such as packaging plants, preparation facilities, optimisation of computer facilities and climate control computers. On the other hand, there has also been direct investment in expanding or modernising production. The second group includes, above all, investment in member companies in the pre-harvesting area, such as the sowing of permanent crops, the construction of greenhouses or the purchase of greenhouse facilities.
% o
f tot
al V
MP
Lettuce Tomatoes Asparagus Cabbages Cucumbers Onions Other types of cabbage Cauliflower Mushrooms Carrots

34 Chapter 5 Answers to the evaluation questions
5.1.1.1 To what extent have the actions aimed at planning of production contributed to
developing Producer Organisations’ performance in relation to planning of production?
With approximately 24 % of total expenditure under the National Strategy, the actions aimed at planning of production form one of the most important intervention areas (Table 5.2). All POs bar one have carried out planning of production actions (Table 5.3). In all the OPs for which mid-term evaluations are already available, the relative significance of the planning of production intervention area at 28 % is somewhat higher than for all POs as a whole. The relative importance of these actions in the individual operational programmes fluctuates from 10 to 48 % of total spending (Table 5.4). No correlation can be established with the size of the PO, judged by the baseline VMP before the OP started. Over the course of time, investment in the product range and product management has increased, while patently lower sums went into product preparation and optimisation in 2011 than in the previous two years. Expansion of production capacity through the construction of greenhouses does not display any unequivocal development over time (Figure 5.11).
Table 5.2: Share of intervention areas in the approved costs of OPs from 2007 to 2011 as a whole (%)(n=27)
Intervention area according to guidance note for evaluation Relative importance (%) Area 1: Actions aimed at planning of production 23.7 Area 2: Actions aimed at improving or maintaining product quality 25.7 Area 3: Actions aimed at improving marketing, including promotion and communication activities 25.8 Area 4: Research, including experimental production 0.6 Area 5: Training actions and actions aimed at promoting access to advisory services 1.8 Area 6: Crisis prevention and management instruments 5.0 Area 7: Environmental actions 14.9 Area 8: Other actions 2.5 Total approved costs 100.0
Source: Own calculations based on the POs’ annual reports (BLE, various years).
Table 5.3: Number of POs carrying out planning of production actions, and approved expenditure from 2007 to 2011.
Actions aimed at planning of production Number of POs in total 2007-2011 Expenditure 2007-2011 (EUR) Purchase of fixed assets Other forms of purchase of fixed assets Other actions
25 9 11
49 066 268 1 250 394 4 701 383
Total 26 55 018 046
Source: Own calculations based on the POs’ annual reports (BLE, various years).

Chapter 5 Answers to the evaluation questions 35
Table 5.4: Approved expenditure for planning of production by PO (2007 to 2011)
(n=18) PO number Total planning of production (EUR) % planning of production of the OP overall DE 0103 DE 0057 DE 0061 DE 0041 DE 0005 DE 0100 DE 0040 DE 0094 DE 0013 DE 0002 DE 0093 DE 0053 DE 0055 DE 0010 DE 0098 DE 0105 DE 0083 DE 0095
10 584 411 2 232 994 3 952 821 3 292 615 5 040 404 4 810 348 1 421 506 2 992 699 3 102 769 2 978 163 2 022 078 1 127 072
388 459
1 460 905 600 400 811 197 536 465
32.9 10.5 26.0 16.3 41.7 43.3 14.4 30.9 46.0 42.8 28.7 37.4
14.5 48.1 25.2 33.7 44.9
Total 47 065 511 28.1 POs with > 50 million baseline value of marketed production
POs with 10-50 million baseline value of marketed production
POs with < 10 million baseline value of marketed production
Source: Own calculations based on POs’ mid-term evaluations (Competent bodies 2012).
Figure 5.11: Most important actions within the National Strategy according to expenditure outlaid in the years 2007 to 2011
Source: Own calculations based on POs’ mid-term evaluations (Competent bodies 2012).
Expe
nditu
re in
mill
ion
EUR
Optimising logistics
Increasing and maintaining product quality
Product range design and management
Reducing the amount of waste
Quality management and backlog management
Improving cooperation
Optimising product preparation
Crisis prevention and crisis management
Greenhouse construction and assembly
Sales support, marketing support

36 Chapter 5 Answers to the evaluation questions
The type of individual investments and the high level of participation in the actions in the planning of production intervention area indicate that capacity has been increased both for preparation and packaging and also for product production. Examples of this are investment in demand-orientated preparation of products, in grading and in labelling on the one hand, as well as in diversification of the product range and the purchase of special machines on the other. In the context of the evaluation, these actions have in part been deemed particularly positive by the competent bodies, such as, for instance, product range diversification through new planting of permanent crops (tree fruit), which enable the POs taking part to take into account the demand for special varieties and increase the quantities marketed on target markets in the long term. In one other case, the new planting of permanent crops as part of a process of tailoring varieties was named as a prerequisite for maintaining production as a whole and generally offering marketable products, which is regarded as an absolute sine qua non for maintaining production among the affiliated producers in the medium to long-term.
Figure 5.12 depicts the relationship between the amounts spent on actions aimed at planning of production from the total amounts spent so far in the OPs of the POs in comparison to the changes to the VMP in 2011 from the baseline indicator. It can clearly be seen that the change to the VMP is independent from the amount spent on planning of production. By way of example, the POs DE 0013 and DE 0098 have used between 45 % and 50 % of spending under their OPs so far for actions aimed at planning of production. However, the change in the VMP varies greatly. While the PO DE 0013 was able to more than double the VMP between 2008 and 2011, it only rose 10 % for DE 0098. Similar examples abound as well for POs that previously spent comparatively little on planning of production. POs DE 0010, DE 0040, DE 0055 and 0057 have each allocated less than 15 % of their spending to date under their OPs on actions aimed at production of planning. When comparing these POs, the change in the VMP also clearly varied and ranges between -4.4 % and 54 %. Looking at the variation in the QMP by PO shows a similar picture (Table 8.6 in the Annex). This illustrates that it is extremely difficult to establish a causal relationship between spending on planning of production and the changes to the VMP and QMP. This may be explained by there being no such correlation, or that it cannot be isolated due to overlapping influences and thus cannot be measured.

Chapter 5 Answers to the evaluation questions 37
Figure 5.12: Comparison of the importance of expenditure on planning of production
taking into account the change in the VMP in 2011 against the baseline indicator, by PO
Source: Own calculations based on POs’ mid-term evaluations (Competent bodies 2012).
The extent to which the actions aimed at planning of production have contributed to the demonstrated changes cannot be ascertained empirically. Hence, economic arguments have been used to check the plausibility of the actions’ impact. It is plausible that investment in expanding fruit and vegetable production capacity contributes to boosting the QMP. Supposing constant prices, the VMP should therefore automatically increase. However, the overall observed changes to the VMP and QMP cannot be attributed to planning of production actions, as this would mean that all other actions have had no effect or that their impact has been nullified. Nevertheless, the European Commission does not require in its guidance note “Common Performance Indicators for the Monitoring and Evaluation of Operational Programmes” (European Commission, 2011a) the effects to be broken down by measure or intervention areas. In this way, the total change in important indicators like VMP, QMP and the number of members is referred to respectively for each intervention area in full in both the annual reports and the mid-term evaluations, which implies a causal relationship between the individual actions and the changes to the indicators, although this is not justified from an objective point of view.
As explained above, it can be assumed that actions aimed at planning of production have helped increase the VMP. Also, the implemented actions most probably help retain members. This is in particular because investments are supported in this intervention area which increase producer production capacity.
Am
ount
or c
hang
e in
%
Proportion of spending on planning of production Change in VMP from the baseline indicator

38 Chapter 5 Answers to the evaluation questions
5.1.1.2 To what extent are the actions aimed at planning of production: (a) in
accordance with needs? (b) coherent with other measures of the National Strategy? (c) coherent with measures of the Rural Development programme(s) having the same objectives?
Due to the significance of the planning of production actions in the POs’ operational programmes with a share of 23.7 % (overall) or 28 % (concerning the POs with the mid-term evaluations) of total spending under the National Strategy, the conclusion can be reached that these specific measures are, to a great extent, of interest to the POs and correspond to their needs. The fact that there is no correlation between PO size and the relative significance of the planning of production actions amongst the individual POs is a further indication that planning of production is a relevant area for all POs in order to expand PO activities, bolster the POs’ importance and thus boost the relevance of POs to their members. It is therefore clear that the intervention area on planning of production addresses important PO needs. The conclusion can also be reached that support for planning of production actions is not in the interests of fruit and vegetable producers who are not affiliated to a PO. The reason for this is that these producers have to fund investments in product preparation or in facilities for fruit and vegetable production, for example, and generally out of their own pocket. In contrast to the members of POs, the profitability and liquidity of producers who are not organised in POs suffers when faced with investments of this kind or similar. This has negative impacts on these holdings’ competitiveness and ability to grow and thus leads to distortions in competition amongst producers. This line of thought applies in essence to all intervention areas supported under the National Strategy, and all in all affects the CMO as well. However, it is particularly apparent with planning of production actions as producers receive a high degree of support for investment in this area16 (Table 5.5). It is hard to acknowledge that the actions implemented by the POs towards planning of production concern societal needs, which, without support, would not have occurred. Increasing demand for certain products or for products from given regions results, due to scarce supply, in increased producer prices, which can be construed in turn by producers as a signal to shift production in this direction. In normal circumstances, these market signals should provide enough incentive to adjust production. Support could in fact accelerate this development.
16 The particular conspicuousness of the issue mentioned applies to all intervention areas of the National
Strategy where investment is carried out at producer level. These areas are, above all, planning of production, some of the actions to improve and maintain product quality and to improve marketing, along with support for harvest insurance in the crisis management intervention area.

Chapter 5 Answers to the evaluation questions 39
There is always a danger, particularly when supporting the cultivation of specific crops or varieties, that exaggerated reactions can be initiated, as for example with support for biogas or photovoltaic systems. Even though reacting through over-adapting is not visible yet in the context of the National Strategy, it can be assumed that adapting production due to market signals alone will generally fulfil society’s needs.
With regard to other actions under the National Strategy, planning of production activities are often closely entwined with actions in the quality and marketing areas and partly build upon each other. For this reason, the planning of production actions appear to be a useful integral part of the funding possibilities under the National Strategy. Nevertheless, this does not give any indication as to whether the support is also useful, as, to do this, additional criteria must be met, such as, for instance, a societal need for changes that would not happen without support.
As regards the coherence of the support for planning of production actions under the National Strategy and the AFP and VV, further research needs to be carried out as to the actions that have been undertaken in this intervention area. It is apparent that a large number of actions have been supported for the affiliated members to improve their performance in the pre-harvesting area or in production itself. Examples of such actions are the planting of permanent crops or the erection and kitting out of greenhouses, which have been carried out by 17 of the 18 POs who have submitted a mid-term evaluation. In order to be able to quantify the extent of these actions, every investment aimed at improving economic performance in the pre-harvesting area has been identified. This includes the purchase of shade curtains and other greenhouse equipment, the construction of greenhouses or other covered areas, such as polytunnels and the planting of permanent crops. 61 % of total spending in the planning of production intervention area can be classified in this way (Table 5.5).
Table 5.5: Investment in producer organisations aimed at improving economic performance in the pre-harvesting area
Total investment in holdings (EUR)
Number of POs Share of intervention area (%)
Planning of production 28 943 621 17 61.1 Improving quality 9 930 139 13 23.6 Improving marketing 1 014 470 5 2.7 Crisis management 8 245 442 10 99.6 Environmental measures 566 630 1 2.4
Source: Own calculations based on POs’ mid-term evaluations (Competent bodies 2012).

40 Chapter 5 Answers to the evaluation questions
Support for this kind of investment has already led to conflicts between POs who are active within a region and who carry out actions to improve the performance of individual holdings in the pre-harvesting area with their producers to a clearly different extent. The reason for this is that investments of this nature are regarded in a particularly critical light due to the perceived distortion of competition, meaning that members of POs that are orientated less intensively in this direction clamour for corresponding actions. This can even result in members leaving this PO or joining the other PO where they can expect more investment for their own holding.
Conversely, these actions to improve the economic performance in the pre-harvesting area in members’ holdings can doubtlessly also have positive impacts on the PO as a whole. This is because they increase the quantities and, where applicable, the quality and the VMP of a PO. Depending on a PO’s age and facilities, these measures may even be a fundamental precondition for the PO’s survival and competitiveness. This is particularly the case with smaller associations of producers with traditional production structures and where cultivation is a secondary line, who, without subsidies and without a market-orientated concept, barely invest in modernising production and thus will probably disappear from the market in the medium term.
On the other hand, it is crucial to check the extent to which actions on individual holdings to improve economic performance in the pre-harvesting area under the POs’ operational programmes actually dovetail with the objectives of the National Strategy, or whether it is rather a case of the windfall gain effect. With these actions, the effects emerge first of all for the individual producer and then in a second stage and only indirectly for the PO. It is therefore logical that investments of this nature be classified rather as support programmes to improve internal business structures among individual producers and thus as individual holding investment support, instead of the National Strategy, which primarily seeks to strengthen POs directly. Due to the lower support rates in the AFP in comparison to the National Strategy, the support for investments via OPs is considerably more interesting for producers.
5.1.2 Actions aimed at improving or maintaining product quality
The actions in the area of improving or maintaining product quality include, on the one hand, quality management at the PO level through controls and quality assurance systems, including laboratory tests and backlog controls, as well as the employment of quality assurance representatives. In addition, this area also includes measures to maintain production quality, such as anti-hail nets, anti-frost irrigation systems, netting for cherry areas, irrigation systems and investment in quality assurance in product preparation and transport.
The latter actions can be counted as investments to improve economic performance in the pre-harvesting area on members’ holdings.

Chapter 5 Answers to the evaluation questions 41
5.1.2.1 To what extent have the actions aimed at improving or maintaining product
quality contributed to developing performance in relation to product quality?
Virtually all POs have instituted measures to improve quality during the evaluation period (Table 5.6). The POs have spent nearly EUR 60 million to date on actions to improve and maintain product quality. This equates on average to 25 % of all POs’ total spending. As emerges in detail from the mid-term evaluations, on a case-by-case basis, between roughly 10 and 49 % of the total amount of the operational programme is invested in this way (Table 5.7). This gives great significance to this intervention area in the POs’ operational programmes. As was observed with planning of production, there is no apparent correlation between spending on actions to improve quality and PO size (Table 5.7).
Table 5.6: Expenditure aimed at improving quality by PO (2007 to 2011) (total) Actions to improve quality Number of POs in total 2007-2011 Expenditure 2007-2011 (EUR) Purchase of fixed assets Other forms of purchasing fixed assets Other actions
23 8 25
35 225 216 350 922 24 113 173
Total 26 59 689 312
Source: Own calculations based on POs’ mid-term evaluations (Competent bodies 2012).
Table 5.7: Expenditure on improving quality by PO (2007 to 2011) (n = 18)
PO Number Total for quality improvement (euro) % quality improvement of total OP DE 0103 3 673 231 11.4 DE 0057 6 188 662 29.2 DE 0061 2 985 373 19.6 DE 0041 1 890 867 9.4 DE 0005 5 797 589 48.0 DE 0100 4 544 294 40.9 DE 0040 2 881 467 29.3 DE 0094 3 980 391 41.1 DE 0013 1 368 241 20.3 DE 0002 1 579 885 22.7 DE 0053 833 355 27.6 DE 0055 210 284 12.6 DE 0010 710 720 26.5 DE 0098 834 851 27.5 DE 0105 1 163 539 48.8 DE 0083 757 600 31.4 DE 0093 2 263 288 32.1 DE 0095 457 173 38.2 Total 42 113 856 25.0 PO with > 50 million baseline value of marketed production PO with 10-50 million baseline value of marketed production PO with < 10 million baseline value of marketed production
Source: own calculations based on mid-term evaluation of the POs (competent authorities 2012).

42 Chapter 5 Answers to the evaluation questions
If we consider the expenditure on measures in the area of quality over time, it is clear that expenditure on quality management, checks and monitoring of residues was still relatively high in 2008 and since then has decreased, whereas investment in improving and maintaining quality in production has increased in importance (Figure 5.11). Improved product quality is expected to be reflected in a stabilisation or increase in sales with prices at least remaining constant or possibly increasing. Overall, the value of the production marketed by the PO has increased by 32 % (Table 5.1), whereas in Germany the overall supply of vegetables stayed almost the same in the years being compared (2008 and 2011) and for fruit it was even distinctly lower in 2011 than in 2008, which indicates a positive development of the POs compared with the sector as a whole. Development at the level of individual POs varies enormously, however. In all size classes there are POs that have shown marked growth, POs that have shown a clear decline and those that have shown minor fluctuations around a stable value of marketed production. No link can be seen here between the size of the PO, measured by the value of marketed production, and changes in the value of the marketed production (Figures 8.10 to 8.12 in the Annex). Overall, participation of POs in specific quality schemes has increased, which could have contributed to the general increase in the value of marketed production. For example, certified organic production has increased by 47 % and certification according to private quality standards has increased by 25 % compared with the baseline (Table 5.8). Table 5.8: Volume of marketed production that meets the requirements of a specific
quality scheme (n = 27)
Volume of marketed production Baseline
indicator
Change in volume in relation to the
baseline indicator t % Certified organic production 26 005 47 % Protected geographical indications and protected designations of origin
33 242
-4 %
Certified integrated production 1 031 685 7 % Private certified product quality schemes 771 274 25 % Source: own calculations based on the annual reports (Federal Office for Agriculture and Food, various years) With regard to the average commercial value (value of marketed production/volume of marketed production) of the production, the POs also show an increase of around 15 % (Table 5.1). Compared with average fruit prices, the POs’ commercial value has shown significantly more positive development. This is particularly surprising in view of the fact that 2008 was a year with comparatively high fruit prices, and the average price of apples in 2011 was significantly lower than it was in 2008. It is possible that the certifications under various quality schemes contributed to this positive development. However, the value of the marketed production and the commercial value did not develop the same way for all POs, but exhibited large differences. Therefore, the available data do not allow any connection to be made between investment in quality-improving measures and the development of the value of marketed production or the commercial value. A comparatively high proportion of the expenditure on measures in the area of quality can be associated with both large and small changes, and even negative changes, in both indicators (Figure 5.13 and Figure 8.13 in the Annex).

Chapter 5 Answers to the evaluation questions 43
Figure 5.13: Comparison of the relative importance of expenditure on quality improvement
with the change in the average value of marketed production compared with the baseline indicator, by PO
Key to Figure:
Anteil Ausgaben für Aktionen zur Qualitätsverbesserung
Proportion of expenditure spent on quality improvement actions
Veränderung mittlerer WVE zu Ausgangsindikator
Change in the average value of marketed production in relation to the baseline indicator
Anteil bzw. Veränderung in % Proportion/change in % Source: own calculations based on the annual reports (Federal Office for Agriculture and Food, various years)
and mid-term evaluations (competent authorities 2012). It must be mentioned, however, that, in addition to the quality of the products, there are other factors that affect the average product price. For example, changes in product range in favour of products with a higher product price will automatically result in an increase in the average value of the marketed production. The information available in the annual reports concerning the product range of the POs is incomplete17, making analyses of this aspect impossible. This means that, on the basis of an increase in the commercial value alone, it cannot be concluded that the market has rewarded an improvement in quality.
17 Table 2.2 in the annual reports shows the four most important products or product groups and the relevant value of the marketed production. On account of the sometimes high degree of product grouping (e.g. lettuces, berry fruit) and in some cases the considerable marketed production value of products that are not indicated separately, these data cannot be used for an evaluation in this context.

44 Chapter 5 Answers to the evaluation questions
5.1.2.2 To what extent are the actions aimed at improving or maintaining product
quality a) in accordance with needs; b) coherent with other measures of the National Strategy; c) coherent with measures of the Rural Development programmes having the same objectives?
The relatively high importance of actions aimed at improving or maintaining product quality in the operational programmes indicates that these specific measures are of considerable interest to the POs and their members, and so it can be assumed that they are in line with the needs of the POs and their active members. The fact that there is no connection between the size of the PO and the relative importance of these actions in terms of the overall expenditure for the OP is a further indication that improvement or maintenance of quality is a fundamentally important area for the functioning of the POs, and one that supports the interests of their members, and that the framework provided by the National Strategy is in line with the various needs of the individual POs. At around 15 % of the expenditure for improving and maintaining quality, personnel costs for a quality controller and product manager are an important component of the operational programmes (Table 5.9). On account of the specific conditions of many POs, in particular where the member holdings exhibit a strongly heterogeneous structure, the introduction and implementation of new quality assurance and management schemes can entail greater expenditure for POs compared with other packers and marketers, which is why subsidising such specific actions is potentially appropriate in order to even out any structure-related competitive disadvantages experienced by the POs. However, the use of permanent personnel for quality or product management that forms part of the core activity of every undertaking that packages fruit and vegetables and places them on the market should be distinguished from such time-limited and subject-specific actions. Subsidising these ordinary personnel costs would result in competitive advantages over other comparable undertakings that fulfil the same functions with regard to supplying the market with high quality fruit and vegetables without a 50 % wage subsidy for human resources. Table 5.9: Totals and proportions of personnel costs for each intervention area
Intervention area Total personnel costs
(euro) Number of POs Proportion of the
intervention area (%) Quality improvement 6 340 873 9 15.1 Promotion of marketing 1 231 498 4 3.3 Wage costs for personnel providing advice to producers
613 373 3 28.6
Source: own calculations based on mid-term evaluation of the POs (competent authorities 2012).

Chapter 5 Answers to the evaluation questions 45
The considerable importance of product quality for producers is due to the importance that society attributes to this area. Thus, the measures eligible for support in this area also meet the needs of society. This applies in particular when the actions affect food security. However, it can be assumed that the positive effects on food security would also occur without support, as there are very restrictive legal provisions relating to this, as demonstrated by the requirements relating to permissible levels of plant protection product residues or to traceability of the products. It should therefore be assumed that the effects in this area would also have been achieved without support. Other quality aspects, for example protection against damage caused by hail or against bird damage is expected to receive less attention by society and instead is more likely to follow the financial interests of producers. With regard to other areas for action in the National Strategy, high product quality is a key element of market orientation and a basic condition for successful marketing. In terms of the coherence of the support for actions aimed at maintaining and improving quality within the framework of the National Strategy with the agricultural investment promotion programme (AFP) and the programme for promotion of the processing and marketing of agricultural products (VV) it is clear that, as with measures in the area of planning of production, a significant proportion of the expenditure goes on investments which, at the level of the member holdings, are aimed at improving financial capacity prior to harvest (Table 5.5). 24% of the expenditure on improving or maintaining quality is allotted to investments such as irrigation installations or hail and bird protection nets. These were implemented in 13 of the 18 POs for which mid-term evaluations are available, that is to say 72 % of POs. The same concerns relating to deadweight effects and the merely secondary effects at the level of the POs as mentioned above (Chapter 5.1.1.2) in relation to the question of the coherence of the support provided for actions aimed at planning of production are also relevant here. In addition, the fact that such actions more appropriately fall within the AFP than the CMO is also mentioned, including with regard to possible distortions of competition for producers who are not members of a PO or whose PO does not invest in individual holdings. Overall, the actions carried out with the aim of maintaining and improving product quality seem to be more appropriate in terms of intervention logic than the actions aimed at planning of production, as a contribution to the observed general increase in the value of the marketed production and the average value of the marketed production is plausible. This is also indicated by the reported increases in the volume of the marketed production that meets the requirements of a specific quality scheme, and the increase in the value of the marketed production and average value of the marketed production that is higher than the general market trend. By way of qualification, however, it is also pointed out that no causal link with the actions carried out in this area can be made on the basis of the data available, and at the level of individual POs the development of the indicators varies widely and is independent of the actions implemented.

46 Chapter 5 Answers to the evaluation questions
5.1.3 Actions aimed at improving marketing, including promotion and communication
activities
The actions that have been carried out with the aim of improving marketing include investments in the introduction of product management systems, improvement of data management, transport of production internally within individual holdings and between holdings and, most importantly, in sales promotion, public relations, visits to trade fairs and acquiring market information and advice on marketing.
5.1.3.1 To what extent have the actions aimed at improving marketing contributed to developing performance in relation to product marketing?
Promotion within the framework of the National Strategy is one of the positive examples of supported actions mentioned by the competent authorities, as these actions are mainly comparatively cost-effective, but in the case described had a direct effect on the increase in sales volume. In this regard, however, it should be noted that a positive development for one PO as a result of public relations and visits to trade fairs could potentially be at the expense of competing POs and will not necessarily increase the market share of the POs as a whole. Overall, the expenditure for this intervention area within the National Strategy amounts to around EUR 60 million, in other words 25 % of the approved expenditure, and all except one PO have implemented actions aimed at improving marketing (Table 5.10). The variation in the relative importance of the marketing actions between the POs that have submitted mid-term evaluations is, with between 2 and 66 % of the operational programme in question, very large and on average is around 22 %. The total expenditure for improving marketing, for improving quality and for planning of production is in the same order of magnitude (Table 5.2), the expenditure for marketing actions having risen slightly over time (see also Figure 5.11). Table 5.10: Expenditure on promotion and participation of the POs (2007 to 2011) (total)
Actions aimed at improving marketing Number of POs
total 2007-2011 Expenditure 2007-2011
(euro) Purchase of fixed assets 24 44 437 001 Other form of acquisition of fixed assets 12 4 142 207 Promotion and communication activities 24 4 298 116 Other actions 12 7 201 057 Total 25 60 078 381 Source: own calculations based on the annual reports (Federal Office for Agriculture and Food, various years)

Chapter 5 Answers to the evaluation questions 47
Table 5.11: Total expenditure on actions aimed at improving marketing by PO for 2007 to
2011
PO Number Total for improving marketing (euro) % marketing of total OP DE 0103 8 824 200 27.4 DE 0057 6 880 393 32.4 DE 0061 2 727 160 17.9 DE 0041 7 641 132 37.8 DE 0005 264 587 2.2 DE 0100 1 000 998 9.0 DE 0040 3 351 722 34.0 DE 0094 901 470 9.3 DE 0013 640 200 9.5 DE 0002 783 755 11.3 DE 0053 621 200 20.6 DE 0055 1 099 676 65.9 DE 0010 404 553 15.1 DE 0098 109 700 3.6 DE 0105 348 842 14.6 DE 0083 347 064 14.4 DE 0093 1 604 378 22.8 DE 0095 0 0.0 Total 37 473 430 22.3 PO with > 50 million baseline value of marketed production PO with 10-50 million baseline value of marketed production PO with < 10 million baseline value of marketed production
Source: own calculations based on mid-term evaluation of the POs (competent authorities 2012). Comparison of the proportion of the total expenditure of each OP that was spent on actions aimed at improving marketing with the changes in the value of marketed production during the course of the OP reveals no link (Figure 5.14). Changes in the POs’ areas under production and volume of marketed production over the evaluation period were also very different and do not allow any link to be made with the investment in improving marketing or even with the size of the PO (Figures 8.4 to 8.9 in the Annex). It was expected in this intervention area in particular that a correlation between the expenditure on marketing actions and the change in the value of marketed production would at least be suggested, as these are actions that aim to directly strengthen the PO by having a direct effect on marketing. With regard to the effectiveness of the specific marketing actions in terms of the objectives of volume and value of marketed production, it is therefore not possible to detect any direct empirical link with the size of investment. The POs DE 0040, DE 0041, DE 0057 and DE 0103 had the highest expenditure in the intervention area aimed at improving marketing, for example, and this was all spent on the expansion of structural facilities. The development of the value of marketed production varies very widely, however, with a rise of around 50 % in relation to 2008 for the POs DE 0040 and DE 0103 and only slight rises of 1 % and 3 %, respectively, for DE 0041 and DE 0057. Of the POs that showed a negative change in the value of marketed production, DE 0053 and DE 0083, with 20 % and 14 % of the expenditure for their OP, are in the mid-range in terms of the amount spent on promotion. For DE 0095 and DE 0098, which had very low expenditure on promotion or even none at all, it was possible to see a slight decrease of 5 % in the value of marketed production or even an increase of 10 % compared with 2008 (see also Table 8.7).
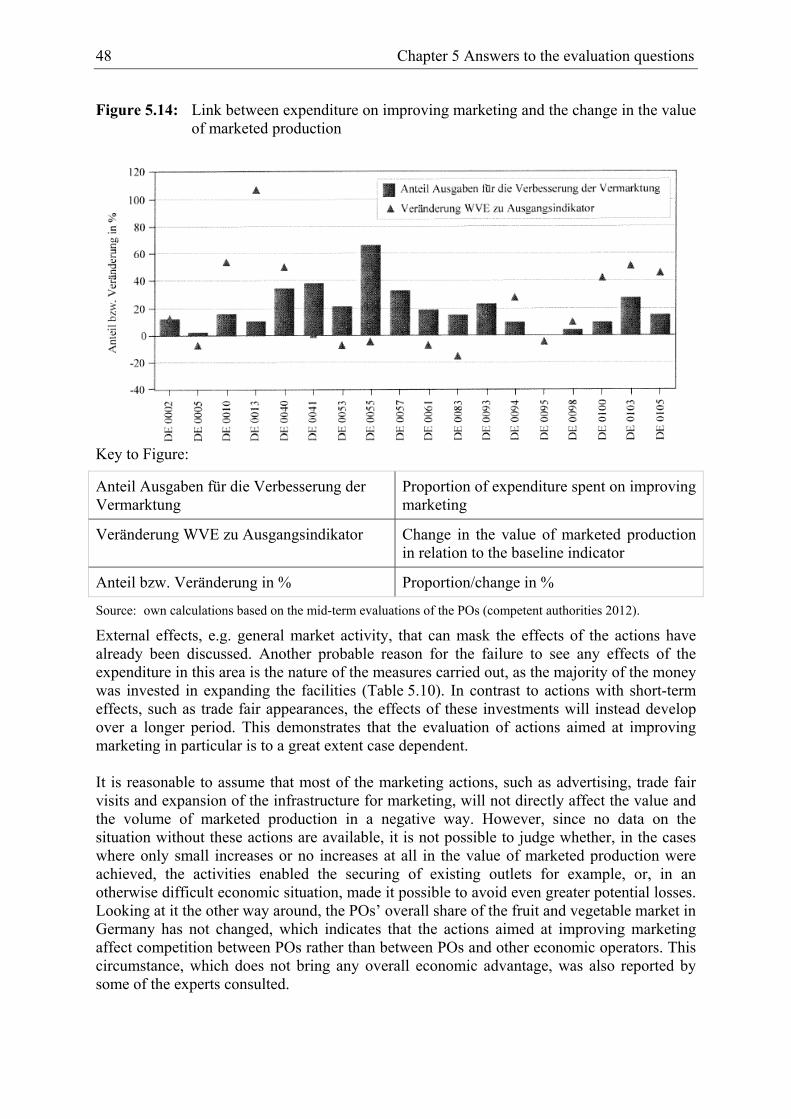
48 Chapter 5 Answers to the evaluation questions
Figure 5.14: Link between expenditure on improving marketing and the change in the value
of marketed production
Key to Figure:
Anteil Ausgaben für die Verbesserung der Vermarktung
Proportion of expenditure spent on improving marketing
Veränderung WVE zu Ausgangsindikator Change in the value of marketed production in relation to the baseline indicator
Anteil bzw. Veränderung in % Proportion/change in %
Source: own calculations based on the mid-term evaluations of the POs (competent authorities 2012).
External effects, e.g. general market activity, that can mask the effects of the actions have already been discussed. Another probable reason for the failure to see any effects of the expenditure in this area is the nature of the measures carried out, as the majority of the money was invested in expanding the facilities (Table 5.10). In contrast to actions with short-term effects, such as trade fair appearances, the effects of these investments will instead develop over a longer period. This demonstrates that the evaluation of actions aimed at improving marketing in particular is to a great extent case dependent. It is reasonable to assume that most of the marketing actions, such as advertising, trade fair visits and expansion of the infrastructure for marketing, will not directly affect the value and the volume of marketed production in a negative way. However, since no data on the situation without these actions are available, it is not possible to judge whether, in the cases where only small increases or no increases at all in the value of marketed production were achieved, the activities enabled the securing of existing outlets for example, or, in an otherwise difficult economic situation, made it possible to avoid even greater potential losses. Looking at it the other way around, the POs’ overall share of the fruit and vegetable market in Germany has not changed, which indicates that the actions aimed at improving marketing affect competition between POs rather than between POs and other economic operators. This circumstance, which does not bring any overall economic advantage, was also reported by some of the experts consulted.
Chapter 5 Answers to the evaluation questions 49
5.1.3.2 To what extent are the actions aimed at improving marketing a) in accordance
with needs; b) coherent with other measures of the National Strategy; c) coherent with measures of the Rural Development programmes having the same objectives?
The nature of the actions carried out with the aim of improving marketing differed greatly between POs. This high degree of heterogeneity is also striking when compared with the measures for planning of production and quality discussed above. Large POs in particular have expanded their structural facilities, making it possible for them to improve logistics. In some cases, although to a rather small extent, actions were taken at member holdings to improve their internal logistics. The introduction or improvement of product management systems was without doubt a necessary action for smaller POs in particular, as these systems are essential for marketing and also for meeting the demands of producers and customers in terms of the management of the PO. Trade fair visits, advertising and other sales promotion measures can not only have a direct effect on sales, they also meet the members’ need for a positive public image of the PO. Support for marketing activities also enables the acquisition of market information, particularly in smaller POs. Advisory activities in respect of marketing and supply chain management at producer level should have a positive effect on the market orientation of the PO. This area was specifically identified in the National Strategy as a problem area for many POs. On account of the diversity of the measures described and the flexibility of the support on offer, particularly for marketing activities, the National Strategy takes considerable account of the needs of the POs in this area. However, the question arises once again as to whether the benefits of the measures justify the disadvantages to other undertakings that package fruit and vegetables and that are in competition with the POs and have no access to the support funds of the National Strategy18. Whether the implementation of actions aimed at improving marketing in POs meets the needs of society is open to question. On account of the broad and year-round supply of very many fruit and vegetable varieties, many of which come from domestic production, there is no shortage of products for consumers. Meeting the needs of society could perhaps be justified indirectly by postulating that consumers demand German products, the provision of which is ensured by strengthening the competitiveness of POs and producers. However, with regard to vegetables in particular, the market share of the POs in terms of German production is only around 25 %. In addition, as discussed above, it can be assumed that shifts in demand towards fruit and vegetables from Germany will send out sufficient incentives via the market to increase production in Germany. On account of this, it can be assumed that there is no specific interest to society in public funds being used to strengthen the marketing position of POs in Germany. With regard to the other actions of the National Strategy, the actions relating to improving marketing represent one of the three most important areas. Although here, too, the majority of the expenditure goes on purchasing fixed assets, though mainly at the level of the PO and only to a limited extent in the member holdings, the actions aimed at communication and at improving logistics and sales management supplement marketing actions and seek to better utilise capacities created through infrastructure investments.
18 Under certain circumstances, it is possible for direct marketers to receive support under the second pillar
of the CAP. However, in contrast to measures under the first pillar, there is no legal entitlement to this support. The subsidy equivalent is usually significantly less than 50 %.

50 Chapter 5 Answers to the evaluation questions
With regard to the support provided via the AFP and the VV, there are funding objectives and measures, particularly in the VV, which are very close to the actions aimed at improving marketing within the framework of the National Strategy. No reason can be seen why the areas of fruit and vegetables should be able to access an additional funding channel or need a higher level of support compared with other agricultural areas. There are also overlaps between the support provided within the framework of the National Strategy and that provided within the AFP. This relates in particular to investments at the level of the member holdings that are aimed at improving economic capacity prior to harvest time, for example in connection with a holding’s own internal transport. These investments account for 2.7 % of the expenditure (see Table 5.5). Such investments were made in five POs, representing 28 % of the POs for which a mid-term evaluation is available. The same objections apply here as have already been mentioned in connection with the actions aimed at planning of production and at maintaining and improving product quality, even if the investments in improving the capacity of the holdings in the intervention area aimed at improving marketing do not have such high priority as investments in the planning of production in particular. 5.1.4 Research, including experimental production The actions in the area of research and experimental production within the framework of the National Strategy include participation in the development of specialised machinery, supporting or carrying out cultivar trials and cultivar demonstrations, process and product innovation, plant protection research in order to fill in gaps in our plant protection needs and, in one case, also the conducting of crop trials. In connection with the actions in this area, expenditure on facilities and non-durable goods and on personnel is eligible for support.
5.1.4.1 To what extent have actions of research and experimental production contributed to developing new products and/or techniques?
A total of 12 of the 27 POs that have provided reports have carried out research and experimental production, with an expenditure volume of EUR 1.4 million (Table 5.12). The expenditure in this area makes up only a very small proportion (0.5 %) of the current total expenditure for the OPs within the framework of the National Strategy, and this also corresponds to the proportion of the expenditure reported in the mid-term evaluations. In detail, around half of this amount was spent on actions in the area of product and process innovation. A further third of the expenditure went on the development of specialised machinery. Table 5.12: PO participation in and expenditure on research and experimental projects
from 2007 to 2011
Actions of research and experimental projects Number of POs
total 2007-2011 Expenditure 2007-2011
(euro)
Purchase of fixed assets 4 237 728 Other forms of acquisition of fixed assets 2 2 346 Other actions 11 1 193 618 Total 12 1 433 692 Source: own calculations based on the annual reports (Federal Office for Agriculture and Food, various years)

Chapter 5 Answers to the evaluation questions 51
Comparing the expenditure of the POs on actions of research and experimental production on the basis of their size, measured by the value of marketed production, it is clear that it is the larger POs in particular that initiate and implement research and experimental projects. None of the POs with a baseline value of marketed production below EUR 10 million have carried out research projects, but around 75 % of the medium-sized and large POs with a baseline value of marketed production of EUR 10 million to EUR 50 million or of more than EUR 50 million have (Table 5.13).
Table 5.13: Expenditure on research and experimental projects by PO (2007 to 2011)
PO Number Total for research (euro) % research of overall OP DE 0103 221 000 0.7 DE 0057 0 0.0 DE 0061 272 047 1.8 DE 0041 75 000 0.4 DE 0005 105 873 0.9 DE 0100 35 000 0.3 DE 0040 113 935 1.2 DE 0094 16 384 0.2 DE 0013 DE 0002 10 000 0.1 DE 0093 67 480 1.0 DE 0053 DE 0055 DE 0010 1 875 0.1 DE 0098 DE 0105 DE 0083 DE 0095 Total 918 595 0.5
PO with > 50 million baseline value of marketed production PO with 10-50 million baseline value of marketed production PO with < 10 million baseline value of marketed production
Source: own calculations based on mid-term evaluation of the POs (competent authorities 2012).
5.1.4.2 To what extent have actions of research and experimental production contributed to developing technical and economic performance and promoting innovation?
Actions of research and experimental production implemented within the framework of the National Strategy include the development of specialist machinery, for example to be used for harvesting cabbage, the disinfection of washing water or the further development of transport systems between field and logistics centre. Moreover, crop trials were carried out for the development of new procedures for cultivar screening, for minimising the use of plant protection products and to investigate their decomposition behaviour, as well as for testing new cultivars. It is in the nature of these experimental, research and development projects that they are initially carried out over a fairly long period and only once they have been concluded successfully do they find wider acceptance in production practice. As a result, the effects cannot be established only a short time after the start of such actions.

52 Chapter 5 Answers to the evaluation questions
5.1.4.3 To what extent are the actions of research and experimental production a) in
accordance with needs; b) coherent with other measures of the National Strategy; c) coherent with measures of the Rural Development programmes having the same objectives?
In the case of actions in the area of research and experimental production, answers to very specific questions are sought. It can therefore be assumed that they have been initiated on the basis of current problems and thus meet the direct needs of the POs. In the event that the results will, at least in the medium term, also be available to the general public, these projects could potentially also meet the needs of producers that do not belong to a PO. In cases where the object of the investigations is aspects of the quality of the products or the environmental effects of production or if they concern the health of consumers, these experiments may also be of interest to society. In other cases, where the experiments are aimed more at improving commercial production, they are instead only of secondary relevance to society. In this intervention area there are no overlaps with the joint task of improvement of the agrarian structures and coastal protection (German designation: GAK) in the support provided. Even though there are other programmes for promoting innovation in the area of agriculture, for example the BMELV Programme for Promoting Innovation (2009), and although these options seem to have similar aims, they nevertheless focus on different target groups and therefore tend to complement each other rather than offer identical subsidies in parallel. It has been shown that the effects of the actions in the area of research and experimental production will in many cases only be seen after a considerable time lag. Therefore, it is not yet possible at this early stage in the evaluation of the National Strategy to make any statements regarding the effects of these actions.
5.1.5 Training actions and actions aimed at promoting access to advisory services
In the intervention area involving actions aimed at promoting access to advisory services, support is provided for training and continued training of the members and personnel of the PO, advice provided at the level of the members and the PO, wage costs for advisory services for members provided by members of the PO and the costs for information services.

Chapter 5 Answers to the evaluation questions 53
5.1.5.1 To what extent have actions related to training and advisory services
contributed to ensuring access to technical training and knowledge for Producer Organisations’ members and/or personnel?
In total, 17 POs have implemented training, advisory and technical training actions, the expenditure for which amounted to EUR 4.2 million (Table 5.14), constituting 1.4 % of the total approved expenditure (see Table 5.2). This also corresponds approximately to the relative importance of the intervention area as reported in the mid-term evaluations, according to which 14 POs have implemented actions. However, the expenditure varies widely between POs. Contrary to expectations, expenditure in this intervention area does not necessarily increase with the size of the PO. Therefore, considerable differences in expenditure per member can also be seen (Table 5.15). Against this background, it is to be expected that access to advisory services and further training for members and personnel of POs differs substantially between POs. Nevertheless, it should be noted that the options provided by the POs in any case help to extend the basic provision in the area of training and advisory services. The POs have no direct influence on the extent to which the additional options provided are taken up, however. Table 5.14: PO participation and total expenditure for actions related to training and
advisory services (2007 to 2011)
Actions related at training and advisory services
Number of POs Total 2007-2011
Expenditure 2007-2011 (euro)
a) Organic production 2 225 017 b) Integrated production or integrated pest management
9 1 533 014
c) Other environmental issues 4 491 005 d) Traceability 2 108 758 e) Product quality, including pesticide residues
9 1 282 109
f) Other issues 11 541 449 Total 17 4 181 351 Source: own calculations based on the annual reports (Federal Office for Agriculture and Food, various years)

54 Chapter 5 Answers to the evaluation questions
Table 5.15: Expenditure for training and advisory services and average spending per
member by PO (2007 to 2011) PO Number Total for training
(euro) % training of overall OP Average per member
(euro) DE 0103 12 617 0.0 22 DE 0057 947 288 4.5 4 883 DE 0061 200 0.0 7 DE 0041 54 300 0.3 127 DE 0005 256 063 2.1 491 DE 0100 7 392 0.1 185 DE 0040 15 386 0.2 385 DE 0094 403 228 4.2 174 DE 0013 DE 0002 62 981 0.9 557 DE 0093 223 080 3.2 1 430 DE 0053 DE 0055 48 000 2.9 407 DE 0010 13 500 0.5 127 DE 0098 DE 0105 42 213 1.8 6 030 DE 0083 DE 0095 55 084 4.6 2 040 Total 2 141 330 1.3 1 183 PO with > 50 million baseline value of marketed production PO with 10-50 million baseline value of marketed production PO with < 10 million baseline value of marketed production Source: own calculations based on mid-term evaluations of the POs (competent authorities 2012). Around two thirds of the expenditure on actions related to advisory services and training was spent on further training or technical training. A further nearly 30 % of the expenditure in this area went to personnel providing advisory services to member holdings on behalf of the PO. In terms of expenditure according to subject area, advisory services and further training in relation to product quality and plant protection are by far the most important. Behind these by a large margin are organic production and traceability (Figure 5.15).

Chapter 5 Answers to the evaluation questions 55
Figure 5.15: Total expenditure on training and advisory services according to subject area
Key to Figure:
Sonstige Fragen Other issues Produktqualität, einschließlich Pestizidrückstände
Product quality, including pesticide residues
Rückverfolgbarkeit Traceability Andere Umweltfragen Other environmental issues Integrierter Landbau bzw. integrierte Schädlingsbekämpfung
Integrated production or integrated pest management
Ökologischer Landbau Organic production Summe der Ausgaben in 1.000 Euro Total expenditure in EUR 1 000 Source: own calculations based on the annual reports (Federal Office for Agriculture and Food, various years)
5.1.5.2 To what extent have actions related to training and advisory services contributed to promoting knowledge and improving human potential to the benefit of Producer Organisations’ members and/or personnel?
It can be assumed that the actions in the area of training and advisory services have contributed to broadening the knowledge of those participating in these actions. The extent to which this new knowledge will result in adjustments in the sub-areas of management, production and marketing at the level of the holdings and the PO cannot be assessed here. It is likely that new knowledge gained from advisory services and further training will be put to use by PO personnel in particular, as the options for actions are put together at this level and therefore are presumably aimed at rectifying specific deficiencies in the PO.
56 Chapter 5 Answers to the evaluation questions
5.1.5.3 To what extent have the actions related to training and advisory services been
efficient with respect to achieving their objectives?
Since the data in this area are relatively abstract and there tends to be time lag before the effects are seen, it is not possible at the present time to make any statements concerning the efficiency of the actions related to training and advisory services.
5.1.5.4 To what extent are the actions related to training and advisory services a) in accordance with needs; b) coherent with other measures of the National Strategy; c) coherent with measures of the Rural Development programmes having the same objectives?
Actions related to training, further training and advisory services are offered by the majority of POs. In addition, they relate to the most important and relevant subject areas (Table 5.14). Since the POs are not obliged to offer actions in this area, nor are the subject areas prescribed, it can be assumed that the training and advisory service actions meet the needs of the POs and their members. As producers of fruit and vegetables that do not belong to a PO have no access to these actions, economically relevant content could put these producers at a competitive disadvantage. Actions related to the areas of consumer health, product quality and the environment are also of relevance to society. However, it is to be assumed that knowledge deficits in these areas would be reduced even without the support of actions for training and further training on account of legal requirements and market signals. Due to the freedom to choose how to structure the training and advisory service actions, they can reasonably be incorporated into other actions implemented within the framework of an OP. Just as with the actions related to research, experimentation and development, it is to be assumed that the options offered in relation to training and advisory service actions within the framework of the National Strategy would reasonable supplement those that are eligible for support via the GAK.
5.1.6 Crisis prevention and management instruments
In the National Strategy, actions related to promotion and actions in the area of training and further training that are aimed specifically at crisis prevention and crisis management can be supported if they serve in particular to prevent a crisis or to avert an acute crisis. In addition, harvest insurance that covers weather-related losses of products at the level of the PO and its members can be supported.

Chapter 5 Answers to the evaluation questions 57
5.1.6.1 To what extent have the set of crisis prevention and management instruments
selected under the National Strategy contributed to crisis prevention and management?
Of the total expenditure within the framework of the National Strategy, barely 5 % has been spent on the area of crisis prevention and crisis management instruments. However, it should be noted that of the six possible crisis measures under EU law, only three have been included in the National Strategy. Thus, the expenditure to date in this intervention area amounts to EUR 11.5 million (Table 5.16). Almost the entire amount was spent on harvest insurance. The actions aimed at crisis prevention and crisis management were implemented by over half of all POs. The proportion of the expenditure that was spent on actions in this area, based on the total expenditure for the relevant OP, varies among the POs that have submitted mid-term evaluations from 1.9 % to 14.6 %, but no differences in take-up based on size of the PO can be seen (Table 5.17). In addition to harvest insurance, other actions aimed at crisis prevention and crisis management in this area are eligible for support, but have not been taken up by the POs. Only four POs are implementing an action in this regard, for which only 0.3 % of the expenditure allocated to this intervention area has been used. Table 5.16: PO participation in and total expenditure on actions aimed at crisis prevention
(2007 to 2011)
Actions aimed at crisis prevention Number of POs
Total 2007-2011 Expenditure 2007-2011
(euro) a) Market withdrawals n.o.* - b) Green harvesting or non-harvesting n.o.* - c) Promotion and communication 4 102 410 d) Training 0 0 e) Harvest insurance 18 11 442 140 f) Support for the administrative costs of setting up mutual funds
n.o.*
-
Total 18 11 544 550 n.o.*: not offered within the framework of the National Strategy, but possible under EU law. Source: own calculations based on the mid-term evaluations of the POs (competent authorities 2012).

58 Chapter 5 Answers to the evaluation questions
Table 5.17: Expenditure on crisis prevention by PO (2007 to 2011)
PO Number Total for crisis prevention
(euro) % crisis prevention of overall OP
DE 0103 2 840 799 8.8 DE 0057 589 152 2.8 DE 0061 DE 0041 2 202 323 10.9 DE 0005 223 784 1.9 DE 0100 495 387 4.5 DE 0040 DE 0094 357 626 3.7 DE 0013 DE 0002 521 418 7.5 DE 0093 656 414 9.3 DE 0053 DE 0055 DE 0010 DE 0098 DE 0105 DE 0083 351 827 14.6 DE 0095 36 124 3.0 Total 8 274 852 PO with > 50 million baseline value of marketed production PO with 10-50 million baseline value of marketed production PO with < 10 million baseline value of marketed production
Source: own calculations based on the mid-term evaluations of the POs (competent authorities 2012). 5.1.6.2 Have specific crisis prevention and management instruments or combinations
of them proved to be the most effective for crisis prevention and management to the benefit of Producer Organisations’ members?
The only significant action in this area is harvest insurance. This serves only to mitigate any financial losses as a result of a loss of harvest due to the weather. Thus, within the framework of the National Strategy, measures are implemented only within the area of crisis management. According to the CMO, other measures would be possible in this area, for example compensation for producers in the event of market withdrawals or green harvesting or non-harvesting of fruit and vegetables. In Germany, these measures are excluded from the support. Although such measures could provide short-term relief in the event of the lowest prices, at the same time, they reduce the incentives for producers to orient their production strategically on the market.

Chapter 5 Answers to the evaluation questions 59
In 2011, producers of vegetables had to suffer the consequences of the EHEC crisis19. The sale of vegetables as a whole, but in particular cucumbers, tomatoes, lettuces and sprouts fell dramatically, so that producers were not able to market their produce and instead had to destroy it. Use of compensation actions, as is possible via the CMO by means of the operational programmes, would have constituted a considerable distortion of competition to the benefit of those vegetable producers who are members of the POs, as other producers would not have been able to benefit from compensation. Therefore, on the basis of the CMO (Article 191), the European Commission adopted a time-limited regulation that enabled all vegetable producers to claim compensation (OJ 2011). This example underlines the fact that the regulations relating to the CMO operational programmes is not the right place for the provision of subsidies for crisis prevention and crisis management in the event of exceptional crises. Accompanying measures, such as actions related to promotion and communication, are eligible for support, however. These were not utilised in the context of the EHEC crisis, however, as no expenditure was allocated to this area even in 2011. It is therefore questionable whether the actions for crisis management and crisis prevention offered in the National Strategy are appropriate.
5.1.6.3 To what extent are eligible crisis prevention and management instruments in accordance with needs?
The high demand for harvest insurance, which 18 POs offer to their members, shows that, in this area, there is essentially a strong need for cover against damage caused by the weather. With the support granted, members of POs can obtain harvest insurance considerably cheaper than other producers can. On account of the costs involved, producers that are not members of a PO take out harvest insurance less often than in the opposite case. Thus, for non-members, either the financial risks or the production costs are higher, which leads to distortions of competition. From the point of view of society, support for harvest insurance is less relevant, as even in the event of crop failures caused by the weather, any shortage in the supply of fruit and vegetables is less likely to be noticeable on account of Germany’s integration in international trade. By contrast, the actions eligible for support in this area over and above this seem to be of little interest to the POs, as only four POs utilised anything beyond the harvest insurance, for which they used a total of 0.3 % of the funds spent in this area.
19 EHEC is an abbreviation of enterohaemorrhagic Escherichia coli, a disease-causing strain of the Escherichia coli bacteria. The outbreak, which was due to contamination of bean sprouts, resulted in 53 deaths. As the source of the pathogen could not be definitively pinpointed for several weeks, various vegetable products were suspected of being the cause of the transmission. As a result of this uncertainty, demand for cucumbers, tomatoes, lettuces and sprouts in particular, but also other vegetable products, plummeted. On the other hand, demand for fruit increased.

60 Chapter 5 Answers to the evaluation questions
5.1.7 Environmental actions
The actions in the area of environmental actions relate to several subject areas. These include actions aimed at 1) avoiding residues and other undesirable substances in order to protect human health; 2) sustainable use and protection of natural resources; 3) climate protection; and 4) reducing the volume of waste. This includes actions related to advice, support and training in the context of certified cultivation systems such as organic or integrated production, the use of energy-saving technologies such as energy screens, environmentally friendly heating installations, special eco-friendly machinery, the avoidance or sparing of plant protection products by using alternative methods, and the avoidance of waste through the use of reusable packaging or the promotion of recycling of packaging and inputs.
5.1.7.1 To what extent have environment actions contributed to providing environmental services?
The implementation of environmental actions is a mandatory prerequisite for support for an OP within the framework of the National Strategy. Therefore, all POs implement environmental actions. Around 80 % of expenditure from a total of EUR 34.7 million for environmental actions is allocated to environmentally sound packaging management (German designation: UVVM)20. This includes the actions aimed at reducing the quantity of packing used or reducing the packaging waste accumulating further along the marketing chain by using reusable systems, and those aimed at improving packaging waste management by recycling disposal packaging and the use of environmentally friendly packaging materials. Actions for reducing production waste in the narrow sense, e.g. films, are of comparatively minor importance. Other important actions in the area of environmental measures are the purchase of fixed assets, e.g. facilities for water recycling, weather stations, special eco-friendly devices or even energy screens (9 %) and actions related to advice in the area of integrated production (4 %). Other forms of acquisition of fixed assets are not significant in terms of environmental actions (Table 5.18). The conditions for receiving support state that either at least two actions must come from this area or at least 10 % of the expenditure for an OP must be spent on this area. Taking the average of all POs, at just under 14 %, the proportion of the total expenditure that is spent on environmental measures exceeds this minimum requirement, as the analyses in the mid-term evaluations show. However, eight of the 18 POs fall significantly below this limit in some cases. These POs have implemented two or more different environmental actions. For one PO, no details are given on the implementation of environmental actions in the mid-term evaluations. Several POs achieve a proportion of 20 %, and in one case significantly more than 40 %, of the total expenditure for their OP (Table 5.19).
20 The expenditure on dual systems and so-called environmentally friendly packaging is subsumed under the heading of marketing. Therefore, the expenditure in this area should be assigned to the UVVM.

Chapter 5 Answers to the evaluation questions 61
Table 5.18: PO participation in environmental actions and total expenditure (2007 to 2011)
Environmental actions Number of POs
Total 2007-2011 Expenditure 2007-2011
(euro) a) Purchase of fixed assets 21 3 319 295 b) Other forms of acquisition of fixed assets 2 13 330 c) Other actions
1) Production i) Organic production 4 105 267 1) Production ii) Integrated production 7 1.429 570 1) Production iii) Improved use and/or
management of water, including water saving and draining
0 0
1) Production iv) Actions to conserve soil (e.g. labour techniques to prevent/reduce soil erosion, green cover, conservation agriculture)
3 414 058
1) Production v) Actions to create or maintain habitats favourable for biodiversity (e.g. wetlands) or to maintain the landscape, including the conservation of historical features (e.g. stonewalls, terraces, small wood)
1 890
1) Production vi) Actions favouring energy saving
2 16 471
1) Production vii) Actions related to reduction of waste production and to improvement of waste management
17 16 391 730
1) Production viii) Other actions 9 1 425 089 2) Transport 1 262 619 3) Marketing 16 11 341 065
Total 27 34 719 384 Source: own calculations based on the annual reports (Federal Office for Agriculture and Food, various years).

62 Chapter 5 Answers to the evaluation questions
Table 5.19: Expenditure on environmental measures by PO (2007 to 2011)
PO Number Total for environmental
measures (euro)
% environmental measures of overall OP
DE 0103 6 062 246 18.8 DE 0057 4 391 031 20.7 DE 0061 3 322 450 21.8 DE 0041 1 408 793 7.0 DE 0005 150 109 1.2 DE 0100 213 963 1.9 DE 0040 2 061 394 20.9 DE 0094 1 038 481 10.7 DE 0013 1 595 850 23.7 DE 0002 519 803 7.5 DE 0093 211 095 3.0 DE 00531) DE 0055 311 017 18.6 DE 0010 1 163 203 43.4 DE 0098 371 253 12.2 DE 0105 229 820 9.6 DE 0083 141 369 5.9 DE 0095 111 019 9.3 Total 23 302 895 13.8 PO with > 50 million baseline value of marketed production PO with 10-50 million baseline value of marketed production PO with < 10 million baseline value of marketed production
1) According to the annual reports, PO DE 0053 has implemented actions in this area, but these are not identified specifically in the mid-term evaluation of its operational programme submitted by the PO. Source: own calculations based on the mid-term evaluations of the POs (competent authorities 2012).
5.1.7.2 To what extent have environmental actions in the area of production contributed to the protection and preservation of the environment?
Specific statements concerning the effect of the various actions on the environmental compartments of soil, water and air cannot be made. The level of uptake of the corresponding actions is very low. Expenditure on these actions amounts to 1.7 %, if the actions for energy saving are included. A somewhat higher, although still insignificant, level of 4 % of the expenditure for environmental actions was spent on support for integrated and organic production (see Table 5.18). However, no specific effects on the environmental compartments or on the status of habitats and biodiversity can be derived from this, as, on the one hand, the effects of these actions are very complex and, on the other, detailed information on these actions cannot be derived from the documents available.

Chapter 5 Answers to the evaluation questions 63
There are no quantitative data on the environmental impact of the investment in special eco-friendly devices, weather stations and water recycling facilities or of the actions aimed at conservation agriculture and energy saving. Moreover, an environmental action was implemented by one PO in the area of transport with a level of expenditure of 0.7 % for the intervention area. However, no specific details are available concerning the nature of the action or the possible environmental impact.
5.1.7.3 To what extent have environmental actions in the area of product preparation for sale and marketing or processing contributed to reducing waste production?
Environmentally sound packaging management (UVVM) accounts for by far the highest expenditure for environmental actions within the framework of the National Strategy. At EUR 27.8 million, more than 11 % of the total expenditure for the OPs of the POs is allocated to these actions. However, these actions will be excluded from the support for future operational programmes in view of the uncertainty about their environmental benefits and the large amount of work required to control these actions (OJ 2012). We will therefore refrain from assessing these actions any further here.
5.1.7.4 To what extent have the environmental actions been efficient with respect to achieving their objectives?
On account of insufficient baseline data for the impact indicators in the area of the environment and the low level of implementation of the environmental actions beyond the UVVM, no statements concerning the efficiency of these actions are possible.
5.1.7.5 To what extent are eligible environmental actions a) in accordance with needs; b) coherent with other measures of the National Strategy; c) coherent with measures of the Rural Development programmes having the same objectives?
No link with other areas of action under the National Strategy can be seen for the environmental actions. The same applies with regard to the AFP and the VV. On account of the complexity of the effects and the frequent lack of information on the exact form that the other environmental actions take, no statements on their coherence with other actions of the National Strategy and of the GAK can be made.

64 Chapter 5 Answers to the evaluation questions
5.1.8 Other actions
Under the heading of ‘other actions’ come actions related to management of members and to the creation of incentives for membership of a PO within the framework of information and advertising. In addition, the costs involved in marketing cooperation and in preparations for mergers with other POs and the acquisition of companies are assigned to this area.
5.1.8.1 To what extent have other actions contributed to improving the performance of the Producer Organisations and/or of their member agricultural holdings through a better use of production factors?
Table 5.20 shows that, with one exception, all POs implement other actions. Around 38 % of the expenditure for these actions relates to the purchase of fixed assets, with the remainder spent on other actions within this area. However, the latter expenditure amounted to more than 90 % for one PO, which received support through these actions for the takeover of a processing plant. Table 5.20: PO participation in other actions and total expenditure (2007 to 2011)
Other actions
Number of POs total 2007-2011
Expenditure 2007-2011 (euro)
Purchase of fixed assets 6 2 178 657 Other forms of acquisition of fixed assets 0 0 Other actions 26 3 720 126 Total 26 5 898 783 Source: own calculations based on the annual reports of the POs (Federal Office for Agriculture and Food, various years) According to the mid-term evaluations, a third of POs that have already presented these evaluations have implemented other actions. On average, 3 % of the entire expenditure for their OPs was spent on these actions (Table 5.21). The difference between this data and the details in the annual reports, according to which all POs have allocated expenditure to the area of other actions, is explained by the fact that, in the meantime, the European Commission has requested that the overall administrative costs be subsumed under ‘other actions – other’. In addition, other actions can sometimes be allocated to other target areas in the mid-term evaluations. In addition to overtaking a processing plant, the POs that have so far submitted a mid-term evaluation have purchased vehicles for just over EUR 1 million, representing around 20 % of the funds paid out by these POs in the context of other actions. Personnel costs for the sustainable use and protection of natural resources (5 %) were also supported within this area. From the information available, no statements can be made concerning changes in the efficiency of the use of production factors.

Chapter 5 Answers to the evaluation questions 65
Table 5.21: Expenditure on other actions by PO (2007 to 2011)
PO Number Total for other actions
(euro) % other actions of overall OP
DE 0103 0 0.0 DE 0057 0 0.0 DE 0061 0 0.0 DE 0041 3 623 331 17.9 DE 0005 249 284 2.1 DE 0100 0 0.0 DE 0040 0 0.0 DE 0094 0 0.0 DE 0013 34 886 0.5 DE 0002 496 643 7.1 DE 0093 0 0.0 DE 0053 435 500 14.4 DE 0055 0 0.0 DE 0010 0 0.0 DE 0098 259 202 8.5 DE 0105 0 0.0 DE 0083 0 0.0 DE 0095 0 0.0 Total 5 098 846 3.0 PO with > 50 million baseline value of marketed production PO with 10-50 million baseline value of marketed production PO with < 10 million baseline value of marketed production
Source: own calculations based on the mid-term evaluations of the POs (competent authorities 2012).
5.1.8.2 To what extent have other actions contributed to developing logistic, product preparation and sale potentials of recognised Producer Organisations?
The action that dominates the area of other actions is the takeover of a processing plant by one of the POs. This takeover took place in 2009. Following this, further restructuring measures were necessary in order to be able to adjust the product palate. Therefore, it is still much too early to be able to evaluate this action. The takeover is intended to increase the sales potential of the PO’s products that it would otherwise only have been possible to sell at a very low product price. If the expectations of the PO with regard to this investment are realised, the real net output ratio will increase considerably as a result of the vertical integration of a company. The resulting added value would benefit the member producers directly as a result of higher product prices and indirectly through PO dividends. The other important action in this area, the purchase of vehicles, should always have a positive impact on logistics, as otherwise the vehicle would be an erroneous purchase. The scale of the impact on logistics cannot be specified, as no details of the types of vehicles are available.

66 Chapter 5 Answers to the evaluation questions
5.1.8.3 To what extent have other actions contributed to strengthening the operational
capability of recognised Producer Organisations?
See Chapter 5.2.5.2.
5.1.8.4 To what extent are other actions a) in accordance with needs; b) coherent with other measures of the National Strategy; c) coherent with measures of the Rural Development programmes having the same objectives?
The area of ‘other actions’ is very non-specific, as is to be expected from an area for all actions that cannot be assigned to another area. Therefore, it cannot be expected that there should be a clearly identifiable picture of the implementation of actions in such an area. This means that it is not possible to make any clear statements concerning the effects of the actions. The expenditure for this area is substantially influenced by one action by one PO. This one individual case does not allow fundamental statements to be made for all POs, however.
5.2 Common evaluation questions relating to the whole National Strategy
Consideration of the specific objectives The support provided within the framework of the National Strategy has three general and seven specific objectives (see Chapter 3.1). The overall objectives are 1) to boost supply; 2) to improve the competitive position; and 3) to assume responsibility for consumers and society at large. The impact of the National Strategy with regard to these overall objectives is discussed from Chapter 5.2.7 onwards. Immediately after this, the specific objectives are considered. These objectives are as follows: 1) to promote the concentration of supply; 2) to improve market orientation; 3) to increase and maintain quality; 4) to improve management of members and incentives to join; 5) to improve efficiency; 6) to develop competences and increase innovation; and 7) the eco-friendly production and marketing of safer products. For the POs as a whole, data are only available in the annual reports (see Chapter 4.2). However, as the data in the annual reports are stated according to intervention area and not according to support objectives, the comments regarding the various support objectives are limited to the data provided by the 18 POs that have already submitted a mid-term evaluation. Table 8.9 (in the Annex) shows the total expenditure of the POs that have submitted a mid-term evaluation, broken down by specific objectives. The expenditure on the different actions allocated to the relevant specific objectives is also noted. It can be seen that almost half of the expenditure is used for the specific objective of improving market orientation. A quarter of the expenditure is spent in the area of maintaining and improving quality. A further 14 % of the expenditure was used to achieve environmental objectives. The remaining specific objectives, such as improving the management of members and incentives to join (5.5 %), promotion of the concentration of supply (2.9 %), developing competences and increasing innovation (1.8 %) and improving efficiency (0.6 %), are relatively insignificant.

Chapter 5 Answers to the evaluation questions 67
The change in importance of the various specific objectives within the framework of the OP, measured by the expenditure on the corresponding actions, is shown in Table 5.22. It is clear that improving market orientation has become more important over time. In particular, investments in greenhouses and in managing production and product range make-up are significant and have increased dramatically in importance. Other specific objectives have become less relevant. This relates in particular to environmental measures, which were given particular importance by the political-administrative side during the programming for the GMO and the National Strategy, as reflected in the conditions for support (see Chapter 3.1). In this regard, the importance of waste reduction in particular has diminished. Table 5.22: Proportion of the expenditure spent on specific objectives under the National
Strategy by year (2007 to 2011)
2007-2011 2007 2008 2009 2010 2011 Specific objective
according to the National Strategy
Measure with which the objective is to be achieved % share of total costs
Evaluation of the change in importance 2007-2011
1.1 Total cooperation building
3.45 5.81 3.53 7.04 0.61 0.27 o Objective 1: promoting the concentration of supply
Objective 1: Total 3.45 5.81 3.53 7.04 0.61 0.27 o
Objective 2: improving market orientation
2.1 Total optimising preparation of the products
9.99 11.34 6.38 6.73 15.57 9.94 o
2.2. Total product range make-up, management of production
9.90 3.02 7.61 11.39 12.33 15.15 ++
2.3 Total sales promotion, marketing promotion
3.66 2.21 3.27 3.76 3.90 5.16 +
2.4 Total information and product management systems
1.30 3.26 1.37 0.35 0.82 0.69 -
2.5 Total logistics optimisation
19.12 21.62 24.78 19.09 14.08 16.06 o
2.6 Total erection of greenhouses
3.48 0.00 0.00 4.75 7.64 5.01 ++
Objective 2: Total 47.45 41.44 43.42 46.08 54.33 51.99 + 3.1 Total quality management
10.88 14.58 14.37 10.02 8.24 7.18 -
3.2 Total certifications 1.47 0.82 1.00 1.36 2.08 2.09 o 3.3 Total improving product quality
14.60 15.29 15.59 12.04 13.29 16.78 o
Objective 3: increasing and maintaining quality
Objective 3: Total 26.95 30.69 30.95 23.43 23.62 26.05 o 4.1 Total sustainability 0.42 0.00 0.00 0.27 0.92 0.91 + 4.2 Total crisis prevention 3.30 0.00 0.00 5.70 4.96 5.86 +
Objective 4: improving the management of members and incentives for joining
Objective 4: Total 3.72 0.00 0.00 5.97 5.88 6.78 +
5.1 Total rationalisation 0.77 0.90 1.14 0.72 0.49 0.61 o Objective 5: improving efficiency
Objective 5: Total 0.77 0.90 1.14 0.72 0.49 0.61 o
6.1 Total research, experimentation projects
0.37 0.00 0.00 0.46 0.65 0.74 +
6.2 Total advisory services, training
1.78 2.87 2.69 1.82 0.81 0.73 -
Objective 6: developing competences/ increasing innovation Objective 6: Total 2.15 2.87 2.69 2.28 1.46 1.48 -
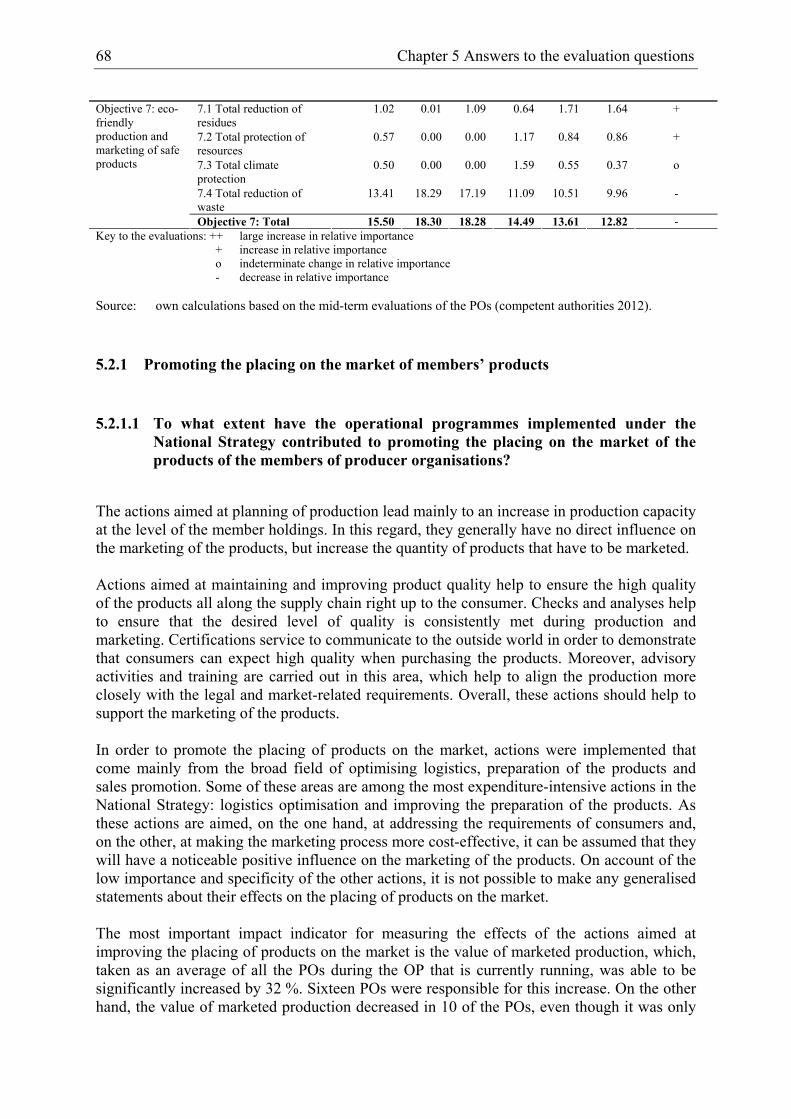
68 Chapter 5 Answers to the evaluation questions
7.1 Total reduction of residues
1.02 0.01 1.09 0.64 1.71 1.64 +
7.2 Total protection of resources
0.57 0.00 0.00 1.17 0.84 0.86 +
7.3 Total climate protection
0.50 0.00 0.00 1.59 0.55 0.37 o
7.4 Total reduction of waste
13.41 18.29 17.19 11.09 10.51 9.96 -
Objective 7: eco-friendly production and marketing of safe products
Objective 7: Total 15.50 18.30 18.28 14.49 13.61 12.82 - Key to the evaluations: ++ large increase in relative importance
+ increase in relative importance o indeterminate change in relative importance - decrease in relative importance
Source: own calculations based on the mid-term evaluations of the POs (competent authorities 2012).
5.2.1 Promoting the placing on the market of members’ products
5.2.1.1 To what extent have the operational programmes implemented under the National Strategy contributed to promoting the placing on the market of the products of the members of producer organisations?
The actions aimed at planning of production lead mainly to an increase in production capacity at the level of the member holdings. In this regard, they generally have no direct influence on the marketing of the products, but increase the quantity of products that have to be marketed. Actions aimed at maintaining and improving product quality help to ensure the high quality of the products all along the supply chain right up to the consumer. Checks and analyses help to ensure that the desired level of quality is consistently met during production and marketing. Certifications service to communicate to the outside world in order to demonstrate that consumers can expect high quality when purchasing the products. Moreover, advisory activities and training are carried out in this area, which help to align the production more closely with the legal and market-related requirements. Overall, these actions should help to support the marketing of the products. In order to promote the placing of products on the market, actions were implemented that come mainly from the broad field of optimising logistics, preparation of the products and sales promotion. Some of these areas are among the most expenditure-intensive actions in the National Strategy: logistics optimisation and improving the preparation of the products. As these actions are aimed, on the one hand, at addressing the requirements of consumers and, on the other, at making the marketing process more cost-effective, it can be assumed that they will have a noticeable positive influence on the marketing of the products. On account of the low importance and specificity of the other actions, it is not possible to make any generalised statements about their effects on the placing of products on the market. The most important impact indicator for measuring the effects of the actions aimed at improving the placing of products on the market is the value of marketed production, which, taken as an average of all the POs during the OP that is currently running, was able to be significantly increased by 32 %. Sixteen POs were responsible for this increase. On the other hand, the value of marketed production decreased in 10 of the POs, even though it was only

Chapter 5 Answers to the evaluation questions 69
by an average of 1.5 %. Another suitable indicator for gauging the success of the marketing activities is the volume of marketed production, which increased by an average of a good 12 %, although seven POs reported a negative change (see Table 5.1). The effects of individual actions on the placing of products on the market cannot be quantified, however, as the influences on the value of marketed production and the volume of marketed production are complex. The same applies to the other areas of action, as these, too, are affected by other internal and external factors (see Chapter 4.3). It is to be assumed, however, that there is a connection between the increased value of marketed production and the actions aimed at improving marketing, as the prices of the products that are important for the POs have largely remained constant during the period under consideration, with only some of them increasing slightly.
5.2.1.2 To what extent have the operational programmes implemented under the National Strategy been efficient with respect to the objective of promoting the placing on the market of the products of the members of producer organisations?
An essential prerequisite for measuring the efficiency of a support measure is that the role of individual supported actions can be quantified on the basis of the defined objectives of a support measure. As this is not possible, as explained in Chapter 4.3, due to the complex interplay between internal and external influences on the various impact indicators, no substantiated claims can be made concerning the efficiency of the actions supported under the National Strategy. Therefore, no analysis of the efficiency of the actions under the National Strategy has been carried out.
5.2.2 Ensuring that production is adjusted to demand, in terms of quality and quantity
5.2.2.1 To what extent have the operational programmes implemented under the National Strategy contributed to ensuring that the production of the recognised producer organisations is adjusted to demand, in terms of quality and quantity?
Of the areas planning of production, marketing, quality and other actions, it is mainly the intervention area involving actions aimed at maintaining and improving quality that has an effect on product quality, as a wide range of actions are supported in this area that result in an adjustment of quality to the requirements of consumers (see Chapter 5.2.1.1). In addition, actions aimed at optimising the preparation of the products can also have a positive effect on quality, for example if investments in sorting and packaging facilities result in the fruit and vegetable products being handled more carefully. An example of this might be a fully automatic, completely water-based sorting facility for apples, which minimises the damage to the products compared with conventional installations. This helps in retaining a high level of external product quality.

70 Chapter 5 Answers to the evaluation questions
The actions aimed at planning of production in particular, which in many cases result in an expansion of the production capacity of the member holdings, facilitate adjustment to the demand for fruit and vegetables produced in Germany, which in many areas is high. It should be pointed out, however, that strong indications of increasing demand for certain products usually lead, even without support, to an adjustment of production capacity at producer level. In addition, assistance in this context leads to a severe distortion of competition between producers that are members of a PO and those that are not. Against this background it is highly questionable whether adjustment of production capacity should be eligible for support under the National Strategy and the CMO.
5.2.2.2 To what extent have the operational programmes implemented under the National Strategy been efficient with respect to the objective of ensuring that the production of the recognised producer organisations is adjusted to demand, in terms of quality and quantity?
See Chapter 5.2.1.2.
5.2.3 Boosting products’ commercial value
5.2.3.1 To what extent have the operational programmes implemented under the National Strategy contributed to boosting the commercial value of the products of the recognised producer organisations?
As already stated in Chapter 5.2.1.1, actions aimed at planning of production usually result in an increase in the production capacity of the producer holdings. However, this will not lead to an increase in the commercial value of the products produced if technologies for improving product quality are not implemented at the same time. The same can be said of marketing actions. In contrast, it is the aim of many actions to increase the commercial value of the products either directly, for example by means of actions related to organic production or the certification of regional products, or indirectly, for example via advice and training. Whether this objective is achieved depends essentially on the conditions of supply and demand on the market. Only if quality improvements match the requirements of consumers is there a chance of increasing the commercial value of the products. However, even then it will not necessarily be the case, as it is possible that competitors will achieve similar improvements in product quality, with the products then remaining interchangeable. The reports from the POs receiving support show that, over the period under evaluation, the average commercial value of the products has increased by around 15 % (Table 5.1), whereas the overall price level for fruit and vegetables has remained constant. However, from the available data it is not possible to determine what the reasons for this increase are, as no time-series data for prices by PO and individual product are available.

Chapter 5 Answers to the evaluation questions 71
It is likely that increases in the commercial value of products beyond the general market trends are largely a result of changes to the product range, as most fruit and vegetable products are standardised to a large degree. The incorporation of a greater number of high-priced products into the range offered by a PO will therefore provide the opportunity to increase the profitability of the fruit and vegetables production. Such a strategy also carries risks, however, as production costs could increase, for example, or the maximum storage time could be shorter than for the product range normally offered previously. With regard to the integration of new products into the product range the question also arises as to whether support for this makes sense. As argued in the criticism of the assistance for extending production capacity, where adjustment of the product range is concerned the market signals should provide sufficient incentive, and not providing support for this would avoid distortions of competition between members of POs and non-members.
5.2.3.2 To what extent have the operational programmes implemented under the National Strategy been efficient with respect to the objective of boosting the commercial value of the products of the recognised producer organisations?
See Chapter 5.2.1.2.
5.2.4 Optimising production costs
5.2.4.1 To what extent have the operational programmes implemented under the National Strategy contributed to optimisation of production costs of recognised producer organisations and/or their members?
A reduction in production costs is usually the result either of the targeted implementation of streamlining investments or of modernisation and capacity expansion and the resulting acceptance of technological progress. In the context of the actions implemented under the National Strategy, streamlining and modernisation investments and investments in capacity expansion are carried out at the level of the producer holdings and the PO. Examples of such investments at the level of the member holdings are the construction of new greenhouses or optimisation of internal transport systems, and at the level of the PO there is the modernisation of sorting and preparation facilities or improvement of logistics. The size of the economies of scale resulting from the actions implemented is not quantifiable on the basis of the data available and does not allow generalisations to made either, as it is usually the case that solutions specific to a particular holding need to be found, which have specific effects.

72 Chapter 5 Answers to the evaluation questions
5.2.4.2 To what extent have the operational programmes implemented under the
National Strategy been efficient with respect to the objective of optimisation of production costs of recognised producer organisations and/or their members?
See Chapter 5.2.1.2.
5.2.5 Promoting concentration of supply
5.2.5.1 To what extent have the operational programmes implemented under the National Strategy contributed to promoting concentration of supply?
A concentration exists if the proportion by volume of German production placed on the market via POs increases in relation to the volume of fruit and vegetables produced in Germany as a whole. According to data from the Federal Statistical Office (2012a), the annual volume harvested from 2007 to 2011 increased from 3 332 000 tonnes to 3 532 000 tonnes in the case of vegetables, whereas for fruit it decreased from 1 254 000 tonnes to 1 069 000 tonnes (Federal Statistical Office 2012b). Overall, the volume of fruit and vegetables harvested during the period under consideration remained almost constant at 4.6 million tonnes, although subject to annual fluctuations. According to data from the AMI (various years), the POs’ share of the total quantity of fruit and vegetables produced in Germany is 32.1 % (2008) to 36.6 % (2010) or 34.9 % (2011). That means that the POs’ share of the overall market in German fruit and vegetable products fluctuates around 34 %. In the relatively short period to which this evaluation relates, annual fluctuations can have greater importance than long-term trends. In order to be able to compare the statistical data with the information from the POs, the same years also need to be considered. In their annual reports, the POs stated as their baseline value the average volume of marketed production in the years 2005 to 2007, which, when compared with 2011, reveals an increase of 12.5 %. According to the Federal Statistical Office, overall production in Germany changed by 6.6 % from 2005-2007 to 2011, and the production of producer groups21 changed by 7.9 % according to the AMI. The growth observed in the annual reports resembles the general development of the volume produced or is slightly above the values produced by other statistics. However, due to the very short period considered, it is not possible to determine whether this should be attributed to random annual fluctuations or whether it indicates an increasing concentration of supply on the part of the supported POs.
21 The data from the AMI include some large POs that are not included in the annual reports as they are not relevant to this evaluation. However, they also include reports from some associations that are not recognised POs.

Chapter 5 Answers to the evaluation questions 73
5.2.5.2 To what extent have the operational programmes implemented under the
National Strategy been efficient with respect to the objective of promoting concentration of supply?
See Chapter 5.2.1.2.
5.2.6 Stabilising producer prices
5.2.6.1 To what extent have the operational programmes implemented under the National Strategy contributed to stabilising producer prices to the benefit of Producer Organisations’ members?
Within the context of actions for crisis prevention and crisis management, the expenditure is almost exclusively for harvest insurance. This has no direct influence on the development of producer prices, however, as such insurance merely serves to reduce the financial losses suffered by the growers concerned in the event of disasters caused by the weather through the payment of compensation. Based on the data available, it is not known in how many cases harvest insurance has been paid out and the amounts involved. It is therefore not possible to say how high a proportion of the members of POs have benefited from taking out harvest insurance. It is also not possible to determine whether the costs of harvest insurance are appropriate in relation to the compensation. The fact that the other crisis prevention actions that are possible according to the CMO, such as market withdrawals and non-harvesting of fruit and vegetables, have been excluded from the support should be regarded as a positive thing from a long-term perspective. The impact of such measures on short-term slumps in sales is uncertain, but in the long term such actions could instead be counterproductive, as the incentives for producers to orientate their production to the market and to avoid overproduction would be reduced.
5.2.6.2 To what extent have the operational programmes implemented under the National Strategy been efficient with respect to the objective of stabilising producer prices to the benefit of Producer Organisations' members?
See Chapter 5.2.1.2.
74 Chapter 5 Answers to the evaluation questions
5.2.7 Improving competitiveness
5.2.7.1 To what extent have the operational programmes implemented under the National Strategy contributed to improving competitiveness of national/regional producer organisations in the fruit and vegetables sector?
Within the framework of the OPs of the POs in the context of the National Strategy, actions aimed in particular at improving marketing, maintaining and increasing quality, eco-friendly production and the marketing of safe products have been implemented. Actions aimed at improving logistics, quality and the preparation of products and at reducing the volume of waste accounted for a particularly large share of the expenditure within the OP. Actions aimed at improving the preparation of the products and at optimising logistics generally result in a reduction in costs in these areas for the POs or their members and therefore directly enhance their competitiveness. Actions aimed at maintaining and improving quality seek to affect the producer price of the products and rather than the production costs. On the contrary, due to the costs associated with measures to protect and improve quality, these measures increase the costs of production. On the whole, it is to be assumed that the majority of the quality actions have no direct influence on the producer price, as the focus is mainly on quality assurance and control and on certification. It is different, however, with actions aimed at organic production and at implementing regional brands, which result in an increase in the product price. Actions in this area are of less importance, however. Overall, the actions implemented under the National Strategy by the POs to maintain and improve product quality tend to have the effect of protecting sales rather than increasing the producer price, as the quality of the products is improved in accordance with the prevailing standard and the quality level is protected, certified and communicated to the outside world.
5.2.7.2 To what extent has the National Strategy contributed to improving competitiveness of the national/regional fruit and vegetables sector?
The support provided under the National strategy is restricted to recognised POs for fruit and vegetables and their members. This results in considerable distortion of competition between the members of POs on the one hand and non-members on the other, with the members of the POs being the ones who benefit. How the funds that are provided to the fruit and vegetables sector via the support scheme affect the competitiveness of the sector as a whole depends to a large extent on the development of the market. The domestic market for vegetables in Germany has remained comparatively stable at between 7.9 million and 8.4 million tonnes between 2005/06 and 2009/10. The degree of self-sufficiency reached values of 35.1 to 38.9 % and, viewed from a longer-term perspective, shows a fluctuating, but slightly increasing trend (AMI 2011a, 2012c). This increasing degree of self-sufficiency relates both to crops that are to a large degree marketed via POs as well as to those that are not (Behr 2012). In the case of fruit, the

Chapter 5 Answers to the evaluation questions 75
level of the domestic market is between 9.8 million and 10.7 million tonnes and is therefore slightly more volatile than the vegetables market. At between 10.9 and 13.4 % the degree of self-sufficiency for fruit is significantly lower than it is for vegetables and, in the longer term, it fluctuates around a comparatively stable level of around 12 % (AMI 2011b, 2012d). The low levels of self-sufficiency where both fruit and vegetables are concerned are due to the fact that the production is subject to strong seasonality, which, in the case of some of the fresh produce that does not store very well, automatically results in imports. Where fruit in particular is concerned, the marked preference of consumers for exotic fruits is also a factor. In principle, however, it would seem to be possible to increase the degree of self-sufficiency for both fruit and vegetables, although this has rarely been achieved in the past for fruit and even less so for vegetables. In the period relevant to the evaluation of the National Strategy, 2007 to 2011, the AMI unfortunately only has market data available for three years (2007/08 to 2009/10), so it is not possible to determine any real trends over this short period. There is no reason to assume that the situation, which has changed very little over many years, would have changed significantly in the recent past (Behr 2012). The fact that the degree of self-sufficiency for fruit in Germany has remained at the same level for the last 10 years means that the support provided under the National Strategy has clearly been unable to help increase the competitiveness of the fruit sector as a whole. Despite the slight increase in the case of vegetables, the situation should not be interpreted as being essentially any different, as this increase in the degree of self-sufficiency did not only occur in respect of crops that are mainly sold via POs. Consequently, members of POs are in competition with colleagues from Germany in particular, in other words with producers who do not belong to a PO, but also with those belonging to other POs. In this competition, members of POs are at an advantage on account of the support. On this basis, the impression is that the support provided within the framework of the National Strategy has had rather minor effects in terms of increasing the competiveness of producers of fruit and vegetables.
5.2.8 Improving attractiveness of producer organisation membership
5.2.8.1 To what extent have the operational programmes implemented under the National Strategy contributed to improving attractiveness of producer organisation membership?
Within the framework of the National Strategy a wide variety of actions are supported which are implemented directly in the PO’s member holdings. These include, for example, the construction of storage facilities, greenhouses and greenhouse fixtures and fittings, the establishment of fruit plantations, harvest insurance or measures relating to logistics. It can be assumed that many of these investments would also be made, at least in a similar way, without the support, as they are necessary in order to safeguard the competitiveness of the member holders. For this reason, many of the actions implemented under the OP of the PO meet the requirements of the members of the PO, which in turn means that membership of a PO is attractive for many producers.

76 Chapter 5 Answers to the evaluation questions
Comparison of the number of members of POs in 2011 with the baseline value shows that it has decreased by more than 27 % (Table 8.12 in the Annex). In order to be able to interpret this decrease, it needs to be compared with the change in the number of the fruit and vegetable holdings in Germany as a whole. In the absence of any up-to-date data on which to base this, the two most recent horticulture surveys from 1994 and 2005 have been used. The annual changes in the number of holdings derived from these two periods were extrapolated. Accordingly, the total number of holdings producing fruit and vegetables between 2011 and the period from 2005 to 2007 in which the baseline value was determined decreased by a good 19 %, and that of specialised fruit and vegetable holdings decreased by a good 17 %. Even though this extrapolation can only be seen as an approximation of the true development, it indicates that the number of active PO member holdings has probably decreased more than the number of fruit and vegetable holdings overall. The reasons for this cannot be determined on the basis of the data available and probably lie in the individual changes occurring in the various POs.
5.2.9 Maintaining and protecting the environment
5.2.9.1 To what extent have the operational programmes implemented under the National Strategy contributed to maintaining and protecting the environment?
As already explained in Chapter 5.1.7.1, the contribution of the operational programmes to maintaining and protecting the environment has not been investigated further on account of the changes to the framework for the provision of support that have already been decided.

Chapter 6 Conclusions and recommendations 77
6 Conclusions and recommendations
6.1 Conclusions
6.1.1 Degree of utilisation of financial resources
The maximum amount of support possible under the National Strategy is limited by the value of marketed production of the recognised PO (see Chapter 3.1). The upper limit is normally set at 4.1 % of a PO’s value of marketed production. Since the operational fund that is to be established by the PO when setting up an OP is to be financed equally by the subsidy funds on the one hand and funds provided by the PO and its members on the other, the result is, as a rule, a maximum possible level of expenditure of 8.2 % of a PO’s value of marketed production for its OP. As a PO cannot be certain of the size of the annual value of marketed production during the planning and implementation phase of an OP, most cases fall slightly below the upper limit for the subsidies. Comparison of the value of marketed production for all POs with the total expenditure for the operational programmes shows that the maximum possible level of support is not achieved (Table 6.1). As a result, the maximum amount of support is not achieved, either. The proportion of the amount of support for the whole OP, taken as a yearly average, is around 3.5 % of the value of marketed production and thus around 0.6 percentage points below the upper limit for the support. Therefore, based on an average of all POs, around 84 % of the maximum possible level of support was utilised over the period being considered. Table 6.1: Total expenditure for OPs and utilisation of the subsidies (2007 to 2011)
Unit 20071) 20081) 2009 2010 2011 Value of marketed production, total (1) EUR million 121.9 129.5 943.6 1087.8 1077.9 Total expenditure for OP (2) EUR million 7.8 8.9 71.6 72.6 73.7 Max. possible total expenditure for OP (3) EUR million 10.0 10.6 77.4 89.2 88.4 Difference (3) – (2) (4) EUR million 2.2 1.8 5.8 16.6 14.7 Proportion of value of marketed production represented by expenditure for the OP
(5) % 6.41 6.84 7.59 6.67 6.84
Subsidy amount under National Strategy (6) EUR million 3.9 4.4 35.8 36.3 36.9 Max. possible amount of subsidy (7) EUR million 5.0 5.3 38.7 44.6 44.2 Proportion of total OP represented by subsidy amount (6)/(1)
(8) % 3.21 3.42 3.79 3.34 3.42
Utilisation of the subsidy amount (6)/(7) (9) % 78.2 83.4 92.5 81.4 83.4 1) Data from mid-term evaluations Source: own calculations based on the annual reports of the POs (Federal Office for Agriculture and Food,
various years) and the mid-term evaluations of the POs (competent authorities 2012).

78 Chapter 6 Conclusions and recommendations
6.1.2 Effects and impacts of the operational programmes in relation to the objectives,
targets and overall objectives set out by the National Strategy and, where appropriate, other objectives set in Article 103c(1) of Regulation (EC) No 1234/2007
Within the framework of the National Strategy, three general and seven specific objectives were set. The overall objectives are 1) to boost supply; 2) to improve the competitive position; and 3) to assume responsibility for consumers and society at large. The specific objectives are as follows: 1) to promote the concentration of supply; 2) to improve market orientation; 3) to increase and maintain quality; 4) to improve management of members and incentives to join; 5) to improve efficiency; 6) to develop competences and increase innovation; and 7) the eco-friendly production and marketing of safer products. In this way, all of the objectives set out in Article 103c(1) and Article 122(c) of Regulation (EC) No 1234/2007, i.e. in the CMO, are included in the National Strategy (BMELV 2008, OJ 2007). The most important indicators relating to results and impact with which the success of the National Strategy is to be gauged are the value of marketed production and the volume of marketed production. In addition, the number of members of POs, the size of the area under production by the members and the proportion of the total value and total volume of fruit and vegetable production represented by POs in Germany are also relevant. In the area of the environment, various indicators are defined which, on account of the complexity of this area of measures and the difficulties in measuring the indicator values, could not be used for a general analysis. At the end of the evaluation period in 2011 the total value of the marketed production of the POs in terms of fruit and vegetables had increased by just under 32 % compared with the baseline value. With a level of EUR 1.085 billion, the National Strategy objective of over EUR 1 billion for the year 2013 was already exceeded for the first time in 2010 and then fell back down to EUR 1.078 billion as a result of the difficult circumstances during the EHEC crisis in 2011. With regard to the volume of marketed production, the target was merely expected to be an increase, which, on comparison of 2011 with the baseline value, reached a level of nearly 12 % (Table 6.2). However, there are considerable differences in the development of the different POs (see Table 5.1). Whereas 16 and 17, respectively, of the POs receiving support were able to increase the volume of marketed production and the value of marketed production, around a third (7 and 9, respectively) of the POs receiving support experienced clear reductions in some cases compared with the baseline period. It was possible to increase the mean commercial value of the goods sold via POs, that is to say the ratio of the value of marketed production to the volume of marketed production, by EUR 0.1 per kg and therefore a good 15 % (Table 6.2). Increased commercial values were achieved by around 80 % of POs (see Table 5.1). An increased average commercial value is not necessarily a result of an increase in the market value of the traded products, as could be caused by consumers rewarding an increase in product quality, for example. On account of the intense competition between POs and with others who prepare fruit and vegetables, such a development is actually improbable. It is far more likely that changes in the mean commercial value are due to shifts in the product range of the POs. Increases in the average commercial value are caused by replacement of low-price products (low price per kilogram), such as apples, with high-price products such as cherries or strawberries (Behr 2012).

Chapter 6 Conclusions and recommendations 79
The overall positive development with regard to these four indicators is an indication of the strengthening of the competitiveness of the POs. During the evaluation period, the degree of self-sufficiency with regard to vegetables also increased slightly from around 36 % in 2007 to 38.9 % in 2011, although with regular annual fluctuations of 1-2 percentage points, whereas for fruit it has fluctuated by 1-2 percentage points around a long-term mean of approximately 12 % for many years. A drop in the number of active producers belonging to POs was expected despite the support provided via the National Strategy, something that is plausible in view of the structural change that has been ongoing in horticulture for decades. The reduction in active producers between the baseline value and the number in 2011 amounted to more than 27 % (Table 8.12 in the Annex). This is markedly more than would be expected in the context of the structural change (see Chapter 5.2.8). It shows that an essential objective of the CMO and the National Strategy, the creation of attractive POs for strengthening producers, was clearly unsuccessful. This is astonishing as, with an amount of EUR 116.25 million, considerable resources went into subsidising POs in Germany between 2007 and 2011. With regard to the area under production that is cropped by members of the POs, the objective of the National Strategy is for this to increase. Based on the situation in 2011, this has actually been successful compared with the baseline value, as it was possible to extend the area under production slightly by nearly 2 % (Table 6.2). In comparing POs, the changes in area under production were very heterogeneous. Only around half of the POs were able to increase it. A comparison of the two sectors of fruit production and vegetable production shows that the total area under production for fruit decreased (-4.6 %), whereas for vegetables it increased significantly (7.6 %) and was therefore able to more than compensate for the loss of areas under fruit production (see Table 5.1)22. Nevertheless, in terms of value of marketed production, apples remain the POs’ most important crop by a wide margin. Table 6.2: Comparison of baseline indicators with the result and impact indicators from
2011
Indicator Unit Baseline value Target 2013 Status 2011 Overall objectives Improving competitiveness
Value of marketed production
euro 814 019 802 >EUR 1 billion 1 077 900 561
Improving the attractiveness of the producer organisation’s membership
Number of fruit and vegetable producers who are active members of a PO
Number 8 869 Decrease 6 440
Total area under fruit and vegetable production cropped by members of a PO
ha 75 903 Increase 77 275
Specific objectives Promoting concentration of supply
Total volume of marketed production
t 1 340 940 Increase 1 509 217
Improving market orientation
Average value of marketed production
euro/kg 0.61 Increase 0.71
22 The details of the sector-specific changes in area under production are based on a comparison of the values from 2008 with those of 2011, as no specific baseline values were determined in this regard in relation to the sectors.

80 Chapter 6 Conclusions and recommendations
Improving and maintaining quality
Volume of marketed production that meets the requirements of a specific quality scheme
t Increase
Certified organic production
t 26 005 38 241 1)
Protected geographic indications and protected designations of origin
t 33 242 32 006 1)
Certified integrated production
t 1 031 685 1 106 281 1)
Private certified product quality schemes
t 771 274 966 402 1)
1) Figures only available up to 2010 Source: BMELV (2008), own calculations based on the annual reports (Federal Office for Agriculture and
Food, various years).
6.1.3 Effectiveness, efficiency and utility of the measures implemented under the operational programmes
The most important actions, measured in terms of expenditure, related to 1) expansion of structural facilities at the level of the PO and the member holdings; 2) the UVVM; 3) investments in maintaining product quality in connection with the preparation and packaging of the products; 4) investments in promoting production and preparation of the products that are adjusted to demand; 5) planting of permanent crops; and 6) harvest insurance. The expansion of structural facilities in the context of optimising storage, preparation, packaging and logistics is one of the core activities of a PO. These investments are directly related to the objective of the pooling of production, preparation and sale of the products in order to strengthen the trading position of the supply side, i.e. the producers of fruit and vegetables, in relation to the retail trade. Many investments aimed at maintaining product quality in the preparation and packaging of the products also fall within this context. It can be assumed that such investments safeguard sales and therefore stabilise the PO’s value of marketed production. However, competition between the POs and other poolers is severely distorted by the support with its high subsidy value of 50 %. In contrast to this there are investments in expanding the production capacity of the holdings belonging to the POs, for example the construction of greenhouses or the establishment of permanent crops, which are intended to promote production that is adjusted to demand. Such investments have a mainly indirect effect on the POs in that they increase the volume of marketed production, shift the PO’s product range and possible increase the value of marketed production and the average commercial value of the products. The direct effects are found in the producer holdings, however. The effects of the promotion of harvest insurance, which primarily benefits the insured producers in that they are compensated in the event of loss or damage, are realised at the level of the PO at best very indirectly. The promotion of harvest insurance also leads to distortions of competition between members of POs and non-members.
Chapter 6 Conclusions and recommendations 81
No statements concerning the effectiveness of actions implemented under the National Strategy can be made in this evaluation. This is due in particular to the fact that, based the data available, no causal link can be made between the actions implemented and the observed changes in the various results and impact indicators. The most important reason for this is that the effects of several of the actions implemented under the National Strategy overlap and there are also other internal and external factors related to the POs that affect the indicators. Overall, it is hard to find any indication from the data available that the support has had any positive effects. Although there have positive developments with regard to the value of marketed production and the volume of marketed production, these are countered by the negative developments in terms of member numbers and no change in the degree of organisation. As explained above (Chapter 5.2.1.2), no conclusions can be drawn in this study concerning the efficiency of the support.
6.1.4 Overall effectiveness, efficiency and utility of the operational programmes implemented
Only rudimentary general statements concerning the effect and the utility of the OPs of the POs can be made, as the various POs, and therefore also their OPs, are very different. Changes in the utilisation of the subsidies over time were already observed in the study by Ruhm et al (2008), with a shifting of the focus between 2003 and 2006 from actions aimed at marketing to actions in the area of production. This development appears to be intensifying, as indicated by up-to-date data on the actions implemented. The development of POs appears to proceed in typical steps, as described below. In the first years in which support is provided to a PO it is mainly investment-related actions that are carried out, aimed at establishing or improving preparation technology, storage capacity, packaging facilities and logistics. These investments are mainly implemented at the site of the PO and more rarely in the member holdings. However, in the case of apples in particular, investment in decentralised storage capacities is a common exception. In a second phase, which follows smoothly on from the first, investments are increasingly made at the level of the member holdings and these are directly linked to the increase and maintenance of product quality and improvement of the logistics chain. In parallel with these first two phases, measures aimed at quality control and certification are implemented under the operational programmes. Examples of this include the introduction of quality controls, examination of the products for residues of plant protection products, implementation of product traceability systems or certification under defined quality standards. In the subsequent third phase, once again with a smooth transition, investments at the level of the member holdings are noticeably increased. For example, investments are made in energy-saving measures in connection with production under glass and production capacities are expanded through the construction of greenhouses or the establishment of permanent crops. In the fourth phase this trend increases so that a considerable amount of the expenditure under the OP now occurs at the level of the member holdings.

82 Chapter 6 Conclusions and recommendations
If it is assumed that the main objective of the promotion of POs is to boost the producer side by pooling supply, increase the assurance of high quality and the achievement of a sustainable ability to deliver and improve the adjustment of the products, in particular in connection with preparation and packaging, to the requirements of the market via the PO, it can be said that the various phases of the promotion of POs contribute to widely varying degrees to achieving this objective. The actions that are mainly implemented during the first two phases make a direct contribution to the objective, as they help to pool production and to prepare, package and distribute the products according to requirements. With the start of the third phase, however, the contribution to the objective becomes increasingly indirect by strengthening the producers. From this point on, one increasingly gets the impression that the high degree of flexibility of the CMO and the National Strategy, which has its origin in the heterogeneity of the POs, is exploited in order to make optimum use of the opportunities for support. Environmental measures in the conventional sense, for example installation of filter facilities that go beyond the legal requirements or the establishment of biotopes, do not as yet form part of the OPs of the POs.
6.1.5. Shortcomings in the definition of overall and specific objectives or measures eligible for support
Three overall and seven specific objectives of the support are defined in the National Strategy (see Chapter 3.1). Based on the results of the SWOT analysis in the National Strategy, the overall objectives seem to have been defined in a reasonable way. The specific objectives are appropriate for supporting the achievement of the overall objectives. The EU requirements and, accordingly, also the National Strategy open up a broad array of subsidy opportunities for POs for fruit and vegetables. To the eight areas for action the National Strategy assigns a wide variety of actions that are eligible for support under the relevant EU requirements. This catalogue of eligible actions is not definitive, leaving a high degree of flexibility in terms of the support that can be provided under the National Strategy. This also seems to be reasonable, as the POs are very heterogeneous in terms of products, structure and consumers. On the other hand, this flexibility actually invites POs to extend the supported actions ever further. On account of the flexible EU requirements and because there is a legal entitlement to support under the National Strategy as a first-pillar measure under the common agriculture policy, it is difficult for the competent authorities to limit this ever increasing expansion of the support spectrum, with the result that, in recent times, the POs’ personnel costs and investments in member holdings for expanding production capacity at producer level have increasingly been supported. It has been possible to show that the effects of harvest insurance are almost exclusively seen at the level of the producer of fruit and vegetables. It cannot be assumed either that the compensation for weather-related damage at the level of the producers will generate indirect effects for the POs. With the exception of the creation of incentives for membership of POs, it is also not possible to find a support objective under the National Strategy that is met by the promotion of harvest insurance. The incentives for membership of a PO should, however, come from the results of the economic activities of a PO and not from supplementary activities that have nothing to do with actual business of a PO.

Chapter 6 Conclusions and recommendations 83
6.2 Recommendations based on evaluation findings, including possible proposals for adaptation of the National Strategy and EU policy
6.2.1 Recommendations on the system set up for the monitoring and evaluation of the National Strategy
For the monitoring and evaluation of the National Strategy, comparatively large amounts of data are collected and prepared. These data are included in the annual reports of the POs and in the mid-term evaluations. In particular, the various baseline, input, output, results and impact indicators form an initial basis for evaluation of the National Strategy. In order to be able to comply with their reporting obligations, the POs are required under the National Strategy to install a suitable system for the collection and storage of data. The enquiries made of various POs and the work with them in the context of this evaluation have shown, however, that the required data is extracted from existing systems on an ad hoc basis as required. This makes the collection of data more difficult when, for example, information that goes beyond the standard details is needed for the evaluation. Where environmental indicators in particular are concerned, but also for all data that are concerned with changes, problems seem to arise with calculations and also with the transfer of the data into the annual reports. A possible simplification of the reporting procedure for the POs would be to simply ask for the actual values on an annual basis and to calculate the desired change indicators centrally. This would also make data interpretation easier for the evaluation. In this regard, it needs to be ensured that baseline indicators are defined for all results and impact indicators so that all changes can be calculated. In addition, the requirements of the National Strategy ought to be followed more closely in this context at the level of the POs and compliance with these requirements should be checked systematically in order to facilitate the production of the annual reports, the mid-term evaluations and the evaluation of the National Strategy. In the National Strategy, areas for action, which are more or less independent from the specific support objectives, are defined for which various eligible actions are proposed. In accordance with these areas for action, input, output and results indicators which are not consistent with the specific support objectives are also defined. Since, in the evaluation of the National Strategy, the focus is in particular on the degree to which the objectives are achieved, this makes the evaluation considerably more difficult. Instead, the measures should in future be assigned to the various specific objectives, for which the indicators are then also defined and quantified. This will make the evaluation of the National Strategy simpler and more precise. The impact of the various actions is measured in terms of the overall objectives of the National Strategy, in particular using the indicators ‘value of marketed production’ and ‘volume of marketed production’ and ‘average commercial value’ (value of marketed production/volume of marketed production). Even though this is understandable in view of the objective of increasing the competitiveness of the POs and their members, no causal links between the changes in the indicator values and the individual actions can be made. The reason for this is that the various actions that are implemented simultaneously in a PO overlap in their effects with other internal factors effected by the PO and external factors acting on the PO, such as changes in the market or in the legal framework conditions and as a result the changes in an indicator reflect the sum of these complex influences. On account of the profusion of actions that are implemented simultaneously or at slightly different times,

84 Chapter 6 Conclusions and recommendations
the specific impact of any particular actions cannot be determined. This would, however, be essential for any meaningful evaluation of the National Strategy. In addition, in the mid-term evaluations of the POs it is striking that, in the analysis of various areas for action and of actions, the overall change in the relevant results and impact indicators is attributed to the relevant actions or areas of action being considered. The approach is also described in the guidelines (EU COM 2011a). However, since these indicators reflect an aggregation of various different impacts, the effects and impacts of the actions are not correctly reported. In the present mid-term evaluations this resulted in considerable over-estimates in each case, as a positive change in an indicator was attributed in its entirety to an action or intervention area multiple times. A correct method here would involve the identification of the individual impact of each separate measure, which would then add up to the overall observable change in an indicator, taking into account the direction of the impact. Of course, this approach encounters the methodological problems involved in quantifying the individual impacts. A possible solution to this could be for the POs to differentiate the impacts of the individual actions on the various impact indicators in the mid-term evaluation of their OP based on their expectations and experience. In the context of an evaluation of the National Strategy, the plausibility of these differentiated impacts can then be examined with the help of experts. The timing of the evaluation of the National Strategy is too early in view of the long-term effects of many of the actions implemented in this context, even though we are aware of the need for evaluation results for an adjustment of the National Strategy for the new EU subsidy period and also for the establishment of the new OPs of the individual POs. Although at the time the evaluation was carried out the first effects were already identifiable, consideration should be given to the conducting of an ex post evaluation of the National Strategy around three years after the OP has ended, similar to that carried out in the rural development programmes under the second pillar of the common agricultural policy. In order to ensure that there is an independent evaluation of the National Strategy in the long term, it would seem to make sense for the costs of this evaluation to be borne by the EU under the first pillar of the common agricultural policy. This is the only way to ensure that the incentive measure will be examined to a sufficient extent and in sufficient depth and therefore that a meaningful evaluation of the incentive measure will be carried out by independent assessors. These independent evaluations could, for example, be carried out universities, other independent research institutes or by consultants who are not involved in providing advice to POs. In addition to the evaluation using the available results and impact indicators, case studies looking at specific areas for action or for particular groups of POs could be carried out in order to get a better understanding of the details of the impact of the support.

Chapter 6 Conclusions and recommendations 85
6.2.2 Recommendations to address shortcomings in the objectives, targets or measures selected under the National Strategy and on needs for defining new instruments
In evaluating the National Strategy, a number of shortcomings were identified. The most important of these concern 1) the increasing creativity on the part of the POs in identifying new actions eligible for support; 2) the scale of the personnel costs that are subsidised under the National Strategy; and 3) the subsidising of harvest insurance. During the course of the subsidising of POs via the National Strategy, four different phases have been identified. These are characterised by the fact that investments are increasingly made at the level of the producer holdings, which are used to an ever increasing degree in the expansion of production capacity for the production of fruit and vegetables. As a result, the direct effects of the support under the National Strategy are increasingly seen in the member holdings of the PO and only indirectly at the level of the PO. This contradicts the main objective of the support, which is to strengthen the member holdings of POs by subsidising the POs, as the development described turns this objective on its head. Therefore, the opportunities for support under the National Strategy should be defined more closely and should focus on actions that have a direct effect at the level of the POs. Examples of this include subsidies for facilities for storage, sorting, preparation and packaging of the products and subsidies for distribution logistics. In addition, the subsidising of individual POs should be limited to a maximum of five years, by way of analogy with the subsidising of the establishment of producer groups in accordance with the Market Structure Act (Federal Law Gazette 1969)23, in order to awaken an interest on the part of the subsidy recipients in a greater focus on the actions that are relevant in the context described and to avoid deadweight effects. The POs’ ever increasing concentration on actions that are essentially implemented at the level of the producer holdings is resulting in the subsidising to an ever increasing extent of the expansion of production capacities at the level of individual holdings. The justification given for this is the adjustment of production to increasing demand. However, it can be assumed that the market provides sufficient regulating incentives here. In addition, the subsidising of such investments gives rise to considerable distortions of competition between members of POs and non-members. A subsidy for expanding production capacity can also provide false incentives and therefore contribute to hasty decisions to expand production. The proportion that goes on subsidising personnel costs in some POs is considerable. These costs arise in particular for actions in the area of quality management and quality control, advice and marketing. Many of the tasks taken on by these members of staff are core tasks at the level of the PO (quality management and control) and their members (use of advisory services) that are necessitated by the economic activities at both levels24. Such tasks carried out by these members of staff should no longer be subsidised under the National Strategy. In this context, stringent control is necessary. A distinction should be made where temporary actions, such as the introduction of new quality and environmental protection systems, are concerned. Such actions, in which there is a particular public interest, can under some circumstances pose particular challenges for POs, particularly those with a very heterogeneous membership structure, and therefore the provision of support seems to make sense in these cases.
23 The implementation of initial investments can be subsidised for up to seven years following the establishment of a producer group with a subsidy value of up to 25 %, provided subsidy funds are available for this. 24 These actions in principle represent incentive measures that are permitted under EU law.

86 Chapter 6 Conclusions and recommendations
Members of POs can take out harvest insurance via their PO, although this insurance has no effect at the level of the PO. On the other hand, it causes considerable distortions of competition between members of POs and non-members. For this reason, the subsidising of harvest insurance should be abolished. On the other hand, however, in the event of a food scandal like the EHEC crisis, for example, it would seem to make sense for there to be an option to intervene, outside the CMO, and take measures to reduce the financial losses suffered by producers of fruit and vegetables to an acceptable level. These measures should be available to all producers affected in order to minimise distortions of competition.
6.2.3 Recommendations on coherence and complementarity with other EU and national instruments
For many of the investments that are eligible for support under the National Strategy, there are opportunities for subsidies both at the level of the PO and also for their members under the GAK. The level of the subsidies here is considerably lower, however, and in many cases there are more stringent conditions for the subsidies. They are therefore of less interest to the POs and their members. Even though it is currently permissible under EU law to have various promotional instruments side by side and double funding is ruled out, such parallel structures in relation to support lead to unequal treatment of investors depending on which support option they have access to: under the National Strategy, the GAK or even none at all. This leads to distortions in competition between the relevant players operating at the level of the producers or the POs. On the other hand, parallel support structures usually result in parallel structures in the administration of the support programmes, which ought to be avoided for the sake of administrative simplification and streamlining. The situation is complicated further by the fact that the support can be provided to POs on a supraregional or even an international basis, which makes approval by the granting authorities and the coordination of their work in the case of combined subsidies from different support programmes considerably more difficult. Investments in the expansion of production facilities at the level of the producer holdings in particular should, by virtue of the nature of the support programmes, be assigned to a programme providing support for individual holdings, and therefore to the AFP, rather than to a programme providing support for POs under the National Strategy. The reason for this is that these investments help to boost the competitiveness of the holdings and to improve working and production conditions in rural areas. These are the objectives set out under the GAK for the AFP. Only through these effects at the level of individual holdings will the investments also indirectly help to improve the competitiveness of the POs and their market orientation. Therefore, in order to improve the coherence and complementarity of the support, the assignment of the support for such investments at the level of individual holdings for expanding production capacity should be examined with the objective of assigning it exclusively to the support programmes of the GAK. This is not only sensible in order to reduce distortions of competition between producers of fruit and vegetables, it will also help to standardise the support schemes among the fruit and vegetables sector and other horticultural and agricultural sectors. In so doing, however, equal access to subsidies via the GAK for investments in all agricultural sectors must be ensured.
Chapter 6 Conclusions and recommendations 87
The fundamental question arises as to why the support for producer groups provided under the CMO, and therefore under the National Strategy, is restricted to POs for fruit and vegetables. Other areas of agricultural primary production are excluded from this type of support. Viewed against the background of equal treatment, this support should either be open to all agricultural producers or not be granted to any at all. Another reason for the special position of the fruit and vegetables sector could be specific sector-related problems, but, on comparison with other agricultural sectors, no such problems are currently evident here.
6.2.4 Recommendations for the design of the future National Strategy
The recommendations for the design of future national strategies stem directly from the recommendations in Chapter 6.2.2. The support provided to POs for fruit and vegetables under the National Strategy should essentially be abolished, as the only very minor positive effects do not justify the distortions of competition in the sector that are associated with the support. In this regard, however, the National Strategy must be viewed in the Europe-wide context of the CMO. Distortions of competition between the Member States as a result of varying degrees of access by POs to support in different Member States must be avoided. In order to restrict the support to the measures that, from the point of view of the recipient, are really necessary in order to strengthen the PO, the opportunities for receiving support should in future be both time-limited and also restricted in terms of range. In terms of time limitation for the support, we propose a period of five years in line with the Market Structure Act (Federal Law Gazette 1969), which should be sufficient to modernise the POs appropriately and thereby enable them to ensure their own future competitiveness in the long term. As mentioned in Chapter 6.2.3, investments for expanding production capacity at the level of individual holdings should be made ineligible for support under the National Strategy. It should instead be ensured that they can be supported under the GAK on equal terms with investments in other agricultural sectors, such as milk production. Furthermore, subsidies for harvest insurance should, following the argument presented in Chapter 6.2.2, essentially be excluded from the support provided under future National Strategies, and the subsidising of personnel costs for improving quality should be examined and, where necessary, restricted. Under these conditions, the level of the support under the National Strategies of the future should continue to be no more than 4.1 % of the value of marketed production and a maximum of 50 % of the approved and eligible costs under an OP. The collection of data to support and evaluate the National Strategy should be adjusted in the future according to the recommendations in Chapter 6.2.1.

88 Chapter 6 Conclusions and recommendations
6.2.5 Recommendations on the design of the future EU policy in the fruit and
vegetables sector
On account of the competition-distorting effect caused by the support for a wide variety of actions under the National Strategy or via the CMO at the level of the producers, but also at the level of poolers of fruit and vegetables, it is recommended that the supporting of POs under the CMO be abolished throughout Europe. Another reason for abolishing the support for POs is the fact that, from society’s point of view, the support has at best a small benefit but with comparatively high costs. The abolition of the facility for supporting POs by an individual Member State alone is not recommended, however, due to the distortions of competition within the European fruit and vegetables sector that would result. If the abolition of support via the CMO does not succeed, care should also be taken at European level in future not to establish parallel support programmes. This means that comparable investments should no longer be eligible for support under different support programmes, as is currently the case, for example, with regard to support for the construction of greenhouses under the CMO or the EAFRD. In particular, the level of funding for comparable investments should be aligned. This also applies to investments of a similar nature but in different agricultural sectors, such as investments to expand agricultural production capacities. This means, in particular, that the support for investments in individual holdings should be removed from CMO and assigned to the second pillar of the common agricultural policy, and therefore the EAFRD, as this corresponds better to the nature of the various support programmes. Furthermore, the recommendations for the adjustment of future National Strategies presented in Chapter 6.2.4 also apply at EU level.

Chapter 7 Reference 89
7 References
OJ, Official Journal of the European Union (2012): Commission Implementing Regulation
(EU) No 755/2012 of 16 August 2012 amending Implementing Regulation (EU) No 543/2011 as regards the eligibility of specific costs of environmental actions under operational programmes of producer organisations in the fruit and vegetables sector. OJ L 223/6 of 21.08.2012.
OJ, Official Journal of the European Union (2011): Commission Implementing Regulation
(EU) No 543/2011 of 7 June 2011 laying down detailed rules for the application of Council Regulation (EC) No 1234/2007 in respect of the fruit and vegetables and processed fruit and vegetables sectors. OJ L 157/1 of 15.06.2011.
OJ, Official Journal of the European Union (2011a): Commission Implementing Regulation
(EU) No 585/2011 of 17 June 2011 laying down temporary exceptional support measures for the fruit and vegetable sector. OJ L 160/71 of 18.06.2011.
OJ, Official Journal of the European Union (2007): Council Regulation (EC) No 1234/2007
of 22 October 2007 establishing a common organisation of agricultural markets and on specific provisions for certain agricultural products (Single CMO Regulation). OJ L 299 of 16.11.2007.
ALBRECHT S, BECK T, BARTHEL L, FISCHER M, DEIMLING S, BAITZ M (2007):
The Sustainability of Packaging Systems for Fruit and Vegetable Transport in Europe based on Life-Cycle-Analysis. Stiftung Initiative Mehrweg, Michendorf, 161 pages.
AMI, Agrarmarkt Informations-Gesellschaft mbH [Agricultural Market Information Company]
(2012a): Warenstromanalyse Obst und Gemüse – Verkaufserlöse [Commodity flow analysis for fruit and vegetables – profits of sale]. Study on behalf of the Johann Heinrich von Thünen Institute (vTI). Unpublished.
AMI, Agrarmarkt Informations-Gesellschaft mbH [Agricultural Market Information Company]
(2012b): Abgabepreise für Obst und Gemüse der Erzeugerorganisationen ohne MwSt [Selling price for the fruit and vegetables of producer organisations without VAT]. Downloaded 09.08.2012.
AMI, Agrarmarkt Informations-Gesellschaft mbH [Agricultural Market Information Company]
(2012c): Marktbilanz Gemüse 2012 [Market Review Vegetables 2012], 194 pages. AMI, Agrarmarkt Informations-Gesellschaft mbH [Agricultural Market Information Company]
(2012d): Marktbilanz Obst 2012 [Market Review Fruit 2012], 224 pages. AMI, Agrarmarkt Informations-Gesellschaft mbH [Agricultural Market Information Company]
(2011a): Marktbilanz Gemüse 2011 [Market Review Vegetables 2011], 168 pages. AMI, Agrarmarkt Informations-Gesellschaft mbH [Agricultural Market Information Company]
(2011b): Marktbilanz Obst 2011 [Market Review Fruit 2011], 208 pages.

90 Chapter 7 Reference
BEHR HC (2012): Information concerning the fruit and vegetables market. Head of Section
for horticulture, organic farming and consumer research, Agricultural Market Information Company, telephone conversation, 03.09.2012.
BGBL, Federal Law Gazette (2008): Order on the implementation of the common
organisation of agricultural markets for fruit and vegetables (EU Fruit and Vegetables Implementing Order. Date of issue: 16.06.2008, most recently amended on 07.12.2011.
BGBL, Federal Law Gazette (1998): Order on the avoidance and recycling of packaging waste
(Packaging Order – German designation: VerpackV). Date of issue: 21.08.1998, most recently amended on 24.02.2012.
BGBL, Federal Law Gazette (1969): Act on the adaptation of agricultural production to
market requirements (Market Structure Act). Date of issue: 16.05.1969, most recently amended on 09.12.2010.
BLE, Federal Office for Agriculture and Food (various years): Annual Report. By email. BMELV, Federal Ministry for Food, Agriculture and Consumer Protection (2011):
Rahmenplan der Gemeinschaftsaufgabe „Verbesserung der Agrarstruktur und des Küstenschutzes“ für den Zeitraum 2011 bis 2014 und Sonderrahmenplan der Gemeinschaftsaufgabe „Verbesserung der Agrarstruktur und des Küstenschutzes“: Maßnahmen des Küstenschutzes in Folge des Klimawandels (2009 bis 2025) [Framework Plan for the joint task ‘Improvement of agricultural structures and coastal protection’ for the period 2001 to 2014 and Special Framework Plan for the joint task ‘Improvement of agricultural structures and coastal protection’: Measures for coastal protection as a consequence of climate change]. As at June 2011, 125 pages. www.bmelv.de, downloaded 24.08.2012.
BMELV, Federal Ministry for Food, Agriculture and Consumer Protection (2008): Programm
zur Innovationsförderung [Programme for the promotion of innovation]. December 2009. 20 pages.
BMELV, Federal Ministry for Food, Agriculture and Consumer Protection (2008): Nationale
Strategie für nachhaltige operationelle Programme der Erzeugerorganisationen für Obst und Gemüse in Deutschland für den Zeitraum 2008 bis 2013 [National Strategy for sustainable operational programmes of producer organisations for fruit and vegetables in Germany for the period 2008 to 2013]. BMELV, eds., November 2008, 65 pages.
BMELV, Federal Ministry for Food, Agriculture and Consumer Protection (various years):
Statistisches Jahrbuch über Ernährung, Landwirtschaft und Forsten der Bundesrepublik Deutschland. [Statistical yearbook on food, agriculture and forestry in the Federal Republic of Germany].

Chapter 7 Reference 91
DIRKSMEYER, Walter (2009): Betriebsstrukturen im Produktionsgartenbau [Holding structures in commercial horticulture]. In: Dirksmeyer, Walter (ed., 2009): Status quo und Perspektiven des deutschen Produktionsgartenbaus [Status quo and prospects of German commercial horticulture]. Special edition 330, Agriculture and Forestry Research, Johann Heinrich von Thünen Institute, Braunschweig, Germany, p. 3-42.
EU COM, European Commission (2011): Guidance Note – Evaluation of national strategies
for sustainable operational programmes in the fruit and vegetables sector (2012). Directorate-General for Agriculture and Rural Development, AGRIC. 2/DOCTRAV/003/ 2011, version of 18.10.2011, 43 pages.
EU COM, European Commission (2011a): Guidance Note: Common performance indicators
for the monitoring and evaluation of operational programmes, AGRIC. 2/DOCTRAV/002/2008 (Corr.1), final version of 20.06.2011, 19 pages.
RUHM G, MÜLLER K, STEINBORN P, BOKELMANN W (2008): Forschungsvorhaben zur
Nationalen Strategie für Obst- und Gemüseerzeugerorganisationen in Deutschland – Handlungsoptionen zur Ausgestaltung von nachhaltigen operationellen Programmen – Abschlussbericht [Research project concerning the National Strategy for fruit and vegetable producer organisations in Germany – courses of action for the design of sustainable operational programmes – final report]. No. 07HS006. Humboldt University of Berlin. Berlin, Germany, 100 pages.
FEDERAL STATISTICAL OFFICE (2012a): Technical volume 3: Series 3.2.1,
Vegetables 2011, downloaded on 25.07.2012. FEDERAL STATISTICAL OFFICE (2012b): Technical volume 3: Series 3.2.1, Fruit 2011,
downloaded on 25.07.2012. COMPETENT AUTHORITIES, AUTHORITIES RESPONSIBLE FOR IMPLEMENTING
THE NATIONAL STRATEGY IN THE GERMAN LÄNDER (2012): Mid-term evaluations of the producer organisations. By post and email.
Related Documents