EVALUATION OF THE MACROFUNGAL COMMUNITY AT LOS AMIGOS BIOLOGICAL STATION, MADRE DE DIOS, PERU by ROMINA GAZIS Bachelor of Science, 2002 Ricardo Palma University Lima, Peru Submitted to the Graduate Faculty of the Colleague of Science and Engineer Texas Christian University in partial fulfillment of the requirements for the degree of Master of Science May 2007

Welcome message from author
This document is posted to help you gain knowledge. Please leave a comment to let me know what you think about it! Share it to your friends and learn new things together.
Transcript
EVALUATION OF THE MACROFUNGAL COMMUNITY AT LOS
AMIGOS BIOLOGICAL STATION, MADRE DE DIOS, PERU
by
ROMINA GAZIS
Bachelor of Science, 2002 Ricardo Palma University
Lima, Peru
Submitted to the Graduate Faculty of the Colleague of Science and Engineer
Texas Christian University in partial fulfillment of the requirements
for the degree of
Master of Science
May 2007


ACKNOWLEDGEMENTS
I would like to thank Dr. John Janovec for his trust in me and in the project as
well as for his enthusiasm for my research. I am grateful to Dr. Clark Ovrebo for his
guidance, support, and research supervision during all phases of the project, including
fieldwork, data analysis, and writing. I am also grateful to Dr. Thomas Læssøe and Dr.
Nigel Hywel – Jones for their help in the identification process and for their support
during the last three years of my project. Finally, I would like to sincerely thank Dr. Luis
Diego Gomez for being a mentor and a friend during the last five years.
I would like to thank Dr. Ernest Couch, Dr. John Horner, and the Biology and
Environmental Science Department faculty for offering useful advice and for helping
during the analysis of the data. I am very thankful to the Andes to Amazon Biodiversity
Program (AABP) team and to the Botanical Research Institute of Texas staff for their
help in logistics, for sharing their valuable data and expertise, and especially for having
their friendship and support during this project. An especial mention to Dr. Sy Sohmers,
without his support this project would have not been conducted.
Financial support was provided by the Gordon and Betty Moore Foundation, the Amazon
Conservation Association, the Botanical Institute of Texas, and Texas Christian
University.
ii
TABLE OF CONTENTS
Acknowledgements ii
List of Figures v
List of Tables vii
Introduction 1
Materials and Methods 16
Study area 16
Climate and seasonality 18
Soils 20
Vegetation 22
Leaf Litter 27
Species 28
Methodology 29
Inventory construction 29
Diversity analysis 32
Identification 34
Data analyses 37
Results 39
Overview of the collection 41
Structure of the community 41
Substratum preference 45
iii
Identified species 44
Plot analyses 45
Individual plot analysis 45
Comparison between plots 60
Habitat comparison 66
Discussion 71
Conclusion 81
Appendix I 84
Appendix II 87
Appendix III 89
Bibliography 90
Vita
Abstract
iv
LIST OF FIGURES
1. Location of the study site. 17
2. Gold mining in the Madre de Dios River. 18
3. Graph showing the fluctuation in precipitation at “Los Amigos”
for 2001 – 2004 and for 2005 separately. 19
4. Graph showing the temperature fluctuation from Dec 2000 to
Jul 2004 at “Los Amigos” 20
5. Vegetation at floodland as seen from Madre de Dios River. 21
6. High terrace as seen from trail “Segundo Mirador.” 22
7. High terrace secondary forest habitat. 24
8. High terrace secondary forest habitat. 24
9. Mantle at high terrace secondary forest habitat. 25
10. High terrace primary forest habitat. 23
11. High terrace primary forest habitat. 26
12. Floodland primary forest. 26
13. Floodland primary forest. 27
14. Litter phenology (2004 – 2005) at Los Amigos biological station. 28
15. Trail system at “Los Amigos.” 30
16. Field work process. 31
17. Plot setup. 32
18. Plot location. 34
19. Steps in the identification of fungal species. 36
20. Agaricales family composition at “Los Amigos” – 2005 (N = 105). 43
21. Substratum preference distribution (N = 305). 44
22. Diversity changes vs. precipitation – PLOT 1. 47
23. Diversity changes vs. precipitation – PLOT 2. 50
24. Diversity changes vs. precipitation – PLOT 3. 53
25. Diversity changes vs. precipitation – PLOT 4. 55
26. Diversity changes vs. precipitation – PLOT 5 57
27. Diversity changes vs. precipitation – PLOT 6. 60
v
28. Total number of morphospecies in each plot. 61
29. Number of morphospecies fluctuation in each plot through
the three sampling dates. 62
30. Fluctuation of the principal groups of macromycetes along
the three sampling dates 63
31. Macromycetes cumulative species richness curve. 67
32. Cumulative species richness curve of macromycetes for each
habitat separately. 67
33. Number of morphospecies in each habitat. 68
34. Number of macromycetes species occurring exclusively in each
forest type and the ones shared among forest types. 70
vi
LIST OF TABLES
Tables:
1. Plot location, habitat, and date of visit. 33
2. Summary of the collection. 39
3. Ascomycota family composition. 40
4. Basidiomycota family composition. 41
5. Macrofungi composition – PLOT-1. 46
6. Macrofungi composition PLOT 2. 49
7. Macrofungi composition PLOT 3. 51
8. Macrofungi composition PLOT 4. 54
9. Macrofungi composition PLOT 5. 56
10. Macrofungi composition PLOT 6. 59
11. Number of species present in each plot. 64
12. Number of species in common between plots. 64
13. Sorenson’s similarity indexes between plots. 65
14. Jaccard similarity indexes between plots. 65
15. Sorenson’s index results for the three habitats. 71
16. Jaccard index results for the three habitats. 71
vii
INTRODUCTION
Fungi constitute the second most diverse group of eukaryotic organisms on earth,
after the insects, in the number of species thought to exist. They are united by their mode
of nutrition, growing through the substrate secreting degradable enzymes and absorbing
nutrients through their cell walls. Because they obtain their nutrients by absorption, they
can successfully exploit a variety of organic matter. They play myriad roles within the
world’s ecosystems among which the most important may be the cycling of nutrients
derived from the breakdown of plant and animal matter, allowing the re-use of scarce
biotic and abiotic resources (Rossman et al., 1998).
Scant attention has been accorded to the role of fungi in ecosystem functioning
and in the maintenance of biodiversity itself. Broadly based integrated interdisciplinary
studies are required to place fungi in an ecosystem context. Not only biomass involved
may be considerable, especially when below-ground and litter inhabiting fungi are
considered, but it is their functions, which are crucial to ecosystem maintenance. In
addition 75 to 80% of vascular plants have mutualistic mycorrhizal fungi. Fungi play
important roles as parasites in the natural bio-control of some organisms such as insects
and plant parasites. They act as mutualists of wood-boring insects and they are a source
of nutrients for a great variety of organisms (Hawksworth, 1991). Fungi are primary
responsible for a large portion of the recycling of mineral nutrients through the
decomposition of organic matter and for the transfer of these nutrients into plants via
mycorrhizal fungi or by depositing them on the soil for their absorption. Fungi along with
other soil organisms serve as sources and sinks of labile nutrients that are necessary for
plant growth, participating in carbon entrapment. Thus, fungal and microbial biomass can
1

control significant fractions of labile pools in humid and wet tropical forests and regulate
the availability of nutrients that may limit plant growth (Lodge, 1992).
Moist tropical forests often occupy ancient weathered oxisols and latisols where
leaching produced by the heavy rainfall may have removed minerals and nutrients from
it. It has been estimated that 94% of Amazonian soils are nutrient limited (Hedger, 1985).
The availability of phosphorous to higher plants is generally limited since phosphorous
combines with aluminum and iron oxides in the highly weathered soils to form insoluble
complexes. Elements such as nitrogen and potassium are leached from ecosystems when
the soil has little cation and anion ex-change capacity, and their availability may thus be
quiet low in tropical forests with high rainfall. The degree to which fungi regulate the
availability of limiting nutrients depends on the size and fluctuation of the labile pool and
on the quantity and fluctuation of fungal biomass. Studies conducted at El Verde in
Puerto Rico (subtropical wet forest), proved that fungi have the ability to immobilize
phosphorus and other nutrients, preventing them from being leached due to high rainfall.
Nutrients, once obtained by saprotrophic fungi are not released immediately or
indiscriminately to other organisms but remain within the mycelium acting as storage
units. Nutrients are often spatially relocated within the ecosystem, affecting the
ecosystem’s functions (Lodge, 1992; Boddy et al., 1995).
Dead wood is the primary nutrient source of tropical macrofungi and constitutes
an important component of forests ecosystems. Dead wood can reduce erosion, increase
soil organic matter, store carbon, and serve as a reserve of nutrients and water. Wood
forms the major component of aboveground biomass of terrestrial ecosystems,
representing over 70% in forest ecosystems, and fungi are the major agents of wood
2
decomposition (Boddy et al., 1995). Decomposition rates of tropical wood are extremely
high and the factors that influence this rate are mainly climate, saprotrophic organisms,
and secondary compounds present in the wood. Nevertheless, the ecological relationships
between wood-inhabiting fungi and substrate qualities remain to be systematically
studied in the tropics (Lindblad, 2001).
This project comprises macromycetes. Macromycetes or macrofungi is an
artificial group, which include those fungi forming reproductive structures (sporocarps,
basidiomes, sporophores, carpophores, fruitbodies, etc.) that are visible with the naked
eye or larger than about 1 mm. They comprise an important component of the lowland
rainforest ecosystem. Fruiting bodies, produced by these macromycetes, serve as
important nutrient sources and refuge for other components of the ecosystem such as
insects and other arthropods. Associations between insects that use fungi as a resource
and the fungi exploited are variable in nature, including from obligate mycetophagous
species to opportunistics. On the other hand, macrofungi groups such as the family
Clavicipitaceae (Ascomycota) use insects (and some arthropods) as their nutrient source
and play a role in the regulation of the host population. Members of the Clavicipitaceae
are also considered a significant “hot spot” for invertebrate pathogens and are known to
be much more diverse in the tropical areas than in temperate regions, especially in
undisturbed forests (Hodge, 2003; Chaverri et al. 2006). A few tropical species from
these entomopathogenic fungi have moved from the forest to agricultural ecosystems,
which should be considered in order to limit potential pests that can affect important crop
pollinators. Currently, many species belonging to this family (anamorphs and telemorphs)
are being using as biocontrol agents of agricultural pests. Most of the fungal species
3
assessed for biocontrol have come from agricultural ecosystems, so natural forests, as the
one studied, presents a potential pool of new biocontrol agents.
Fungi help to preserve plant biodiversity at tropical rainforests, by causing a high
rate of plant mortality. In a study conducted at Panama’s rainforest, Gilbert (2005) found
that fungal attack caused 47% and 39% annual mortality of seed in the soil seed bank of
Miconia argentea (Melastomataceae) and Cecropia insignis (Cecropiaceae), two pioneer
tree species. Fungal pathogens attack tropical trees seedlings, preserving the biodiversity
of the community because only the strongest individuals from each plant species in that
generation will survive the infection; therefore, there will not be only one dominant
species that can displace the rest. Consequently, fungi play an important role in the
balance of death and survival, which will generate the future tree species composition of
a community. The majority of these pathogens are not macromycetes; however, some of
them are, such as neotropical polypores like Ganoderma, Amauroderma, and Phellinus
species (Ryvarden, 1992). They attack living trees, making them more susceptible to
damage from wind and rain. Others will infect living trees but really only colonize and
decay extensively when the tree is dead or dying from other factors. For instance, a
survey done at the Barro Colorado (Panama) found that the percentage of live trees with
polypore fruiting bodies range from zero to 33%, while 56% of all dead trees had
polypores (Gilbert, 2005). Members of the Xylariaceae are also believed to be plant
pathogens of tropical plants (although in less proportion than polypores); these species
invade the host when it is still alive and wait for a change in conditions which favors the
fungus causing canker or root rot diseases. Kretzschmaria clavus, a widespread tropical
4
fungus, is an example and should not be underestimated as a potential pathogen of
commercial crops (Whalley, 1992).
Because of their widespread distribution and association with all organic and
many inorganic substrates, the actual number of fungal species in existence is difficult to
assess (Rossman et al., 1998). Several estimates of fungal diversity have been made,
based on several types of data. Hawksworth proposed the most common estimate for the
number of fungus species. He proposed an estimate of 1.5 million fungal species on
earth; largely by extrapolating the ratio of host plants to fungi (1:6) found for the well
studied mycobiota of the British Isles (Hawksworth, 1991). He also concluded that based
on these estimates, the currently accepted number of described fungal species represents
as little as 5% of the potential global mycobiota. Smith and Waller (1992) considered 1.5
million too low and suggested that there are probably 1 million undescribed fungi living
on tropical plants alone. Subsequents estimates have ranged from 500 thousand to 9.9
million, but it is prudent to retain 1.5 as the working hypothesis for the number of Fungi
on Earth while additional data are obtained (Hawksworth, 2001). Cifuentes et al. (1997)
proposed a ratio of 3.5:1 of macromycetes species to vascular plants for subtropical
regions. Caution is needed when making extrapolations since the smaller area surveyed
the more species of fungi outnumber those of flowering plants. The latter because
saprobes (habit of most of the tropical macromycetes) have wider distribution than plants
and are often non-specific. The ratio of 6:1 of fungi vs. vascular plants proposed by
Hawksworth may be higher or lower in tropical regions but tropical fungi are not known
sufficiently to even speculate about their richness (Rossman et al., 1998). More recently,
Muller et al. (2007) proposed a number of macrofungi species, ranging between 53,000
5
to 110,000. They also proposed that the total number of macrofungi in Tropical America
should be approximately 14,000 species based on a 5:1 ratio of plant to macrofungi.
Overall, fungal diversity overall is greater at lower latitudes, such as tropical areas
(Lodge et al., 1995). Most of the fungal species remaining to be described are probably
found in the neotropics because of the vastness of the tropical area, the number of
unexplored habitats there, and the existence of a latitudinal biodiversity gradient with the
tropics richest in taxa. The unexplored tropical rain forests represent the richest
ecosystem in Earth in terms of variety of micro-habitats, individual genomes, and
morphological diversity (Moncalvo, 1997). Neotropical regions are expected to be the
richest sources of new species. For instance, Batista and his co-workers described
approximately 3500 species between 1954 and 1972 (Da Silva et. al., 1995). These new
fungi came mainly from easily accessible parts of the Amazon, and several species new
to science were discovered from single perennial leaves. Therefore, areas of difficult
access are probably holding many new species waiting to be discovered. Some
macromycetes groups are particularly diverse in the neotropics such as Xylariales (an
Ascomycota order of mostly decaying fungi) and Agaricales (a Basidiomycota order of
mostly saprobes fungi). Singer (1989) published 276 new species of agarics of which 241
were from Central and South America (Hawksworth, 1991). The studies of Dennis (1970)
also demonstrated that Xylariaceae is well represented in tropical South America,
reporting more than 100 species for this family, a number that later Læssøe (1999)
proposed to be even greater (up to 500 species). In contrast, ectomycorrhizal genera are
exceptionally poorly represented in the neotropics whereas in other tropical areas, such as
the Congo flora, are very diverse (Dennis, 1970).
6
The number of fungal species is deeply related to the number of different possible
substrata located within a site. The type of vegetation in an area affects the species’
richness and the abundance of macrofungi since plants constitute the habitat and energy
source for most fungi, and all fungi show some degree for host or substratum specificity
(Lodge et al., 1995). In the case of the tropics, low host specificity is expected comparing
with the temperate regions, because natural selection can act against specificity that limits
colonization of widely spaced hosts (Janos, 1980). In most tropical wet forests tree
dominance is low and diversity is high, which also means that macrofungi will have more
types of substrata to exploit. In addition, forests with greater stature and structural
complexity can create more microhabitats and microclimates for fungi. For the fungi
treated in this study, diversity of habitats rather than geographic location is believed to
have the strongest influence on fungal species richness (Dennis, 1986).
Whatever future research establishes as to the true number of species, it is
indisputable that there is a tremendous number of undescribed fungi in tropical regions. If
only 5% of the world’s species (70,000) have now been described, 1.43 million must
remain unrecognized. In conclusion, the state of knowledge of the tropical mycobiota is
still in the pioneer phase of exploration. This phase represents only the first portion of the
alpha-taxonomy, which embrace the knowledge of the species present and their
variability (Hawksworth, 1992).
Although macrofungi have perhaps the longest history of diversity studies of any
mycota, they nevertheless are understudied throughout most of the world. More data are
available from Europe than from any other region; yet, even for Europe the knowledge of
macrofungal diversity is incomplete. Taxonomic obstacles and the absence of long-term
7
studies prevent us from conclusively answering even basic questions about the number of
species at a specific location or whether diversity is greater in one type of forest than in
another (Mueller et al., 2004). The percentage of well-known fungi is low for several
reasons related to the nature of fungi themselves. Fungi are composed of a threadlike
vegetative structure called mycelium, which usually exists immersed in soil or plant parts
and only become visible when reproductive structures are produced (Rossman et al.,
1998).
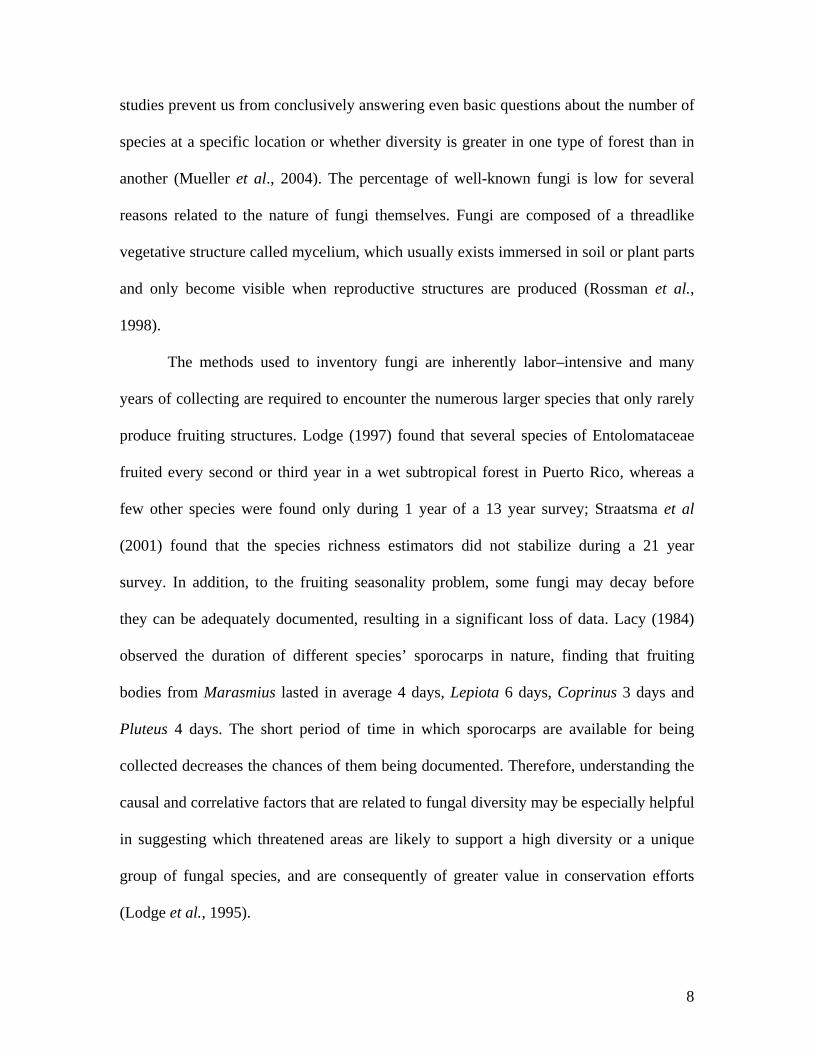
The methods used to inventory fungi are inherently labor–intensive and many
years of collecting are required to encounter the numerous larger species that only rarely
produce fruiting structures. Lodge (1997) found that several species of Entolomataceae
fruited every second or third year in a wet subtropical forest in Puerto Rico, whereas a
few other species were found only during 1 year of a 13 year survey; Straatsma et al
(2001) found that the species richness estimators did not stabilize during a 21 year
survey. In addition, to the fruiting seasonality problem, some fungi may decay before
they can be adequately documented, resulting in a significant loss of data. Lacy (1984)
observed the duration of different species’ sporocarps in nature, finding that fruiting
bodies from Marasmius lasted in average 4 days, Lepiota 6 days, Coprinus 3 days and
Pluteus 4 days. The short period of time in which sporocarps are available for being
collected decreases the chances of them being documented. Therefore, understanding the
causal and correlative factors that are related to fungal diversity may be especially helpful
in suggesting which threatened areas are likely to support a high diversity or a unique
group of fungal species, and are consequently of greater value in conservation efforts
(Lodge et al., 1995).
8
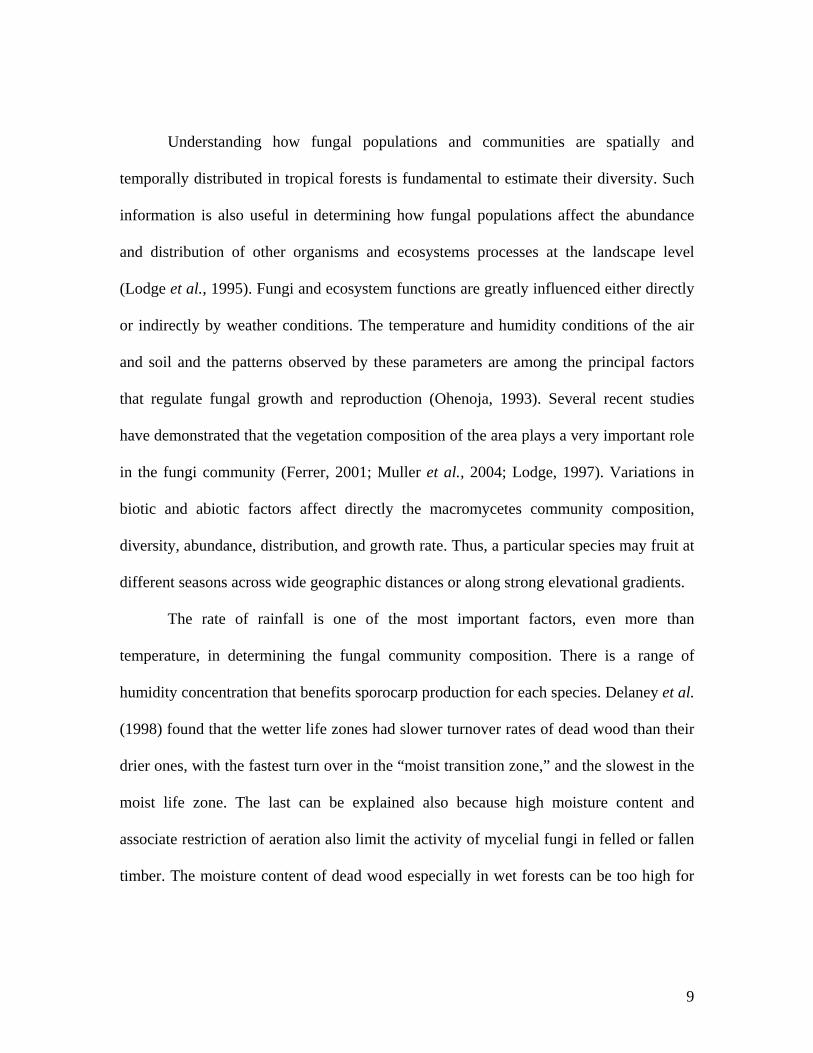
Understanding how fungal populations and communities are spatially and
temporally distributed in tropical forests is fundamental to estimate their diversity. Such
information is also useful in determining how fungal populations affect the abundance
and distribution of other organisms and ecosystems processes at the landscape level
(Lodge et al., 1995). Fungi and ecosystem functions are greatly influenced either directly
or indirectly by weather conditions. The temperature and humidity conditions of the air
and soil and the patterns observed by these parameters are among the principal factors
that regulate fungal growth and reproduction (Ohenoja, 1993). Several recent studies
have demonstrated that the vegetation composition of the area plays a very important role
in the fungi community (Ferrer, 2001; Muller et al., 2004; Lodge, 1997). Variations in
biotic and abiotic factors affect directly the macromycetes community composition,
diversity, abundance, distribution, and growth rate. Thus, a particular species may fruit at
different seasons across wide geographic distances or along strong elevational gradients.
The rate of rainfall is one of the most important factors, even more than
temperature, in determining the fungal community composition. There is a range of
humidity concentration that benefits sporocarp production for each species. Delaney et al.
(1998) found that the wetter life zones had slower turnover rates of dead wood than their
drier ones, with the fastest turn over in the “moist transition zone,” and the slowest in the
moist life zone. The last can be explained also because high moisture content and
associate restriction of aeration also limit the activity of mycelial fungi in felled or fallen
timber. The moisture content of dead wood especially in wet forests can be too high for
9

many wood-rotting fungal species to survive. In such areas, there will be a selective
pressure for species with high tolerance for moisture contents in wood (Lindblad, 2001).
Fungal succession has been defined as “mycelial succession” (Hyde et al., 2002),
but for the purposes of this study we considered fungal succession as the succession of
sporocarps within the study area. Succession of macrofungi must be considered when
inventorying, measuring, and comparing communities, and when plots are analyzed.
First, there are successions of sporocarp production on particular substrata, although all
species may be present in the substrata from the beginning. Succession involving changes
in community composition often are related to changes in the quality of substrata. Hedger
(1985) found, for example, that some species of Lepiota only grow well on leaf litter that
previously has been decomposed by other fungi, such as certain Marasmius species.
Second, successional changes occur in the vegetation at a site, which may have a direct
impact on fungi through the establishment of new host taxa and changes in the amount
and quality of available organic matter (Lodge et al., 2004). During decomposition the
nature and abundance of substrata change with time from readily decomposable
compounds to a proportionally greater recalcitrant fraction. A Substrate is initially
colonized by pioneer saprophytic fungi or sugar fungi (Zygomycota), which use simple
soluble nutrients. They are followed by the more specialized polymer degraders which
utilize cellulose, hemicelluloses, or chitin. In later successional stages, the fungal flora
composed of species able to break down recalcitrant compounds, which are accompanied
by secondary opportunistic invaders (mainly Basidiomycota). Generally, the early stages
of succession are characterized by a high biochemical and fungal diversity, whereas later
phases comprise fewer functional groups. The successional changes within the fungal
10
community are associated with an increase of drought, accumulation of recalcitrant
substrates, and lower C/N ratio (Ruess et. al, 2005).
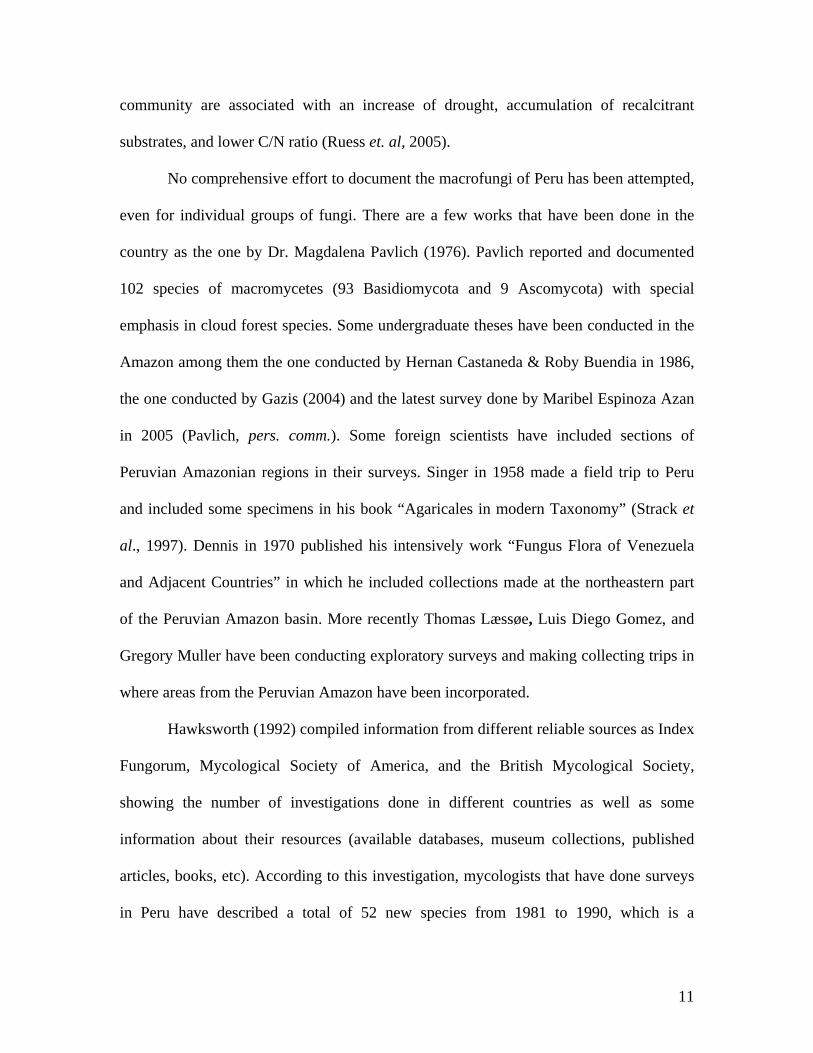
No comprehensive effort to document the macrofungi of Peru has been attempted,
even for individual groups of fungi. There are a few works that have been done in the
country as the one by Dr. Magdalena Pavlich (1976). Pavlich reported and documented
102 species of macromycetes (93 Basidiomycota and 9 Ascomycota) with special
emphasis in cloud forest species. Some undergraduate theses have been conducted in the
Amazon among them the one conducted by Hernan Castaneda & Roby Buendia in 1986,
the one conducted by Gazis (2004) and the latest survey done by Maribel Espinoza Azan
in 2005 (Pavlich, pers. comm.). Some foreign scientists have included sections of
Peruvian Amazonian regions in their surveys. Singer in 1958 made a field trip to Peru
and included some specimens in his book “Agaricales in modern Taxonomy” (Strack et
al., 1997). Dennis in 1970 published his intensively work “Fungus Flora of Venezuela
and Adjacent Countries” in which he included collections made at the northeastern part
of the Peruvian Amazon basin. More recently Thomas Læssøe, Luis Diego Gomez, and
Gregory Muller have been conducting exploratory surveys and making collecting trips in
where areas from the Peruvian Amazon have been incorporated.
Hawksworth (1992) compiled information from different reliable sources as Index
Fungorum, Mycological Society of America, and the British Mycological Society,
showing the number of investigations done in different countries as well as some
information about their resources (available databases, museum collections, published
articles, books, etc). According to this investigation, mycologists that have done surveys
in Peru have described a total of 52 new species from 1981 to 1990, which is a
11

demonstration of the low number of surveys made in the country or might be a sign of the
loss of information that remains unpublished. What is of concern from this publication is
that Peru appears as having no levels of information resources (as checklists, collections,
bibliography) for macromycetes.
Conservation implications
Fungi conservation has received scant attention in most countries. This is
regrettable in view of their role in ecosystem function and so in the maintenance of
biodiversity but further because of the unexploited genetic resource they represent.
Moore et al. (2001) suggested the following steps for fungal conservation: (i)
conservation of habitats, (ii) In-situ conservation of non-mycological reserves/ ecological
niches, and (iii) Ex-situ conservation especially for saprotrophic species growing in
culture. The in situ conservation is hampered by the lack of information such as the
species present in particular sites, the length of time and labor-intensiveness of producing
lists, knowledge of the rarity of individual species, and in most cases the lack of
understanding of precise ecological requirements of species. Even in the relatively
intensively studied British Isles, is not possible to have confidence that the database can
make judgments on rarity. In-situ conservation of fungi is therefore best effected by
ensuring the preservation of the widest range of least disturbed habitat types, and
macromycetes can be of value in determining such sites. The safeguarding of centers of
plant diversity would be a major step in securing the associated fungi. These management
decisions are of especial importance in tropical regions because most of the undescribed
fungi are located within these areas, which are going under a massive reduction. The
12

deforestation rate for the neotropics is calculated at least in 13 million acres of forest
annually1, leading to an enormous loss of habitats, and with them an unknown number of
species.
Some European countries experienced and reported a decline in population and in
geographical range of macromycetes, leading them to take some remarkable strategies to
battle this situation. Austria, Denmark, Germany, Finland, and Norway have published a
list of macromycetes species considered to be in danger of near-future extinction as a
result of a complex of environmental changes (Arnolds, 2001). The Red Data List2
reflects their concern about the possible extinction of some known and yet unknown
species. Species included in Red List are usually associated with ecosystems that are
themselves endangered (Ing, 1996). The Amazon, being a threatened ecosystem, should
be object of consideration and macromycetes should be included in its endangered
species list. Even though Red Lists are in essence a statement of concern based on
existing knowledge (if the knowledge is inadequate so will be the list) and we still have a
long way to get to know the neotropical mycoflora consciously, we need to take actions
soon since the loss of habitat has a much faster rate that our achievements in this regard.
Developing inventories and increasing the exploratory surveys in tropical areas will assist
scientists in determining which species are considered as rare or endemic to a region.
Hence a Red List can start being built in order to prevent the extinction of some valuable
species.
The primary motivation for conducting a biotic inventory is to manage
biodiversity. In order to achieve this objective it is necessary to know (1) what the
1 Data obtained from Rainforest Alliance organization. 2 Rarity, Endangerment, and Distribution Data lists.
13
biodiversity of a site is; (2) where it is located in that site; (3) how to obtain the
organisms in order to study or exploit them; and (4) the ecological roles and biotic
interactions of the organisms. These are prerequisites for fulfilling the obligations of the
Convention on Biological Diversity (Hawksworth et al. 1997). My study deals with the
first two points of the requirements which will serve as the foundation for the following
two steps.
The present research is part of a much larger project called “Andes to Amazon
Biodiversity Program” (AABP), whose principal mission is to support and help to
conserve natural areas located in the Amazon basin in order to preserve a priceless
resource: biodiversity.
Project Objectives
The main goal was to expand the baseline database about fungal diversity and ecology in
the Amazon region of southeastern Peru, establishing an inventory of the macrofungi
species. This project has taxon-driven implications for conservation research and
planning in the region. The following were the project’s goals: (1) A preliminary
checklist of the species found in the area; (2) An overview of the macrofungi community
composition in three main habitats (high terrace primary forest, high terrace secondary
forest, and floodland primary forest); and (3) An overview of the macrofungi community
composition changes along three different seasons.
14
Questions and Hypotheses
The following were the questions that drove the project:
- How diverse is the macrofungal community?
- How the community diversity and composition vary between habitats?
- How the diversity, abundance, and population structure vary with seasonal patterns?
The area was estimated to present a high diversity in macromycetes species since it is
located in one of the richest places in microhabitats on Earth, offering a great diversity of
suitable substrata. Primary forests were expected to hold the highest number of species,
and secondary forest the lowest. The community structure was anticipated to change
according to the quantity of rainfall, being the months with more rainfall the ones with
more number of species.
15

Materials and Methods
Study area
This study was carried out in the Los Amigos conservation concession of The
Amazon Conservation Association (ACCA), which is located within the lower Los
Amigos watershed in the department of Madre de Dios, Peru (Figure 1, A - D). The
Department of Madre de Dios, dominated by the Madre de Dios River basin, is an
important geopolitical region in the pristine SW Amazon. This Department lies at the
southwestern edge of the Amazon basin near the Andean foothills in southern Peru, and
is covered primarily by lowland tropical/subtropical moist forest. Threats to the forest
occur in the form of hunting, gold mining (Figure 2), timber extraction, impending road
construction, and slash-and- burn agriculture; however, Los Amigos is still in a relatively
pristine state. Collections were made at Los Amigos Biological Station3, which is part of
Los Amigos Conservation Concession. The station is located at approximately
12°34’07”S 70°05’57” W (Figure 1, C) at an elevation of 268 m. The closest settlement
to CICRA is the community of Boca Amigos, approximately 3 km downriver and the
closest city is Puerto Maldonado, the capital of Madre de Dios, approximately 90 km
downriver from CICRA.
3 CICRA (‘Centro de Investigación y Capacitación del río Los Amigos’ – Training and Research Center of the Los Amigos river).
16

Figure 1 (A – D). Location of the study site. The study site is located in the Peruvian southeastern region
within the Amazon basin in one of the few remain pristine areas of the Amazon.
17
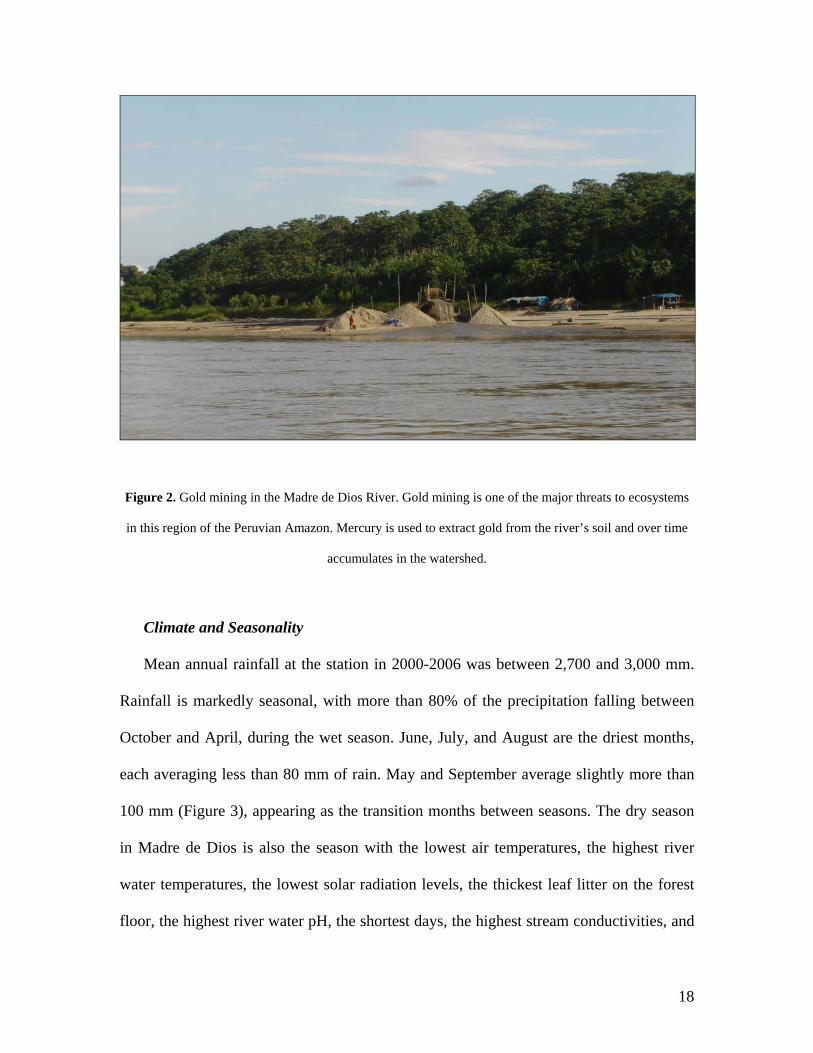
Figure 2. Gold mining in the Madre de Dios River. Gold mining is one of the major threats to ecosystems
in this region of the Peruvian Amazon. Mercury is used to extract gold from the river’s soil and over time
accumulates in the watershed.
Climate and Seasonality
Mean annual rainfall at the station in 2000-2006 was between 2,700 and 3,000 mm.
Rainfall is markedly seasonal, with more than 80% of the precipitation falling between
October and April, during the wet season. June, July, and August are the driest months,
each averaging less than 80 mm of rain. May and September average slightly more than
100 mm (Figure 3), appearing as the transition months between seasons. The dry season
in Madre de Dios is also the season with the lowest air temperatures, the highest river
water temperatures, the lowest solar radiation levels, the thickest leaf litter on the forest
floor, the highest river water pH, the shortest days, the highest stream conductivities, and
18

(because it is also a time of lower rainfall in the Andes) the lowest river levels.
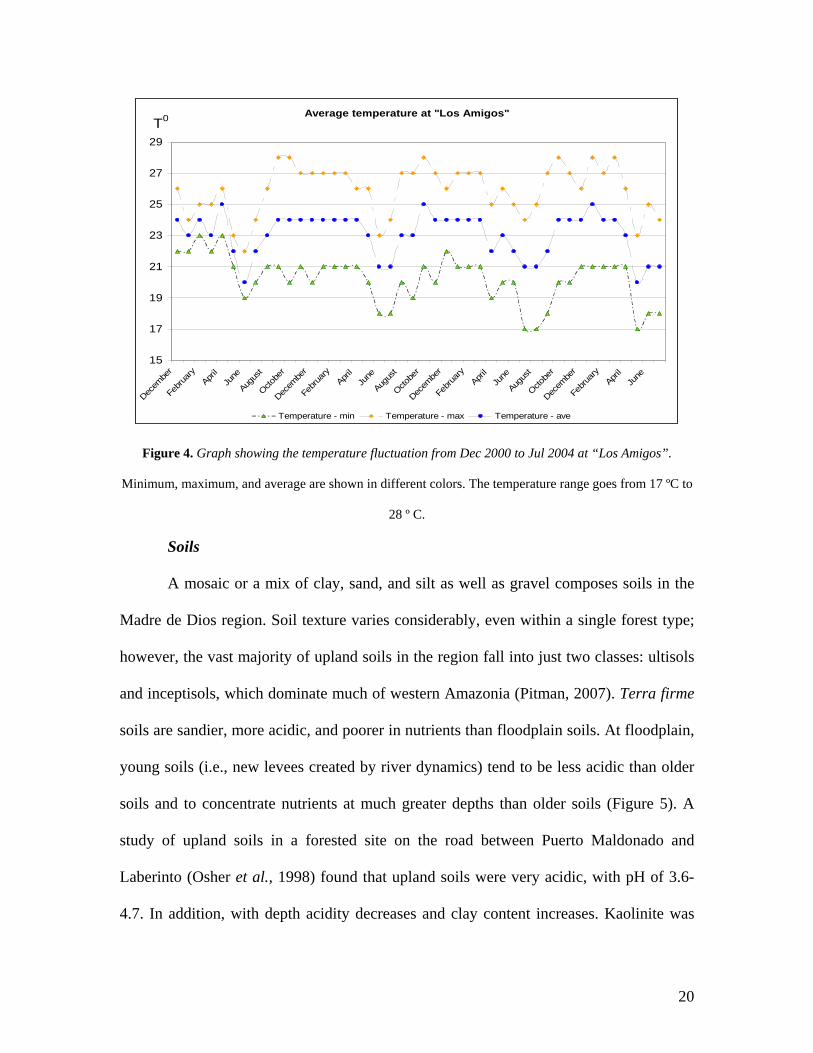
Temperature shows a much milder seasonal signal (Figure 4). The dry season is slightly
cooler than the wet season, but monthly means never depart from the range of 21-26 °C
(Pitman, 2006).
"Los Amigos" - Precipitation
0.0
50.0
100.0
150.0
200.0
250.0
300.0
350.0
400.0
450.0
500.0
Janu
ary
Febr
uary
Mar
ch
April
May
June
July
Augu
st
Sept
embe
r
Oct
ober
Nov
embe
r
Dec
embe
r
mm
3
Average (2001-2004) 2005
Figure 3. Graph showing the fluctuation in precipitation at “Los Amigos” for 2001 – 20004 and for 2005
separately. The average precipitation during 2005 was significantly less than the average between 2001 and
2004.
19
Average temperature at "Los Amigos"
15
17
19
21
23
25
27
29
Decem
ber
Febru
ary
April
June
Augus
t
Octobe
r
Decem
ber
Febru
ary
April
June
Augus
t
Octobe
r
Decem
ber
Febru
ary
April
June
Augus
t
Octobe
r
Decem
ber
Febru
ary
April
June
Temperature - min Temperature - max Temperature - ave
T0
Figure 4. Graph showing the temperature fluctuation from Dec 2000 to Jul 2004 at “Los Amigos”.
Minimum, maximum, and average are shown in different colors. The temperature range goes from 17 ºC to
28 º C.
Soils
A mosaic or a mix of clay, sand, and silt as well as gravel composes soils in the
Madre de Dios region. Soil texture varies considerably, even within a single forest type;
however, the vast majority of upland soils in the region fall into just two classes: ultisols
and inceptisols, which dominate much of western Amazonia (Pitman, 2007). Terra firme
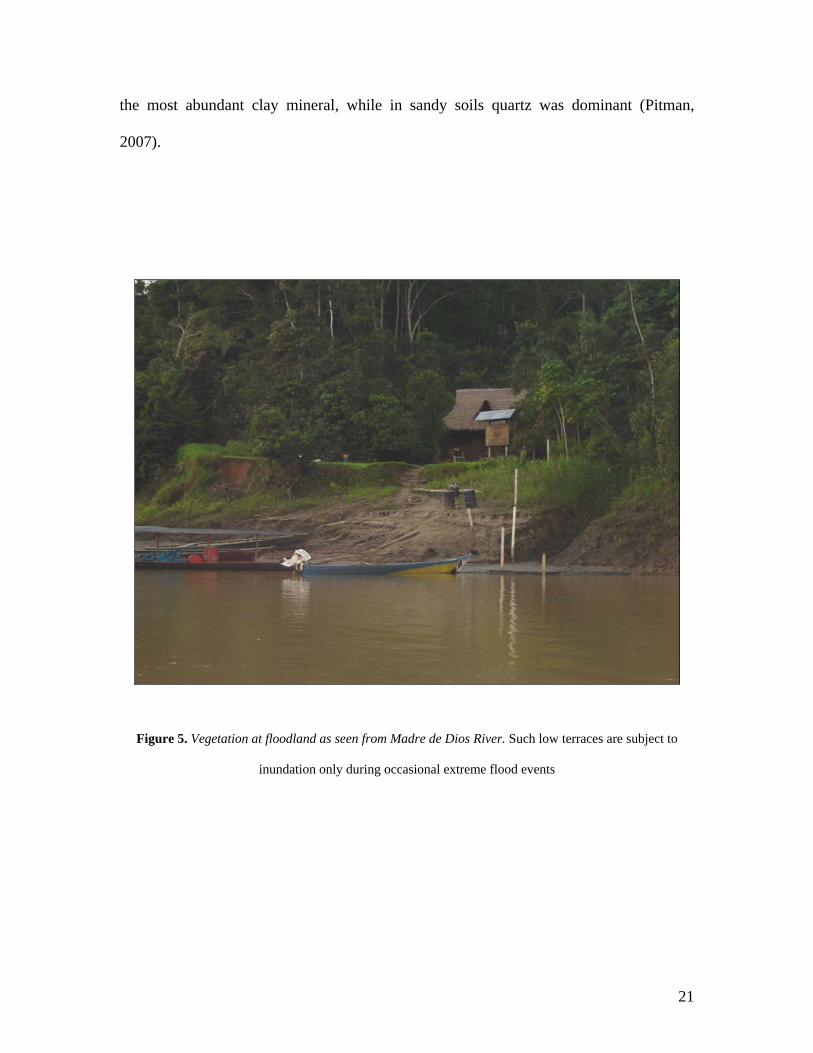
soils are sandier, more acidic, and poorer in nutrients than floodplain soils. At floodplain,
young soils (i.e., new levees created by river dynamics) tend to be less acidic than older
soils and to concentrate nutrients at much greater depths than older soils (Figure 5). A
study of upland soils in a forested site on the road between Puerto Maldonado and
Laberinto (Osher et al., 1998) found that upland soils were very acidic, with pH of 3.6-
4.7. In addition, with depth acidity decreases and clay content increases. Kaolinite was
20
the most abundant clay mineral, while in sandy soils quartz was dominant (Pitman,
2007).
Figure 5. Vegetation at floodland as seen from Madre de Dios River. Such low terraces are subject to
inundation only during occasional extreme flood events
21
.
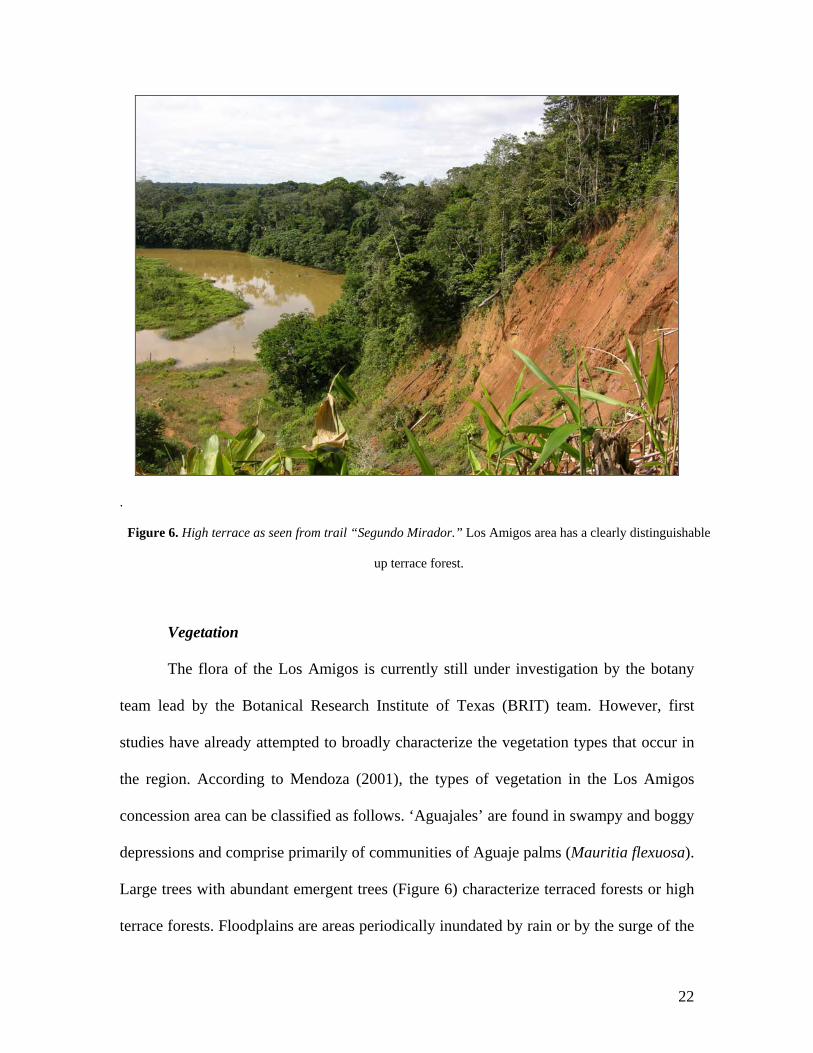
Figure 6. High terrace as seen from trail “Segundo Mirador.” Los Amigos area has a clearly distinguishable
up terrace forest.
Vegetation
The flora of the Los Amigos is currently still under investigation by the botany
team lead by the Botanical Research Institute of Texas (BRIT) team. However, first
studies have already attempted to broadly characterize the vegetation types that occur in
the region. According to Mendoza (2001), the types of vegetation in the Los Amigos
concession area can be classified as follows. ‘Aguajales’ are found in swampy and boggy
depressions and comprise primarily of communities of Aguaje palms (Mauritia flexuosa).
Large trees with abundant emergent trees (Figure 6) characterize terraced forests or high
terrace forests. Floodplains are areas periodically inundated by rain or by the surge of the
22
river. Successional forests are associated with the high river dynamics and thus located
on areas periodically inundated or near shores of rivers. Pioneer vegetation composed of
shrubby vegetation grows on the shallow and mostly sandy riverbanks (Figure 12 & 13).
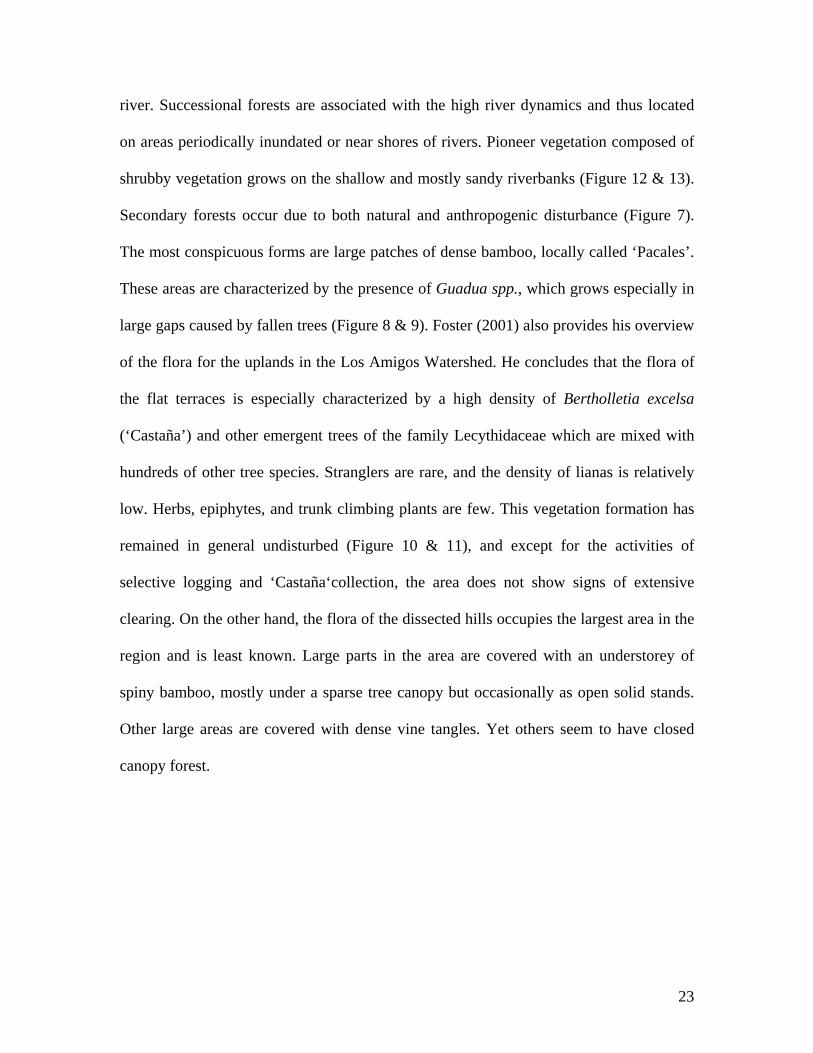
Secondary forests occur due to both natural and anthropogenic disturbance (Figure 7).
The most conspicuous forms are large patches of dense bamboo, locally called ‘Pacales’.
These areas are characterized by the presence of Guadua spp., which grows especially in
large gaps caused by fallen trees (Figure 8 & 9). Foster (2001) also provides his overview
of the flora for the uplands in the Los Amigos Watershed. He concludes that the flora of
the flat terraces is especially characterized by a high density of Bertholletia excelsa
(‘Castaña’) and other emergent trees of the family Lecythidaceae which are mixed with
hundreds of other tree species. Stranglers are rare, and the density of lianas is relatively
low. Herbs, epiphytes, and trunk climbing plants are few. This vegetation formation has
remained in general undisturbed (Figure 10 & 11), and except for the activities of
selective logging and ‘Castaña‘collection, the area does not show signs of extensive
clearing. On the other hand, the flora of the dissected hills occupies the largest area in the
region and is least known. Large parts in the area are covered with an understorey of
spiny bamboo, mostly under a sparse tree canopy but occasionally as open solid stands.
Other large areas are covered with dense vine tangles. Yet others seem to have closed
canopy forest.
23
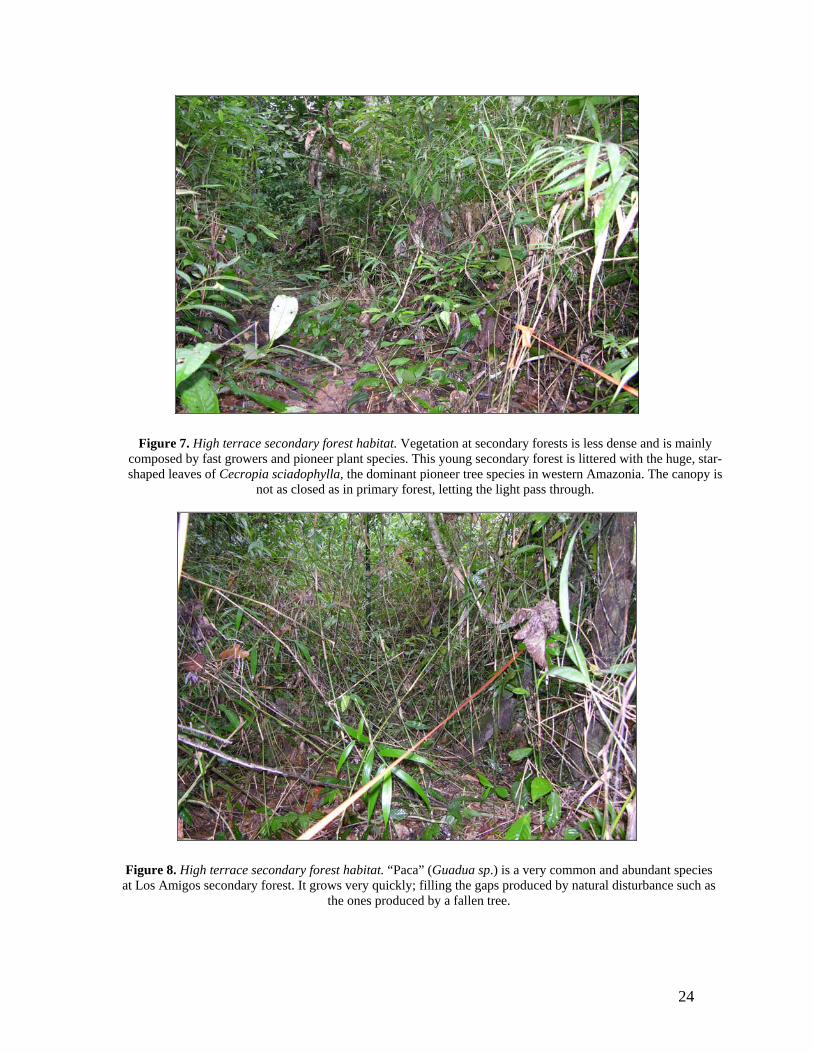
Figure 7. High terrace secondary forest habitat. Vegetation at secondary forests is less dense and is mainly composed by fast growers and pioneer plant species. This young secondary forest is littered with the huge, star-shaped leaves of Cecropia sciadophylla, the dominant pioneer tree species in western Amazonia. The canopy is
not as closed as in primary forest, letting the light pass through.
Figure 8. High terrace secondary forest habitat. “Paca” (Guadua sp.) is a very common and abundant species at Los Amigos secondary forest. It grows very quickly; filling the gaps produced by natural disturbance such as
the ones produced by a fallen tree.
24
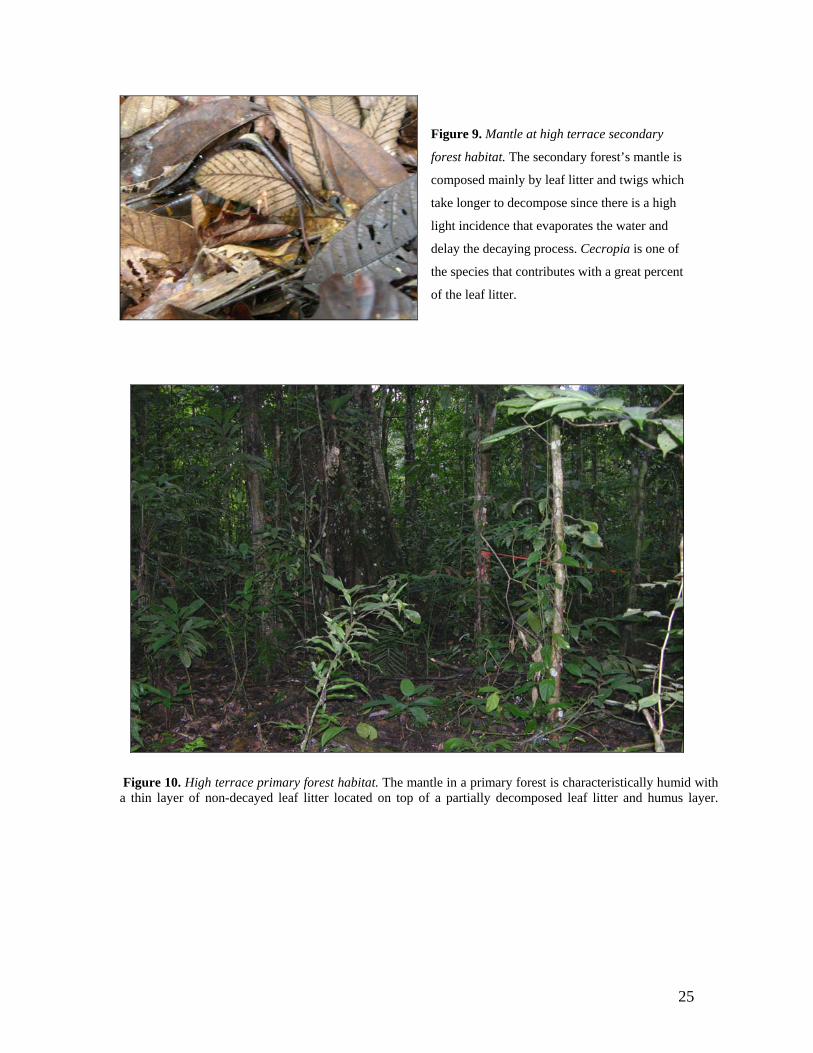
Figure 9. Mantle at high terrace secondary
forest habitat. The secondary forest’s mantle is
composed mainly by leaf litter and twigs which
take longer to decompose since there is a high
light incidence that evaporates the water and
delay the decaying process. Cecropia is one of
the species that contributes with a great percent
of the leaf litter.
Figure 10. High terrace primary forest habitat. The mantle in a primary forest is characteristically humid with a thin layer of non-decayed leaf litter located on top of a partially decomposed leaf litter and humus layer.
25
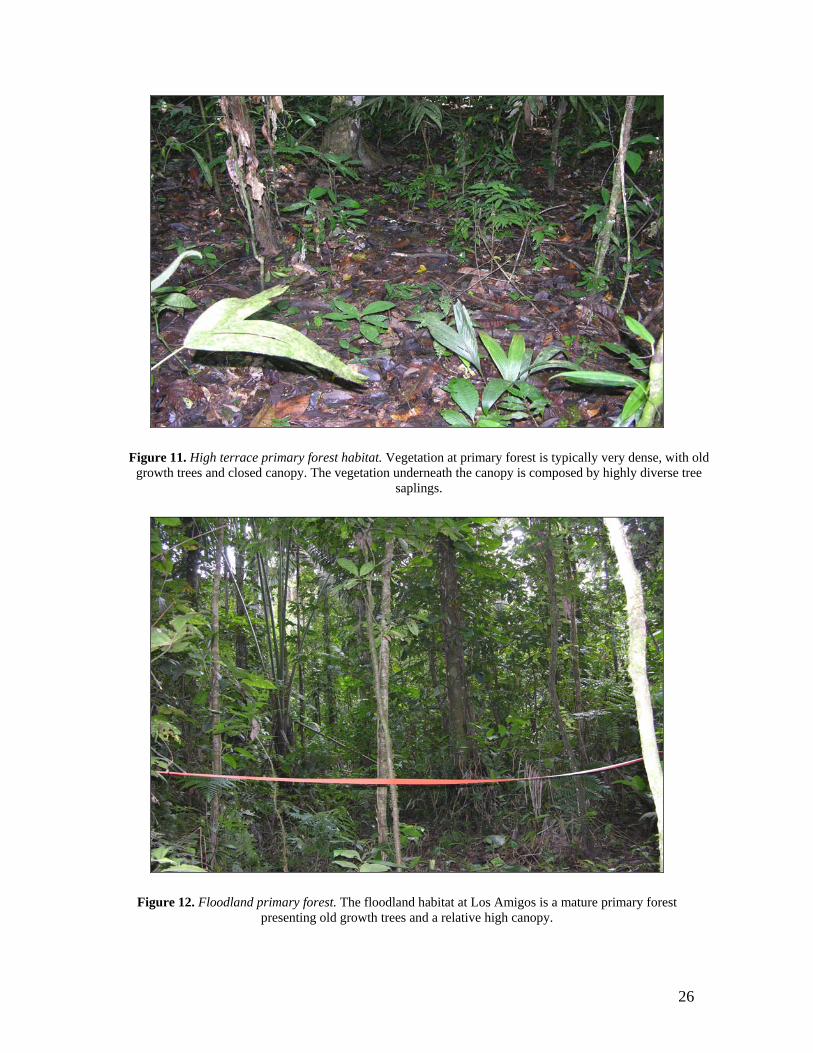
Figure 11. High terrace primary forest habitat. Vegetation at primary forest is typically very dense, with old growth trees and closed canopy. The vegetation underneath the canopy is composed by highly diverse tree
saplings.
Figure 12. Floodland primary forest. The floodland habitat at Los Amigos is a mature primary forest presenting old growth trees and a relative high canopy.
26

Figure 13. Floodland primary forest. The floodland primary forest mantle presented a thin layer of intact
leaf litter on top of a humus layer. The canopy is not as closed as in high terrace primary forest.
Leaf litter
One important environmental factor to take into account is the “forest litter
seasonality.” Leaf litter produced by the plant subsystem act as storage of nutrients
becoming suitable substrates for saprobic fungi. A feature of all moist tropical forests is
the presences of masses of litter mostly leave and small branches, trapped in the canopies
of treelets and understorey trees. Fungi known as “litter trapping fungi” contribute to hold
the litter using their mycelium system (Hedger et al., 1993). Furthermore, foliicolous
fungi are abundant in the tropics; therefore, the amount of leaf litter influences their
abundance and distribution.
Litter data is only available for two types of habitats: high terrace and floodland
forest, therefore, distinctions between secondary and primary forest cannot be conducted.
In both habitats, the accumulation of litter in the forest’s floor presents a seasonal cycle
27
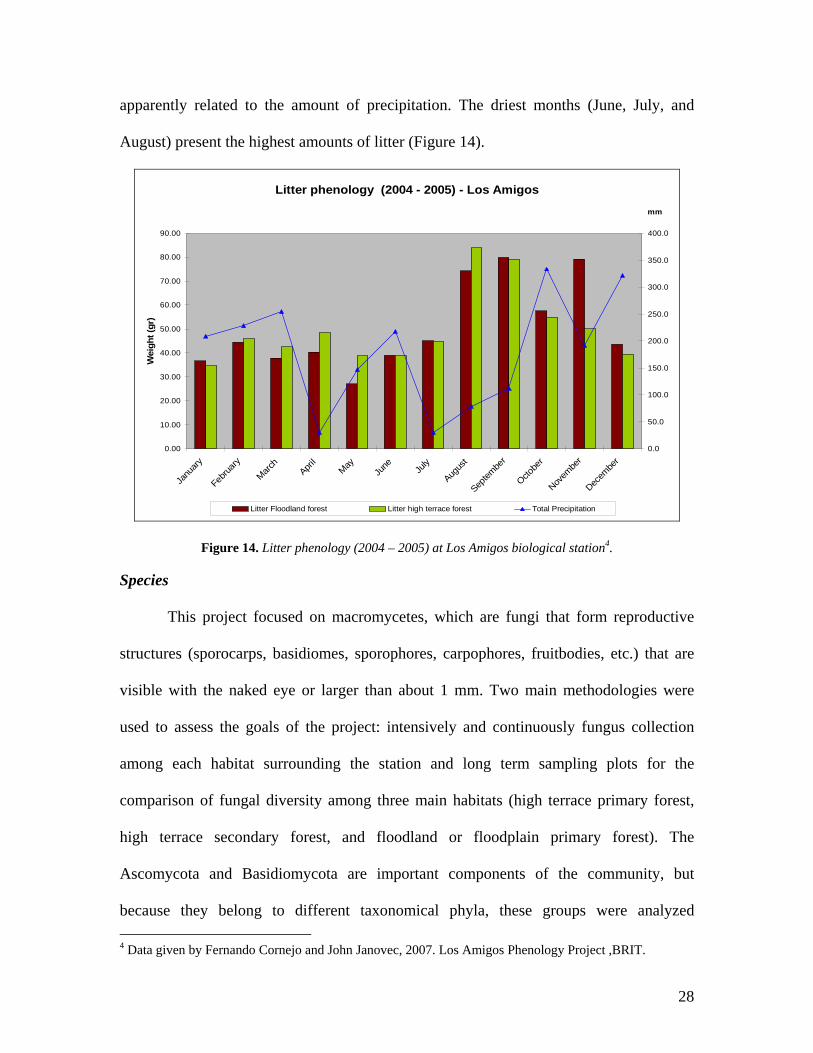
apparently related to the amount of precipitation. The driest months (June, July, and
August) present the highest amounts of litter (Figure 14).
Litter phenology (2004 - 2005) - Los Amigos
0.00
10.00
20.00
30.00
40.00
50.00
60.00
70.00
80.00
90.00
Janu
ary
Februa
ry
March
April
MayJu
ne July
Augus
t
Septem
ber
Octobe
r
Novem
ber
Decem
ber
Wei
ght (
gr)
0.0
50.0
100.0
150.0
200.0
250.0
300.0
350.0
400.0
mm
Litter Floodland forest Litter high terrace forest Total Precipitation
Figure 14. Litter phenology (2004 – 2005) at Los Amigos biological station4.
Species
This project focused on macromycetes, which are fungi that form reproductive
structures (sporocarps, basidiomes, sporophores, carpophores, fruitbodies, etc.) that are
visible with the naked eye or larger than about 1 mm. Two main methodologies were
used to assess the goals of the project: intensively and continuously fungus collection
among each habitat surrounding the station and long term sampling plots for the
comparison of fungal diversity among three main habitats (high terrace primary forest,
high terrace secondary forest, and floodland or floodplain primary forest). The
Ascomycota and Basidiomycota are important components of the community, but
because they belong to different taxonomical phyla, these groups were analyzed 4 Data given by Fernando Cornejo and John Janovec, 2007. Los Amigos Phenology Project ,BRIT.
28
separately to determine whether they show similar patterns of community structure
within each habitat. In addition to those two groups, some collections were made
belonging to a third group, deuteromycetes. Deuteromycetes5 are not usually considered
within the macromycetes since they are mostly composed by micromycetes; however,
there are some macro–representatives included in this survey. A general description of
the collection protocols for each objective is made below.
Methodology
Inventory construction
To create the checklist and to analyze the beta diversity (species richness of the
region), all the different habitats were sampled, using the trail systems as transects. The
trail system used consisted of more than 150 km (Figure 15, Appendix IV) passing
through the major types of habitats present in the area as: mature floodplain forest,
upland terrace and hill forest, bamboo-dominated forest, and wetlands. Trails are marked
with flags every 25 m, helping in the geo-referencing of the specimens collected. Every
trail was visited at least 3 times during the 6 months period (June to Dec 2005), some of
them were visited more times (4– 10) depending on their length, location, and richness.
All the specimens received a collection number, which included the date of
collection, habitat type, GPS location, number of plot or trail, and some extensive notes
that can be important to identify the specimen. Once the sample was detected and the data
annotated in the field notebook, it was collected and transported in a special envelope to
the station laboratory. At the station samples were documented according to a special
protocol for each family of macro-fungi. These annotations were introduced into a excel
5 Deuteromycetes is use informally, to denote species of Ascomycota and Basidiomycota in which sexual reproduction is unknown.
29

sheet and archived with the images taken for each specimen. Once documented,
specimens were dried using specific techniques depending on the nature of the fungus,
but in most of the cases an electric food dryer was used. Finally, they were stored using
silica gel to prevent re-hydration of the specimens, growing of undesirable fungus
contaminants and to prevent insect incursion (Figure 16).
Figure 15. Trail system at “Los Amigos”. The more than 50 km of trails cover the main habitat
present at the station’s surroundings such as High terrace primary forest (A), high terrace secondary forest
(B), floodland (C, D), bamboo patches, among others.
30
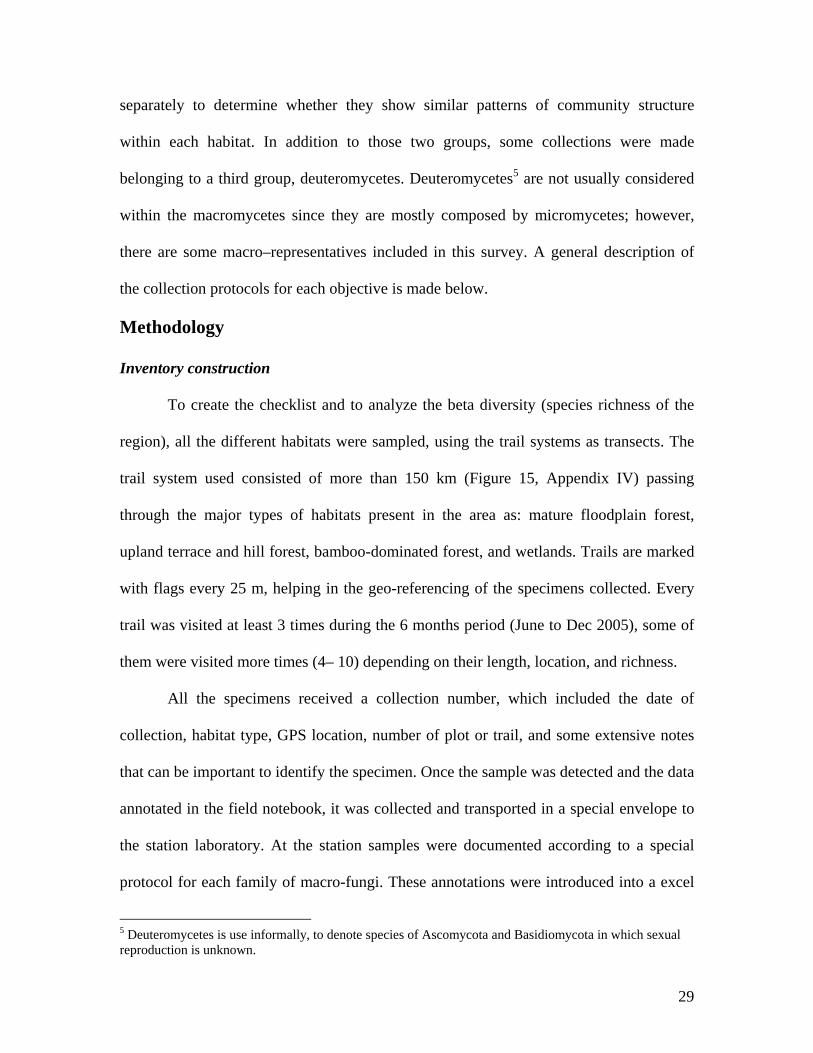
Figure 16. Field work process. A. “Los Amigos” Biological Station. B. Specimen collection. C. Field equipment. D. Trail’s tag. E. Obtaining spore prints. F. Specimen documentation. G. Specimens drying
process. H. Collection of the day waiting to be documented.
31

Diversity Analysis
For the long term plots used in the monitoring of the fungal community, the total
area sampled in each habitat was 1000 m2. The sampling area was distributed in two sub-
samples or replicates of 20 x 25 m; therefore, the sampled area in each plot was 500 m2.
The size of the sampling area was chosen according to the variability of the plant
community present in this type of forest. For very variable arborescent communities, 20
mm x 25 mm – 50 mm x 50 mm or even 100 x 100 m have been shown to be necessary
(Walting et al., 2005). The plots were located as randomly as possible, but accessibility
was taken into account (Figure 17 - 18). The plots were inventoried three times, during a
six months period, in average one time every two months during different seasons
(Table1).
Figure 17. Plot set-up. A - B. Plot delimitation using biodegradable flag - tape. C. Specimens collected in one of the plots ready to be documented and processed. D. Plot tag to avoid disturbance by other scientists
visiting the station. Each plot was GPS referenced as they were set.
32

LOCATION HABITAT DATES VISITED
PLOT 1 Trail Daniela High terrace – primary
forest
June 27
August 10
November 15
PLOT 2 Trail Daniela High terrace – primary
forest
June 25
August 11
November 15
PLOT 3 Trail Aerodromo High terrace –
secondary forest
June 29
August 14
November 24
PLOT 4 Trail Aerodromo High terrace –
secondary forest
June 29
August 14
November 24
PLOT 5 Trail Cocha Lobo Floodland – primary
forest
July 7
August 17
November 25
PLOT 6 Trail Cocha Lobo Floodland – primary
forest
July 9
August 21
November 23
Table 1. Plot location, habitat, and date of visit. Each plot was visited three times in different seasons in
order to monitor changes in the community.
33
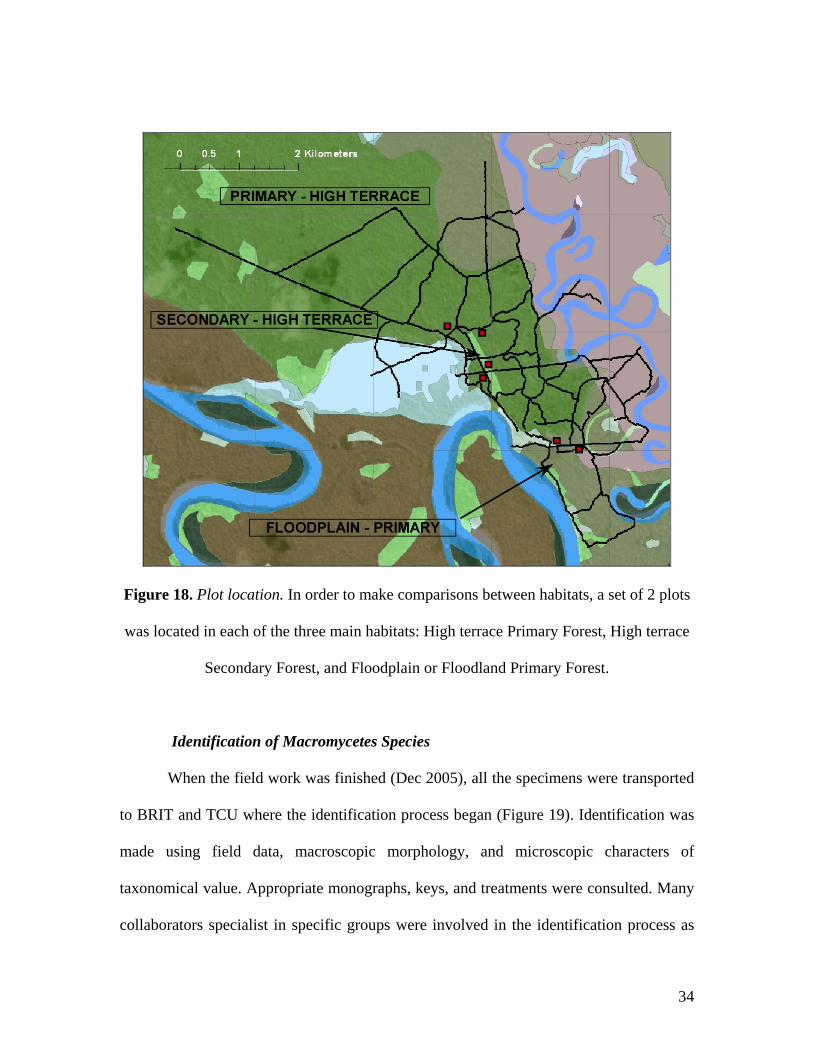
Figure 18. Plot location. In order to make comparisons between habitats, a set of 2 plots
was located in each of the three main habitats: High terrace Primary Forest, High terrace
Secondary Forest, and Floodplain or Floodland Primary Forest.
Identification of Macromycetes Species
When the field work was finished (Dec 2005), all the specimens were transported
to BRIT and TCU where the identification process began (Figure 19). Identification was
made using field data, macroscopic morphology, and microscopic characters of
taxonomical value. Appropriate monographs, keys, and treatments were consulted. Many
collaborators specialist in specific groups were involved in the identification process as
34

well as in the corroboration of the species’ identification: Thomas Læssøe, Nigel Hywel-
Jones, Clark Ovrebo, Luis Diego Gomez, and Juan Carlos Mata helped in this regard. The
collections were deposited at San Marco’s Herbarium (USM, Lima) as part of an
agreement with the National Institute of Natural Resources (INRENA) to obtain the
collection and export permits. Duplicates are deposited at BRIT Herbarium.
Systematics used
Fungi systematics is in continuously change especially with the molecular
analyses and the phylogenetic relationships that are discovered every day. Many groups
are being split, and some are being fused. The author chose a more conventional system
based more on morphological characters than in molecular affinities between species.
Nevertheless, in most of the cases, the classification dictated by the international
organization “Index Fungorum” 6 was followed. The present work does not attempt to be
a taxonomic treatment and the main purpose of classifying the species was to evaluate the
diversity and build a database that can be useful for future projects. The use of
systematics helps in the communication of the data obtained and at the same time gives
an idea of how environmental factors can affect in the same way related groups of
organisms.
6 www.indexfungorum.org
35
SAMPLE COLLECTION
FIELD DATA
RECORD DATA & SPECIMEN’S PRESERVATION
LITERATURE REVIEW
MACROSCOPIC CHARACTERS
MICROSCOPIC CHARACTERS
CHEMICAL REACTIONS
LIGHT MICROSCOPY
SEM
IDENTIFICATION
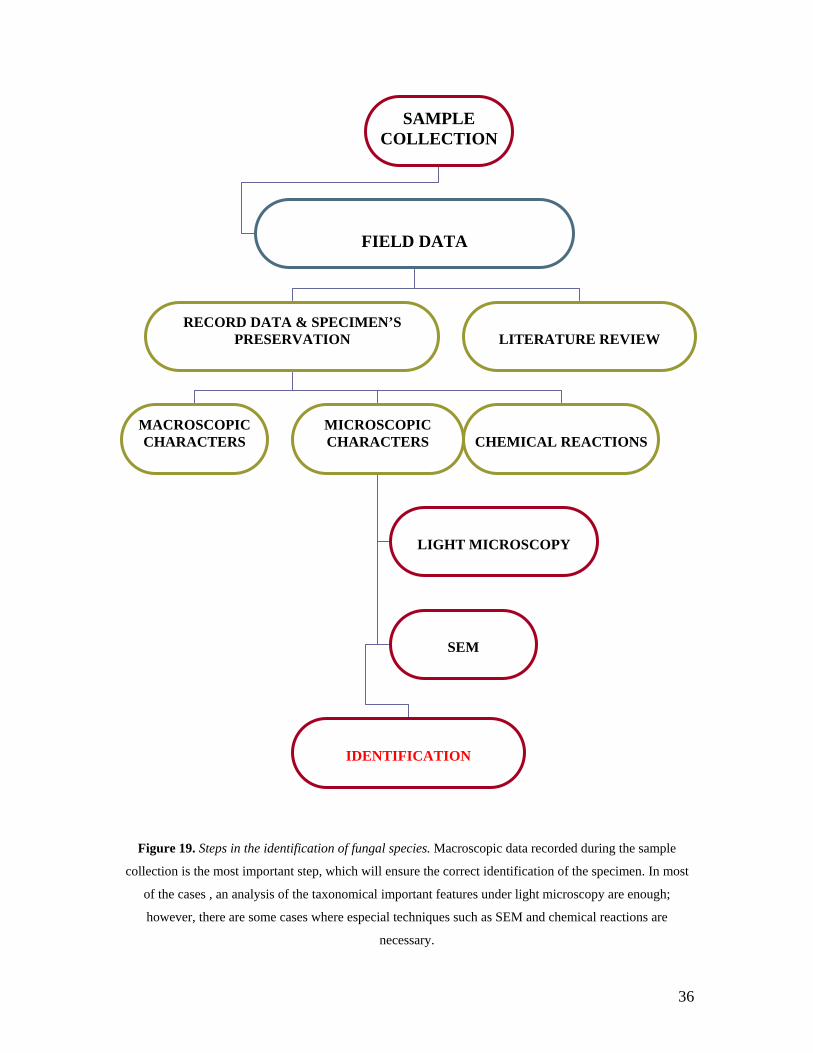
Figure 19. Steps in the identification of fungal species. Macroscopic data recorded during the sample
collection is the most important step, which will ensure the correct identification of the specimen. In most
of the cases , an analysis of the taxonomical important features under light microscopy are enough;
however, there are some cases where especial techniques such as SEM and chemical reactions are
necessary.
36
Data Analysis
The specimens collected were classified to genus or to species level when enough
literature about the group was available or when specialists could be consulted. Many
species; however, were only divided into morphospecies and used for the diversity
analyses. The data obtained from the inventory and from the classification of the
collection in morphospecies was used to analyze the beta-diversity of the area (species
richness).
Another way to think about beta diversity is to view it as a measure of the degree of
similarity or difference in species composition between sites. In other words, beta
diversity examines the degree of species turnover as one moves from habitat to habitat,
from community to community, or along any ecological gradient. The fewer species the
various sites or positions along the gradient share, the higher the beta diversity.
Sporocarps were not quantified hence only indexes that use binary data (presence and
absence) could be applied. The similarities between the fungal community of pairs of
sites were estimated using two binary indexes: Sorenson qualitative (presence – absence)
index and Jaccard index (Mueller et al., 2004). The mentioned tests were made to
compare the similarity of fungal morphotypes occurrence among sites. Both indexes have
a scale, which goes from 0 to 1. The closest to one, the more similar the communities are
in species composition.
Sorenson = C2 = 2j
(a+b)
37

Where: j = number of fungal morphotypes common to both sites.
a = the number of fungal morphotypes in site A.
b = the number of fungal morphotypes in site B.
Jaccard = JI = j
(a+b-j)
Where: j = number of fungal morphotypes common to both sites.
a = the number of fungal morphotypes in site A.
b = the number of fungal morphotypes in site B.
38

RESULTS
1. Overview of the Collection
A total of 305 macromycetes belonging primarily to Basidiomycota and Ascomycota
were collected (Table 2). Basidiomycota was the largest sample, with 224 morphospecies
representing 71% of the collections. Ascomycota presented 76 morphospecies and
contributed with 27% of the total sample. Deuteromycetes are mostly represented by
microfungi therefore only 5 (2%) were recorded.
GROUP # COLLECTIONS % COLLECTION
Ascomycota 76 27
Basidiomycota 224 71
Deuteromycetes 5 2
TOTAL 305 100 %
Table 2. Summary of the collection.
1.2 Structure of the fungal community:
1.2.1 Ascomycota composition
The Ascomycota7 represented 27% of the collection, much less than the
Basidiomycota (Table 3). Xylariaceae composed a numerically important group
represented by more than 60% of the species, indicating that they are a major component
of the Ascomycota mycoflora. Xylaria was the most representative genus, with more than
20 morphospecies. Other xylariaceous genera found in the area were Hypoxylon,
7 Only macrofungi species were collected.
39

Camillea, Daldinia, Kretzschmaria, Phylacia, and Thamnomyces. Camillea was
represented in the area by three species: C. lepreurii, C. mucronata and C. venezuelensis.
Thamnomyces was only represented by T. chordalis. Phylacia, Kretzschmaria, and
Hypoxylon did not show a great diversification in the region. Just one species from each
genus was collected.
ASCOMYCETES
Family # of Collections % of the Collection
Xylariaceae 49 64 %
Clavicipitaceae 22 28 %
Sarcoscyphaceae 3 4 %
Pyrenotemataceae 2 3 %
TOTAL 76 100 %
Table 3. Ascomycota’s family composition.
The Clavicipitaceae, an arthropod-pathogen group, was the second family that
showed more representatives within the Ascomycota. Cordyceps had most diversity.
Fifteen species of Cordyceps were found, among them C. australis and C. amazonica
were the most abundant. Hypocrella and Torrubiella are two clavicipitaceous fungi also
collected in the area, but only one species from each one was recorded. Ten
morphospecies of anamorphic entomopathogenic fungi were found belonging to the
following genera: Aschersonia, Akanthomyces, Paecilomyces (Isaria), Hymenostilbe, and
40
Beauveria. Paecilomyces tenuipes was by far the most commonly found species,
especially growing on lepidopteran pupae.
1.2.2 Basidiomycota composition
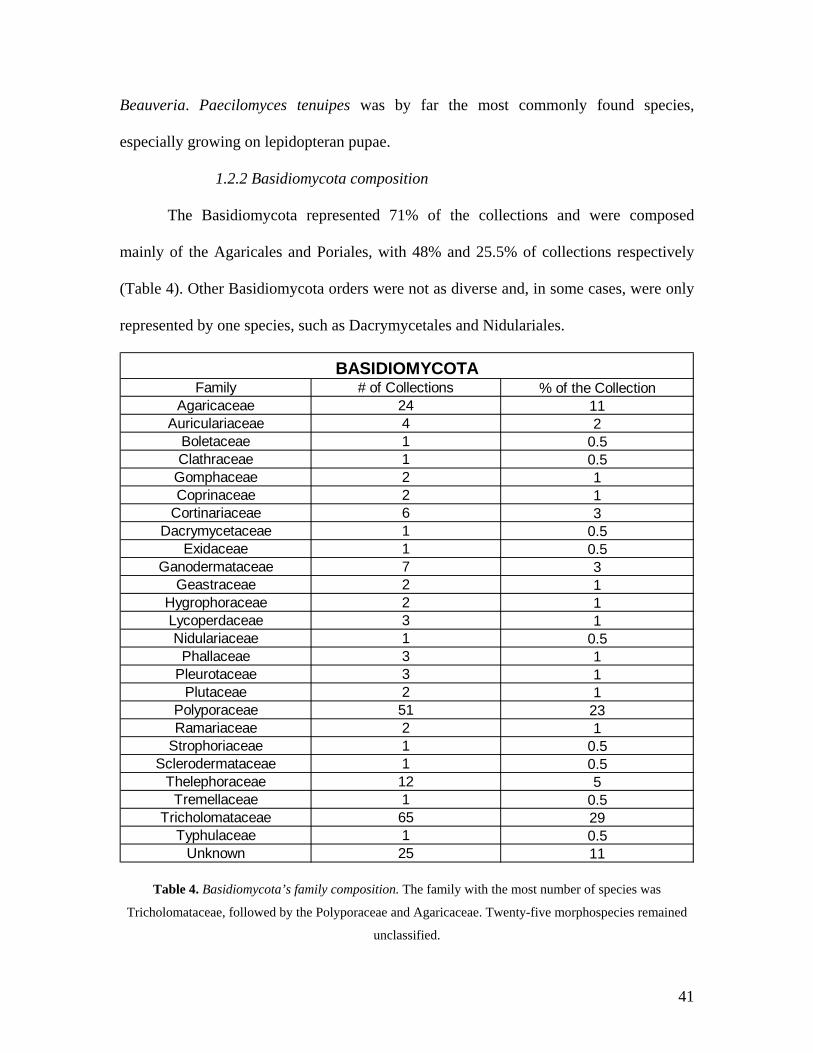
The Basidiomycota represented 71% of the collections and were composed
mainly of the Agaricales and Poriales, with 48% and 25.5% of collections respectively
(Table 4). Other Basidiomycota orders were not as diverse and, in some cases, were only
represented by one species, such as Dacrymycetales and Nidulariales.
Family # of Collections % of the CollectionAgaricaceae 24 11
Auriculariaceae 4 2Boletaceae 1 0.5Clathraceae 1 0.5
Gomphaceae 2 1Coprinaceae 2 1
Cortinariaceae 6 3Dacrymycetaceae 1 0.5
Exidaceae 1 0.5Ganodermataceae 7 3
Geastraceae 2 1Hygrophoraceae 2 1Lycoperdaceae 3 1Nidulariaceae 1 0.5
Phallaceae 3 1Pleurotaceae 3 1
Plutaceae 2 1Polyporaceae 51 23Ramariaceae 2 1
Strophoriaceae 1 0.5Sclerodermataceae 1 0.5
Thelephoraceae 12 5Tremellaceae 1 0.5
Tricholomataceae 65 29Typhulaceae 1 0.5
Unknown 25 11
BASIDIOMYCOTA
Table 4. Basidiomycota’s family composition. The family with the most number of species was
Tricholomataceae, followed by the Polyporaceae and Agaricaceae. Twenty-five morphospecies remained
unclassified.
41
The Poriales (Polyporaceae sensu lato), which constituted 25% of the
Basidiomycota, also showed a common neotropical composition. The majority presented
a saprobic habit as wood decayers. Nevertheless, some species were collected apparently
growing on living trees. Two families belonging to this order were found in the area8:
Ganodermataceae and Polyporaceae. Polyporaceae had more representatives and was
more abundant, with Polyporus tricholoma and Favolus brasiliensis as the most common
species. Ganodermataceae was represented by 7 species: Ganoderma applanatum, G.
lucidum and Amauroderma trichodermatum among others unidentified morphospecies.
The first two species are wood-decayers, and the last one was collected growing on soil
but its rhizomorphs were probably connected underground to a wood source. Boletales
was neither abundant nor diverse in the study area. There was only two species collected
from this order: Gyrodon exiguus, a saprobe and Scleroderma sinnamariensis9, a
mycorrhizal species. The latter was the only mycorrhizal fungi found in the area. The
Phallales was composed by two families: Geastraceae and Phallaceae. Phallaceae was
represented by four genera: Mutinus (=Xylophallus), Phallus, Staheliomyces and
Pseudocolus.
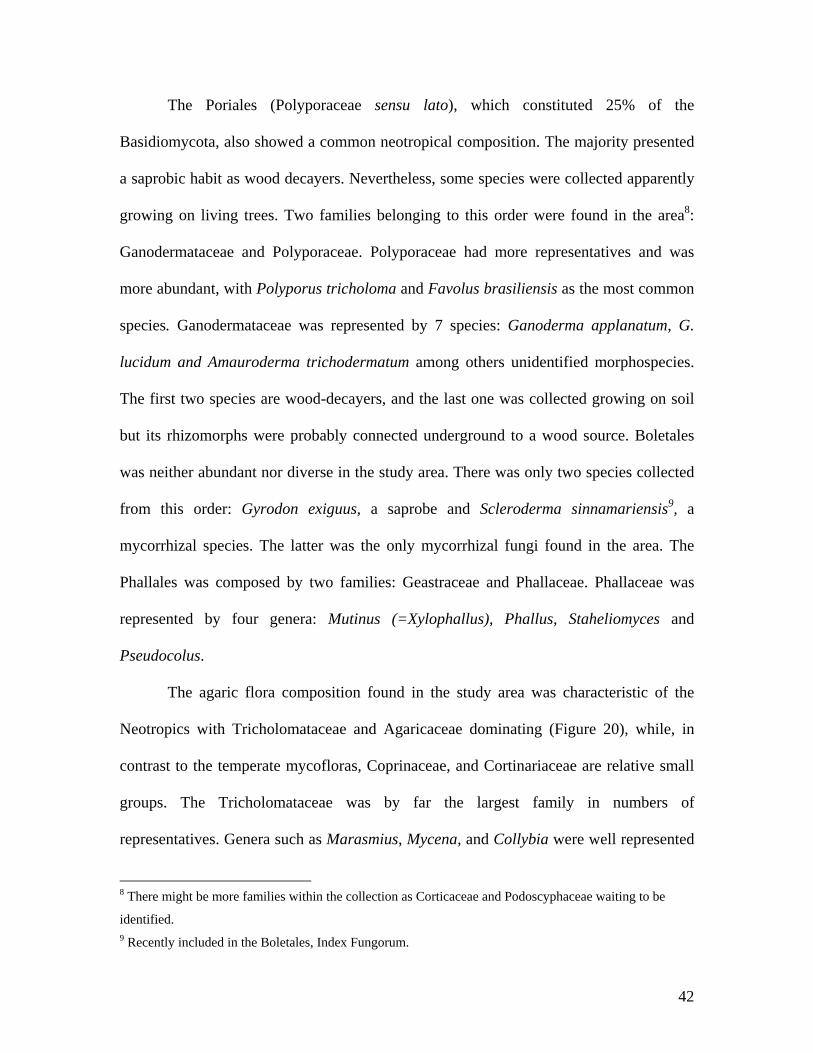
The agaric flora composition found in the study area was characteristic of the
Neotropics with Tricholomataceae and Agaricaceae dominating (Figure 20), while, in
contrast to the temperate mycofloras, Coprinaceae, and Cortinariaceae are relative small
groups. The Tricholomataceae was by far the largest family in numbers of
representatives. Genera such as Marasmius, Mycena, and Collybia were well represented
8 There might be more families within the collection as Corticaceae and Podoscyphaceae waiting to be
identified. 9 Recently included in the Boletales, Index Fungorum.
42
by many species. Some rare species were also reported, such as Calocybe cyaenella,
which was only collected two times during the survey. On the other hand, some species
showed to be abundant and very widely spread within the area, such as Coprinus
disseminatus and some foliicolous species of Marasmius, such as M. cladophyllus, M.
haematocephalus, and M. rotuloides.
Agaricales Composition - 2005
23%
61%
2%
6%
1%
2%
3%2%
Agaricaceae
Coprinaceae
Cortinariaceae
Strophariaceae
Hygrophoraceae
Pleurotaceae
Plutaceae
Tricholomataceae
Figure 20. Agaricales family composition at “Los Amigos” – 2005 (N = 105). Like in most of the
neotropical areas, the order Agaricales was mostly composed by the Tricholomataceae, representing 61%,
followed by the Agaricaceae family with 23%.
2. Substratum preference
The majority of morphospecies (88.5 %) was only found growing on one type of
substratum (Figure 21), 11.1% in two different types of substrata and just 0.4% of the
morphospecies were collected in 3 different types of substrata. From the 305
morphospecies collected, the majority were found inhabiting the following substratum
43

categories: 46% logs; 20% branches; 20% leaves; 17 % soil (probably the rhyzomorphs
some of these fungi were connected to a woody source); 10% leaves; and 9% insects.
Substratum Preference
LOGS - BRANCHES & TWIGS0.34% BRANCHES
11.49%TWIGS3.38%LEAVES
6.42%LOGS & BRANCHES
5.07%
FRUITS0.68%
INSECTS9.12%
DUNG0.34%
BRANCHES & TWIGS2.70%
LEAVES & TWIGS2.70%
SOIL16.55%
SEED0.34% SOIL & LOGS
0.68%
LOGS37.50%
BURIED LOGS2.70%
Figure 21. Substratum preference distribution (N = 305). The majorities of species presented a saprobe
habit and were found growing on just one substratum: logs (37.5%), soil (16.5%), and branches (11.5%).
Less that 1% of the collection inhabited three different substrates.
3. Identified species:
One hundred and thirteen species were identified, 70 belonging to the
Basidiomycota, 40 to the Ascomycota, and 3 to the Deuteromycetes. Some of these
identified species are considered new records for the area, for the country, and even for
the continent. Forty eight species are new records for the country including:
44

Paecilomyces lilacinus, Paecilomyces tenuipes, Camarops aff. scleroderma, Xylaria
cubensis, Thamnomyces chordalis, Mutinus xylogenus and Hygrocybe miniata. One of
the species collected, Pseudocolus fusiformis, was recorded for the first time in South
America (Gazis & Gomez, 2006).
For the complete list of identified species and the ones that constitute new reports for
Peru, see Appendix 1.
4. Plot analysis
4.1 Individual Plot analysis
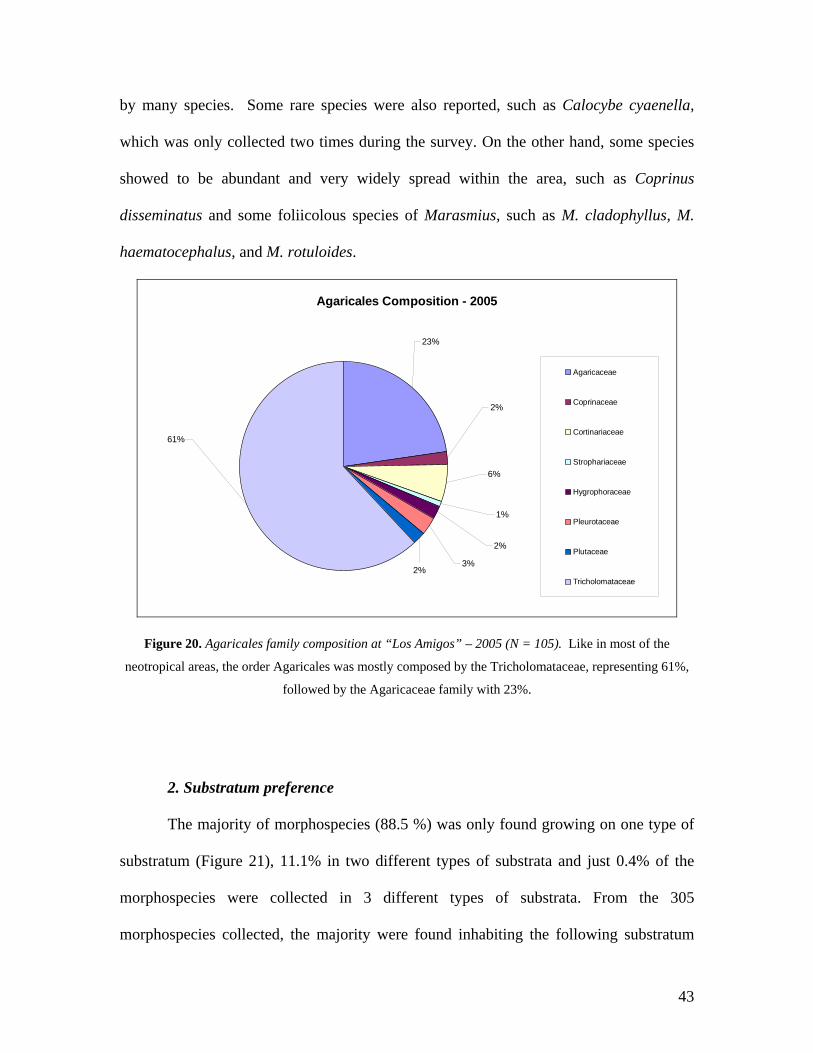
a. Plot 1 – high terrace primary forest I
The first sampling was conducted on June 28, 2005, a month when the total
precipitation recorded was 217.6 mm. The number of morphospecies collected was 46.
The community was mainly composed by Tricholomataceae (21%) and Polyporaceae
(22%) followed by Xylariaceae (20%). The second sampling was conducted on August
10, 2005, a month when the total precipitation suffered a drop to 78.4 mm. The number
of morphospecies collected at this time dropped as well to 11. The community was again
mainly composed by Polyporaceae and Tricholomataceae. Marasmius nigrobrunneus
was also collected in the first sampling, which suggest its adaptation two lower humid
conditions. The third and last sampling was conducted on November 15, 2005, a month
when the total precipitation increased to 191.4 mm; in addition, the previous month
(October) presented the highest amount of precipitation (333.4 mm) contributing to the
45
soil’s moisture. During this sampling 32 morphospecies were collected, and the
community was primarily composed by Tricholomataceae. This time, Polyporaceae and
Xylariaceae showed much less representatives counting with five species in each family.
Just one from the 69 morphospecies was present during the three samplings dates:
Mycena sp.
Xylariaceae 9 20% 0 0% 5 16%Clavicipitaceae 4 9% 0 0% 0 0%
Agaricaceae 4 9% 1 9% 2 6%Tricholomataceae 10 21% 3 3% 17 53%
Polyporaceae 10 22% 5 46% 5 16%Pyronemataceae 1 2% 0 0% 0 0%Thelephoraceae 1 2% 0 0% 1 3%
Tremellaceae 1 2% 0 0% 0 0%Agaricales 3 7% 2 18% 1 0%
Ganodermataceae 1 2% 0 0% 0 0%Auriculariaceae 2 4% 0 0% 1 3%
TOTAL 46 100% 11 100% 32 100%
1 2Taxon Samplings
3
MACROFUNGI COMPOSITION OF PLOT - 1
Table 5. Macrofungi composition – PLOT-1.
The following summary can be obtained from the plot’s monitoring during 3 different
seasons:
- There was just one species collected in the three samplings: Mycena sp. (P1_45)
showing its ability to fructify during the year. This species presented a foliicolous habit
and belongs to the Tricholomataceae.
- Some species recorded on the first sampling date were not found during the second
collecting date and later reappeared during the third sampling. The latter pattern
suggested that these species are probably conditioned to the quantity of rainfall and have
a constricted range of optimal humidity conditions that allowed them to fructify. Fourteen
46
morphospecies present in the first sampling were also collected during the third sampling,
mainly Xylariaceae and Tricholomataceae. Some of the species collected at the first and
third sampling are: Auricularia fuscosuccinea, Leucocoprinus bimbaumii, Marasmiellus
nigripes, Marasmius crinis-equis, and M. cladophyllus, suggesting their need of high
levels of humidity to fructify.
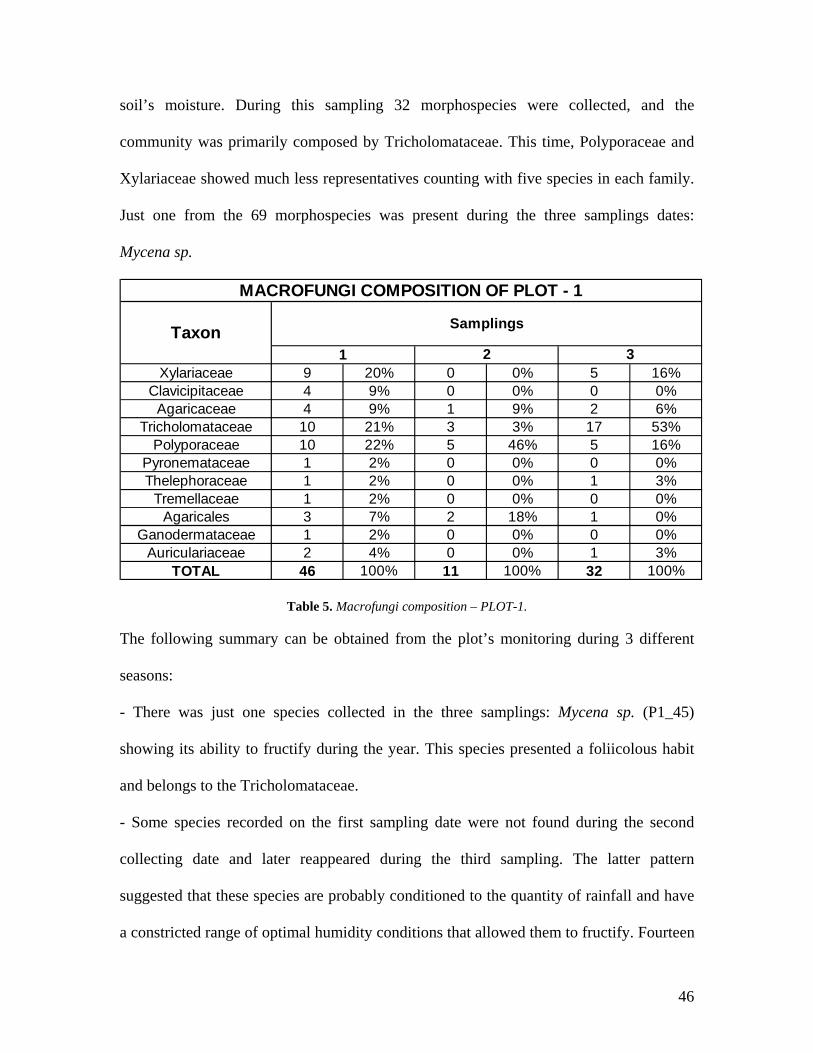
- A total of 69 morphospecies were collected in the 1000 m2 during the three samplings.
Macromycetes Diversity vs. Precipitation
The number of morphospecies strongly decreased (from 46 to 11) with the dropped of
precipitation and increased again when it rose (from 11 to 31) (Figure 22).
Macromycetes Diversity vs. Precipitation - PLOT 1
0.0
50.0
100.0
150.0
200.0
250.0
300.0
350.0
400.0
May June July August September October November December0
5
10
15
20
25
30
35
40
45
50
Precipitation Number of morphspecies
1 st
sampling.
2 nd
sampling.
3 rd
sampling.
mm3 No
Figure 22. Diversity changes vs. precipitation – PLOT 1. The diversity of macromycetes dropped
drastically as the precipitation diminished. In the third sampling the diversity increased as well as the
precipitation. Notice that October is the month with highest precipitation which could contribute to the
soil’s humidity and to the increase of fructification.
47
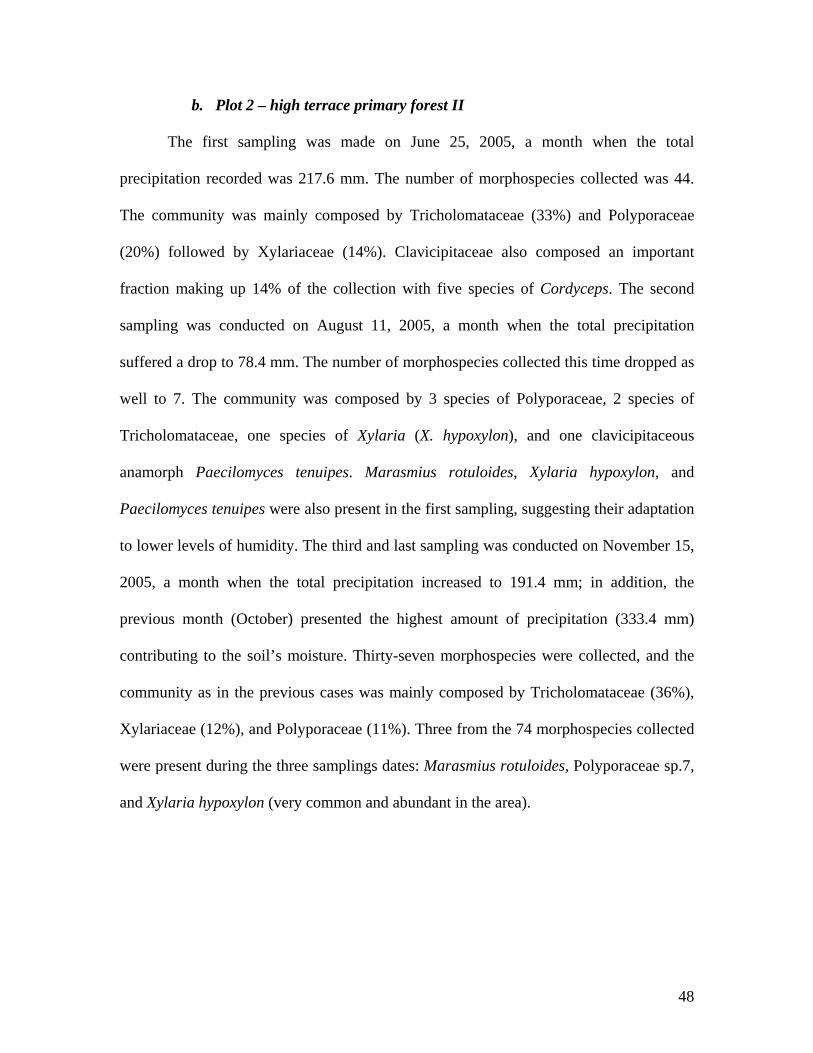
b. Plot 2 – high terrace primary forest II
The first sampling was made on June 25, 2005, a month when the total
precipitation recorded was 217.6 mm. The number of morphospecies collected was 44.
The community was mainly composed by Tricholomataceae (33%) and Polyporaceae
(20%) followed by Xylariaceae (14%). Clavicipitaceae also composed an important
fraction making up 14% of the collection with five species of Cordyceps. The second
sampling was conducted on August 11, 2005, a month when the total precipitation
suffered a drop to 78.4 mm. The number of morphospecies collected this time dropped as
well to 7. The community was composed by 3 species of Polyporaceae, 2 species of
Tricholomataceae, one species of Xylaria (X. hypoxylon), and one clavicipitaceous
anamorph Paecilomyces tenuipes. Marasmius rotuloides, Xylaria hypoxylon, and
Paecilomyces tenuipes were also present in the first sampling, suggesting their adaptation
to lower levels of humidity. The third and last sampling was conducted on November 15,
2005, a month when the total precipitation increased to 191.4 mm; in addition, the
previous month (October) presented the highest amount of precipitation (333.4 mm)
contributing to the soil’s moisture. Thirty-seven morphospecies were collected, and the
community as in the previous cases was mainly composed by Tricholomataceae (36%),
Xylariaceae (12%), and Polyporaceae (11%). Three from the 74 morphospecies collected
were present during the three samplings dates: Marasmius rotuloides, Polyporaceae sp.7,
and Xylaria hypoxylon (very common and abundant in the area).
48

Xylariaceae 7 16% 1 14% 6 16%Pezizales 1 2% 0 0% 1 3%Agaricales 0 0% 0 0% 3 8%
Cortinariaceae 0 0% 1 14% 1 3%Agaricaceae 1 2% 0 0% 2 5%
Tricholomataceae 14 33% 1 14% 13 36%Psathyrellaceae 0 0% 0 0% 2 5%Polyporaceae 9 20% 3 44% 4 11%
Thelephoraceae 3 7% 0 0% 2 5%Ganodermataceae 0 0% 0 0% 2 5%
Pluteaceae 0 0% 0 0% 1 3%Clavicipitaceae 6 14% 1 14% 0 0%Tremellaceae 1 2% 0 0% 0 0%
Lycoperdaceae 1 2% 0 0% 0 0%Geastraceae 1 2% 0 0% 0 0%
TOTAL 44 100% 7 100% 37 100%
Taxon SamplingsMACROFUNGI COMPOSITION PLOT - 2
1 2 3
Table 6. Macrofungi composition PLOT 2.
The following summary can be obtained from the plot’s monitoring during 3 different
seasons:
- Marasmius rotuloides and Xylaria hypoxylon were two species collected in the three
sampling dates, showing their ability to fructify along different seasons. Both are very
common and abundant species in the area.
- Some species recorded in the first sampling date were not found during the second
collecting date and later reappeared during the third sampling. The latter pattern
suggested that these species are conditioned to the quantity of rainfall and have a
constricted range of optimal humidity conditions that allowed them to fructify. Some
examples of species that were found fructifying in the first sampling and then reappeared
at the third sampling were: Marasmiellus nigripes, Xylaria telfairii, and Marasmiellus
sp.1, suggesting their need for more humidity in order to fructify.
49
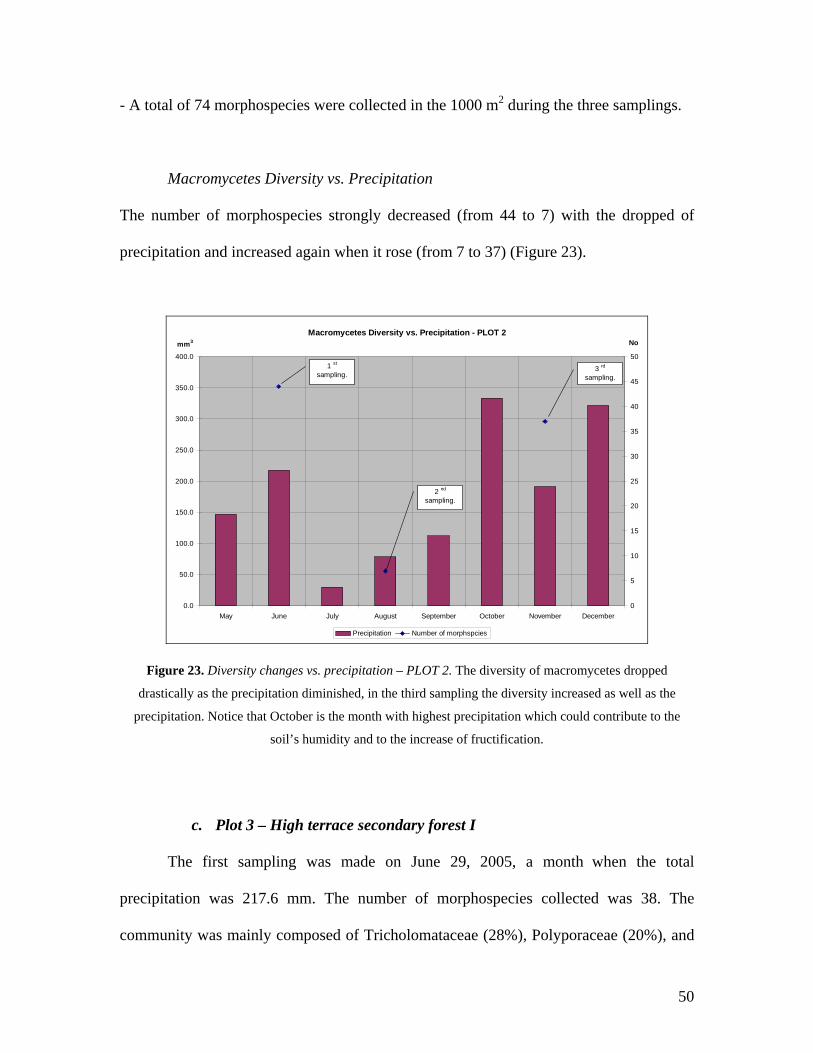
- A total of 74 morphospecies were collected in the 1000 m2 during the three samplings.
Macromycetes Diversity vs. Precipitation
The number of morphospecies strongly decreased (from 44 to 7) with the dropped of
precipitation and increased again when it rose (from 7 to 37) (Figure 23).
Macromycetes Diversity vs. Precipitation - PLOT 2
0.0
50.0
100.0
150.0
200.0
250.0
300.0
350.0
400.0
May June July August September October November December0
5
10
15
20
25
30
35
40
45
50
Precipitation Number of morphspcies
1 st
sampling.
2 nd
sampling.
3 rd
sampling.
mm3 No
Figure 23. Diversity changes vs. precipitation – PLOT 2. The diversity of macromycetes dropped
drastically as the precipitation diminished, in the third sampling the diversity increased as well as the
precipitation. Notice that October is the month with highest precipitation which could contribute to the
soil’s humidity and to the increase of fructification.
c. Plot 3 – High terrace secondary forest I
The first sampling was made on June 29, 2005, a month when the total
precipitation was 217.6 mm. The number of morphospecies collected was 38. The
community was mainly composed of Tricholomataceae (28%), Polyporaceae (20%), and
50

Xylariaceae (18%). The second sampling was conducted on August 14, 2005, a month
when the total precipitation suffered a drop to 78.4 mm. The number of morphospecies
collected this time dropped as well to 16. The community was again composed mainly by
three groups: Polyporaceae (30%), Xylariaceae (19%), and Tricholomataceae (13%).
Eight of the 38 species collected in the first sampling were found again in the second
sampling, showing their adaptation to lower humidity. The third and last sampling was
done on November 24, 2005, a month when the total precipitation increased to 191.4 mm;
in addition, the previous month (October) presented the highest precipitation rate (333.4
mm) contributing to the soil’s moisture. Thirty morphospecies were collected, and the
community as in the previous cases was composed by Tricholomataceae (74%),
Xylariaceae (13%), and Polyporaceae (13%). Just one from the 68 morphospecies overall
collected was present during the three samplings dates: Kretszchamaria clavus.
Xylariaceae 7 18% 3 19% 4 13%Clavicipitaceae 4 11% 2 13% 0 0%
Agaricaceae 2 5% 0 0% 0 0%Tricholomataceae 11 28% 2 13% 22 74%
Polyporaceae 8 20% 5 30% 4 13%Pezizales 1 3% 0 0% 0 0%
Thelephoraceae 1 3% 2 13% 0 0%Geastraceae 1 3% 0 0% 0 0%Pleurotaceae 1 3% 0 0% 0 0%
Ganodermataceae 1 3% 1 6% 0 0%Phallaceae 1 3% 0 0% 0 0%
Lycoperdacee 0 0% 1 6% 0 0%TOTAL 38 100% 16 100% 30 100%
Taxon 1 2 3
MACROFUNGI COMPOSITION PLOT 3Samplings
Table 7. Macrofungi composition – PLOT 3.
51
The following summary can be obtained from the plot’s monitoring during 3 different
seasons:
- Kretszchamaria clavus was the only species collected in the three samplings, showing
the ability to fructify along the year, although it can be a slow grower.
- Some species recorded in the first sampling date were not found during the second
collecting date, and later reappeared during the third sampling. The latter pattern
suggested that these species are probably conditioned to the quantity of rainfall and have
a constricted range of optimal humidity conditions that allowed them to fructify. Some
examples of species that were found fructifying in the first sampling and then reappeared
at the third sampling were: Marasmiellus nigripes, Marasmius rotuloides, and Marasmius
cladophyllus suggesting their need for more humidity in order to fructify.
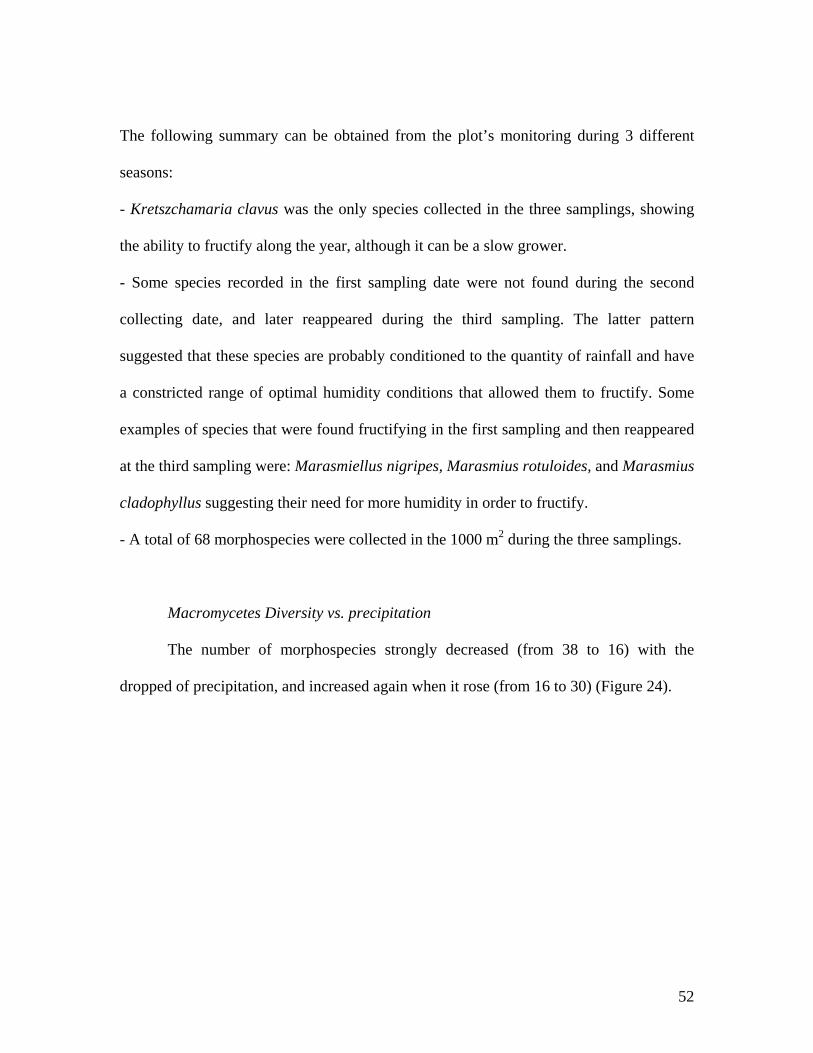
- A total of 68 morphospecies were collected in the 1000 m2 during the three samplings.
Macromycetes Diversity vs. precipitation
The number of morphospecies strongly decreased (from 38 to 16) with the
dropped of precipitation, and increased again when it rose (from 16 to 30) (Figure 24).
52
Macromycetes Diversity vs. Precipitation - PLOT 3
0.0
50.0
100.0
150.0
200.0
250.0
300.0
350.0
400.0
May June July August September October November December0
5
10
15
20
25
30
35
40
Precipitation Number of morphspecies
1 st
sampling.
2 nd
sampling.
3 rd
sampling.
mm3 No
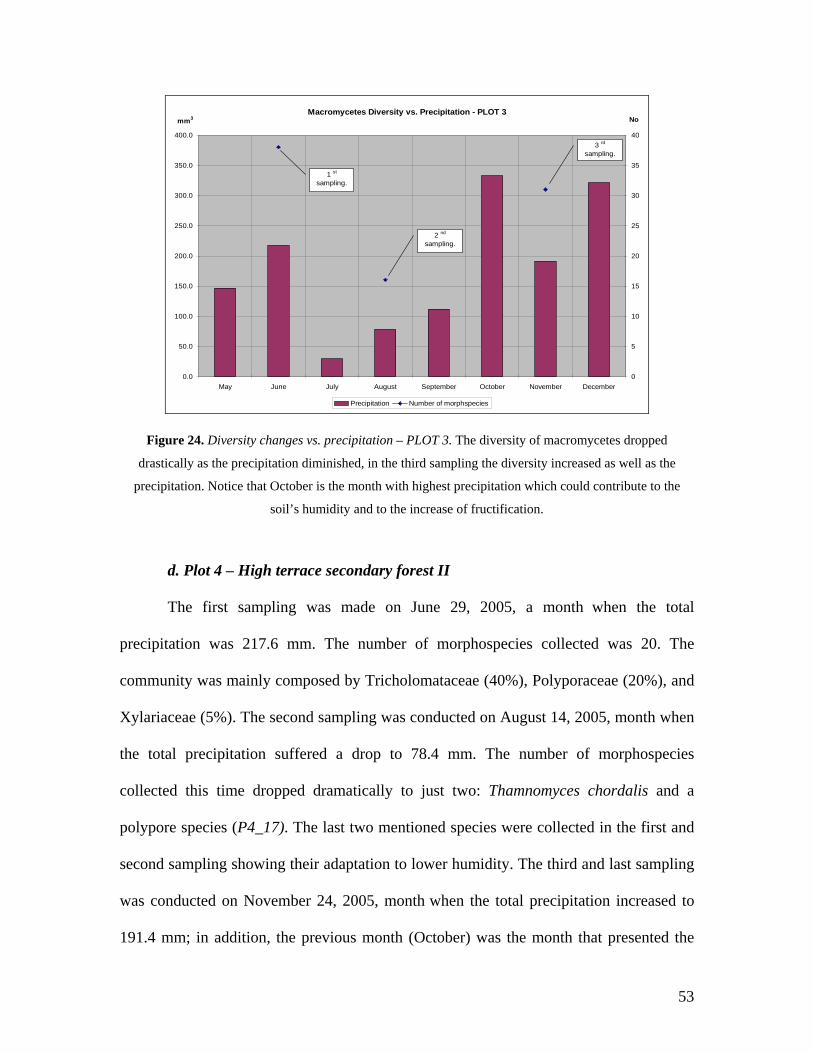
Figure 24. Diversity changes vs. precipitation – PLOT 3. The diversity of macromycetes dropped
drastically as the precipitation diminished, in the third sampling the diversity increased as well as the
precipitation. Notice that October is the month with highest precipitation which could contribute to the
soil’s humidity and to the increase of fructification.
d. Plot 4 – High terrace secondary forest II
The first sampling was made on June 29, 2005, a month when the total
precipitation was 217.6 mm. The number of morphospecies collected was 20. The
community was mainly composed by Tricholomataceae (40%), Polyporaceae (20%), and
Xylariaceae (5%). The second sampling was conducted on August 14, 2005, month when
the total precipitation suffered a drop to 78.4 mm. The number of morphospecies
collected this time dropped dramatically to just two: Thamnomyces chordalis and a
polypore species (P4_17). The last two mentioned species were collected in the first and
second sampling showing their adaptation to lower humidity. The third and last sampling
was conducted on November 24, 2005, month when the total precipitation increased to
191.4 mm; in addition, the previous month (October) was the month that presented the
53
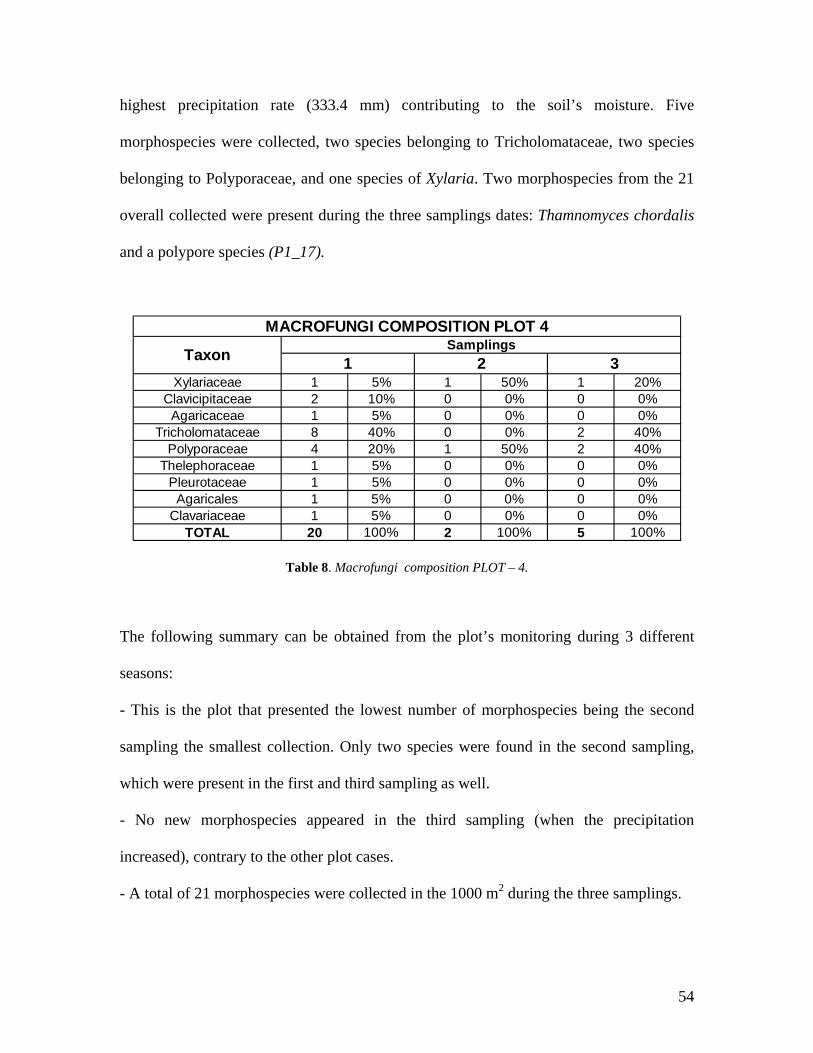
highest precipitation rate (333.4 mm) contributing to the soil’s moisture. Five
morphospecies were collected, two species belonging to Tricholomataceae, two species
belonging to Polyporaceae, and one species of Xylaria. Two morphospecies from the 21
overall collected were present during the three samplings dates: Thamnomyces chordalis
and a polypore species (P1_17).
Xylariaceae 1 5% 1 50% 1 20%Clavicipitaceae 2 10% 0 0% 0 0%
Agaricaceae 1 5% 0 0% 0 0%Tricholomataceae 8 40% 0 0% 2 40%
Polyporaceae 4 20% 1 50% 2 40%Thelephoraceae 1 5% 0 0% 0 0%
Pleurotaceae 1 5% 0 0% 0 0%Agaricales 1 5% 0 0% 0 0%
Clavariaceae 1 5% 0 0% 0 0%TOTAL 20 100% 2 100% 5 100%
MACROFUNGI COMPOSITION PLOT 4
Taxon Samplings1 2 3
Table 8. Macrofungi composition PLOT – 4.
The following summary can be obtained from the plot’s monitoring during 3 different
seasons:
- This is the plot that presented the lowest number of morphospecies being the second
sampling the smallest collection. Only two species were found in the second sampling,
which were present in the first and third sampling as well.
- No new morphospecies appeared in the third sampling (when the precipitation
increased), contrary to the other plot cases.
- A total of 21 morphospecies were collected in the 1000 m2 during the three samplings.
54

Macromycetes Diversity vs. precipitation
The number of morphospecies strongly decreased (from 20 to 2) with the dropped
of precipitation and had a small increase (from 2 to 5) when it rose (Figure 25).
Macrodiversity vs. Precipitation - PLOT4
0.0
50.0
100.0
150.0
200.0
250.0
300.0
350.0
400.0
May June July August September October November December0
5
10
15
20
25
Precipitation Number of morphspecies
1 st
sampling.
2 nd
sampling.
3 rd
sampling.
mm3 No
Figure 25. Diversity changes vs. precipitation – PLOT 4. The diversity of macromycetes dropped
drastically as the precipitation diminished, in the third sampling the diversity recovered with the increase of
precipitation. Notice that October is the month with highest precipitation which could contribute to the
soil’s humidity and to the increase of fructification.
e. Plot 5 – floodland primary forest I
The first sampling was made on July 7, 2005, a month when the total precipitation
was 29.9 mm. The number of morphospecies collected was 34. The community was
mainly composed by Tricholomataceae (34%), Xylariaceae (21%), and Polyporaceae
(18%). The second sampling was conducted on August 17, 2005, a month when the total
precipitation suffered a drop to 78.4 mm. The number of morphospecies collected this
time dropped to 25 morphospecies. The composition was led by Xylariaceae (32%),
55
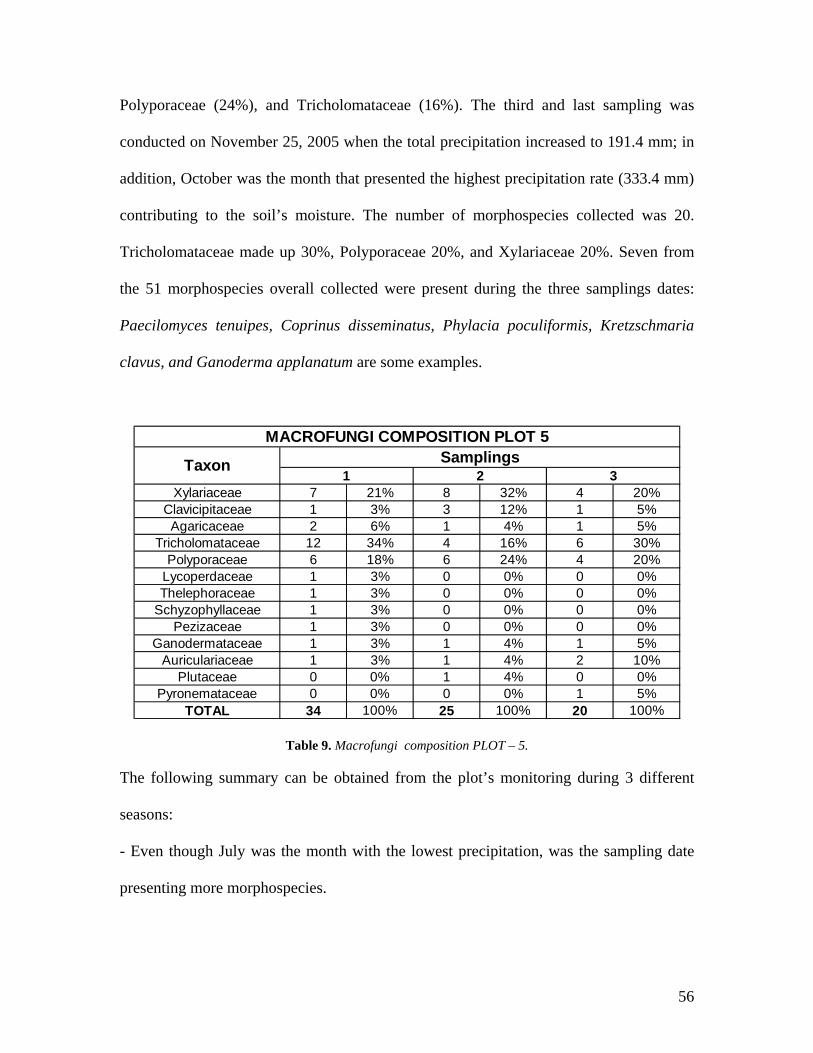
Polyporaceae (24%), and Tricholomataceae (16%). The third and last sampling was
conducted on November 25, 2005 when the total precipitation increased to 191.4 mm; in
addition, October was the month that presented the highest precipitation rate (333.4 mm)
contributing to the soil’s moisture. The number of morphospecies collected was 20.
Tricholomataceae made up 30%, Polyporaceae 20%, and Xylariaceae 20%. Seven from
the 51 morphospecies overall collected were present during the three samplings dates:
Paecilomyces tenuipes, Coprinus disseminatus, Phylacia poculiformis, Kretzschmaria
clavus, and Ganoderma applanatum are some examples.
Xylariaceae 7 21% 8 32% 4 20%Clavicipitaceae 1 3% 3 12% 1 5%Agaricaceae 2 6% 1 4% 1 5%
Tricholomataceae 12 34% 4 16% 6 30%Polyporaceae 6 18% 6 24% 4 20%
Lycoperdaceae 1 3% 0 0% 0 0%Thelephoraceae 1 3% 0 0% 0 0%
Schyzophyllaceae 1 3% 0 0% 0 0%Pezizaceae 1 3% 0 0% 0 0%
Ganodermataceae 1 3% 1 4% 1 5%Auriculariaceae 1 3% 1 4% 2 10%
Plutaceae 0 0% 1 4% 0 0%Pyronemataceae 0 0% 0 0% 1 5%
TOTAL 34 100% 25 100% 20 100%
SamplingsTaxon
MACROFUNGI COMPOSITION PLOT 5
1 2 3
Table 9. Macrofungi composition PLOT – 5.
The following summary can be obtained from the plot’s monitoring during 3 different
seasons:
- Even though July was the month with the lowest precipitation, was the sampling date
presenting more morphospecies.
56
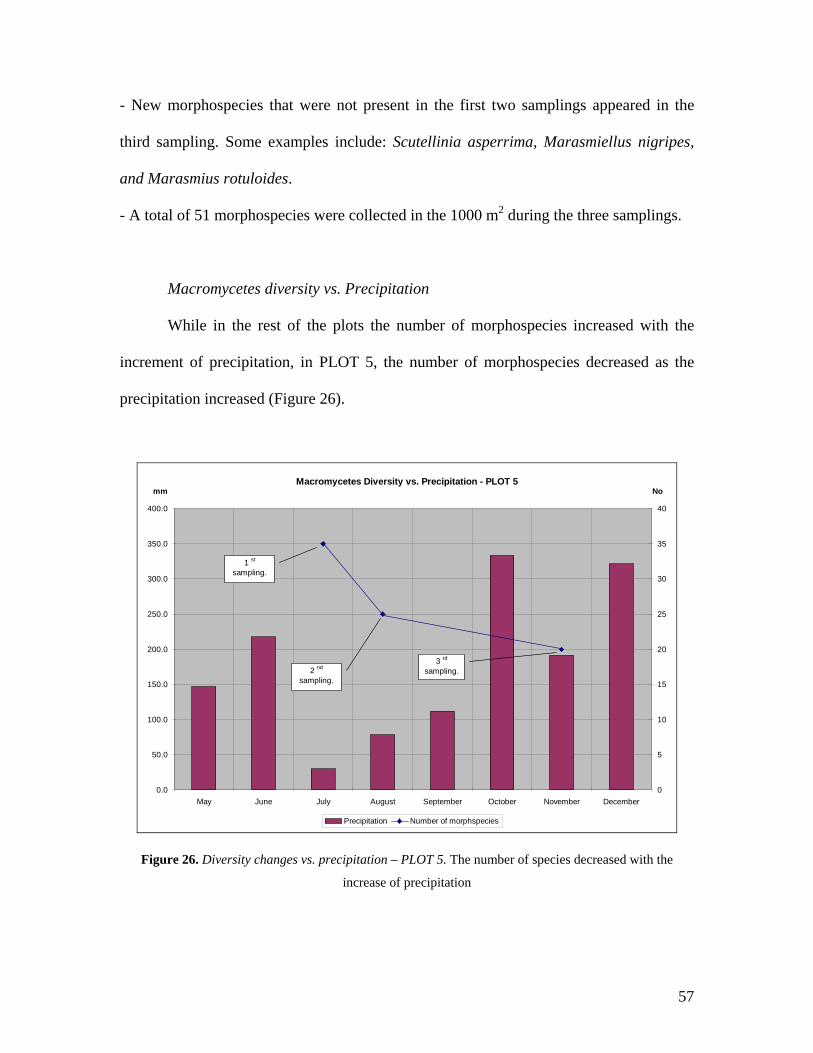
- New morphospecies that were not present in the first two samplings appeared in the
third sampling. Some examples include: Scutellinia asperrima, Marasmiellus nigripes,
and Marasmius rotuloides.
- A total of 51 morphospecies were collected in the 1000 m2 during the three samplings.
Macromycetes diversity vs. Precipitation
While in the rest of the plots the number of morphospecies increased with the
increment of precipitation, in PLOT 5, the number of morphospecies decreased as the
precipitation increased (Figure 26).
Macromycetes Diversity vs. Precipitation - PLOT 5
0.0
50.0
100.0
150.0
200.0
250.0
300.0
350.0
400.0
May June July August September October November December0
5
10
15
20
25
30
35
40
Precipitation Number of morphspecies
1 st
sampling.
2 nd
sampling.
3 rd
sampling.
mm3
No
Figure 26. Diversity changes vs. precipitation – PLOT 5. The number of species decreased with the
increase of precipitation
57
f. Plot 6 – floodland primary forest II
The first sampling was made on July 9, 2005, a month when the total precipitation
was 29.9 mm. The number of morphospecies collected was 45. The community was
mainly composed by Tricholomataceae (25%), Xylariaceae (25%), and Polyporaceae
(15%). The second sampling was conducted on August 21, 2005, month when the total
precipitation suffered a drop to 78.4 mm. The number of morphospecies collected this
time dropped strongly to 17 morphospecies. The composition was led by Polyporaceae
(28%), Xylariaceae (24%), and Tricholomataceae (18%). The third and last sampling was
conducted on November 23, 2005, month when the total precipitation increased to 191.4
mm; in addition the previous month (October) presented the highest precipitation rate
(333.4 mm) contributing to the soil’s moisture. The number of morphospecies collected
was 22. Tricholomataceae made up 44%, Polyporaceae 14%, and Xylariaceae 28%.
Three from the 58 morphospecies overall collected were present during the three
samplings dates: Kretszchamaria clavus, Xylaria sp.4 (P6_34), and Polyporaceae sp.3
(P6_30).
58
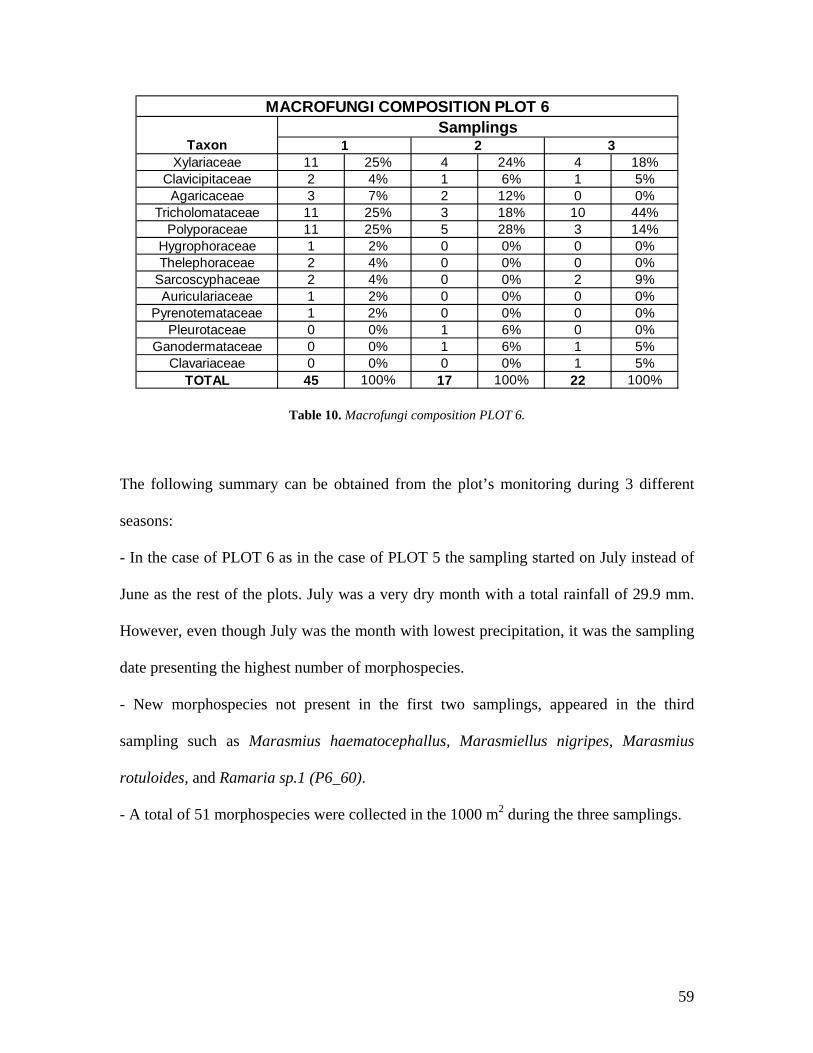
Xylariaceae 11 25% 4 24% 4 18%Clavicipitaceae 2 4% 1 6% 1 5%
Agaricaceae 3 7% 2 12% 0 0%Tricholomataceae 11 25% 3 18% 10 44%
Polyporaceae 11 25% 5 28% 3 14%Hygrophoraceae 1 2% 0 0% 0 0%Thelephoraceae 2 4% 0 0% 0 0%
Sarcoscyphaceae 2 4% 0 0% 2 9%Auriculariaceae 1 2% 0 0% 0 0%
Pyrenotemataceae 1 2% 0 0% 0 0%Pleurotaceae 0 0% 1 6% 0 0%
Ganodermataceae 0 0% 1 6% 1 5%Clavariaceae 0 0% 0 0% 1 5%
TOTAL 45 100% 17 100% 22 100%
TaxonSamplings
MACROFUNGI COMPOSITION PLOT 6
1 2 3
Table 10. Macrofungi composition PLOT 6.
The following summary can be obtained from the plot’s monitoring during 3 different
seasons:
- In the case of PLOT 6 as in the case of PLOT 5 the sampling started on July instead of
June as the rest of the plots. July was a very dry month with a total rainfall of 29.9 mm.
However, even though July was the month with lowest precipitation, it was the sampling
date presenting the highest number of morphospecies.
- New morphospecies not present in the first two samplings, appeared in the third
sampling such as Marasmius haematocephallus, Marasmiellus nigripes, Marasmius
rotuloides, and Ramaria sp.1 (P6_60).
- A total of 51 morphospecies were collected in the 1000 m2 during the three samplings.
59
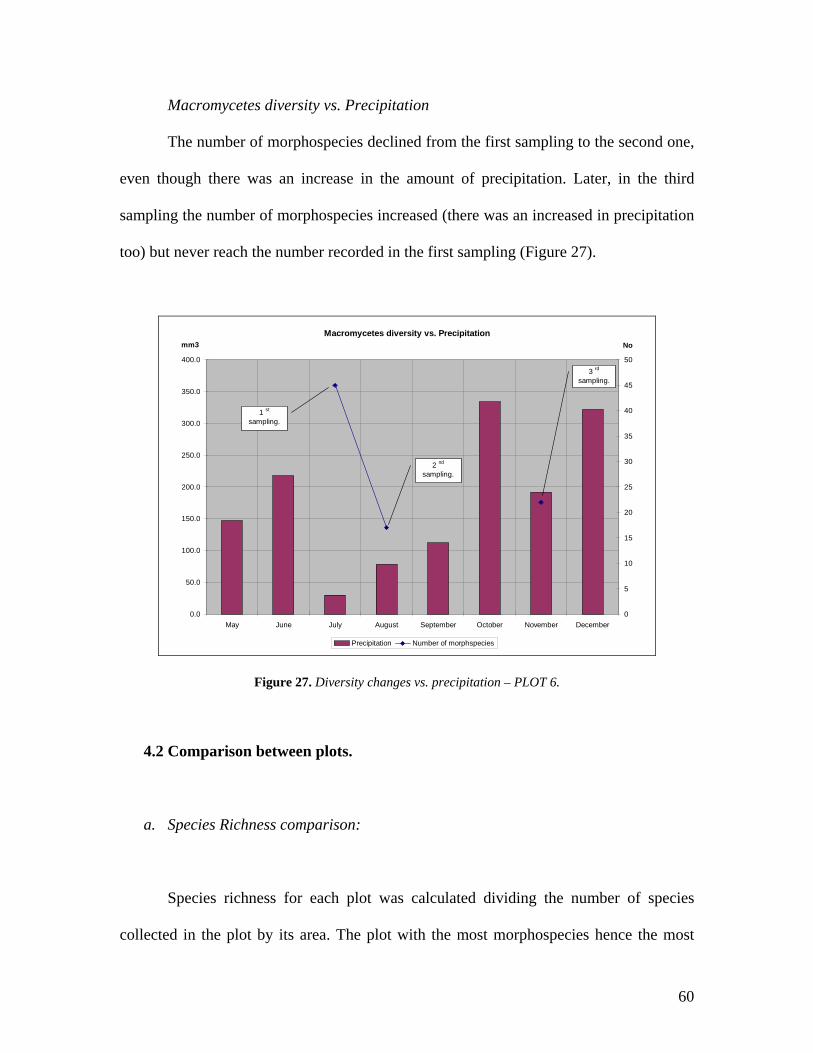
Macromycetes diversity vs. Precipitation
The number of morphospecies declined from the first sampling to the second one,
even though there was an increase in the amount of precipitation. Later, in the third
sampling the number of morphospecies increased (there was an increased in precipitation
too) but never reach the number recorded in the first sampling (Figure 27).
Macromycetes diversity vs. Precipitation
0.0
50.0
100.0
150.0
200.0
250.0
300.0
350.0
400.0
May June July August September October November December
mm3
0
5
10
15
20
25
30
35
40
45
50
No
Precipitation Number of morphspecies
1 st
sampling.
2 nd
sampling.
3 rd
sampling.
Figure 27. Diversity changes vs. precipitation – PLOT 6.
4.2 Comparison between plots.
a. Species Richness comparison:
Species richness for each plot was calculated dividing the number of species
collected in the plot by its area. The plot with the most morphospecies hence the most
60

diverse, was PLOT 2 followed by PLOT 1, both located in high terrace primary forest
(Figure 28). PLOT 3 also presented a high number of morphospecies matching PLOT 2
with 68 morphospecies in 1000 m2. However, its replica (PLOT 4) located as well at high
terrace secondary forest, presented only 21 morphospecies.
Number of Morphospecies
0 10 20 30 40 50 60 70
PLOT 1
PLOT 2
PLOT 3
PLOT 4
PLOT 5
PLOT 6
80
Figure 28. Total number of morphospecies in each plot.
b. Species Richness fluctuation
There was a clear trend followed by the first four plots, located in high terrace
primary and secondary forest (Figure 29). They all presented a drop in species richness as
the precipitation rate decreased (from the first sampling to the second), and in all of them
the species richness increased when the precipitation rose (from the second sampling to
the third). The latter does not mean that the species were absent during the dry season; it
means is that they were not fruiting during that period. In the cases of the plots located in
floodland primary forest (PLOT 5 & 6) the situation was the opposite. The highest
61
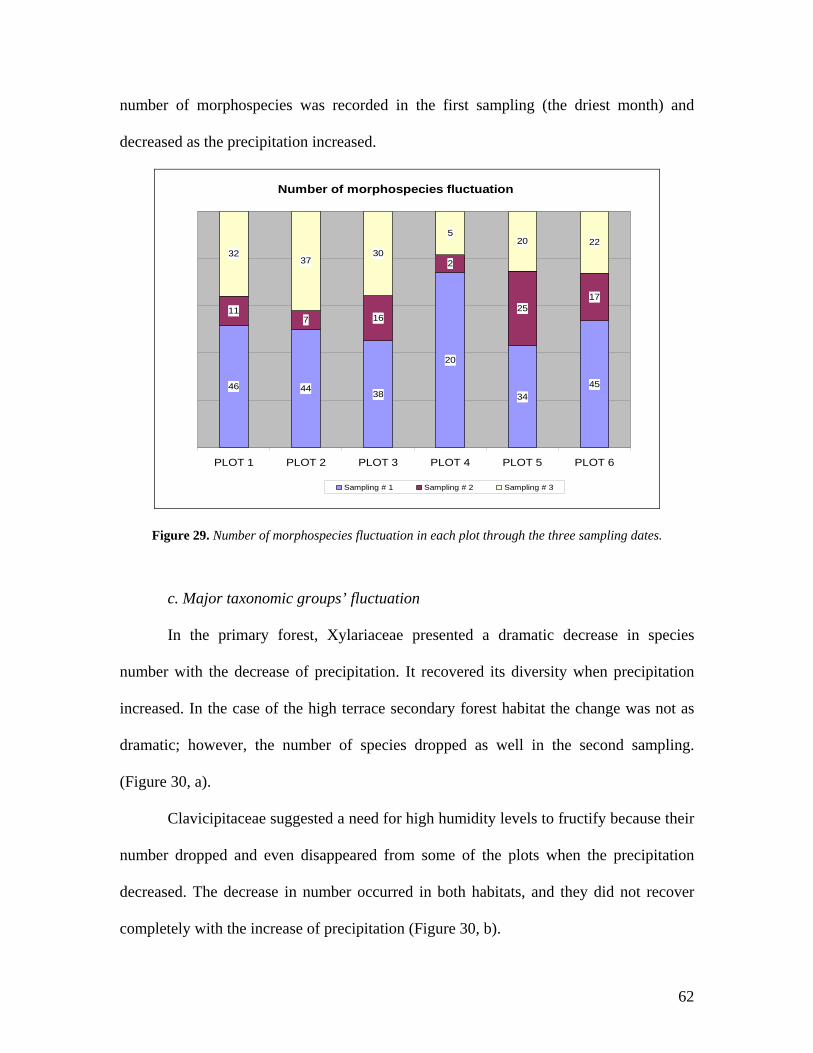
number of morphospecies was recorded in the first sampling (the driest month) and
decreased as the precipitation increased.
Number of morphospecies fluctuation
46 4438
20
3445
117 16
2
2517
3237
30
520 22
PLOT 1 PLOT 2 PLOT 3 PLOT 4 PLOT 5 PLOT 6
Sampling # 1 Sampling # 2 Sampling # 3
Figure 29. Number of morphospecies fluctuation in each plot through the three sampling dates.
c. Major taxonomic groups’ fluctuation
In the primary forest, Xylariaceae presented a dramatic decrease in species
number with the decrease of precipitation. It recovered its diversity when precipitation
increased. In the case of the high terrace secondary forest habitat the change was not as
dramatic; however, the number of species dropped as well in the second sampling.
(Figure 30, a).
Clavicipitaceae suggested a need for high humidity levels to fructify because their
number dropped and even disappeared from some of the plots when the precipitation
decreased. The decrease in number occurred in both habitats, and they did not recover
completely with the increase of precipitation (Figure 30, b).
62
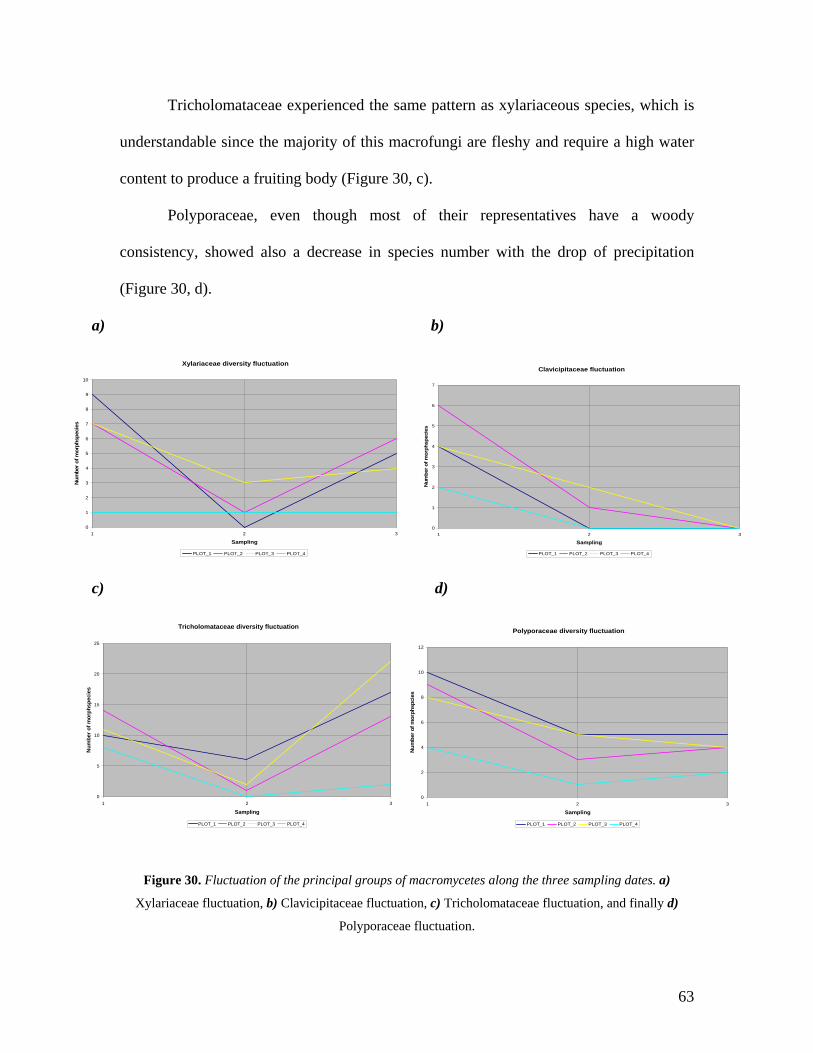
Tricholomataceae experienced the same pattern as xylariaceous species, which is
understandable since the majority of this macrofungi are fleshy and require a high water
content to produce a fruiting body (Figure 30, c).
Polyporaceae, even though most of their representatives have a woody
consistency, showed also a decrease in species number with the drop of precipitation
(Figure 30, d).
a) b)
Xylariaceae diversity fluctuation
0
1
2
3
4
5
6
7
8
9
10
1 2 3
Sampling
Num
ber o
f mor
phsp
ecie
s
PLOT_1 PLOT_2 PLOT_3 PLOT_4
Clavicipitaceae fluctuation
0
1
2
3
4
5
6
7
1 2 3
Sampling
Num
ber o
f mor
phsp
ecie
s
PLOT_1 PLOT_2 PLOT_3 PLOT_4
c) d)
Tricholomataceae diversity fluctuation
0
5
10
15
20
25
1 2 3
Sampling
Num
ber o
f mor
phsp
ecie
s
PLOT_1 PLOT_2 PLOT_3 PLOT_4
Polyporaceae diversity fluctuation
0
2
4
6
8
10
12
1 2
Sampling
Num
ber o
f mor
phsp
cies
3
PLOT_1 PLOT_2 PLOT_3 PLOT_4
Figure 30. Fluctuation of the principal groups of macromycetes along the three sampling dates. a)
Xylariaceae fluctuation, b) Clavicipitaceae fluctuation, c) Tricholomataceae fluctuation, and finally d)
Polyporaceae fluctuation.
63
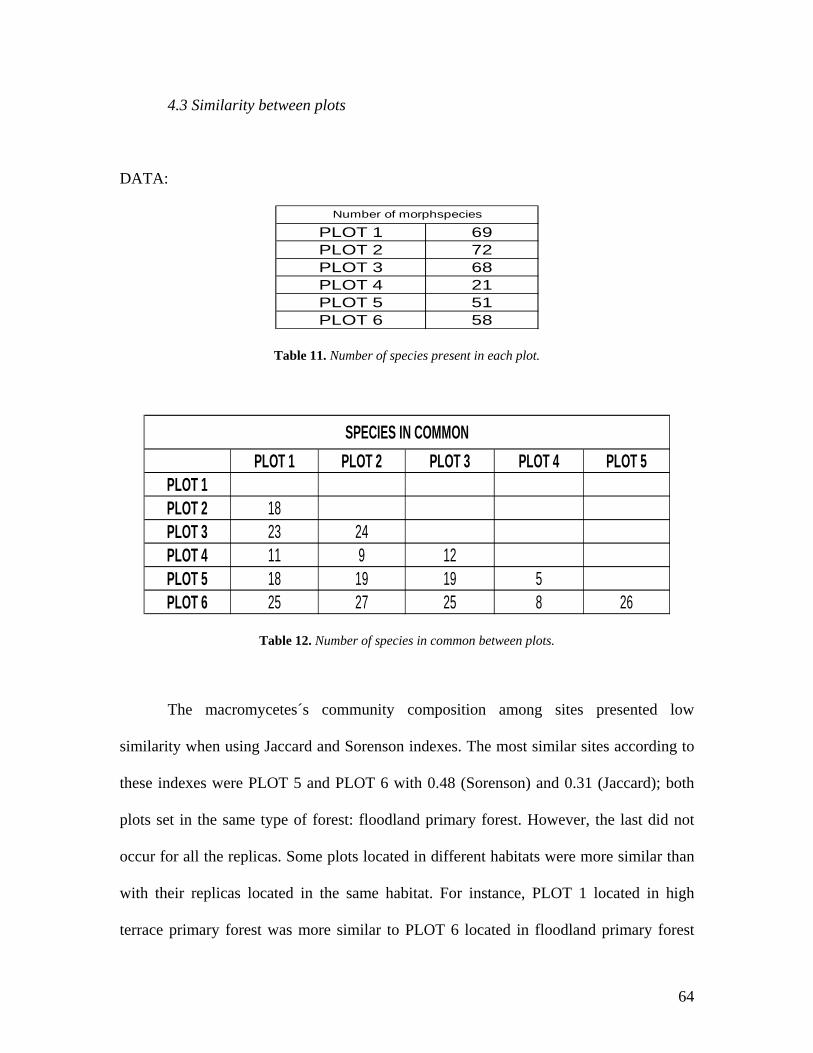
4.3 Similarity between plots
DATA:
PLOT 1 69PLOT 2 72PLOT 3 68PLOT 4 21PLOT 5 51PLOT 6 58
Number of morphspecies
Table 11. Number of species present in each plot.
PLOT 1 PLOT 2 PLOT 3 PLOT 4 PLOT 5PLOT 1PLOT 2 18PLOT 3 23 24PLOT 4 11 9 12PLOT 5 18 19 19 5PLOT 6 25 27 25 8 26
SPECIES IN COMMON
Table 12. Number of species in common between plots.
The macromycetes´s community composition among sites presented low
similarity when using Jaccard and Sorenson indexes. The most similar sites according to
these indexes were PLOT 5 and PLOT 6 with 0.48 (Sorenson) and 0.31 (Jaccard); both
plots set in the same type of forest: floodland primary forest. However, the last did not
occur for all the replicas. Some plots located in different habitats were more similar than
with their replicas located in the same habitat. For instance, PLOT 1 located in high
terrace primary forest was more similar to PLOT 6 located in floodland primary forest
64

than with PLOT 2 located in the same habitat. The same occurred between PLOT 3 and
PLOT 6 showing a greater similarity than PLOT 3 and PLOT 4 located in the same
habitat.
The plot which shared the highest number of morphospecies with the rest of the
sample units was PLOT 6. Conversely, PLOT 4 was most dissimilar community
(according to both indexes), sharing the lowest proportion of morphotypes with the other
sites.
a. Sorenson Quality Index:
PLOT 1 PLOT 2 PLOT 3 PLOT 4 PLOT 5PLOT 1PLOT 2 0.26PLOT 3 0.34 0.34PLOT 4 0.24 0.19 0.27PLOT 5 0.30 0.31 0.32 0.14PLOT 6 0.39 0.42 0.40 0.20 0.48
SORENSON
Table 13. Sorenson’s similarity indexes between plots.
b. Jaccard similarity index:
PLOT 1 PLOT 2 PLOT 3 PLOT 4 PLOT 5PLOT 1PLOT 2 0.15PLOT 3 0.20 0.21PLOT 4 0.14 0.11 0.16PLOT 5 0.18 0.18 0.19 0.07PLOT 6 0.25 0.26 0.25 0.11 0.31
JACCARD'S INDEX
Table 14. Jaccard similarity indexes between plots.
65
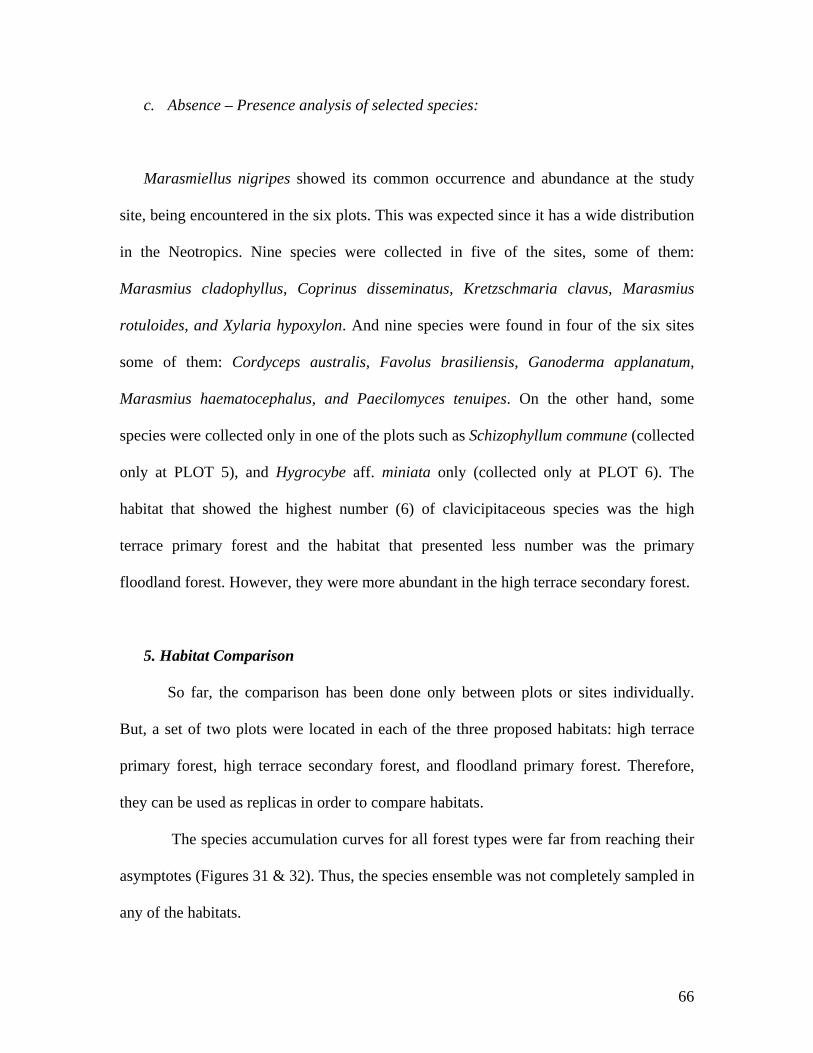
c. Absence – Presence analysis of selected species:
Marasmiellus nigripes showed its common occurrence and abundance at the study
site, being encountered in the six plots. This was expected since it has a wide distribution
in the Neotropics. Nine species were collected in five of the sites, some of them:
Marasmius cladophyllus, Coprinus disseminatus, Kretzschmaria clavus, Marasmius
rotuloides, and Xylaria hypoxylon. And nine species were found in four of the six sites
some of them: Cordyceps australis, Favolus brasiliensis, Ganoderma applanatum,
Marasmius haematocephalus, and Paecilomyces tenuipes. On the other hand, some
species were collected only in one of the plots such as Schizophyllum commune (collected
only at PLOT 5), and Hygrocybe aff. miniata only (collected only at PLOT 6). The
habitat that showed the highest number (6) of clavicipitaceous species was the high
terrace primary forest and the habitat that presented less number was the primary
floodland forest. However, they were more abundant in the high terrace secondary forest.
5. Habitat Comparison
So far, the comparison has been done only between plots or sites individually.
But, a set of two plots were located in each of the three proposed habitats: high terrace
primary forest, high terrace secondary forest, and floodland primary forest. Therefore,
they can be used as replicas in order to compare habitats.
The species accumulation curves for all forest types were far from reaching their
asymptotes (Figures 31 & 32). Thus, the species ensemble was not completely sampled in
any of the habitats.
66
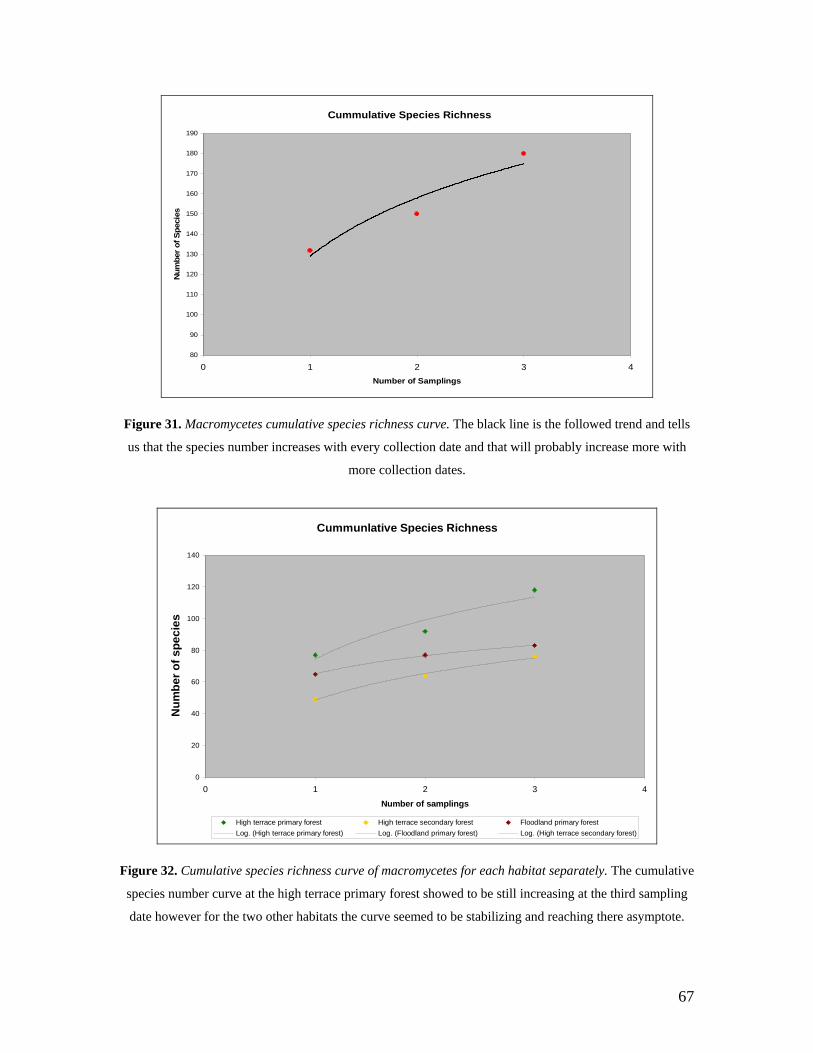
Cummulative Species Richness
80
90
100
110
120
130
140
150
160
170
180
190
0 1 2 3Number of Samplings
Num
ber o
f Spe
cies
4
Figure 31. Macromycetes cumulative species richness curve. The black line is the followed trend and tells
us that the species number increases with every collection date and that will probably increase more with
more collection dates.
Cummunlative Species Richness
0
20
40
60
80
100
120
140
0 1 2 3 4
Number of samplings
Num
ber o
f spe
cies
High terrace primary forest High terrace secondary forest Floodland primary forestLog. (High terrace primary forest) Log. (Floodland primary forest) Log. (High terrace secondary forest)
Figure 32. Cumulative species richness curve of macromycetes for each habitat separately. The cumulative
species number curve at the high terrace primary forest showed to be still increasing at the third sampling
date however for the two other habitats the curve seemed to be stabilizing and reaching there asymptote.
67
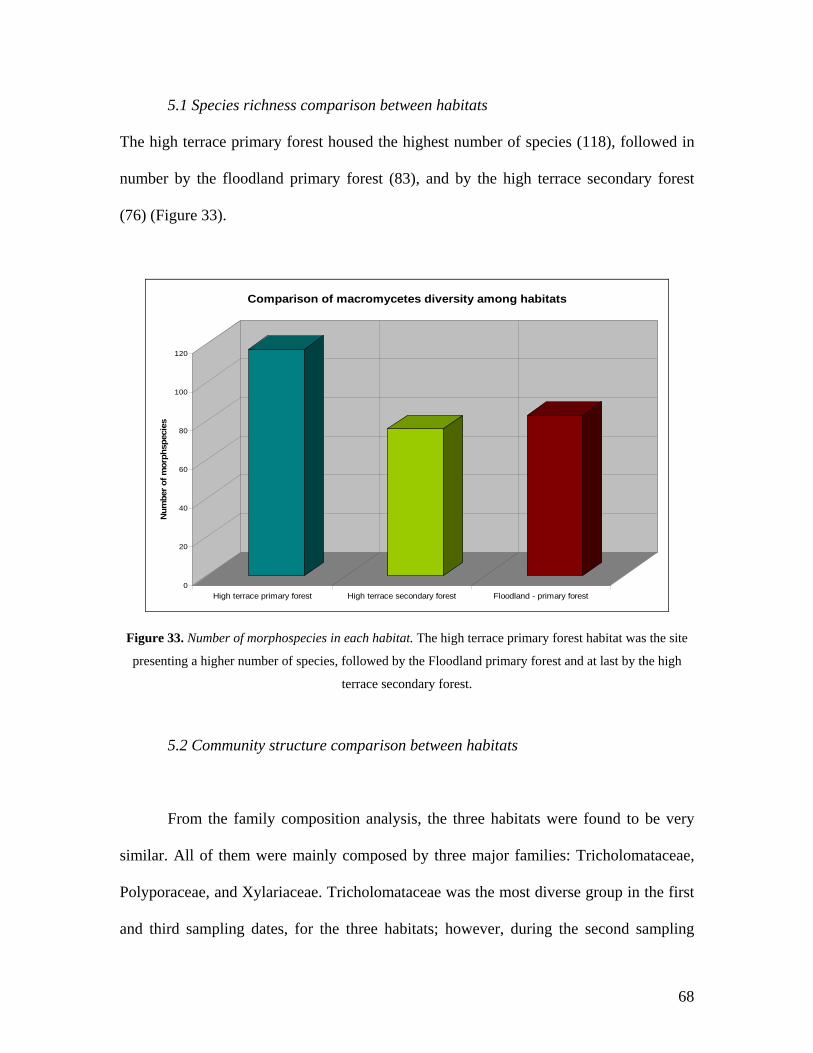
5.1 Species richness comparison between habitats
The high terrace primary forest housed the highest number of species (118), followed in
number by the floodland primary forest (83), and by the high terrace secondary forest
(76) (Figure 33).
0
20
40
60
80
100
120
Num
ber o
f mor
phsp
ecie
s
High terrace primary forest High terrace secondary forest Floodland - primary forest
Comparison of macromycetes diversity among habitats
Figure 33. Number of morphospecies in each habitat. The high terrace primary forest habitat was the site
presenting a higher number of species, followed by the Floodland primary forest and at last by the high
terrace secondary forest.
5.2 Community structure comparison between habitats
From the family composition analysis, the three habitats were found to be very
similar. All of them were mainly composed by three major families: Tricholomataceae,
Polyporaceae, and Xylariaceae. Tricholomataceae was the most diverse group in the first
and third sampling dates, for the three habitats; however, during the second sampling
68

(when the precipitation dropped) the community suffered a change in composition.
During the second sampling date Polyporaceae and Xylariaceae took first place in
number of representatives. These results were expected since Xylariaceae and
Polyporaceae (sensu lato) have structural defenses against dehydration and can fructify or
maintain their fruiting bodies during dry periods.
Some groups were more diverse in a particular habitat. For instance, members of
the Clavicipitaceae family presented more species in the high terrace primary forest; the
same occurred for Tricholomataceae and Xylariaceae members. On the other hand, some
groups did not present a high diversity but a high abundance in a particular habitat. For
example, as was said before, Clavicipitaceae was found to be more diversified in the high
terrace primary forest; however, was found to be more abundant in the high terrace
secondary forest. A few species were only found in a particular habitat as in the case of
Hygrocybe miniata, Xylaria globosa, and Scleroderma sinnamariensis, which were only
collected in floodland primary forest.
5.3 Similarity between habitats
The high terrace primary forest and the high terrace secondary forest shared 20
species, the high terrace primary forest and the floodland primary forest shared 22
species, and the high terrace secondary forest and the floodland primary forest shared 7
species (Figure 34). Twenty four species occurred at the three sites such as Coprinus
disseminatus, Cordyceps australis, Favolus brasiliensis, Ganoderma applanatum,
Kretzschmaria clavus, Marasmiellus nigripes, and Marasmius cladophyllus among
69
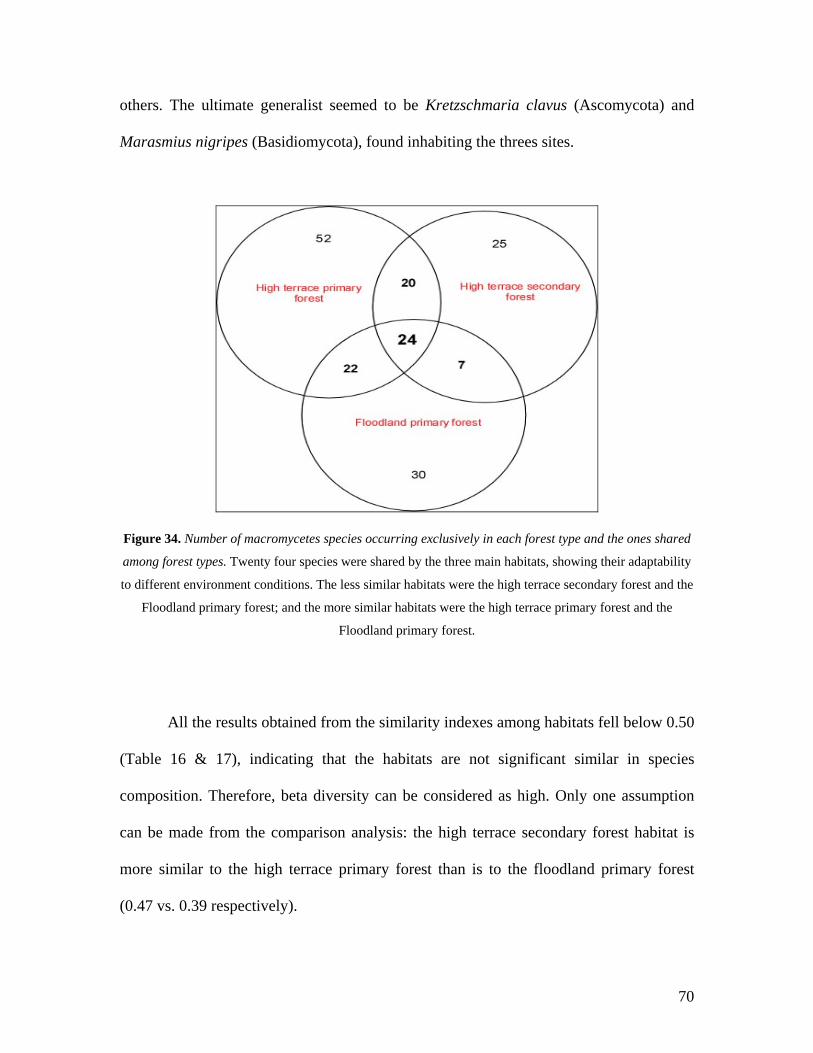
others. The ultimate generalist seemed to be Kretzschmaria clavus (Ascomycota) and
Marasmius nigripes (Basidiomycota), found inhabiting the threes sites.
Figure 34. Number of macromycetes species occurring exclusively in each forest type and the ones shared
among forest types. Twenty four species were shared by the three main habitats, showing their adaptability
to different environment conditions. The less similar habitats were the high terrace secondary forest and the
Floodland primary forest; and the more similar habitats were the high terrace primary forest and the
Floodland primary forest.
All the results obtained from the similarity indexes among habitats fell below 0.50
(Table 16 & 17), indicating that the habitats are not significant similar in species
composition. Therefore, beta diversity can be considered as high. Only one assumption
can be made from the comparison analysis: the high terrace secondary forest habitat is
more similar to the high terrace primary forest than is to the floodland primary forest
(0.47 vs. 0.39 respectively).
70
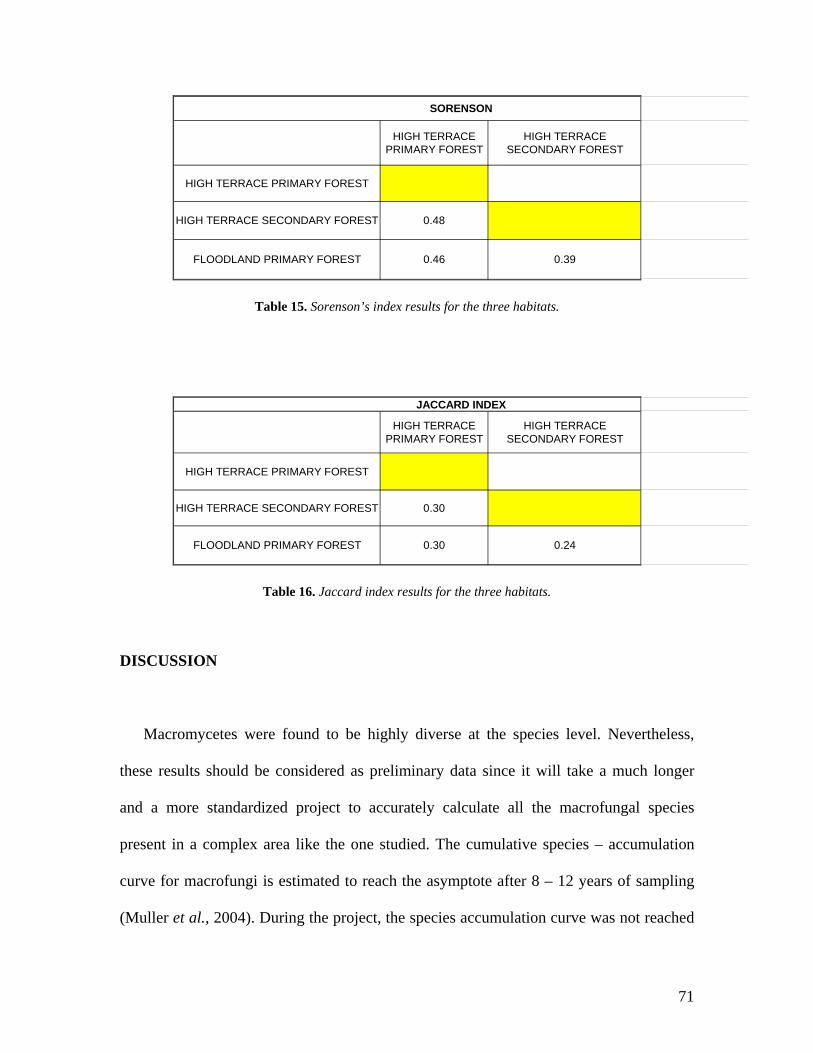
HIGH TERRACE PRIMARY FOREST
HIGH TERRACE SECONDARY FOREST
HIGH TERRACE PRIMARY FOREST
HIGH TERRACE SECONDARY FOREST 0.48
FLOODLAND PRIMARY FOREST 0.46 0.39
SORENSON
Table 15. Sorenson’s index results for the three habitats.
HIGH TERRACE PRIMARY FOREST
HIGH TERRACE SECONDARY FOREST
HIGH TERRACE PRIMARY FOREST
HIGH TERRACE SECONDARY FOREST 0.30
FLOODLAND PRIMARY FOREST 0.30 0.24
JACCARD INDEX
Table 16. Jaccard index results for the three habitats.
DISCUSSION
Macromycetes were found to be highly diverse at the species level. Nevertheless,
these results should be considered as preliminary data since it will take a much longer
and a more standardized project to accurately calculate all the macrofungal species
present in a complex area like the one studied. The cumulative species – accumulation
curve for macrofungi is estimated to reach the asymptote after 8 – 12 years of sampling
(Muller et al., 2004). During the project, the species accumulation curve was not reached
71
in any of the habitats sampled, indicating that more sampling effort is needed in order to
accurately estimate species diversity in these forests. Using the 5:1 plant to macrofungi
ratio proposed by Muller et al. and considering an amount of 2000 angiosperms, the
estimated for the number of macrofungi at the study area was 400 species. Nonetheless,
the sampling technique was effective in describing the general patterns of community
structure and it is important to mention that fewer new species for the inventory were
being found as the collecting trip was approaching its end. Even if the complete number
of morphospecies was not accurately determined, a preliminary inventory gave us the
information necessary to start building a potential database as well as an idea of the
biodiversity of the region, information necessary to start a conservation plan that will lead
us to preserve this valuable resource. Therefore, we hope that this project serves as the
foundation for future taxonomic and ecological research in the area.
Basidiomycota showed to be more diverse within the collection (71%); however,
it should be pointed that only the species belonging to the artificial group
“macromycetes” were object of study. In most ecological studies, where saprobic
(especially wood-inhabiting) macromycetes are targeted, Basidiomycota appear to be the
most frequently collected. However, Ferrer, collected a greater number of Ascomycota,
although that could be related to the tree species she was sampling (Ferrer, 2001). In
general, Ascomycota is known to be very diverse in the tropics; but because it includes
many microfungi species, Basidiomycota appeared to be more diverse. Therefore, it can
only be stated that Basidiomycota showed a higher diversity in macromycetes.
Nevertheless, Ascomycota macromycetes are still a very important group of
decomposers. They grow in great numbers over dead logs and branches. Xylariaceae
72
composed a numerically important group similar to the rest of the Neotropics as has been
demonstrated in other studies (Læssøe, 1999; Rogers, 2000). In this survey, they
represented more than 60% of the species, indicating that they are a major component of
the Ascomycota mycoflora. Xylaria was the most representative genus, with more than
20 morphospecies. Many of these species have been recorded as varieties, since this
genus is highly polymorphic. Species look very similar in the field, and variations within
species are caused by environmental factors such as nutrient availability or the substrate’s
water content. A clear example of the last phenomenon was illustrated by X. telfairii, a
very common species found growing on dead logs along the majority of the trails. The
common variety presents a light brown crust color; however, the same species can be
phenotypically different, showing crust colors that can go from white to dark brown.
Daldinia species were also difficult to distinguish and identify. This genus (as Xylaria) is
very polymorphic in shape, size, and color; hence, these characters have to be employed
very carefully when identification keys are used. Phylacia, Kretzschmaria and Hypoxylon
did not show a great diversification in the region, contrasting with other neotropical
studies. Just one species from each genus was recorded. Probably there were more
species inhabiting the area but were overlooked since they tend to be cryptic. The latter
especially happens in Hypoxylon species, which grow as a crust, covering the dead host
and making their field detection and differentiation very difficult.
Fungi can present an anamorphic (asexual) or a teleomorphic (sexual) state,
depending on their reproduction strategy. Anamorphic states cycles faster and can infect
more host in a shorter period. An interestingly high number of anamorphic xylariaceous
and clavicipitaceous species were collected. Conversely, to temperate areas, the
73

teleomorphic state is prevalent in the tropics since the available substrate for colonization
is greater. Nevertheless, two xylariaceous and ten clavicipitaceous anamorphs species
were recorded. Xylariaceous anamorphs such as Moelleroclavus penicilliopsis (anamorph
of X. penicilliopsi) or Xylocoremium flabelliforme (anamorph of X. cubensis) were
collected in 2005 but were not recorded for 2003 (Gazis, 2005). The last could be a
consequence of the unusual dry conditions present during 2005, which addresses the
environmental differences between those years, showing how environmental factors as
precipitation influences the occurrence of macrofungal species.
Almost all the members of the Xylariaceae found in this survey presented a
saprobic habit and did not show an obvious host preference, probably because of the
variety of substrates available for colonization. However, even with this great number of
substrates available in a subtropical rainforest, competition between fungi is intense.
Therefore, macromycetes species need to exploit different substrates and xylariaceous
species are known to be commonly latent invaders of “stressed” hosts (Whalley, 1985;
Rogers, 2000). Species that have the ability of switch between a saprobic and a parasite
habit (facultatives) get a new ecological niche to exploit, which creates an advantage over
the saprophytic macromycetes. A few species were found inhabiting a non-decayed wood
substrate; instead, they were found growing on seeds (Mycena - P6_34) or on living
branches such as Daldinia (RGM_0201). Besides, those two collections, no more
parasites were directly observed10; however, two other species collected in the area
10 Sometimes it is difficult to distinguish dead material from living material. A log along a trail can be
considered as dead however the core tissue can still be alive and present a suitable substrate for biotrophs
macromycetes.
74
Xylaria cubensis and Kretzschmaria clavus are known to be facultative parasites,
switching from dead to living material (Rogers, 2000).
Two groups Agaricales (48%) and Poriales (25.5%) mainly composed
Basidiomycota. The agaric flora composition found in the study area was characteristic of
the neotropics with Tricholomataceae and Agaricaceae dominating, while, in contrast to
the temperate mycofloras, Coprinaceae, and Cortinariaceae were relative small groups.
The Tricholomataceae was by far the largest family in numbers of representatives, which
agree with the results found by Ovrebo (1996) in La Selva (Costa Rica); Dennis in
Venezuela, and Pegler in the Lesser Antilles. Some genera such as Marasmius, Mycena,
and Collybia were well represented by many species. These genera were not only diverse
in species number but also abundant, widely distributed within the area. Coprinus
disseminatus, M. cladophyllus, M. haematocephalus, and M. rotuloides were species that
showed to be abundant and spread within the area. On the other hand, some species were
classified as rare, considering the number of times they were encountered. Two of these
species were Calocybe cyaenella (Tricholomataceae), only collected 2 times during the
survey, and Mutinus xylogenus (Phallaceae), only encountered once.
Members of the Basidiomycota were found to be in general saprobes, especially
wood decayers. Several species were recorded to grow on soil; however, a closer looked
revealed, in the majority of the occasions, their connection to a woody source. Some
times the wood is buried or in an advanced stage of decaying process, appearing to be
humus or soil. Nevertheless, some species were truly growing on soil, such as the case of
lepiotaceous species. From all the collection, just one species of mycorrhizal
macromycetes were recorded, Scleroderma sinamarensis a member of the Boletales. The
75
latter is one of the more obvious differences between the agaric composition of tropical
and temperate forests. In temperate forests ecosystems, mycorrhizal macromycetes are
very common and key species in the maintenance of plant community, building a
symbiotic relationship, especially for nutrient uptake. Macromycetes in tropical forests
ecosystems are also key stones species, but conversely, they intervene in the maintenance
of the plant community by recycling, transforming, storing nutrients making them
available for plant absorption.
Tropical decomposer fungi are frequently restricted to particular size classes and
types of substrata (Hedger, 1985; Lodge 1997). Lodge (1995) documented in her study at
El Verde, Puerto Rico, that almost all decomposers fungi were restricted to one or at most
two similar types of substrata. The same results were obtained from this project; 88.5% of
the morphspecies were found in just one type of substratum; 11.1% in two different types
of substrata and not even 1% of the morphospecies was collected in 3 different types of
substrata. From the substratum’s class analysis, the majority of the morphospecies were
found growing on logs followed in preference by branches. In addition, leaf litter was
also found to be an important substrate suitable for macromycetes colonization. This
substrate was especially important for a very diverse and abundant genus, Marasmius, a
foliicolous or lignocolous species.
The analysis of the fungal community composition in the 500m2 sub-plots
revealed similarities and distinct differences among habitats. Plots were analyzed and
described individually as a community; however, pairs of plots were set in each habitat
hence at some point they were considered replicas. The plot that presented the highest
number of macromycetes species was PLOT 2 located within the high terrace primary
76

forest followed by PLOT 1, located in the same habitat. The number of morphospecies
was very similar between plots located in the same habitat; however, an important
difference in number of species was found between PLOT 3 and PLOT 4 even though,
they were located relatively close to each other. PLOT 3 presented 68 morphospecies
while PLOT 4 presented only 21. This difference in number was probably related to
differences in number of suitable substrates for fungi colonization such as decaying logs
and dead branches.
When plots were grouped and compared by their habitat location, the highest
diversity of macromycetes was found to be at the high terrace primary forest with 123
species. Secondly, the floodland primary forest habitat with 83 species in total. The high
terrace secondary forest habitat was ranked in third place being the less diverse habitat
with only 67 species in total. The results from this experiment, agree with the scheme that
undisturbed areas have greater diversity. Pristine areas have showed to hold more number
of species; therefore, they should be target for conservations purposes. Higher diversity at
primary forest was a probably a result of the larger variety of resource sizes available for
colonization, while in secondary forest more small diameter trees and branches are
present. For instance, PLOT 1 and PLOT 2 presented more wood material and of greater
diameter (branches, logs) comparing to PLOT 3 and PLOT 4. These results accorded
with the ones obtained by Ferrer (2001) were she found a positive correlation between the
sizes of the resource and the number of fungal morphotypes. Nevertheless, PLOT 3 (high
terrace secondary forest) showed a relative high diversity, which might be explained by
the abundance of suitable leaf litter substrate for members of the genus Marasmius,
which constituted a high percentage of the samples found within this plot.
77

Habitats showed similarities in family composition, having Tricholomataceae,
Polyporaceae, and Xylariaceae dominating within the three habitats. However, they
showed to have a peculiar species composition since they only shared 24 species in total.
Some of the species collected in the three habitats were Coprinus disseminatus,
Cordyceps australis, Favolus brasiliensis, Ganoderma applanatum, Kretzschmaria
clavus, Marasmiellus nigripes, and Marasmius cladophyllus. From the shared species, the
ultimate generalists seemed to be Kretzschmaria clavus from the Ascomycota and
Marasmius nigripes as from the Basidiomycota since were collected at the six plots. The
mentioned species were found to be not only widely distributed in the three main
habitats, but also present in a high local abundance. The factors that make the populations
of these species both abundant and with a board tolerance to a range of physical
conditions are still unknown. Future work, which analyzes the genetic structure of widely
distributed species vs. site-specific species, will decode this mystery. On the other hand,
some species were only found exclusively in one of the habitats, such as Hypocrella
gaertneriana (high terrace secondary forest), Polyporus udus, Hygrocybe miniata and
Scleroderma sinnamariense (floodland primary forest), or Marasmius nigrobrunneus
(high terrace primary forest).
The results obtained from the similarity indexes among habitats also reflected that
each habitat has a unique species composition. All of the results obtained from the
similarity indexes (Jaccard and Sorenson) fell below 0.50, indicating that the habitats are
not significantly similar in species composition. Therefore, beta diversity can be
considered as high.
78

Abundance data was not addressed in this project; however, some general
annotations were done while sampling. For instance, although high terrace primary forest
presented a higher number of morphospecies, those species were not abundant. Contrary,
the majority of the species present at high terrace secondary forest were present in a
relative high number of fruiting bodies. This particular pattern was obvious, for instance,
in the clavicipitaceous fungi. Diversity of this group was higher at high terrace primary
forest but a small amount of specimens was recorded in each collection. Contrary, they
were not as diverse in the high terrace secondary forest but abundant. For instance, in
several occasions more than five specimens of Cordyceps australis were recorded in a
single collecting date.
The opportunistic collections made for the inventory were consistent with the
results obtained from the plot analysis. Trails located along the high terrace primary
forest habitat provided more number of species to the collection.
One of the hypotheses of this project was that the number of morphospecies, in all
the habitats, varies with the amount of precipitation. It was predicted that the number of
morphospecies is positively correlated to the amount of rainfall, therefore it was expected
a decrease in species diversity along with the decrease of precipitation. This was true for
high terrace primary forest and for the high terrace secondary forest, where the number of
morphospecies decreased dramatically from the first sampling to the second sampling
(lower amount of precipitation). Interesting was the case of the floodland primary forest,
where the diversity pattern showed a different trend. More morphospecies were collected
during the driest month and the number of collections decreased as the monthly
precipitation increased. Apparently, in this habitat, there is a negative correlation between
79
number of macromycetes and precipitation levels. This phenomenon could be a result of
the excess soil’s moisture, which accumulates, saturating the soil. The latter can affect
dramatically the fructification of macromycetes as well as the existence of their mycelia
since the excess of water content reduces the decay process and decreases the quantity of
available oxygen (Delaney et al., 1998).
This is the first effort to evaluate a Peruvian macrofungal community, which
involved not only the compilation of the species present in the area, but also the
comparison between communities among the main habitats present at the station. Several
macromycetes collected in this project constituted new records for the region and even
for the country. Forty-eight species are considered as new records for the region and for
the country, increasing the checklist of Peruvian macromycetes (Appendix II).
Particularly interesting was the case of Pseudocolus fusiformis, a member of the
Phallaceae. P. fusiformis was one of the rare species found in the area only collected once
during the six months of fieldwork, and was never previously recorded for the Amazon.
Another example was Mutinus xylogenus, which was only known to inhabit the Guiana.
The collection of these two species has been already published in a scientific journal
(Gazis & Guzman, 2006). Building a list of macromycetes species is one of the most
important outcomes of this project because it helps scientists in the evaluation of the
Peruvian – Amazon biodiversity, in the identification of “hot biodiversity spots,” which
could be proposed as conservation sites, and finally in the construction of a database for
future mycological research in the region.
80

CONCLUSIONS
This study was designed to evaluate and monitor the macromycetes community at
Los Amigos Biological Station. Some of the goals accomplished are a checklist of the
species present in the area, an overview of the community composition at the three main
habitats and of the changes in the community among different seasons.
The macromycetes at the area were found to be highly diverse at the species level.
The fungal family composition found in the area was typical of Neotropical areas and
similar to the ones found in the lowland regions of Brazil, Venezuela, and Ecuador. The
inventory of morphospecies was built with opportunistic collections made through the
majority of the trails located at the biological station in addition with the morphospecies
found in the plots. More than three hundred morphospecies of macromycetes belonging
primarily to Basidiomycota and Ascomycota were recorded. Basidiomycota was the most
abundant group which made up 71% of the collections compared to Ascomycota, which
only represented 27%. Within the Ascomycota, representatives from the Xylariaceae
were the most common encountered. The Tricholomataceae was the most commonly
found within the Basidiomycota, especially the genera Marasmius, Marasmiellus, and
Gymnopus.
Analysis of fungal community composition in the 500 m2 plots revealed distinct
differences in fungal communities among high terrace primary forest, high terrace
secondary forest, and floodland primary forest. A small number of species (both
Ascomycota and Basidiomycota) were generalist. These species are also widely
81
distributed in several places within the neotropics. In addition, some species were found
to inhabit only one type of habitat.
The highest diversity of both fungal groups was found on high terrace primary
forest; however, the asymptote of morphospecies accumulation curves was not reached
for any of the habitats. Previous work on tropical macromycetes community revealed that
diversity is positively correlated with local abundance and diversity of substrates. Higher
diversity in old growth forests is related to larger variety of resource sizes, while
secondary forests only contains small diameter trees and branches. In this study, the
obtained results agreed with the last statement; high terrace primary forest is the habitat
presenting more quantity of logs and branches, therefore it is the habitat containing more
available and suitable substrata.
Similarity indexes (Jaccard and Sorenson) showed that the species composition
vary among habitats; however they had a similar family composition. All of them were
mainly composed by three families: Tricholomataceae, Polyporaceae, and Xylariaceae.
According to the similarity indexes used, none of the habitats presents a similar
macrofungal community composition.
The amount of precipitation influenced the macromycetes abundance and the
community composition. For the high terrace primary and secondary forest, a positive
correlation was found. Species diversity diminished with the decrease of precipitation
amount. On the other hand, in the floodland habitat, the opposite trend was found.
Species diversity decreased with the increase of precipitation amount.
82
Most of the species presented a decomposer habit, being the majority wood
decayers. When the substrate was broken down into classes, it was found that the favorite
substrate for decomposers was logs followed by soil and branches. Leaf litter was found
to be also an important substrate, especially for the genus Marasmius.
The outcomes from this project have implications for conservation of fungal
diversity since deforestation is a constant threat in the Amazon, increasing every day.
Logging is one of the activities driven deforestation in the area. This activity implies the
disturbance of the forest with the removal of logs (and other suitable substrate for fungi)
in their search for precious wood material. In recent years, conservationists in temperate
zones have worked in a red list of macromycetes in order to preserve the regions holding
this species. This measure should also be adopted in the conservation policy of
Neotropical forests. The results presented here are hoped to be useful in that regard.
This study is only a small part of a much larger an integrated project (AABP),
which tends to evaluate the biodiversity of the Peruvian southeastern region in many
areas and dimensions. Plant community, phenology, climate, insects, and even mammals
diversity and distribution are evaluated and monitored by this project. All sub-projects
are interconnected and created to be shared among members of the team. The project has
designed a fieldwork system (series of protocols) and a network useful to evaluate high
diversity areas. Data obtained from the different sub-projects are also available for
external researchers through online digital databases.
83
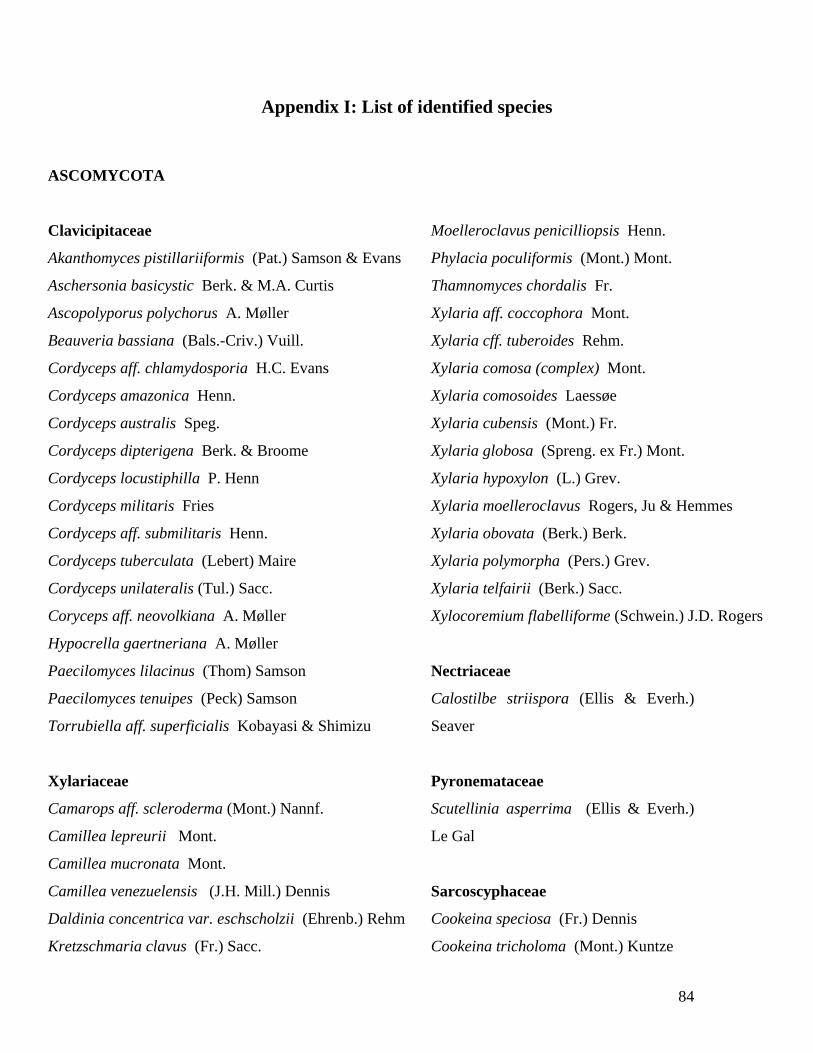
Appendix I: List of identified species
ASCOMYCOTA
Clavicipitaceae
Akanthomyces pistillariiformis (Pat.) Samson & Evans
Aschersonia basicystic Berk. & M.A. Curtis
Ascopolyporus polychorus A. Møller
Beauveria bassiana (Bals.-Criv.) Vuill.
Cordyceps aff. chlamydosporia H.C. Evans
Cordyceps amazonica Henn.
Cordyceps australis Speg.
Cordyceps dipterigena Berk. & Broome
Cordyceps locustiphilla P. Henn
Cordyceps militaris Fries
Cordyceps aff. submilitaris Henn.
Cordyceps tuberculata (Lebert) Maire
Cordyceps unilateralis (Tul.) Sacc.
Coryceps aff. neovolkiana A. Møller
Hypocrella gaertneriana A. Møller
Paecilomyces lilacinus (Thom) Samson
Paecilomyces tenuipes (Peck) Samson
Torrubiella aff. superficialis Kobayasi & Shimizu
Xylariaceae
Camarops aff. scleroderma (Mont.) Nannf.
Camillea lepreurii Mont.
Camillea mucronata Mont.
Camillea venezuelensis (J.H. Mill.) Dennis
Daldinia concentrica var. eschscholzii (Ehrenb.) Rehm
Kretzschmaria clavus (Fr.) Sacc.
Moelleroclavus penicilliopsis Henn.
Phylacia poculiformis (Mont.) Mont.
Thamnomyces chordalis Fr.
Xylaria aff. coccophora Mont.
Xylaria cff. tuberoides Rehm.
Xylaria comosa (complex) Mont.
Xylaria comosoides Laessøe
Xylaria cubensis (Mont.) Fr.
Xylaria globosa (Spreng. ex Fr.) Mont.
Xylaria hypoxylon (L.) Grev.
Xylaria moelleroclavus Rogers, Ju & Hemmes
Xylaria obovata (Berk.) Berk.
Xylaria polymorpha (Pers.) Grev.
Xylaria telfairii (Berk.) Sacc.
Xylocoremium flabelliforme (Schwein.) J.D. Rogers
Nectriaceae
Calostilbe striispora (Ellis & Everh.)
Seaver
Pyronemataceae
Scutellinia asperrima (Ellis & Everh.)
Le Gal
Sarcoscyphaceae
Cookeina speciosa (Fr.) Dennis
Cookeina tricholoma (Mont.) Kuntze
84
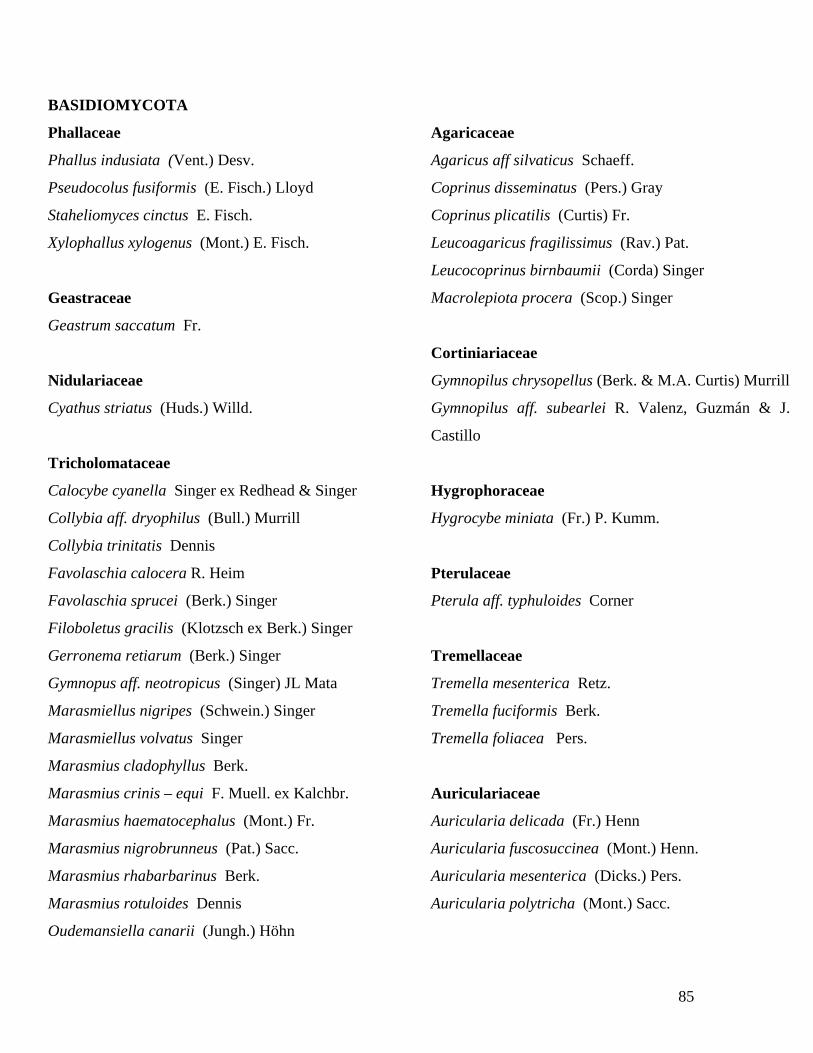
BASIDIOMYCOTA
Phallaceae
Phallus indusiata (Vent.) Desv.
Pseudocolus fusiformis (E. Fisch.) Lloyd
Staheliomyces cinctus E. Fisch.
Xylophallus xylogenus (Mont.) E. Fisch.
Geastraceae
Geastrum saccatum Fr.
Nidulariaceae
Cyathus striatus (Huds.) Willd.
Tricholomataceae
Calocybe cyanella Singer ex Redhead & Singer
Collybia aff. dryophilus (Bull.) Murrill
Collybia trinitatis Dennis
Favolaschia calocera R. Heim
Favolaschia sprucei (Berk.) Singer
Filoboletus gracilis (Klotzsch ex Berk.) Singer
Gerronema retiarum (Berk.) Singer
Gymnopus aff. neotropicus (Singer) JL Mata
Marasmiellus nigripes (Schwein.) Singer
Marasmiellus volvatus Singer
Marasmius cladophyllus Berk.
Marasmius crinis – equi F. Muell. ex Kalchbr.
Marasmius haematocephalus (Mont.) Fr.
Marasmius nigrobrunneus (Pat.) Sacc.
Marasmius rhabarbarinus Berk.
Marasmius rotuloides Dennis
Oudemansiella canarii (Jungh.) Höhn
Agaricaceae
Agaricus aff silvaticus Schaeff.
Coprinus disseminatus (Pers.) Gray
Coprinus plicatilis (Curtis) Fr.
Leucoagaricus fragilissimus (Rav.) Pat.
Leucocoprinus birnbaumii (Corda) Singer
Macrolepiota procera (Scop.) Singer
Cortiniariaceae
Gymnopilus chrysopellus (Berk. & M.A. Curtis) Murrill
Gymnopilus aff. subearlei R. Valenz, Guzmán & J.
Castillo
Hygrophoraceae
Hygrocybe miniata (Fr.) P. Kumm.
Pterulaceae
Pterula aff. typhuloides Corner
Tremellaceae
Tremella mesenterica Retz.
Tremella fuciformis Berk.
Tremella foliacea Pers.
Auriculariaceae
Auricularia delicada (Fr.) Henn
Auricularia fuscosuccinea (Mont.) Henn.
Auricularia mesenterica (Dicks.) Pers.
Auricularia polytricha (Mont.) Sacc.
85
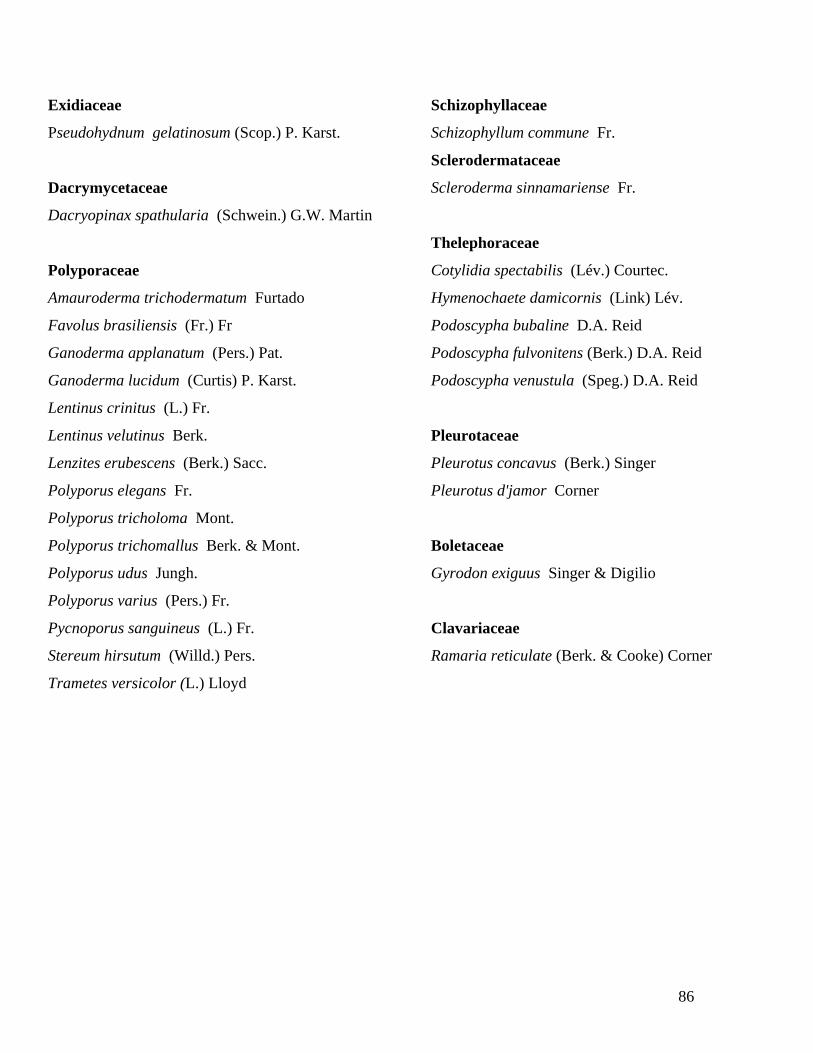
Exidiaceae Schizophyllaceae
Pseudohydnum gelatinosum (Scop.) P. Karst. Schizophyllum commune Fr.
Sclerodermataceae
Scleroderma sinnamariense Fr. Dacrymycetaceae
Dacryopinax spathularia (Schwein.) G.W. Martin
Thelephoraceae
Cotylidia spectabilis (Lév.) Courtec. Polyporaceae
Amauroderma trichodermatum Furtado Hymenochaete damicornis (Link) Lév.
Favolus brasiliensis (Fr.) Fr Podoscypha bubaline D.A. Reid
Ganoderma applanatum (Pers.) Pat. Podoscypha fulvonitens (Berk.) D.A. Reid
Ganoderma lucidum (Curtis) P. Karst. Podoscypha venustula (Speg.) D.A. Reid
Lentinus crinitus (L.) Fr.
Lentinus velutinus Berk. Pleurotaceae
Lenzites erubescens (Berk.) Sacc. Pleurotus concavus (Berk.) Singer
Polyporus elegans Fr. Pleurotus d'jamor Corner
Polyporus tricholoma Mont.
Polyporus trichomallus Berk. & Mont. Boletaceae
Polyporus udus Jungh. Gyrodon exiguus Singer & Digilio
Polyporus varius (Pers.) Fr.
Pycnoporus sanguineus (L.) Fr. Clavariaceae
Stereum hirsutum (Willd.) Pers. Ramaria reticulate (Berk. & Cooke) Corner
Trametes versicolor (L.) Lloyd
86
Appendix II: List of new records for Peru
ASCOMYCOTA
Clavicipitaceae
Beauveria bassiana (Bals.-Criv.) Vuill.
Cordyceps aff. chlamydosporia H.C. Evans
Cordyceps aff. submilitaris Henn.
Cordyceps unilateralis (Tul.) Sacc.
Paecilomyces lilacinus (Thom) Samson
Paecilomyces tenuipes (Peck) Samson
Torrubiella aff. superficialis Kobayasi & Shimizu
Xylariaceae
Camarops aff. scleroderma (Mont.) Nannf.
Kretzschmaria clavus (Fr.) Sacc.
Moelleroclavus penicilliopsis Henn.
Thamnomyces chordalis Fr.
Xylaria aff. coccophora Mont.
Xylaria aff. tuberoides Rehm.
Xylaria comosoides Laessøe
Xylaria cubensis (Mont.) Fr.
Xylaria globosa (Spreng. ex Fr.) Mont.
Xylaria moelleroclavus Rogers, Ju & Hemmes
Xylocoremium flabelliforme (Schwein.) J.D. Rogers
BASIDIOMYCOTA
Phallaceae
Pseudocolus fusiformis (E. Fisch.) Lloyd
Staheliomyces cinctus E. Fisch.
Xylophallus xylogenus (Mont.) E. Fisch.
Tricholomataceae
Calocybe cyanella Singer ex Redhead & Singer
Collybia aff. dryophilus (Bull.) Murrill
Collybia trinitatis Dennis
Favolaschia calocera R. Heim
Gymnopus aff. neotropicus (Singer) JL Mata
Marasmius crinis-equi F. Muell. ex Kalchbr.
Marasmius nigrobrunneus (Pat.) Sacc.
Agaricaceae
Agaricus aff silvaticus Schaeff.
Leucoagaricus fragilissimus (Rav.) Pat.
Leucocoprinus birnbaumii (Corda) Singer
Cortiniariaceae
Gymnopilus chrysopellus (Berk. & M.A. Curtis) Murrill
Gymnopilus aff. subearlei R. Valenz, Guzmán & J.
Castillo
Hygrophoraceae
Hygrocybe miniata (Fr.) P. Kumm.
Pterulaceae
Pterula aff. typhuloides Corner
87
Tremellaceae
Tremella fuciformis Berk.
Tremella foliacea Pers.
Auriculariaceae
Auricularia mesenterica (Dicks.) Pers.
Exidiaceae
Pseudohydnum gelatinosum (Scop.) P. Karst.
Dacrymycetaceae
Dacryopinax spathularia (Schwein.) G.W.
Martin
Polyporaceae
Polyporus elegans Fr.
Polyporus udus Jungh.
Polyporus varius (Pers.) Fr.
Stereum hirsutum (Willd.) Pers.
Sclerodermataceae
Scleroderma sinnamariense Fr.
Thelephoraceae
Cotylidia spectabilis (Lév.) Courtec.
Boletaceae
Gyrodon exiguus Singer & Digilio
Clavariaceae
Ramaria reticulate (Berk. & Cooke) Corner
88

Appendix III: Trail system – Los Amigos Biological Station
89
BIBLIOGRAPHY
Arnolds, Eff. (2001). The future of fungi in Europe: threats, conservation and
management. In: Fungal conservation: issues and solutions. The British Mycological
Society.
Boddy, Lynne & Watkinson Sarah. 1995. Wood decomposition, higher fungi, and
their role in nutrient distribution. Can. J. Bot. 73, 1: 1377 – 1383.
Chaverri, Priscila; Vilchez, Braulio. (2006). Hypocrealean (Hypocreales,
Ascomycota) Fungal Diversity in Different Stages of Tropical Succession in Costa Rica.
Biotropica 38(4): 531 – 543.
Cifuentes Blanco, J., M. Villegas Rios, J.L. Villareal-Ordaz & S. Sierra Galvan.
(1997). Diversity of macromycetes in pine-evergreen oak forests in the Neovolcanic
Axis, Mexico. Pp 11 – 121 In: Mycology in Sustainable Development: Expanding
Concepts, Vanishing Borders. Parkway Publishers.
Da Silva, M.; Minter, D.W. (1995). Fungi from Brazil recorded by Batista and
Co-workers. Mycological Papers 16: i-ii, 1-585.
Delaney, Matt; Brown, Sandra; Lugo, Ariel; Torres-Lezama, Armando &
Quintero, Narsizo. (1998). The quantity and turnover of dead wood in permanent forest
plots in six life zones in Venezuela. Biotropica 30, 1: 2 – 11.
Dennis, R.W.G. (1970). Fungus flora of Venezuela and adjacent countries. Kew
Bulleting, additional series vol. 3.
Dennis, R.W.G. (1986). Fungi of the Hebrides. Royal Botanical Gardens, Kew,
Surrey, England.
90

Ferrer, Astrid. (2001). Diversity of wood-inhabiting Fungi in Panamanian tropical
rain forest. Dissertation, College of Environmental Science and Forestry – State
University of New York.
Foster, R. B. (2001). Some description of the Río Los Amigos, Madre de Dios,
Peru. Unpublished report for the Asociación para la Conservación de la Cuenca
Amazónica (ACCA). 2 pp.
Gazis Olivas, R. (2004). Evaluación preliminar de la micoflora localizada en los
alrededores del Centro de Investigación "Río Los Amigos," Manu. Tesis de licenciatura.
Facultad de Ciencias Biológicas, Universidad Ricardo Palma, Lima.
Gazis Olivas, Romina. (2005). Evaluación preliminar de la micoflora de la
cuenca del Río Los Amigos, Madre de Dios, Perú. Biodiversidad Amazónica 1(1): 47-
54.
Gazis Olivas, Romina & Gomez, Luis Diego. (2006). Dos Gasteromycetes
(Basidiomycotina, Fungi) del Peru. Brenesia, 65: 71.
Gilbert, Gregory. (2005). Dimensions of plant disease in tropical forests. In:
Biotic interactions in the tropics: their role in the maintenance of species diversity.
Cambridge University Press.
Hawksworth, D.L. (1991). The fungal dimension of biodiversity: magnitude,
significance and conservation. Mycological research. 25(6): 641 – 655.
Hawksworth, D.L. (1992). The tropical fungal biota: census, pertinence,
prophylaxis, and prognosis. Aspects of Tropical Mycology. pp. 265 – 293.
91

Hawksworth, David ; Minter, David ; Kinsey, Graham & Cannon, Paul. (1997).
Inventorying a Tropical Fungal biota: Intensive and Extensive Approaches. In: Tropical
mycology. Science Publishers
Hawksworth, D. L. (2001). The magnitude of fungal diversity: the 1.5 million
species estimated revisited. Mycological research. 105 (12): 1422 – 1432.
Hedger, John. (1985). Tropical Agarics: resource relations and fruiting
periodicity. In: Developmental biology of higher fungi.
Hedger, J; Lewis, P.; & Gitay, H. (1993). Litter- trapping by fungi in moist
tropical forest. In: Aspercts of tropical mycology. Cambridge University Press.
Hodge, Kathie. (2003). Clavicipitaceous Anamorphs. In: Clavicipitalean Fungi:
Evolutionary Biology: Chemistry, Biocontrol, and Cultural Impacts, pp: 75 - 123.
Hyde, Kevin & Jones, E.B.G. (2002). Introduction to fungal succession. Fungal
Diversity, Vol. 10, pp 1 – 4.
Janos, D.P. (1980). Mycorrhizae infuence tropical succession. Biotropica 12: 56 –
64.
Ing, B. (1996). Red Data List and decline in fruiting of macromycetes in relation
to pollution and loss of habitat. In: Fungi and environmental change. British Mycological
Society.
Lacy, R.C. (1984). Predictability, toxicity, and trophic niche breadth in fungus-
feeding Drosophilidae (Diptera). Ecol Entomol 9:43–54.
Laessoe, Thomas. (1999). The Xylaria comosa complex. Key Bull. 54: 605 – 619.
92
Lindblad, Irene. (2001). Diversity of poroid and some corticoid wood-inhabiting
fungi along the rainfall gradient in tropical forest, Costa Rica. Journal of Tropical
Ecology 17: 353 – 369. .
Lodge, D. Jean. (1992). Nutrient cycling by fungi in wet tropical forest. In:
Aspects of Tropical Mycology, pp: 37 - 57. British Mycological Society.
Lodge, Jean. Chapela, G. Samuels, F. A. Uecker, D. Desjardin, E. Horak, O. K.
Miller, Jr., G. L. Hennebert, C. A. Decock, J. Ammirati, H. H. Burdsall. Jr., P. M. Kirk,
D. W. Minter, R. Hailing, T. Laessøe, G. Mueller, Sabine Huhndorf, F. Oberwinkler, D.
N. Pegler, B. Spooner, R. H. Petersen, J. D. Rogers, L. Ryvarden, R. Watling, Evelyn
Turnbull, A. J. S. Whalley. (1995). A survey of patterns of diversity in non-lichenized
Fungi. Mitt. Eidgenöss. Forsch.anst. Wald Schnee Landsch. 70, 1: 157-173.
Lodge, Jean & Cantrell, Sharon. (1995). Fungal communities in wet tropical
forests: variation in time and space. Can. J. Bot. 73, 1: 1391 – 1398.
Lodge, D. Jean. (1997). Factors related to diversity of decomposer fungi in
tropical forests. Biodiversity and Conservation, 6: 681 – 688.
Mendoza, R.E. (2001). Mapa de tipos de Vegetación: Concesión Los Amigos y su
área de influencia. Informe no publicado para ACCA. 5 pp.
Moncalvo, Jean-Marc. (1997). Evaluation of Fungal Biological Diversity in the
Tropics: Systematic Perspectives. Tropical Mycology. Science Publishers.
Moore, D.; Nauta, M. M.; Evans, S. E.; & Rotheroe, M. (2001). Fungal
Conservation – Issues and Solutions, Cambridge University Press, pp. 262.
Mueller, Gregory; Bills, Gerald; & Foster, Mercedes. (2004). Biodiversity of
Fungi. Inventory and Monitoring Methods. Elsevier.
93
Mueller, Gregory M.; Schmit, John P.; Leacock, Patrick R.; Buyck, Bart;
Cifuentes, Joaquı´n; Desjardin, Dennis E.; Halling, Roy E.; Hjortstam, Kurt; Iturriaga,
Teresa; Larsson, Karl-Henrik; Lodge, D. Jean; May, Tom W.; Minter, David;
Rajchenberg, Mario; Redhead, Scott A.; Ryvarden, Leif; Trappe, James M.; Watling,
Roy; Wu, Qiuxin. 2007. Global diversity and distribution of macrofungi. Biodiversity
Conservation: 16: 37 – 48.
Onhehoja, E. (1993). Effect of weather conditions on the larger fungi at different
forest sites in northern Finland in 1976 – 1988. Acta Universitatis Oulensis, Series A 243:
1 – 69.
Osher, L. J. and S. W. Buol. 1998. Relationship of soil properties to parent
material and landscape position in eastern Madre de Dios, Peru. Geoderma 83(1-2): 143-
166.
Ovrebo, C. L. 1996. The agaric flora (Agaricales) of La Selva Biological Station,
Costa Rica. Revista de Biología Tropical 44, 4: 39-57.
Pavlich, Magdalena. (1976). Ascomycota y Basidiomycota del Perú. Universidad
Nacional de San Marcos.
Pitman, Nigel. (2007) An overview of the Los Amigos watershed, Madre de Dios,
southeastern Peru. Unpublished report. 78 pp.
Rogers, Jack. (2000). Thoughts and musings on tropical Xylariaceae. Mycol. Res.
104, 12: 1412 – 1420.
Rossman, Amy; Tulloss, Rodham; O'Dell, Thomas; & Thorn, Greg. (1998).
Protocols for an All Taxa Biodiversity Inventory of Fungi in a Costa Rican conservation
area. Parkway Publishers.
94

Ruess, L., Tiunov, A., Haubert, D., Richnow, H.H., Häggblom, M.M. & S. Scheu
(2005). Carbon stable isotope fractionation and trophic transfer of fatty acids in fungal
based soil food chains. Soil Biology & Biochemistry, 37, 945-954.
Ryvarden, Leif. (1992). Tropical polypores. In: Aspects of tropical mycology.
Singer, R. (1986). The Agaricales in modern Taxonomy. 4th edition ed. Koeltz
Scientific, Koenigstein, Germany.
Singer, R. (1989). New taxa and new combinations of Agaricales (Diagnose
Fungorum Novorum Agaricalium IV). Field Museum of Natural History, Botany, New
Series no. 21.
Smith, D. & Waller, J.M. (1992). Culture collections of microorganisms: their
importance in tropical plant pathology. Fitologia brasileira 17: 1- 8.
Straatsma, G.; F. Ayer; and S. Egli. (2001). Species richness, abundance, and
phenology of fungal fruit bodies over 21 years in a Swiss forest plot. Mycological
Research 105: 515 – 523.
Strack, B & Muller, G. (1997). The Field Itinerary of Rolf Singer. Fieldiana 38: 9
– 12.
Walting, R; Fasham, M.; & Dobson, D. (2005). Species assesment: Fungi. In:
Handbook of Biodiversity Methods. Cambridge University Press.
Whalley, A.J.S. (1985). The Xylariaceae: some ecological considerations.
Sydowia 38: 369 – 382.
Whalley, A.J.S. (1992). Tropical Xylariaceae: their distribution and ecological
characteristics. Aspects of Tropical Mycology, pp. 103 – 119.
95

VITA
Romina Gazis was born January 11, 1980, in Lima, Peru. She is the daughter of
Antonio Gazis and Orietta Olivas. In 1996 graduated from Nuestra Senora del Carmen
High School, Miraflores, Lima. She received a Bachelor of Science degree with a major
in Biology from Ricardo Palma University, Lima, Peru, in 2002. She defended her
bachelors’ thesis and licentiated in 2004.
In August, 2004, she enrolled in graduate study at Texas Christian University,
where she received her Master in Science degree in 2007.
EVALUATION OF THE MACROFUNGAL COMMUNITY AT LOS
AMIGOS BIOLOGICAL STATION, MADRE DE DIOS, PERU
by Romina Gazis, M.S, 2007
Department of Environmental Science Texas Christian University
Thesis Advisor: Dr. John Janovec, Adjunct Professor at TCU
Macrofungi represents a diverse group of taxa which play an important role in
nutrient cycling. Little is known about their diversity, community organization, variation
in time and space, and their role within the ecosystem. This study was designed to
evaluate the diversity, composition, and ecological importance of macromycetes
belonging to the Basidiomycota and Ascomycota. The project was conducted at a
lowland Amazonian rainforest area in the southeastern region of Peru, within the Amazon
basin in the Madre de Dios province. The study was divided into two main parts: (1) an
inventory involving opportunistic collections made to document the species present, and
(2) a quantitative comparison between the three major habitats of the region, primary
high-terrace forest, secondary high-terrace forest, and primary floodplain forest, using a
system of plots that were sampled during the different seasons. This is the first study to
evaluate the macrofungal communities of a lowland Amazonian forest in Peru. Three
hundred and five morphospecies were collected from Los Amigos Biological Station
(Peruvian Amazon lowland subtropical rainforest) indicating a high diversity. The fungal
family composition found in the area was typical of Neotropical areas and similar to the
ones found in the lowland regions of Brazil, Venezuela and Ecuador. Forty eight species
are presented as new records for the country.
Similarity indexes showed that the species composition varied among habitats; however
all of them were mainly composed of three families: Tricholomataceae, Polyporaceae,
and Xylariaceae. The amount of precipitation influenced the macromycetes abundance
and community composition. The outcome from this study will be stored as a
mycological database that will be available to mycologists who plan to do research in this
region. Also, the species documented will increase our knowledge of biodiversity held in
this region of the world.
Related Documents


