446 Journal of Engineering Sciences Assiut University Faculty of Engineering Vol. 49, No. 4 July 2021 PP. 446 - 475 Evaluation of the Hot Asphalt Mix Aggregate Gradation Using Bailey Method: State-of-the-art Kareem Othman 1,2 1 Civil engineering department, University of Toronto, Toronto, Canada, 35 St George St, Toronto, ON M5S 1A4 [email protected] 2 Public works department, Faculty of engineering, Cairo University, Giza, Egypt [email protected] Received 5 April 2021; Revised 17 May 2021; Accepted 23 May 2021 Abstract The selection of the aggregate gradation, in the process of the asphalt mix design, is one of the most critical steps because it accounts for the overall strength of the asphalt mixture in terms of resisting the permanent deformation or rutting. This paper focuses on evaluating the current aggregate gradation selection procedure for the hot asphalt mix (HAM) using the three Bailey ratios. Additionally, this study analyzes, theoretically, the compaction and performance characteristics of the resulting HAM designed using the traditional design procedures which follow the trial-and-error technique in order to have a mix that satisfies the specification range. Results show that 14% of the samples prepared using the traditional technique satisfy the Bailey method guidelines and thus indicate good performance in the field. However, almost 80% of the asphalt mixes are tender asphalt mixes that are prone to segregation in the field, and 6 to 7% of the asphalt mixes are hard to compact.

Welcome message from author
This document is posted to help you gain knowledge. Please leave a comment to let me know what you think about it! Share it to your friends and learn new things together.
Transcript

446
Journal of Engineering
Sciences Assiut University
Faculty of Engineering
Vol. 49, No. 4
July 2021
PP. 446 - 475
Evaluation of the Hot Asphalt Mix Aggregate
Gradation Using Bailey Method: State-of-the-art
Kareem Othman1,2
1 Civil engineering department, University of Toronto, Toronto, Canada, 35
St George St, Toronto, ON M5S 1A4
[email protected] 2 Public works department, Faculty of engineering, Cairo University, Giza,
Egypt [email protected]
Received 5 April 2021; Revised 17 May 2021; Accepted 23 May 2021
Abstract
The selection of the aggregate gradation, in the process of the asphalt mix
design, is one of the most critical steps because it accounts for the overall
strength of the asphalt mixture in terms of resisting the permanent deformation
or rutting. This paper focuses on evaluating the current aggregate gradation
selection procedure for the hot asphalt mix (HAM) using the three Bailey
ratios. Additionally, this study analyzes, theoretically, the compaction and
performance characteristics of the resulting HAM designed using the
traditional design procedures which follow the trial-and-error technique in
order to have a mix that satisfies the specification range. Results show that
14% of the samples prepared using the traditional technique satisfy the Bailey
method guidelines and thus indicate good performance in the field. However,
almost 80% of the asphalt mixes are tender asphalt mixes that are prone to
segregation in the field, and 6 to 7% of the asphalt mixes are hard to compact.

447 Othman K., Evaluation of the Hot Asphalt Mix Aggregate Gradation Using Bailey Method
Based on the findings of this research, it is recommended that the Bailey
Method analysis process should be incorporated into the mix design process as
an additional tool to develop and select trial blends for the design of the asphalt
mixes in Egypt.
Keywords: Aggregate gradation, Asphalt mix, Asphalt pavement, Bailey
design method.
1 Introduction
The transportation system is an essential element for any long-term
progress of a country. In general, one of the most important indices for
the socio-economic development of nations is the growth of the road
network. In 2014, Egypt started a major plan for the development of the
transportation infrastructure [[1]]. This plan managed to significantly
improve the quality of roads in Egypt. As a result of this program, in
2020, Egypt ranked the second in Africa and 28th globally in terms of
the quality of roads [[2]], jumping from the 118th place globally a year
before [[3]]. Thus, the appropriate planning, designing, and construction
of road networks with the proper materials and soil properties is an
essential step for the construction of these roads. Flexible pavement is
the most commonly type of pavement used in Egypt [[4]-[5]]. In general,
flexible pavement consists of a surface pavement layer in direct contact
with the running traffic followed by aggregate layers on top of the soil.
The asphalt pavement surface layer consists of hot mix asphalt and the
thickness of this layer is estimated based on multiple factors such as the
traffic loading, life cycle, the properties of the asphalt mix components,
environmental conditions, and properties of the subgrade soil properties
[[6]]. The asphalt mix consists of aggregate, which represents hard
pieces of rock, binder, and air voids. The performance of the hot asphalt
mix depends on the characteristics of its constituents and the proportion
of each. Approximately 95% of the asphalt mix weight consists of
aggregate [[7]]. Thus, the characteristics of the mix mainly depend on
the aggregate properties and its gradation. Thus, the main source of
compressive strength and resistance to movement under traffic loads or
heavy loads comes from the aggregate and its properties such as shape,
hardness, texture, and gradation of the aggregate. Of these properties,
gradation is the most unstructured [[8]]. However, it is mentioned in the
448 JES, Assiut University, Faculty of Engineering, Vol. 49, No. 4, July 2021, pp. 400 – 475
literature that aggregate gradation is one of the most important factors
that influence the asphalt mix performance as mentioned in the study by
Ahlrich [[9]]. Button et al. [[10]] show that aggregate gradation is one of
the main factors that influence the rutting performance of the asphalt
pavement. Additionally, Stakston and Bahia [[11]] state that “the rutting
performance is highly dependent on aggregate gradation” that even the
mixes with the best possible materials would fail and provide poor
asphalt mixes without a proper gradation. Bissada [[12]] reported that
the aggregate gradation significantly influences the compaction of
bituminous mixes. El-Basyouny and Mamlouk [[13]] show that the
aggregate gradation and the nominal maximum aggregate size
significantly affect the rutting performance of the asphalt pavement and
stated that the coarser gradations are expected to have better performance
than finer gradations.
Over the last few years, rutting has been recognized as one of the major
pavement distresses noticed in Egyptian roads [[14]] and this became a
concerning issue for highway engineers because of the developments in
truck loads and the associated increase in the wheel load and tire
pressures on the pavement, which increase the severity of this issue
[[15]]. Rutting can be defined as the permanent deformation that appears
on the pavement surface on the wheel path referring to accumulation in
the irrecoverable strains from repeated load cycles. Rutting can be
hazardous as it might cause sliding of vehicles and drivers might lose
control of their vehicles. In general, there are two types of rutting:
subgrade rutting and asphalt mix rutting. Subgrade rutting is caused as a
result of a structural design problem, such as the selection of a thin
pavement thickness, rather than a material problem. On the other hand,
the asphalt mix rutting is caused as a result of problems in the mix design
or problems in the compaction. Rutting in the asphalt mix can be defined
as the deformations that cannot be recovered within the asphalt layer
when the subgrade does not rut yet. This study focuses on the rutting of
the hot asphalt mix and this type of rutting is, generally, related to the
mixes that are exposed to high temperatures and subjected to heavy
traffic. In the literature, it is extensively cited that aggregate gradation is
the main factor that influences the rutting performance of the asphalt mix
[[12]-[14]]. In general, asphalt mixes are designed following the trial-
and-error approach to select the aggregate gradation that satisfies some
aggregate gradation specifications or limits. Recently, the Bailey method
for gradation selection was developed to provide some guidelines on the

449 Othman K., Evaluation of the Hot Asphalt Mix Aggregate Gradation Using Bailey Method
selection of the appropriate aggerate gradation that improves the
performance of the asphalt mix in the field. Thus, the main objectives
of this study are:
- Evaluating the current aggregate gradation selection procedure for
the hot asphalt mix using the three Bailey ratios.
- Analyze, theoretically, the compaction and performance
characteristics of the resulting hot mix asphalt mixture(s).
- Understanding the impact of the NMAS on the performance of the
asphalt mix. In other words, the impact of the NMAS on the three
Bailey ratios.
- Illustrating the importance of incorporating an analytical gradation
design and evaluation method into the Marshal mix design
procedure.
1.1 The Bailey Design method:
The Bailey method is a systematic approach for choosing the aggregate
gradation that provides interlocking between the aggregate particles.
Additionally, this method provides a set of tools for the evaluation of the
final performance of the mix. These tools provide better understanding
of the influence of the aggregate gradation on the asphalt mix. Thus, this
method provides the designers with some tools to develop and adjust the
aggregate blend to ensure good aggregate packing, offer the desired
resistance to permanent deformation, and at the same time satisfy the
volumetric properties that provide resistance to environmental distress
[[8]]. The Bailey method was proposed in the 1980s by Robert D. Bailey
and it focuses on choosing the aggregate structure that improves the air
voids, voids in mineral aggregate (VMA) and overall workability of the
mix when using Marshall or Superpave method [[15]]. The main scope
of this approach is the aggregate packing that includes coarse aggregate
structure and the particles fit into the voids within that structure. Over
the last few years, this approach was used in multiple countries such as
the United Arab Emirates, France, Canada and many states in the United
States and results showed that this method improves the performance of
the asphalt mixes [[16], [17]]. However, the Bailey method has never
been used in Egypt. In this paper, the Bailey method will be used to
evaluate the traditional asphalt mix design process and analyze the
performance of the resulting asphalt mixes.

450 JES, Assiut University, Faculty of Engineering, Vol. 49, No. 4, July 2021, pp. 400 – 475
1.2 Benefits of the Bailey Method:
Over the last few years, the Bailey Method for the selection of the
aggrege gradation was tested and compared with the traditional methods
to quantify the impact of following this new approach. Zaniewski and
Mason show that the Bailey Method can be a very useful tool to design
an optimal mix that provides the best asphalt mix performance and with
the required volumetric properties [[18]]. Thompson showed that the
Bailey method of gradation can be used for the prediction of the rutting
performance of the asphalt mix as the increasing VMA (which increased
by decreasing the coarse aggregate (CA)) tended to increase rutting
[[19]]. In 2012, Zhu Wei et al, showed that the asphalt mixes designed
using the Bailey method have much better performance than the mixes
designed by the traditional method in terms of crack resistance at low
temperature, durability and rutting resistance at high temperature [[20]].
In 2013, Shang et al. showed similar results and concluded that the use
of the Bailey method, in the mix design of a Japanese airfield pavement,
procedures gives better results and produces better rutting resistance
mixtures [[21]]. Similarly, in 2014, Manjunath and Poornachandra
showed that the asphalt mixes designed following the Bailey gradation
method perform better than the asphalt mixes designed using the
traditional technique [[22]]. In 2015, Teklu showed that the mixes
designed using the Bailey method give better rutting performance than
the Asphalt Institute gradation method. Additionally, there is a high
correlation between the CA (coarse aggregate) ratio calculated using the
Bailey method and the rutting resistance; thus, this correlation can be
used for the prediction of the asphalt mix rutting performance [[23]]. In
2016, Oufa and Abdolsamed showed that the Bailey method is useful for
evaluating the aggregate blends and that mixes with coarse gradations
are better in resisting rutting [[24]]. In 2019, Komba et al. studied the
relation between the aggregate gradation and the compatibility of HAM,
and results suggest that the Bailey ratios may be very useful to predict
HAM compatibility [[25]]. In 2020, Ghuzlan et al, demonstrated that
using the Bailey aggregate gradation approach gives good aggregate
packing expressed by good rutting performance [15].
1.3 Main principles of the Bailey Method:
As discussed in Jones (2006) [[26]], there are four main principles of the
Bailey Method:

451 Othman K., Evaluation of the Hot Asphalt Mix Aggregate Gradation Using Bailey Method
- Principle 1: this principle provides a new definition for the coarse
particles and the fine particles. This method employs the Nominal
Maximum Aggregate Size (NMAS) to estimate the volume of void
in the coarse particles. Thus, this method defined a new sieve called
the primary control sieve (PCS) for categorizing the particles into
coarse and fine particles. In general, the gradation is considered as
coarse if the percentage of the particles retained on the PCS is higher
than 50%. On the other hand, the gradation is considered fine
gradation if the percentage of the passing from the PCS is higher
than 50%.
- Principle 2: this principle is concerned with the coarse particles
determined by the PCS. More specifically, this principle focuses on
the packing of the coarse particles. In other words, the distribution
of the coarse particles. This principle introduces a new sieve called
the half-size and divides the coarse particles into two categories one
coarse and the other is the fine part that fills the void between the
coarse part in the coarse particles.
- Principle 3: focuses on the coarse particles of the fine part and the
packing of this category.
- Principle 4: focuses on the fine part of fine aggregate and the
packing of the fine portion of the gradation in the blend.
The four principles are shown in Figure 1.
Figure 1. the four principles of the Bailey Method [[27]]

452 JES, Assiut University, Faculty of Engineering, Vol. 49, No. 4, July 2021, pp. 400 – 475
2 Methodology
As discussed above, the Bailey method has been used and tested in
multiple countries and the results show that the three Bailey ratios have
direct correlations with the asphalt mix performance characteristics.
However, this method has never been used in Egypt before. Thus, in this
study, the Bailey method will be used to evaluate the aggregate structure
for multiple asphalt mixes designed using the standard procedures in
Egypt. In this study, 103 asphalt mix samples, that were used in the
construction of roads in Egypt between 2015 and 2019, will be evaluated
using the three Bailey ratios to evaluate their performance and provide
some indication about their resistance and performance in the field.
Thus, this study will focus on the two common aggregate gradations used
for the construction of roads in Egypt (4C and 3D) [[4]-[5]].
Additionally, the aggregate type used in the samples tested is dolomite,
which is the main aggregate type used in the asphalt mixes in Egypt [[4]].
Figure 2 shows the locations where these gradations were used for the
construction of the wearing course layer. Of the 103 samples tested in
this study, 64 follow the 3D aggregate gradation and 39 follow the 4C
aggregate gradation. Figures 3 and 4 show the aggregate gradation for
the asphalt mix samples with the specification limits shown in the figure
in black. Finally, Tables 1 and 2 summarize the main characteristics of
the aggregate gradation used, such as the control sieves and the three
Bailey ratios, for every asphalt mix.

453 Othman K., Evaluation of the Hot Asphalt Mix Aggregate Gradation Using Bailey Method
Figure 2. the locations where the aggregate gradations were used for the
construction of the wearing course layer in the HAM
Garden Hills, 6th of October
City
El Sadat City
Bani-Mazar Road, Giza
Mit Abu Sheikahah, Minofia
Benha University Roads
El-Farafra Dayrout Road
30th of June Corridor, Ismailia
Garden Heights, Giza

454 JES, Assiut University, Faculty of Engineering, Vol. 49, No. 4, July 2021, pp. 400 – 475
Figure 3. Aggregate gradation for all 3D samples with the gradation limits
0
20
40
60
80
100
120
0.01 0.1 1 10 100
% p
assi
ng
Sieve Size (mm)
Gradation

455 Othman K., Evaluation of the Hot Asphalt Mix Aggregate Gradation Using Bailey Method
Figure 4. Aggregate gradation for all 4D samples with the gradation limits
0
20
40
60
80
100
120
0.01 0.1 1 10 100
% p
assi
ng
Sieve Size (mm)
GradationLimts

456 JES, Assiut University, Faculty of Engineering, Vol. 49, No. 4, July 2021, pp. 400 – 475
Table 1: Control sieves and the three Bailey rations for the 3D samples
OAC NMAS(mm) PCS(mm) SCS(mm) TSC(mm) HS(mm) %P(NMPS) %P(PCS) %P(SCS) %P(TSC) %P(HS) CA FAc FAf
4.75 25 4.75 1.18 0.3 12.5 87 40.5 21 8 64 0.65 0.52 0.38
4.75 25 4.75 1.18 0.3 12.5 90 36 20 8 65 0.83 0.56 0.4
4.7 25 4.75 1.18 0.3 12.5 88 38 22 5.2 63 0.68 0.58 0.24
4.7 25 4.75 1.18 0.3 12.5 90 38 21 7 60 0.55 0.55 0.33
5.23 25 4.75 1.18 0.3 12.5 88 34 24 6 66 0.94 0.71 0.25
4.75 25 4.75 1.18 0.3 12.5 90 38 21 5 64 0.72 0.55 0.24
4.85 25 4.75 1.18 0.3 12.5 90 38 20 4 64 0.72 0.53 0.2
4.8 25 4.75 1.18 0.3 12.5 91 37 18 6 66 0.85 0.49 0.33
4.7 25 4.75 1.18 0.3 12.5 92 36 23 5 53 0.36 0.64 0.22
4.75 25 4.75 1.18 0.3 12.5 90 36 20 6.5 58 0.52 0.56 0.33
4.75 25 4.75 1.18 0.3 12.5 90 32 24 6 64 0.89 0.75 0.25
4.85 25 4.75 1.18 0.3 12.5 90 34 18 6 53 0.4 0.53 0.33
4.8 19 2.36 0.6 0.15 9.5 90 33 21 6 53 0.43 0.64 0.29
4.75 19 2.36 0.6 0.15 9.5 88 36 19 4 58 0.52 0.53 0.21
4.8 19 2.36 0.6 0.15 9.5 88 34 23 7 50 0.32 0.68 0.3
4.65 19 2.36 0.6 0.15 9.5 90 32.13 21.45 5.45 53.48 0.46 0.67 0.25
4.75 19 2.36 0.6 0.15 9.5 90 39.85 18.35 4.92 55.36 0.35 0.46 0.27
4.75 19 2.36 0.6 0.15 9.5 90 39.85 18.35 4.92 55.36 0.35 0.46 0.27
4.8 19 2.36 0.6 0.15 9.5 90 34.07 17.82 5.41 55.1 0.47 0.52 0.3
4.75 19 2.36 0.6 0.15 9.5 90 34.97 16.82 6.74 57.66 0.54 0.48 0.4
4.7 19 2.36 0.6 0.15 9.5 90 32.71 19.48 6.15 54.64 0.48 0.6 0.32
4.7 19 2.36 0.6 0.15 9.5 90 29.2 20.76 5.58 50.66 0.43 0.71 0.27

457 Othman K., Evaluation of the Hot Asphalt Mix Aggregate Gradation Using Bailey Method
OAC NMAS(mm) PCS(mm) SCS(mm) TSC(mm) HS(mm) %P(NMPS) %P(PCS) %P(SCS) %P(TSC) %P(HS) CA FAc FAf
4.8 19 2.36 0.6 0.15 9.5 90 31.79 19.98 5.13 53.56 0.47 0.63 0.26
4.8 19 2.36 0.6 0.15 9.5 90 31.53 19.45 6.38 49.72 0.36 0.62 0.33
4.7 19 2.36 0.6 0.15 9.5 90 34.59 13.88 6.29 55.63 0.47 0.4 0.45
4.75 19 2.36 0.6 0.15 9.5 90 34.19 16.59 4 54.51 0.45 0.49 0.24
4.75 19 2.36 0.6 0.15 9.5 90 33.85 19.15 7.11 51.63 0.37 0.57 0.37
4.95 19 2.36 0.6 0.15 9.5 90 33.03 20.07 4.86 58.94 0.63 0.61 0.24
4.85 19 2.36 0.6 0.15 9.5 90 33.71 20.09 4.93 55.93 0.5 0.6 0.25
4.7 19 2.36 0.6 0.15 9.5 90 34.41 20.03 5.59 62.02 0.73 0.58 0.28
4.85 19 2.36 0.6 0.15 9.5 90 31.72 19.23 6.46 49.77 0.36 0.61 0.34
4.85 19 2.36 0.6 0.15 9.5 90 33.18 21.56 5.1 56.47 0.54 0.65 0.24
4.65 19 2.36 0.6 0.15 9.5 90 32.2 20.37 7.38 55.64 0.53 0.63 0.36
4.75 19 2.36 0.6 0.15 9.5 90 31.95 22.07 5.07 52.76 0.44 0.69 0.23
4.75 19 2.36 0.6 0.15 9.5 90 29.51 19.69 4.97 52.41 0.48 0.67 0.25
4.65 19 2.36 0.6 0.15 9.5 90 31.5 19.53 5.13 47.98 0.32 0.62 0.26
4.92 19 2.36 0.6 0.15 9.5 90 30.74 20.67 4.12 55.81 0.57 0.67 0.2
4.8 19 2.36 0.6 0.15 9.5 90 34.65 14.78 4.96 47.52 0.25 0.43 0.34
4.75 19 2.36 0.6 0.15 9.5 90 32.09 19.58 5.13 52.74 0.44 0.61 0.26
4.75 19 2.36 0.6 0.15 9.5 90 31.11 18 4.42 55.31 0.54 0.58 0.25
4.7 19 2.36 0.6 0.15 9.5 90 31.45 17.29 5.35 54 0.49 0.55 0.31
4.83 19 2.36 0.6 0.15 9.5 90 31.11 20.21 6.84 59.45 0.7 0.65 0.34
4.8 19 2.36 0.6 0.15 9.5 90 35.02 18.41 4.78 50.01 0.3 0.53 0.26
4.75 19 2.36 0.6 0.15 9.5 90 30.65 19.48 5.68 55.29 0.55 0.64 0.29

458 JES, Assiut University, Faculty of Engineering, Vol. 49, No. 4, July 2021, pp. 400 – 475
OAC NMAS(mm) PCS(mm) SCS(mm) TSC(mm) HS(mm) %P(NMPS) %P(PCS) %P(SCS) %P(TSC) %P(HS) CA FAc FAf
4.7 19 2.36 0.6 0.15 9.5 90 32.81 18.1 5.56 56.92 0.56 0.55 0.31
5 19 2.36 0.6 0.15 9.5 90 29.61 13.05 4.63 56.16 0.61 0.44 0.35
4.8 19 2.36 0.6 0.15 9.5 90 38.85 16.46 3.82 54.64 0.35 0.42 0.23
4.65 19 2.36 0.6 0.15 9.5 90 37.06 18.16 4.55 59.14 0.54 0.49 0.25
4.65 19 2.36 0.6 0.15 9.5 90 37.06 18.16 4.55 59.14 0.54 0.49 0.25
4.85 19 2.36 0.6 0.15 9.5 90 29.87 19.84 5.62 52.36 0.47 0.66 0.28
4.95 19 2.36 0.6 0.15 9.5 90 28.54 15.06 7.04 52.99 0.52 0.53 0.47
4.77 19 2.36 0.6 0.15 9.5 90 30.07 19.2 4.76 53.11 0.49 0.64 0.25
4.8 19 2.36 0.6 0.15 9.5 90 31.37 19.64 5.16 50.69 0.39 0.63 0.26
4.97 19 2.36 0.6 0.15 9.5 90 35.1 17.46 3.38 61.69 0.69 0.5 0.19
4.75 19 2.36 0.6 0.15 9.5 90 35.94 15.66 4.01 53.81 0.39 0.44 0.26
4.75 19 2.36 0.6 0.15 9.5 90 33.25 19.85 6.01 51.07 0.36 0.6 0.3
4.75 19 2.36 0.6 0.15 9.5 90 37.7 11.98 2.81 52.28 0.31 0.32 0.23
4.85 19 2.36 0.6 0.15 9.5 90 28.95 12.63 4.65 47.82 0.36 0.44 0.37
4.9 19 2.36 0.6 0.15 9.5 90 33.84 17.06 4.22 52.91 0.4 0.5 0.25
5 19 2.36 0.6 0.15 9.5 90 37.21 16.44 6 55.01 0.4 0.44 0.37
4.92 19 2.36 0.6 0.15 9.5 90 31.19 19.12 4.59 53.85 0.49 0.61 0.24
4.75 19 2.36 0.6 0.15 9.5 90 30.61 15.35 6.79 56.03 0.58 0.5 0.44
5.42 19 2.36 0.6 0.15 9.5 90 28.12 19.92 5.8 51.04 0.47 0.71 0.29
5.08 19 2.36 0.6 0.15 9.5 90 30.39 19.35 5.08 52.39 0.46 0.64 0.26

459 Othman K., Evaluation of the Hot Asphalt Mix Aggregate Gradation Using Bailey Method Table 2: Control sieves and the three Bailey rations for the 4C samples
OAC NMAS(mm) PCS(mm) SCS(mm) TSC(mm) HS(mm) %P(NMPS) %P(PCS) %P(SCS) %P(TSC) %P(HS) CA FAc FAf
5.25 25 4.75 1.18 0.3 12.5 90.07673 49.95 31.25 11.23 65.74 0.46 0.63 0.36
5.28 25 4.75 1.18 0.3 12.5 90.03148 48.06 32.7 11.26 66.79 0.56 0.68 0.34
5.35 19 2.36 0.6 0.15 9.5 90 49.04 32.35 11.44 74.05 0.96 0.66 0.35
5.35 19 2.36 0.6 0.15 9.5 90 49.36 30.26 10.59 73.35 0.9 0.61 0.35
5.25 19 2.36 0.6 0.15 9.5 90 49.86 30.27 10.56 70.56 0.7 0.61 0.35
5.3 19 2.36 0.6 0.15 9.5 90 52.88 27.58 12.23 66.95 0.43 0.52 0.44
5.25 19 2.36 0.6 0.15 9.5 90 53.57 28.48 12.65 67.28 0.42 0.53 0.44
5.2 19 2.36 0.6 0.15 9.5 90 53.77 26.13 11.01 67.28 0.41 0.49 0.42
5.2 19 2.36 0.6 0.15 9.5 90 53.77 26.13 11.01 67.28 0.41 0.49 0.42
5.35 19 2.36 0.6 0.15 9.5 90 48.33 31.29 10.49 71.45 0.81 0.65 0.34
5.45 19 2.36 0.6 0.15 9.5 90 55.62 29.04 10.38 68.97 0.43 0.52 0.36
5.55 19 2.36 0.6 0.15 9.5 90 51.1 24.54 11.24 63.27 0.33 0.48 0.46
5.25 19 2.36 0.6 0.15 9.5 90 49.38 28.42 11.19 64.43 0.42 0.58 0.39
5.25 19 2.36 0.6 0.15 9.5 90 47.95 28.27 12.11 64.25 0.46 0.59 0.43
5.25 19 2.36 0.6 0.15 9.5 90 48.53 26.62 12.02 67.89 0.6 0.55 0.45
5.35 19 2.36 0.6 0.15 9.5 90 52.31 30.44 9.28 66.95 0.44 0.58 0.3
4.9 19 2.36 0.6 0.15 9.5 90 54.98 28.66 8.81 69.32 0.47 0.52 0.31
5.45 19 2.36 0.6 0.15 9.5 90 52.75 24.05 10.34 68.32 0.49 0.46 0.43
5.2 19 2.36 0.6 0.15 9.5 90 46.72 29.01 10.13 67.59 0.64 0.62 0.35
5.35 19 2.36 0.6 0.15 9.5 90 51.75 25.08 11.03 67.03 0.46 0.48 0.44
5.25 19 2.36 0.6 0.15 9.5 90 52.08 28.27 10.64 71.8 0.7 0.54 0.38
5.25 19 2.36 0.6 0.15 9.5 90 48.43 31.16 10 63.42 0.41 0.64 0.32

460 JES, Assiut University, Faculty of Engineering, Vol. 49, No. 4, July 2021, pp. 400 – 475
OAC NMAS(mm) PCS(mm) SCS(mm) TSC(mm) HS(mm) %P(NMPS) %P(PCS) %P(SCS) %P(TSC) %P(HS) CA FAc FAf
5.25 19 2.36 0.6 0.15 9.5 90 49.96 29.32 12.04 66.73 0.5 0.59 0.41
5.5 19 2.36 0.6 0.15 9.5 90 48.11 29.77 11 68.28 0.64 0.62 0.37
5.4 19 2.36 0.6 0.15 9.5 90 45.43 30.55 10.36 66.6 0.63 0.67 0.34
5.25 19 2.36 0.6 0.15 9.5 90 51.04 28.11 9.88 67.67 0.51 0.55 0.35
5.1 19 2.36 0.6 0.15 9.5 90 47.07 28.26 10.86 65.24 0.52 0.6 0.38
5.2 19 2.36 0.6 0.15 9.5 90 51.76 24.35 11.19 67.69 0.49 0.47 0.46
5.13 19 2.36 0.6 0.15 9.5 90 46.41 29.62 9.65 65.51 0.55 0.64 0.33
5.21 19 2.36 0.6 0.15 9.5 90 46.52 29.66 10.28 62.86 0.44 0.64 0.35
5.25 19 2.36 0.6 0.15 9.5 90 49.36 28.05 8.78 62.84 0.36 0.57 0.31
5.2 19 2.36 0.6 0.15 9.5 90 47.28 23.17 10.37 66.19 0.56 0.49 0.45
5.25 19 2.36 0.6 0.15 9.5 90 49.19 29.11 12.03 61.07 0.31 0.59 0.41
5.73 19 2.36 0.6 0.15 9.5 90 47.78 22.51 9.97 64.96 0.49 0.47 0.44
5.35 19 2.36 0.6 0.15 9.5 90 47.61 29.36 12.04 62.54 0.4 0.62 0.41
5.25 19 2.36 0.6 0.15 9.5 90 48.25 28.92 12.39 65.39 0.5 0.6 0.43
5.48 19 2.36 0.6 0.15 9.5 90 45.12 29.31 10.81 62.52 0.46 0.65 0.37
5.27 19 2.36 0.6 0.15 9.5 90 45.05 23.15 11.73 62.22 0.45 0.51 0.51
5.22 19 2.36 0.6 0.15 9.5 90 50.79 26.51 7.47 65.83 0.44 0.52 0.28

461 Othman K., Evaluation of the Hot Asphalt Mix Aggregate Gradation Using Bailey Method
2.1 Control sieves:
In the Bailey method, there are three main control sieves to classify the
different particles in the aggregate gradation as shown in Figure 5.
Starting with the Primary Control Sieve (PCS) which can be defined as
the sieve that separates the coarse and fine particles and it is calculated
based on the Nominal Maximum Aggregate Size (NMAS) [[28]] as
follows:
𝑃𝐶𝑆 = 0.22 ∗ 𝑁𝑀𝐴𝑆
The value of 0.22 was adopted from the packing theory as an average of
aggregate diameter ratios that theoretically ranges from 0.15 for rounded
aggregate to 0.29 for flat aggregates. The second control sieve is called
the secondary control sieve (SCS) and the main objective of this control
point is to split the fine part into two further fractions and the SCS is
calculated based on the PCS as follows:
𝑆𝐶𝑆 = 0.22 ∗ 𝑃𝐶𝑆
Finally, the third control point is the Tertiary Control Sieve (TCS) which
is calculated as follows:
𝑇𝐶𝑆 = 0.22 ∗ 𝑆𝐶𝑆
Figure 5. overview of the three control points [8]
2.2 Analysis of the Design Blend
In addition to the previous control points, the Bailey method suggested
three additional ratios for the purpose of evaluating the aggregate blend.
These ratios are used to understand the aggregate gradation based on the

462 JES, Assiut University, Faculty of Engineering, Vol. 49, No. 4, July 2021, pp. 400 – 475
previous control points. These ratios are the Coarse Aggregate Ratio (CA
Ratio), Fine Aggregate Coarse Ratio (FAc), and Fine Aggregate Fine
Ratio (FAf).
2.2.1 CA ratio:
The CA ratio is a representation of the interlocking between the coarse
particles and provides a better understanding of the void structure
between these particles. This ratio introduces a new sieve size which is
the half-size (HS) which is half the NMAS:
𝐻𝑆 =𝑁𝑀𝐴𝑆
2
The aggregate particles between the two sizes HS and PCS are called the
interceptors and changing the percentage of aggregate between these two
sizes significantly affects the voids in the mineral aggregate (VMA) as
the fine part of the coarse aggregate will fill the voids between the coarse
part. Interceptors are too large to fit in the voids created by the larger
coarse aggregate particles. With a balanced aggregate structure, the
mixture should be easy to compact in the field and should adequately
perform under load. The CA ratio is calculated as follows:
𝐶𝐴 =%𝑝𝑎𝑠𝑠𝑖𝑛𝑔 (𝐻𝑆) − %𝑝𝑎𝑠𝑠𝑖𝑛𝑔 (𝑃𝐶𝑆)
100% − %𝑝𝑎𝑠𝑠𝑖𝑛𝑔 (𝐻𝑆)
In general, the CA ratio plays an important role in understanding the
mixture degree of compaction or in other words provides an indication
for the compaction. Asphalt mixes with low CA values (lower than 1)
have a better degree of compaction than mixes with a large CA ratio. CA
ratio of 1 means that the mix contains an equal amount of interceptors
and coarser aggregate, which indicates good interlocking between the
particles and high degree of compaction. On the other hand, mixes with
high CA ratios (more than one) indicate that the mixes contain a large
number of interceptors may lead to segregation and produces mixes that
are hard to compact.

463 Othman K., Evaluation of the Hot Asphalt Mix Aggregate Gradation Using Bailey Method
2.2.2 FAc ratio:
Similar to the previous case, voids will be introduced between the
particles of the coarse part of the fine aggregate. Thus, the main objective
of the finer particles is to fill the void between these particles. The FAc
is used to show the ratio of these fractions and it is estimated using the
following equation:
𝐹𝐴𝑐 =%𝑝𝑎𝑠𝑠𝑖𝑛𝑔 (𝑆𝐶𝑆)
%𝑝𝑎𝑠𝑠𝑖𝑛𝑔 (𝑃𝐶𝑆)
The desired FAc value should be around 0.5, as high values of FAc
(higher than 0.5) indicate that the mix contains a large amount of fine
particles. On the other hand, the very low values of FAc (lower than 0.5)
indicate that the mix is not uniformly graded because of the low fine
aggregates in the mix.
2.2.3 FAf ratio:
The FAc is the most important ratio for understanding the mix air voids
and the required binder content because it focuses on the fine particles
in the mix, including the filler, and it is calculated using the following
equation:
𝐹𝐴𝑓 =%𝑝𝑎𝑠𝑠𝑖𝑛𝑔 (𝑇𝐶𝑆)
%𝑝𝑎𝑠𝑠𝑖𝑛𝑔 (𝑆𝐶𝑆)
2.2.4 Effect of the FAc and FAf ratio:
High values of FAc and FAf indicate that the mix contains excessive
amount of fine particles. If the ratio of any of these two ratios goes higher
than 0.5, it indicates that the mix will show a “hump” in the sand portion
of the gradation curve of a 0.45 gradation chart, which is generally
accepted as an indication of a potentially tender mixture. On the other
hand, if the ratios are lower than the guidelines, the gradation is not
uniform. These mixtures are generally gap-graded and have a “belly” in
the 0.45-power grading chart, which can indicate instability and may
lead to compaction problems.
2.2.5 Summary of the ratios:
- CA ratio: this ratio describes how the coarse particles of the
aggregate are packed together and how these particles compact the

464 JES, Assiut University, Faculty of Engineering, Vol. 49, No. 4, July 2021, pp. 400 – 475
fine aggregate portion of the aggregate blend that fills the voids
created by the coarse aggregate.
- FAc ratio: this ratio shows how the coarse particles of the fine
particles are packed together and how these particles compact the
material that fills the voids created.
- FAf ratio: this ratio shows how the fine portion of the fine particles
are packed together.
Figure 6 summarizes these rations with the three control points. Based
on the previous studies and the performance of a large number of asphalt
mixes, the Bailey method provides some guidelines for the selection of
aggregate gradation. The guidelines are discussed in the study by Aurilio
et al [[27]] and are summarized in table 3.
Figure 6. summarization of the control points and the Bailey ratios (adopted from
[8])
Table 3. Bailey method ratio guidelines [[27]]
NMAS
(mm)
37.5 25 19 12.5 9.5 4.75
CA ratio 0.8-0.95 0.7-0.85 0.6-0.75 0.5-0.65 0.4-0.55 0.3-0.45
FAc ratio 0.35 - 0.5
FAf ratio 0.35 - 0.5
3 Analysis and results
3.1 Analysis of the 3D samples:
This section focuses on analyzing the 64 asphalt mix samples designed
following the 3D aggregate gradation using the three ratios introduced
by the Bailey method. Figures 7 and 8 show the frequency of the CA

465 Othman K., Evaluation of the Hot Asphalt Mix Aggregate Gradation Using Bailey Method
ratios and the FAc ratios. From Figure 7, it can be seen that a small
proportion of samples fall on the recommended guidelines as follows:
- 80% of the samples have CA ratio less than the specification, which
indicates that these samples represent gab graded samples and are
prone to segregation.
- 14% of the samples are within the Bailey method guidelines.
- 6% of the samples have CA ratio higher than the guidelines, which
indicates that these samples are hard to compact in the field.
From figure 8, it can be seen that a small proportion of samples fall on
the recommended guidelines as follows:
- 0% of the samples have FAc ratio less than the recommendations
provided by the Bailey method guidelines.
- 25% of the samples are within the Bailey method guidelines.
- 75% of the samples have FAc ratio higher than the guidelines, which
indicates that these samples represent tender mixtures.
Figure 7. Frequency of the CA ratios for the 3D asphalt mixes
0%
20%
40%
60%
80%
100%
0
2
4
6
8
10
12
0.2
0.2
5
0.3
0.3
5
0.4
0.4
5
0.5
0.5
5
0.6
0.6
5
0.7
0.7
5
0.8
0.8
5
0.9
0.9
5 1
Cu
mu
lati
ve F
req
uen
cy
Freq
uen
cy
CA
Frequency Cumulative %
CA within the
Guidlines
Mixes that are hard to
comapct
Gap gradede mixes
(Segregation)

466 JES, Assiut University, Faculty of Engineering, Vol. 49, No. 4, July 2021, pp. 400 – 475
Figure 8. Frequency of the FAc ratios for the 3D asphalt mixes
Additionally, it is important to understand the impact of the NMAS on
the Bailey ratios. Thus, a detailed analysis was carried out based on the
NMAS. Out of the 64 (3D) samples, there are 12 samples with a NMAS
of 25 mm and 52 samples with a NMAS of 19 mm. Figures 9 and 10
show the frequency of the CA ratios and the FAc ratios for the (3D)
samples that have a NMAS of 25 and Figures 11 and 12 show the
frequency of the CA ratios and the FAc ratios for the (3D) samples that
have a NMAS of 19 mm. Table 4 summarizes the percentage of samples
that follow the Bailey method guidelines for the 3D aggregate gradations
with 19 and 25 mm NMAS. Results show that there is a significant
difference in the percentage of samples that follow the guidelines. For
the CA ratio, 42% of the samples with 25 mm NMAS follow the Bailey
method guidelines; however, only 10% of the samples with 19 mm
NMAS follow the Bailey method guidelines. On the other hand, for the
FAc ratio, only 10% of the samples with 25 mm NMAS follow the
Bailey method guidelines; however, 30% of the samples with 19 mm
NMAS follow the Bailey method guidelines.
0%
20%
40%
60%
80%
100%
0
2
4
6
8
10
12
14
0.3 0.35 0.4 0.45 0.5 0.55 0.6 0.65 0.7 0.75 0.8
Cu
mu
lati
ve F
req
uen
cy
Freq
uen
cy
FAc
Frequency Cumulative %
FAc within the
Excessive fine
(tender mixture)

467 Othman K., Evaluation of the Hot Asphalt Mix Aggregate Gradation Using Bailey Method
Figure 9. Frequency of the CA ratios for the 3D asphalt mixes with a NAMS of 25
mm
Figure 10. Frequency of the FAc ratios for the 3D asphalt mixes with a NAMS of
25 mm
0%
20%
40%
60%
80%
100%
0
0.5
1
1.5
2
2.5
0.2
0.2
5
0.3
0.3
5
0.4
0.4
5
0.5
0.5
5
0.6
0.6
5
0.7
0.7
5
0.8
0.8
5
0.9
0.9
5 1
Cu
mu
lati
ve F
req
uen
cy
Freq
uen
cy
CA
Frequency Cumulative %
CA within the
Guidlines Mixes that are hard to
comapct
Gap gradede mixes
(Segregation)
0%
20%
40%
60%
80%
100%
0
1
2
3
4
5
6
0.3 0.35 0.4 0.45 0.5 0.55 0.6 0.65 0.7 0.75 0.8
Cu
mu
lati
ve F
req
uen
cy
Freq
uen
cy
FAc
Frequency Cumulative %
FAc within the
Guidlines Excessive fine (tender
mixture)

468 JES, Assiut University, Faculty of Engineering, Vol. 49, No. 4, July 2021, pp. 400 – 475
Figure 11. Frequency of the CA ratios for the 3D asphalt mixes with a NAMS of 19
mm
Figure 12. Frequency of the FAc ratios for the 3D asphalt mixes with a NAMS of
19 mm
0%
20%
40%
60%
80%
100%
0
2
4
6
8
10
12
14
0.2
0.2
5
0.3
0.3
5
0.4
0.4
5
0.5
0.5
5
0.6
0.6
5
0.7
0.7
5
0.8
0.8
5
0.9
0.9
5 1
Cu
mu
lati
ve F
req
uen
cy
Freq
uen
cy
CA
Frequency Cumulative %
CA within the
Guidlines
Mixes that are hard to
comapct
Gap gradede mixes
(Segregation)
0%
20%
40%
60%
80%
100%
0
2
4
6
8
10
12
14
16
0.3 0.35 0.4 0.45 0.5 0.55 0.6 0.65 0.7 0.75 0.8
Cu
mu
lati
ve F
req
uen
cy
Freq
uen
cy
FAc
Frequency Cumulative %
FAc within the
Guidlines
Excessive fine (tender
mixture)
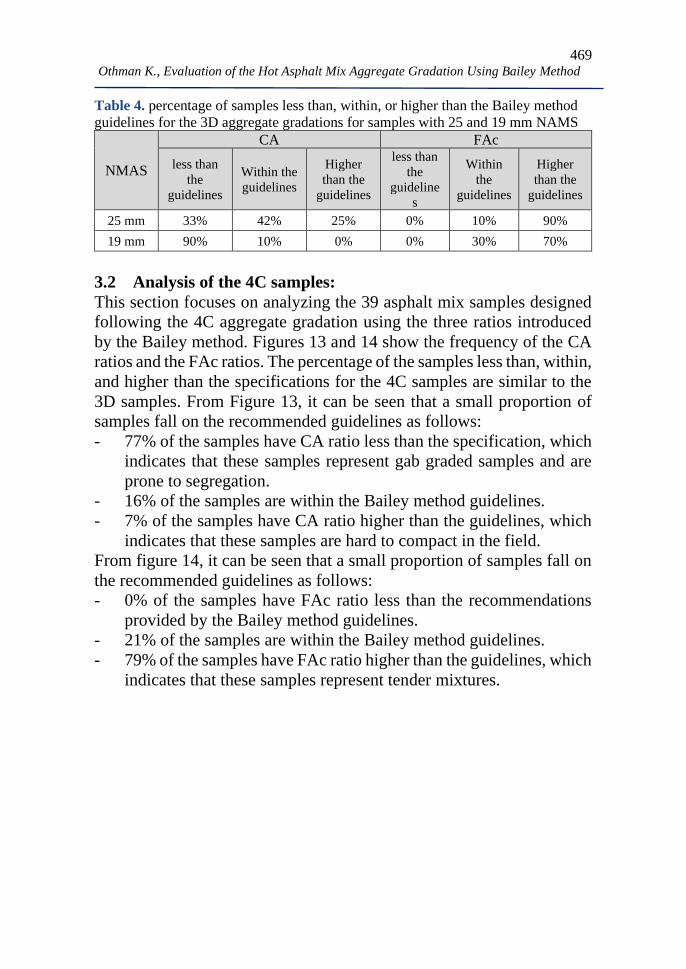
469 Othman K., Evaluation of the Hot Asphalt Mix Aggregate Gradation Using Bailey Method Table 4. percentage of samples less than, within, or higher than the Bailey method
guidelines for the 3D aggregate gradations for samples with 25 and 19 mm NAMS
NMAS
CA FAc
less than
the
guidelines
Within the
guidelines
Higher
than the
guidelines
less than
the
guideline
s
Within
the
guidelines
Higher
than the
guidelines
25 mm 33% 42% 25% 0% 10% 90%
19 mm 90% 10% 0% 0% 30% 70%
3.2 Analysis of the 4C samples:
This section focuses on analyzing the 39 asphalt mix samples designed
following the 4C aggregate gradation using the three ratios introduced
by the Bailey method. Figures 13 and 14 show the frequency of the CA
ratios and the FAc ratios. The percentage of the samples less than, within,
and higher than the specifications for the 4C samples are similar to the
3D samples. From Figure 13, it can be seen that a small proportion of
samples fall on the recommended guidelines as follows:
- 77% of the samples have CA ratio less than the specification, which
indicates that these samples represent gab graded samples and are
prone to segregation.
- 16% of the samples are within the Bailey method guidelines.
- 7% of the samples have CA ratio higher than the guidelines, which
indicates that these samples are hard to compact in the field.
From figure 14, it can be seen that a small proportion of samples fall on
the recommended guidelines as follows:
- 0% of the samples have FAc ratio less than the recommendations
provided by the Bailey method guidelines.
- 21% of the samples are within the Bailey method guidelines.
- 79% of the samples have FAc ratio higher than the guidelines, which
indicates that these samples represent tender mixtures.

470 JES, Assiut University, Faculty of Engineering, Vol. 49, No. 4, July 2021, pp. 400 – 475
Figure 13. Frequency of the CA ratios for the 4C asphalt mixes
Figure 14. Frequency of the FAc ratios for the 4C asphalt mixes
For the impact of the NMAS on the Bailey ratios, this analysis was not
carried out because there are only 2 samples that have a NMAS of 25
0%
10%
20%
30%
40%
50%
60%
70%
80%
90%
100%
0
2
4
6
8
10
12
0.2
0.2
5
0.3
0.3
5
0.4
0.4
5
0.5
0.5
5
0.6
0.6
5
0.7
0.7
5
0.8
0.8
5
0.9
0.9
5 1
Cu
mu
lati
ve F
req
uen
cy
Freq
uen
cy
CA
Frequency Cumulative %
CA within the
Guidlines
Mixes that are hard to
comapct
Gap gradede mixes
(Segregation)
0%
20%
40%
60%
80%
100%
0
2
4
6
8
10
12
14
0.3 0.35 0.4 0.45 0.5 0.55 0.6 0.65 0.7 0.75 0.8
Cu
mu
lati
ve F
req
uen
cy
Freq
uen
cy
FAc
Frequency Cumulative %
FAc within the
Guidlines Excessive fine (tender mixture)

471 Othman K., Evaluation of the Hot Asphalt Mix Aggregate Gradation Using Bailey Method
mm and the remaining 37 samples have a NMAS of 19 mm. thus, the
data are not sufficient for analyzing the impact of the NMAS on the
Bailey ratios.
4 Conclusions The transportation system is an essential element for any long-term
progress of a country that one of the most important indices for the socio-
economic development of nations is the growth of the road network. In
2014, Egypt started a major plan for the development of the
transportation infrastructure. This plan managed to significantly improve
the quality of roads in Egypt. Thus, the appropriate planning, designing,
and construction of road networks with the proper materials and soil
properties is an essential step for the construction of these roads. In this
study, 103 asphalt mix samples are designed following the trial-and-error
approach to select the aggregate gradation that satisfies some aggregate
gradation specifications or limits. In this study, the Bailey ratios are used
to evaluate the traditional aggregate gradation selection technique and
results show that:
- For both the 3D and 4C gradations, Table 5 summarizes the
percentage of samples that follow the Bailey method guidelines for
the two aggregate gradations used in this study. Results show that
almost 80% of the asphalt mixes designed using the traditional
technique with no guidelines regarding the aggregate gradation
produces gap graded asphalt mixes that are prone to segregation with
CA ratio lower than the guidelines, 6 to 7% of the asphalt mixes
have CA ratios higher than the guidelines which indicates that these
mixes are hard to compact, and 15% of the mixes satisfy the Bailey
method guidelines and indicate good performance in the field.
Table 5. percentage of samples less than, within, or higher than the Bailey
method guidelines for the two aggregate gradations tested
CA FAc
less than
the
guideline
s
Within
the
guideline
s
Higher
than the
guideline
s
less than
the
guideline
s
Within
the
guideline
s
Higher
than the
guideline
s
3D 80% 14% 6% 0% 25% 75%
4C 77% 16% 7% 0% 21% 79%

472 JES, Assiut University, Faculty of Engineering, Vol. 49, No. 4, July 2021, pp. 400 – 475
- For the FAc ratio of both 3D and 4C gradations, results show that
almost 80% of the asphalt mixes designed using the traditional
technique produces have excessive fines as the FAc ratio is higher
than the guidelines, which indicates that these mixes are tender
asphalt mixes. On the other hand, 20% of the samples satisfy the
Bailey method guidelines, which indicates good performance in the
field.
- Studying the impact of the NMAS on the three Bailey ratios, results
show that the NMAS has a significant influence on the Bailey ratios
as follows:
• While most of the samples that have a NMAS of 25 mm satisfy
the CA guidelines (42%), most of these samples (90%) have high
FAc ratios, which indicates that these samples are tender mixes.
Thus, most of the samples that satisfy the CA guidelines do not
satisfy the FAc ratio guidelines.
• For the 3D samples with a NMAS of 19 mm, results indicate that
most of these samples (90%) have CA ratios that are lower than
the guidelines, which indicates that these samples are gap graded
and are prone to segregation. On the other hand, more samples
satisfy the FAc ratio guidelines than the samples with a NMAS
of 25mm. However, around 70% of the samples have high FAc
ratios, which indicates that these samples are tender mixes. Thus,
most of the samples that satisfy the FAc guidelines do not satisfy
the CA ratio guidelines.
- Based on the previous discussion and analysis, it must be mentioned
that it is highly recommended to incorporate an analytical gradation
design and evaluation method such as the Bailey design method into
the Marshal mix design procedure to improve the performance of
the asphalt mixes designed in the field and in order to increase the
cycle life of the asphalt mixes in Egypt. However, more research
should be undertaken to further validate the Bailey method by using
wheel tracking test devices to confirm the improvements in the
performance of the asphalt mixtures in Egypt.

473 Othman K., Evaluation of the Hot Asphalt Mix Aggregate Gradation Using Bailey Method
References [1]. Egypt Independent. Egypt’s road quality now 2nd place in Africa: Prime
Minister. 2020. https://egyptindependent.com/egypts-road-quality-now-2nd-
place-globally-prime-minister/
[2]. The Global Economy.. Roads quality - Country rankings. 2021.
https://www.theglobaleconomy.com/rankings/roads_quality/
[3]. Woof, MJ. .Worldhighways. Egypt’s massive road building expansion
programme. https://www.worldhighways.com/wh10/news/egypts-massive-
road-building-expansion-programme
[4]. Mousa, K.M., Abdelwahab, H.T., Hozayen H.A., Models for estimating
optimum asphalt content from aggregate gradation. Proceedings of the
Institution of Civil Engineers – Construction Materials, 174(2): 69–74,
2021, https://doi.org/10.1680/jcoma.18.00035
[5]. Othman, K.M.M., and Abdelwahab, H., Prediction of the Optimum Asphalt
Content Using Artificial Neural Networks. Metallurgical and Materials
Engineering Journal, Association of Metallurgical Engineers of Serbia
AMES. 2021. https://doi.org/10.30544/579
[6]. Ma, T., Huang, X., Zhao, Y., Yuan, H., Ma, X. Degradation behavior and
mechanism of HMA aggregate, J. Test. Eval. 40 (5) (2012) 697–707.
[7]. Sangsefidi, E. Ziari, H. Sangsefidi, M. The effect of aggregate gradation
limits consideration on performance properties and mixture design
parameters of hot mix asphalt, KSCE Journal of Civil Engineers 20(1): 385–
392, 2015.
[8]. Aho, B. et al., Bailey Method for Gradation Selection in Hot-Mix Asphalt
Mixture Design. TRANSPORTATION RESEARCH CIRCULAR. ISSN
0097-8515. Number E-C044 October 2002. Transportation Research Board.
[9]. Ahlrich, R.C. Influence of Aggregate Gradation and Particle Shape/Texture
on Permanent Deformation of Hot Mix Asphalt Pavements, Army Engineer
Waterways Experiment Station Vicksburg MS Geotechnical Lab. 1996.
[10]. Button, J.W., Perdomo, D., and Lytton, R.L. Influence of Aggregate on
Rutting in Asphalt Concrete Pavements, Transportation Research Board.
1990.
[11]. Stakston, A.D., and Bahia, H. The Effect of Fine Aggregate Angularity,
Asphalt Content and Performance Graded Asphalts on Hot Mix Asphalt
Performance, University of Wisconsin – Madison, Department of Civil and
Environmental Engineering. 2003.
[12]. Bissada A F,. Resistance to compaction of asphalt paving mixtures and its
relationship to stiffness.” ASTM STP 829, USA. 1984.
[13]. El-Basyouny, M.M. and Mamlouk, M.S., Effect of aggregate gradation on
rutting potential of Superpave mixes, Paper presented at 78th annual meeting
of the Transportation Research Board, Washington D.C. 1999.
[14]. Vavrik, W.R., Asphalt mixture design concepts to develop aggregate
interlock (Doctoral dissertation), University of Illinois at Urbana-
Champaign), 2000.
[15]. Vince A, Pine WJ, Lum P. The Bailey method—achieving volumetric and
HMA compatibility. Course Materials and Handouts (2009)

474 JES, Assiut University, Faculty of Engineering, Vol. 49, No. 4, July 2021, pp. 400 – 475
[16]. Vavrik WR, Huber G, Pine WJ, Carpenter SH, Bailey R. Bailey method for
gradation selection in hot-mix asphalt mixture design. Transportation
Research Board Circular No.EC044, Natl Res Counc, Washington DC. 2002.
[17]. Vavrik W.R., Pine W.J., Huber G., Carpenter S.H. The Bailey method of
gradation evaluation: the influence of aggregate gradation and packing
characteristic on voids in the mineral aggregate. J Assoc Asphalt Paving
Technol 70. 2001.
[18]. Zaniewski, J.P., Mason, C., An Evaluation of The Bailey Method to Predict
Voids in The Mineral Aggregate, Division of Highways, Charleston, WV,
2006.
[19]. Thompson, G., Investigation of the Bailey Method for the design and analysis
of dense-graded HMAC using Oregon aggregates. Final report, Oregon
Department of Transportation, Research Unit. SPR-304-311, 2006.
[20]. Zhu, W. Li, H.Z., Ma, S.R., Liu, D.B., Application of Bailey Method for
Aggregate Grading Design of Continuous Dense Gradation Asphalt Mixture,
in: Advanced Materials Research. Trans Tech Publications, 2012, Vol. 413,
pp. 154–159. doi:10.4028/www.scientific.net/AMR.413.154
[21]. Shang, G.T., Takahashi, O., Maekawa, R. Recommended combination of the
Bailey parameters in Superpave gradation design for Japanese airfield
pavements, Int. J. Pavement Res. Technol. 6 (6) (2013) 704–713.
[22]. Manjunath, K.R., Poornachandra N.B., Design of hot mix asphalt using bailey
method of gradation, Int. J. Res. Eng. Tech. 03 (06) (2014) 386–393,
https://doi.org/10.15623/ijret.2014.0306072
[23]. Teklu, W. Effect of Gradation of aggregates on the rutting performance of hot
mix asphalt. (Doctoral dissertation), ADDIS ABABA UNIVERSITY ADDIS
ABABA, 2015.
[24]. Oufa, M.S., Abdolsamedb, A.A., Controlling rutting performance of hot mix
asphalt, Int. J. Sci. Eng. Res. 6 (12) (2016).
[25]. Komba, J.J., Maina, J.W., Horak, E., Steyn, W.J., Relationship between
aggregate packing characteristics and compactability of Hot-Mix Asphalt
mixes, in: Airfield and Highway Pavements 2019: Testing and
Characterization of Pavement Materials, American Society of Civil
Engineers, Reston, VA, 2019, pp. 183–194.
[26]. Jones, W., The Bailey Method, A Tool Jbr Evaluating HMA Volumetrics and
Field Compatibility. 2006.
[27]. Aurilio, V. Pine, WJ. Lum, P. Bailey Method - Achieving Volumetrics and
HMA Compactability. Fiftieth Annual Conference of the Canadian Technical
Asphalt Association (CTAA). Victoria British Columbia, Canada. 2005.
[28]. Vavrik, W.R., Pine, W.J., Carpenter, S.H., Aggregate blending for asphalt
mix design: Bailey method, Transp. Res. Rec. 1789 (1) (2002) 146–153.

475 Othman K., Evaluation of the Hot Asphalt Mix Aggregate Gradation Using Bailey Method
باستخدام الإسفلتيةالخلطة علىتأثير تدرج الركام تقييم
طريق بايلي
الملخص
لما ات التصميم وخطمن اهم لتيةفسالإ الخلطةتدرج الركام في عمليه تصميم ختيارايعد
في هذا البحث بما في ذلك مقاومه التخدد. الإسفلتية الخلطةله من تأثير علي قوه ومقاومه
الاجراءات سيتم الركام الخاصة الحاليةتقييم تدرج الخلطات باختيار الإسفلتية في
بشكل نظري يحللهذا البحث سيقيم و ذلك، ي ال بالإضافة. الثلاثةتخدام نسب بايلي اسب
والتي التقليدية الطريقةالتي يتم تصميمها باستخدام الإسفلتيةاداء وخصائص الخلطات
خلطه حتى والخطأ المحاولةاسلوب علىتعتمد الي نطاق الوصول وتحقق تفي
التقليدية الطريقة من العينات التي يتم تجهيزها باستخدام %14تبين النتائج ان . المواصفات
يد الاخر، ع علي الصلديها اداء جيد في الموقع. وبالتاليتحقق مواصفات طريقه بايلي
معرضه لفصل وبالتاليخلطات تعتبر خلطات لينه من ال %80 يبينت النتائج ان حوال
من الخلطات %7الي 6الي ذلك، وضحت النتائج ان حوالي فة ابالإض . الخلطةالركام عن
فانه يوصي باستخدام نتائج هذا البحث علىبناء . في الموقع في دمكها صعوبةتعاني من
.في مصر لتيةفسالإطريقه بايلي في عمليه تصميم الخلطات
Related Documents