General rights Copyright and moral rights for the publications made accessible in the public portal are retained by the authors and/or other copyright owners and it is a condition of accessing publications that users recognise and abide by the legal requirements associated with these rights. Users may download and print one copy of any publication from the public portal for the purpose of private study or research. You may not further distribute the material or use it for any profit-making activity or commercial gain You may freely distribute the URL identifying the publication in the public portal If you believe that this document breaches copyright please contact us providing details, and we will remove access to the work immediately and investigate your claim. Downloaded from orbit.dtu.dk on: May 19, 2019 Evaluation of the efficiency of alternative enzyme production technologies Albæk, Mads Orla Publication date: 2012 Document Version Publisher's PDF, also known as Version of record Link back to DTU Orbit Citation (APA): Albæk, M. O. (2012). Evaluation of the efficiency of alternative enzyme production technologies. Kgs. Lyngby: Technical University of Denmark, Department of Chemical Engineering.

Welcome message from author
This document is posted to help you gain knowledge. Please leave a comment to let me know what you think about it! Share it to your friends and learn new things together.
Transcript

General rights Copyright and moral rights for the publications made accessible in the public portal are retained by the authors and/or other copyright owners and it is a condition of accessing publications that users recognise and abide by the legal requirements associated with these rights.
Users may download and print one copy of any publication from the public portal for the purpose of private study or research.
You may not further distribute the material or use it for any profit-making activity or commercial gain
You may freely distribute the URL identifying the publication in the public portal If you believe that this document breaches copyright please contact us providing details, and we will remove access to the work immediately and investigate your claim.
Downloaded from orbit.dtu.dk on: May 19, 2019
Evaluation of the efficiency of alternative enzyme production technologies
Albæk, Mads Orla
Publication date:2012
Document VersionPublisher's PDF, also known as Version of record
Link back to DTU Orbit
Citation (APA):Albæk, M. O. (2012). Evaluation of the efficiency of alternative enzyme production technologies. Kgs. Lyngby:Technical University of Denmark, Department of Chemical Engineering.

Evaluation of the efficiency of
alternative enzyme production
technologies
Mads Orla Albæk
Ph.D. Thesis
March 2012


Evaluation of the efficiency of alternative enzyme
production technologies
Ph.D. thesis
Mads Orla Albæk
Department of Chemical and Biochemical Engineering
Technical University of Denmark
March 30th 2012
Supervisors:
Associate Professor Krist V. Gernaey
Morten S. Hansen
Stuart M. Stocks

Copyright©: Mads Orla Albæk
March 2012
Address: Fermentation Pilot Plant
Novozymes A/S
Krogshøjvej 36
DK- 2880 Bagsværd
Denmark
Phone: +45 61 26 47 48
Web: www.novozymes.com
Print: J&R Frydenholm A/S
København
2012
ISBN: xxx-xx-xx-xx-xxxx

iii
Abstract
Enzymes are used in an increasing number of industries. The application of enzymes is extending
into the production of lignocellulosic ethanol in processes that economically can compete with
fossil fuels. Since lignocellulosic ethanol is based on renewable resources it will have a positive
impact on for example the emission of green house gasses. Cellulases and hemi-cellulases are used
for enzymatic hydrolysis of pretreated lignocellulosic biomass, and fermentable sugars are released
upon the enzymatic process. Even though many years of research has decreased the amount of
enzyme needed in the process, the cost of enzymes is still considered a bottleneck in the economic
feasibility of lignocellulose utilization. The purpose of this project was to investigate and compare
different technologies for production of these enzymes. The filamentous fungus Trichoderma reesei
is currently used for industrial production of cellulases and hemi-cellulases. The aim of the thesis
was to use modeling tools to identify alternative technologies that have higher energy or raw
material efficiency than the current technology.
The enzyme production by T. reesei was conducted as an aerobic fed-batch fermentation. The
process was carried out in pilot scale stirred tank reactors and based on a range of different process
conditions, a process model was constructed which satisfactory described the course of
fermentation. The process was governed by the rate limiting mass transfer of oxygen from the gas
to the liquid phase. During fermentation, filamentous growth of the fungus lead to increased
viscosity which hindered mass transfer. These mechanisms were described by a viscosity model
based on the biomass concentration of the fermentation broth and a mass transfer correlation that
incorporated a viscosity term. An analysis of the uncertainty and sensitivity of the model indicated
the biological parameters to be responsible for most of the model uncertainty.
A number of alternative fermentation technologies for enzyme production were identified in the
open literature. Their mass transfer capabilities and their energy efficiencies were evaluated by use
of the process model. For each technology the scale-up enzyme production was simulated at
industrial scale based on equal mass transfer. The technical feasibility of each technology was
assessed based on prior knowledge of successful implementation at industrial scale and mechanical
complexity of the fermentation vessel. The airlift reactor was identified as a potential high energy
efficiency technology for enzyme production with excellent chances for success.
Two different pilot plant configurations of the airlift reactor technology were tested in nine
fermentations. The headspace pressure was varied between 0.1 and 1.1 barg and the superficial gas

iv
velocity in the airlift riser section was varied between 0.02 and 0.06 m/s. The biological model
developed in the stirred tank reactor was shown to apply to the airlift reactor with only small
modifications: The mass transfer of oxygen in the airlift reactor was studied and a mass transfer
correlation containing the superficial gas velocity and the apparent viscosity of the fermentation
broth was shown to describe the experimental data well. The mass transfer rate was approximately
20% lower than the literature data for airlift reactors. Mixing in the pilot scale airlift reactor was
also studied. As the mixing time was of the same order of magnitude as the characteristic time for
oxygen transfer, mixing could also be limiting the process at that scale. The process model for the
airlift reactor was also shown to describe the experimental data well for a range of process
conditions.
A cost function for oxygen transfer including the equipment cost and running cost for nutrients and
electricity was developed for both the stirred tank reactor and the airlift reactor. The cost function
was used to identify an optimum range of reactor configuration and process conditions for industrial
scale enzyme production fermentors. It was shown that compared to the stirred tank reactor 22% of
the electricity cost might be reduced for the airlift reactor, and the capital cost might also be
somewhat lower. However, since the electricity cost is a relatively minor part of the total cost, there
might currently not be an obvious fiscal motive to change technology. The cost of nutrients is
considerably larger than the electricity cost and was shown to be independent of the technology and
process conditions. If the cost structure changes in the future and the airlift reactor is chosen as the
alternative production technology, suggestions on the practical scale-up procedure are given. These
include the use of Computational Fluid Dynamics (CFD) and scale-down models of the production
environment.

v
Dansk resume
I det foreliggende erhvervsph.d.-projekt er forskellige produktionsteknologier for industrielle
enzymer blevet undersøgt. Cellulaser og hemicellulaser er enzymer, der kan bruges til produktion af
lignocellulose-baseret etanol, og enzymerne produceres ved hjælp af aerob gæring af den
filamentøse svamp Trichoderma reesei. Normalt foregår produktionen af enzymerne i mekanisk
omrørte tanke i størrelsesordenen 100 m3. Formålet med projektet var at undersøge, om der findes
andre gæringsteknologier, som bruger mindre energi og råvarer. Dermed kan prisen på enzymer
mindskes og cellulose-baseret etanol kan blive konkurrencedygtig med fossile brændstoffer.
Ved hjælp af en model af gæringsprocessen blev forskellige alternative teknologier vurderet i
forhold til deres energieffektivitet for iltoverførsel. En speciel reaktortype uden mekanisk omrøring
men med opblanding ved hjælp af beluftning, kaldet airlift reaktor, blev identificeret som en
potentiel teknologi med høj energieffektivitet.
To forskellige airlift reaktorkonfigurationer blev undersøgt i 550L skala; iltovergangen i systemet
blev målt under 9 gæringer og blandingstider blev bestemt vha konduktivitetsmålinger. Modellen
for enzymproduktion i airlift reaktoren blev forbedret, og det blev derefter brugt til at optimere
designet af en airlift reaktor i industriel skala. Sammenlignet med en optimeret mekanisk omrørt
reaktor kan der spares 22% af elektricitetsforbruget under gæringsprocessen. De resterende udgifter
i enzymproduktionen er dog væsentligt større end elektricitetsudgifterne, fx udgør råmaterialer en
langt større udgiftspost. Hvis det besluttes at ændre produktionsteknologi anbefales det at undersøge
konsekvenserne af denne ændring vha mere detaljerede computerbaserede modeller af processen i
stor skala samt yderligere forsøg med airlift reaktoren i forskellige skalaer.


vii
Preface
This thesis is the main result of my industrial Ph.D studies, which were carried out in collaboration
between Novozymes A/S and the Department of Chemical and Biochemical Engineering at the
Technical University of Denmark. The project was carried out from April 2009 to March 2012 and
was financed by Novozymes A/S and the Danish Agency for Science, Technology and Innovation.
The purpose of the project was to obtain new knowledge about the production of industrial
enzymes. Specifically, Novozymes was interested in exploring ways to produce cellulases for
bioethanol production as energy efficiently and thereby environmentally friendly as possible. One
way to do that is to implement various modifications of the current production technology that each
will improve the overall performance of the production process. Another approach is to entirely
rethink the production setup with the hope to make a step change that could bring energy efficiency
to a level that cannot be reached with minor improvements. This project was thought as an attempt
to do the latter.
The topic of this project was determined by Novozymes. During my M.Sc. thesis we developed a
model to describe enzyme production by Aspergillus oryzae and saw very promising results. It was
hoped that a similar methodology could be used for the modeling of fermentations of Trichoderma
reesei for cellulase production. I am very happy that Novozymes had the trust to invite me to pursue
the opportunity to carry out a Ph.D. project and continue that work at the Fermentation Pilot Plant
in Bagsvaerd.
I have had the pleasure of working with no less than 3 supervisors on this project. It has been very
rewarding to work with people with quite different backgrounds and approaches to the project. This
is meant in a very positive way, because it taught me the importance of always being able to argue
for the decisions and choices that are made. It is not always easy to convince a skeptical supervisor
to take a different approach than he would usually have done, but if you succeed, that should be
proof that you have built a strong argument.
Morten S. Hansen and Stuart M. Stocks have been my Novozymes supervisors. I have received a lot
of insight from working with Morten and Stuart who have many years of experience in this field
and who face (and overcome) the difficulties of fermentation technology on a daily basis. Thank
you for all your help. I would like to express my gratitude to my supervisor Associate Professor
Krist Gernaey, whose advice and great interest in the project have been amazing. I have enjoyed the
discussions we all have had during the project and we have made better collective decisions based

viii
on the input from all of us.
During the past years, I have been working in the Novozymes Fermentation Pilot Plant. I would like
to thank everyone in “Afdeling 235” and the supporting functions: Laboratory for Production
strains, Engineering Support, Maintenance and Planning, the process operators, the quality and
laboratory team, the Chemap team, and the chemist group. You have all made me feel like a part of
the team and I am truly grateful for that. This project was carried out with strong encouragement
from the management team of Fermentation Pilot Plant. I thank Henrik Steen Jørgensen, Morten
Carlsen, and Karin Nikolajsen for their continued support throughout the project.
I have also received help from many other colleagues at Novozymes and the Center for Process
Engineering and Technology at the Department of Chemical and Biochemical Engineering at DTU.
I would like to thank everyone who has helped me by answering my questions and teaching me
about your specific areas.
I enjoy learning and investigating new things, and I have been very fortunate to be able to do that all
of my life. I owe many thanks to my friends and loving family for supporting my desire to pursue
my goals and at the same time reminding me about the other important things in life.
Mads Orla Albæk, March 2012

ix
Contents
Abstract ..................................................................................................................................... iii
Dansk resume ..................................................................................................................................... v
Preface .................................................................................................................................... vii
Contents ..................................................................................................................................... ix
Nomenclature .................................................................................................................................. xiii
Chapter 1 Introduction ................................................................................................................ 1
1.1 Project description........................................................................................................ 1
1.1.1 State of the art ...................................................................................................... 1
1.1.2 Project content...................................................................................................... 2
1.1.3 Scientific novelty ................................................................................................. 3
1.1.4 Elaboration of the project purpose ....................................................................... 4
1.1.5 Thesis structure .................................................................................................... 4
1.2 Introduction to cellulases and their applications .......................................................... 5
1.2.1 Structure of cellulosic biomass ............................................................................ 5
1.2.2 Degradation of cellulosic biomass by Trichoderma reesei .................................. 6
1.2.3 Industrial applications of cellulases ..................................................................... 7
1.2.4 Challenges of lignocellulosic ethanol .................................................................. 8
Chapter 2 Modeling fungal fermentations for enzyme production in stirred tank reactors11
2.1 Introduction ................................................................................................................ 11
2.2 The model .................................................................................................................. 13
2.3 Materials and methods ............................................................................................... 18
2.4 Results and discussion ............................................................................................... 23
2.4.1 Mass transfer ...................................................................................................... 23
2.4.2 Yield coefficients ............................................................................................... 25
2.4.3 Viscosity............................................................................................................. 27

x
2.4.4 Process simulation.............................................................................................. 27
2.4.5 Sensitivity analysis ............................................................................................. 28
2.4.6 Energy efficiency and overall model performance ............................................ 31
2.5 Conclusions ................................................................................................................ 33
Chapter 3 Identification of key performance indicators for cellulase production ............... 35
3.1 Introduction of performance indicators ...................................................................... 35
3.2 Results and discussion ............................................................................................... 36
3.2.1 Productivity and oxygen transfer ....................................................................... 36
3.2.2 Yield coefficients YSP and YNP ........................................................................... 40
3.3 Conclusions ................................................................................................................ 42
3.3.1 Productivity and oxygen transfer ....................................................................... 42
3.3.2 Yield coefficients YSP, YNP, and YOP ................................................................... 43
Chapter 4 Identification of alternative enzyme production technologies ............................. 45
4.1 Scale-up strategy ........................................................................................................ 46
4.2 Technology screening ................................................................................................ 47
4.2.1 Power input by compressed gas ......................................................................... 47
4.2.2 Power input by liquid circulation ....................................................................... 54
4.2.3 Power input by mechanically moved internal devices ....................................... 60
4.2.4 Solid state fermentation ..................................................................................... 68
4.3 Results and discussion ............................................................................................... 69
Chapter 5 Airlift reactor experiments ...................................................................................... 73
5.1 Airlift reactor design .................................................................................................. 73
5.1.1 Reactor type and shape ...................................................................................... 73
5.1.2 Baffle position .................................................................................................... 74
5.1.3 Reactor hydrodynamics and flow configurations .............................................. 75
5.1.4 Pilot scale airlift reactors .................................................................................... 76
5.2 Materials and methods ............................................................................................... 77
5.3 Results and discussion ............................................................................................... 80
5.3.1 Fermentations ..................................................................................................... 80
5.3.2 Yield coefficients and carbon balance ............................................................... 82

xi
5.3.3 Rheology of the fermentation broth ................................................................... 83
5.3.4 Mass transfer correlations .................................................................................. 84
5.3.5 Mixing time measurements ................................................................................ 88
5.3.6 Regime analysis ................................................................................................. 90
5.3.7 Simulations......................................................................................................... 91
5.4 Conclusions ................................................................................................................ 93
Chapter 6 Objective comparison between airlift reactor and stirred tank reactor ............. 95
6.1 Comparison of pilot scale experimental data ............................................................. 95
6.1.1 Distribution of the power consumption ............................................................. 96
6.1.2 Key performance indicators ............................................................................... 97
6.1.3 Discussion of calculation method of power consumption ............................... 100
6.2 Comparison at industrial scale ................................................................................. 100
6.2.1 Evaluation of cost efficiency ............................................................................ 100
6.2.2 Airlift reactor.................................................................................................... 105
6.2.3 Stirred tank reactor ........................................................................................... 107
6.2.4 Comparison ...................................................................................................... 109
6.2.5 Uncertainties of the comparison ...................................................................... 112
Chapter 7 Overall conclusions and suggestions for future work ......................................... 115
7.1 Overall conclusions .................................................................................................. 115
7.2 Suggestions for future work ..................................................................................... 116
7.2.1 Focus on energy efficiency .............................................................................. 116
7.2.2 Development of a detailed airlift reactor process design ................................. 117
7.2.3 Airlift reactor scale up ...................................................................................... 118
7.2.4 Optimization of the stirred tank reactor ........................................................... 119
Appendix .................................................................................................................................. 121
Appendix A: Supplementary data for chapter 5 ........................................................................... 123
Appendix B: Supplementary data for chapter 6 ........................................................................... 137
Bibliography .................................................................................................................................. 143

xii

xiii
Nomenclature
Roman Letters
a, b, c constants of Eq. (2.9)
A1, A2 constants of Eq. (2.8)
Ad area of the down comer zone (m2)
Ar area of the riser zone (m2)
C constant of Eq. (2.9)
C∞ final conductivity output (mS/cm)
C0 initial conductivity output (mS/cm)
C1, C2 constants
Cc allowance for corrosion (0.0038 m)
Ci conductivity output (mS/cm)
Ci´ normalized conductivity
Cp cost factor of pressure vessels ($/kg)
CO2 cost of oxygen transfer ($/kg O2)
Cs proportionality constant
CER carbon dioxide evolution rate (moles CO2/m3/h)
COP coefficient of performance (energy removed/energy consumed)
D impeller diameter (m)

xiv
DL diffusivity (m2/s)
DO oxygen concentration in the liquid phase (moles O2/m3)
DO* oxygen saturation concentration (moles O2/m3)
EEO2 energy efficiency of oxygen transfer (kg O2/kWh)
EJ efficiency of joints (0.85)
g gravitational constant (m/s2)
HO2 Henry’s constant for oxygen for water at 25°C (793.4 bar.kg/moles O2)
k isentropic exponent
ks Metzner and Otto or (shear rate) constant
kLa volumetric oxygen mass transfer coefficient (1/h)
K consistency index (Pa.sn)
mo maintenance coefficient for oxygen (moles O2/g DW/h)
ms maintenance coefficient for substrate (g substrate/g DW/h)
MO2 molar weight of oxygen (kg O2/mol)
n flow behavior index
n number of impellers
N impeller speed (rps)
OTR oxygen transfer rate (moles O2/m3/h or kg O2/m
3/h)
OUR oxygen uptake rate (moles O2/m3/h)
pO2 partial pressure of oxygen in the gas phase (bar)
p1 absolute compressor inlet pressure (bar)
p2 absolute compressor discharge pressure (bar)
po absolute pressure at vessel outlet (bar)

xv
pCO2 partial pressure of carbon dioxide (mbar)
P agitation power input (kW)
Pa motor power consumption for agitation (kW)
Pair energy dissipation due to aeration (kW)
Pbroth energy dissipation to the broth from agitation and aeration (kW)
Pc compressor power consumption (kW)
Pg/Po relative power draw upon aeration
Pi maximum allowable internal pressure (kPa, gauge)
Ploss power loss in bearings, seal and gearbox (kW)
Po unaerated impeller power number
Pw cooling system power consumption (kW)
Q total heat generation of the fermentor (kW)
Q1 volume rate of air flow at inlet conditions (m3/h)
QM molar rate of air flow conditions (mol/s)
QN aeration rate (Nm3/min)
R universal gas constant (J/mol °K)
Re Reynolds number
S maximum allowable working stress (79300 kPa)
t minimum wall thickness (m)
tgas gas residence time (s)
tmt mass transfer time (s)
tmix,m mixing time for a degree of mixing of m (s)
T vessel diameter (m)

xvi
Tp absolute process temperature (°K)
V liquid volume in the vessel (m3)
vb terminal bubble rise velocity (m/s)
vg superficial gas velocity at actual temperature and pressure (m/s)
vl,r riser zone superficial liquid velocity (m/s)
vg,r riser zone superficial gas velocity (m/s)
vg, standard superficial gas velocity at standard temperature and pressure (m/s)
Wv weight of the vessel (kg)
X biomass concentration (g DW/L)
YSC observed yield coefficient of CO2 per substrate (g CO2/g substrate)
YSO observed yield coefficient of O2 per substrate (g O2/g substrate)
YSP observed yield coefficient of product per substrate (g product/g substrate)
YSX observed yield coefficient of biomass per substrate (g DW/g substrate)
Z ungassed height of liquid in the column (m)
Greek Letters
ΔHf heat development proportionality constant (kJ/mol O2)
α, β constants of Eq.(2.13)
45 shear rate (1/s)
45677 effective shear rate (1/s)
εg gas holdup (%)
ηc compressor efficiency
ρ broth density (kg/m3)
ρSS316 stainless steel 316 density (7840 kg/m3)

xvii
ρF carbon substrate feed density (kg/m3)
γxo stoichiometric coefficient (moles O2/g DW)
γxs stoichiometric coefficient (g substrate/g DW)
σ surface tension (N/m)
μ growth rate (1/h)
μ viscosity (Pa.s)
μapp apparent viscosity (Pa.s)
μw viscosity of water (Pa.s)
τ shear stress (Pa)
τy yield stress (Pa)
Abbreviations
ALR airlift reactor
AR aspect ratio
B2 Hayward Tyler B2 (formerly titled APV-B2)
CBH cellobiohydrolase
CFD computational fluid dynamics
CMC carboxy methyl cellulose
DCM dry cell matter
DOT dissolved oxygen tension
EG endoglucanase
GH glycosyl hydrolase
NL normal liter
RDT Rushton disc turbine

xviii
RQ respiratory quotient, CER/OUR
SRC standardized regression coefficient
STR stirred tank reactor

Chapter 1
Introduction
The first section of this chapter contains the main contents of the project description approved by
the Danish Agency for Science, Technology and Innovation. The structure of this thesis follows that
of the project description and should be apparent from this first section. In the second section an
introduction to modern cellulases and their applications is provided.
1.1 Project description
1.1.1 State of the art
Enzymes are proteins that catalyze chemical reactions inside the cells of living organisms. They can
also function outside the biological systems, have high specificity, and involve fast reaction rates.
Furthermore enzymes can be used under mild conditions and therefore they are used in many
industrial processes to reduce the consumption of chemicals and energy, and to reduce the
production of waste (Olsen, 2008). The increasing demand for industrial enzymes is largely driven
by decreasing supply of resources such as energy and raw materials. The demand for energy and
biomass is ever-increasing and the future will undoubtedly call for a better utilization and higher
efficiency of the use of both. There is hope that the global society can transform from dependency
of fossil fuels and petrochemical materials towards a bio-based and sustainable energy economy
(Bevan and Franssen, 2006). A better utilization of the biomass resources of the Earth requires the
use of effective and economical enzymes for the conversion of plant material to valuable sugars that
can be further converted to fuels, materials and commodity chemicals (Davenport, 2008).
Within industrial enzymes, Denmark has had a unique position internationally. Until the takeover of
Danisco by Dupont in 2011, Danish companies were responsible for 70% of the global enzyme
production, and world leading research is still ongoing in Denmark (Ministry of Foreign Affairs of
Denmark, 2006). The world market for industrial enzymes is increasing and had an estimated size
of ~$5 billion in 2007 (Novozymes estimate (Novozymes A/S, 2007). In the production of
industrial enzymes, relatively large amounts of energy, water, and raw materials are used.
Novozymes annually consumes 856,000 GJ for primary activities, corresponding to the private
electricity consumption of 240,000 Danes (Novozymes A/S, 2007). A reduction in the energy
consumption of enzyme production would therefore have large effects on the CO2 emission and
environmental impact. An even greater impact would be the breakthrough of the production of

2 Chapter 1
lignocellulosic ethanol. If enzyme prices can be reduced further, it seems likely that lignocellulosic
ethanol economically can compete with fossil fuels in a near future. Since lignocellulosic ethanol is
based on a renewable resource it has an obvious environmental advantage over oil derived fuels.
1.1.2 Project content
Industrial enzymes are currently primarily produced in stirred tank reactors, which is the traditional
technology for many biotechnological processes. This technology platform is well known, since it
has been the preferred technology for this type of operations for approximately 50 years. The
enzyme producing microorganisms need substrates for growth and enzyme formation e.g. oxygen,
sugars, and other nutrients. In the large production vessels, the greatest challenge is often to ensure
proper oxygen supply for the microorganisms. The fermentation broths may become very viscous,
which hinders the oxygen transfer. Mechanical stirring with high intensity is one way to overcome
this challenge, which is among the reasons for the relatively high energy consumption of the
process. Supply and compression of sterile air for the microorganisms also is highly energy
consuming. Continuously, scientific studies are initiated in order to improve the current technology
platform by minor adjustments such as changes to the feeding strategy, stirrer speed etc. However, a
number of alternative technologies to the stirred tank reactor exist as well, which potentially could
replace it.
The purpose of this project is “to investigate the efficiency of alternative enzyme production
technologies and objectively evaluate these in a comparison with the existing production platform”.
The underlying hypothesis of the research project is, that alternative technologies exist which may
be employed in industrial enzyme production such that the energy and/or resource usage is lowered.
To evaluate alternative technologies objectively with the traditional production platform, similar
dimensions are needed. For research concerning reactors, geometric similarity is a very important
parameter, since processes cannot be scaled up by utilization of a volumetric factor. The
Novozymes pilot plant is a good setting for the project, as the scales of operation available here,
typically are not present in academic environments.
Optimization of the current production technology contributes to minor improvements of enzyme
production in the stirred tank reactor; however no ground breaking changes have been introduced to
the technology since its origin in the 1950’s. In the literature a vast number of alternative
technologies are described, which in various ways challenge the traditional production technology.
Some are very well known and have been applied for many other biotechnological processes for
years while some have just been developed and never been used to perform fungal fermentations. A
few examples are given here:
o Rotating jet heads as a means of providing mixing and gas dispersion replacing mechanical
stirring (Hua et al., 2007; Nordkvist et al., 2003; Nordkvist et al., 2008)
o Static mixers applied for gas liquid oxygen transfer (Heyouni et al., 2002)

Project description and introduction to cellulases 3
o Different technologies for solid substrate fermentations (Mitchell et al., 2006)
o Bubble columns in various designs (Atkinson and Mavituna, 1991)
Previously, studies have shown that compared to the traditional production technology, alternative
technologies have both advantages and drawbacks (Grajek, 1987; Sukumaran et al., 2005). A major
challenge is however to perform a reliable and objective comparison of the different available
technologies.
One important performance parameter for comparison is the amount of product formation per unit
of energy consumed (kg product/kWh), which relates to the energy efficiency of the process or
technology. If optimization of this parameter however leads to decreased product concentration, an
important drawback is that a larger production volume is required to maintain the amount of
product produced. Furthermore parameters such as water- and substrate consumption and the
difficulty of product recovery – the cost of product recovery usually increases at lower product
concentrations – also play an important role in the comparison of different technologies.
As indicated by the above list of examples, a long list of possible technologies for enzyme
fermentations is available through the open literature. Many of the technologies have however only
been tested at laboratory or prototype level. A realistic analysis and evaluation of these technologies
require experimental data from larger scale or the use of modeling tools that can simulate the effect
of various process conditions and parameters.
This research project is very much in line with the recommendation from the Danish AgriFish
Agency which in its rapport concludes that “the upscaling of promising research results from
laboratory to pilot-scale studies” is among the cross disciplinary areas that need research and
development “if Denmark is to retain its competitive edge and become internationally leading in the
non-food and feed areas” (Danish AgriFish Agency (former Direktoratet for FødevareErhverv),
2006)
1.1.3 Scientific novelty
Bioreactor characterization and comparison is not a new concept, and each time a new technology is
suggested it should be compared with existing alternatives. This project aims at collecting relevant
data from the open literature and by the use of modeling and simulation tools to make a technology
comparison for a specific biotechnological process: enzyme production by Trichoderma reesei. The
cellulases and hemi-cellulases secreted by T. reesei are important enzymes in the processing of
lignocellulosic biomass to industrial products such as sugars and ultimately bioethanol. A
significant strength of this project is the access to a strain with properties very similar to the
industrial strains currently used for the production of lignocellulosic enzymes. The process studied
will thus closely resemble the actual enzyme production in industrial scale and have the same
limiting rates and other process conditions. The development of modeling tools has been strongly

4 Chapter 1
aided by the advances of computer calculating power. The application of a process model for a
number of alternative technologies can now be done quite quickly even though it involves relatively
heavy computational operations.
1.1.4 Elaboration of the project purpose
The specific purpose of this project is to investigate and compare the efficiency of enzyme
production technologies. Enzyme recovery and enzyme formulation or enzyme granulation are
operations strongly connected to the fermentation process for some processes, but in various
business models for lignocellulosic bioethanol the recovery processes (if any) are very different. For
this reason and in order to confine the project and emphasize the focus of fermentation technology
comparison it was decided early on that this thesis should be concerned only with the fermentation
process.
For commercial reasons this thesis does not contain details about the Novozymes production setup
including variable costs, energy consumption and cost, raw material prices, absolute figures on
productivity, or product volumes. It is not the intention of this project to minimize the full
manufacturing cost of the product, but to explore different technologies for the fermentation
process. It is the intension that the approach described in this thesis will be an example of how
technology comparison can be done and that it can function as inspiration for others in the future.
1.1.5 Thesis structure
Modeling of the reference process (Chapter 2)
The first part of the project involved the development of a process model of the reference process in
the stirred tank reactor. The model is constructed in such a way, that the central part of the model –
the oxygen mass transfer model – is easily replaced in the later model applications. The reference
process is a fed-batch fermentation of a strain of T. reesei with high similarity to the production
strains.
Determination of key parameters of the reference process (Chapter 3)
A central problem of the project is to determine the key parameters that will be used for the
evaluation of the different technologies. The key parameters are influenced by the process
conditions such as the aeration rate, agitation intensity, pressure, concentration of substrate,
viscosity etc, and should cover the contribution from these. A number of key parameters are
calculated and their abilities to be used for the technology comparison are discussed.
Identification of alternative production technologies (Chapter 4)
A large number of alternative reactor technologies exist. Some of these have previously been

Project description and introduction to cellulases 5
explored by Novozymes, but there is a constant development in the field and new possibilities of
combinations also appear. This activity involves a thorough literature search and the development
of a reasoned list of potentially interesting technologies based on the previously obtained
knowledge of the reference process, the process conditions, and their interactions. If it is not
possible to evaluate the particular potential of certain technologies based on the available literature,
the information should be obtained by others means (e.g. by contacting the experts and
manufacturers in the field).
Research within at least one alternative technology (Chapter 5)
Depending of the results of the identification of alternative technologies, a detailed reactor and
process design is to be carried out for at least one alternative technology. This activity involves
experimental work with the primary objective of evaluating the potential of this technology as the
possible platform for future enzyme production. A central part of the evaluation will be
considerations on the possibilities of scaling up of the technology.
Conclusion on at least one alternative technology (Chapter 6)
Whether this last phase of the project can be reached or not depends on the quality of the collected
information of the previous activities. The intention is to be able to conclude, whether the proposed
alternative technology, in objective comparison with the reference technology, is competitive.
Chapter 7 contains the overall conclusions of the project and provides guidelines for further work.
1.2 Introduction to cellulases and their applications
1.2.1 Structure of cellulosic biomass
Lignocellulose is the structural cell wall component which provides plants their rigidity. The three
major components of lignocellulose are cellulose (35-50 wt. % w), hemicellulose (20-35 wt. %),
and lignin (5-30 wt. %) (Lynd et al., 2002). The remaining components include small amounts of
ash, proteins, and pectin. The composition and amounts of residuals vary depending on the source
of biomass (Dashtban et al., 2009).
Cellulose is a linear polymer of β-1,4-linked glucose and is the most abundant organic molecule on
the Earth with an annual production of about 7.2·1010 tons (Kubicek et al., 2009). Cellulose is
synthesized in nature as individual molecules (linear chains of glycosyl residues) which undergo
self assembly at the site of biosynthesis (Lynd et al., 2002). Adjacent chains of cellulose are
coupled by hydrogen bonds, hydrophobic interactions, and van der Waal’s forces resulting in a
parallel alignment of crystalline structures known as fibrils (Dashtban et al., 2009). Cellulose fibers
in nature however are not purely crystalline. Regions with kinks, twists, and irregularities also exist
and are known as amorphous regions.

6 Chapter 1
The cellulose fibrils are surrounded by hemicelluloses, which are heterogeneous polymers of
pentoses, hexoses, and sugar acids (Dashtban et al., 2009). The composition of hemicelluloses in
nature varies considerably depending on the plant source, but consists mainly of β-1,4-linked xylans
and β-mannans (Kubicek et al., 2009). Hemicellulose often has side chain substituents such as
arabinose, galactose, and acetic or glucuronic acid (Mach and Zeilinger, 2003). It is estimated that
6·1010 tons of hemicelluloses are produced annually (Kubicek et al., 2009).
Lignin is the third heterogeneous polymer of lignocellulosic residues and generally contains
aromatic alcohols including coniferyl alcohol, sinapyl and p-coumaryl (Dashtban et al., 2009). It is
the most recalcitrant lignocellulosic material to degrade as it forms linkages to both hemicelluloses
and cellulose and thereby efficiently acts as a barrier to any solutions or enzymes (Dashtban et al.,
2009).
1.2.2 Degradation of cellulosic biomass by Trichoderma reesei
Trichoderma reesei (teleomorph Hypocrea jecorina) is a saprobic ascomycete fungus capable of
efficient degradation of plant cell wall polysaccharides (Martinez et al., 2008). The discovery of the
strain Trichoderma viride QM6a by the US Army during World War II led to extensive research
towards the industrial application of its exceptionally efficient enzymes (Schuster and Schmoll,
2010). The organism was identified as the cause of a massive infection of cotton-based army
material, and later on this species was renamed T. reesei in honor of Elwin T. Reese and is now the
most important cellulase producer worldwide (Simmons, 1977).
T. reesei secretes its lignocellulolytic enzymes into its surroundings as the enzymes should act on a
macromolecular insoluble substrate. This strategy is known as a noncomplexed lignocellolytic
system in contrast to complexed cellulase systems (cellulosomes). Cellulosomes are typically found
in anaerobic systems where bacteria growing on cellulosic material form a stable enzyme complex
firmly bound to the cell wall but flexible enough to also bind microcrystalline cellulose (Lynd et al.,
2002).
The genome of the original isolate QM6a was recently sequenced (Martinez et al., 2008). The
genome size was 33.9 Mb and 9,129 genes were identified or predicted. The enzymes involved in
degradation of cellulose and hemicellulose work synergistically to allow hydrolysis to smaller
oligosaccharides and finally to the corresponding monomers (Mach and Zeilinger, 2003). The
cellulolytic enzyme system consists of three types of activities: cellobiohydrolase (CBH) activity,
endoglucanase (EG) activity, and β-glucosidase activity (Persson et al., 1991). T. reesei encodes at
least two CBH enzymes, Cel7A and Cel6A, which are exocellulases hydrolyzing cellulose chain
ends. Cel7A and Cel6A act on the cellulose chains from the reducing and non-reducing end,
respectively, producing cellobiose as the main product (Dashtban et al., 2009). EG enzymes initiate
cellulose breakdown by internally cleaving cellulose chains at amorphous cellulose regions, thereby
providing new chain ends accessible for the action of CBH enzymes (Lynd et al., 2002). At least

Project description and introduction to cellulases 7
five EG enzymes (Cel7B, Cel5A, Cel12A, Cel61A, and Cel45A) have been identified for T. reesei
(Zhang and Lynd, 2004). At least two β-glucosidases are produced by T. reesei to facilitate the
hydrolysis of cellodextrins (oligosaccharides of glucose) and cellobiose to glucose (Lynd et al.,
2002).
T. reesei was found to have 200 genes from the glycosyl hydrolase (GH) family, 103
glycosyltranferases, 16 carbohydrate esterases, and 3 polysaccharide lyases, and 16 genes encoding
for hemicellulases (Martinez et al., 2008). As the cellulolytic machinery of T. reesei is considered
the paradigm for enzymatic breakdown of cellulose and hemicelluloses, it was unexpected that
compared to other filamentous fungi T. reesei has a considerably smaller set of genes encoding
cellulases and hemicellulases (Martinez et al., 2008). However, the efficiency of a cellulase system
is not determined by the number of enzymes present. Instead, they act in a coordinated manner to
efficiently hydrolyze cellulose (Lynd et al., 2002). Competitive product inhibition of the hydrolysis
steps is a well known phenomenon (Dashtban et al., 2009), e.g. an efficient β-glucosidase to prevent
the accumulation of cellobiose is needed in order for CBH and GH to be effective since cellobiose
inhibits the latter enzymes. Actually, the need for five endoglucanases in the T. reesei cellulase
system is not fully understood (Lynd et al., 2002) and there still seems to be a lack of ability to
rationalize the diversity observed in the composition of cellulolytic enzymes, which underscores the
need for further improvement of the understanding of plant cell wall degradation (Martinez et al.,
2008).
Expression of extracellular hemicellulases and cellulases is a hugely resource demanding activity
for the cell, and tight regulation of the process is needed. Most cellulases are formed adaptively
which means that their transcripts are not formed during growth on monosaccharides and full
expression of the enzymes requires the presence of an inducer (Kubicek et al., 2009). The genome
sequence of T. reesei has raised the possibility to use sophisticated gene manipulation methods to
further over-production of cellulases by exploitation of the insight into the regulation pathways
(Kubicek et al., 2009). However detailed discussion of this matter is beyond the scope of this thesis.
1.2.3 Industrial applications of cellulases
Cellulases and hemicellulases have important applications in a number of industries. Industrial
strains of T. reesei are currently used for the production of these enzymes in relatively large
amounts. Early strain improvement with T.reesei included classical mutagenesis from treatment
with UV light and nitrosoguanine in combination with selection procedures, which resulted in high-
yielding strains such as the well known strain T. reesei Rut C30 that is also resistant to carbon
catabolite repression (Montenecourt and Eveleigh, 1977a). The industrial application of T. reesei
has led to a well developed toolkit for genetic manipulation of the species (Schuster and Schmoll,
2010). Among the tools currently applied are: transformation, sequential deletions, knock out
strategies for functional analysis of genes, and expression of antisense constructs for knockdown
(Schuster and Schmoll, 2010).

8 Chapter 1
T. reesei has a long history of safe use in industrial use and the current applications of
hemicellulases and cellulases include food (xylanases improve shelf life and quality of bakery
products, clarification of fruit juices), animal feed (hemicelluses improve the digestibility of the
feed), textile industry (bio-polishing of cotton clothes) and paper and pulp industry (bleaching of
cellulose pulp, wood processing) (Nevalainen et al., 1994).
T. reesei represents a principal target cellulase host in the quest to, at least partially, replace
gasoline with cellulose-derived ethanol (Ward, 2011). Fuel ethanol production is currently an
economically viable industry with a production in the USA of more than 10 billions of gallons
produced in 2010 (Renewable Fuels Association, 2011). Lignocellulosic biomass (including
agricultural by-products, forestry residues, and woody crops) has a much larger potential as a
renewable energy source in the future (Harris et al., 2010; National Academy of Sciences, 2009;
Perlack et al., 2005). It is (optimistically) estimated that one billion tons per year of lignocellulosic
biomass could be sustainably harvested in the form of crop and forestry residues in the US, which
could replace as much as 30% of the total US gasoline consumption (Merino and Cherry, 2007;
Perlack et al., 2005). However, a number of challenges have to be overcome before the dream of
conversion of cellulosic residues into fuels and chemicals at industrial scale becomes reality.
1.2.4 Challenges of lignocellulosic ethanol
In Figure 1.1 a schematic overview over the process of converting lignocellulosic biomass to
ethanol is given. Although a large number of possible variations to the process are suggested and
tested, the process can be summarized in five unit operations: (1) desizing, (2), thermochemical
pretreatment, (3) enzymatic hydrolysis, (4) ethanol fermentation, and (5) ethanol recovery (Merino
and Cherry, 2007).

Project description and introduction to cellulases 9
Figure 1.1. Schematic overview of the biomass to ethanol process. Step 1: The biomass is milled or chopped to increase
the surface area and the uniformity. Step 2: Some form of thermochemical pretreatment (exposure to high pressure,
temperature, and/or extremes of pH) destroy the plant cell wall and expose the sugars to a liquid phase. Step 3:
Enzymatic hydrolysis using a complex mix of glycosyl hydrolases to convert sugar polymers to monomeric sugars. Step
4: Fermentation of monomeric sugars to ethanol by a fermentation organism. Step 5: Ethanol recovery from the
fermentation using distillation or another separation technology. C6 refers to glucose derived from cellulose hydrolysis,
while C5 refers to pentose sugers (mainly xylose) derived from hemicelluloses. Adapted from Merino and Cherry
(2007).
The conversion of lignocellulose to ethanol must become less expensive in both operating cost and
capital investment, before the process will have the potential to replace the current liquid fuels
(Merino and Cherry, 2007). For one, investment costs are higher for lignocellulosic ethanol plants
compared to starch based production facilities due to their larger size to accommodate more dilute
sugar streams, more unit operations, and in some cases the need for acid-resistant construction
materials (Merino and Cherry, 2007). Furthermore, the operating costs may currently be higher due
to higher enzyme dosage required and higher water consumption that might be required to remove
compounds that interfere with the hydrolysis and fermentation process (Merino and Cherry, 2007).
Considerable research has been carried out in order to reduce the cost of enzymes used to hydrolyze
the pretreated biomass to monomeric glucose. This work includes the quest for better understanding
of the synergy between enzymes in the cellulase complex, the use of T. reesei transformants
Desizing
Biomass
1 2
Cellulase
& Hemi-
cellulase
Enzymatic
hydrolysis
3
Ethanol
fermentation
Pretreatment
4 Soluble C5
C6
(C5)
Lignin and
waste to
boiler
Ethanol
Recovery
5

10 Chapter 1
expressing non-native enzymes such as β-glucosidases and members of the GH61 family, use of
synergistic hemicellulases, and the search for the optimal hydrolysis conditions (Harris et al., 2010;
Merino and Cherry, 2007).
The US National Renewable Energy Laboratory is very active in the promotion of the production of
ethanol and other liquid fuels from lignocellulosic biomass. In a recent publication in which a
detailed process simulation including material and energy balances and capital and operating costs
was published, the minimum ethanol selling price for a plant using dilute-acid pretreatment and
enzymatic hydrolysis of corn stover was determined to be $2.15/gal (Humbird et al., 2011). In
comparison, market studies showed that the production cost of corn ethanol and sugarcane ethanol
were $1.53/gal and $1.13/gal, respectively (Humbird et al., 2011). Of the minimum ethanol selling
price $2.15/gal, enzymes in that particular case accounted for $0.34/gal corresponding to 16% of
the total costs (Humbird et al., 2011). A reduction of the enzyme cost could therefore significantly
improve the financial feasibility of the lignocellulosic biomass to ethanol process.
The aim of this work is to investigate if the production costs of the enzymes can be brought down
by using an alternative enzyme fermentation technology. The enzymes are considered a (hemi)-
cellulase complex, since the composition of the hemicellulase and cellulase mixture produced in the
T. reesei strains developed at Novozymes is not stated for proprietary reasons. It is expected that the
close future will lead to further improvements in the industrial strains and enzyme complexes, e.g.
by expression of ortholog enzymes from thermophilic fungi in exchange for their mesophile
counterparts (Berka et al., 2011). Therefore the approach of this thesis has been generic with the
intention that the results should apply also to future industrial strains of T. reesei even though they
most likely will be even more efficient over-expressors of an even more efficient complex of
cellulases and hemicellulases.

Chapter 2
Modeling fungal fermentations for enzyme production in
stirred tank reactors
The content of this chapter is based on following two articles. Figures from the articles are reprinted
with permission from John Wiley and Sons, Inc.
Modeling Enzyme Production With Aspergillus oryzae in Pilot Scale Vessels With Different
Agitation, Aeration, and Agitator Types
Albaek, MO; Gernaey, KV; Hansen, MS; Stocks, SM
Biotechnology and Bioengineering 108: 1828-1840 (2011)
Evaluation of the Energy Efficiency of Enzyme Fermentation by Mechanistic Modeling
Albaek, MO; Gernaey, KV; Hansen, MS; Stocks, SM
Biotechnology and Bioengineering 109: 950-961 (2012)
2.1 Introduction
The investigations of this thesis are focused on fermentations of the mesophilic soft-rot ascomycete
fungus Trichoderma reesei (teleomorph Hypocrea jecorina). T. reesei utilizes a remarkably
efficacious protein secretion machinery and represents a paradigm for industrial production of
cellulases and hemicellulases for hydrolysis of biomass polysaccharides (Martinez et al., 2008).
Most industrial enzymes are produced by submerged fermentation, a process involving cultivation
of the production strain in closed fermentation vessels that contain the nutrient medium (Berka and
Cherry, 2006). The sparged, mechanically agitated, vertical, cylindrical tank (commonly known as

12 Chapter 2
the stirred tank reactor (STR)) is the traditional design of the fermentation vessel, which dates from
the 1940’s (Bailey, 1980). Today, this fermentation technology is still preferred (Dodge, 2009).
The majority of large-scale industrial fungal fermentations involve fed-batch mode cultivations with
a high concentration of active biomass (Papagianni, 2004). During fermentation, growing hyphal
elements tend to entangle and therefore many fungal fermentations suffer from the same problem –
high viscosity of the fermentation broth that often leads to mass transfer limitations (Li et al., 2000;
Mcneil and Harvey, 1993; Morris et al., 1973; Olsvik and Kristiansen, 1994). For aerobic
fermentations the transfer of sufficient oxygen to active cells is critically important. By
manipulation of the substrate feed rate it can be guaranteed that the carbon source becomes the rate
limiting substrate and the dissolved oxygen tension (DOT) is maintained at the desired level. This
mode of operation is reliant on the available oxygen mass transfer in the fermentor. The gas-liquid
mass transfer in the fermentor is influenced by the operational conditions, the physicochemical
properties of the culture, the geometrical parameters of the system, and the presence of oxygen
consuming cells.
A number of models have been proposed in order to describe filamentous growth and growth
related production (see for example (Agger et al., 1998; Nielsen, 1993)). Some authors relate
cytological events within the hyphae to mycelial growth kinetics (i.e. hyphal extension and branch
initiation), but each model seems to be very strain specific and highly dependent on the
experimental setup (Pazouki and Panda, 2000). Yang and Allen (1999) have described a model to
predict mycelial morphology and mycelial growth in the development of an alternative scale-up
strategy to constant energy dissipation, mass transfer coefficient, or impeller tip speed. Their work
showed that simulation of mycelial processes can be a valuable tool for developing process
understanding and for scale-up of such processes (Yang and Allen, 1999).
The present work represents a relatively simple but more complete mathematical process model
describing microbial growth and enzyme production in submerged viscous aerobic fed-batch
fermentations. The model has been shown to describe fermentations of both Aspergillus oryzae and
T. reesei well. For each production organism, a number of biological parameters are measured and
used in the model as described in this chapter. The model simulates the process performance at
different rates of agitation and aeration as well as different headspace pressures; three of the key
parameters influencing the oxygen mass transfer. With focus on oxygen mass transfer, it is shown
that it is possible to model enzyme production even under very different process conditions.
Here, three mass transfer correlations are tested and compared in their ability to describe the mass
transfer characteristics of 550 L fed-batch fermentations with viscous fermentation broth. The data
set consists of kLa measurements from 9 fermentations carried out under different process
conditions.
An analysis of the model uncertainty is included as well. Assuming a certain distribution of the

Modeling fungal fermentations for enzyme production 13
model parameter values, Monte Carlo simulations – a widely recognized technique – are performed
to explore how the parameter uncertainty influences the simulation results (Heinzle et al., 2006).
Also, a sensitivity analysis is conducted which results in a significance ranking of the model
parameters. This will help to direct the future experimental work towards reducing the uncertainty
of the most influential parts of the model.
Finally, the total energy consumption of the fermentation vessel including agitation, aeration and
cooling is considered.
2.2 The model
In this model the progress of the fermentation is simulated by considering the following: (1) a
representation of the main reaction equation of the fermentation, (2) a mass transfer prediction, (3) a
viscosity prediction, and (4) a mathematical representation of the above components that can be
used for simulating the process. In the following each of these four components will be described in
more detail.
The reaction equation
It is assumed that the enzyme production process can be described with the following simple
reaction equation
SO 2 SX SP SC 2 2Substrate O biomass product CO H OY Y Y Y+ ⋅ → ⋅ + ⋅ + ⋅ + (2.1)
where YSO, YSX, YSP, and YSC are the observed yield coefficients of substrate and products per unit of
carbon source substrate consumed. Since the reaction is carried out in aqueous solution, the
relatively small amount of water produced is neglected. A certain amount of nitrogen is needed for
biomass and product formation, but the ammonium added in order to adjust and maintain the
desired pH is assumed to deliver enough nitrogen. For simplicity this relatively small amount of
nitrogen is not included in the reaction equation.
A mass transfer prediction
In a DOT controlled fed-batch fermentation the oxygen mass transfer rate is rate limiting. The
oxygen transfer rate per unit of reactor volume (OTR) is often described by
( )*LOTR DO DOk a= − (2.2)
In the literature, a number of approaches towards estimation of kLa have been suggested for the
STR with non-Newtonian fluids. The flow behavior of these liquids is often described in terms of
the Ostwald-de Waele relationship (Nienow, 1990)

14 Chapter 2
1nKµ γ −= ɺ (2.3)
The shear rate in the STR is locally non-uniform. Close to the impeller blades the shear rates are
high. The shear rate decreases with increasing distance from the stirrer and stagnant zones with zero
shear rates might even exist (Herbst et al., 1992). In Table 2.1 three correlations are listed to obtain
the effective mean shear rate, which is then used to calculate the apparent viscosity from Eq. (2.3).
Graphical representations of the three correlations and the apparent viscosities calculated on data
for a fed-batch enzyme production of T. reesei are shown in Figure 2.1A and Figure 2.1B,
respectively.
Figure 2.1. A: Comparison of effective mean shear rates estimated with Eq. (2.4) – (2.6) for data from a fed-batch
fermentation of T. reesei (550L fermentor, B2 impellers, N = 6.33 1/s, 0.58<n<0.92). B: Apparent viscosities calculated
from shear rates from Figure 2.1A. See Herbst et al. (1992) for similar graphs for xanthan production. Note that time
axis labels are not shown on purpose for proprietary reasons. Adapted from (Albaek et al., 2012).
The relationship of Metzner and Otto (1957) (Eq. (2.4)) was modified with a function of n by
Calderbank and Moo-Young (1959) (Eq. (2.5)). In the above example, 0.58<n<0.92 which means
that the shear rate predicted by Eq. (2.5) is ~20% lower than the one obtained with Eq. (2.4). The
resulting difference in apparent viscosity, Figure 2.1B, is limited. Eq. (2.6) predicts a different trend
since increasing viscosity is assumed to decrease the effective shear rate in this correlation (Herbst
et al., 1992). Intuitively, this might be right. The corresponding development in apparent viscosity
is different than predicted by the other relationships as the shear rate is roughly one order of
magnitude higher.
In the literature a number of correlations for the volumetric mass transfer coefficient, kLa, have been
proposed. Three such mass transfer correlations for non-Newtonian media are presented in Table
2.1. In each correlation a different method for shear rate estimation is employed.
101
102
103
104
Time
Shear rate (1/s)
Metzner and Otto
Calderbank and Moo-Young
Henzler and Kauling
0
0.05
0.1
0.15
Time
Apparent viscosity (Pa.s)
A B

Modeling fungal fermentations for enzyme production 15
Table
2.1
. T
op:
Est
imat
ions
of
the
effe
ctiv
e sh
ear
rate
in
stir
red
tank
rea
ctor
s. B
otto
m:
Sel
ecte
d m
ass
tran
sfer
cor
rela
tion
s fo
r
visc
ous
liqu
ids.
Ada
pted
fro
m H
erbs
t et
al.
(19
92).
She
ar r
ate
CM
(E
q. (
2.5)
)
HK
(E
q. (
2.6)
)
MO
(E
q. (
2.4)
)
a In t
his
wor
k a
valu
e of
A sB1
1 is u
sed
b The
fol
low
ing
prop
erti
es a
re a
ssum
ed:
C = 1
050
kg/m
3 , D =
0.0
47 N
/m, E L
B2.5·
10JK m
2 /s, L b
B0.26
5 m/s
Der
ivat
ion
Em
piri
cal
Sem
i-em
piri
cal
Dim
ensi
onal
ana
l.
Der
ivat
ion
Sem
i-th
eore
tica
l
Var
ious
lit
. dat
a
Var
ious
lit
. dat
a
Equ
atio
n
(2.4
)
(2.5
)
(2.6
)
(2.7
)
(2.8
)
(2.9
)
45 eff
BAsM
45 effBA
sMN4P 3P
Q1RS/T
UJSV
45 effBW
X broth Y
1 Z app[\.]
A L^B2
430E L\.]
C_ ] `X broth CY
aKbcS
d U\T Ub
SVe
`f CaU
gT UbS
V D_ ]
hNL g L bR\.]
NZ app Z wRJ\
.g]
A L^ L gWZ app
gg
[U/_Bi
UWX broth Y
1 L gCg[j k
A L^Bl
NX broth Y
Rm L gn Z appo
Ref
eren
ce
Met
zner
and
Ott
o (1
957)
a
Cal
derb
ank
and
Moo
-You
ng (
1959
)a
Hen
zler
and
Kau
ling
(19
85)
Ref
eren
ce
Kaw
ase
and
Moo
-You
ng (
1988
)b
Hen
zler
(19
82)b
Em
piri
cal

16 Chapter 2
The theoretical expression suggested in Eq. (2.7) contains only one factor that should be fitted to
data for specific surface area and has been determined using data for water (Kawase and Moo-
Young, 1988). The correlation proposed by Henzler (1982) (Eq. (2.8)) has been shown to
successfully describe many literature data, although with the limitation that the system specific
constant A1 and exponent A2 are required (Herbst et al., 1992). A commonly used empirical
correlation is based on power input per unit volume, superficial gas velocity, and apparent viscosity
(Eq. (2.9)). The constant C is said to depend on the geometrical parameters of the vessel and the
experimental method used, while it is sure that the exponent values a, b, and c show a wide
variation range in different correlations proposed by different authors (Garcia-Ochoa and Gomez,
2009). It is claimed, that there is poor correspondence among most correlations proposed in the
literature (Kawase and Moo-Young, 1988). The correlation is however seen to describe the
experimental data within ±30% (e.g., Cooke et al., 1988; Zhu et al., 2001). Within this precision,
which is realistic for pilot scale and industrial scale vessels, there are multiple examples that kLa is
independent of agitator geometry (Albaek et al., 2011; Cooke et al., 1988). The correlation of
Kawase and Moo-Young (1988) (Eq. (2.7)) is semi-theoretical and thus no fitting to the data set is
performed, while the two empirical correlations are fitted to the data set by least squares regression.
A viscosity prediction
The fermentation broth is known to have power law-like behavior. The power law consistency, K,
and flow behavior indices, n, are here correlated in the following way
1K C X α= (2.10)
2n C X β= (2.11)
where C1, C2, α, and β, are constants estimated by regression. The effective shear rate of the
fermentation vessel, 45677, is determined by the approach of Metzner and Otto
eff sk Nγ =ɺ (2.12)
where ks is the Metzner and Otto (or shear rate) constant (Nienow, 1996) and N is the rate of
agitation. The apparent viscosity, µapp, of the broth is calculated using ks = 11 for both agitator types
( ) 2 1app 1 s
C XC X k N βαµ
−
= (2.13)
A mathematical representation of the model
It was decided to model the fed-batch fermentation by applying a pseudo steady state assumption; a
complex differential equation can then be converted to a simpler algebraic equation. The model
consists of balance equations for the total liquid phase volume and the concentrations of biomass,

Modeling fungal fermentations for enzyme production 17
substrate, product, and dissolved oxygen, respectively, given below.
Volume, V (L/h)
2 2F evap O COF F M MdVdt
ρρ
− + −= (2.14)
Biomass, X (g DW/L/h)
( )2 2F evap O COX F F M MdX Xdt Vρ
µρ
− + −= − (2.15)
Substrate, S (g substrate/L/h)
( ) ( )2 2F evap O COF ruexs st S F F M MdS c F m Xdt V Vρ
µγρ
− + −= − + − (2.16)
Product, P (g product/L/h)
( )2 2F evap O COSP XS
P F F M MdP Y Y Xdt Vρ
µρ
− + −= − (2.17)
Dissolved oxygen, DO (moles O2/L/h)
( ) ( ) ( ) ( )2 2* *in out F evap O COtrueL xo o*in
*out
DO DO DO DO DODODO DOln DO DO
F F M Md k a m Xdt Vρ
µγρ
− − − − + −= − + −
− −
(2.18)
The derivation of Eq. (2.14) to (2.18) is given in the supplementary material of Albaek et al. (2011).
The oxygen transfer in this work is however approximated by use of a logarithmic mean value for
the driving force, which corresponds to plug flow of the gas phase.
Dissolved oxygen control
A proportional integral control law is used to regulate the substrate feed rate in such a way that the
desired level of dissolved oxygen is obtained.
Estimating the specific growth rate
For cell growth on a single nutrient limiting substrate at low concentrations it is generally seen that
the specific growth rate is proportional to the substrate concentration, S. In contrast, with increasing

18 Chapter 2
values of S the specific growth rate approaches an upper limit (Nielsen et al., 2003). This can be
described with different mathematical models of which the Monod model is frequently used.
However use of e.g. the Monod model requires an estimation of the substrate concentration and the
upper limit of the growth rate (µmax). Intuitively, the dosing strategy of a DOT controlled fed-batch
fermentation yields a very low substrate concentration. If the substrate is consumed immediately
and with the same rate as added via the substrate feed, one can assume a steady state of the substrate
concentration, dS/dt≈0 {Jahic, 2003 157 /id} The following is then seen from the substrate balance
Eq.(2.16)
( )2 2F evap O COFL s
truexs
S F F M Mc FV V mX
ρ
ρ
µγ
− + −−
−=
(2.19)
µ is a function of the feed flow rate, and is to a lesser degree dependent on the substrate
concentration. Note that the balance includes losses to evaporation and CO2.
Computational methods
The model as described above was implemented in MATLAB, version 2009b (Natick,
Massachusetts). Numerical solution of the differential equations was obtained by using the ode23
solver. However, before anything was computed, the yield coefficients and the parameters for the
biomass-viscosity and kLa correlations were estimated.
2.3 Materials and methods
Strain and growth conditions
A proprietary, recombinant strain of T. reesei was used that originated from the wild strain QM6a
(Montenecourt and Eveleigh, 1977a; 1977b) For inoculation, frozen spores were germinated on
fresh agarose plates, allowed to sporulate, and used to inoculate a seed fermentation whose
vegetative growth was subsequently used to inoculate the main fermentors. Inoculation volume was
approximately 10% (volume) of the initial batch volume. The process and batch medium are similar
to those of various previously published studies (Lehman, 2011). Addition of the carbon source
(approximately 65 w/w% carbohydrate) was controlled in such a way that the dissolved oxygen
tension was following a specified set point profile throughout the fermentation. A pulsed-paused
feeding mode as previously described (see for example Albaek et al. (2011)) was also employed
here.
Enzyme expression and activity assay
A cellulase complex is expressed behind various promoters (e.g., (Mach and Zeilinger, 2003)). The

Modeling fungal fermentations for enzyme production 19
hydrolytic activity and specific promoter used are not reported for proprietary reasons. Enzyme
activity was determined using a proprietary enzyme activity assay, and results are here reported as
arbitrary units per litre of fermentation broth.
Experimental design and fermentation conditions
We made a full-factorial design consisting of two levels for three process variables: Specific
agitation power input (1.5 kW/m3 and 15 kW/m3, respectively), aeration rate (96 NL/min and 320
NL/min, respectively), and headspace pressure (0.1 barg and 1.3 barg, respectively). We included a
center point (with values 9 kW/m3, 208 NL/min, and 0.7 barg, respectively) as recommended in the
literature (e.g., (Miller, 2007) and various software packages). Thus in total 9 fermentations were
conducted. The fermentation vessels were 550 L pilot plant fermentors with dimensions as
previously described (Albaek et al., 2008). Six fermentations were carried out with the dual B2-
30/45 (D/T = 0.44) configuration while three fermentations had a single B2-45 (D/T = 0.488)
impeller. pH was controlled through feeding of ammonia, and pressure and temperature were kept
at constant levels by the process control system (DeltaV, Emerson Process Management). The
operation mode of the fermentation process was as follows:
-All fermentations were started with identical batch phases, during which the substrate
concentration decreased from a high initial value to its operational range. The agitation power input
was 0.15 kW, the aeration rate was 96 NL/min, and the headspace pressure was 0.1 barg.
-The batch phase was followed by a DOT controlled fed-batch phase with process variables as
described above and with the carbon substrate feed flow rate as the controlled variable.
Biological parameters
Biomass, specific growth rate, and yield and maintenance coefficients were determined as described
in Albaek et al (2011). A simple maintenance model describes the maintenance uptake of substrate
and oxygen independent of the growth process (Nielsen et al., 2003)
IXitrueix
Ym
µµ
γ
=+
(2.20)
where YIX is the “observed” yield coefficient of biomass per mass of component i, 4rstuv6 is the
“true” stoichiometric coefficient, and mi is the non-growth associated maintenance coefficient of i.
The true yield coefficients for biomass formation on substrate and oxygen and the maintenance
coefficients were then determined since the specific rates of substrate uptake, rs, and oxygen
consumption, ro, are correlated the following way (Nielsen et al., 2003)

20 Chapter 2
i itrueix1r mµ
γ= + (2.21)
Determination of kLa
The direct method was used by means of a mass spectrometer (VG Prima dB, Thermo, MA). A
logarithmic mean driving force was used to model average driving force, since the gas phase
concentration of oxygen is lower in the outlet (Nielsen et al., 2003). Perfect mixing of the liquid
phase is assumed. The oxygen concentration at 100% saturation was estimated using Henry’s
constant for water at 25°C (HO2 = 793.4 bar.kg/mol O2 (Rettich et al., 2000)) and the solute
concentration was assumed constant (DOw = pO2/HO2). The reported kLa values were calculated as
average values for time periods of 1 h.
Rheological measurements
The rheological characterization of the fermentation broth was performed by steady state flow
measurements using a “vane-and-cup” geometry ideal for suspension rheology in a controlled strain
and stress rheometer (AR-G2, TA Instruments, DE). The vane consists of four blades (14 mm W x
42 mm H) mounted at right angles, and the cup had a 15 mm radius and contained 28.72 mL
fermentation broth. The gap between vane and cup was 4000 µm. 15 steady state measurements
(<5% variation in three consecutive measurements of 5 s duration) were made for each sample in
the shear rate interval from 10 to 200 1/s. The power law model was used to describe the
rheological behavior of each sample.
Uncertainty analysis
The Monte Carlo Procedure as described in Sin et al. (2009) was used. 10 model parameters were
included in the analysis. The subjective input uncertainty of the model parameters was subject to an
expert review process and defined as listed in Table 2.2. A uniform distribution was assumed in all
cases. The four observed yield coefficients (YSX, YSP, YSO, YSC) did not vary much and their variation
range was set to 10%. The uncertainty of the viscosity prediction is represented by the uncertainty
of the constant C1 (Eq. (2.13)) and set to 30%. The uncertainty of the mass transfer correlation is
represented by the constant C and set to 30%. The largest uncertainty presumably exists around the
parameters γxs, γxo, ms, and mo; since the fermentations are carried out at low growth rates, these four
parameters are not easily determined. Therefore the variation range was set to 50%. For proprietary
reasons, the actual values of the yield- and maintenance coefficients are not reported.

Modeling fungal fermentations for enzyme production 21
Table 2.2. Expert review of uncertainty of input parameters
Uncertainty class Variation range (%) Parameters
Low 10 YSX, YSP, YSO, YSC
Medium 30 C, C1
High 50 γxs, γxo, ms, mo
100 samples – each containing one value for each parameter – were selected from the input
parameter space using the Latin-Hypercube Sampling method (Sin et al., 2009). In lack of detailed
knowledge, no correlation was assumed between the parameters. The sampled input matrix was
used to perform 100 simulations of a randomly selected fermentation. Fermentation conditions were
1.5 kW/m3, 320 NL/min, and 1.3 barg, respectively.
Sensitivity analysis
Linear regression (using linear least squares) was used to obtain Standardized Regression
Coefficients (SRCs) between the 100 input parameter samples and the output results of the Monte
Carlo simulations. The procedure is described in detail in Sin et al. (2009). The scalar outputs
required for the calculation of the SRCs were chosen to be the values at the end of the fermentation
as the uncertainty in general increased with time.
Power consumption
The power consumption for agitation is calculated by
3 5 g LPo /1000
n N D P PP ρ= (2.22)
where n is the number of impellers, Po is the unaerated impeller power number, and Pg/Po is the
relative power draw upon aeration. The power consumption of the motor includes the power loss in
bearings, seal and gearbox, Ploss
a lossP P P= + (2.23)
Previously, Po for the dual B2-30/45 configuration was determined to be 3.35 (Albaek et al., 2008).
As part of the measurements with this study, Po for the single larger B2 (D/T = 0.48) was found to
be 2.69 and Ploss = 0.15 kW (data not shown). Pg/Po was set to 0.8 in this work (Albaek et al., 2008).
The power dissipated by aeration is calculated as suggested by Roels and Heijnen (1980)

22 Chapter 2
g,standard pair
oln 122.4
v RT V gZP Z pρ
= + (2.24)
The total energy dissipated in the fermentation broth due to agitation and aeration is
broth airP P P= + (2.25)
The power consumption for the air compressor is calculated assuming single stage, isentropic
compression of Q1 from p1 to p2 (Green and Perry, 2008)
11 1 22c
12.78 10 11
kk
ck Q p pP k pη
−
−
⋅ = ⋅ − −
(2.26)
The mechanical and electrical losses of the compressor were represented by the degree of efficiency
of the compressor, ηc, which was assumed to be 0.7 (Knoll et al., 2005). The isentropic exponent, k,
is about 1.4 for air (Kouremenos and Antonopoulos, 1987).
Microbial metabolism and the mechanical power input by agitation dissipate heat to the
fermentation broth. The energy removed from the system by water evaporation is not considered
here. The metabolic heat development has been shown to be directly proportional to the rate of
oxygen consumption and the proportionality constant, ∆Hf, is assumed to be 460 kJ/mol (Cooney et
al., 1969; Nielsen et al., 2003). The total heat generation of the fermentor, Q, is thus
fOTR3600
VQ P H ⋅= + ∆ (2.27)
The power consumption for cooling of the vessel is estimated by assuming an effective cooling
system with a coefficient of performance (COP) of 6 (Curran et al., 1989)
w COPQP = (2.28)
The energy efficiency of oxygen transfer includes all energy consumed by the system
22
OO
a c w
OTRMEE P P PV
=+ +
(2.29)

Modeling fungal fermentations for enzyme production 23
2.4 Results and discussion
2.4.1 Mass transfer
The accumulated oxygen transfer for all fermentations is shown as function of the total specific
power input to the fermentation broth and the aeration rate in Figure 2.2. The achieved specific
power inputs are slightly lower than the experimental design due to the fed-batch mode of
fermentation; the volume generally increased during the course of the fermentation. The average
fermentation broth volume is used for these calculations.
Figure 2.2. Total oxygen transfer for all fermentations as function of aeration rate and total specific power input,
Pbroth/V. Three different headspace pressures were used. Adapted from Albaek et al. (2012).
The oxygen transfer increased with increased aeration, agitation power input and headspace
pressure as predicted from Eq. (2.2) and Eq. (2.7) – (2.9). In the data reported in Figure 2.2 there are
no exceptions to this observation (in each case an increase in any single process parameter leads to
increased oxygen transfer); this provides an indication of the high quality of the equipment and
measurements in the pilot plant.
In Figure 2.3A, B, and C the experimental kLa data are shown versus the correlations presented in
Table 2.1. The correlation by Kawase and Moo-Young (1988) (Figure 2.3A) is not modified to fit
the experimental data. The relationship suggested by Henzler (1982) (Figure 2.3B) has been fitted
to the current data set with A1 = 1.19; A2 = 0.48. The best fit obtained with the empirical correlation
is shown in Figure 2.3C
g
0.52broth 0.15 0.50L app32 Pk a vV µ −
= (2.30)

24 Chapter 2
100
500
100
500
Measured kLa (1/h)
Kawase and M
oo-Young, Eq. (2.7)
A
100
500
Henzler, Eq. (2.8)
B
100
500
kLa = 32⋅(Pbroth/V)0.52⋅ vg0.15⋅ µapp
-0.50
C
100
500
100
500
Measured kLa (1/h)
kLa = 8.42⋅(Pbroth/V)0.33⋅ vg0.56
Wang et al., 1979a
D
100
500
kLa = 5.76 ⋅ (Pbroth/V)0.6⋅ vg0.67⋅ µapp
-0.67
Garcia-Ochoa and Gomez, 1998
E
100
500
kLa = 63 ⋅ (Pbroth/V)0.41⋅ vg0.16⋅ µapp
-0.39
Albaek et al., 2011
F
Model ± 30%
Fig
ure
2.3
. Com
pari
son
of t
hree
cor
rela
tion
s fo
r k L
a u
sing
fer
men
tati
on d
ata.
In
each
cas
e th
e ex
peri
men
tal
data
is
show
n as
fun
ctio
n of
the
mod
el.
A:
Kaw
ase
and
Moo
-You
ng (
1988
), E
q. (
2.7)
. R
egre
ssio
n cu
rve
slop
e: 0
.67
(R2 =
0.8
7).
B:
Hen
zler
(19
82),
Eq.
(2.
8). R
egre
ssio
n cu
rve
slop
e: 0
.75
(R2 =
0.8
4). C
: E
mpi
rica
l co
rrel
atio
n, E
q. (
2.9)
. Reg
ress
ion
curv
e sl
ope:
0.9
7 (R
2 = 0
.93)
. D
: W
ang
et a
l.,
1979
. R
egre
ssio
n cu
rve
slop
e: 0
.84
(R2 =
0.5
8).
E:
Gar
cia-
Och
oa a
nd G
omez
, 19
98. R
egre
ssio
n cu
rve
slop
e: 0
.68
( R
2 = 0
.86)
. F:
Alb
aek
et a
l., 2
011.
Reg
ress
ion
curv
e sl
ope:
1.2
1 (R
2 = 0
.93)
. Ada
pted
fr
om A
lbae
k et
a.-
(20
12).
a Pbr
oth
is i
nser
ted
in h
p/10
00L
and
vg
in c
m/m
in.

Modeling fungal fermentations for enzyme production 25
Of the three correlations included in this work, Eq. (2.30) describes the experimental data best with
a regression curve slope of 0.97. For 105 available data points, only 8 are not within ±30% of the
model prediction. Contrary to previous findings, it is also seen that one correlation describes both
geometrical configurations used. The regression curve slopes for the correlations by Kawase and
Moo-Young (1988) and Henzler (1982) are 0.67 and 0.75, respectively. Even though it might have
been beneficial for a comparison of mass transfer correlations, it has not been possible to include
mass transfer data from other scales.
The correlation matrix of the parameter estimates in Eq. (2.9) based on the Fisher Information
Matrix (see for example Petersen et al. (2008)) is shown in Table 2.3. The parameters are highly
correlated, i.e. most correlation coefficients are higher than 0.5.
Table 2.3. Correlation matrix of the parameter estimation in Eq. (2.9) calculated based on the Fisher Information
Matrix.
C a b c
C 1.0000 -0.5617 0.7264 0.7170
a -0.5617 1.000 -0.0917 -0.4951
b 0.7264 -0.0917 1.000 0.0960
c 0.7170 -0.4951 0.0960 1.000
The correlation coefficients can vary between -1 and +1. Values close to -1 or +1 indicate a high correlation.
Comparison between Eq. (2.30) and other correlations in the literature is possible. In Figure 2.3D, E
and, F the experimental data are shown versus correlations of the same form obtained for non-
Newtonian media in STR. The correlation of Wang et al. (1979) does not contain the viscosity term
and the fit to the data is not impressive (Figure 2.3D). The correlation of Garcia-Ochoa and Gomez
(1998) describes the current data somewhat better (Figure 2.3E). The slope of the regression curve
is 0.68, which reflects the differences in the exponents a, b, and c (0.6, 0.67, and -0.67,
respectively) compared to those of Eq. (2.30). The correlation found in the previous work with A.
oryzae in identical fermentors (Albaek et al., 2011) has an excellent fit with the data (Figure 2.3E).
It is clearly seen that the two different sets of parameters give very similar predictions of kLa. This
underlines the importance of not considering the individual exponents as absolute values. Indeed,
they are highly correlated and many combinations of these constants will yield equally good fit to
the data.
2.4.2 Yield coefficients
The yield coefficients and maintenance coefficients were determined as described in “Materials and
methods”, but their values are not stated for proprietary reasons. However, it was surprising to
observe that in some cases higher headspace pressure led to lower cellulase concentrations. Oxygen

26 Chapter 2
transfer to the fermentation broth was shown to follow Eq. (2.2) and Eq. (2.30) in the previous
section. In all fermentations, the respiration quotient (RQ) was on average equal to 1.05 and
fluctuated only slightly around this value (data not shown), which meant that the CER varied
accurately with the process conditions similar to OUR (assuming OUR = OTR). CO2 has long been
known to inhibit microbial growth (Onken and Liefke, 1989). The actual effect of CO2 is caused by
its concentration in the medium; however, assuming efficient exchange between the gas and liquid
phases, partial pressure of CO2 in the gas phase will be the independent variable (pH was constant
during the fermentations). The yield coefficients for biomass and protein formation relative to the
average yield coefficients for all fermentations are shown in Figure 2.4.
Figure 2.4. Relative YSP and YSX versus partial pressure of CO2. All values are calculated averages of the entire
fermentation. Above a threshold value of pCO2 between 40 and 60 mbar product formation is decreased ~20%. YSX
increases correspondingly. Adapted from Albaek et al. (2012).
At the lowest values (pCO2 < 50 mbar) no clear trend is seen. In two cases, YSP and YSX differ
significantly from this situation. YSP is decreased ~20% when pCO2 is above what seems to be a
threshold level, which lies between 40 and 60 mbar. Biomass formation, YSX, seems to increase
correspondingly to the decrease in product formation. It is important to remember here, that no
threshold CO2 content in the outlet gas (e.g., 3% or 5%) is observed; the essential parameter is the
partial pressure. The complex interactions between process conditions, morphology and growth, and
productivity of filamentous fungi in general are still to be assessed (McIntyre et al., 2001).
The observed response of T. reesei to pCO2 is perhaps not surprising. Onken and Liefke (1989)
compared data from 10 different studies where pCO2 was varied. There is a general trend of growth
retardation for increasing levels of CO2, but examples where lower CO2 partial pressures stimulated
growth, and growth was only inhibited at higher pCO2 are also mentioned (Onken and Liefke,
1989). Pirt and Mancini (1975) found reductions in penicillin production of 35% at 50 mbar CO2
and 50% at 80 mbar CO2 in chemostat cultures of Penicillum chrysogenum. It therefore seems
possible that even CO2 partial pressures in the range of 50 mbar can induce a shift in the
metabolism from product to biomass formation.
20 40 60 80 100 120 140 160 180 2000.5
0.6
0.7
0.8
0.9
1
1.1
1.2
1.3
1.4
1.5
pCO2 (mbar)
Relative yield coefficient
YSX
YSP
YSP
YSX

Modeling fungal fermentations for enzyme production 27
2.4.3 Viscosity
In Figure 2.5A the measured apparent viscosity is shown as a function of fermentation time for all
fermentations. The effective shear rates used for the calculation of the apparent viscosity ranged
from 28-91 1/s. The apparent viscosity increases during the fermentation from initial values around
0.001 Pa.s, the viscosity of water, to maximum values of 0.120 Pa.s at the end of the fermentation.
Figure 2.5. A: Development of apparent viscosity as function of fermentation time for all fermentations. The apparent
viscosity increases from approximately that of water (0.001 Pa.s) to a maximum of 0.120 Pa.s at the end of the
fermentation. B: Parity plot of measured apparent viscosity as function of modeled apparent viscosity. A good modeling
prediction is seen (regression curve slope: 1.01, R2 = 0.80). Note that the time and the constants in the viscosity model
are not given for proprietary reasons.
The measured apparent viscosity is shown as function of the modeled apparent viscosity using Eq.
(2.13) in a parity plot in Figure 2.5B. For proprietary reasons the values of the constants are not
given. The regression slope curve of Figure 2.5B is 1.01 with R2 = 0.80, which means that the
model explains most of the development seen in Figure 2.5A. A few separate measurement point
are not predicted by the model, but this can be due to uncertainty in the determination of the
biomass concentration or an unrepresentative broth used for the rheological characterization.
2.4.4 Process simulation
Now that the parameters from the individual model components are determined, the complete fed-
batch phase can be simulated as proposed. In Figure 2.6 representations of the model prediction and
model uncertainty are shown as well as the experimental measurements. It is clear, that uncertainty
exists in the model outputs. The degree of uncertainty on different outputs is different; e.g. the
uncertainties on biomass and product concentration are relatively larger compared with the
uncertainty of the prediction of kLa. The mean values of the simulations in Figure 2.6 overall
0
0.05
0.1
0.15
0.20
Time
Apparent viscosity (Pa.s)
0 0.05 0.1 0.15 0.200
0.05
0.1
0.15
0.20
µapp = C1Xα(k
sN)C2
Xβ-1
Modeled apparent viscosity (Pa.s)
Measured apparent viscosity (Pa.s)A B

28 Chapter 2
describe the fermentation process in quite a satisfactory manner. The mean simulated trajectories of
weight, specific growth rate, product concentration, feed flow rate, apparent viscosity and kLa are in
fact all very similar to the experimental measurements. The DO is the controlled output and
therefore the uncertainty for this output is expected to be small.
Figure 2.6. Representation of the model prediction and model uncertainty for weight, biomass concentration, specific
growth rate, product concentration, dissolved oxygen, feed flow rate, apparent viscosity, and kLa: Monte Carlo
simulations (gray), mean (-), 10th (• -) and 90th (- - ) percentile of the predictions as well as the experimental
measurements (bold) are shown. The fermentation conditions were: 1.5 kW/m3, 320 NL/min, and 1.3 barg respectively.
Adapted from Albaek et al. (2012).
The example shown in Figure 2.6 is typical for the fermentations performed in this study. In two
cases however, the model is shown to overestimate the final weight by ~20% even though the
oxygen transfer is predicted satisfactory. Interestingly, these two cases are the fermentations with
pCO2 > 50 mbar. One might speculate that the observed change in metabolism from protein
formation to increased biomass formation also leads to changes in the oxygen consumption. The
model in its current state does not correct for these changes, since such phenomena are not
incorporated in the model structure.
It seems that the level of complexity of the model is suitable and that the number of parameters for
growth, product formation, and maintenance uptake is sufficient to describe these processes. Future
improvements could include the effect of increased pCO2.
2.4.5 Sensitivity analysis
The SRCs ranked for each model output are given in Table 2.4. First, it is noticed that the degree of
0
0.2
0.4
0.6
0.8
1Weight
Time0
0.2
0.4
0.6
0.8
1Biomass concentration
Time0
0.02
0.04
0.06
0.08
0.1Specific growth rate (1/h)
Time0
0.2
0.4
0.6
0.8
1Product concentration
Time
0
20
40
60
80
100DO (%)
Time0
0.2
0.4
0.6
0.8
1Feed flow rate
Time0
0.050
0.100
0.150
0.200
0.250Apparent viscosity (Pa.s)
Time0
100
200
300
400
500
Mass transfer coefficient, kLa (1/h)
Time

Modeling fungal fermentations for enzyme production 29
linearization indicated by the coefficient of model determination, R2, is high for all outputs. The
linearized model is thus able to explain most of the variance in the model.
The maintenance oxygen uptake, mo¸ is highly influential on all outputs. mo describes non-growth
associated oxygen uptake, and therefore a higher mo intuitively should lead to less oxygen available
for growth. Consequently, the growth rate should decrease. With the decreased growth rate, also the
biomass and product concentration, feed flow rate, and viscosity are expected to be lower. Finally, a
higher mo should lead to higher kLa because the viscosity is lower. Encouragingly, the signs of the
SRCs of mo predict exactly these trends. This expected behavior of the system is also seen with C
(of the kLa correlation). Increasing C leads to increases in all outputs (positive SRCs). For C1 (of the
viscosity prediction) the analogue (and opposite) behavior is seen.
The maintenance coefficients (γxs, γxo, ms, mo) in general have high rankings, and at least one of
them has a higher ranking than C for all outputs. This might be somewhat surprising, since the
fermentation is limited by mass transfer of oxygen. However, the model of the mass transfer is
accurate with ±30% and therefore, the uncertainty of the model is primarily seen in the biological
parameters. The variations in the yield coefficients (YSX, YSP, YSO, YSC) only have significant impact
on the product concentration. This is expected from Table 2.2 and the model structure, as YSO and
YSC contribute only to the calculation of the dilution term in the selected model outputs.
Overall, the sensitivity analysis shows that detailed knowledge of the production organism is
required in order to use the mechanistic model for quantitative purposes. In future investigations,
emphasis could be on improving the knowledge of the biological system and thus decreasing the
uncertainty of this part of the model. It seems that the viscosity prediction and the mass transfer
correlation at present do have the necessary accuracy.

30 Chapter 2
Table
2.4
. S
tand
ardi
zed
Reg
ress
ion
Coe
ffic
ient
s (S
RC
s):
The
ran
king
of
the
10 m
odel
par
amet
ers
for
the
mod
el
outp
uts.
k La
0.99
SR
C
0.76
0.50
-0.2
5
0.24
-0.1
0
-0.0
1
-0.0
1
-0.0
1
-0.0
1
0.00
SR
C m
ay t
ake
valu
es b
etw
een
0 an
d ±
1.
The
lar
ger
the
abso
lute
val
ue o
f a
coef
fici
ent,
the
mor
e si
gnif
ican
t th
e pa
ram
eter
. The
sig
ns i
ndic
ate
a ne
gati
ve o
r a
posi
tive
im
pact
of
the
para
met
er o
n th
e ou
tput
s.
mo
C
C1
γ xo
γ xs
YS
P
ms
YS
O
YS
X
YS
C
µap
p
0.95
SR
C
-0.6
7
0.51
0.34
-0.2
7
-0.2
0
-0.1
0
0.05
-0.0
1
0.00
0.00
mo
C
C1
γ xs
γ xo
ms
YS
X
YS
O
YS
P
YS
C
Fee
d fl
ow r
ate
0.85
SR
C
-0.5
9
0.50
0.41
0.33
-0.1
4
0.03
0.02
0.02
-0.0
1
0.00
mo
ms
γ xs
C
C1
YS
X
γ xo
YS
C
YS
O
YS
P
Pro
duct
0.97
SR
C
-0.6
3
0.48
0.34
-0.3
0
-0.2
6
-0.2
0
-0.1
7
-0.0
5
0.00
0.00
mo
C
YS
P
YS
X
C1
γ xo
γ xs
ms
YS
O
YS
C
Gro
wth
rat
e
0.91
SR
C
-0.7
4
0.47
0.26
0.23
0.17
-0.0
7
-0.0
5
-0.0
2
0.01
0.01
mo
γ xo
γ xs
ms
C
C1
YS
O
YS
P
YS
X
YS
C
Bio
mas
s
0.97
SR
C
-0.7
1
0.53
-0.2
8
-0.2
8
-0.2
2
-0.1
0
0.03
0.01
0.00
0.00
mo
C
γ xs
C1
γ xo
ms
YS
X
YS
P
YS
C
YS
O
Wei
ght
0.94
SR
C
0.75
-0.4
0
0.34
0.26
-0.2
0
-0.1
7
0.02
0.02
0.01
0.01
γ xs
mo
C
ms
γ xo
C1
YS
X
YS
P
YS
C
YS
O
R2
Ran
k
1 2 3 4 5 6 7 8 9 10

Modeling fungal fermentations for enzyme production 31
2.4.6 Energy efficiency and overall model performance
The efficiency of oxygen transfer is a key process variable, since oxygen transfer completely
governs DOT-controlled fed-batch fermentations and protein formation is thus directly coupled to
oxygen transfer. In Figure 2.7 the measured efficiencies of oxygen transfer (Eq. (2.29)) at each
process condition are shown versus the total specific power consumption including agitation,
aeration and cooling. A clear correlation between EEO2 and specific power input is seen; as
expected efficiency drops with increasing power input. The simulation results are also shown, and
in general the agreement with the experimental results is good. On average, the total oxygen
transfer of the entire fermentation time is under-predicted by only 13%. A deviation in this order of
magnitude is acceptable and within the uncertainty of the model. The simulation “error” is
relatively larger in the low power fermentations.
Figure 2.7. Energy efficiency of oxygen transfer versus total specific power consumption for agitation, aeration and
cooling. Experimental data are shown in uppercase letters while the corresponding simulation results are shown in bold
lowercase letters. The experimentally observed efficiency EEO2 drops with increasing specific power input with a
negative exponent of -0.50 (R2 = 0.88). Adapted from Albaek et al. (2012).
If only the power input for agitation is considered, the following relationship is expected (Schügerl,
1990)
O2mPEE V
∝
(2.31)
0 5 10 15 200.05
0.1
0.15
0.2
0.25
A
a
bc
d
e
f
g
h
i
B
C
D
E
F
G
H
I
A, B, C, ... Experimental data
a, b, c, ... SimulationsEEO2
∝ (P/V)-0.50
Specific power consumption total (kW/m3)
EEO2
(kg O
2/kWh)

32 Chapter 2
By theoretically considering the turbulent forces, it has been suggested, that if the power input was
only altered by a change in agitation intensity, m would be equal to -0.6 (Schügerl, 1991). In this
study, energy consumption for aeration and cooling is however included in order to give a more
realistic description of the operation of the STR. We observe a change in oxygen transfer efficiency
with specific total power input with an exponent m ≈ -0.5, and the simulation results predict a
similar relationship. Opposed to a purely theoretical relation, the mechanistic model incorporates
the complex behavior of the system: Oxygen transfer causes biomass formation; this growth is
coupled with increased viscosity, which increasingly hinders oxygen transfer. Even though
comparison with other studies is difficult due to differences in media properties such as degree of
coalescence-promotion and viscosity, our data is very much in line with other studies in stirred
tanks (Schügerl, 1991). We find it encouraging and interesting that m ≈ -0.5 even after accounting
for aeration and cooling. However, at different scales the relative contributions from agitation,
aeration and cooling change, making the detailed analysis in Eq. (2.29) necessary. In Figure 2.8 the
measured EEO2 is shown versus the simulated EEO2. In each end of the wide range of variation of
the process parameters, the EEO2 is predicted with good accuracy.
Figure 2.8. Parity plot of the measured EEO2 as function of the simulation EEO2. The model covers well the entire range
of fermentation conditions. The simulation error on average is 13% and is therefore larger for the high efficiency
fermentations, which have the smallest energy consumption.
These kinds of simulations, developed for enzyme production by filamentous fungi, may serve as a
basis for development of increased understanding of process economics in the STR. In applying the
0 0.05 0.1 0.15 0.2 0.250
0.05
0.1
0.15
0.2
0.25
Simulated EEO2 (kg O
2/kWh)
Measured EEO2 (kg O
2/kWh)
Parity ± 15%

Modeling fungal fermentations for enzyme production 33
model to the actual fermentation plant one must however consider the remaining critical cost
functions such as product sale price, plant life time, reactor and compressor purchase costs, energy
costs, etc.
2.5 Conclusions
It has been showed that a relatively simple model containing the reaction equation stoichiometry, a
mass transfer correlation, and a viscosity prediction can be used to simulate STR pilot scale fed-
batch fermentations of T. reesei carried out with different agitation, aeration and headspace
pressure.
Three oxygen mass transfer correlations have been compared based on experimental data from 9
fermentations. A purely empirical correlation which is commonly used in the STR literature showed
to describe the experimental data best. No data from other scales were included in the comparison.
The partial pressure of carbon dioxide seemed to have a threshold level around 40-60 mbar, above
which the metabolism is shifted from protein production to more growth in the form of biomass
formation.
The process model was shown to describe the important process variables with a satisfactory
accuracy during the entire fermentation period. The large variation in oxygen transfer is
successfully predicted by the model. The physical part of the model is coupled with a biological
part describing growth, product formation and maintenance uptake. The uncertainty and sensitivity
analyses suggest that future work could be especially focused on the biological part of the model.
Finally the model is shown to predict the energy efficiency of oxygen transfer for the entire range of
process conditions well. This application of the model allows for a quantitative evaluation of the
efficiency of the enzyme production in the STR. As the power input is increased, the efficiency is
decreased, reflecting the inverse relationship often experienced between productivity and efficiency.
The manufacturer can utilize such models to achieve the highest possible profitability if the
remaining costs of production are known.


Chapter 3
Identification of key performance indicators for cellulase
production
The cellulase production process in the STR is described and modeled in Chapter 2. In the current
chapter the focus is on identifying suitable performance indicators that can be used for comparison
of bioreactors. In the literature a number of such indicators have been suggested. The data collected
during the model construction in Chapter 2 are used to determine these performance indicators for
the process studied in this thesis, namely T. reesei fermentation.
In this analysis, investment costs and fixed-costs are assumed to be relatively low owing to the long
lifespan of the plant (Schügerl, 1991) The operational costs considered here are substrate
consumption and energy consumption. Factors such as manual labor, downtime, and raw material
preparation are considered to be equal for the technologies considered.
3.1 Introduction of performance indicators
Depending on the process, many different parameters may be used to characterize and compare
bioreactors. It is important to keep in mind the type of process and product when defining
performance indicators. In this case the product is the extra-cellular (hemi)cellulase complex. The
aim of the process is thus efficient formation of this product. The production of the enzyme
complex is carried out by the active biomass in the fermentation vessel. The formation of product as
well as the growth and existence of active biomass is reliant on oxygen transfer from the gas to the
liquid phase (and finally from the liquid phase to the fungal cells). During most of the process
oxygen transfer is the limiting rate.
For an extracellular product and an oxygen transfer limited process, four performance indicators
was suggested by Schügerl (1991) as seen in Table 3.1. The productivity (product formation per
fermentation broth volume per time) and oxygen transfer rate are obvious indicators. The specific
productivities (product formation per energy consumption (EEP) and efficiency of oxygen transfer
(EEO2)) are indicators of the process efficiency. In this work all energy consumption – including
that of mixing, aeration, and cooling – of the fermentation vessel is considered.

36 Chapter 3
Table 3.1. Units of productivity and oxygen transfer rate and the related efficiencies. Adapted from (Schügerl, 1991).
Indicator Unit Equation
Productivitya kg product/m3/h (3.1)
EEPb kg product/kWh (3.2)
Oxygen transfer ratea kg O2/m3/h (2.2)
EEO2b kg O2/kWh (2.29)
aUsing the average broth volume for the process (not vessel absolute capacity). bIn this work the energy consumption
includes all energy for mixing, aeration, and cooling.
In addition to the energy consumption, the consumption of substrate (including chemicals such as
anti-foam oil) is another major operational cost. The carbon source used in this process constitutes
the largest cost, while the consumption of ammonia used to control pH is also investigated here.
The overall consumption of these substrates relative to overall product formation is calculated as
shown in Table 3.2.
Table 3.2. Units of overall yield coefficients for product on carbon source and ammonia
Indicator Unit Equation
Product yield on carbon substrate, YSP g product/g substrate (3.3)
Product yield on ammonia, YNP g product/g NH3 (3.4)
3.2 Results and discussion
Two fermentations in this data set stand out from the rest. In Chapter 2, the reason for this is argued
to be sensitivity of the organism to pCO2. Throughout this chapter the data from these fermentations
are therefore not included in the calculations, but the data are shown in the figures with special
markers (gray) for comparison.
3.2.1 Productivity and oxygen transfer
The six indicators introduced above have been determined from the data obtained the modeling of
the reference process. In Figure 3.1 the relative productivity and EEP are shown as function of the
total specific power input. The productivity is seen to increase with the power consumption with an
exponent of 0.38 (Figure 3.1A), while EEP decreases with the power consumption with an exponent
of -0.66 (Figure 3.1B). Note that the data are shown in relative units for commercial reasons.
OTR and EEO2 are shown as function of the total specific power consumption in Figure 3.2. OTR
increases with the power consumption with an exponent of 0.50 (Figure 3.2A). The data shown in
Figure 3.2B are identical to the experimental data shown in Figure 2.7. EEO2 decreases with the
power consumption with an exponent of -0.57.

Identification of key performance indicators 37
Figure 3.1.A: Relative productivity (Eq. (3.1)) shown as function of total power consumption for the nine
fermentations described in Chapter 2. The productivity increases with total power consumption with an exponent of
0.38 (R2 = 0.92). The data points in gray are shown for comparison but not included in the regression B: Relative
energy efficiency of product formation (Eq. (3.2)) shown as function of total power consumption. EEP decreases with
the specific power consumption with an exponent of -0.66 (R2 = 0.98).
Figure 3.2. A: Oxygen transfer rate (Eq. (2.2)) shown as function of total power consumption for the nine
fermentations described in Chapter 2. The oxygen transfer rate increases with total power consumption with an
exponent of 0.43 (R2 = 0.85). B: EEO2 (Eq. (2.29)) shown as function of total power consumption. The data is identical
to the experimental data shown in Figure 2.7. EEO2 decreases with the specific power consumption with an exponent of
-0.57 (R2 = 0.91).
0 5 10 15 200.5
1.0
1.5
2.0
2.5
3.0
(P/V)0.38
Specific power consumption total (kW/m3)
Relative productivity (-)
A
0 5 10 15 200.5
1.0
1.5
2.0
2.5
3.0
3.5
4.0
4.5
5.0
(P/V)-0.66
Specific power consumption total (kW/m3)
Relative EEP (-)
B
0 5 10 15 200
0.4
0.8
1.2
1.6
2
(P/V)0.43
Specific power consumption total (kW/m3)
Oxygen transfer rate (kg O
2/m
3/h)
A
0 5 10 15 200
0.05
0.1
0.15
0.2
0.25
(P/V)-0.57
Specific power consumption total (kW/m3)
EEO2
(kg O
2/kWh)
B

38 Chapter 3
The very small difference between the exponents of the regression curves in Figure 3.1 and Figure
3.2 is noteworthy. While the oxygen transfer rate increases with P/V with an exponent of 0.43, the
productivity increases with an exponent of 0.38. EEO2 decreases with the power consumption with
an exponent of -0.57 while EEP decreases with an exponent of -0.66. Since the values of the
productivity and EEP obtained in the experiments are not given here and thus cannot easily be used
in the later comparison, it is interesting to investigate the relation between product formation and
oxygen transfer in more detail.
According to the model presented earlier, maintenance consumption of substrates (carbon and
oxygen are considered in the model) is non-growth related metabolism needed to maintain the
organisms in a healthy state (Pirt, 1965). The amount of dry cell matter (DCM) is shown as function
of the total oxygen transfer in Figure 3.3A. In general, one should be careful with the use of DCM
since this method (as described in Chapter 2) includes all non-soluble substances as well as live and
dead biomass. If however, DCM is assumed to reflect mostly the biomass present in the bioreactor,
the biomass formation is linearly proportional to the oxygen transfer. The slope of the regression
line gives the yield coefficient of biomass per oxygen, YOX.
In Figure 3.3B the corresponding graph for product formation is shown. Product formation is
almost linearly proportional to oxygen transfer. The second order polynomial regression curve fitted
the data slightly better than a linear regression (R2 = 0.98 and R2 = 0.97, respectively).
Figure 3.3.A: Dry cell matter in the bioreactor shown as function of total oxygen transfer. A linear relation is seen
between dry cell matter and oxygen transfer (R2 = 0.95). The slope of the regression line is the yield of DCM per
oxygen, YOX. B: Total product formation shown as function of end total oxygen transfer. An almost linear relation is
seen between product formation and oxygen transfer. The slope of the regression curve is the yield of product per
oxygen, YOP. Note that dry cell matter and product formation are shown in arbitrary units for proprietary reasons.
0 20 40 60 80 100 1200
0.5
1.0
1.5
2.0
Total oxygen transfer (kg)
Dry cell matter (-)
A
0 20 40 60 80 100 1200
0.5
1.0
1.5
2.0
Total oxygen transfer (kg)
Total product form
ation (-)
B

Identification of key performance indicators 39
The yield of product per oxygen, YOP, is shown as function of the average DCM during
fermentation in Figure 3.4. No clear correlation is observed between YOP and average DCM. The
data presented in Figure 3.3 and Figure 3.4 indicates that the maintenance consumption of oxygen is
relatively small. The presented data shows, that the oxygen transfer almost linearly determines both
the formation of biomass and product.
Figure 3.4. Yield of product per oxygen, YOP, shown as function of average dry cell matter during fermentation. The
calculated mean value of YOP is also shown. The standard deviation from the mean value is 9.4%.
The final comparison of this section is shown in Figure 3.5. OTR and EEO2 are shown as function of
productivity and EEP in Figure 3.5A and B, respectively. OTR can be described by a second order
polynomial of the productivity (R2 = 0.94). A linear regression line fits the data almost as well (R2 =
0.93). Also EEO2 can be described by a second order polynomial of EEP (R2 = 0.97).
The results of this section show that oxygen transfer completely governs the progress of this
process. This is perhaps not unexpected, since the process is oxygen transfer limited. The
maintenance uptake and consumption of oxygen is indicated to play a very small role, since the
yield of product on oxygen does not seem to vary with the amount of biomass in the reactor. This
means that YOP can be considered almost constant and it also explains why OTR and EEO2 are
almost linearly proportional with productivity and EEP. Instead of using productivity and EEP
(which again are not revealed due to commercial reasons) as process indicators it is therefore
natural to use OTR and EEO2.
0
0.5
1.0
1.5
2.0
Average dry cell matter (-)
Relative YOP (-)

40 Chapter 3
Figure 3.5. A: Oxygen transfer rate shown as function of productivity. The regression curve is a second order
polynomial (R2 = 0.94). B: EEO2 shown as function of EEP. The regression curve is a second order polynomial (R2 =
0.97).
3.2.2 Yield coefficients YSP and YNP
The overall yield coefficients, YSP and YNP, specify the influence of the total consumption of the
variable substrates, the carbon substrate and ammonia, of the process. All fermentations had
identical batch phases and additional substrates in the batch medium are not considered here. YSP
and YNP are shown as function of the total specific power consumption in Figure 3.6.
0
0.4
0.8
1.2
1.6
2
Productivity (-)
Oxygen transfer rate (kg O
2/m
3/h)
A
0
0.05
0.1
0.15
0.2
0.25
EEP (-)
EEO2
(kg O
2/kWh)
B

Identification of key performance indicators 41
Figure 3.6. A: Relative YSP shown as function of total specific power consumption. The mean value of all nine
fermentations is used in the model of Chapter 2. There is no relation between YSP and P/V. B: Relative YNP shown as
function of total specific power consumption. A slightly inverse relation between YNP and P/V is seen (R2 = 0.45)
For YSP no relation with the total specific power consumption is seen. For YNP an inverse relation
with the total specific power consumption is observed. Like YOP, YSP and YNP are shown as function
of average DCM in Figure 3.7. No relation is observed between YSP and the average DCM either,
which suggests that in this case not much carbon is used in the maintenance metabolism even at low
growth rates. This implies that it is reasonable to assume a constant yield coefficient for product on
the carbon substrate. The standard deviation from the mean value is 9.0%.
For YNP there seems to be a relation with the average DCM (negative exponent of -0.13 and R2 =
0.55). The standard deviation from the mean value for YNP is however only 8.9% and it therefore is
reasonable also to consider this yield coefficient constant.
0 5 10 15 200
0.5
1.0
1.5
2.0
Specific power consumption total (kW/m3)
Relative YSP (-)
A
mean
0 5 10 15 200
0.5
1.0
1.5
2.0
(P/V)-0.076
Specific power consumption total (kW/m3)
Relative YNP (-)
B
mean
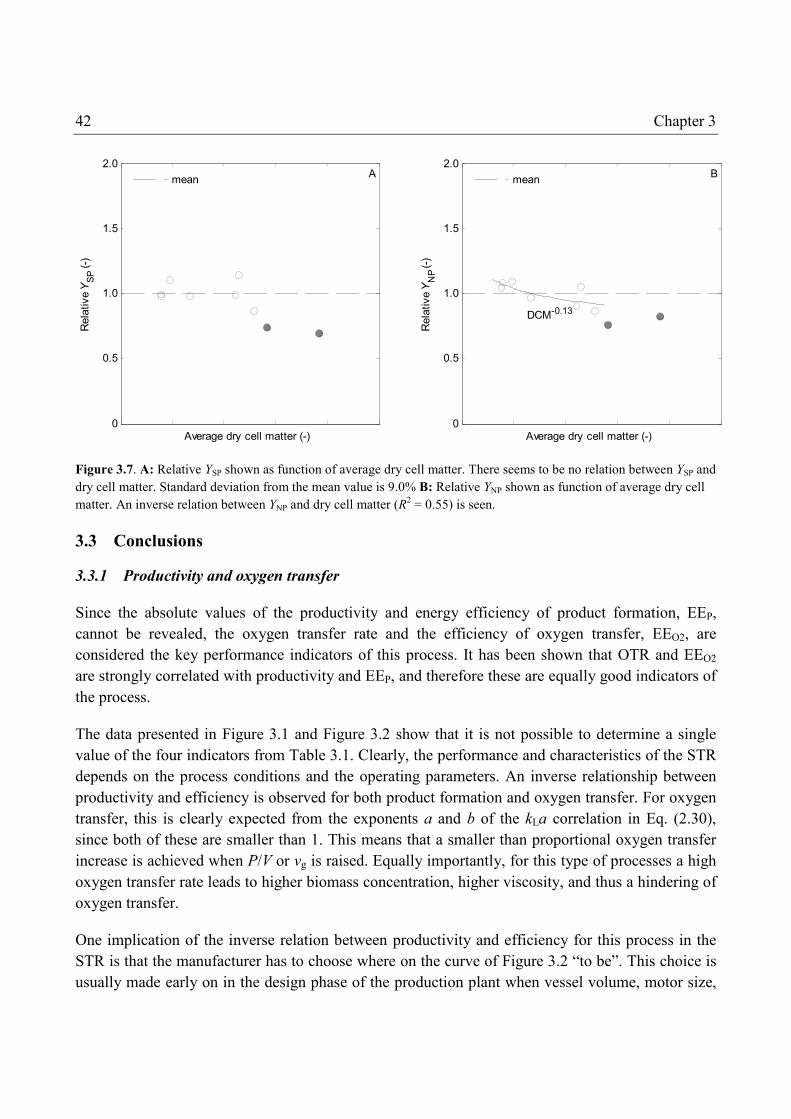
42 Chapter 3
Figure 3.7. A: Relative YSP shown as function of average dry cell matter. There seems to be no relation between YSP and
dry cell matter. Standard deviation from the mean value is 9.0% B: Relative YNP shown as function of average dry cell
matter. An inverse relation between YNP and dry cell matter (R2 = 0.55) is seen.
3.3 Conclusions
3.3.1 Productivity and oxygen transfer
Since the absolute values of the productivity and energy efficiency of product formation, EEP,
cannot be revealed, the oxygen transfer rate and the efficiency of oxygen transfer, EEO2, are
considered the key performance indicators of this process. It has been shown that OTR and EEO2
are strongly correlated with productivity and EEP, and therefore these are equally good indicators of
the process.
The data presented in Figure 3.1 and Figure 3.2 show that it is not possible to determine a single
value of the four indicators from Table 3.1. Clearly, the performance and characteristics of the STR
depends on the process conditions and the operating parameters. An inverse relationship between
productivity and efficiency is observed for both product formation and oxygen transfer. For oxygen
transfer, this is clearly expected from the exponents a and b of the kLa correlation in Eq. (2.30),
since both of these are smaller than 1. This means that a smaller than proportional oxygen transfer
increase is achieved when P/V or vg is raised. Equally importantly, for this type of processes a high
oxygen transfer rate leads to higher biomass concentration, higher viscosity, and thus a hindering of
oxygen transfer.
One implication of the inverse relation between productivity and efficiency for this process in the
STR is that the manufacturer has to choose where on the curve of Figure 3.2 “to be”. This choice is
usually made early on in the design phase of the production plant when vessel volume, motor size,
0
0.5
1.0
1.5
2.0
Average dry cell matter (-)
Relative YSP (-)
A
mean
0
0.5
1.0
1.5
2.0
DCM-0.13
Average dry cell matter (-) Relative YNP (-)
B
mean

Identification of key performance indicators 43
and compressor pressure etc. are determined. However the operating conditions of most STRs can
easily be changed, so that in times of excess production capacity the agitation or aeration intensity –
and thereby also the overall productivity – is reduced, while the energy efficiency is increased.
The data collected from this process might be quite different to other data available in the literature
due to differences in the media. Coalescence and viscosity of the medium highly influence the
oxygen transfer. It should also be remembered that the power consumption considered in the
literature is often only that delivered to the broth by the agitator.
3.3.2 Yield coefficients YSP, YNP, and YOP
The yield coefficients for product formation on carbon substrate, ammonia, and oxygen can be
considered constant for the conditions used in this study. No or only very weak correlations were
found between each of the coefficients and the specific power input and average DCM. The yield
coefficients therefore cannot be used as key performance indicators for this process. The results
suggest that the maintenance consumption of carbon substrate, ammonia, and oxygen is of minor
importance for this process. This finding might be somewhat surprising if compared to the results of
Table 2.4, where the maintenance coefficients were found to have high SRCs. However, that
analysis in fact showed that uncertainty of the model developed in Chapter 2 is caused by the
uncertainty concerning the value of the maintenance coefficients. The results of Chapter 3 do not
contradict that conclusion; the results rather indicate that the maintenance coefficients for oxygen
and substrate are quite small.


Chapter 4
Identification of alternative enzyme production
technologies
Using current technology, large amounts of enzymes are needed if the ambitions of lignocellulosic
ethanol and commodity chemicals are to come true. The United States congress set an annual goal
of 16 billion gallons of cellulosic ethanol by 2022 along with 15 billion gallons of ethanol from
conventional sources like corn starch (U.S.Congress, 2007). Currently, conversion of
lignocellulosic biomass realistically results in approximately 80 gallons of ethanol per dry ton of
feedstock, which corresponds to about 75% of the maximum theoretical conversion (Humbird et al.,
2011). If an enzyme loading of 20 mg/g cellulose is assumed, approximately 1·106 kg of cellulase
protein is needed annually in order to comply with the US ambitions (Humbird et al., 2011).
The work described so far in the thesis has been conducted at pilot plant scale, while the
commercial production of enzymes will surely take place at very large scale, since the increase of
production capacity is governed by the principles of the economy of scale. Collection of cost data
for a wide range of plant construction has given rise to the so-called six-tenth factor, which means
that as the plant capacity is doubled, the cost will only be 20.6 higher (Votruba and Sobotka, 1992).
The purpose of this chapter is to compare different enzyme production technologies that have been
described in the literature and evaluate their potential as the platform for industrial enzyme
production. The approach is to utilize the process model that has been constructed for T. reesei
enzyme production in Chapter 2 and evaluate the fermentation technologies at large scale based on
available knowledge for each technology.
The list of technologies is not exhaustive. Innumerable minor and major variations of fermentation
technologies have been suggested, patented, and published. It is not the aim of this work to include
all technologies that have ever existed; it is however the hope that the significant types of
alternative technologies for enzyme production at the moment are covered. For more detailed
descriptions of each technology in this chapter the reader is referred to books dealing entirely with
the subject (Schügerl, 1991; Schügerl and Sittig, 1982).

46 Chapter 4
4.1 Scale-up strategy
An enormous number of book chapters, reviews, and original papers have dealt with the subject of
scale-up (Reuss, 1993). Scale-up of biotechnological processes is usually the final step in a research
and development program leading to the large scale industrial manufacture of a biotechnological
product by fermentation (Hewitt and Nienow, 2007). The term scale-up has become almost
identical with the attempt to duplicate a seemingly optimal solution from small-scale fermentors in
large scale aerated STRs (Charles, 1985). That task has proven to be very difficult, as the process of
scaling up a fermentation system is often governed by a number of important engineering
considerations and not simply a question of increasing culture and vessel volume (Hewitt and
Nienow, 2007).
Scale-up can however also be the problem associated with the design of a fermentor or a production
plant, assuming that the designer has the flexibility to select and develop a system to meet the
process requirements (Reuss, 1993). This perception of scale-up fits well to the procedure presented
here. The enzyme production fermentation described in Chapter 2 will be used as the reference
process in a screening of technologies based on their energy efficiency. The following procedure for
this screening was employed:
1. Oxygen transfer was assumed to be the rate limiting step of the process. Oxygen transfer
was modeled using Eq. (2.2) and the logarithmic mean value for the driving force as shown
in Eq. (2.18) was used.
2. Mass transfer data were obtained from the open literature for each technology and inserted
in the process model. Preferably, mass transfer data collected in non-Newtonian media were
used in order to access the influence of increasing viscosity on mass transfer. The viscosity
model obtained in Chapter 2 was used to estimate the viscosity of the fermentation broth.
3. The process model of Chapter 2 including the DOT-controlled substrate feed flow was used
to simulate the progress of the fermentation.
4. Geometric similarity was assumed and the operating conditions at large scale were equal or
similar to the ones used to obtain the mass transfer data.
5. The fermentation length was the same for all technologies (between 100-200h). For
proprietary reasons the exact fermentation length is not stated.
6. The fermentation vessel volume was iterated such that the total oxygen transfer at the
fermentation end was equal for all technologies. The total oxygen transfer was in the range
10,000-30,000 kg but the exact amount is not revealed for proprietary reasons. The vessel
volumes needed were in the range of 100 m3.
7. The total energy consumption during fermentation was estimated as shown in Chapter 2.
Since product formation is proportional to oxygen transfer, this procedure ensured that an equal
amount of product was formed for each technology. Mixing was not quantitatively considered in
this procedure, since this process could not be predicted at other scales for all technologies. The

Identification of alternative technologies 47
scale-up procedure described here thus includes a constant DOT as this is the way the fermentation
process is controlled, while other parameters such as superficial gas velocity, kLa, and OTR might
vary significantly from the laboratory experiments. This is only natural since completely different
conditions are often provided at large scale (Garcia-Ochoa and Gomez, 2009).
The technologies included in this chapter were subject to an assessment of their technical feasibility
at large scale. Each technology was scored from 0-10; with 10 ranging as very high likelihood of
successful implementation at large scale. Assessments of this kind are inherently subjective and the
score given here should not be considered a “hard number”.
4.2 Technology screening
Fermentation technologies are often grouped according to the primary method of energy input:
energy input through expansion of compressed gas, energy input by means of liquid kinetic energy
generated by a liquid pump, or energy input by mechanically moving agitators (Schügerl, 1991).
This classification is also used here. Solid state fermentation is treated in a separate section, as this
fermentation technology differs significantly from the other groups.
4.2.1 Power input by compressed gas
Mixing and mass transfer of these reactor types relies on compressed gas dispersed into the liquid
through a sparger. The energy consumption of these reactors was determined as the sum of the
energy consumption of the compressor calculated by Eq. (2.26) and the energy consumption for
cooling by Eq. (2.28).
4.2.1.1 Bubble column
These reactors are only controlled by the aeration, which is usually supplied by a porous plate of a
perforated ring at the bottom of the reactor (Schügerl, 1985). The dispersion of gas leads to density
differences within the fluid body, which induces convective flows in the reactor sufficient enough
for mixing and mass transfer for a variety of biotechnological processes (Lübbert, 2010). Bubble
columns are often utilized when the medium has a viscosity only slightly higher than that of water
and a commonly mentioned disadvantage is a limited top-to-bottom mixing in slender columns
(Lübbert, 2010).
Bubble columns have however also been employed for fermentations of filamentous fungi such as
Penicillium chrysogenum (Deckwer et al., 1982). The effect of apparent viscosity on mass transfer
in a bubble column was also studied by Godbole et al. (1984) by testing various concentrations of
carboxy methyl cellulose (CMC) solutions in a rather large bubble column. An overview of the
conditions tested in the study is given in Table 4.1.

48 Chapter 4
Table 4.1. Summary of experimental conditions for a bubble column (Godbole et al., 1984)
Property Value
Vessel volume (m3) 0.250
Operating volume (m3) 0.183
Diameter (m) 0.305
Height (m) 3.4
Fluid CMC solutions
Superficial gas velocity (m/s) 0.0025-0.25
kLa values (1/h) 72-144
The kLa values obtained in the study were sufficient for oxygen transfer of fermentations of
filamentous fungi; however increasing viscosity was shown to have a large impact on kLa. The mass
transfer correlation recommended was the following (Godbole et al., 1984)
0.44 1.01L g app3.006k a v µ −= (4.1)
The mass transfer of Eq. (4.1) was inserted in the process model and a superficial gas velocity of
0.15 m/s was assumed. The simulation of the bubble column gave the following results
Performance indicator Value
Oxygen transfer rate (kg O2/m3/h) 0.83
EEO2 (kg O2/kWh) 0.18
The technical feasibility of the bubble column is indisputable. This type of reactor is widely used in
large production scale for commodity products such as baker’s yeast and citric acid (Lübbert, 2010).
The technical feasibility at industrial scale was assessed at 10 on the scale from 0-10.
4.2.1.2 Airlift reactor with internal loop
This reactor type has a defined liquid flow directed by the geometry of the reactor or the reactor
internals. The liquid flow is caused by a density difference between an aerated part of the liquid and
a non-aerated part. In turn this driving force is caused by a difference in gas hold-up (Chisti and
Moo-Young, 1987).
Airlift reactors exist in a variety of configurations. The reactor may have internal or external loops
and may be fitted with internals such as static mixers (Chisti, 1989). Airlift reactors with various
combinations of internal fittings such as draft tubes and perforated plates also exist (Fukuda et al.,

Identification of alternative technologies 49
1978), and even mechanically agitated airlift reactors have been proposed (Chisti and Jauregui-
Haza, 2002). In Table 4.2 a summary of the experimental conditions are given for a study of a
simple internal loop airlift reactor with a central draft tube.
Table 4.2. Summary of experimental conditions for a internal loop airlift reactor (Barker and Worgan, 1981)
Property Value
Vessel volume (m3) 0.140
Operating volume (m3) 0.100
Diameter (m) 0.30
Height (m) 2.00
Fluid 0-1 % (w/v) starch solution
Riser superficial gas velocity (m/s) 0.018-0.069
kLa values (1/h) 40-100
Increasing viscosity was shown to lead to a decrease of kLa and different broth viscosities were
tested, but no general relationship between kLa and viscosity was found (Barker and Worgan, 1981).
The mass transfer correlation recommended by Barker and Worgan (1981) for the gas-air system
was the following
0.78L g,r853k a v= (4.2)
In order to incorporate the anticipated influence of increased viscosity, in the simulation of the
airlift reactor with this geometry, a 25% smaller constant was assumed, and thus the constant of Eq.
(4.2) was set to 640. The airlift simulation was carried out using vg,r = 0.069 and gave the following
results
Performance indicator Value
Oxygen transfer rate (kg O2/m3/h) 0.54
EEO2 (kg O2/kWh) 0.40
This type of reactor is popular; its use is widespread and it is used for microorganism, plant and
animal cell cultivation (Blenke, 1979; Hatch, 1975; Schügerl, 1991; Sittig, 1982). The technical
feasibility at industrial scale was assessed at 9.
4.2.1.3 The pressure cycle reactor
A noteworthy variation of the airlift reactor with internal loop is the so-called pressure cycle

50 Chapter 4
reactor. In Billingham, England, Imperial Chemical Industries constructed a very well known and
very large reactor of this type with an operating volume of about 1500 m3, see Figure 4.1 (Westlake,
1986). The reactor was constructed for single cell protein fermentation of the species Methylophilus
methylotrophus. The organism was grown in a medium containing methanol as the sole carbon
substrate (Westlake, 1986). The process was run with a high cell mass concentration and in order to
match the biological kinetics, an extremely high oxygen transfer rate of approximately 10 kg
O2/m3/h was required (Hines et al., 1975). Under pressure, this can be achieved by intense
mechanical agitation in small vessels, but is prohibitive in power consumption for large scale
equipment (Hines et al., 1975). For this reason an airlift fermentor was developed in which the air
for biological oxidation also provided the liquid circulation (Hines et al., 1975).
Figure 4.1. Pressure cycle fermenter. Reprinted from Schügerl (1983) with permission from John Wiley and Sons, Inc.
The reactor had an inner diameter of 7 m and was 60 m tall; thus the operating ungassed liquid
height would have been around 40 m. The top of the fermentor was widened to enable the gas

Identification of alternative technologies 51
bubbles to separate from the ascending liquid stream before the liquid returns in the downcomer
zones (Smith, 1980). The reactor contained an internal draft tube for the aerated section, and in
order to reduce the liquid velocity perforated plates were mounted in this section. The difficulty of
the operation of such a large reactor with fast-growing bacteria is that of maintaining the supply of
power, oxygen, and substrate while still ensuring their uniform distribution in the reactor (Schügerl,
1991). The air was claimed to be added with a pressure of 6 bar at the base of the fermentor, whilst
CO2 is drawn off at the top with a pressure of about 3 bar (Westlake, 1986). However, this does not
fit together with a liquid height of at least 40 m. The distribution system of the toxic methanol
substrate was attached to the 19 perforated plates, and uniform distribution was accomplished by
having 5000-8000 injection points throughout the height of the fermentor (Schügerl, 1991). This
means that the oxygen demand created by the methanol injection was primarily in the riser of the
fermenter.
Before dealing with the energy consumption of this reactor type, the biological aspects of the
technology are worth considering. The fermenting mass is circulated between areas of high and low
pressure driving the liquid circulation (Smith, 1980). The ability of the micro organism to withstand
these changes in physiological conditions was tested in laboratory scale, but it is specifically stated
that the distinct design of the reactor was unlikely to be suitable, without further research and
design, for other fermentations (Smith, 1980).
There seems to be disagreement over the energy consumption of the reactor. The energy dissipation
rate of the reactor was claimed to be 1.6 kW/m3 by Westlake (1986), while the oxygen transfer
efficiency stated by Hines et al. (1975) was 1.5 kg O2/kWh with an OTR of 10 kg O2/m3/h. This
corresponds to a specific energy consumption of 6.6 kW/m3. The aeration rate of the reactor has
been stated to be 93000 Nm3/h (Schügerl, 1983). If the pressure at the bottom of the reactor is
assumed to be 6 bar, the power consumption of the compressor estimated using Eq. (2.26) is 9,300
kW. With a liquid volume of 1500 m3 this corresponds to 6.2 kW/m3, which is close to the number
of Hines et al. (1975). However, the aeration rate of 93000 Nm3/h corresponds to a mean superficial
gas velocity of 0.225 m/s (based on the total reactor cross-sectional area), which means that the
power input per unit liquid is about 2.2 kW/m3 (Chisti and Moo-Young, 1987). This number is in
turn very close to that of Westlake (1986). This kind of seemingly divergent data is a general
problem that will be examined closer in a later chapter of this thesis.
The mass transfer coefficient achieved in the reactor can be estimated using Eq. (2.2). If the mass
transfer is assumed to take place throughout the height of the fermentor, the average pressure in the
fermenter is assumed to be 4 bar, and DO of the medium is set to zero one obtains (Schügerl, 1991):
( )( ) ( )
32L * 32
10 kg O /m /hOTR 313 1/hDO 4 0.008 kg O /mk a = = =⋅
(4.3)
52 Chapter 4
By use of the process conditions from the above discussion of the pressure cycle reactor, a
simulation based on this technology was completed. The impact of increasing viscosity could not be
determined. The pressure cycle reactor has a high oxygen transfer rate, but in this simulation it did
not match the 10 kg O2/m3/h mentioned in the literature, since the simulated reactor was shorter and
thus the driving force for oxygen transfer was smaller. The simulation was performed assuming
only a headspace pressure of 0.5 barg; otherwise the partial pressure of CO2 was unacceptably high.
The following results were obtained
Performance indicator Value
Oxygen transfer rate (kg O2/m3/h) 2.17
EEO2 (kg O2/kWh) 0.31
The technical feasibility of the reactor has been proven on a very large scale, but its complex design
with many feeding points is not desirable from a sanitary point of view. Furthermore the fermenter
height and slenderness potentially involve unacceptably high levels of pCO2. The technical
feasibility at industrial scale was assessed at 5.
A variant of the pressure cycle reactor was also designed and operated for use in the sewage and
effluent treatment business and sold under license with the trade name “Deep Shaft” (Smith, 1980;
Walker and Wilkinson, 1979). It has not been possible to obtain data for this type of reactor for this
comparison. However, its large volume and thin design (the depth was in the range 50-150 m
(Schügerl, 1985)) makes it a questionable candidate for other purposes than waste-water treatment.
4.2.1.4 Airlift reactor with external loop
A 1000-tons per year single cell protein reactor of this type was constructed as a pilot scale
fermentor by Imperial Chemical Industries (Gow et al., 1975). However, no construction and
operational data were published on the unit.
The mass transfer capability of an airlift reactor with external loop was improved by insertion of
static mixers in the riser section of the reactor (Chisti et al., 1990). The plastic static mixer elements
were fitted inside the tube of the riser with the intension of increasing the surface for gas-liquid
transfer by physically breaking down larger gas bubbles into smaller ones (Chisti et al., 1990). The
energy needed for the break-up of bubbles in static mixers was delivered by a pressure drop through
the loop. The mass transfer in different CMC solutions was studied, and it was found that for highly
viscous fluids the viscosity did not permit sufficiently rapid fluid circulation and the reactor became
stagnant (Chisti et al., 1990). For highly viscous fluids the use of static mixers therefore also
requires the use of a liquid pump to force circulation in the loop (Chisti et al., 1990).

Identification of alternative technologies 53
Table 4.3. Summary of experimental conditions for a external loop airlift reactor with static mixers (Chisti et al., 1990)
Property Value
Vessel volume (m3) 0.0149
Operating volume (m3) 0.0120
Diameter, riser (m) 0.050
Diameter, downcomer (m) 0.075
Height (m) 1.8
Fluid 0-0.6 % (w/v) CMC solution
Riser superficial gas velocity (m/s) 0.02-0.08
kLa values (1/h) 4-108
Increasing viscosity was shown to result in a decrease of kLa as expected for this technology. The
data for the 0.2% (w/v) CMC are reported here, since this CMC concentration was most similar to
the medium of T. reesei fermentations. The mass transfer correlation recommended by Chisti et al.
(1990) for the 0.2% (w/v) CMC solution was the following
0.83L g,r241k a v= (4.4)
For the simulation of this technology an aspect ratio of 15 was used and a riser superficial gas
velocity of 0.06 m/s. The increasing viscosity of the fermentation broth was simulated, but this did
not affect mass transfer since this is not included in Eq. (4.4). The simulation gave the following
results
Performance indicator Value
Oxygen transfer rate (kg O2/m3/h) 0.16
EEO2 (kg O2/kWh) 0.12
Highly viscous fermentation broths may not be possible to circulate through the static mixers
without the aid of a liquid pump. Furthermore the static mixers might impose serious sanitary
problems. The technical feasibility at industrial scale was assessed at 5.
4.2.1.5 Gas fluidized bed reactor
Baker’s yeast has been grown aerobically in the form of solid particles in reactors known as gaseous
fluidized beds (Schügerl, 1985). In such beds, air would be used to fluidize the solid yeast particles
and to supply the oxygen necessary for aerobic growth, while the concentrated nutrient solution is
54 Chapter 4
sprayed above the bed surface (Mishra et al., 1982). This system possibly eliminates the
requirement for cooling, and drying of the yeast could take place in the production vessel (Mishra et
al., 1982). However, only low growth rates could be realized and the technology was found
noncompetitive for industrial biomass production (Mishra et al., 1982).
Since this technology differs significantly from the submerged fermentation type used for the
industrial enzyme production, no further investigation of these reactor types was made. Whether T.
reesei could grow in the form of solid particles and maintain its high secretion of proteins is not
known.
4.2.2 Power input by liquid circulation
This type of reactor requires a loop in which the liquid is accelerated. The kinetic energy produced
is then used to disperse the gas in the reactor, providing the mixing and mass transfer needed for
successful fermentation (Schügerl, 1991). Pump efficiencies are in the range 0.75-0.95; in this
section the pump efficiency is assumed to be 0.80 (Schügerl, 1985). Cooling may be achieved by a
heat exchanger in connection with the loop and thus internal cooling coils of the reactor may be
avoided.
4.2.2.1 Plunging jet reactor
A nozzle is directed downwards and a liquid jet hits the liquid surface of the fermentor vessel,
which plunges into the liquid taking some of the surrounding air with it (Schügerl, 1991). An
example of the set-up is given in Figure 4.2, where a two-phase jet is produced in the nozzle (6)
dispersing the gas in the liquid phase. The mass transfer in the system is largest between the bubbles
dispersed in the pool liquid (Schügerl, 1991)
The main variables are the distance between the nozzle and the liquid pool surface, the pool
geometry, and the angle of jet inclination from the vertical position (Schügerl, 1985). A 20 m3
plunging jet reactor has been used to produce single cell protein from whey (Moebus and Teuber,
1979), however the main application of the reactor is in waste-water treatment (Schügerl, 1985).
The production of xanthan was studied in the plunging jet reactor depicted in Figure 4.2 by Zaidi et
al. (1991). A summary of the experimental conditions of the study is given in Table 4.4. The effect
of the power input on mass transfer was studied at the end of a fermentation, where the viscosity of
the broth was approximately 0.2 Pa.s (with a shear rate of 80 1/s). The influence of different
aeration rates was not studied.

Identification of alternative technologies 55
Figure 4.2. Experimental set-up for xanthan production in a plunging jet reactor by Zaidi et al (1991). Figure reprinted
with permission from Springer.
Table 4.4. Summary of experimental conditions for a plunging jet reactor (Zaidi et al., 1991)
Property Value
Vessel volume (m3) 0.100
Operating volume (m3) 0.040-0.080
Diameter, vessel (m) 0.40
Height (m) 0.8
Pump power input (kW/m3) 0.07-0.5
Fluid xanthan fermentation broth
Vessel superficial gas velocity (m/s) 0.003
kLa values (1/h) 32-83
The mass transfer correlation obtained for the system was the following
0.45L 111 Pk a V
=
(4.5)
In order to simulate the plunging jet reactor it was assumed that multiple jets are used
simultaneously. No data on the pressure in the external loop were given, so the minimum outlet
56 Chapter 4
pressure for the gas compressor was assumed to be 1 barg. The superficial gas velocity was
assumed to be 0.06, which is however larger than the range of the study, but this is a natural
consequence of scale-up. Fermentation broths of T. reesei probably have lower viscosity than the
xanthan fermentation broth, so the energy efficiency for T. reesei might be higher than predicted
here. The simulation gave the following results
Performance indicator Value
Oxygen transfer rate (kg O2/m3/h) 0.60
EEO2 (kg O2/kWh) 0.13
The technical feasibility for this system has been proven for pilot scale fermentations of
Xanthomonas campestris. The fitting of multiple jets in a large reactor might be associated with
technical difficulties and mixing limitations. How other filamentous fungi are impacted by the
pump and pressure drop in the nozzle is not known. The technical feasibility of the technology is set
to 6.
4.2.2.2 Rotating jet heads
Jets are a well known low power input alternative for mixing in large tanks and are also used in
waste-water treatment and in storage tanks to avoid stratification (Revill, 1985; Schügerl, 1980).
This reactor system is a special kind of jet nozzle reactor developed based on a “cleaning in place”
machine produced by Toftejorg, Denmark. A liquid stream is taken out of the reactor and
recirculated into the reactor along with gas. In stationary jet systems the flow patterns are constant
which may lead to stagnant zones in the tank resulting in compartmentalization and poor mixing in
the tank (Kold, 2010). In this system the recirculated fermentation broth is distributed by four
nozzles into the tank, while the pressure of the incoming liquid drives a turbine that via a gearing
system, makes the “head” rotate around both the horizontal and the vertical axes (Nordkvist et al.,
2008). The jets of mixed recirculated fermentation broth and gas continuously change direction and
are thus designed to cover the entire reactor volume.
In a recent study, Kold (2010) investigated mass transfer of a rotating jet head during fermentation
of X. campestris. The experimental conditions of the study are shown in Table 4.5.

Identification of alternative technologies 57
Table 4.5. Summary of experimental conditions for a rotating jet head (Kold, 2010)
Property Value
Vessel volume (m3) 0.310
Operating volume (m3) 0.300
Diameter, vessel (m) 0.750
Height (m) 0.750
Pump power input (kW/m3) 0.4-4.2
Fluid xanthan fermentation broth
Vessel superficial gas velocity (m/s) 0.001-0.005
kLa values (1/h) 132-180
No complete mass transfer correlation could be derived for the system. However the individual
influences of increased power input by the pump P/V, the reactor superficial gas velocity, and the
increasing viscosity was estimated. The apparent viscosity studied was in the range 0.004-0.011
Pa.s, while there was very little variation in the superficial gas velocity. The correlations between
the variables were found to be
0.1220.4 0.8L g app
Pk a vV µ − ∝
(4.6)
In order to simulate the rotating jet heads it is assumed that multiple devices can be fitted inside an
industrial scale reactor and provide the same mass transfer efficiency. The power input of the pump
was set to 1.0 kW/m3, which corresponds to a pressure increase of 1.5 barg in the external loop,
which is the minimum outlet pressure for the gas compressor (Kold, 2010). The superficial gas
velocity was assumed to be 0.06, which is however larger than the range of the study by Kold
(2010), but this is a natural consequence of scale-up. The simulation gave the following results
Performance indicator Value
Oxygen transfer rate (kg O2/m3/h) 0.91
EEO2 (kg O2/kWh) 0.18
The technical feasibility for this system has been proven for pilot scale fermentations of A. oryzae
and X. campestris. To my knowledge it has not been proven for commercial fermentation of
filamentous fungi. The fitting of multiple rotating jet heads in a larger reactor might be associated
with technical difficulties. Furthermore, how other filamentous fungi are impacted by the pump and

58 Chapter 4
pressure drop in the rotating jet head is yet to be determined. The technical feasibility of the
technology is set to 6.
4.2.2.3 Pumped loop reactor with static mixers
This type of fermentor is a pumped loop type reactor with static mixers, which bears resemblance to
the airlift reactor with external loop. An example of this reactor type is shown in Figure 4.3. A
circulation pump is installed in the loop to ensure the flow through the static mixers. This reactor
type has been used for xanthan production with a high viscosity fermentation broth (Olivier and
Oosterhuis, 1988).
Figure 4.3. Pumped loop reactor with static mixers in the riser section. A mechanical pump is inserted in the loop for
the circulation of the fermentation broth. Gas is fed into the loop before the static mixers where the bubbles are
dispersed for a larger total interfacial area. Figure reprinted from Meesters et al (1996) with permission from Springer.
The performance of a pumped loop reactor with static mixers has been studied in a 4 m3 fermentor
with the experimental conditions shown in Table 4.6. The reactor had an inner tube diameter of 0.5
m and was equipped with Sulzer SMV mixers. In the mixers a swarm of bubbles and a large,
continuously renewed interfacial surface are formed (Streiff et al., 1997).
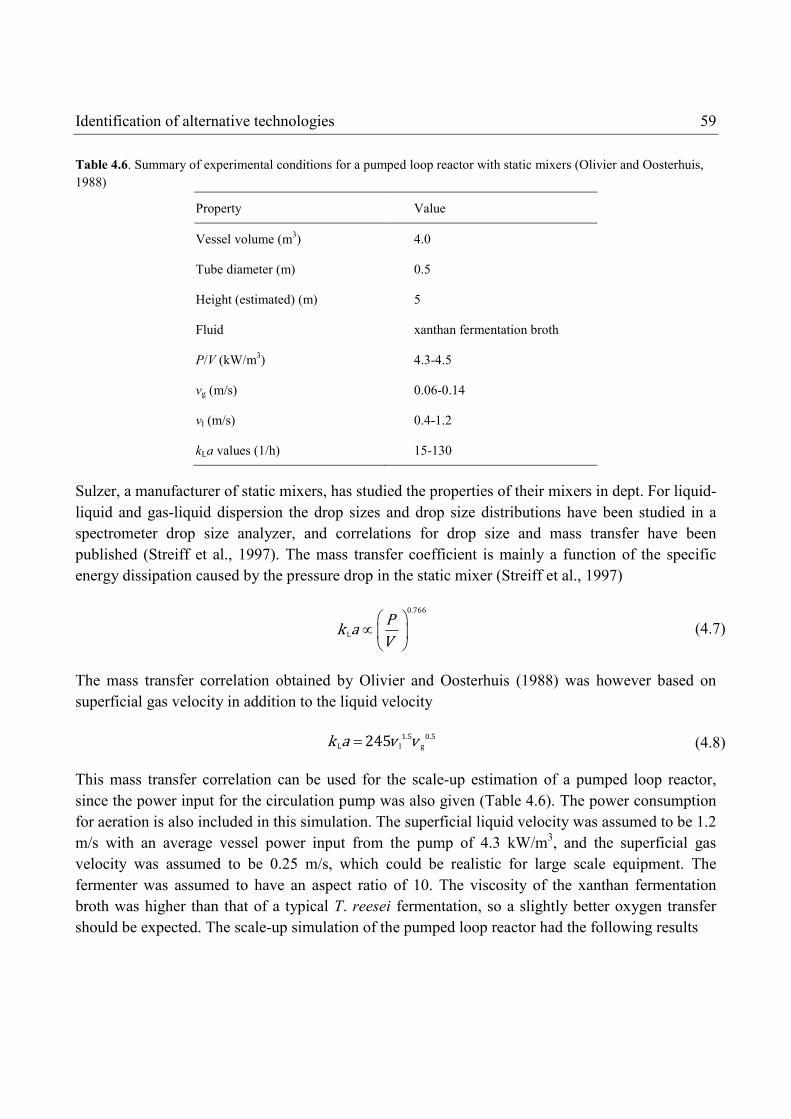
Identification of alternative technologies 59
Table 4.6. Summary of experimental conditions for a pumped loop reactor with static mixers (Olivier and Oosterhuis,
1988)
Property Value
Vessel volume (m3) 4.0
Tube diameter (m) 0.5
Height (estimated) (m) 5
Fluid xanthan fermentation broth
P/V (kW/m3) 4.3-4.5
vg (m/s) 0.06-0.14
vl (m/s) 0.4-1.2
kLa values (1/h) 15-130
Sulzer, a manufacturer of static mixers, has studied the properties of their mixers in dept. For liquid-
liquid and gas-liquid dispersion the drop sizes and drop size distributions have been studied in a
spectrometer drop size analyzer, and correlations for drop size and mass transfer have been
published (Streiff et al., 1997). The mass transfer coefficient is mainly a function of the specific
energy dissipation caused by the pressure drop in the static mixer (Streiff et al., 1997)
0.766L
Pk a V
∝ (4.7)
The mass transfer correlation obtained by Olivier and Oosterhuis (1988) was however based on
superficial gas velocity in addition to the liquid velocity
1.5 0.5L l g245k a v v= (4.8)
This mass transfer correlation can be used for the scale-up estimation of a pumped loop reactor,
since the power input for the circulation pump was also given (Table 4.6). The power consumption
for aeration is also included in this simulation. The superficial liquid velocity was assumed to be 1.2
m/s with an average vessel power input from the pump of 4.3 kW/m3, and the superficial gas
velocity was assumed to be 0.25 m/s, which could be realistic for large scale equipment. The
fermenter was assumed to have an aspect ratio of 10. The viscosity of the xanthan fermentation
broth was higher than that of a typical T. reesei fermentation, so a slightly better oxygen transfer
should be expected. The scale-up simulation of the pumped loop reactor had the following results

60 Chapter 4
Performance indicator Value
Oxygen transfer rate (kg O2/m3/h) 0.96
EEO2 (kg O2/kWh) 0.09
The OTR of this simulation is very similar to the maximum OTR of 0.94-1.27 kg/m3/h obtained by
Olivier and Oosterhuis (1988), but the EEO2 is about half of the range 0.21-0.30 kg O2/kWh
recorded in that study. This is most likely because the pump efficiency and power consumption of
the compressor is included in this work. Compared to a STR, the pumped loop reactor produced
considerably higher concentrations of xanthan at similar power inputs (Olivier and Oosterhuis,
1988). It could be hypothesized that mixing, not mass transfer, was limiting in those STR
experiments, which would not be unexpected for highly non-Newtonian fluids. That would also
explain why the pumped loop reactor performed better in that study.
The pumped loop fermentor has been used for fermentations of yeast and production of xanthan at
scales of at least 4 m3, so the technology seems feasible (Meesters et al., 1996; Olivier and
Oosterhuis, 1988). It is not known how different micro organisms are impacted by the technology,
and the static mixers could impose sanitary problems. The technical feasibility at industrial scale
was assessed at 7.
4.2.3 Power input by mechanically moved internal devices
The stirred tank reactor – certainly the most well-known example of this reactor category – became
the standard bioreactor in the last half of the twentieth century (Schügerl, 1985). However, a great
number of alternative reactors in this category have been developed. The energy consumption for
these reactors includes the mechanical power by the moving device, the energy consumption for the
compressor, and the energy for cooling.
4.2.3.1 Reactor with mechanical agitators
The STR falls into this category. The STR is naturally included in the comparison since the
experiments in Chapter 2 were carried out using this reactor type. It therefore might be regarded as
the reference technology. Recent developments of the STR include new impeller types with
improved gas handling capabilities (Albaek et al., 2008; Nienow, 1996). In our study of the fed-
batch A. oryzae fermentation, the kLa measurements of the RDT and the B2 impellers could not be
distinguished at equal power input (Albaek et al., 2011).
The mass transfer correlation of Eq. (2.30) is used. This correlation was determined over a wide
range of conditions and in fermentation medium but solely at pilot plant scale. Contradictory reports
on the effect of scale on the exponents a and b of the mass transfer correlation exist. It has been
claimed that both a and b decrease as function of fermentor size (Bartholomew, 1960), but it has

Identification of alternative technologies 61
also been shown that a single value of b described kLa data from 0.55 m3 to 80 m3 with for a wide
range of P/V (Pedersen, 1997).
A simulation using the process model and mass transfer correlation proposed in this work assuming
P/V = 3 and a superficial gas velocity of 0.08 m/s was carried out. The simulation gave the
following results at industrial scale
Performance indicator Value
Oxygen transfer rate (kg O2/m3/h) 1.33
EEO2 (kg O2/kWh) 0.13
The technical feasibility of the STR in large scale has been proven by many industrial
manufactures. The technical feasibility is 10.
4.2.3.2 Mechanically stirred loop reactor
This type of reactor is similar to the STR but has an internal coaxial cylinder (draft tube) in order to
create a defined circulation pattern of the fermentation broth. The introduction of the draft tube was
aimed at improving the performance of the STR by providing a more homogeneous reactant
distribution (Kura et al., 1993). No quantitative data on the influence of viscosity were given, but
experimental data obtained in water as well as small amounts of polyethylene oxide were described
by the same mass transfer correlation, because the high viscosity fluids required a higher specific
power input (n was kept constant). A summary of the relevant parameters for this reactor type is
shown in Table 4.7.
Table 4.7. Summary of experimental conditions and results for a mechanically stirred loop reactor (Kura et al., 1993)
Property Value
Vessel volume (m3) 0.050
Diameter (m) 0.35
Height (m) 0.60
Fluid 0-1000 ppm polyethylene oxide
P/V (kW/m3) 1.8-5.8
vg (m/s) 0.002-0.009
kLa values (1/h) 0.1-108
The mass transfer correlation found to best describe the experimental data was (Kura et al., 1993):

62 Chapter 4
0.5air 1.0L g
air/1.222 P V Pk a vP
+=
(4.9)
Since this study was carried out in a relatively small fermentor, the superficial gas velocities
investigated were low. In simulations using the process model this leads to very high levels of CO2
in the offgas. According to Eq. (4.9), kLa is proportional to the superficial gas velocity, and upon
scale-up of this technology, high values of kLa will be predicted (if pCO2 is to be held at an
acceptable level). The scale-up simulation of the stirred loop reactor had the following results
Performance indicator Value
Oxygen transfer rate (kg O2/m3/h) 0.62
EEO2 (kg O2/kWh) 0.20
There has been a PhD thesis on the subject of relatively thin columns (H/T from 5-15) within this
reactor category (Schügerl, 1991), but the data could not be retrieved for this technology. As this
technology is quite similar to the STR, its technical feasibility is quite likely although the
introduction of a draft tube makes the design for fed-batch operation more complicated. The
technical feasibility at industrial scale was assessed at 8.
4.2.3.3 Reactor agitated and aerated with gas-inducing impellers
The impeller shaft of this reactor type is hollow and air is induced through holes in the impeller
rather than introduced from a sparger located under the impeller. In some systems the stirrer
automatically draws in air from the space above the liquid (Zlokarnik, 1978), or the gas might be
provided through the shaft while liquid is sucked in through the impeller and the gas-liquid phase is
released in a radial direction together (Poncin et al., 2002). Many variations of this reactor type
exist, including internal draft tubes directing the fluid flow and aspect ratios up to 5 (Scargiali et al.,
2007). This reactor type does not require a gas compressor, and has been claimed to have given
higher kLa than other types of contactors at same unit power consumption in water (Chen et al.,
2003).
A mass transfer correlation, which is very similar the ones found for the STR, for the self-aspirating
impeller system has been suggested for a coalescence promoting media (pure water) (Zlokarnik,
1978)
0.84L 1.1 10 Pk a V−
= ⋅ (4.10)
In a study of self-aspirating impellers with neutralized fermentation broth of Aspergillus niger, it

Identification of alternative technologies 63
was found that an upper limit to the power input existed above which mass transfer was not
increased (Heim et al., 1995). This speed, above with no additional air was aspirated, was found to
be 7.39 1/s, which corresponded to 0.45 kW/m3. The apparent viscosity at this speed was 0.003 Pa.s
and kLa was 68 1/h, which was inferior to data for a conventional STR (Heim et al., 1995).
Mass transfer in this reactor was assumed to decrease with viscosity similarly to the STR since the
principal mixing mechanism is the same. The following results were obtained upon scale-up by the
process model
Performance indicator Value
Oxygen transfer rate (kg O2/m3/h) 0.18
EEO2 (kg O2/kWh) 0.29
The technical feasibility of the gas-inducing impeller is regarded as quite likely, since this
contacting device has been used for a variety of applications (Zlokarnik, 1978). The technical
feasibility at industrial scale was assessed at 8.
4.2.3.4 Horizontal loop reactor with gas-inducing impellers
This reactor type is also known as the Torus reactor and is made up of a horizontal, ring-shaped
tube as shown in Figure 4.4 (Gschwend et al., 1983). A gas-inducing propeller provides the
aeration and mixing of the medium, and the outlet gas is withdrawn through a foam destroyer. To
my knowledge, no large scale versions of this reactor type exist despite the claims of superior
performance for xanthan production (Krebser et al., 1988). A summary of the operating conditions
used to obtain mass transfer data for this reactor is given in Table 4.8.
Figure 4.4. Example of a Torus reactor. Figure adopted from Adler and Fiechter (1988) with permission from Springer.
Gas in

64 Chapter 4
Table 4.8. Summary of experimental conditions and results for the Torus reactor (Krebser et al., 1988)
Property Value
Vessel volume (m3) 0.115
Operating volume (m3) 0.075
Inner diameter (m) 0.50
Outer diameter (m) 1.0
Tube diameter (m) 0.25
Fluid 0-3 % (w/v) xanthan
P/V (kW/m3) 3.5
Aeration rate (m3/s) 0.00125
kLa values (1/h) 25-350
Since the power input was constant in the study, it is not possible to estimate the mass transfer as a
function of P/V. However, at P/V = 3.5 kW/m3 the influence of increasing viscosity is correlated
with mass transfer in the following way
0.34L app34.72k a µ −= (4.11)
The following results were obtained upon scale-up with the process model (the untraditional design
was simulated in a cylindrical tank with aspect ratio of 0.16):
Performance indicator Value
Oxygen transfer rate (kg O2/m3/h) 0.47
EEO2 (kg O2/kWh) 0.11
The feasibility of the Torus reactor has not, to my knowledge, been proven on large scale. The
design would probably require additional optimization, but mechanically it should be possible to
construct and operate the reactor at a larger scale. The technical feasibility at industrial scale was
assessed at 5.
4.2.3.5 Cascade reactor with rotary agitators
These reactors are slender columns separated into stages by perforated plates. The reactor is
typically aerated in the bottom, while each stage is equipped with one or multiple agitators for
mixing and gas dispersion (Schügerl, 1991). The following characteristics were found in a study of
the a 9 stage reactor with a single flat bladed agitator per stage, unfortunately using a water-gas
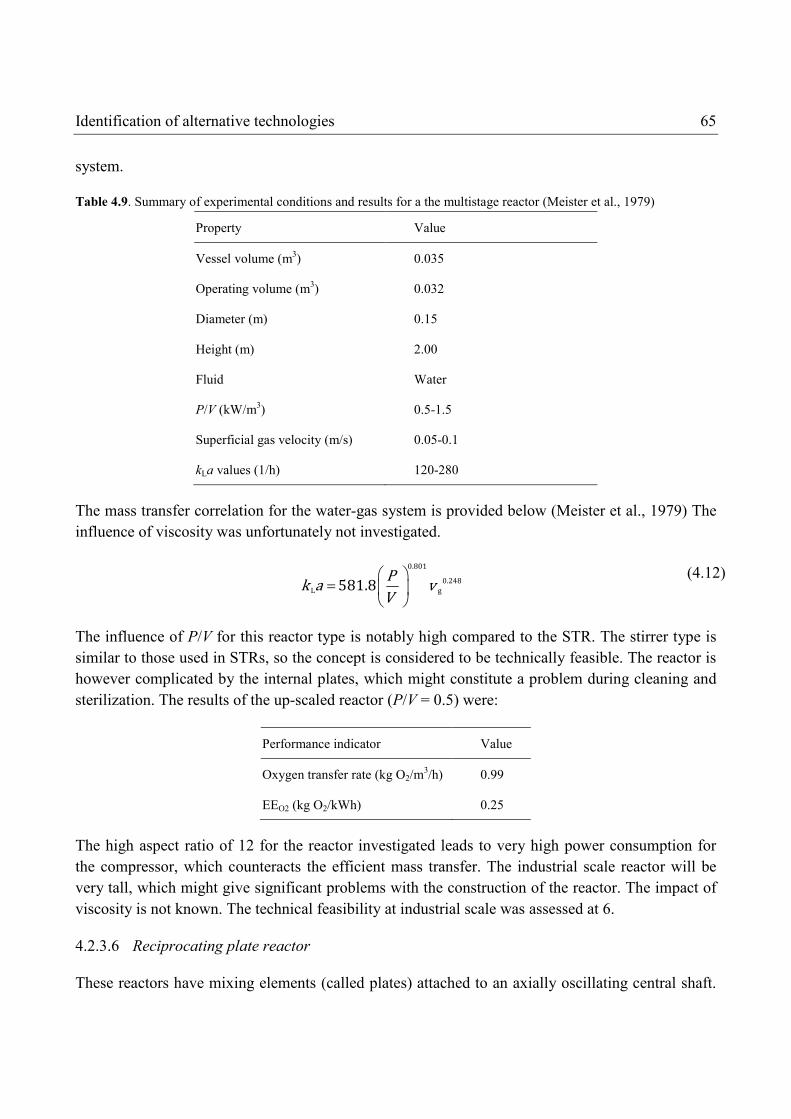
Identification of alternative technologies 65
system.
Table 4.9. Summary of experimental conditions and results for a the multistage reactor (Meister et al., 1979)
Property Value
Vessel volume (m3) 0.035
Operating volume (m3) 0.032
Diameter (m) 0.15
Height (m) 2.00
Fluid Water
P/V (kW/m3) 0.5-1.5
Superficial gas velocity (m/s) 0.05-0.1
kLa values (1/h) 120-280
The mass transfer correlation for the water-gas system is provided below (Meister et al., 1979) The
influence of viscosity was unfortunately not investigated.
0.8010.248L g581.8 Pk a vV
=
(4.12)
The influence of P/V for this reactor type is notably high compared to the STR. The stirrer type is
similar to those used in STRs, so the concept is considered to be technically feasible. The reactor is
however complicated by the internal plates, which might constitute a problem during cleaning and
sterilization. The results of the up-scaled reactor (P/V = 0.5) were:
Performance indicator Value
Oxygen transfer rate (kg O2/m3/h) 0.99
EEO2 (kg O2/kWh) 0.25
The high aspect ratio of 12 for the reactor investigated leads to very high power consumption for
the compressor, which counteracts the efficient mass transfer. The industrial scale reactor will be
very tall, which might give significant problems with the construction of the reactor. The impact of
viscosity is not known. The technical feasibility at industrial scale was assessed at 6.
4.2.3.6 Reciprocating plate reactor
These reactors have mixing elements (called plates) attached to an axially oscillating central shaft.

66 Chapter 4
The element oscillates up and down by a crank-driven motor (Schügerl, 1991). The plates are
perforated and liquid is forced through the holes as jets, which creates complex vortex movements
ensuring the mixing. Air is fed at the base of the reactor, while the power consumption can be
measured from a force transducer on the shaft. The reciprocating plate reactor has been investigated
as the production vessel for microbial polysaccharides, where oxygen mass transfer is also crucial
(Audet et al., 1996). The operation conditions of that study are shown in Table 4.10. Experiments
were carried out in water and in aqueous solutions containing various concentrations of dextran, a
complex branched glucan.
Table 4.10. Summary of experimental conditions for a reciprocating plate reactor (Audet et al., 1996)
Property Value
Vessel volume (m3) 0.014
Operating volume (m3) 0.012
Diameter (m) 0.206
Height (m) 0.430
Fluid 0- 100 g/L dextran solution
P/V (kW/m3) 0.7-5
Superficial gas velocity (m/s) 0.015-0.105
The mass transfer correlation for a 20 g/L non-Newtonian dextran solution is given here. The
authors were not able to describe the mass transfer as a function of the apparent viscosity or the
measured rheological parameters (Audet et al., 1996)
1.2 0.20.8 0.3L g4617 Pk a vV
±
± =
(4.13)
Remarkably, for P/V > 0.7 kW/m3, kLa increases more than proportionally to the power input, a
result not unusual for this type of reactor (Lounes et al., 1995). For the process simulation no effect
of viscosity increase during fermentation was considered, but the mass transfer correlation of the
non-Newtonian dextran solutions was used independently of fermentation time. The simulation
results for P/V = 1 are given below

Identification of alternative technologies 67
Performance indicator Value
Oxygen transfer rate (kg O2/m3/h) 1.84
EEO2 (kg O2/kWh) 0.41
The technical feasibility for this reactor type is questionable. The reactor is complicated by the
upwards and downwards movement of the shaft. This requires sophisticated sealing technology if
aseptic production is to be maintained. Cleaning of the internal parts of the reactor might also
impose severe problems. The technical feasibility at industrial scale was assessed at 2.
4.2.3.7 Pulsed baffled reactor
This reactor is constructed as a slender column with horizontal baffles on the reactor wall with air
being sparged in the bottom through a ring sparger. The column base is connected to a piston,
which oscillates the system with amplitudes from 1-14 mm and frequencies from 1 to 12 Hz (Ni et
al., 1995a; Ni et al., 1995b). The oscillations are intended to increase gas hold-up and thereby
increase oxygen mass transfer. Different baffle geometries were tested in yeast culture medium and
the best results are reported here.
Table 4.11. Summary of experimental conditions for a pulsed baffled reactor with mixed central and wall baffles (Ni et
al., 1995b)
Property Value
Vessel volume (m3) 0.001
Operating volume (m3) 0.0008
Diameter (m) 0.050
Height (m) 0.50
Fluid resuspension of yeast
P/V (kW/m3) 0-10
Superficial gas velocity (m/s) 0.0017-0.0068
kLa values (1/h) 50-250
The mass transfer correlation for the geometry with central baffles and wall baffles mixed together
is given here. The influence of viscosity on mass transfer was not investigated.
0.3530.92L g17500 Pk a vV
=
(4.14)

68 Chapter 4
The experiments with this reactor type were performed in relatively small scale and thus at very low
superficial gas velocities. The impact of superficial gas velocity therefore might be overpredicted
when applied in a scale-up of the process. The simulation results for P/V = 1 and superficial gas
velocity of 0.016 m/s are given below
Performance indicator Value
Oxygen transfer rate (kg O2/m3/h) 0.81
EEO2 (kg O2/kWh) 0.38
The technical feasibility for this reactor type is highly questionable. The movement of the system
might be feasible for a laboratory reactor, but if the amplitude of the movement is also subject to
scale-up, a very complicated mechanical design is required. The technical feasibility at industrial
scale was assessed at 1.
4.2.3.8 Other reactor types with mechanical energy input
A number of different surface aerators are used – allegedly exclusively - in biological effluent
treatment (Schügerl, 1991). These technologies are used in relatively slow systems and have their
advantages at power inputs over the range P/V = 0.01-0.2 kW/m3 (Schügerl, 1991). Usually such
technologies cannot be operated under aseptic conditions and therefore they were not included in
this screening. Also horizontal reactors with internal paddle wheels have been developed especially
for aeration of inhomogeneous fluids and waste water treatment applications (Zlokarnik, 1975), for
example the rotating biological contactors. Horizontal reactors with paddle wheels now seem to
have found use in cultivation of microalgae (Grima et al., 2009), but other commercial utilization of
this reactor type related to fermentation is not described in the open literature to my knowledge.
Therefore this technology was not investigated further in this screening.
4.2.4 Solid state fermentation
Solid-state fermentation (SSF) involves the growth of microorganisms on moist solid particles
where the spaces between the particles contain a continuous gas phase and a minimum of visible
water (Mitchell et al., 2006). Traditionally SSF has been used in the production of fermented foods
and in the composting process. In the food industry in Asia SSF is the state-of-the-art technology,
and enzymes and metabolites are produced on a large scale by processes with a very long history
(Hölker and Lenz, 2005).
The comparison of SSF and submerged fermentation is difficult due to the large density difference.
It has been generally claimed that enzyme titers are higher for SSF than for submerged fermentation
when comparing the same strain and fermentation broth (Viniegra-González et al., 2003). However,
no established scale or method to compare product yields in SSF and submerged fermentation in

Identification of alternative technologies 69
true terms exist (Pandey, 2003), and the definition of “productivity” is often very different from
study to study (Hölker et al., 2004).The volumetric productivity of submerged fermentation may be
measured in activity per liter, while compared with the volumetric productivity of SSF in activity
per g (Tengerdy, 1996). As is often the case, there might be a trend for researchers to have a biased
view on SSF.
SSF is said to simulate the natural environment of filamentous fungi and should therefore be a
better choice for cultivation because evolution of higher fungi took place on solid growth substrates
(Hölker et al., 2004). On the other hand, since research with submerged fermentation accelerated in
the 1940s because of the necessity to produce antibiotics on a large scale (Hölker and Lenz, 2005),
very efficient microbial strains well adapted to submerged fermentation have been developed
(amongst other ways) by genetic engineering (Hölker et al., 2004). When considering the SSF as an
alternative to submerged fermentation it should be noted that submerged fermentation is often an
“easier” system to work with (Mitchell et al., 2006). The handling of liquid substrates instead of
moving solids and the better possibility for applying measurement and control are among the
advantages of submerged fermentation systems.
In this work, SSF has not been included in the technology comparison. The reference process
utilized a strain of T. reesei which has clearly been optimized and selected for high enzyme
expression in submerged fermentation systems. To objectively compare SSF and submerged
fermentations, the technologies should be equally developed. It is possible that further development
within large scale operations of SSF will lead to commercial production of industrial enzymes
including cellulases (Mitchell et al., 2006). A separate project might be needed to follow up looking
specifically at the potential application of SSF.
4.3 Results and discussion
The results of applying the mass transfer relationships to the process model are summarized for all
technologies in Figure 4.5. The key performance indicator EEO2 is shown as function of the oxygen
transfer rate, since the oxygen transfer rate is a measure of the required fermentor volume. The size
of the bubbles in Figure 4.5 refers to the judgment of the technical feasibility of fermentation using
the technology in industrial scale.

70
Figure 4.5. Technology screening using the
technologies is shown as function of oxygen t
technology at industrial scale. The highest EE
high oxygen transfer rate but has an unlikely feasibilit
EEO2 and have been proven to be feasible
The highest energy efficiency was predicted for the reciprocating plate reactor, which also had a
high oxygen transfer rate. However, the mechanical challenges of this technology are overwhelming
and the technology is not considere
was predicted to have almost the same energy efficiency.
The pressure cycle reactor has the highest oxygen transfer rate, since
pressure. The pressure cycle even had
obtained in low viscosity fermentation broth, the viscosity of filamentous fermentation
expected to lower this number significantly.
The traditional stirred tank reactor is capable of delivering a high oxygen transfer rate, but not at
higher EEO2. It was decided to investigate airlift reactors
EEO2 and have been employed for a range of large scale operation
oxygen transfer rate of airlift reactors is inferior to some other technologies but it is acceptably
high.
1
2
31
2
3
1
2
3
4
5
7
0.00
0.05
0.10
0.15
0.20
0.25
0.30
0.35
0.40
0.45
0.50
0 0.5 1 1.5
EE
O2
(kg
O2/k
Wh
)
Oxygen transfer rate (kg O
. Technology screening using the T. reesei fed-batch fermentation process model. The EE
shown as function of oxygen transfer rate, while the bubble size refers to the technical feasibility of the
industrial scale. The highest EEO2 is predicted for the reciprocating plate reactor, which also provide
an unlikely feasibility at industrial scale. Airlift reactors are predicted to have high
and have been proven to be feasible at very large scale.
The highest energy efficiency was predicted for the reciprocating plate reactor, which also had a
wever, the mechanical challenges of this technology are overwhelming
and the technology is not considered an alternative in large scale, especially since the airlift reactor
was predicted to have almost the same energy efficiency.
the highest oxygen transfer rate, since it is operated with headspace
pressure. The pressure cycle even had an EEO2 of 0.28, but since the mass transfer data was
obtained in low viscosity fermentation broth, the viscosity of filamentous fermentation
lower this number significantly.
The traditional stirred tank reactor is capable of delivering a high oxygen transfer rate, but not at
It was decided to investigate airlift reactors further, since they have the second
and have been employed for a range of large scale operations of fermentation processes.
oxygen transfer rate of airlift reactors is inferior to some other technologies but it is acceptably
2.1
6
2 2.5 3
Oxygen transfer rate (kg O2/m3/h)
1. Bubble column
2. Airlift reactor with internal loop
2.1 Airlift reactor with internal loop
3. Airlift reactor with external loop
1. Plunging jet reactor
2. Rotating jet head
3. Pumped loop reactor with static mixers
1. Mechanically stirred reactors
2. Mechanically stirred loop reactor
3. Reactor agitated and aerated with gas
4. Horizontal loop reactor with gas
5. Cascade reactor with rotary agitators
6. Reciprocating plate reactor
7. Pulsed baffled reactor
Bubble sizes indicate technical feasibility for fermentation
of T. reesei at industrial scale
Chapter 4
batch fermentation process model. The EEO2 of the
ransfer rate, while the bubble size refers to the technical feasibility of the
reciprocating plate reactor, which also provides a
industrial scale. Airlift reactors are predicted to have high
The highest energy efficiency was predicted for the reciprocating plate reactor, which also had a
wever, the mechanical challenges of this technology are overwhelming
d an alternative in large scale, especially since the airlift reactor
operated with headspace
of 0.28, but since the mass transfer data was
obtained in low viscosity fermentation broth, the viscosity of filamentous fermentation broth is
The traditional stirred tank reactor is capable of delivering a high oxygen transfer rate, but not at the
, since they have the second highest
of fermentation processes. The
oxygen transfer rate of airlift reactors is inferior to some other technologies but it is acceptably
2. Airlift reactor with internal loop
2.1 Airlift reactor with internal loop - pressure cycle
3. Airlift reactor with external loop - static mixers
3. Pumped loop reactor with static mixers
1. Mechanically stirred reactors
2. Mechanically stirred loop reactor
3. Reactor agitated and aerated with gas-inducing impellers
4. Horizontal loop reactor with gas-inducing impellers
5. Cascade reactor with rotary agitators
6. Reciprocating plate reactor
technical feasibility for fermentation

Identification of alternative technologies 71
An overview of the assessments of the technical feasibility of the technologies resulting from this
screening is given in Table 4.12. The assessments are not definitive, and some technologies that are
regarded questionable might already have proven their usefulness for industrial application. This
does not however change the estimation of energy efficiency and oxygen transfer rates, which are
the essential parameters applied here for comparison.
The screening procedure chosen here was seen as the most objective way to compare the fermentor
technologies (Hatch, 1975). Mixing was not considered yet, as the oxygen transfer is assumed to be
the limiting rate. A completely different approach for screening the reactor technologies would have
been to evaluate the mixing capabilities of each reactor first and subsequently estimate the power
consumption required for achieving sufficient mixing. The disadvantages of this approach however
include that little information on the large scale mixing capabilities has been published for a number
of these technologies. Furthermore, the impact of the (imperfect) mixing in the process and micro
organism is not fully understood, and therefore this process is currently run with oxygen transfer as
the limiting rate.
Table 4.12. Assessment of the technical feasibility for all technologies of the screening.
Technology Technical feasibility at industrial scale
Bubble columns 10
Airlift reactors with internal loop 9
Airlift reactors with internal loop – pressure cycle reactor 5
Airlift reactors with external loop – static mixers 5
Plunging jet reactor 6
Rotating jet head 6
Pumped loop reactor with static mixers 7
Mechanically stirred reactors 10
Mechanically stirred loop reactors 8
Reactors agitated and aerated with gas-inducing impellers 8
Horizontal loop reactor with gas-inducing impellers 5
Cascade reactors with rotary agitators 6
Reciprocating plate reactors 2
Pulsed baffled reactor 1
.


Chapter 5
Airlift reactor experiments
Nine fermentations have been carried out using airlift technology. The objective of the airlift reactor
experiments was to obtain data from this technology at pilot scale, to evaluate the feasibility of
fermentations of T. reesei in airlift reactors, and revise the process model for the airlift reactor if
needed. Specifically, the mass transfer and mixing characteristics were investigated and compared
with available knowledge. The data collected from these experiments are used to increase the
reliability of the model based scale-up of airlift reactors in Chapter 6.
5.1 Airlift reactor design
5.1.1 Reactor type and shape
Airlift reactors are pneumatically agitated gas-liquid or gas-liquid-solid contacting devices that are
characterized by fluid circulation in a defined cyclic pattern through channels built specifically for
this purpose (Merchuk and Gluz, 2002). The liquid pool is divided into two distinct zones, where
only one of them is usually sparged by the gas (Chisti and Moo-Young, 1987). The different
degrees of gas holdup in the gassed (riser) and ungassed (downcomer) zones result in a density
difference which causes the circulation of the fluid by a gas-lift action. Airlift reactors can be
divided into two main types of reactors based on their structure (see Figure 5.1): 1) Internal loop (or
baffled) vessels in which strategically placed internal devices create the channels needed for
circulation, and 2) external-loop reactors which have separate and distinct circuits for circulation.
The simplest airlift reactor geometry is arguably the internal-loop split cylinder. External loops
increase the risk of infections and the amount of material needed for construction. It was therefore
decided to investigate the split cylinder internal loop airlift reactor due to the flexibility of the
design: 1) the baffle system is more flexible than a tube because different geometries can easier be
obtained, and 2) rectangular vessels are much harder to construct in a design that can be
pressurized.

74 Chapter 5
Figure 5.1. Different types of airlift reactors. Left: Internal loop split airlift reactor. Middle: Internal loop concentric
tube reactor. Right: External loop airlift reactor. Figure adapted from (Merchuk and Gluz, 2002) with permission from
Wiley.
5.1.2 Baffle position
The effect of the downflow/upflow area ratio on the airlift reactor performance has previously been
investigated by use of a mathematical model (Hatch, 1975). The studied airlift geometry was an
airlift reactor with an inner draft tube. The performance ratio achieved a maximum value at an area
ratio of approximately 0.8. However the difference between the performance ratio at area ratios 0.8
and 1.0 was ~3% (Figure 5.2). The simplest baffle construction was achieved by placing the baffle
in the middle of the vessel.

Airlift reactor experiments 75
Figure 5.2. Computer simulated dependency of the performance ratio (~oxygen transfer efficiency (lb O2/hp-hr)) and
oxygen transfer rate on the downflow/upflow area ratio. Figure from (Hatch, 1975).
5.1.3 Reactor hydrodynamics and flow configurations
The gas introduced in the bottom of the airlift reactor is the main variable of the system (Chisti and
Moo-Young, 1987). The hydrodynamics of the multiphase flow of the airlift reactor have
controlling influence on its mixing, mass transfer, and heat transfer characteristics. The gas and
liquid velocities of the reactor as well as the gas holdup in the riser and downcomer are determined
by the gas flow (Merchuk and Gluz, 2002). The viscosity is also a variable, but in case of non-
Newtonian fluids the viscosity is a function of the liquid velocity and it furthermore changes with
time of the fermentation due to biomass growth.
Several different gas-liquid flow regimes may be observed based on the gas flow (Brauner and
Barnea, 1986). In the riser, the gas velocity is usually higher than that of the liquid. At low gas
flows small gas bubbles rise almost straight up the riser section with little interaction amongst them.
The free rising velocity of the gas bubbles is here negligible with respect to the liquid velocity
(Merchuk and Gluz, 2002). The turbulence is low and this regime is known as the homogenous (or
bubbly) flow regime. As the gas flow is increased the bubble density gradually increases which
leads to bubble interactions, increased bubble collision frequency, and greater turbulence in a
transitional regime known as coalesced bubble flow (Chisti and Moo-Young, 1987). A further
increase in the gas flow eventually leads to a fully developed churn turbulent regime in which larger
bubbles occur frequently along with many small bubbles. The shape of the bubbles fluctuates quite
randomly due to the very high turbulence fields (Chisti and Moo-Young, 1987). The fully
developed slug flow obtained at even higher gas flow rates is characterized by spherical caps or
bullet nosed bubbles with dimensions that may attain those of the riser. The large bubbles may
bridge the entire riser cross section and offer very poor mass transfer, and this regime is important
only as a situation to be avoided at all costs (Merchuk and Gluz, 2002). The transition from churn
turbulent to slug flow depends, in addition to the gas flow, on the properties of the liquid and on the

76 Chapter 5
geometry of the reactor (Chisti and Moo-Young, 1987). Highly viscous fluids and mycelial media
are known to promote spherical cap bubbles, and slug flow occurs earlier in small diameter tubes
than in vessels of larger size (Chisti and Moo-Young, 1987). Flow regime maps that are aimed at
simplifying the identification of the flow regime of bubble columns do exist, but the transition
regions are not clearly or easily defined (Merchuk and Gluz, 2002). In airlift reactors quite high
linear liquid velocities may be generated which shift the incipient slugging of airlift reactors to
higher gas velocities than is usually seen in bubble columns (Chisti and Moo-Young, 1987).
5.1.4 Pilot scale airlift reactors
Based on the previous fermentations of T. reesei in STRs it was assumed that the viscosity of the
fermentation broth would reach 0.02-0.04 Pa.s (thus 20-40 times that of water) in airlift reactor
fermentations. In order to avoid slug flow, the above considerations of the hydrodynamics of airlift
reactors suggest that as large a vessel diameter as possible should be exploited. Two airlift reactor
configurations (ALR1 and ALR2) were tested, see Figure 5.3. Both configurations were split
cylinder airlift reactors with a total diameter of 0.688 m. The split baffle bottom clearance was 0.20
m. Air was supplied using a perforated pipe sparger (number of holes = 44, hole diameter = 0.0045
m) in the riser section in either downwards (against the direction of the liquid flow) or upwards (in
the direction of the liquid flow) direction. The specifications of the reactors are provided in Table
5.1. It was not possible to perform experiments using other scales of operation.
Table 5.1. Airlift reactor configurations tested
Baffle height (m) Baffle clearance(m) Baffle perforated Sparger direction Aspect ratioa
ALR1 0.80 0.20 Yes Down 1.0
ALR2 0.80 0.20 No Up 1.7 aUnaerated aspect ratio at the beginning of the fermentations

Airlift reactor experiments 77
Figure 5.3. Airlift reactor configurations tested. A: Front view of ALR1: Perforated split baffle. The initial, unaerated
aspect ratio was 1.0. The sparger was in the downwards direction B: Front view of ALR2: Split baffle. The initial,
unaerated aspect ratio was 1.7. The sparger was in the upwards direction. C: Side view of ALR2.
5.2 Materials and methods
In order to compare as objectively as possibly with the STR experiments, all methods employed
earlier were unchanged. The strain and growth conditions were the same as described in Chapter 2,
as were the enzyme assay and the measurements of rheology, biomass, and kLa.
Experimental design and fermentation conditions
Two process variables were varied: Headspace pressure and superficial gas velocity. For airlift
reactors the superficial gas velocity must be based on the riser cross section to have a real meaning.
Unless otherwise stated, the superficial gas velocity of airlift reactors is considered based on riser
cross section. Importantly, the axial variation in volumetric flow of gas due to changes in
hydrostatic pressure must be considered. The headspace pressure must therefore be considered, and
the mean superficial gas velocity is given by (Chisti and Moo-Young, 1987):
M pg,r r ogln 1g
Q RT Zv A Z pρ
ρ
= + (5.1)
From Eq. (5.1) it can be seen that the superficial gas velocity, and thus the turbulence intensity and
parameters depending on it (e.g. mixing, mass transfer, and gas hold-up), declines with increasing
1.20
1.20
H = 0.68
0.80
0.20

78 Chapter 5
reactor headspace pressure, even with constant molar gas flow into a reactor.
The extreme ends of the experimental design were determined by the equipment. It was discovered
that a minimum aeration rate of 400 NL/min was needed for establishing a circulating flow during
the batch phase of ARL1 fermentations. The maximal obtainable aeration rate was 1180 NL/min.
The objective of the experimental design was to explore the experimental space in such a way to
determine possible correlations between the varied process variables and the performance of the
fermentations. The summary of the experimental design is shown in Table 5.2.
Table 5.2. Experimental design for airlift reactor fermentations
Fermentation nr Headspace pressure (barg) Aeration rate (NL/min) vg,r (m/s)
ALR1.1 0.10 635 0.05
ALR1.2 1.10 1180 0.05
ALR1.3 0.10 400 0.03
ALR1.4 0.10 505 0.04
ALR1.5 1.10 708 0.03
ALR1.6 0.60 545 0.03
Fermentation nr Headspace pressure (barg) Aeration rate (NL/min) vg,r (m/s)
ALR2.1 1.10 475 0.02
ALR2.2 0.75 1180 0.06
ALR2.3 0.10 505 0.04
The fermentation conditions and fed-batch strategy were identical to the STR experiments (of
course without agitation as a process variable). The operation mode of the fermentation process was
as follows:
-All fermentations were started with identical batch phases, during which the substrate
concentration decreased from a high initial value to its operational range. The aeration rate was 400
NL/min and the headspace pressure was 0.1 barg.
-The batch phase was followed by a DOT controlled fed-batch phase with process variables as
described above and with the carbon substrate feed flow rate as the controlled variable.
Yield coefficients and carbon balance
The yield coefficients were determined as average values for all three fermentations. The carbon
substrate in the batch medium was included in the calculation of YSC. For low growth rates the

Airlift reactor experiments 79
composition of T. reesei cell mass can be set to CH1.80N0.116O0.710 (Ross et al., 1983). For the
elemental composition of the enzyme complex the distribution of the four major cellulases secreted
by the strain RutC30 was assumed to represent all the protein since they represent 85% of all
components (Tolan and Foody, 1999). The amino acid sequence of each enzyme was found on the
publicly available protein knowledge base UniProt (www.uniprot.org) and analyzed using the
software GPMAW (Peri et al., 2001). The composition including glycosylation was calculated by
use of high-mannose glycans (Hui et al., 2001; Hui et al., 2002).
Table 5.3. Distribution, composition, and glycosylation of the four major components of the T. reesei cellulase
complex.
Enzyme Distribution (%) Composition Glycosylation (%) Composition glycosylated
Cel7A 50a CH1.50N0.28O0.34S0.01 9.7b CH1.54N0.25O0.40S0.01
Cel6A 20a CH1.52N0.27O0.31S0.01 20.9c CH1.60N0.23O0.43S0.01
Cel7B 10a CH1.52N0.28O0.35S0.02 14.8c CH1.58N0.24O0.42S0.01
Cel5A 5a CH1.52N0.28O0.32S0.01 14.3c CH1.58N0.24O0.40S0.01
Weighted average CH1.56N0.25O0.41S0.01
a(Tolan and Foody, 1999), b(Hui et al., 2001), c(Hui et al., 2002)
Mixing time measurements
Mixing time was measured using the conductivity method using a Conducell 4 USF ARC 425 probe
(Hamilton, Bonatuz, Switzerland). Data from the conductivity probe were collected once per
second. Three different media were used: Water, 0.125% (w/v) xanthan gum, and 0.25% (w/v)
xanthan gum (Rhodopol, Rhodia, Albertville, France). All media furthermore contained 0.43%
(w/v) sodium benzoate and 0.21% (w/v) KH2PO4. The salt pulse used was 400 mL of 0.25% (v/v)
NaCl. The salt tracer pulse was injected within 10 s and the addition time was included in the
mixing time. The addition of the salt tracer occurred on top of the fermentation broth. Average
numbers and standard deviations of three mixing time determinations are used.
Airlift reactor shear rate estimations
In the context of correlating hydrodynamic parameters in non-Newtonian fluids, many
investigations of bubble columns have assumed that the average (effective) shear rate is
proportional to the superficial gas velocity:
eff s gC vγ =ɺ (5.2)
As shear originates from the relative velocity between the bubble and the liquid, it is argued that γ 5eff
increases with gas holdup (γ5eff ~ εg) and with the mean bubble rise velocity (γ 5eff ~ vg/εg) which in

80 Chapter 5
combination yield Eq. (5.2). The approach has been questioned from a rheological point of view
because it predicts the same shear rate for a certain superficial gas velocity no matter which fluid is
used (Merchuk and Gluz, 2002). A number of different proportionality constants for Eq. (5.2) have
been suggested as shown in the literature, and as the disparity among the constants is large. It is
generally agreed that the correct solution is still to be found (Chisti, 1989; Merchuk and Gluz,
2002).
For airlift reactors a common approach also involves assuming that an average shear rate in the
airlift reactor exists, even though the area is surrounded with considerable debate (Allen and
Robinson, 1991; Chisti and Moo-Young, 1989; Nishikawa, 1991). It has been assumed that the
active (predominant) zone for oxygen mass transfer, gas holdup and gas/liquid interfacial area is in
the riser section of the reactor (Allen and Robinson, 1989; Popovic and Robinson, 1989). Therefore
is seems reasonable that the relevant effective viscosity is that of the riser section of the reactor and
the effective shear rate is deduced from the conditions of the riser (Allen and Robinson, 1991)
eff s g,rC vγ =ɺ (5.3)
In this work, a value of Cs = 2800 is assumed (Schumpe and Deckwer, 1987). In Appendix A other
constants have been compared.
Mass transfer correlations for airlift reactors
Two different mass transfer correlations were investigated in which the riser zone superficial gas
velocity was related to the mass transfer coefficient kLa. The apparent viscosity was included in one
of them by analogue to the empirical mass transfer correlation of Chapter 2
L g,rak a Cv= (5.4)
L g,r appa bk a Cv µ= (5.5)
5.3 Results and discussion
5.3.1 Fermentations
The airlift fermentations were somewhat difficult to execute compared with the STR fermentations.
The primary reason for this is that the medium and the fermentation procedure has been optimized
for the STR and transferred directly to the ALR. The six fermentations carried out with the ALR1
configuration suffered from biomass growth on the DOT electrodes, which made DOT controlled
carbon feeding impossible. As a consequence of that growth, about halfway through the fed-batch
phase the signals from the DOT electrodes were at 0% and the carbon feeding was conservatively
set manually based on the historical feed rate observed at each set of fermentation conditions. An

Airlift reactor experiments 81
example of the ALR1 fermentations is shown in Figure 5.4 The decision to continue feeding the
fermentations carbon substrate even though the DOT apparently was 0% was based on the fact that
OUR and CER were not behaving unexpectedly and RQ was unaffected (around ~1.05). In the
ALR2 configuration, equipment was installed for steaming (or more precisely blowing steam
condensate on) the DOT electrodes. When the DOT signal in the ALR2 started to drop due to
fouling of the electrode, the steam successfully removed the beginning fouling and the correct
signal was restored.
Figure 5.4. Fermentation profile of ALR1.4. From the top left: The weight of the fermentation is seen to decrease due
to evaporation. This was similar to the other fermentations with 0.1 barg headspace pressure. The aeration rate was
controlled at the set point throughout the fermentation (505 NL/min). The headspace pressure was controlled well at the
set point (0.1 barg) except for the final part. The reason for the increase up to 0.2 barg is not known. Temperature was
controlled well throughout the fermentation. The biomass concentration increased steadily except for the last two
measurement points. The specific growth rate was always below 0.02 1/h, except for the last measurements. The
product concentration increased steadily during the fermentation. The DOT is seen to follow the set point nicely until
the suspected fouling of the DOT electrode occurs around halfway through the fermentation. The feed flow rate was the
control variable of the DOT and when the DOT signal dropped, manual control of the feed flow rate was needed for the
remainder of the fermentation. The apparent viscosity was calculated based on (Schumpe and Deckwer, 1987) with γ 5eff
= 112 1/s and remained in the interval 0.002-0.011 Pa.s. OUR followed the feed flow rate as expected. The drop in
OUR at the moment that the suspected fouling of the DOT electrode occurred indicated that the feed could be increased.
The measured kLa was in the interval 33-64 1/h and did not decrease significantly towards the end of the fermentation.
Another example of a challenge encountered was the suspension of the denser particles of the
fermentation medium. Some insoluble particles were apparently not well suspended in the reactor
which led to some sampling difficulties since the particles would gather at the sampling port which
0
100
200
300
400
500
600Weight (kg)
Time0
200
400
600
800
1000Aeration rate (NL/min)
Time0
0.2
0.4
0.6
0.8
1
1.2Head space pressure (barg)
Time-1
+1Temperature (°C)
Time
0
0.2
0.4
0.6
0.8
1Biomass concentration
Time0
0.02
0.04
0.06
0.08
0.1Specific growth rate (1/h)
Time0
0.2
0.4
0.6
0.8
1Product concentration
Time0
20
40
60
80
100DOT (%)
Time
0
0.2
0.4
0.6
0.8
1Feed flow rate
Time0
0.02
0.04
Apparent viscosity (Pa.s)
Time0
1
2
3
4
5OUR (mol/h)
Time0
100
200
300
400
500
Mass transfer coefficient, kLa (1/h)
Time
Suspected fouling
Manual control

82 Chapter 5
was located in the bottom of the reactor. This is also a minor problem that could be overcome in
time by medium optimization and by gaining more experience with ALR operation.
The ALR2 fermentations were performed in accordance with the described fermentation conditions
and control methods even though ALR2.1 and ALR2.2 were terminated earlier than planned this
time due to fouling of the pH electrodes. Anti-foam oil was preventively added periodically to all
fermentations, and in none of the fermentations foaming was observed. The non-foaming property
of this strain of T. reesei allowed operation with liquid heights quite close to the total vessel height.
5.3.2 Yield coefficients and carbon balance
The absolute values of the yield coefficients are confidential and are therefore not provided. Instead,
a comparison with the nine previous fermentations in the STR of Chapter 2 is given in Table 5.4.
Table 5.4. Relative average yield coefficients, C-balance, and RQ for all fermentations. The carbon balances of the
ALR fermentations are not shown for proprietary reasons.
YSX YSP YSO YSC C-balance RQ
STR (9 batches) 1.00±0.18 1.00±0.15 1.00±0.11 1.00±0.10 0.92±0.06 1.05±0.02
ALR1 (6 batches) 0.66±0.22 0.99±0.16 0.99±0.14 1.00±0.14 - 1.07±0.06
ALR2 (3 batches) 0.67±0.07 0.98±0.17 0.98±0.02 0.99±0.02 - 1.07±0.04
The data presented in Table 5.4 are encouraging for future modeling purposes since it can be seen
that except from the measured biomass yield coefficients, all yield coefficients (and hence the RQ
and the carbon balance) for the ALR fermentations are very close to the equivalent STR data and
certainly within the uncertainty of the measurement methods. This shows that the enzyme
producing strain behaved similarly for two quite different fermentation technologies and indicates
that the model developed in the STR can be applied also to make predictions about other
technologies and certainly for the ALR. The lower yield of biomass on carbon substrate is most
likely due to biomass loss at the reactor wall above the liquid level in those cases where the volume
of the STR was seen to decrease during the course of the fermentation (see Figure 5.5 and caption).
Optimization of the carbon content in the carbon feed could probably help to eliminate this
problem. The carbon balance closed at 0.92±0.06 for the STR fermentations, and the ALR results
were quite similar, but cannot be shown for proprietary reasons. Since only YSX differs from the
STR fermentations, its value could have been estimated easily by the observant reader.
The fact that the yield coefficients of ALR1 and ALR2 are so consistent with each other and also
(with the exception of YSX) with the STR fermentations, indicates that the ALR1 fermentations were
not overfed. This was a major concern during the manual feed flow rate adjustment, but the RQ was
also observed to be only slightly higher than the STR fermentations. If the feed flow rate had been
too high, YSP had probably been lower while YSC and/or YSX had increased. On the other hand the

Airlift reactor experiments 83
yield coefficients do not reveal whether the feed flow rate could have actually been higher as OUR
kept increasing with increasing feed flow rate, see Figure 5.4.
Figure 5.5. Left: Photograph inside the reactor with the ARL1 configuration during fermentation. Biomass is seen on
the reactor wall. If just 2 mm biomass is left on the reactor wall, a 15 cm drop in liquid level due to evaporation
corresponds to 0.6 kg assuming a density of 1000 kg/m3. Right: Photograph inside a reactor after fermentation when
the tank has been emptied. No wall growth was ever observed below the liquid surface level.
5.3.3 Rheology of the fermentation broth
The data obtained with the ALR configuration are compared with the data reported in Chapter 2 in
Figure 5.6. The biomass concentrations obtained using the ALR are lower than those obtained with
the STR as the OTR was in general lower in the former. Eq. (2.10) and (2.11) were also used for
modeling the STR in Chapter 2. The exponents α and β were found to be 2.29 and -0.32,
respectively, for the STR fermentations. Since the relation between the rheological parameters and
the biomass concentration represented by α and β seems to differ between the ALR and the STR
fermentations, it could be argued that the morphology seems to be different in the ALR compared to
the STR.

84 Chapter 5
Figure 5.6. A: K shown as function of biomass concentration for both ALR and STR fermentations (Chapter 2). Both
the highest values of K and biomass concentrations were obtained in the STR. B: n shown as function of biomass
concentration for both ALR and STR fermentations (Chapter 2). At the higher biomass concentrations achieved in the
STR, the values of n were lower than for the ALR.
If the morphology is in fact different for the ALR and the STR, it would perhaps not be surprising.
The STR is known to provide zones with very high power input per unit mass (Zhou and Kresta,
1996) and it has previously been shown that the morphology of filamentous fungi is affected by
mechanical stress of the STR. The productivity of some organisms seems to be influenced by the
morphological state (e.g., Penicillum chrysogenum) while the productivity of other organisms
appears unaffected (e.g., A. oryzae) (Amanullah et al., 1999; Amanullah et al., 2002; Jüsten et al.,
1998).
However, as the yield coefficients of the present strain of T. reesei are very similar for the ALR and
the STR fermentations while the relation between the rheological parameters and biomass
concentration apparently differ it would seem that the productivity of the current strain of T. reesei
is not affected by morphological differences between the reactor technologies. It could therefore be
argued that the possible mycelial damage in the STR is actually beneficial since it helps to lower the
viscosity of the fermentation broth. A more certain confirmation of the proposed difference in
morphology would require more detailed investigations such as advanced image analysis or particle
size distribution (Petersen et al., 2008).
5.3.4 Mass transfer correlations
The direct method of measuring kLa was used. The ALR reactor had only a single DOT probe and
therefore no distinction between different zones of the reactor could be made. The direct method as
used here implies in principle that the reactor is perfectly mixed such that the measured kLa is the
same in the entire volume of the whole vessel (Merchuk and Gluz, 2002). If all gas liquid mass
0
0.5
1
1.5
2
Biomass concentration (g DW/L)
K (Pa.sn)
A
ALR data
STR data
ALR: K = CX1.40
STR: K = CX2.29
0
0.2
0.4
0.6
0.8
1
1.2
Biomass concentration (g DW/L)
n (-)
B
ALR data
STR data
ALR: n = CX-0.19
STR: n = CX-0.32

Airlift reactor experiments 85
transfer occurs in the riser section as argued in the section on effective shear rate, the broth volume
used for mass transfer corresponded to only half of vessel volume. This means that the measured
kLa would be twice as large in the riser zone and zero in the downcomer zone. The average vessel
kLa would be the same as assuming that the entire vessel volume is utilized for mass transfer.
Therefore it is simpler in this case to consider the kLa equal in the entire vessel.
The measured kLa values are shown as function of vg,r in Figure 5.7. The ALR fermentations have
been carried out in the range 0.02<vg,r<0.06 and the kLa values are in the range 15-62 1/h. At each
level of vg,r, a range of kLa measurements were made as function of fermentation time. Therefore,
naturally, there is a certain scatter in the data. For each ALR configuration, there seems to be
different exponents for the mass transfer correlation of Eq. (5.4). The ALR1 data with the lowest vg,r
deviate from the behavior seen from ALR2 and the correlation from the literature. The ALR1 data
suggest an exponent of a = 1.67. It is quite unexpected that a>1, and it is interesting that as vg,r was
increased in the ALR1, the data is very similar to that of ALR2. One reason may, perhaps in
combination with other causes, explain this: the mixing achieved with the ALR1 configuration was
suboptimal and especially at the lowest power inputs the entire vessel was not well mixed. This
would lead to lower average kLa values.

86 Chapter 5
Figure 5.7. kLa in a log-log plot as function of riser zone superficial gas velocity for ALR1 and ALR2 fermentations.
The relationship of Barker and Worgan (1981) is also shown as well as the least square regression of Eq. (5.4) to the
ALR1 and ALR2 data, respectively.
By use of the ALR2 experimental data, the constants of Eq. (5.4) were estimated by least squares
regression: C = 511 and a = 0.76. All experimental data are within ±30% of the model.
Encouragingly, these constants were quite similar to the ones obtained from the literature and
previously used where a = 0.78, however with C = 640 (Barker and Worgan, 1981). In their work
Barker and Worgan (1981) determined C = 853 for water and recognized a certain influence of
viscosity, but did not specify this influence quantitatively. In the technology screening of Chapter 4
the increased viscosity was assumed to reduce kLa by 25% yielding C = 640 (Barker and Worgan,
1981).
Eq. (5.5) includes a term for apparent viscosity by analogy to the empirical mass transfer correlation
of the STR in Chapter 2. The term is included since biomass concentration and apparent viscosity
were expected to increase during fermentation and affect the oxygen mass transfer negatively
during the course of the fermentation. In Figure 5.8 the measured kLa data is shown in a log-log plot
0.01 0.05 0.110
20
30
40
50
60
70
80
90
100
vg,r (m/s)
kLa (1/h)
ALR1 data
ALR2 data
kLa = 640v
g,r0.78 Barker and Worgan (1981)
kLa = 8439v
g,r1.67 ALR1
kLa = 511v
g,r0.76 ALR2

Airlift reactor experiments 87
versus Eq. (5.5) with constants estimated by least squares regression using the ALR2 data. For
ALR2 which must be regarded as the most reliable data, the experimental data are always within
±30% of the model prediction, which is satisfactory for this type of measurements (e.g., Albaek et
al., 2011, Cooke et al., 1988; Zhu et al., 2001).
Figure 5.8. Log-log plot of the measured kLa values versus the modeled values using Eq. (5.5). By use of the ALR2
data, the exponents were estimated by least squares regression: a = 0.71 and b = -0.18. The ALR2 data are all within
±30% of the model prediction. The ALR1 data are generally overpredicted by the model indicating that mixing and
mass transfer were better in the ALR2 configuration.
Both correlations Eq. (5.4) and (5.5) can be used to describe the experimental kLa data. In Eq. (5.4),
the exponent a = 0.76 while due to the incorporation of the viscosity term, in Eq. (5.5) a = 0.71. The
exponent of the viscosity term b was -0.18, which is numerically smaller than for the similar
empirical mass transfer correlation for the STR, Eq. (2.30), where the exponent c was -0.50. This
finding is in accordance with the previous study that found a seemingly less adverse effect of broth
10 50 10010
20
30
40
50
60
70
80
90
100
Measured kLa (1/h)
kLa = 196v
g,r0.71µapp
-0.18
ALR1 data
ALR2 data
Model ± 30%

88 Chapter 5
viscosity in airlift fermentors than in the STR (Barker and Worgan, 1981). It was decided to use Eq.
(5.5) and the corresponding constants (C = 196, a = 0.71, and b = -0.18) in the model based scale-
up, since it allows the quantification of the effect of the viscosity increase during the course of
fermentation.
5.3.5 Mixing time measurements
The results of the 90% mixing time measurements are shown in Figure 5.9, while the details of the
measurements are provided in Appendix A. In general, mixing time decreased with superficial gas
velocity and increased with the viscosity of the broth. The mixing times varied between 29 s (water
and vg,r = 0.06) and 260 s (0.25% xanthan and vg,r = 0.02 m/s). The mixing time for the 0.125%
xanthan solution was 57-87 s for both ALR1 and ALR2. For the xanthan solutions, ALR2 showed
lower mixing times than the ALR1 while no difference was observed with water as the medium.
Figure 5.9. Mixing time versus vg,r for three different media in ALR1 and ALR2. 400 mL of 25% (w/v) NaCl were used
as tracer. Injection time was 10 s and included in the mixing time. Experiments were done in triplicates; average values
are shown and the standard deviation is shown with error bars.
The mixing times of the ALR were compared with the STR. Mixing times in the STR were
measured with the agitation intensities used in Chapter 2 and otherwise the same procedure as
described here. No aeration was included since this introduced too much noise for reasonable
measurements of the conductivity. The measured mixing times are shown as function of the agitator
power input in Figure 5.10. The mixing times for the STR including injection pulse time were
below 35 s for all fluids and did not change much with power input. There was a difference between
the fluids, but it is in the range of the injection time and the standard deviation of the measurements.
0 0.01 0.02 0.03 0.04 0.05 0.06 0.07 0.080
50
100
150
200
250
300
vg,r (m/s)
t mix,90% (s)
ALR1: Water
ALR1: 0.125% Xanthan
ALR1: 0.25% Xanthan
ALR2: Water
ALR2: 0.125% Xanthan
ALR2: 0.25%

Airlift reactor experiments 89
Figure 5.10. Mixing time measured for the STR with configuration as described in Chapter 2. No aeration was
provided. 400 mL of 25% (w/v) NaCl were used as tracer. Injection time was 10 s and included in the mixing time.
Experiments were done in triplicates; average values are shown and the standard deviation is shown with error bars.
A correlation for turbulent mixing in a STR with H/T = 1 was proposed (Nienow, 1997):
1/3 1/32/3m,95% 5.9 P Dt T V T
− −
=
(5.6)
Eq. (5.6) predicts 95% mixing times at ~3-5 s for the agitation intensities used here.
The Reynolds number of the STR was calculated for each fluid and agitation intensity according to
(Grenville and Nienow, 2004):
2app
Re NDσµ
= (5.7)
The Reynolds numbers for water were 272,000-726,000 and are thus clearly in the turbulent regime
as expected at these high power inputs. For the 0.125% xanthan solution the apparent viscosity
varied with N from 0.011-0.017 Pa.s, which yielded Reynolds numbers between 16,000-67,000.
The apparent viscosities for the 0.25% xanthan solution varied from 0.029-0.056 Pa.s and the
Reynolds numbers were between 4,900-25,000.
The transition from the turbulent region to the transitional region has been shown to occur at
(Grenville and Nienow, 2004):
0 2 4 6 8 10 12 14 160
10
20
30
40
50
P/V (kW/m3)
t mix,90% (s)
STR: Water
STR: 0.125% Xanthan
STR: 0.25% Xanthan
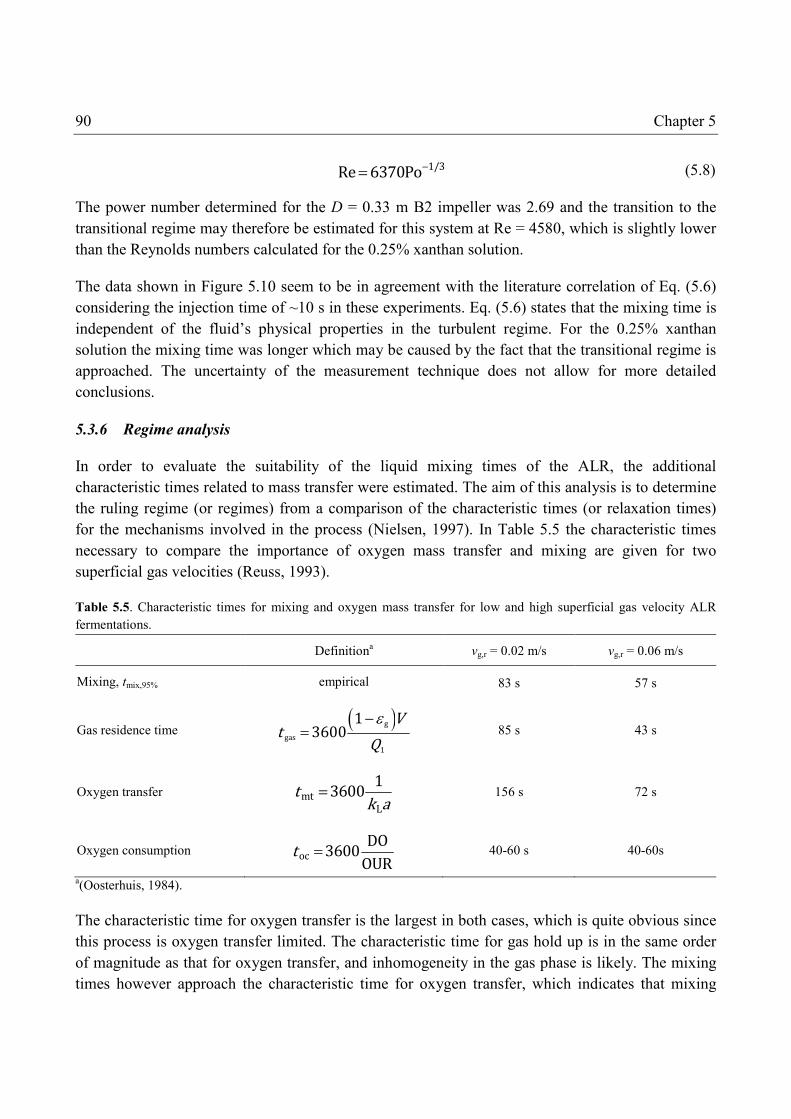
90 Chapter 5
1/3Re 6370Po−= (5.8)
The power number determined for the D = 0.33 m B2 impeller was 2.69 and the transition to the
transitional regime may therefore be estimated for this system at Re = 4580, which is slightly lower
than the Reynolds numbers calculated for the 0.25% xanthan solution.
The data shown in Figure 5.10 seem to be in agreement with the literature correlation of Eq. (5.6)
considering the injection time of ~10 s in these experiments. Eq. (5.6) states that the mixing time is
independent of the fluid’s physical properties in the turbulent regime. For the 0.25% xanthan
solution the mixing time was longer which may be caused by the fact that the transitional regime is
approached. The uncertainty of the measurement technique does not allow for more detailed
conclusions.
5.3.6 Regime analysis
In order to evaluate the suitability of the liquid mixing times of the ALR, the additional
characteristic times related to mass transfer were estimated. The aim of this analysis is to determine
the ruling regime (or regimes) from a comparison of the characteristic times (or relaxation times)
for the mechanisms involved in the process (Nielsen, 1997). In Table 5.5 the characteristic times
necessary to compare the importance of oxygen mass transfer and mixing are given for two
superficial gas velocities (Reuss, 1993).
Table 5.5. Characteristic times for mixing and oxygen mass transfer for low and high superficial gas velocity ALR
fermentations.
Definitiona vg,r = 0.02 m/s vg,r = 0.06 m/s
Mixing, tmix,95% empirical 83 s 57 s
Gas residence time ( )g
gas1
13600 Vt Qε−
= 85 s 43 s
Oxygen transfer mt L13600t k a= 156 s 72 s
Oxygen consumption oc DO3600OURt = 40-60 s 40-60s
a(Oosterhuis, 1984).
The characteristic time for oxygen transfer is the largest in both cases, which is quite obvious since
this process is oxygen transfer limited. The characteristic time for gas hold up is in the same order
of magnitude as that for oxygen transfer, and inhomogeneity in the gas phase is likely. The mixing
times however approach the characteristic time for oxygen transfer, which indicates that mixing

Airlift reactor experiments 91
might also be limiting the fermentation and it therefore cannot be ruled out that concentration
gradients exist. It is important to keep this in mind if the process is further investigated in other
scales.
The characteristic times for substrate addition and substrate consumption have not been included
here, since the process is a fed-batch fermentation where the substrate concentration is not know.
Intuitively, the substrate concentration must be very low and the substrate consumption must be in
the same order of magnitude.
5.3.7 Simulations
All ALR fermentations were simulated using the process mode; the simulations utilized the yield
and maintenance coefficients determined in Chapter 2, the rheological correlations for the ALR as
shown in Figure 5.6, and the ALR mass transfer correlation shown in Figure 5.8. For comparison,
simulations were also performed with the mass transfer correlation of Barker and Worgan (1981),
while all other components of the model were unchanged.
An example of the simulation results is shown in Figure 5.11. The biomass concentration and
product concentration of ALR2.3 increased steadily during the fermentation. Except for the last
measurement, the specific growth rate in general decreased as expected for fed-batch fermentation.
Furthermore, the apparent viscosity generally increased although with some fluctuation in the data.
These trends were predicted quite well by both the simulation using the mass transfer correlation of
Barker and Worgan (1981) and the correlation of this work. However, the mass transfer coefficient
was overpredicted by the literature correlation. The literature prediction of kLa led then to an
overestimation of the OTR and finally to an overestimation of the feed flow rate. The kLa prediction
of this work led to a better estimation of OTR, feed flow rate, and ultimately a better estimation of
biomass and protein concentration.
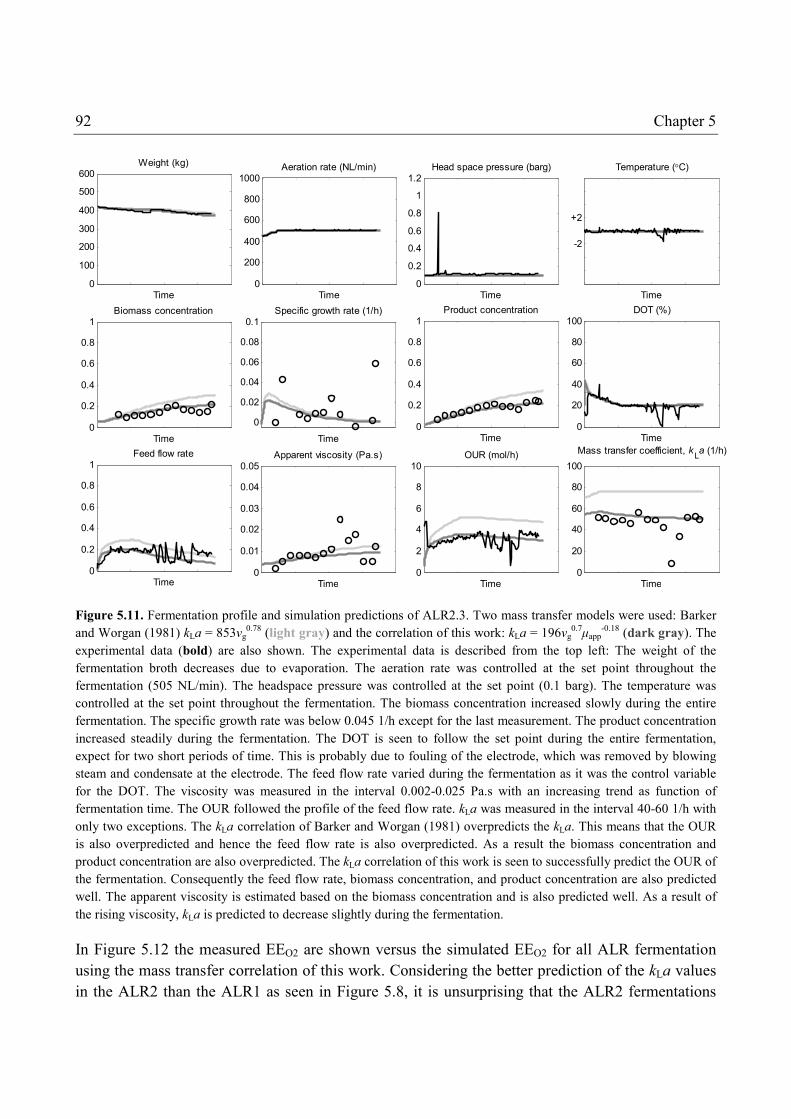
92 Chapter 5
Figure 5.11. Fermentation profile and simulation predictions of ALR2.3. Two mass transfer models were used: Barker
and Worgan (1981) kLa = 853vg0.78 (light gray) and the correlation of this work: kLa = 196vg
0.7µapp
-0.18 (dark gray). The
experimental data (bold) are also shown. The experimental data is described from the top left: The weight of the
fermentation broth decreases due to evaporation. The aeration rate was controlled at the set point throughout the
fermentation (505 NL/min). The headspace pressure was controlled at the set point (0.1 barg). The temperature was
controlled at the set point throughout the fermentation. The biomass concentration increased slowly during the entire
fermentation. The specific growth rate was below 0.045 1/h except for the last measurement. The product concentration
increased steadily during the fermentation. The DOT is seen to follow the set point during the entire fermentation,
expect for two short periods of time. This is probably due to fouling of the electrode, which was removed by blowing
steam and condensate at the electrode. The feed flow rate varied during the fermentation as it was the control variable
for the DOT. The viscosity was measured in the interval 0.002-0.025 Pa.s with an increasing trend as function of
fermentation time. The OUR followed the profile of the feed flow rate. kLa was measured in the interval 40-60 1/h with
only two exceptions. The kLa correlation of Barker and Worgan (1981) overpredicts the kLa. This means that the OUR
is also overpredicted and hence the feed flow rate is also overpredicted. As a result the biomass concentration and
product concentration are also overpredicted. The kLa correlation of this work is seen to successfully predict the OUR of
the fermentation. Consequently the feed flow rate, biomass concentration, and product concentration are also predicted
well. The apparent viscosity is estimated based on the biomass concentration and is also predicted well. As a result of
the rising viscosity, kLa is predicted to decrease slightly during the fermentation.
In Figure 5.12 the measured EEO2 are shown versus the simulated EEO2 for all ALR fermentation
using the mass transfer correlation of this work. Considering the better prediction of the kLa values
in the ALR2 than the ALR1 as seen in Figure 5.8, it is unsurprising that the ALR2 fermentations
0
100
200
300
400
500
600Weight (kg)
Time0
200
400
600
800
1000Aeration rate (NL/min)
Time0
0.2
0.4
0.6
0.8
1
1.2Head space pressure (barg)
Time
-2
+2
Temperature (°C)
Time
0
0.2
0.4
0.6
0.8
1Biomass concentration
Time
0
0.02
0.04
0.06
0.08
0.1Specific growth rate (1/h)
Time0
0.2
0.4
0.6
0.8
1Product concentration
Time0
20
40
60
80
100DOT (%)
Time
0
0.2
0.4
0.6
0.8
1Feed flow rate
Time0
0.01
0.02
0.03
0.04
0.05Apparent viscosity (Pa.s)
Time0
2
4
6
8
10OUR (mol/h)
Time0
20
40
60
80
100
Mass transfer coefficient, kLa (1/h)
Time
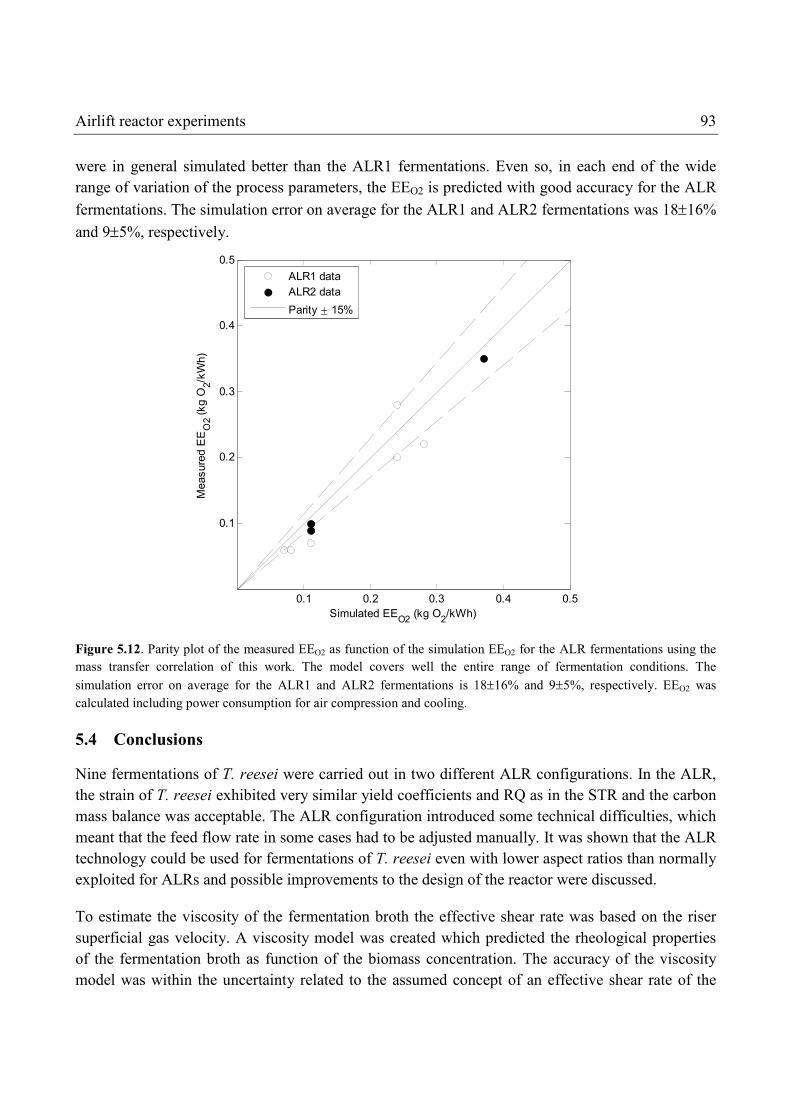
Airlift reactor experiments 93
were in general simulated better than the ALR1 fermentations. Even so, in each end of the wide
range of variation of the process parameters, the EEO2 is predicted with good accuracy for the ALR
fermentations. The simulation error on average for the ALR1 and ALR2 fermentations was 18±16%
and 9±5%, respectively.
Figure 5.12. Parity plot of the measured EEO2 as function of the simulation EEO2 for the ALR fermentations using the
mass transfer correlation of this work. The model covers well the entire range of fermentation conditions. The
simulation error on average for the ALR1 and ALR2 fermentations is 18±16% and 9±5%, respectively. EEO2 was
calculated including power consumption for air compression and cooling.
5.4 Conclusions
Nine fermentations of T. reesei were carried out in two different ALR configurations. In the ALR,
the strain of T. reesei exhibited very similar yield coefficients and RQ as in the STR and the carbon
mass balance was acceptable. The ALR configuration introduced some technical difficulties, which
meant that the feed flow rate in some cases had to be adjusted manually. It was shown that the ALR
technology could be used for fermentations of T. reesei even with lower aspect ratios than normally
exploited for ALRs and possible improvements to the design of the reactor were discussed.
To estimate the viscosity of the fermentation broth the effective shear rate was based on the riser
superficial gas velocity. A viscosity model was created which predicted the rheological properties
of the fermentation broth as function of the biomass concentration. The accuracy of the viscosity
model was within the uncertainty related to the assumed concept of an effective shear rate of the
0.1 0.2 0.3 0.4 0.5
0.1
0.2
0.3
0.4
0.5
Measured EEO2 (kg O
2/kWh)
Simulated EEO2 (kg O
2/kWh)
ALR1 data
ALR2 data
Parity ± 15%

94 Chapter 5
vessel. The shear fields in any bioreactor are position dependent and the estimation of local or
global shear rates are extremely complex and were not the subject of this work.
The correlations between the rheological parameters K and n and the biomass concentration were
different from those observed for the STR. This could be due to the low biomass concentrations
obtained in the ALR which meant that the comparison was not made over the same range of
biomass concentrations. It could also be speculated that higher local mechanical forces in the STR
influenced the morphology characteristics of the strain. More detailed studies would be needed to
make certain conclusions on this matter.
Two mass transfer correlations were shown to predict the kLa with satisfactory accuracy. One was
purely based on riser superficial gas velocity and was approximately 20% lower than the mass
transfer correlation from the literature (Barker and Worgan, 1981). The second mass transfer
correlation included a viscosity term to account for the decreasing kLa values that were observed as
function of fermentation time. The apparent viscosity was shown to negatively impact kLa with an
exponent of ~0.18. This means that a viscosity increase to 0.020 Pa.s leads to a reduction in mass
transfer of ~40%. The ALR2 configuration had higher kLa values than the ALR1 configuration at
least at low superficial gas velocities.
The mixing time of the ALR was measured by the conductivity method for three different media
and compared to the STR. Mixing times in the ALR2 were lower than in the ALR1, but were in the
range 57-87 s for both configurations with the 0.125% xanthan solution, which resembles the
fermentation broth most closely. The mixing times were in the same order of magnitude as the
characteristic time for oxygen transfer of the system, which indicates that mixing might also be
limiting the fermentation. Finally the mixing times of the ALR were compared to those of the STR.
For the STR mixing times were in the order of twice the salt tracer injection time (20 s).
The process model developed for the STR in Chapter 2 was also employed for prediction of the
ALR fermentations. The viscosity model was revised using slightly different rheological
correlations with the biomass concentration and the mass transfer correlation containing the riser
superficial gas velocity and the apparent viscosity was inserted in the model. The nine ALR
fermentations carried out were simulated well by the process model. The conditions covered were
0.02<vg,r<0.06 with headspace pressures from 0.1-1.1 barg.

Chapter 6
Objective comparison between airlift reactor and stirred
tank reactor
In Chapter 4 the performance of the airlift reactor in relevant scale was estimated based on the
literature data and correlations. The pilot scale trials described in Chapter 5 have provided detailed
information about the level of mass transfer that can be expected in the medium used for T. reesei
fermentations and how the fermentation broth viscosity differed from the STR fermentations. The
process model was refined and proved to describe the ALR fermentations accurately too. In this
chapter, the results obtained using the ALR and the STR at pilot scale will first be compared using
two different estimations of the vessel power input. Finally and most importantly, the ALR and
STR are evaluated at relevant scale using the revised process model.
6.1 Comparison of pilot scale experimental data
The power input of a fermentation vessel may be estimated in various ways. In this section, two
different approaches for estimating the power input are employed. It will be clear that the choice of
approach influences the results and might lead to very different conclusions.
Approach 1. The conventional approach: Power dissipated to the fermentation broth
The power input from mechanical agitation is the power actually dissipated to the
fermentation broth determined by Eq. (2.22). The compression power input is estimated
by the superficial gas velocity (Chisti, 1989). Specifically, in bubble columns and airlift
reactors this is calculated by
g,rdLr
1gvP
AVA
ρ=
+ (6.1)
In the literature, this is the commonly used approach for fermentor comparison (Gasner,
1974; Schügerl, 1990; Schügerl, 1991; Schügerl, 1993).
Approach 2. An integrated approach: The total power consumption of the fermentor
The total power consumption of the fermentation vessel considers that of agitation (the

96 Chapter 6
power consumption of the motor), aeration (the power consumption of the compressor),
and cooling, following Eq. (2.22) - (2.28) of Chapter 2. The energy that is to be removed
by cooling consists of metabolic heat and the energy dissipated by the stirrer. The
possible energy loss due to evaporation depends on the fermentation temperature and
humidity of the air and only plays a minor role compared to the metabolic heat
development (Soderberg, 1997).
6.1.1 Distribution of the power consumption
The respective contributions to the power consumption of agitation, aeration, and cooling (only in
approach 2) are shown in Figure 6.1 for all pilot scale fermentations. The power consumption for
agitation of the STR fermentations was designed to be 1.5, 9, or 15 kW/m3; here the realized values
as average of the entire fermentations are shown. For approach 1, the energy dissipated in the STR
is almost completely from agitation. The energy dissipated by aeration in the ALR was always
below 1 kW/m3.
Figure 6.1. Two approaches for the estimation of the power consumption of STR and ALR fermentations in pilot scale.
A: Approach 1: Power dissipation to the liquid broth from agitation and aeration. B: Approach 2: Total power
consumption of the fermentation vessel with contributions from agitation, aeration (compressor power consumption)
and cooling.
For approach 2, agitation on average accounted for 62% of the total STR power consumption, while
cooling contributed with up to 25% of the total power consumption. For the ALR, cooling on
average only contributed 11% of the total power consumption. Notably also is the large influence of
5
10
15
20
Power consumption (kW/m
3)
A
STR1
STR2
STR3
STR4
STR5
STR6
STR7
STR8
STR9
ALR1.1
ALR1.2
ALR1.3
ALR1.4
ALR1.5
ALR1.6
ALR2.1
ALR2.2
ALR2.3
Agitation
Aeration
5
10
15
20
Power consumption (kW/m
3)
B
STR1
STR2
STR3
STR4
STR5
STR6
STR7
STR8
STR9
ALR1.1
ALR1.2
ALR1.3
ALR1.4
ALR1.5
ALR1.6
ALR2.1
ALR2.2
ALR2.3
Agitation
Aeration
Cooling

Objective reactor comparison 97
the headspace pressure on the power consumption for aeration. In ALR2.3 the low headspace
pressure of 0.10 barg and 505 NL/min aeration rate required a power consumption of 0.65 kW/m3,
while the lower aeration rate of ALR2.1 of 475 NL/min with 1.10 barg headspace pressure required
a power consumption of 2.8 kW/m3. The power consumption of the ALR fermentations was in
general lower than for the STR. Four ALR fermentations were carried out with 0.1 barg headspace
pressure and the power consumption of those fermentations was around 1 kW/m3. It is clear that the
power dissipated by the air (approach 1) was much smaller than the power consumed by the
compressor in order to deliver the air.
6.1.2 Key performance indicators
The key performance indicators have been calculated for all fermentations using both approach 1
and approach 2. The oxygen transfer rates and EEO2 for approach 1 are shown as function of the
total power consumption in Figure 6.2A+B, respectively. The ALR fermentations had much lower
power inputs than the STR fermentations. As expected, the STR fermentations also had the highest
oxygen transfer rates. The estimated values of EEO2 were up to 2.3 kg O2/kWh for the ALR and up
to 1.3 kg O2/kWh for the STR; however this was only achieved at the lowest power inputs.
For approach 2, the oxygen transfer rates and EEO2 are shown in Figure 6.2C+D. While the
measured OTR obviously was not changed compared to approach 1, the calculated power
consumption for all fermentations was higher compared with approach 1. For similar power
consumption, the OTR was lower in the ALR than the STR, and EEO2 was higher for the STR at
similar power consumption. In a single case was the EEO2 higher for the ALR, and this was
achieved at the lowest power input, which was lower than the STR power inputs of this study.
Approach 1 and 2 give significantly different values of EEO2, especially for the ALR where the
difference between the energy input by aeration and the actual energy consumption by the
compressor is large.

98 Chapter 6
Figure 6.2. Oxygen transfer rate and EEO2 for all pilot scale STR and ALR fermentations as function of the total power
input. A: OTR for approach 1. B: EEO2 for approach 1. C: OTR for approach 2. D: EEO2 for approach 2. For approach
1, less power was dissipated in the ALR fermentations, and the OTR and EEO2 cannot be compared at equal power
consumption for the two fermentation technologies. EEO2 was estimated around 2 kg O2/kWh or higher for some ALR
fermentations, while the highest EEO2 for the STR was 1.3 kg O2/kWh. For approach 2, at similar power consumption
the oxygen transfer rate was lower in the ALR than the STR. For similar power consumption, EEO2 was higher for the
STR. At low power consumption, the highest achieved EEO2 was 0.32 for the ALR at 1 kW/m3, while an EEO2 of 0.22
was achieved in the STR with a power consumption of around 3 kW/m3.
In Figure 6.3 EEO2 is shown as function of oxygen transfer rate for all fermentations for approach 1
and approach 2, respectively. For approach 1, the ALR1.2 and ALR2.2 fermentations had similar
0
0.4
0.8
1.2
1.6
2
Oxygen transfer rate (kg O
2/m
3/h)
A
Approach 1
Approach 2
C
5 10 15 200
0.5
1
1.5
2
2.5
Specific power consumption total (kW/m3)
EEO2 (kg O
2/kWh)
B
5 10 15 20
Specific power consumption total (kW/m3)
D
ALR1
ALR2
STR

Objective reactor comparison 99
oxygen transfer rates as the low power STR fermentation and had higher values of EEO2. Even
higher values of EEO2 were observed for ALR2.1 and ALR1.5 (2.3 and 1.9 kg O2/kWh,
respectively), though at lower oxygen transfer rates. The ALR fermentations with the highest values
of EEO2 were carried out with the highest headspace pressures. For approach 2, the ALR
fermentations in general provided a lower oxygen transfer rate; only in two cases were the ALR
oxygen transfer rates as high as the lowest STR oxygen transfer rates. Five ALR fermentations had
both low oxygen transfer rates and low EEO2. Those five ALR fermentations were carried out with
headspace pressure higher than 0.10 barg. This shows that increased headspace pressure in the ALR
is not economical at pilot scale.
Figure 6.3. EEO2 as function of oxygen transfer rate for all STR and ALR fermentations. A: Approach 1. The ALR
fermentations reached values up to 2.3 kg O2/kWh, while the STR reached up to 1.3 kg O2/kWh. The highest EEO2 were
obtained with the highest head space pressure. At similar oxygen transfer rates, the ALR1.2 and ALR2.2 fermentations
had a considerably higher EEO2 than the low power STR fermentations B: Approach 2: The STR generally achieves the
same EEO2 as the ALR but at a higher OTR. Five ALR fermentations were characterized with both low oxygen transfer
rates and EEO2: ALR1.2, ALR1.5, ALR1.6, ALR2.1, and ALR2.2. These were the ALR fermentations carried out with
headspace pressures higher than 0.10 barg. ALR2.3 had the highest EEO2 of 0.32 kg/kWh. Note that ALR2.3 was
carried out with identical conditions as ALR1.4. Also note that A and B have different axes.
ALR2.3 was carried out with vg,r = 0.04 and a headspace pressure of 0.10 barg. Following approach
2, the average OTR was 0.25 kg O2/m3/h while the EEO2 was 0.32 kg O2/kWh. This EEO2 was 50%
higher than observed for the low power STR. The low power STR however was operated at oxygen
transfer rates around 0.6 kg O2/m3/h, which means that in order to achieve the same quantitative
oxygen transfer the ALR must be operated with a larger volume than the STR.
Interestingly, ALR1.4 was operated with the same fermentation conditions as ALR2.3, but EEO2 for
0 0.5 1 1.5 20
0.5
1
1.5
2
2.5
ALR1.1
ALR1.2
ALR1.3
ALR1.4
ALR1.5
ALR1.6
ALR2.1
ALR2.2
ALR2.3
Oxygen transfer rate (kg O2/m3/h)
EEO2 (kg O
2/kWh)
Approach 1
ALR1
ALR2
STR
0 0.5 1 1.5 20
0.05
0.10
0.15
0.20
0.25
0.30
0.35
ALR1.1
ALR1.2
ALR1.3
ALR1.4
ALR1.5
ALR1.6
ALR2.1ALR2.2
ALR2.3
Oxygen transfer rate (kg O2/m3/h)
EEO2 (kg O
2/kWh)
Approach 2
A B vg,r barg
ALR1.1 0.05 0.1
ALR1.2 0.05 1.1
ALR1.3 0.03 0.1
ALR1.4 0.04 0.1
ALR1.5 0.03 1.1
ALR1.6 0.03 0.6
ALR2.1 0.02 1.1
ALR2.2 0.06 0.8
ALR2.3 0.04 0.1

100 Chapter 6
the ALR2.3 was almost twice as high. There are a number of possible reasons for the better
performance of the ALR2.3. First, it is likely that the design of the ALR2 is superior to the ALR1 in
terms of mixing and mass transfer. The ALR2 had a larger volume and thus a higher aspect ratio,
which can have improved the liquid circulation and led to the decrease in mixing time measured in
Chapter 5. Secondly, the higher volume of the ALR2 led to a better utilization of the compressed air
and allowed for a longer time of oxygen exchange between the air bubbles and the fermentation
broth. Finally, as shown in Figure 5.4 the carbon substrate feed rate was manually adjusted in the
last half of the fermentation when the DOT signal was missing. It is therefore quite likely that
ALR1.4 was not limited by the oxygen transfer rate as the DOT controlled substrate feeding of
ALR2.3.
6.1.3 Discussion of calculation method of power consumption
In this section, two different approaches of estimating the power consumption of fermentation
vessels have been utilized. The results have shown that depending on the method, very different
conclusions may be made.
Approach 1 may be grasped as the theoretical and strictly correct approach of investigating the
effect of the dissipated power on mass transfer and mass transfer efficiency. Approach 2 attempts to
evaluate the entire power consumption of the fermentation vessel. It is used in order to evaluate the
total power consumption of the system, imitating the value of an imaginary energy meter of the
system.
For the industrial manufacturer of a biotechnological product, approach 2 seems to be the most
objective way to compare technologies. If approach 1 is used, some unpleasant and surprising
energy bills will surely result from the vast underestimation of the cooling demand and the
compressor power consumption. Approach 1 is however widely used in the literature and if
comparison with literature data is needed, taking this approach is necessary.
6.2 Comparison at industrial scale
6.2.1 Evaluation of cost efficiency
The scope of this work has until now been to investigate the energy and substrate efficiencies of
fermentation technologies. It has been shown that the substrate yield coefficients and thus also the
substrate efficiency are independent on the fermentation technology. The experimental data have
confirmed that the energy efficiency of each technology depends on the process conditions, and a
mechanistic model has been shown to describe the experimental data well.
The comparison at pilot scale showed that at equal oxygen transfer rate, less energy was consumed
per oxygen transfer in the STR reactor than in the ALR. The ALR is however usually operated at
low oxygen transfer rates, where the efficiency (of both technologies) is higher. In order for the

Objective reactor comparison 101
ALR to have the same total oxygen transfer as the STR a larger fermentation volume is thus needed.
This can be achieved by having a larger numbers of fermentors or by increasing the vessel size.
This section has a dual purpose. First, based on the process model the optimal reactor specification
and process conditions for the ALR and the STR are sought. Secondly, with this knowledge the two
technologies should be objectively compared. In other words, the problem can be defined as the
search for optimum design of oxygen transfer in the ALR and the STR for the T. reesei
fermentation process. Following the principles of engineering process design, the criteria for
optimality can ultimately be reduced to a consideration of costs (Peters et al., 2003). The
development of an optimum design usually involves the following phases which will be covered in
this section:
- Determination of the objective function that is to be minimized or maximized
- Determination of the design process variables and the process constraints
- Identification of optimum conditions
6.2.1.1 Determination of the objective function
The objective function in this case is the total cost of oxygen transfer, which should be minimized
for the optimal fermentation design. The cost of oxygen transfer, CO2 ($/kg O2), can be estimated by
the relation between the sum of the equipment investment cost, Cinvestment ($/h) and the running cost,
RC ($/h), and the time specific oxygen transfer
investmentO2 LRCC OTR
CV+
=⋅ (6.2)
where the time specific oxygen transfer is easily found as the OTR (kg O2/m3/h) multiplied with the
volume (m3).
To simplify the estimation of the cost efficiency, only the reactor, the compressor, and the cooling
system are taken into account for the investment cost. Humbird et al. (2011) have collected vendor
quotes for fermentors (303 m3, internal cooling coils), fermentor agitators (800 horse power), and
air compressors (225 Nm3/min at 3 atm) for their detailed lignocellulosic ethanol plant (Humbird et
al., 2011). In this work, the cooling system is including the agitator cost as 40% of the agitator price
(Peters et al., 2003). In Table 6.1 the costs of the equipment are summarized as well as the scaling
exponent and the installation cost factors used. A number of costs including piping, instrumentation
and controls, as well as electrical systems are assumed to be constant and are therefore not
considered.

102 Chapter 6
Table 6.1. Scaled installed costs of the mechanical equipment considered for the cost function. Adopted from Humbird
et al. (2011). Prices are in 2007$.
Equipment Size Cost ($) Scaling exp.a Inst. Factor
Fermentor (internal cooling coils) 303 m3 400,000 Eq. (6.3) - (6.5) 2
Agitator, motor, and cooling system 588 kW 812,000 0.4 1.5
Air compressor 225 (Nm3/min) 350,000 0.6 1.6 a(Peters et al., 2003)
The fermentor cost is estimated by calculating the total weight of the vessel following the procedure
of Peters et al. (2003). The weight of the fermentor specified above was estimated, and the cost
factor is then applied to the other fermentor geometries and sizes explored here.
The maximal internal pressure of the vessel is then calculated as the headspace pressure plus the
liquid pressure of a completely filled tank plus 2.5 bar for safety. The minimum wall thickness for
cylindrical shells is (Peters et al., 2003)
i cJ i0.6P rt CSE P= +− (6.3)
where t is the wall thickness, Pi is the maximum allowable internal pressure, r is the reactor radius,
S is the maximum allowable working stress, EJ is the efficiency of joints, and Cc is the allowance
for corrosion. For stainless steel 316, S =79,300 kPa, and the joint efficiency EJ = 0.85 assuming
spot-examined double welded butt joints. The corrosion allowance was assumed to be 3.8 mm
(Peters et al., 2003). The heads of the fermentors were assumed to be torispherical and their weight
was estimated by (Peters et al., 2003)
2SS316 T / 24 3 V
4T T t tπ
ρ+ +
(6.4)
The weight of the fermentor specified by Humbird et al. (2011) was estimated to be 37,993 kg using
Eq. (6.3) and (6.4) and assuming 20% weight increase for nozzles, manholes, and saddles (Peters et
al., 2003).
The cost of pressure vessels as price per kilogram weight of the fabricated unit is given by (Peters et
al., 2003)
( ) 0.34p vCost C W −
= (6.5)
where Cp is the cost factor and Wv is the total calculated weight of the vessel (kg). Using the cost of
400,000$ for the 37,993 kg reactor, the specific cost of the vessel including internal cooling coils is

Objective reactor comparison 103
10.52 $/kg. The cost factor is therefore estimated as Cp = 230. Using this procedure and cost factor,
the cost of all fermentor configurations can be estimated.
For the estimation of the compressor cost, the dependence of pressure is neglected since
compressors are usually designed to have a working overpressure higher than needed here; thus
only the volumetric flow rate is considered to be cost related (Knoll et al., 2005). For the estimate of
the specific investment cost, a lifetime of ten years is used. The specific investment cost for the
ALR is given by
0.6Nreactorreactor compressorinvestment,ALR
1.6 350,000$22510 8760h 87600h
QCC CC
+ + = =⋅ (6.6)
Similarly, the specific investment cost for the STR is given by
reactor agitator compressorinvestment,STR
0.6 0.6a Nreactor
10 8760h
1.5 580,000 1.6 350,000$558 22587600h
C C CC
P QC
+ +=
⋅
+ +
= (6.7)
For example, the specific investment cost of a 200 m3 ALR with an aspect ratio of 7 that requires an
aeration rate of 50 Nm3/min is estimated below with the fermentor weight estimated at 40,750 kg
( )0.60.34
investment
502 380$/kg 40,750 40,750kg 1.6 350,000$225 12.16$/h87,600hC−
⋅ ⋅ + = = (6.8)
The running cost is estimated by the power consumption for agitation, aeration, and cooling as well
as the cost of nutrients. The annual average utilization ratio was set to 0.7 and the electricity cost,
EC, was set to 0.05717 $/kWh (Humbird et al., 2011). The cost of nutrients is assumed to equal the
cost of the carbon source. The carbon source requirement per oxygen transfer, YOC = 1.47 g/g, and
its cost, Ccarbon = 0.526 $/kg, were adopted from Humbird et al. (2011)
( )a c w L OC carbonRC UR EC OTRP P P V Y C= + + ⋅ ⋅ + ⋅ ⋅ ⋅ (6.9)
6.2.1.2 Determination of design process variable and process constraints
Different fermentor geometries and process conditions were investigated for each technology. The

104 Chapter 6
intervals for these process variables are given in Table 6.2. The intervals were chosen based on rule
of thumb values obtained from the available literature about the respective technologies.
Table 6.2. Process variables for each fermentation technology
Process variable Airlift reactor Stirred tank reactor
Fermentor size (m3) 100-1000d 100-400c
Fermentor aspect ratio (-) 1.5-25d 2-5a,b
Agitation intensity (kW/m3) - 0.5-7c
Superficial gas velocity (vg or vg,r, m/s) 0.069-0.2d 0.05-0.2c
Headspace pressure (barg) 0-2a 0-2a a(Chisti, 2003), b(Humbird et al., 2011), c(Middleton, 1997), d(Moresi, 1981)
The developed process model contains the desired DOT set point which determined the substrate
feed flow rate. In that regard the process model is inherently constrained. A physical constraint was
however included since the partial pressure of CO2 seemingly impacts product formation negatively
at certain levels. For the strain investigated in this work, there seemed to be a threshold level around
40-60 mbar, but the constraint was set here to pCO2>200 mbar since it has not been determined for
other strains and it is also expected to depend on pH and other medium properties.
6.2.1.3 Identification of optimum conditions
The enzyme production considered here is a fed-batch fermentation. This implies that the liquid
volume during fermentation will almost never be constant; this would only be the case when the
evaporation rate of water equals the carbon and ammonium feed flow rate. Therefore the following
procedure was followed for the application of the process model to each fermentation technology:
1. A set of process variables were assumed (fermentor size, aspect ratio, agitation
intensity, superficial gas velocity, and head space pressure). The initial filling was set
to 60% of the fermentor size.
2. The process model was run and the final filling and average liquid volume were
calculated.
3. The final filling was compared with the fermentor volume. The final filling target
was 80% of the fermentor volume. The initial filling was adjusted (step 1) and the
procedure was repeated until the target of 80±2% final filling target was reached.
4. The operating and investment cost were evaluated as shown above.
Identification of the optimum reactor design and operation conditions is a multivariable task.
Therefore, the response surface methodology – a statistical tool known from design of experiments
– was used in order to explore the relationship between the process variables with the ranges

Objective reactor comparison 105
specified in Table 6.2 (in statistical language termed the explanatory variables) and the cost
efficiency evaluation (termed the response variable) (Montgomery, 1997). The statistical design
was a central composite design enabling the determination of interaction and squared terms. A
central composite design of the process variables was constructed for each technology, fermentation
simulations were performed using the process model, and the cost efficiency was evaluated in each
case. The design and simulation results are given in the appendix (Table B.1 and B.2).
Second-degree polynomial models were then approximated for the cost efficiency and the pCO2 of
fermentation for each technology. The design and data analysis were carried out in the software
JMP 8.0.1. Non-significant effects were removed successively (highest p-values first), until only
effects with p<0.05 remained.
6.2.2 Airlift reactor
The constraint of pCO2<200 was reached at aspect ratios above ~15 for almost any combination of
the remaining variables. Therefore in the following a maximum aspect ratio of 13.2 is assumed. The
results of the statistical models for CO2 and pCO2 are shown as function of the four process
variables for the ALR in Figure 6.4. The following key observations can be made: 1) combinations
of headspace pressure and high aspect ratios often lead to inacceptable levels of pCO2, 2) large
vessel volumes combined with low riser superficial gas velocity lead to the most favorable
operation, 3) there seems to be optimum levels of headspace pressure and aspect ratio. The optimal
conditions of the airlift reactor within the biological constraint were predicted at the maximum
fermentor volume (1000 m3), the minimum riser superficial gas velocity vg,r = 0.069 m/s, and a
headspace pressure of 1 barg. It was not possible to determine the exact optimal aspect ratio. The
minimum cost of oxygen transfer at these conditions was predicted at ~0.95$/kg O2, see Figure 6.4.

106 Chapter 6
Figure 6.4. Statistical model of the airlift reactor: Cost of oxygen transfer (contours, $/kg O2) and corresponding carbon
dioxide partial pressure (shading, mbar) as function of aspect ratio (from top to bottom: 1.5, 7.4, or 13.2, respectively),
riser superficial gas velocity (y-axis), headspace pressure (from left: 0, 1, or 2 barg, respectively), and fermentor volume
(x-axis). The prediction of the lowest cost (within the biological limit) is with aspect ratios between 1.5 and 7.4,
headspace pressure of 1 barg, minimum riser superficial gas velocity and the maximum volume.
The statistical model was used to predict the approximate optimal conditions. This reduced the
number of simulations needed to be run. It was decided to investigate in detail the operational space
around the optimum identified by the statistical model. The aspect ratio and the headspace pressure
were varied while the volume was set to 1000 m3 and the riser superficial gas velocity was set to
0.069 m/s. The results of these simulations are shown in Figure 6.5. The lowest cost was achieved
with a headspace pressure of 1 barg and aspect ratio ~5. The optimum aspect ratio with no

Objective reactor comparison 107
headspace pressure seems to be lower. Aspect ratios in the range 2-6 only changed the cost of
oxygen transfer within 3% for a headspace pressure of 1 barg. At an aspect ratio of 5, a headspace
pressure of 2 exceeds the biological constraint of the system, and the optimal headspace pressure is
close to 1 barg. The simulation results are very similar to the predictions of the statistical model
shown in Figure 6.4.
Figure 6.5. Simulation-based estimations of the cost of oxygen transfer as function of headspace pressure and aspect
ratio for the airlift reactor. The fermentor volume was 1000 m3 and the riser superficial gas velocity was 0.069 m/s. The
filled symbols represent conditions where pCO2>200 mbar and were thus not considered. The lowest cost was achieved
with a headspace pressure of 1 barg and aspect ratio ~5. The cost difference between different levels of headspace
pressure was clearly low. Also, in this operating region, aspect ratios between 1.5 and 10 only changed the cost within
10%.
6.2.3 Stirred tank reactor
The design space of the STR in this work has an additional variable, the agitation intensity (P/V).
Therefore, the results of the statistical model for the STR are shown in three separate figures with
headspace pressures of 0, 1, and 2 barg. The results shown in Figure 6.6 were obtained with a
headspace pressure of 1 barg, while the remaining predictions are found in the appendix. The
following key observations can be made for the STR: 1) large vessel volumes give lower cost, 2)
low agitation intensities give lower cost, 3) low superficial gas velocities give lower cost, 4) high
aspect ratios seem to give lower cost. The cost of oxygen transfer is predicted to be in the range
~1.05-1.45 $/kg for the STR.
0 2 4 6 8 10 12 14 16 18 200.80
0.85
0.90
0.95
1.00
1.05
1.10
1.15
1.20
Aspect ratio
Cost of oxygen transfer ($/kgO2)
Headspace pressure: 0 barg
Headspace pressure: 1 barg
Headspace pressure: 2 barg

108 Chapter 6
Figure 6.6. Statistical model of the stirred tank reactor: Cost of oxygen transfer (contours, $/kg O2) and corresponding
carbon dioxide partial pressure (shading, mbar) as function of aspect ratio (from top to bottom: 2, 3.5, or 5,
respectively), agitator power input (y-axis), superficial gas velocity (from left: 0.05, 0.13, or 0.20 m/s, respectively), and
fermentor volume (x-axis). The head space pressure was 1 barg. The optimum conditions seem to be large volume, low
agitation power input, and low superficial gas velocity.
In order to identify the optimal conditions for the STR, the volume was set to the maximum of 400
m3, the superficial gas velocity was set to the minimum of 0.05 m/s, the agitation intensity was set
to the minimum of 0.5 kW/m3, while three different aspects ratios were tested and the headspace
pressure was varied between 0-2 barg. The results of these simulations are given in Figure 6.7.
From this figure it can be seen that higher aspect ratios give lower oxygen transfer costs, even
though the difference between aspect ratios of 2 and 5 is below 6%. Furthermore there seems to be

Objective reactor comparison 109
an optimum headspace pressure between 0.5 and 1 barg depending on the aspect ratio.
Figure 6.7. Simulation-based estimations of the cost of oxygen transfer as function of aspect ratio and headspace
pressure for the STR. The fermentor volume was 400 m3 and the riser superficial gas velocity was 0.05 m/s. High aspect
ratios give lower costs, while there seems to be an optimum headspace pressure between 0.5 and 1.5 barg depending on
the aspect ratio. The cost of oxygen transfer with an aspect ratio of 5 and a headspace pressure of 1 barg was 1.015$/kg
O2, however the cost changes within 3% for headspace pressures between 0-2 barg (aspect ratio of 5).
6.2.4 Comparison
The analyses summarized in this chapter have led to a prediction of the most desirable
configurations for the industrial scale airlift reactor and the stirred tank reactor. It is important to
remember that the fermentor design and operating conditions have been selected simultaneously.
This means that for example a higher headspace pressure increased the oxygen transfer driving
force but also increased the fermentor and compressor costs since a higher pressure should be
accommodated for in the fermentor design and more aeration was needed to maintain the same
superficial gas velocity at higher pressure. Therefore the differences between similar configurations
are not very big (see Figure 6.7).
In Table 6.3 three reactor designs are presented. The optimal configuration of the ALR identified in
this chapter has a large volume, aspect ratio of 5, relatively low aeration, and headspace pressure of
1 barg. The STR1 configuration was identified as the optimal STR configuration. It has a large
volume, high aspect ratio of 5, low agitation intensity, and headspace pressure of 1 barg. The STR2
configuration included in this comparison is identical to STR1 except for the headspace pressure,
which is equal to zero for the STR2. It is not surprising that for a number of the reactor variables,
the optimum is one of the extreme values of the conditions specified in Table 6.2.
0 0.5 1 1.5 2 2.50.80
0.85
0.90
0.95
1.00
1.05
1.10
1.15
1.20
Headspace pressure (barg)
Cost of oxygen transfer ($/kgO2)
Aspect ratio: 2
Aspect ratio: 3.5
Aspect ratio: 5

110 Chapter 6
It is seen that the ALR is ideally operated with an OTR of 0.75, which is similar to the STR2 with
no headspace pressure. The STR1 is operated with an OTR of 1.15 because of the increased driving
force, which however also increases the aeration need. The energy efficiencies of the reactors are
also provided. The EEO2 for the optimum ALR is estimated at 0.336 kg O2/kWh, which is the
highest of the three compared configurations. The efficiency is lower than predicted in the
technology screening of Chapter 4 (EEO2 = 0.40), since the experimental mass transfer rate was
lower than the literature data used for the screening. The EEO2 of the two STR configurations are
around 0.29 kg/kWh. The efficiency is lower than that of the ALR, but higher than predicted in the
literature screening (EEO2 = 0.13), since the configuration has now been optimized.
Table 6.3. Reactor design and process variables for the optimum design for the ALR and two STR configurations
within the biological constraint of the process model.
Optimum ALR STR1 STR2
Fermentor design
Volume (m3) 1000 400 400
Aspect ratio 5 5 5
Fermentor height (m) 36 26 26
Diameter (m) 5.85 4.34 4.34
Agitator capacity(kW/m3)a 0 0.5 0.5
Aeration (Nm3/min) 187 114 93
NVVM (Nm3/m3/min) 0.19 0.29 0.23
Headspace pressure (barg) 1 1 0
Oxygen transfer rate (kg O2/m3/h)b 0.75 1.15 0.74
EEO2 (kg O2/kWh) 0.336 0.290 0.283 aThe specified agitator capacity is the maximum installed agitator in relation to the total fermentor volume. P/V during
fermentation is higher since the start filling is approximately 50% of the fermentor volume. bOTR is the average data
obtained by the process model from this work.
The energy efficiency as predicted by simulation is shown as function of the predicted oxygen
transfer rate for both technologies in Figure 6.8. These were the simulations used for constructing
the statistical models shown in Figure 6.4 and Figure 6.6, and simulations with pCO2>200 mbar
have been removed. Interestingly, the two technologies cannot be distinguished in this
representation. The ALR does not seem to deliver higher energy efficiency at equal oxygen transfer
rate. It is also seen that the results of the technology screening of Chapter 4 are covered quite well
by the simulations of this chapter. The trend observed in Figure 6.8 is similar to what was seen in
Figure 2.7, which is an inverse relationship between oxygen transfer efficiency and the productivity

Objective reactor comparison 111
of the process. The influence of viscosity is again worth remembering, since a high power input or
OTR leads to higher biomass concentration and eventually higher viscosity. This mechanism favors
low energy systems.
Figure 6.8. Simulated energy efficiency shown as function of oxygen transfer rate for the ALR and the STR. The data
from the technology screening of Chapter 4 are shown for comparison. The simulation details are seen in Table B.1 and
B.2.
The total costs of oxygen transfer are summarized in Table 6.4 for the three reactor configurations.
The total cost ranges from 0.949 $/kg O2 for the ALR to 1.042 $/kg O2 for the STR2 configuration.
The largest contributor to the total cost is the cost of nutrients. In this analysis only the carbon
substrate is considered, but the cost of nutrients is 5-7 times larger than the electricity cost. The
nutrients cost is the same for all technologies, since identical yield coefficients of substrate on
oxygen consumption were assumed in the analysis.
Assuming identical volumes, the fermentor cost is lower for fermentors with high aspect ratios than
fermentors with low aspect ratios, since the cost is related to fermentor weight and the fermentor
wall thickness. The fermentor wall thickness is not dependent on fermentor height, only the
fermentor diameter. Furthermore, the specific fermentor cost is assumed to decrease with the
fermentor weight (with a negative exponent of 0.4). This explains why all configurations have high
aspect ratios. The agitator cost also influences the total cost significantly.
0 0.5 1 1.5 2 2.5 3 3.5 40
0.05
0.1
0.15
0.2
0.25
0.3
0.35
0.4
0.45
0.5
Oxygen transfer rate (kg O2/m3/h)
EEO2 (kg O
2/kWh)
ALR screening
STR screening
ALR simulations
STR simulations

112 Chapter 6
Table 6.4. Cost of oxygen transfer ($/kg O2) of three reactor configurations
Optimum ALR STR1 STR2
Capital cost
Fermentor cost 0.053 0.049 0.061
Agitator and cooling system - 0.033 0.045
Compressor cost 0.012 0.015 0.019
Total capital cost 0.065 0.097 0.125
Electricity cost
Agitation - 0.029 0.040
Aeration 0.081 0.076 0.066
Cooling 0.030 0.035 0.037
Total electricity cost 0.111 0.139 0.143
Nutrients cost (carbon substrate) 0.773 0.773 0.773
Total cost of oxygen transfer($/kg O2) 0.949 1.010 1.042
The electricity cost of the STR is estimated between 0.139-0.143 $/kg O2. The contribution from
cooling is higher or similar to the contribution from agitation. Interestingly, the total electricity cost
for the ALR is up to 22% lower than that of the STR, even though the ALR requires more
electricity for aeration.
The comparison between STR1 and STR2 indicate that increased headspace pressure can be a way
to increased oxygen transfer rate and higher energy efficiency. This comparison is valid for a future
enzyme production facility where the operation pressure of the compressor can be matched exactly
to the requirements (the minimum pressure to sparge the air into the bottom of the fermentor). For
an existing facility (where a compressor system is already installed) it could be most optimal to run
the process with as high headspace pressure as possible.
6.2.5 Uncertainties of the comparison
6.2.5.1 Mixing at large scale
The comparison of this section has relied on a process model with the oxygen mass transfer model
as the governing equation. Thus it has been assumed, that the oxygen mass transfer is the limiting
rate. It was shown in Chapter 5 that the mixing times of the ALR in pilot scale were in the same
order of magnitude as the characteristic time for oxygen transfer. Mixing therefore could also be

Objective reactor comparison 113
limiting the ALR. However, for the ALR it has been shown that liquid velocity and thus mixing is
generally improved upon scale-up as function of the liquid height (Chisti et al., 1988)
0.5,l rv Z∝ (6.10)
where vl,r is the liquid velocity in the riser. A tall ALR presumably leads to a more defined liquid
circulation flow and lower circulation times. Mixing of the large scale ALR may therefore prove to
be better than observed in the pilot scale experiments and not impose a greater challenge at scale-
up.
Mixing times in industrial scale STRs are much longer than in laboratory or pilot scale. Mixing
times might be in the range 150-250 s, and the mixing time is certainly a function of agitation
intensity (Li et al., 2002). Furthermore it is well known that increasing aspect ratio leads to longer
mixing times and the following relation has been suggested for both radial and axial flow impellers
(which have approximately half the mixing time of radial impellers) (Cooke et al., 1988)
( )2.43mix /t H T∝ (6.11)
Eq. (6.11) clearly shows that mixing should be considered if the aspect ratio of the STR is increased
in the effort to increase energy efficiency of the fermentor system. The effect of longer mixing
times could be studied using a scale-down model like described in the literature (Enfors et al., 2001)
6.2.5.2 Capital cost estimations
It is quite clear that the total capital costs of an actual enzyme production facility are larger than
estimated here. It has been estimated that the purchased and installed equipment (as considered
here) constitutes 30% of the total capital investment of a new facility (Peters et al., 2003). Therefore
the absolute numbers in this work cannot be used for direct comparison.
The specific cost of fermentation vessels is assumed to decrease with a negative exponent of 0.4 of
the fermentor weight. There are however upper limits to the size and thickness of fermentors that
can be constructed. These limits include practical issues such as the feasibility of transporting the
fermentors, physical limits of steel rolling mills, and the limits of the thickness of steel that is to be
welded. The cost of fermentors therefore might not decrease with scale as assumed in Eq. (6.5) and
some fermentor configurations may not be possible to construct at all. The cost of fermentors is
furthermore not only a function of the fermentor weight. For very tall fermentors, custom-made
support for the fermentor and i.e. enforced foundations are likely to add significantly to the cost.
The cost of the cooling system is here included in the agitator cost price and therefore not included
in the ALR capital costs. However it might not be very large due to the cooling effect of the
evaporation of water and the possible co-location with other facilities.

114 Chapter 6
In this analysis a default fermentation time was specified and used for all cases. To complete the
analysis, the optimal fermentation time (including down time) should be determined for each
fermentor configuration and considered in the analysis.
Finally, in this analysis the economy of scale is considered in the scaling exponents of Table 6.1.
However, the cost function does not include construction expenses and the cost for engineering and
supervision. These expenses decrease with the number of fermentors being installed and create a
benefit of multiple units instead of a single larger volume.

Chapter 7
Overall conclusions and suggestions for future work
7.1 Overall conclusions
The production of cellulases in submerged fermentations of Trichoderma reesei has been studied in
pilot scale. Fed-batch fermentations were carried out in the traditional STR and in one alternative
configuration, the ALR. A mechanistic model has been developed to describe the process of the fed
batch fermentation. The model consists of four interchangeable parts: 1) the reaction equation, 2) a
mass transfer correlation, 3) a viscosity prediction, and 4) a mathematical description of the process
including the process control variables.
For the STR, the model proved to describe the fermentation process well for a range of conditions
applied including agitation intensity from 1.5-15 kW/m3, aeration rates from 96-320 NL/min, and
headspace pressure from 0.1-1.3 barg. In the ALR, the model covers superficial gas velocities in the
riser from 0.02-0.06 m/s and a headspace pressure from 0.1-1.1 barg. For both technologies it was
shown that the energy efficiency of the fermentation process is a function of the process conditions.
In general, the efficiency of the process is inversely proportional to the productivity. This relation
was predicted successfully by the process model.
Nine fermentations were carried out using the ALR technology. The strain of T. reesei exhibited the
same yield coefficients in the ALR as measured in the STR. The rheological properties however
were shown to be slightly different functions of the biomass concentration than in the STR. The
viscosity model for the ALR model was revised based on this new knowledge. The mass transfer
correlation for the ALR was approximately 20% lower than the corresponding literature correlation.
A viscosity term was incorporated in the mass transfer correlation with an exponent of -0.18,
indicating a less adverse effect of viscosity than in the STR. An increase of viscosity of e.g. 0.020
Pa.s “only” results in a mass transfer reduction of 40%. The mixing time for the ALR
configurations tested in pilot scale was measured in viscous fluids with properties resembling those
of the fermentation broth. The mixing time was estimated in the range 40-60 s.
When different fermentation technologies are compared, it is of great importance to consider the
total power consumption of the system. The approach often used in the literature is based on the
power dissipated to the fermentation broth. If a technology is selected on these grounds, the energy
consumption at large scale might be underestimated considerably.

116 Chapter 7
The process model was used to identify the optimal reactor design and process conditions for the
ALR and the STR based on oxygen transfer. The cost function included capital costs for the
fermentor, agitator, and compressor and running costs for electricity and nutrients. Large volumes
combined with low power inputs lead to lower overall cost of oxygen transfer. It was shown that
depending on the design and process conditions up to 22% of the electricity cost may be saved,
while the cost for nutrients remains the largest contributor to the overall cost. Mixing was not
considered in the comparison but mixing may be improved upon scale-up in the ALR, while for the
STR mixing is impaired at lower energy inputs and larger scale.
7.2 Suggestions for future work
7.2.1 Focus on energy efficiency
The comparison between the two technologies investigated in this thesis suggests that the energy
consumption might be reduced up to 22% by a change in technology from the optimal STR
configuration to the optimal ALR configuration. The ALR has a lower specific productivity and
thus demands a larger total vessel volume to maintain the same enzyme production rate.
However, the energy consumption at present represents a relatively minor part of the total cost of
enzyme production so a fiscal motive for technology chance is missing. A large part of the total cost
is constituted by nutrients, and the studies performed in the frame of this thesis have shown that the
consumption of nutrients is independent of process conditions and fermentation technology.
Development of even more efficient strains might however lead to improved yield coefficients in
the future.
The future electricity price and the increasing focus on energy efficiency might lead to changes in
the enzyme production. The development in average US electricity price is shown in Figure 7.1. In
the 1970s much work around optimization of bioreactor operation and design was carried out, and
there again seems to be focus on this area. If energy costs increase, it would raise the incentive to
converge to less energy consuming technologies and processes.
The increased focus on energy efficiency could also play a role in the future choice of technologies.
For example, the European Commission has set a target for 2020 of saving 20% of its primary
energy consumption compared to the projections (European Commision, 2011). Higher energy
efficiency is claimed to enhance security of energy supply and to reduce emissions of greenhouse
gas and other pollutants. Furthermore, a number of companies now openly report their energy
consumption and CO2 emissions (e.g., Wall-Mart: http://walmartstores.com/sustainability/ and
Novozymes: http://report2011.novozymes.com/). It is not unlikely that factors such as energy
efficiency and energy savings can be competitive parameters that some companies can use to
increase market shares.

Conclusions and future work 117
Figure 7.1. Development in US electricity price since 1973 (cents per kWh including taxes). The price is the annually
average retail price of electricity for the industrial sector. Prices vary over time and by locality due to the availability of
power plants and fuels, local fuels costs, and pricing regulation and structures. Source: U.S. Energy Information
Administration, www.eia.gov/energyexplained/index.cfm?page=electricity_factors_affecting_prices (accessed March
4th 2012)
7.2.2 Development of a detailed airlift reactor process design
This thesis contains a preliminary process design of cellulase production in the ALR. Compared
with the STR, the total cost efficiency of the ALR was found to be lower based on capital costs and
electricity costs, while the nutrient costs were the same. Any commercial producer must develop a
detailed process design for a plant, which involves many other factors such as plant location,
downstream operations, and waste management systems. Those factors depend on the business
strategy and possible co-location with customers and suppliers. All of the above considerations may
influence the choice of technology.
It is assumed here that a change in technology would only be considered for the construction of
future enzyme production facilities. In the development of a detailed process design, a number of
refinements to the cost estimation must be considered. The estimation of the capital investment
must include direct costs such as land, buildings, piping, electrical systems, and instrumentation as
well as indirect costs such as engineering and supervision, construction expenses, and contingency
(Peters et al., 2003). The estimation of the manufacturing costs must furthermore include all raw
material costs, operating labor, and maintenance (Peters et al., 2003).
Of the abovementioned factors, it is likely that there are differences between the STR and the ALR
1970 1975 1980 1985 1990 1995 2000 2005 2010 2015
1
2
3
4
5
6
7
8
9
10
Year
Cents per kWh

118 Chapter 7
which have not been included in this work. For example the labor requirements for the larger ALRs
might be bigger. It should be the task of experienced project planners and plant engineers to
estimate these costs and provide a more detailed process design.
Finally it will be the task of the managements of the companies or collaborative consortia of
companies to decide upon the future enzyme production technology. The STR is very well known
and used from laboratory scale through pilot plant scale to production scale. The ALR has been -
and is currently - used in production scale of various biotechnological processes, but some
uncertainty is definitely involved with regard to its introduction as the main production technology
for industrial enzymes. The ALR has a lower probability of mechanical failure and likelihood of
loss of sterility. The ALR is less flexible than the STR in the sense, that power input is constrained
by the aeration capacity of the fermentor.
7.2.3 Airlift reactor scale up
If decision should be taken to explore the use of the ALR in production scale, an approach to
maximizing the probability of a successful result is proposed here. It seems that the development
within computational fluid dynamics (CFD) has now reached a level of maturity that makes it
useful for bioreactor design and optimization. CFD utilizes computer power to make numerical
simulations and predictions of fluid flow, heat, mass, species concentration, and momentum transfer
in a model system (Revstedt et al., 1998). CFD models are based on the conservation statements for
each quantity transported with the flow, and this is calculated for the whole volume of the fluid
which is subdivided into small control volumes (Brown, 2009). While the use of CFD is certainly a
task of experienced analysts, it seems that much useful work can be done with CFD now. A recent
article describes for example how a CFD model of an ALR can be coupled with a growth model of
Trichoderma reesei using the open-source CPD package OpenFOAM (Bannari et al., 2012).
However, a major concern surrounding the use of CFD should be validation of the computer
simulations, which is not always easy.
Based on the data collected in this thesis, it could be possible to validate a CFD model for the
current ALR configuration including the non-Newtonian rheology of the fermentation broth
(ANSYS Inc., 2011). The obtained data for mixing time and oxygen mass transfer could serve as
basis for this validation (see Figure 7.2 for an example of a CFD model). Next, a CFD simulation of
the production scale ALR could be created as well. The CFD model could serve as a tool in
determining the optimal engineering design of the production scale ALR by prediction of various
scale-up effects. The technical problems to be overcome also include the design and position of the
draft tube or split baffle, and the design of the sparger. The development of reliable CFD model
requires appropriate software and expertise.

Conclusions and future work 119
Figure 7.2. Example of CFD interpretation of the liquid flow pattern in the ALR1 configuration using the software
ANSYS. CFD model kindly provided by Ulrich Krühne, Department of Chemical and Biochemical Engineering at the
Technical University of Denmark.
Finally, it is advised to construct a demonstration ALR that can serve as validation of the models.
Such a vessel should have a relevant geometry and size representative of the hydrodynamics of the
proposed final design. Experiments with production strains should be carried out in order to
investigate the possible sensitivity to pCO2.
7.2.4 Optimization of the stirred tank reactor
If the STR is used as the future enzyme production technology, this work has proven that the STR
can be operated with varying efficiency and productivity. While it is certain that mixing is impaired
at lower agitation intensities, energy efficiency is increased as long as mass transfer of oxygen is the
limiting rate. Considering the scale of operation, it is worthwhile to consider the design and process
conditions of future facilities using process models like the ones shown in this work.
The analysis suggests that the fermentor volume could be increased for lower overall costs, while

120 Chapter 7
the agitation intensity could be decreased. In addition to the effect on mixing performance, higher
fermentor volumes also decrease the flexibility of the production facility and impact the design of
the recovery process. All of such diverted effects must also be considered before taking a decision
on changing the current enzyme production technology.

Appendix


Appendix 123
Appendix A: Supplementary data for chapter 5
Rheological characterization
A number of different proportionality constants for Eq. (5.2) have been suggested in the literature as
shown in Table A.1, the disparity among the constants is large. It is generally agreed that the correct
solution is still to be found (Chisti, 1989; Merchuk and Gluz, 2002). Here, the different
proportionality constants will be compared in the presentation of the rheological characterization of
the fermentation broth.
Table A.1. Effective (average) shear rate in bubble columns as a function of superficial gas velocity for three studies.
Reference Correlation Variation of n Equation Derivation
Nishikawa et al (1977) eff g5000vγ =ɺ 1-0.72 (5.2a) Heat transfer
Henzler (1980) eff g1500vγ =ɺ 0.82-0.38 (5.2b) Lit. kLa data
Schumpe and Deckwer (1987) eff g2800vγ =ɺ 1-0.18 (5.2c) Own kLa data
Combination of the three different riser superficial gas velocities and the three proportionality
constants reveals that the effective shear rates of this study are estimated between 45 and 250 1/s.
The rheological characterization was performed in the span 10-300 1/s which thus covers the
expected shear rate range. In Figure A.1 the measured shear stress is shown as a function of shear
rate for an arbitrarily chosen fermentation sample. Also the calculated apparent viscosity is shown.
The broth shows shear thinning behavior as the apparent viscosity decreases with the shear rate. The
apparent viscosity in the range of 45-250 1/s decreases from 0.023 Pa.s to 0.013 Pa.s.
The power law model
nKτ γ= ɺ (A.1)
and the Herchel-Bulkley model (Nienow, 1998)
HBy HB nKτ τ γ= + ɺ (A.2)
were tested for their ability to describe the rheological properties of the fermentation broth. The
rheological parameters K, n, τy, KHB, and nHB were estimated using least squares regression. Both
models proved to describe the observed rheological behavior with high values of R2 (0.9942 and
0.9991, respectively). In the shear rate range 45-250 1/s there is little difference between the two
models. For example, assuming an effective shear rate of 168 1/s the difference between the models
is less than 2%. It should be remembered that the parameters K and n of Eq. (A.1) are highly
correlated and so are τy, KHB, and nHB of Eq. (A.2) and therefore direct comparison between the
parameters obtained for each model does not seem reasonable (Petersen et al., 2008).

124 Appendix
Figure A.1. Example of the rheological characterization of the fermentation broth (ALR2.2). 14 steady state
measurements of the shear stress (left axis) were made within the shear rate range of 10-300 1/s. The calculated
apparent viscosity is also shown (right axis). Two rheological models were tested for their ability to describe the
observed shear thinning behavior: the power law and the Herschel-Bulkley model (R2 = 0.9942 and R2 = 0.9991,
respectively). Assuming an effective shear rate of 168 1/s (vg,r = 0.06 m/s and Eq. (5.2c)) the model predicted effective
viscosity is 0.0152 and 0.0149, respectively (<2% difference).
The apparent viscosity calculated by both models for all measurements for ALR2.2 is shown as
function of fermentation time in Figure A.2. The difference between the two models was always
below 5% and on average the difference was 3.1%. Since it can be seen from Figure A.1 that the
yield stress of the fermentation broth is quite small (<0.5 Pa.s), it seems reasonable therefore to use
the power law model. The power law has one parameter less than the Herschel-Bulkley model but
describes the rheological behavior in the relevant shear rate range equally well. The important
parameter here is the apparent viscosity and not the actual rheological parameters.
The result of the differences between the proportionality coefficients in Eq. (5.2A-C) can be seen in
Figure A.3.. The size of the proportionality constant primarily impacts the relative position of the
viscosity curve. The difference between the apparent viscosities can be up to 0.010 Pa.s. It was
decided to use Eq. (5.2C), the least radical of the three relations, in this work.
0 50 100 150 200 250 300
0.5
1
1.5
2
2.5
3
3.5
4
4.5
5
τ (Pa)
γ (1/s)
←→
0 50 100 150 200 250 300
0.01
0.02
0.03
0.04
0.05
0.06
0.07
0.08
0.09
0.1
µ app (Pa.s)
τ = 0.1305γ0.5803
τ = 0.3645 + 0.0456γ0.7507

Appendix 125
Figure A.2. Apparent viscosity determined by regression of the rheological measurements by the power law and the
Herschel-Bulkley model shown as function of time for ALR2.2 (γ 5eff = 168 1/s). The average difference between the
predictions is 3.1%.
Figure A.3. Apparent viscosity determined by use of three different proportionality coefficients in Eq. (5.3). The
fermentation is ALR2.2 and the power law model is used.
0
0.005
0.01
0.015
0.02
0.025
0.03
0.035
0.04
0.045
0.05
Time
µ app (Pa.s)
Power law
Herschel-Bulkley
0
0.005
0.01
0.015
0.02
0.025
0.03
0.035
0.04
0.045
0.05
Time
µ app (Pa.s)
γeff = 5000vg,r
γeff = 1500vg,r
γeff = 2800vg,r

126 Appendix
Rheological measurements during fermentation
The power law model was applied to all rheological measurements. The rheological development
during the fermentation is shown in Figure A.4-Figure A.6. The consistency index varies quite
significantly between the fermentations and it also appears in some fermentations that K fluctuates
quite a lot (Figure A.4). Generally K increases during the course of fermentation to values up to 0.4
Pa.sn. The flow behavior index development with fermentation time is depicted in Figure A.5. At
the fermentation start n is close to 1 and decreases to values between 0.4 and 0.8 towards the end of
the fermentations. Also n seems to fluctuate for some fermentations; note however that as K and n
are highly correlated, the values of each of the parameters are not as important as the apparent
viscosity calculated based on both of these. The apparent viscosity is shown as function of
fermentation time for all ALR fermentations in Figure A.6. vg,r ranged from 0.02-0.06 m/s and the
effective shear rate was calculated based on Eq. (5.2C). The apparent viscosity ranged during the
course of fermentation from values around 0.001 Pa.s at the fermentation start up to values of 0.030
Pa.s.
Figure A.4. Measurements of the consistency index K as function of fermentation time for all ALR fermentations.
0
0.05
0.10
0.15
0.20
0.25
0.30
0.35
0.40
0.45
0.50
Time
K (Pa.sn)

Appendix 127
Figure A.5. Measurements of the flow behavior index n as function of fermentation time for all ALR fermentations.
Figure A.6. Measurements of the apparent viscosity as function of fermentation time for all ALR fermentations. Note
that the effective shear rates varied and were calculated based on Eq. (5.2C).
The observed rheological behavior with increasing non-Newtonian properties (decreasing n) and
increasing apparent viscosity is similar to other data from filamentous fungi in the literature (Marten
et al., 1997; Wang et al., 1979). Compared to the industrial strain of A. oryzae previously studied in
a similar approach (using the STR), the increase in apparent viscosity and K for this strain of T.
0
0.2
0.4
0.6
0.8
1
Time
n (-)
0
0.005
0.010
0.015
0.020
0.025
0.030
0.035
0.040
0.045
0.050
Time
µ app (Pa.s)

128 Appendix
reesei is considerably smaller (Albaek et al., 2011).
A viscosity model
It has previously been shown that various rheological parameters can be correlated with biomass
concentration (Albaek et al., 2011; Petersen et al., 2008). The development of biomass
concentration as function of fermentation time is shown in Figure A.7. The biomass concentration is
rather low at the fermentation start as the seed material constitutes only about 10% of the broth
volume. During the course of fermentation the biomass concentration increases manyfold although
to quite different levels for the different fermentations. The different levels of biomass
concentration are also expected since very different process conditions were applied. As seen from
Table 5.4 the biomass formation (on average) followed the amount of carbon substrate fed to the
fermentation.
Figure A.7. Biomass concentration shown as function of fermentation time. Note that the units are not shown for
proprietary reasons.
The consistency index K and the flow behavior index n are shown as function of biomass
concentration in Figure A.8(A+B). As K tends to increase rapidly with biomass concentration, X,
the power function of Eq. (2.10) has been widely used to describe the relationship between K and X
for a range of fermentations with filamentous fungi (Olsvik and Kristiansen, 1994). A logistic
equation for the dependence of K on biomass concentration has been proposed by Goudar et al.
(1999)
Time
Biomass concentration (g DW/L)

Appendix 129
( )0
Of
1 1cX
cXK eK K eK
=− −
(A.3)
where K0 and Kf can be considered representative of the initial and final values of K, and c is a
constant (Goudar et al., 1999).
Both Eq. (2.10) and (A.3) with parameters estimated by least squares regression using the
experimental values are shown in Figure A.8(A). At low biomass concentrations the experimental K
values are <0.05. At higher biomass concentrations some low K values are still observed while Kf ~
0.25. Naturally, neither Eq. (2.10) nor (A.3) are able to describe all of the data, since the data are
quite scattered.
Figure A.0.1. A: K as function of biomass concentration for all ALR fermentations Eq. (2.10) and (A.3) with
parameters estimated by least squares regression are both shown. B: n as function of biomass concentration for all ALR
fermentations. Eq. (2.11) and (A.4) with parameters estimated by least squares regression are both shown. nf was
determined to be -0.37.
For n, Eq. (2.11) was used in Chapter 2 to describe the dependence of n on biomass concentration.
Goudar et al. (1999) proposed an equation with a final value of n
( )ff 1
1 enn n dX
−= +
+ (A.4)
where d and e are constants and nf is representative of the final value of n (Goudar et al., 1999). Eq.
(A.4) proved to fit well to a range of literature data collected by Goudar et al. (1999).
0
0.05
0.10
0.15
0.20
0.25
0.30
0.35
0.40
0.45
0.50
Biomass concentration (g DW/L)
K (Pa.sn)
A
K = C1X1.40
K = K0ecX/(1-K
0/K
f(1-ecX))
0
0.2
0.4
0.6
0.8
1
1.2
Biomass concentration (g DW/L)
n (-)
B
n = C2X-0.19
n = nf+(1-n
f)/(1+(dX)e)

130 Appendix
In Figure A.8(B), Eq. (2.11) and (A.4) with parameters estimated by least squares regression are
shown as well as the experimental data. n seems to decrease with increasing biomass concentration,
but the data are quite scattered. The two equations predict a very similar trend for n, but none of
them describes all the experimental data. It should be noted that the final value of n, nf, predicted by
Eq. (A.4) was -0.37, which does not make sense from a rheological point of view.
In order to compare the prediction power of Eq. (2.10)/(2.11) with Eq. (A.3)/(A.4) the two parity
plots of the experimental data versus the model prediction are shown in Figure A.9(A) and Figure
A.9(B), respectively. Both models generally overpredict the apparent viscosity in the low-viscosity
region, and about 45% of the experimental data are within ±25% of either model. The mean square
error was calculated in order to compare the predictive power of each model and it was found to be
3.17·10-5 and 3.00·10-5, respectively. The mean absolute error of the viscosity models are 0.0056
and 0.0055 Pa.s, respectively. To put the difference between the model prediction and the measured
viscosity in perspective it is worth remembering, that the effective shear rate in this section has been
estimated using Eq. (5.2C). The difference in the proportionality constants can be up to 0.010 Pa.s.
The models thus seem to describe the experimental data reasonably well considering the uncertainty
that exist around µapp.
Figure A.9. Parity plots for two proposed viscosity models. The parity line (bold) is shown ± 25%. A: Measured
apparent viscosity versus modeled apparent viscosity using Eq. (2.10) and (2.11). Mean square error: 3.17·10-5 B:
Measured apparent viscosity versus modeled apparent viscosity using Eq. (A.3) and (A.4). Mean square error: 3.00·10-5.
As the mean square error for the two models are very similar, it was decided to use the simpler
model described by Eq. (2.10) and (2.11), mainly for two reasons: it contains only four constants in
contrast to six variables and the constants of the second model do not make sense in a rheological
context as intended. The exponents of Eq. (2.10) and (2.11) (α, β) were 1.40 and -0.19, respectively,
0 0.01 0.02 0.03 0.04 0.050
0.01
0.02
0.03
0.04
0.05
Modeled µapp (Pa.s)
Measured µapp (Pa.s)
A
0 0.01 0.02 0.03 0.04 0.050
0.01
0.02
0.03
0.04
0.05
Modeled µapp (Pa.s)
Measured µapp (Pa.s)
B

Appendix 131
while the constants C1 and C2 are not given for proprietary reasons. α has previously been shown
vary within the range 0.7-3.3 dependent on the type of strain and the mycelial morphology (Olsvik
and Kristiansen, 1994; Petersen et al., 2008).
Additional data for the mass transfer correlation
It was shown in the section on rheological characterization that the use of different proportionality
constants in Eq. (5.3) could lead to quite different apparent viscosities. In Figure A.10 the measured
kLa values are shown as function of three different sets of constants of Eq. (5.5) corresponding to
the different proportionality constants. For all three proportionality constants it is seen that the
correlation of Eq. (5.5) is able to describe the experimental kLa values with satisfactory accuracy.
Figure A.10. Impact of three proportionality constants on Eq. (5.5). In each case the experimental kLa is shown as
function of Eq. (5.5) with constants estimated by least squares regression. A: Cs =5000, Eq. (5.2A). Regression curve
slope: 1.04 (R2 = 0.83). B: Cs =1500, Eq. (5.2B). Regression curve slope: 1.04 (R2 = 0.82).C: Cs =2800, Eq. (5.2C).
Regression curve slope: 1.04 (R2 = 0.83).
The exponents (a, b) of Eq. (5.5) were estimated to be in the narrow ranges 0.70-0.72 and (-0.20)-(-
0.16), respectively, for the three proportionality constants investigated. As expected from Eq. (2.3)
and Eq. (5.2A-C), the larger the proportionality constant, the smaller difference in apparent
viscosities is expected at different superficial gas velocities. This was confirmed in Figure A.3.. The
numerically larger exponent a (-0.20) for Cs = 5000 is thus explained since the differences in
apparent viscosities were smaller for this proportionality constant (compared e.g. with Cs = 1500
where the viscosity varied to a larger degree and a = -0.16).
It was decided to continue the use of Cs = 2800 from Eq. (5.2C) in the further investigations, and
the corresponding constants 196, 0.71, and -0.18 in the mass transfer correlation Eq. (5.5). The
effect of the viscosity increase during the course of fermentation can thereby easily be quantified.
10 5010
50
100
Measured kLa (1/h)
γeff = 5000vg,r
kLa = 180v
g,r0.72µapp
-0.20
A
10 50γeff = 1500vg,r
kLa = 218v
g,r0.70µapp
-0.16
B
10 50 100γeff = 2800vg,r
kLa = 196v
g,r0.71µapp
-0.18
CALR1 data
ALR2 data
Model ± 30%

132 Appendix
Use of the other proportionality constants proposed in the literature yields the same information.
Mixing Time Measurements
In order to ensure that the addition of the tracer did not damage the rheological properties of the
xanthan gum solutions, rheological characterizations were performed similarly to the
characterizations of the fermentation broth. The results of these measurements are shown in Figure
A.11. The xanthan gum solutions were shear thinning with rheological properties as shown in Table
A.2. The 0.125% xanthan solution resembled the properties of the fermentation broth closest.
During the mixing time measurements up to 2% (v/v) of the concentrated NaCl tracer was injected,
but even addition of 5% (v/v) does not significantly alter the rheology of the xanthan gum solution.
Figure A.11. Rheological characterization of the shear thinning xanthan gum solutions used for mixing time
measurements. In the experiments <2% (v/v) of the NaCl tracer was injected. Addition of 5% (v/v) of the tracer does
not significantly alter the rheology of xanthan gum solutions.
0 50 100 150 200 250 3000
0.5
1
1.5
2
2.5
3
3.5
4
4.5
5
γ (1/s)
τ (Pa)
0.125% Xanthan
0.125% Xanthan + 5% (v/v) tracer
0.25% Xanthan
0.25% Xanthan + 5% (v/v) tracer

Appendix 133
Table A.2. Rheological characterization of the xanthan gum solutions used for mixing time measurements. The power
law is used to describe the rheological behavior.
Medium K n
0.125% (v/v) xanthan gum solution 0.083 0.53
0.125% (v/v) xanthan gum solution + 5% (v/v) tracer 0.077 0.54
0.25% (v/v) xanthan gum solution 0.51 0.34
0.25% (v/v) xanthan gum solution + 5% (v/v) tracer 0.47 0.35
The conductivity readings were normalized between the initial zero value, C0, measured before the
addition and the final stable value measured after the test is complete, C∞ (Brown et al., 2004)
i 0i 0´ C CC C C∞
−=
− (A.5)
where Ci´ is the normalized conductivity. The data was finally also plotted in terms of a log
variance as a function of time (Brown et al., 2004)
( )22 tlog log ´ 1Cσ = − (A.6)
An example of the data and flow of data processing described here is shown in Figure A.12 for the
ALR2 configuration with water as medium and vg,r = 0.02 m/s. The conductivity raw data are
shown in Figura A.12(A), the normalized probe output is shown in Figure A.12(B), and the log
variance is shown in Figure A.12(C). The mixing time was determined as the time to achieve 90%
mixing. Thus the lines representing ±10% are shown with the normalized output and the line
representing 90% mixedness is shown with the log variance. The 90% mixing time in this case was
determined to be 39s.
The measurement of mixing time was complicated with the presence of the non-conductive air
bubbles, which resulted in a rather low signal to noise ratio for the viscous xanthan gum solutions.
This is an inherent disadvantage of the conductivity method when used for aerated systems
(Nordkvist, 2005). The noise caused by the air bubbles increased with the apparent viscosity. An
example is shown in Figure A.13, where the degree of mixing apparently only surpasses 80% and
the normalized probe output thus only remains within ±20%. If it assumed that mixing is a first
order process, the 90% mixing time can be calculated as
mix,90% mix,80% mix,80%lnT1 0.90V 1.43lnT1 0.80Vt t t−= =
− (A.7)

134 Appendix
Figure A.12. Mixing time measurement with water as the medium for ALR2 (vg,r = 0.02m/s) A: Conductivity. B
Normalized probe output with lines representing ±10%. C: Log variance σ2 with line representing 90% mixedness. 90%
mixing time determined to be 39 s.
-150 -100 -50 0 50 100 150 200 250 300 3506
6.5
7
7.5
8
Time (s)
Conductivity (mS/cm) A
-150 -100 -50 0 50 100 150 200 250 300 350
0
0.5
1
1.5
Time (s)
Norm
alized probe output (-)
B
+10% -10%
-150 -100 -50 0 50 100 150 200 250 300 350
-4
-2
0
Time (s)
Log variance σ 2
C
90% mixedness
39s

Appendix 135
Figure A.13. Mixing time determination with 0.125% xanthan as the medium for ALR2 (vg,r = 0.04m/s) A:
Conductivity. B Normalized probe output with lines representing ±20%. C: Log variance σ2 with line representing 80%
mixedness, tmix,80% = 49 s. The 90% mixing time was calculated using Eq. (A.7), tmix,90% = 70 s.
-150 -100 -50 0 50 100 150 200 250 300 3505
5.5
6
6.5
7
Time (s)
Conductivity (mS/cm) A
-150 -100 -50 0 50 100 150 200 250 300 350
0
0.5
1
1.5
Time (s)
Norm
alized probe output (-)
B
+20%
-20%
-150 -100 -50 0 50 100 150 200 250 300 350
-4
-2
0
Time (s)
Log variance σ 2
C
80% mixedness
49s


Appendix 137
Appendix B: Supplementary data for chapter 6
Table B.1. Cost efficiency of simulated ALR fermentations
Run nr Volume Aspect ratio vg,r Headspace
pressure Maximum
pCO2 Energy
cost Capital
cost Nutrients
cost Cost
efficiency
m3 - m/s barg mbar $/kg O2 $/kg O2 $/kg O2 $/kg O2
1 101 1.5 0.069 0 16 0.11 0.24 0.77 1.13
2 100 1.5 0.069 2 46 0.24 0.15 0.77 1.16
3 99 1.5 0.200 0 11 0.14 0.16 0.77 1.07
4 100 1.5 0.200 2 35 0.42 0.13 0.77 1.33
5 101 25.0 0.069 0 212 0.14 0.27 0.77 1.19
6 99 25.0 0.069 2 344 0.11 0.15 0.77 1.03
7 100 25.1 0.200 0 112 0.16 0.15 0.77 1.08
8 99 25.0 0.200 2 294 0.15 0.11 0.77 1.04
9 995 1.5 0.069 0 40 0.11 0.09 0.77 0.98
10 1001 1.5 0.069 2 107 0.15 0.06 0.77 0.99
11 1003 1.5 0.200 0 31 0.14 0.06 0.77 0.97
12 997 1.5 0.200 2 83 0.26 0.05 0.77 1.08
13 1000 25.0 0.069 0 412 0.14 0.11 0.77 1.03
14 1005 25.0 0.069 2 543 0.13 0.09 0.77 0.99
15 1018 21.9 0.200 0 282 0.26 0.09 0.77 1.12
16 998 25.0 0.200 2 528 0.14 0.05 0.77 0.97
17 100 13.2 0.135 1 143 0.13 0.12 0.77 1.03
18 1001 13.3 0.135 1 298 0.13 0.06 0.77 0.96
19 549 1.5 0.135 1 50 0.17 0.07 0.77 1.01
20 551 25.0 0.135 1 329 0.14 0.08 0.77 0.98
21 555 13.2 0.069 1 278 0.11 0.09 0.77 0.96
22 552 13.2 0.200 1 246 0.14 0.06 0.77 0.96
23 552 13.2 0.135 0 126 0.16 0.10 0.77 1.02
continues on next page

138 Appendix
continued from previous page
Run nr Volume Aspect ratio vg,r Headspace
pressure Maximum
pCO2 Energy
cost Capital
cost Nutrients
cost Cost
efficiency
m3 - m/s barg mbar $/kg O2 $/kg O2 $/kg O2 $/kg O2
24 550 13.3 0.135 2 360 0.13 0.06 0.77 0.96
25 554 13.3 0.135 1 257 0.13 0.07 0.77 0.97
26 554 13.3 0.135 1 257 0.13 0.07 0.77 0.97

Appendix 139
Table B.2. Cost efficiency of simulated ALR fermentations
Run nr Volume Aspect ratio P/V vg
Headspace pressure
Maximum pCO2
Energy cost
Capital cost
Nutrients cost
Cost efficiency
m3 - kW/m3 m/s barg mbar $/kg O2 $/kg O2 $/kg O2 $/kg O2
1 102 2.0 0.50 0.05 0 26 0.14 0.25 0.77 1.17
2 101 2.0 0.50 0.20 2 17 0.69 0.20 0.77 1.67
3 102 2.0 5.00 0.05 1 81 0.36 0.21 0.77 1.34
4 101 2.0 7.00 0.20 0 14 0.44 0.23 0.77 1.45
5 101 5.0 0.50 0.05 2 116 0.18 0.17 0.77 1.12
6 102 5.0 0.50 0.20 0 21 0.21 0.18 0.77 1.16
7 100 5.0 7.00 0.05 0 105 0.48 0.28 0.77 1.53
8 96 5.1 5.00 0.20 1 72 0.52 0.23 0.77 1.52
9 400 2.0 0.50 0.05 2 90 0.21 0.10 0.77 1.08
10 399 2.0 0.50 0.20 0 17 0.22 0.10 0.77 1.10
11 403 2.0 7.00 0.05 0 82 0.50 0.14 0.77 1.41
12 408 2.1 6.00 0.20 1 50 0.52 0.11 0.77 1.41
13 398 5.0 0.50 0.05 0 87 0.14 0.13 0.77 1.04
14 397 5.0 0.50 0.20 2 75 0.35 0.09 0.77 1.22
15 411 5.0 7.00 0.05 2 388 0.41 0.11 0.77 1.29
16 402 5.0 7.00 0.20 0 80 0.45 0.11 0.77 1.34
17 101 3.5 3.75 0.13 1 54 0.34 0.20 0.77 1.32
18 406 3.5 3.75 0.13 1 97 0.32 0.10 0.77 1.19
19 253 2.0 3.75 0.13 1 44 0.36 0.13 0.77 1.26
20 253 5.0 3.75 0.13 1 116 0.31 0.12 0.77 1.21
21 249 3.5 0.50 0.13 1 45 0.24 0.12 0.77 1.12
22 256 3.5 7.00 0.13 1 102 0.45 0.14 0.77 1.36
23 246 3.5 3.75 0.05 1 154 0.28 0.13 0.77 1.18
24 255 3.5 3.75 0.20 1 56 0.38 0.13 0.77 1.28
continues on next page

140 Appendix
continued from previous page
Run nr Volume Aspect ratio P/V vg
Headspace pressure
Maximum pCO2
Energy cost
Capital cost
Nutrients cost
Cost efficiency
m3 - kW/m3 m/s barg mbar $/kg O2 $/kg O2 $/kg O2 $/kg O2
25 246 3.5 3.75 0.13 0 49 0.32 0.15 0.77 1.24
26 251 3.5 3.75 0.13 2 101 0.41 0.13 0.77 1.32
27 253 3.5 3.75 0.13 1 80 0.32 0.13 0.77 1.22
28 253 3.5 3.75 0.13 1 80 0.32 0.13 0.77 1.22

Appendix 141
Figure B.1. Stirred tank reactor: Cost of oxygen transfer (contours, $/kg O2) and corresponding carbon dioxide partial
pressure (shading, mbar) as function of aspect ratio (from top to bottom: 2, 3.5, or 5, respectively), agitator power input
(y-axis), superficial gas velocity (from left: 0.05, 0.13, or 0.20 m/s, respectively), and fermentor volume (x-axis). The
head space pressure was 0 barg.

142 Appendix
Figure B.2. Stirred tank reactor: Cost of oxygen transfer (contours, $/kg O2) and corresponding carbon dioxide partial
pressure (shading, mbar) as function of aspect ratio (from top to bottom: 2, 3.5, or 5, respectively), agitator power input
(y-axis), superficial gas velocity (from left: 0.05, 0.13, or 0.20 m/s, respectively), and fermentor volume (x-axis). The
head space pressure was 2 barg.

Bibliography


Bibliography 145
Adler I, Fiechter A. 1986. Valuation of bioreactors for low viscous media and high oxygen transfer demand. Bioprocess Biosyst Eng 1:51-59.
Agger T, Spohr AB, Carlsen M, Nielsen J. 1998. Growth and product formation of Aspergillus
oryzae during submerged cultivations: verification of a morphologically structured model using fluorescent probes. Biotechnol Bioeng 57:322-329.
Albaek MO, Gernaey KV, Stocks SM. 2008. Gassed and ungassed power draw in a pilot scale 550 litre fermentor retrofitted with up-pumping hydrofoil B2 impellers in media of different viscosity and with very high power draw. Chem Eng Sci 63:5813-5820.
Albaek MO, Gernaey KV, Hansen MS, Stocks SM. 2011. Modeling enzyme production with Aspergillus oryzae in pilot scale vessels with different agitation, aeration and agitator types. Biotechnol Bioeng 108:1828-1840.
Albaek MO, Gernaey KV, Hansen MS, Stocks SM. 2012. Evaluation of the energy efficiency of enzyme fermentation by mechanistic modeling. Biotechnol Bioeng 109:950-961.
Allen DG, Robinson CW. 1989. Hydrodynamics and mass transfer in Aspergillus niger
fermentations in bubble column and loop bioreactors. Biotechnol Bioeng 34:731-740.
Allen DG, Robinson CW. 1991. Comments on the communication: On the calculation of shear rate and apparent viscosity in airlift and bubble column bioreactors. Biotechnol Bioeng 38:212-216.
Amanullah A, Blair R, Nienow AW, Thomas CR. 1999. Effects of agitation intensity on mycelial morphology and protein production in chemostat cultures of recombinant Aspergillus oryzae. Biotechnol Bioeng 62:434-446.
Amanullah A, Christensen LH, Hansen K, Nienow AW, Thomas CR. 2002. Dependence of morphology on agitation intensity in fed-batch cultures of Aspergillus oryzae and its implications for recombinant protein production. Biotechnol Bioeng 77:815-826.
ANSYS Inc. 2011. ANSYS 14.0 Capabilities Chart. www ansys com.
Atkinson B, Mavituna F. 1991. Biochemical engineering and biotechnology handbook. 2nd ed. New York: Macmillan Publishers Ltd.
Audet J, Thibault J, LeDuy A. 1996. Polysaccharide concentration and molecular weight effects on the oxygen mass transfer in a reciprocating plate bioreactor. Biotechnol Bioeng 52:507-517.
Bailey JE. 1980. Biochemical reaction engineering and biochemical reactors. Chem Eng Sci 35:1854-1886.
Bannari R, Bannari A, Vermette P, Proulx P. 2012. A model for cellulase production from Trichoderma reesei in an airlift reactor. Biotechnol Bioeng Accepted article, doi: 10 1002/bit 24473.
Barker T, Worgan J. 1981. The application of air-lift fermenters to the cultivation of filamentous

146 Bibliography
fungi. Appl Microbiol Biotechnol 13:77-83.
Bartholomew WH. 1960. Scale-up of submerged fermentations. Adv Appl Microbiol 2:289-300.
Berka RM, Cherry JR. 2006. Enzyme biotechnology, In: Ratledge C, Kristiansen B, editors. Basic Biotechnology. Cambridge: Cambridge University Press. p 477-498.
Berka RM, Grigoriev IV, Otillar R, Salamov A, Grimwood J, Reid I, Ishmael N, John T, Darmond C, Moisan MC, Henrissat B, Coutinho PM, Lombard V, Natvig DO, Lindquist E, Schmutz J, Lucas S, Harris P, Powlowski J, Bellemare A, Taylor D, Butler G, de Vries RP, Allijn IE, van den Brink J, Ushinsky S, Storms R, Powell AJ, Paulsen IT, Elbourne LDH, Baker SE, Magnuson J, LaBoissiere S, Clutterbuck AJ, Martinez D, Wogulis M, de Leon AL, Rey MW, Tsang A. 2011. Comparative genomic analysis of the thermophilic biomass-degrading fungi Myceliophthora thermophila and Thielavia terrestris. Nat Biotech 29:922-927.
Bevan MW, Franssen MCR. 2006. Investing in green and white biotech. Nat Biotech 24:765-767.
Blenke H. 1979. Loop reactors, In: Ghose T, Blakebrough N, Fiechter A, editors. Advances in Biochemical Engineering, Volume 13. Berlin/Heidelberg: Springer. p 121-214.
Brauner N, Barnea D. 1986. Slug/Churn transition in upward gas-liquid flow. Chem Eng Sci 41:159-163.
Brown DAR. 2009. Computational Fluid Dynamics. Course materials: Improving Mixing Processes. BHR Group Limited.
Brown DAR, Jones PN, Middleton JC, Papadopoulus G, Arik EB. 2004. Experimental Methods, In: Paul EL, Atiemo-Obeng V, Kresta SM, editors. Handbook of Industrial Mixing: Science and Practice. Hoboken: John Wiley & Sons, Inc. p 145-201.
Charles M. 1985. Fermentation scale-up: problems and possibilities. Trends Biotechnol 3:134-139.
Chen JH, Hsu YC, Chen YF, Lin CC. 2003. Application of gas-inducing reactor to obtain high oxygen dissolution in aeration process. Water res 37:2919-2928.
Chisti Y. 1989. Airlift bioreactors. London: Elsevier.
Chisti Y, Halard B, Moo-Young M. 1988. Liquid circulation in airlift reactors. Chem Eng Sci 43:451-457.
Chisti Y, Moo-Young M. 1987. Airlift reactors: characteristics, applications and design considerations. Chem Eng Commun 60:195-242.
Chisti Y. 2003. Bioreactor design, In: Ratledge C, Kristiansen B, editors. Basic biotechnology. Cambridge: Cambridge University Press. p 181-200.
Chisti Y, Jauregui-Haza UJ. 2002. Oxygen transfer and mixing in mechanically agitated airlift bioreactors. Biochem Eng J 10:143-153.

Bibliography 147
Chisti Y, Kasper M, Moo-Young M. 1990. Mass transfer in external-loop airlift bioreactors using static mixers. Can J Chem Eng 68:45-50.
Chisti Y, Moo-Young M. 1989. On the calculation of shear rate and apparent viscosity in airlift and bubble column bioreactors. Biotechnol Bioeng 34:1391-1392.
Cooke, M., Middleton, J. C., and Bush, J. R. 1988. Mixing and mass transfer in filamentous fermentations. 2nd International conference on bioreactors. Cambridge, UK.p. 37-64.
Cooney CL, Wang DIC, Mateles RI. 1969. Measurement of heat evolution and correlation with oxygen consumption during microbial growth. Biotechnol Bioeng 11:269-281.
Curran JS, Smith J, Holms W. 1989. Heat-and-power in industrial fermentation processes. Appl Energy 34:9-20.
Danish AgriFish Agency (former Direktoratet for FødevareErhverv). 2006. Biotechnology strategy for non-food and feed. Copenhagen, Denmark
Dashtban M, Schraft H, Qin WS. 2009. Fungal bioconversion of lignocellulosic residues; opportunities & perspectives. Int J Biol Sci 5:578-595.
Davenport R. 2008. Chemicals & polymers from biomass. Ind biotechnol 4:59-63.
Deckwer WD, Nguyen-Tien K, Schumpe A, Serpemen Y. 1982. Oxygen mass transfer into aerated CMC solutions in a bubble column. Biotechnol Bioeng 24:461-481.
Dodge T. 2009. Production of industrial enzymes, In: Whitehurst RJ, van Oort M, editors. Enzymes in Food Technology, 2nd edition. Oxford, UK: Wiley-Blackwell. p 44-58.
Enfors O, Jahic M, Rozkov A, Xu B, Hecker M, Jürgen B, Krüger E, Schweder T, Hamer G, O'Beirne D, Noisommit-Rizzi N, Reuss M, Boone L, Hewitt C, McFarlane C, Nienow A, Kovacs T, Trägårdh C, Fuchs L, Revstedt J, Friberg PC, Hjertager B, Blomsten G, Skogman H, Hjort S, Hoeks F, Lin Y, Neubauer P, der Lans Rv, Luyben K, Vrabel P, Manelius Å. 2001. Physiological responses to mixing in large scale bioreactors. J Biotechnol 85:175-185.
European Commision. 2011. Energy efficiency plan 2011 (http://ec.europa.eu/energy/efficiency/action_plan/action_plan_en.htm).
Fukuda H, Shiotani T, Okada W, Morikawa H. 1978. Oxygen transfer in a new tower bioreactor containing a draft tube and perforated plates. J Ferment Technol 56:619-625.
Garcia-Ochoa F, Gomez E. 2009. Bioreactor scale-up and oxygen transfer rate in microbial processes: An overview. Biotechnol Adv 27:153-176.
Gasner LL. 1974. Development and application of the thin channel rectangular air lift mass transfer reactor to fermentation and waste-water treatment systems. Biotechnol Bioeng 16:1179-1195.
Godbole SP, Schumpe A, Shah YT, Carr NL. 1984. Hydrodynamics and mass transfer in non-

148 Bibliography
Newtonian solutions in a bubble column. AIChE J 30:213-220.
Goudar CT, Strevett KA, Shah SN. 1999. Influence of microbial concentration on the rheology of non-Newtonian fermentation broths. Appl Microbiol Biotechnol 51:310-315.
Gow JS, Littlehailes JD, Smith SRL, Walter RB. 1975. SCP production from methanol: bacteria, In: Tannenbaum SR, Wang DIC, editors. Single-cell protein II. Cambridge: MIT Press. p 370-384.
Grajek W. 1987. Comparative studies on the production of cellulases by thermophilic fungi in submerged and solid-state fermentation. Appl Microbiol Biotechnol 26:126.
Green DW, Perry RH. 2008. Perry's Chemical Engineers' Handbook. 8th Edition. New York, USA: McGraw-Hill.
Grenville RK, Nienow AW. 2004. Blending of Miscible Liquids, In: Paul EL, Atiemo-Obeng V, Kresta SM, editors. Handbook of Industrial Mixing: Science and Practice. Hoboken: John Wiley & Sons, Inc. p 507-539.
Grima EM, Fernández JMS, Fernández FGA. 2009. Microalgae, mass culture methods, In: Flickinger MC, editor. Encyclopedia of Industrial Biotechnology. John Wiley & Sons, Inc.
Gschwend K, Fiechter A, Widmer F. 1983. Oxygen transfer in a loop reactor for viscous non-Newtonian biosystems. J Ferment Technol 61:491-498.
Hari-Prajitno D, Mishra VP, Takenaka K, Bujalski W, Nienow AW, McKemmie J. 1998. Gas-liquid mixing studies with multiple up- and down-pumping hydrofoil impellers: Power characteristics and mixing time. Can J Chem Eng 76:1056-1068.
Harris PV, Welner D, McFarland KC, Re E, Navarro Poulsen JC, Brown K, Salbo R, Ding H, Vlasenko E, Merino S, Xu F, Cherry J, Larsen S, Lo Leggio L. 2010. Stimulation of lignocellulosic biomass hydrolysis by proteins of glycoside hydrolase family 61: structure and function of a large, enigmatic family. Biochemistry 49:3305-3316.
Hatch RT. 1975. Fermentor design, In: Tannenbaum SR, Wang DIC, editors. Single cell protein II. Cambridge, MA: MIT Press. p 46-68.
Heim A, Rzyski E, Stelmach J, Kraslawski A. 1995. Aeration of bioreactors by self-aspirating impellers. Chem Eng J Biochem Eng J 58:59-63.
Heinzle E, Biwer AP, Cooney CL. 2006. Development of Sustainable Bioprocesses. Hoboken: John Wiley & Sons, Inc.
Herbst H, Schumpe A, Deckwer WD. 1992. Xanthan production in stirred tank fermenters: Oxygen transfer and scale-up. Chem Eng Technol 15:425-434.
Hewitt CJ, Nienow AW. 2007. The scale-up of microbial batch and fed-batch fermentation processes. Adv Appl Microbiol 62:105-135.

Bibliography 149
Heyouni A, Roustan M, Do-Quang Z. 2002. Hydrodynamics and mass transfer in gas-liquid flow through static mixers. Chem Eng Sci 57:3325-3333.
Hines DA, Bailey M, Ousby JC, Roesler FC. 1975. The ICI deep shaft aeration process for effluent treatment. Inst Chem Engng Symp Ser 41:D1-D10.
Hölker U, Höfer M, Lenz J. 2004. Biotechnological advantages of laboratory-scale solid-state fermentation with fungi. Appl Microbiol Biotechnol 64:175-186.
Hölker U, Lenz J. 2005. Solid-state fermentation - are there any biotechnological advantages? Curr Opin Microbiol 8:301-306.
Hua L, Nordkvist M, Nielsen PM, Villadsen J. 2007. Scale-up of enzymatic production of lactobionic acid using the rotary jet head system. Biotechnol Bioeng 97:842-849.
Hui JPM, Lanthier P, White TC, McHugh SG, Yaguchi M, Roy R, Thibault P. 2001. Characterization of cellobiohydrolase I (Cel7A) glycoforms from extracts of Trichoderma reesei using capillary isoelectric focusing and electrospray mass spectrometry. J Chromotogr B 752:349-368.
Hui JPM, White TC, Thibault P. 2002. Identification of glycan structure and glycosylation sites in cellobiohydrolase II and endoglucanases I and II from Trichoderma reesei. Glycobiology 12:837-849.
Humbird, D, Davis, R, Tao, L, Kinchin, C, Hsu, D., Aden, A, Schoen, P, Lukas, J, Olthof, B, Worley, M, Sexton, D, and Dudgeon, D. 2011. Process design and economics for biochemical conversion of lignocellulosic biomass to ethanol; dilute-acid pretreatment and enzymatic hydrolysis of corn stover. Technical Report NREL/TP-5100-47764
Jahic M, Wallberg F, Bollok M, Garcia P, Enfors SO. 2003. Temperature limited fed-batch technique for control of proteolysis in Pichia pastoris bioreactor cultures. Microb cell fact 2:1-11.
Jüsten P, Paul GC, Nienow AW, Thomas CR. 1998. Dependence of Penicillium chrysogenum growth, morphology, vacuolation, and productivity in fed-batch fermentations on impeller type and agitation intensity. Biotechnol Bioeng 59:762-775.
Kawase Y, Moo-Young M. 1988. Volumetric mass transfer coefficients in aerated stirred tank reactors with Newtonian and non-Newtonian media. Chem Eng Res Des 66:284-288.
Knoll A, Maier B, Tscherrig H, Buchs J. 2005. The oxygen mass transfer, carbon dioxide inhibition, heat removal, and the energy and cost efficiencies of high pressure fermentation. Adv Biochem Eng Biotechnol 92:77-99.
Kold, David. Study of mass transfer in viscous fermentations. 2010. PhD thesis. Technical University of Denmark.
Kouremenos D, Antonopoulos K. 1987. Isentropic exponents of real gases and application for the

150 Bibliography
air at temperatures from 150 K to 450 K. Acta Mech 65:81-99.
Krebser U, Meyer HP, Fiechter A. 1988. A comparison between the performance of continuously stirred-tank bioreactors and a TORUS bioreactor with respect to highly viscous culture broths. J Chem Technol Biotechnol 43:107-116.
Kubicek CP, Mikus M, Schuster A, Schmoll M, Seiboth B. 2009. Metabolic engineering strategies for the improvement of cellulase production by Hypocrea jecorina. Biotechnology for Biofuel 2.
Kura S, Nishiumi H, Kawase Y. 1993. Oxygen transfer in a stirred loop fermentor with dilute polymer solutions. Bioprocess Biosyst Eng 8:223-228.
Lehman, L. Physiological characterization of enzyme production in Trichoderma reesei. 2011. PhD thesis. Technical University of Denmark.
Li ZJ, Shukla V, Fordyce AP, Pedersen AG, Wenger KS, Marten MR. 2000. Fungal morphology and fragmentation behavior in a fed-batch Aspergillus oryzae fermentation at the production scale. Biotechnol Bioeng 70:300-312.
Li ZJ, Shukla V, Wenger KS, Fordyce AP, Pedersen AG, Marten MR. 2002. Effects of Increased Impeller Power in a Production-Scale Aspergillus oryzae Fermentation. Biotechnol Prog 18:437-444.
Lounes M, Audet J, Thibault J, LeDuy A. 1995. Description and evaluation of reciprocating plate bioreactors. Bioprocess Biosyst Eng 13:1-11.
Lübbert A. 2010. Bubble columns and airlift loop bioreactors, In: Berovic M, Enfors S-O, editors. Comprehensive bioprocess engineering. Ljubljana: University of Ljubljana. p 160-178.
Lynd LR, Weimer PJ, van Zyl WH, Pretorius IS. 2002. Microbial cellulose utilization: Fundamentals and biotechnology. Microbiol Mol Biol R 66:506-577.
Mach RS, Zeilinger S. 2003. Regulation of gene expression in industrial fungi: Trichoderma. Appl Microbiol Biotechnol 60:515-522.
Marten MR, Wenger KS, Khan SA. 1997. Rheology, mixing time, and regime analysis for a production-scale Aspergillus oryzae fermentation. BHR Group Conference Series 25:295-316.
Martinez D, Berka RM, Henrissat B, Saloheimo M, Arvas M, Baker SE, Chapman J, Chertkov O, Coutinho PM, Cullen D, Danchin EGJ, Grigoriev IV, Harris P, Jackson M, Kubicek CP, Han CS, Ho I, Larrondo LF, de Leon AL, Magnuson JK, Merino S, Misra M, Nelson B, Putnam N, Robbertse B, Salamov AA, Schmoll M, Terry A, Thayer N, Westerholm-Parvinen A, Schoch CL, Yao J, Barbote R, Nelson MA, Detter C, Bruce D, Kuske CR, Xie G, Richardson P, Rokhsar DS, Lucas SM, Rubin EM, Dunn-Coleman N, Ward M, Brettin TS. 2008. Genome sequencing and analysis of the biomass-degrading fungus Trichoderma reesei (syn. Hypocrea jecorina). Nat Biotechnol 26:553-560.

Bibliography 151
McIntyre M, Müller C, Dynesen J, Nielsen J. 2001. Metabolic engineering of the morphology of Aspergillus. Adv Biochem Eng Biotechnol 73:103-128.
Mcneil B, Harvey LM. 1993. Viscous fermentation products. Crit Rev Biotechnol 13:275-304.
Meesters PAEP, Wal H, Weusthuis R, Eggink G. 1996. Cultivation of the oleaginous yeast Cryptococcus curvatus in a new reactor with improved mixing and mass transfer characteristics (Surer). Biotechnol Tech 10:277-282.
Meister D, Post T, Dunn IJ, Bourne JR. 1979. Design and characterization of a multistage, mechanically stirred column absorber. Chem Eng Sci 34:1367-1374.
Merchuk JC, Gluz M. 2002. Bioreactors, air-lift reactors.Encyclopedia of Bioprocess Technology. Hoboken: John Wiley & Sons, Inc.
Merino ST, Cherry J. 2007. Progress and challenges in enzyme development for biomass utilization. Biofuels 108:95-120.
Middleton JC. 1997. Gas-liquid dispersion and mixing, In: Harnby N, Edwards MF, Nienow AW, editors. Mixing in the Process Industries. Oxford: Butterworth-Heinemann. p 322-363.
Miller CE. 2007. Chemometrics in process analytical chemistry, In: Bakeev KA, editor. Process Analytical Technology. Oxford, UK: Blackwell Publishing Ltd. p 226-328.
Ministry of Foreign Affairs of Denmark, Ministry of Transport of Denmark Danish Ministry of the Environment. 2006. Export promotion of energy and environmental technologies.
Mishra IM, El-Temtamy SA, Schügerl K. 1982. Growth of Saccharomyces cerevisiae in gaseous fluidized beds. Appl Microbiol Biotechnol 16:197-203.
Mitchell DA, Krieger N, Berovic M. 2006. Solid-State fermentation bioreactors: fundamentals of design and operation. Berlin: Springer.
Moebus O, Teuber M. 1979. Herstellung von single cell protein mit Saccharomyces cerevisiae in einer tauchstrahlbegasungsanlage. Kieler milchwirtsschaftliche Forschungsberichte 31:297-361.
Montenecourt BS, Eveleigh DE. 1977a. Preparation of mutants of Trichoderma reesei with enhanced cellulase production. Appl Environ Microbiol 34:777-782.
Montenecourt BS, Eveleigh DE. 1977b. Semiquantitative plate assay for determination of cellulase production by Trichoderma viride. Appl Environ Microbiol 33:178-183.
Montgomery D. 1997. Response surface methods and other approaches to process optimization. In: Design and analysis of experiment. New York: John Wiley & Sons, Inc. p 427-510.
Moresi M. 1981. Optimal design of airlift fermenters. Biotechnol Bioeng 23:2537-2560.
Morris MD. 1991. Factorial sampling plans for preliminary computational experiments 1.

152 Bibliography
Technometrics 33:161-174.
National Academy of Sciences, National Academy of Engineering National Research Counsil. 2009. Liquid transportation fuels from coal and biomass: technological status, costs, and environmental impacts. Washington, DC: National Academy of Sciences
Nevalainen H, Suominen P, Taimisto K. 1994. On the safety of Trichoderma reesei. J Biotechnol 37:193-200.
Ni X, Gao S, Cumming RH, Pritchard DW. 1995a. A comparative study of mass transfer in yeast for a batch pulsed baffled bioreactor and a stirred tank fermenter. Chem Eng Sci 50:2127-2136.
Ni X, Gao S, Pritchard DW. 1995b. A study of mass transfer in yeast in a pulsed baffled bioreactor. Biotechnol Bioeng 45:165-175.
Nielsen J. 1997. Physiological engineering aspects of Penicillium chrysogenum. Singapore: World Scientific.
Nielsen J. 1993. A simple morphologically structured model describing the growth of filamentous microorganisms. Biotechnol Bioeng 41:715-727.
Nielsen J, Villadsen J, Lidén G. 2003. Bioreaction engineering principles. New York: Kluwer Academic/Plenum Publishers.
Nienow AW. 1990. Agitators for mycelial fermentations. Trends Biotechnol 8:224-233.
Nienow AW. 1996. Gas-liquid mixing studies: A comparison of Rushton turbines with some modern impellers. Trans IChemE 74:417-423.
Nienow AW. 1997. On impeller circulation and mixing effectiveness in the turbulent flow regime. Chem Eng Sci 52:2557-2565.
Nienow AW. 1998. Hydrodynamics of stirred bioreactors. Appl Mech Rev 51:3-32.
Nishikawa M. 1991. On the estimation of average shear rate in bubble columns. Biotechnol Bioeng 37:691-692.
Nordkvist, Mikkel. Mixing and mass transfer by rotating jets: fundamentals and applications. 2005. PhD thesis. Technical University of Denmark.
Nordkvist M, Grotkjær T, Lazar JÅ, Hummer JS, Villadsen J. 2003. Hiv røreværket op, sænk jetten ned. Dansk Kemi 84:18-21.
Nordkvist M, Vognsen M, Nienow AW, Villadsen J, Gernaey KV. 2008. Mixing by rotary jet heads: Indications of the benefits of head rotation under turbulent and transitional flow conditions. Chem Eng Res Des 86:1454-1461.
Novozymes A/S. 2007. The Novozymes Report 2007. Bagsvaerd, Denmark

Bibliography 153
Olivier APC, Oosterhuis NMG. 1988. Oxygen mass transfer in non-Newtonian fermentation systems, In: Durant G, Robichon L, Florent J, editors. Proceedings 8th International Biotechnology Symposium. Paris: Société francaise de microbiologie. p 389-409.
Olsen, HS. 2008. Enzymes at work. Novozymes A/S. www.novozymes.com
Olsvik E, Kristiansen B. 1994. Rheology of filamentous fermentations. Biotechnol Adv 12:1-39.
Onken U, Liefke E. 1989. Effect of total and partial pressure (oxygen and carbon dioxide) on aerobic microbial processes. Adv Biochem Eng Biotechnol 40:137-169.
Oosterhuis, N. M. G. Scale-up of bioreactors. A scale-down approach. 1984. PhD thesis. Delft University of Technology.
Pandey A. 2003. Solid-state fermentation. Biochem Eng J 13:81-84.
Papagianni M. 2004. Fungal morphology and metabolite production in submerged mycelial processes. Biotechnol Adv 22:189-259.
Pazouki M, Panda T. 2000. Understanding the morphology of fungi. Bioprocess Eng 22:127-143.
Pedersen, A. G. 1997. kla characterization of industrial fermentors. Proceedings of the forth international conference on bioreactor and bioprocess fluid dynamics. Edinburgh, UK: 263-276.
Peri S, Steen H, Pandey A. 2001. GPMAW - a software tool for analyzing proteins and peptides. Trends Biochem Sci 26:687-689.
Perlack, R., Wright, L, Turhollow, A., Graham, R., Stokes, B., and Erbach, D. 2005. Biomass as feedstock for a bioenergy and bioproducts industry: The technical feasibility of a billion-ton annual supply (U.S. Department of Energy and U.S. Department of Agriculture, Eds.). Washington, DC: U.S. Department of Energy
Persson I, Tjerneld F, Hahn-Hägerdal B. 1991. Fungal cellulolytic enzyme production: A review. Process Biochem 26:65-74.
Peters MS, Timmerhaus KD, West RE. 2003. Plant design and economics for chemical engineers. New York, USA: McGraw-Hill.
Petersen N, Stocks S, Gernaey KV. 2008. Multivariate models for prediction of rheological characteristics of filamentous fermentation broth from the size distribution. Biotechnol Bioeng 100:61-71.
Pirt SJ. 1965. The maintenance energy of bacteria in growing cultures. Proceedings of the Royal Society of London Series B, Biological Sciences 163:224-231.
Poncin S, Nguyen C, Midoux N, Breysse J. 2002. Hydrodynamics and volumetric gas-liquid mass transfer coefficient of a stirred vessel equipped with a gas-inducing impeller. Chem Eng Sci 57:3299-3306.

154 Bibliography
Popovic MK, Robinson CW. 1989. Mass transfer studies of external-loop airlifts and a bubble column. AIChE J 35:393-405.
Renewable Fuels Association. 2011. 2011 Ethanol Industry Outlook. Washington, DC
Rettich TR, Battino R, Wilhelm E. 2000. Solubility of gases in liquids. 22. High-precision determination of Henry's law constants of oxygen in liquid water from T = 274 K to T = 328 K. J Chem Thermodyn 32:1145-1156.
Reuss M. 1993. Oxygen transfer and mixing: scale-up implications, In: Rehm H-J, Reed G, editors. Biotechnology: Bioprocessing. Weinheim, Germany: Wiley-VCH Verlag GmbH. p 185-217.
Revill BK. 1985. Jet mixing, In: Harnby N, Edwards MF, Nienow AW, editors. Mixing in the Process Industries. Oxford: Butterworth-Heinemann. p 159-183.
Revstedt J, Fuchs L, Trägårdh C. 1998. Large eddy simulations of the turbulent flow in a stirred reactor. Chem Eng Sci 53:4041-4053.
Ross A, Schügerl K, Scheiding W. 1983. Cellulase production by Trichoderma reesei. Appl Microbiol Biotechnol 18:29-37.
Scargiali F, Russo R, Grisafi F, Brucato A. 2007. Mass transfer and hydrodynamic characteristics of a high aspect ratio self-ingesting reactor for gas-liquid operations. Chem Eng Sci 62:1376-1387.
Schügerl K. 1985. Nonmechanically agitated bioreactor systems, In: Moo-Young M, editor. Comprehensive Biotechnology. Volume 2. p 99-118.
Schügerl K. 1980. Neue Bioreaktoren für aerobe Prozesse. Chem Ing Tech 52:951-965.
Schügerl K. 1983. Apparatetechnische Aspekte der Kultivierung von Einzellern in Turmreaktoren. Chem Ing Tech 55:123-134.
Schügerl K. 1990. Comparison of the performances of stirred tank and airlift tower loop reactors. J Biotechnol 13:251-256.
Schügerl K. 1991. Bioreaction engineering: characteristic features of bioreactors. Chichester: John Wiley & Son Ltd.
Schügerl K. 1993. Comparison of different bioreactor performances. Bioprocess Biosyst Eng 9:215-223.
Schügerl K, Sittig W. 1982. Bioreactors, In: Präve P, Faust U, Sittig W, Sukatsch DA, editors. Fundamentals of Biotechnology. Wiesbaden: Akademische Verlagsgesellschaft. p 179-224.
Schumpe A, Deckwer W-D. 1987. Viscous media in tower bioreactors: Hydrodynamic characteristics and mass transfer properties. Bioprocess Biosyst Eng 2:79-94.
Schuster A, Schmoll M. 2010. Biology and biotechnology of Trichoderma. Appl Microbiol
Bibliography 155
Biotechnol 87:787-799.
Simmons, E. G. 1977. Classification of some cellulase-producing Trichoderma species. Proceedings of the Second International Mycological Congress, University of South Florida, Tampa, Florida. p 618.
Sin G, Gernaey KV, Lantz AE. 2009. Good modeling practice for PAT applications: Propagation of input uncertainty and sensitivity analysis. Biotechnol Prog 25:1043-1053.
Sittig W. 1982. The present state of fermentation reactors. J Chem Technol Biotechnol 32:47-58.
Smith SRL. 1980. Single Cell Protein. Philosophical Transactions of the Royal Society of London B 290:341-354.
Soderberg AC. 1997. Fermentation design, In: Vogel HC, Todaro CL, editors. Fermentation and Biochemical Engineering Handbook. Westwood, NJ: William Andrew Publishing. p 67-121.
Streiff F. A, Mathys P, Fischer TU. 1997. New fundamentals for liquid – liquid dispersion using static mixers. Paris: Proc. 9th European Conference on Mixing. p 307-314.
Sukumaran RK, Singhania RR, Pandey A. 2005. Microbial cellulases - Production, applications and challenges. J Sci Ind Res 64:832-844.
Tengerdy RP. 1996. Cellulase production by solid substrate fermentation. J Sci Ind Res 55:313-316.
Tolan JS, Foody B. 1999. Cellulase from submerged fermentation. Adv Biochem Eng Biotechnol 65:41-67.
U.S.Congress. 2007. Energy Independence and Security Act of 2007. US Congress.
Viniegra-González G, Favela-Torres E, Aguilar CN, Rómero-Gomez SdJ, Díaz-Godínez G, Augur C. 2003. Advantages of fungal enzyme production in solid state over liquid fermentation systems. Biochem Eng J 13:157-167.
Votruba J, Sobotka M. 1992. Physiological similarity and bioreactor scale-up. Folia Microbiol 37:331-345.
Walker J, Wilkinson GW. 1979. The treatment of industrial effluents using the deep shaft process. Ann N Y Acad Sci 326:181-191.
Wang DIC, Cooney CL, Demain AL, Dunnill P, Humpfrey AE, Lilly MD. 1979. Fermentation and enzyme technology. New York: Wiley & Sons.
Ward OP. 2011. Production of recombinant proteins by filamentous fungi. Biotechnol Adv. Article in press.
Westlake R. 1986. Large-scale continuous production of single cell protein. Chem Ing Tech 58:934-937.
156 Bibliography
Yang H, Allen DG. 1999. Model-based scale-up strategy for mycelial fermentation processes. Can J Chem Eng 77:844-854.
Zaidi A, Ghosh P, Schumpe A, Deckwer WD. 1991. Xanthan production in a plunging jet reactor. Appl Microbiol Biotechnol 35:330-333.
Zhang YHP, Lynd LR. 2004. Toward an aggregated understanding of enzymatic hydrolysis of cellulose: Noncomplexed cellulase systems. Biotechnol Bioeng 88:797-824.
Zhou G, Kresta SM. 1996. Impact of tank geometry on the maximum turbulence energy dissipation rate for impellers. AIChE J 42:2476-2490.
Zlokarnik M. 1975. Der Schaufelradreaktor - ein spezieller Reaktortyp für Reaktionen im System gasfürmig/flüssig. Verfahrenstechnik 9:442-445.
Zlokarnik M. 1978. Sorption characteristics for gas-liquid contacting in mixing vessels. Adv Biochem Eng Biotechnol 8:133-151.
Related Documents