Journal of Multidisciplinary Engineering Science and Technology (JMEST) ISSN: 2458-9403 Vol. 5 Issue 11, November - 2018 www.jmest.org JMESTN42352768 9109 Evaluation of the Effect of Atmospheric Parameters on Radio Pathloss in Cellular Mobile Communication System 1,2 Kalu Constance 1 ,Ozuomba Simeon 2 , Ezuruike Okafor S.F. 3 Department of Electrical/Electronic and Computer Engineering, University of Uyo, Akwa Ibom, Nigeria 3 Department of Electrical/Electronic Engineering, Imo State Polytechnic, Umuagwo, Nigeria ( 1 [email protected]) Abstract— In this paper, the effect of atmospheric parameters (temperature , pressure and relative humidity) on pathloss in cellular mobile communication system is examined. In the study statistical data of Received Signal Strengths (RSS) and weather parameters were obtain. The data on RSS and weather parameters, temperature, pressure and relative humidity are captured on two different days and at different time (morning, afternoon and evening) on each day. In particular, the empirical survey measurement is conducted for global system for mobile communication (GSM) network at 900 MHz frequency band where the GSM base station and site survey measurement points geo-coordinates are located in Uyo metropolis in Akwa Ibom State, Nigeria. From the RSS value, the measured pathloss was computed. Maximum error or disparity between the lowest and the highest measured pathloss values at that measurement point were obtained ; the lowest value was 3.68 dB at measurement point 2 , a distance of 0.642 km from the base station whereas the highest value was 15.00 dB at measurement point 14 , a distance of 0.1622 km from the base station. In all, the study results showed that there is significant correlation between the variations in the atmospheric parameters and the variations in the measured pathloss at any given point within the network coverage area. As such, appropriate pathloss model or appropriate pathloss tuning method that incorporates the atmospheric parameters can be more effective in modelling the pathloss at any given point within a network coverage area. Keywords— Received Signal Strengths, Pathloss, Atmospheric Parameters, Pathloss Model, Cellular Network I. INTRODUCTION The reduction in power density of an electromagnetic wave as it propagates through space is referred to as pathloss [1, 2, 3, 4, ]. It is a major component in the analysis and design of wireless communication system. Pathloss depends on frequency, antenna height, receive terminal location relative to obstacles and reflectors, and link distance, among many other factors [6, 7, 8, 9, 10] . Propagation pathloss models are used for prediction of expected pathloss that wireless signal may experience as the propagates along the signal path [11, 13, 14]. Pathloss models play important roles in the design of wireless networks, especially in specifying key system parameters such as transmission power, frequency, antenna heights etc, as well as determining the network coverage area [6, 14, 15, 16, 17, 18, 19, 20]. Pathloss models can be broadly categorized into three types; empirical, deterministic and stochastic [7, 21, 22, 23]. Among these the empirical models which are based on observations and measurements are the most widely use. Despite their there wide applications none of the empirical pathloss models has factored in the effect of atmospheric parameters. Consequently, in this paper, the effect of atmospheric parameters, namely temperature, atmospheric pressure and relative humidity on pathloss is studied. The study is aimed at drawing attention of researchers to the significant effect of variation in atmospheric parameters on the measured pathloss. Also, the study seek to demonstrate through empirical data that variations in the atmospheric parameters can have significant effect on the measured pathloss at any given point within the network coverage area. Particularly, variation in atmospheric parameters can be employed in modeling the variation in measured pathloss at any given point within the network coverage area. In all, the study seeks to stir up further study in pathloss modeling and pathloss model tuning for cellular networks. II. METHODOLOGY The study is carried out to obtain statistical data of Received Signal Strengths (RSS) and weather parameters. From the RSS value, the measured pathloss are computed. The data on RSS and weather parameters, temperature, pressure and relative humidity are captured on two different days and at different time (morning, afternoon and evening ) on each day. In particular, the empirical survey measurement is conducted for global system for mobile communication (GSM) network at 900 MHz frequency band where the GSM base station and site survey measurement points geo-coordinates are located in Uyo metropolis in Akwa Ibom State, with coordinates as shown in Table 1 and figure 1.

Welcome message from author
This document is posted to help you gain knowledge. Please leave a comment to let me know what you think about it! Share it to your friends and learn new things together.
Transcript
Journal of Multidisciplinary Engineering Science and Technology (JMEST)
ISSN: 2458-9403
Vol. 5 Issue 11, November - 2018
www.jmest.org
JMESTN42352768 9109
Evaluation of the Effect of Atmospheric Parameters on Radio Pathloss in Cellular
Mobile Communication System
1,2Kalu Constance1
,Ozuomba Simeon2, Ezuruike Okafor S.F.
3
Department of Electrical/Electronic and Computer Engineering, University of Uyo, Akwa Ibom, Nigeria 3 Department of Electrical/Electronic Engineering, Imo State Polytechnic, Umuagwo, Nigeria
Abstract— In this paper, the effect of atmospheric parameters (temperature , pressure and relative humidity) on pathloss in cellular mobile communication system is examined. In the study statistical data of Received Signal Strengths (RSS) and weather parameters were obtain. The data on RSS and weather parameters, temperature, pressure and relative humidity are captured on two different days and at different time (morning, afternoon and evening) on each day. In particular, the empirical survey measurement is conducted for global system for mobile communication (GSM) network at 900 MHz frequency band where the GSM base station and site survey measurement points geo-coordinates are located in Uyo metropolis in Akwa Ibom State, Nigeria. From the RSS value, the measured pathloss was computed. Maximum error or disparity between the lowest and the highest measured pathloss values at that measurement point were obtained ; the lowest value was 3.68 dB at measurement point 2 , a distance of 0.642 km from the base station whereas the highest value was 15.00 dB at measurement point 14 , a distance of 0.1622 km from the base station. In all, the study results showed that there is significant correlation between the variations in the atmospheric parameters and the variations in the measured pathloss at any given point within the network coverage area. As such, appropriate pathloss model or appropriate pathloss tuning method that incorporates the atmospheric parameters can be more effective in modelling the pathloss at any given point within a network coverage area.
Keywords— Received Signal Strengths, Pathloss, Atmospheric Parameters, Pathloss Model, Cellular Network
I. INTRODUCTION The reduction in power density of
an electromagnetic wave as it propagates through space is referred to as pathloss [1, 2, 3, 4, ]. It is a major component in the analysis and design of wireless communication system. Pathloss depends on frequency, antenna height, receive terminal location relative to obstacles and reflectors, and link distance, among many other factors [6, 7, 8, 9, 10] .Propagation pathloss models are used for prediction of expected pathloss that wireless signal may experience as the propagates along the signal path [11, 13, 14].
Pathloss models play important roles in the design of wireless networks, especially in specifying key system parameters such as transmission power, frequency, antenna heights etc, as well as determining the network coverage area [6, 14, 15, 16, 17, 18, 19, 20].
Pathloss models can be broadly categorized into three types; empirical, deterministic and stochastic [7, 21, 22, 23]. Among these the empirical models which are based on observations and measurements are the most widely use. Despite their there wide applications none of the empirical pathloss models has factored in the effect of atmospheric parameters. Consequently, in this paper, the effect of atmospheric parameters, namely temperature, atmospheric pressure and relative humidity on pathloss is studied. The study is aimed at drawing attention of researchers to the significant effect of variation in atmospheric parameters on the measured pathloss. Also, the study seek to demonstrate through empirical data that variations in the atmospheric parameters can have significant effect on the measured pathloss at any given point within the network coverage area. Particularly, variation in atmospheric parameters can be employed in modeling the variation in measured pathloss at any given point within the network coverage area. In all, the study seeks to stir up further study in pathloss modeling and pathloss model tuning for cellular networks.
II. METHODOLOGYThe study is carried out to obtain statistical
data of Received Signal Strengths (RSS) and weather parameters. From the RSS value, the measured pathloss are computed. The data on RSS and weather parameters, temperature, pressure and relative humidity are captured on two different days and at different time (morning, afternoon and evening ) on each day. In particular, the empirical survey measurement is conducted for global system for mobile communication (GSM) network at 900 MHz frequency band where the GSM base station and site survey measurement points geo-coordinates are located in Uyo metropolis in Akwa Ibom State, with coordinates as shown in Table 1 and figure 1.

Journal of Multidisciplinary Engineering Science and Technology (JMEST)
ISSN: 2458-9403
Vol. 5 Issue 11, November - 2018
www.jmest.org
JMESTN42352768 9110
Table 1 : The geo-coordinates of the empirical GSM network site survey measurement points and the distance of the measurement points from the GSM base station
Measurement Point Number
Latitude Longitude Distance From Base Station; d (km)
1 5.037535 7.898945 0
2 5.0381 7.89855 0.0766
3 5.038034 7.898325 0.0884
4 5.037951 7.89811 0.1035
5 5.037771 7.897817 0.1278
6 5.037575 7.897483 0.1622
7 5.037424 7.897223 0.1913
8 5.037398 7.896844 0.2335
9 5.037395 7.896464 0.2756
10 5.037393 7.896082 0.3179
11 5.037418 7.895499 0.3824
12 5.037515 7.894953 0.4427
13 5.037688 7.894642 0.4775
14 5.037778 7.894444 0.4999
15 5.037846 7.894155 0.5323
16 5.037908 7.893972 0.553
17 5.038064 7.893549 0.6013
18 5.038196 7.893194 0.642
19 5.038316 7.892644 0.7041
Figure 1: Google map visualization of the geo-coordinates of the empirical GSM network site survey
measurement points and the geo-coordinates of the GSM base station
The measurement of the longitude, latitude, RSS, temperature, pressure and relative humidity are made using android application running on Samsung Galaxy S4 mobile phone handset. The android application termed UNIUYO Enhanced Site Survey Android Application (UESSAP) is locally developed specifically for this purpose to enable simultaneous measurements of the geo-coordinates, the RSS as well as the temperature, pressure and relative humidity. However, the same measurements can be done with a combination of available android applications such as Cellmapper android application, Netmonitor android application and MYGPS coordinate android application, along with android applications for measuring temperature, pressure and relative humidity.
The measurement procedure is as follows: Step 1: The GSM network base station covering the
study area is identified and its geo-coordinates are obtained using the UESSAP android application running on the Samsung Galaxy S4 mobile phone handset.
Step 2: The route for the site survey is selected and the site survey measurement points are identified and marked. The geo-coordinates of the empirical GSM network site survey measurement points and the geo-coordinates of the GSM base station are then stored in a Microsoft Excel file. A total of 18 measurement points are marked, starting

Journal of Multidisciplinary Engineering Science and Technology (JMEST)
ISSN: 2458-9403
Vol. 5 Issue 11, November - 2018
www.jmest.org
JMESTN42352768 9111
from place marker 2 to place marker 19 on figure 1. The distance between the measurement points geo-coordinates determined using Haversine Haversine formula (Eq 1) is used to calculate the distance (shown in Table 1 and figure 2) between each of the measurement points geo-coordinates and the geo-coordinates of the GSM base station.
Figure 2: Google map visualization of the total
distance covered in the empirical GSM network site survey measurement
𝑑 = 2𝑟 {√sin (𝐿𝐴𝑇2−𝐿𝐴𝑇1
2)
2
+ cos(𝐿𝐴𝑇1) cos(𝐿𝐴𝑇2) sin (𝐿𝑂𝑁𝐺2−𝐿𝑂𝑁𝐺1
2)
22
}
(1)
LAT in Radians = (LAT in Degrees ∗ 3.142)
180
(2)
LONG in Radians = (LONG in Degrees ∗ 3.142)
180
(3) Where LAT1 and LAT2 the latitude of the coordinates of point1 and point 2 respectively; LONG1 and LONG2 the longitude of the coordinates of point1 and point 2 respectively; R = radius of the earth = 6371 km , d =the distance between the two coordinates and R varies from 6356.752 km at the poles to 6378.137km at the equator. In the morning of the first day of the site survey the UESSAP android application running on the Samsung Galaxy S4 mobile phone handset is used to measure and store
the longitude, latitude, RSS, temperature, pressure and relative humidity at each of the 18 measurement points, starting from place marker 2 to place marker 19 on figure 1. The data are stored in the Microsoft Excel file.
Step 3: Step 3.1: Each of the measured RSS value is
converted to measured pathloss
( PLm(dB)) using the modified link budget
formula in Eq 4 (Ajose and Imoize, 2013; Rappaport 2002; Seybold 2005):
𝑃𝐿𝑚(𝑑𝐵) = EIRP (dBm) – Pr (dBm) = EIRPt (dBm) –
RSS(dBm) (4) where PLm(dB)is the measured pathloss for
each measurement location at a distance d( km) ; Pr is the mean Received Signal Strength (RSS) in dBm = the measured received signal strength and EIRP is the Effective Isotropic Radiated Power in dBm . In this study EIRP = 53.5 dBm.
Step 3.2: The measured pathloss values in dB obtained by substituting the value of EIRP (dBm) and the measured RSS(dBm) into Eq 4. The data are stored in the Microsoft Excel file.
Step 4: Step 3 is repeated for the afternoon and evening of the first day and also for the morning, afternoon and evening of the second day of the site survey. In all, six different site survey data sets are collected.
III. RESULT AND DISCUSSION
` The measure Received Signal Strength (RSS)
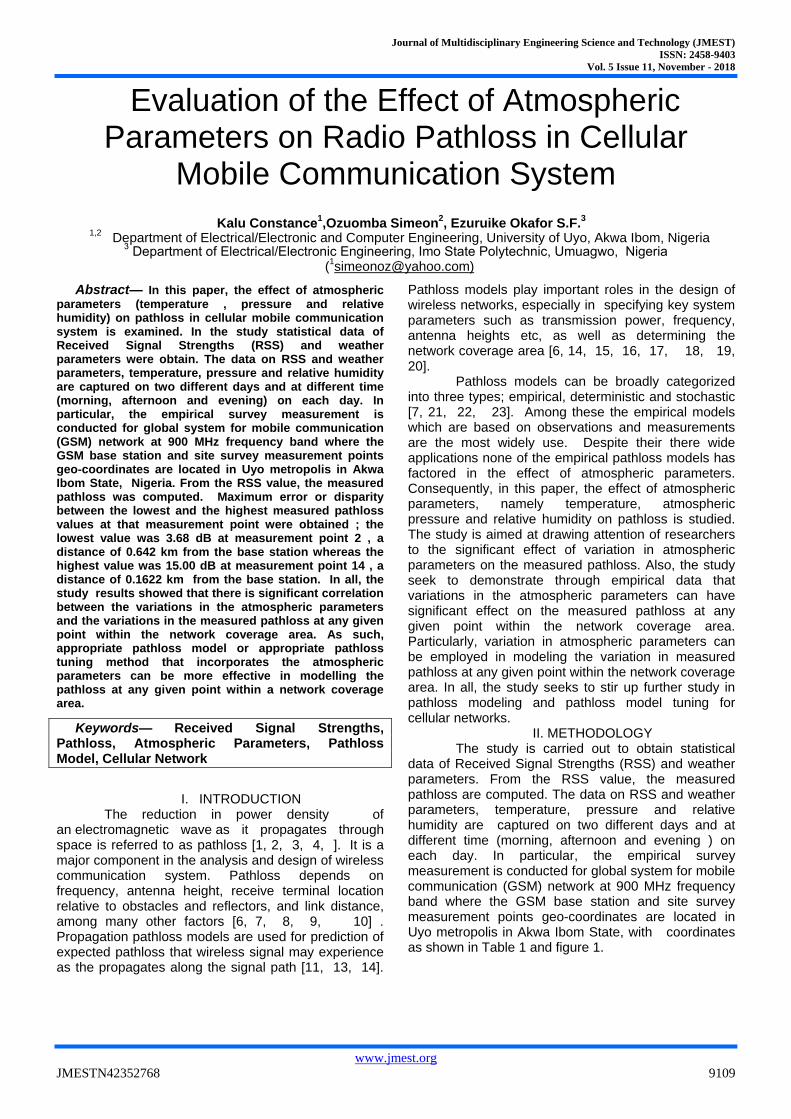
in dBm, Temperature (⁰C), Pressure(hPa) and Relative Humidity(%) for the first and second day of the network site survey are shown in Table 2, Table 3, Table 4, Table 5, Table 6 and Table 7. The measured pathloss (dB) for the morning, afternoon and evening of the first and second day of the network site survey is given in Table 8 and Figure 3.
Table 2 Measure Received Signal Strength (RSS) in dBm, Temperature (⁰C), Pressure(hPa) and Relative Humidity(%) For The Morning Of The First day of The Network Site Survey
S/N Distance
(km) Received Signal Strength
(RSS) in dBm Air Temperature
(Celsius ) Atmospheric
Pressure(hPa) Relative
Humidity(%)
1 0.7041 -89.3 24.3 1007.2 100
2 0.642 -90.7 23.8 1007.1 100
3 0.6013 -92.1 23.3 1007.1 100
4 0.553 -95.6 23.4 1007.1 100
5 0.5323 -90.4 23.5 1007.1 100
6 0.4999 -95 23.4 1007.1 100
7 0.4775 -95.8 23.1 1007.1 100
8 0.4427 -87.2 23.1 1007.1 100
9 0.3824 -91.9 22.9 1007.1 100
10 0.3179 -81.7 22.8 1007.1 100
11 0.2756 -87.4 22.6 1007.2 100

Journal of Multidisciplinary Engineering Science and Technology (JMEST)
ISSN: 2458-9403
Vol. 5 Issue 11, November - 2018
www.jmest.org
JMESTN42352768 9112
12 0.2335 -88 22.4 1007.3 100
13 0.1913 -92.3 22.4 1007.3 100
14 0.1622 -81 22 1007.3 100
15 0.1278 -91.1 22.1 1007.3 100
16 0.1035 -84.8 22 1007.3 100
17 0.0884 -84.1 22.3 1007.3 100
18 0.0766 -87 22.6 1007.4 100
Mean Value 22.9 1007.2 100
Table 3 Measure Received Signal Strength (RSS) in dBm, Temperature (⁰C), Pressure(hPa) and Relative Humidity(%) For The Afternoon Of The First day of The Network Site Survey
S/N Distance (km)
Received Signal Strength (RSS) in dBm
Air Temperature (Celsius )
Atmospheric Pressure(hPa)
Relative Humidity(%) 1 0.7041 -85.5 36.0 1005.3 72.65571
2 0.642 -90.6 39.5 1005.1 67.50073
3 0.6013 -89.9 37.7 1005.0 70.52283
4 0.553 -90.9 41.7 1004.9 62.857323
5 0.5323 -91.0 39.2 1004.9 62.192505
6 0.4999 -90.3 39.6 1004.8 63.866512
7 0.4775 -94.4 36.7 1004.8 65.11625
8 0.4427 -90.5 36.5 1004.8 67.218796
9 0.3824 -85.0 35.3 1004.8 70.64967
10 0.3179 -81.2 35.4 1004.8 73.15703
11 0.2756 -83.9 35.9 1004.8 74.66163
12 0.2335 -83.4 34.5 1004.8 75.81324
13 0.1913 -88.7 32.9 1004.8 75.9744
14 0.1622 -78.4 33.5 1004.8 72.43555
15 0.1278 -89.6 37.6 1004.8 65.51128
16 0.1035 -82.5 41.0 1004.7 58.190796
17 0.0884 -81.8 40.6 1004.8 57.800457
18 0.0766 -80.1 38.1 1004.7 60.067104
Mean Value 37.3 1004.9 67.56621183
Table 4 Measure Received Signal Strength (RSS) in dBm, Temperature (⁰C), Pressure(hPa) and Relative Humidity(%) For The Evening Of The First day of The Network Site Survey
S/N Distance
(km) Received Signal
Strength (RSS) in dBm
Air Temperature (Celsius )
Atmospheric Pressure(hPa)
Relative Humidity(%)
1 0.7041 -85.5 24.7 1006.1 100
2 0.642 -89.2 24.8 1006.1 100
3 0.6013 -89.0 25.0 1006.1 100
4 0.553 -89.2 24.8 1006.0 100
5 0.5323 -89.9 25.0 1006.1 100
6 0.4999 -82.5 25.5 1006.1 100
7 0.4775 -90.5 24.8 1006.1 100
8 0.4427 -90.1 26.3 1042.5 103.6
9 0.3824 -86.4 25.3 1006.1 100
10 0.3179 -81.8 25.6 1006.2 100
11 0.2756 -83.2 25.6 1006.2 100
12 0.2335 -88.0 26.0 1006.3 100
13 0.1913 -90.0 25.9 1006.3 100
14 0.1622 -75.4 25.4 1006.3 100
15 0.1278 -87.8 25.2 1006.3 100
16 0.1035 -85.4 25.1 1006.4 100
17 0.0884 -79.7 25.2 1006.3 100
18 0.0766 -82.3 25.1 1006.4 100
Mean Value 25.3 1008.2 100.2

Journal of Multidisciplinary Engineering Science and Technology (JMEST)
ISSN: 2458-9403
Vol. 5 Issue 11, November - 2018
www.jmest.org
JMESTN42352768 9113
Table 5 Measure Received Signal Strength (RSS) in dBm, Temperature (⁰C), Pressure(hPa) and Relative Humidity(%) For The Morning Of The Second day of The Network Site Survey
S/N Distance
(km) Received Signal
Strength (RSS) in dBm
Air Temperature (Celsius )
Atmospheric Pressure(hPa)
Relative Humidity(%)
1 0.7041 -86.8 24.0 1006.4 100
2 0.642 -91.6 24.5 1006.3 100
3 0.6013 -92.3 24.7 1006.3 100
4 0.553 -93.8 24.9 1006.3 100
5 0.5323 -91.9 24.7 1006.3 100
6 0.4999 -96.1 25.5 1006.3 100
7 0.4775 -89.5 26.2 1006.2 100
8 0.4427 -87.7 25.5 1006.2 100
9 0.3824 -88.4 25.4 1006.2 100
10 0.3179 -85.5 25.6 1006.4 100
11 0.2756 -86.6 24.4 1006.4 100
12 0.2335 -89.1 24.2 1006.4 100
13 0.1913 -91.0 24.5 1006.4 100
14 0.1622 -75.6 24.5 1006.5 100
15 0.1278 -90.1 24.4 1006.5 100
16 0.1035 -86.5 24.2 1006.6 100
17 0.0884 -83.0 24.3 1006.6 100
18 0.0766 -83.4 24.3 1006.6 100
Mean Value 24.8 1006.4 100
Table 6 Measure Received Signal Strength (RSS) in dBm, Temperature (⁰C), Pressure(hPa) and Relative Humidity(%) For The Afternoon Of The Second day of The Network Site Survey
S/N Distance
(km)
Received Signal Strength (RSS) in
dBm
Air Temperature (Celsius)
Atmospheric Pressure(hPa)
Relative Humidity(%)
1 0.7041 -83.3 33.3 1004.8 80.4
2 0.642 -92.9 32.1 1004.9 83.8
3 0.6013 -89.3 31.9 1004.9 83.6
4 0.553 -91.0 32.3 1004.8 79.7
5 0.5323 -90.4 35.7 1004.8 72.6
6 0.4999 -88.8 39.9 1004.7 62.2
7 0.4775 -87.6 41.2 1004.5 62.0
8 0.4427 -91.0 42.7 1004.4 57.0
9 0.3824 -89.7 41.5 1004.4 57.0
10 0.3179 -81.0 38.9 1004.4 62.0
11 0.2756 -85.7 37.8 1004.5 63.7
12 0.2335 -85.0 35.6 1004.5 68.4
13 0.1913 -86.8 35.4 1004.6 68.6
14 0.1622 -87.8 33.8 1004.6 70.1
15 0.1278 -83.7 33.6 1004.5 70.0
16 0.1035 -80.6 34.0 1004.6 70.3
17 0.0884 -83.0 34.3 1004.6 66.7
18 0.0766 -82.7 33.9 1004.5 68.8
Mean Value 34.1 948.8 65.4
Table 7 Measure Received Signal Strength (RSS) in dBm, Temperature (⁰C), Pressure(hPa) and Relative
Humidity(%) For The Evening Of The Second day of The Network Site Survey
S/N Distance
(km)
Received Signal Strength (RSS) in
dBm
Air Temperature (Celsius )
Atmospheric Pressure(hPa)
Relative Humidity (%)
1 0.7041 -90.9 25.2 1005.3 100.0
2 0.642 -92.8 25.7 1005.2 100.0
3 0.6013 -95.9 26.0 1005.2 99.2
4 0.553 -95.5 26.3 1005.2 97.6
Journal of Multidisciplinary Engineering Science and Technology (JMEST)
ISSN: 2458-9403
Vol. 5 Issue 11, November - 2018
www.jmest.org
JMESTN42352768 9114
5 0.5323 -96.6 26.3 1005.1 97.3
6 0.4999 -93.7 24.1 1005.1 100.0
7 0.4775 -94.0 24.4 1005.1 100.0
8 0.4427 -90.4 24.5 1005.0 100.0
9 0.3824 -85.5 24.6 1005.1 100.0
10 0.3179 -86.8 24.7 1005.2 100.0
11 0.2756 -87.2 24.7 1005.2 100.0
12 0.2335 -88.8 24.5 1005.2 100.0
13 0.1913 -82.7 24.6 1005.3 100.0
14 0.1622 -90.4 24.5 1005.3 100.0
15 0.1278 -86.7 24.7 1005.4 100.0
16 0.1035 -82.6 25.0 1005.4 100.0
17 0.0884 -84.4 25.1 1005.4 100.0
18 0.0766 -83.0 25.2 1005.4 100.0
Mean Value 23.6 949.4 94.1
Table 8 Measured Pathloss (dB) For The Morning, afternoon and evening of the First and Second of The Network
Site Survey
S/N
Distance (km)
Measured
Pathloss (dB) Day
1 Morning
Measured
Pathloss (dB) Day
1 Afternoon
Measured
Pathloss (dB) Day
1 Evening
Measured
Pathloss (dB) Day
2 Morning
Measured Pathloss(dB
) Day 2 Afternoon
Measured
Pathloss (dB) Day
2 Evening
Maximum Error
Maximum % Error
1 0.7041 142.7 138.96 138.94 140.23 136.78 144.34 7.56 5.53
2 0.642 144.2 144.08 142.66 145.04 146.34 146.25 3.68 2.58
3 0.6013 145.6 143.37 142.45 145.76 142.74 149.3 6.85 4.81
4 0.553 149.1 144.34 142.6258 147.25 144.45 148.98 6.47 4.54
5 0.5323 143.9 144.45 143.3511 145.3 143.81 150.05 6.70 4.67
6 0.4999 148.45 143.71 135.9665 149.55 142.21 147.12 13.58 9.99
7 0.4775 149.3 147.85 143.9665 142.93 141.06 147.46 8.24 5.84
8 0.4427 140.7 143.99 143.5946 141.18 144.45 143.82 3.75 2.67
9 0.3824 145.4 138.45 139.86 141.87 143.12 138.94 6.95 5.02
10 0.3179 135.2 134.63 135.23 138.93 134.47 140.23 5.76 4.28
11 0.2756 140.9 137.37 136.65 140.08 139.11 140.67 4.25 3.11
12 0.2335 141.4 136.81 141.41 142.58 138.45 142.21 5.77 4.22
13 0.1913 145.8 142.14 143.44 144.45 140.23 136.12 9.68 7.11
14 0.1622 134.45 131.81 128.86 129 141.22 143.86 15.00 11.64
15 0.1278 144.6 143.09 141.29 143.55 137.1 140.12 7.50 5.47
16 0.1035 138.2 135.94 138.86 139.9283 134.08 136.02 5.85 4.36
17 0.0884 137.5 135.23 133.14 136.45 136.45 137.84 4.70 3.53
18 0.0766 140.5 133.57 135.71 136.84 136.12 136.45 6.93 5.19
Men
Values 142.66 139.99 139.33 141.72 140.12 142.77 7.18 5.25
Figure 3 Measured Pathloss (dB) For The Morning, afternoon and evening of the First and Second of The
Network Site Survey
125
130
135
140
145
150
155
0.04 0.12 0.2 0.28 0.36 0.44 0.52 0.6 0.68
Me
asu
red
Pa
thlo
ss (
dB
)
Distance (km)
Measured Pathloss (dB) Day 1 Morning
Measured Pathloss (dB) Day 1 Afternoon

Journal of Multidisciplinary Engineering Science and Technology (JMEST)
ISSN: 2458-9403
Vol. 5 Issue 11, November - 2018
www.jmest.org
JMESTN42352768 9115
From Table 8 and Figure 4 it can be seen that each measurement point different measured pathloss values are obtained in each of the six times the measurements were carried out. In Table 8 and Table 9 show that the measurement point 2, at a distance of 0.642 km from the base station has the lowest error (3.68 dB) between the lowest measured pathloss value and the highest measured pathloss value whereas the measurement
point 14, at a distance of 0.1622km from the base station has the highest error (15.00 dB) between the lowest measured pathloss value and the highest measured pathloss value. Essentially, at different times of the day the measured pathloss values at any given point in the selected network coverage area are different.
Figure 4 The Maximum error and Maximum % error between the lowest and the highest measured pathloss
values at that measurement point The variation can be in the measured pathloss values at any given measurement point can be further demonstrated by considering the measured pathloss at measurement point 18 (Table 9 and Table 10). Table 10 shows that temperature and relative humidity have significant correlation of -0.61007115 and 0.626148719 respectively whereas the
atmospheric pressure does not have significant correlation with the measured pathloss values at measurement point 18. Furthermore, while temperature has a negative correlation, the relative humidity have positive correlation with the measured pathloss values at measurement point 18.
Table 9 The measured pathloss and the measured atmospheric parameters at measurement point 18, at a distance
of 0.7041 km from the base station.
Air Temperature (Celsius)
Atmospheric Pressure (hPa)
Relative Humidity(%)
Measured Pathloss (dB)
First Day Morning 24.3 1007.2 100 142.7
First Day Afternoon 36.04711 1005.26 72.65571 138.96
First Day Evening 24.69905 1006.1 100 138.94
Second Day Morning 23.98758 1006.35 100 140.23
Second Day Afternoon 33.34524 1004.82 80.35391 136.78
Second Day Evening 25.24862 1005.25 100 144.34
Table 10 The correlation among the measured pathloss and the measured atmospheric parameters at measurement point 18, at a distance of 0.7041 km from the base station.
Air Temperature
(Celsius) Atmospheric
Pressure (hPa) Relative Humidity
(%) Measured
Pathloss (dB)
Air Temperature (Celsius) 1
Atmospheric Pressure(hPa)
-0.699384683 1
Relative Humidity(%) -0.996201692 0.648210665 1
Measured Pathloss (dB)
-0.61007115 0.398534317 0.626148719 1
1
3
5
7
9
11
13
15
17
19
0.04 0.12 0.2 0.28 0.36 0.44 0.52 0.6 0.68
Ma
xim
um
Err
or
an
d
Ma
xim
um
% E
rro
r
Distance (km)
Maximum Error between the lowest and the highest measured pathloss values atthat measurement point

Journal of Multidisciplinary Engineering Science and Technology (JMEST)
ISSN: 2458-9403
Vol. 5 Issue 11, November - 2018
www.jmest.org
JMESTN42352768 9116
Table 11 The measured pathloss and the predicted pathloss at measurement point 18
Measured Pathloss
(dB) Predicted Pathloss
(dB) Error Error
2
First Day Morning 142.7 141.212894 1.487106 2.21148541
First Day Afternoon 138.96 137.385692 1.574308 2.47844623
First Day Evening 138.94 141.52189 -2.58189 6.6661553
Second Day Morning 140.23 140.862527 -0.63253 0.40009002
Second Day Afternoon 136.78 138.975091 -2.19509 4.81842446
Second Day Evening 144.34 141.989589 2.350411 5.52442967
Regression coefficient between the measured pathloss and the predicted pathloss
0.648293172 RMSE 1.91915915
A multiple linear regression model used to predict the measured pathloss with the measured atmospheric parameters at measurement point 18 is given in Eq 5 . The regression coefficient between the measured pathloss and the predicted pathloss at measurement point 18 is significant with a value of 0.648293172; also the RMSE value is quite small with a value of 1.91915915 dB, as shown in Table 11.
Predicted Pathloss (dB) = 0.949042436 T+ 0.063377263 P +0.543176 H (5)
Although the model in Eq 5 and the correlation
coefficient between the measured pathloss and the predicted pathloss in Table 12 in do not apply to the data at the other data measurement points nevertheless the results show that there is significant correlation between the variations in the atmospheric parameters and the variations in the measured pathloss at any given point within the network coverage area. As such, appropriate pathloss model or appropriate pathloss tuning method that incorporates the atmospheric parameters can be more effective in modelling the pathloss at any given point within a network coverage area.
IV. CONCLUSION The study on the effect of temperature , pressure and relative humidity on pathloss for a 900 MHz GSM network is presented. Empirical measurement of Received Signal Strengths (RSS) and weather parameters were conducted in two different days and at different time (morning, afternoon and evening) on each day. From the RSS value, the measured pathloss are computed. Maximum error or disparity between the lowest and the highest measured pathloss values at that measurement point were obtained. The results showed that at different times of the day the measured pathloss values at any given point in the selected network coverage area were different. In all, the study results showed that there is significant correlation between the variations in the atmospheric parameters and the variations in the measured pathloss at any given point within the network coverage area. As such, appropriate pathloss model or appropriate pathloss tuning method that incorporates the atmospheric parameters can be more effective in modelling the
pathloss at any given point within a network coverage area.
REFERENCES 1. Ai, Y., Andersen, J. B., & Cheffena, M. (2017).
Path-Loss Prediction for an Industrial Indoor Environment Based on Room Electromagnetics. IEEE Transactions on Antennas and Propagation.
2. Usanga, E. M., & Adams, E. J. (2016). Measurement And Analysis Of Gsm-Based Transmission Losses In Mkpat Enin And Its Environs, Akwa Ibom State, Nigeria. Akwapoly Journal of Communication and Scientific Research, 1(2), 35-49.
3. Shoewu, O., & Edeko, F. O. (2014). Propagation Loss Determination in Cluster Based Gsm Base Stations in Lagos Environs. International Transaction of Electrical and Computer Engineers System, 2(1), 28-33.
4. Rani, P., Chauhan, V., Kumar, S., & Sharma, D. (2014). A Review on Wireless Propagation Models. International Journal of Engineering and Innovative Technology, 3(11), 256-261.
5. Papas, C. H. (2014). Theory of electromagnetic wave propagation. Courier Corporation.
6. ABA, R. O. (2014). Path Loss Prediction For Gsm Mobile Networks For Urban Region Of Aba, South-East Nigeria.
7. Akpado, K. A., Oguejiofor, O. S., Adewale, A., & Ejiofor, A. C. (2013). Pathloss Prediction for a typical mobile communication system in Nigeria using empirical models. IRACST–International Journal of Computer Networks and Wireless Communications (IJCNWC), 3(2), 207-211.
8. Kumar, M., Kumar, V., & Malik, S. (2012). Performance and analysis of propagation models for predicting RSS for efficient handoff. Jurnal Ilmiah. Electronics and Communication, 1.
9. Ayyappan, K., & Dananjayan, P. (2008). Propagation model for highway in mobile communication system. Ubiquitous Computing and Communication Journal, 3(4), 61-66.
10. Debus, W. (2006). RF path loss & transmission distance calculations. Axonn, LLC.

Journal of Multidisciplinary Engineering Science and Technology (JMEST)
ISSN: 2458-9403
Vol. 5 Issue 11, November - 2018
www.jmest.org
JMESTN42352768 9117
11. Ibhaze, A. E., Imoize, A. L., Ajose, S. O., John, S. N., Ndujiuba, C. U., & Idachaba, F. E. (2017). An Empirical Propagation Model for Path Loss Prediction at 2100MHz in a Dense Urban Environment. Indian Journal of Science and Technology, 8(1).
12. Series, P. (2012). Propagation data and prediction methods for the planning of indoor radiocommunication systems and radio local area networks in the frequency range 900 MHz to 100 GHz. ICU: Genève, Switzerland.
13. Mulligan, J. (1997). A Performance Analysis of a CSMA Multihop Packet Radio Network.
14. Kumbhar, A., Guvenc, I., Singh, S., & Tuncer, A. (2017). Exploiting LTE-Advanced HetNets and FeICIC for UAV-assisted Public Safety Communications. arXiv preprint arXiv:1708.01226.
15. Krishnan, N. N., Sridharan, G., Seskar, I., & Mandayam, N. (2017, March). Coverage and rate analysis of super Wi-Fi networks using stochastic geometry. In Dynamic Spectrum Access Networks (DySPAN), 2017 IEEE International Symposium on (pp. 1-10). IEEE.
16. Liu, R., Wang, Y., Shu, M., & Wu, S. (2017). Throughput assurance of wireless body area networks coexistence based on stochastic geometry. PloS one, 12(1), e0171123.
17. Amjad, K., Ali, M., Jabbar, S., Hussain, M., Rho, S., & Kim, M. (2015). Impact of dynamic path loss models in an urban obstacle aware ad hoc network environment. Journal of Sensors, 2015.
18. Hrovat, A., Kandus, G., & Javornik, T. (2014). A survey of radio propagation modeling for tunnels. IEEE Communications Surveys & Tutorials, 16(2), 658-669.
19. Wang, L. (2013). Cooperative and Cognitive Communication in Wireless Networks (Doctoral dissertation, KTH Royal Institute of Technology).
20. Singh, Y. (2012). Comparison of okumura, hata and cost-231 models on the basis of path loss and signal strength. International journal of computer applications, 59(11).
21. Bouzera, N., & Kheirddine, A. (2014). Comparison of Propagation Models for Small Urban Cells in GSM Network. Journal of Networking Technology Volume, 5(4), 125.
22. Agrawal, A. (2013). Evolving CSP Algorithm in Predicting the Path Loss of Indoor Propagation Models. International Journal Of Computer Applications Technology And Research, 2(2), 86-90.
23. Abhayawardhana, V. S., Wassell, I. J., Crosby, D., Sellars, M. P., & Brown, M. G. (2005, May). Comparison of empirical propagation path loss models for fixed wireless access systems. In Vehicular Technology Conference, 2005. VTC 2005-Spring. 2005 IEEE 61st (Vol. 1, pp. 73-77). IEEE. -hour .
Related Documents


![The effects of elevated atmospheric [CO2] on Norway spruce needle parameters](https://static.cupdf.com/doc/110x72/63347b497a687b71aa08b466/the-effects-of-elevated-atmospheric-co2-on-norway-spruce-needle-parameters.jpg)