Evaluation of the Convergence European Social Fund (ESF) Programme 2007 - 2013 Final report September 2015 Pye Tait Consulting Royal House, 110 Station Parade, Harrogate, HG1 1EP Tel: 01423 509433 Fax: 01423 509502 Email: [email protected] Website: www.pyetait.com Cert No: 76000/GB/Q

Welcome message from author
This document is posted to help you gain knowledge. Please leave a comment to let me know what you think about it! Share it to your friends and learn new things together.
Transcript

Evaluation of the Convergence European Social Fund (ESF)
Programme 2007 - 2013
Final report
September 2015
Pye Tait Consulting Royal House, 110 Station Parade, Harrogate, HG1 1EP Tel: 01423 509433 Fax: 01423 509502 Email: [email protected] Website: www.pyetait.com
Cert No: 76000/GB/Q
Evaluation of the ESF Convergence Programme
September 2015 Page 2 ISO9001:2008 QAP 01/01 Issue 8
Table of contents
Executive summary ...................................................................................................................... 6 1. Introduction ........................................................................................................................... 16
1.1 Background context .................................................................................................................... 16 1.2 Research aim and objectives ...................................................................................................... 18 1.3 Report structure .......................................................................................................................... 19
2. About the ESF Convergence programme ................................................................................. 20
2.1 Programme strategic aims .......................................................................................................... 20 2.2 ESF Convergence Programme targets ......................................................................................... 21
3. Key findings – programme level .............................................................................................. 24
3.1 Policy and economic changes in the external landscape ............................................................ 24 3.2 Impact of policy and economic changes on the ESF Convergence programme ......................... 25 3.3 Programme design ...................................................................................................................... 27 3.4 Effectiveness of strategic linkages with ERDF ............................................................................. 28 3.5 Cross-cutting themes .................................................................................................................. 29 3.6 Programme performance against targets ................................................................................... 36 3.7 Differences between the first and second half of the programme ............................................ 45 3.8 Social and economic impacts ...................................................................................................... 50 3.9 Changes to baseline conditions in the region since the start of the programme ...................... 51 3.10 Value for money ........................................................................................................................ 59 3.11 Strategic considerations for future programmes ..................................................................... 62
4. Key findings – Priority 4 .......................................................................................................... 63
4.1 Performance against targets – Priority 4 .................................................................................... 63 4.2 Effectiveness of project delivery – Priority 4 .............................................................................. 67 4.3 Barriers – Priority 4 ..................................................................................................................... 69 4.4 Impacts – Priority 4 ..................................................................................................................... 70
5. Key findings – Priority 5 .......................................................................................................... 73
5.1 Performance against targets – Priority 5 .................................................................................... 73 5.2 Effectiveness of delivery – Priority 5 ........................................................................................... 78 5.3 Barriers – Priority 5 ..................................................................................................................... 79 5.4 Impacts – Priority 5 ..................................................................................................................... 80
6. Key findings – Priority 6 .......................................................................................................... 83
6.1 About Technical Assistance ......................................................................................................... 83 6.2 Effectiveness of use of technical assistance ............................................................................... 85 6.3 Gaps and opportunities to improve technical assistance ........................................................... 87
7. Conclusions and recommendations ......................................................................................... 89
7.1 Research conclusions .................................................................................................................. 89 7.2 Recommendations ...................................................................................................................... 93
Appendix 1: Research methodology ........................................................................................... 95 Appendix 2: projects in scope of this evaluation ......................................................................... 96

Evaluation of the ESF Convergence Programme
September 2015 Page 3 ISO9001:2008 QAP 01/01 Issue 8
List of figures
Figure 1: Priority 4 – achievement against targets ................................................................................. 8
Figure 2: Priority 5 – achievement against targets ................................................................................. 8
Figure 3: Priority 4 - % of achievement against targets compared with the national average (Priority 1
contracts) ................................................................................................................................................ 9
Figure 4: Priority 5 - % of achievement against targets compared with the national average (Priority 2
contracts) ................................................................................................................................................ 9
Figure 5: Comparison of % of target achieved in the first and second halves of the programme –
Priority 4 ................................................................................................................................................ 10
Figure 6: Comparison of % of target achieved in the first and second halves of the programme –
Priority 5 ................................................................................................................................................ 11
Figure 7: % of achievement against targets, supporting participants with disabilities – Priority 4
compared with Priority 1 (rest of England)........................................................................................... 31
Figure 8: % of achievement against targets, supporting participants with disabilities – Priority 5
compared with Priority 2 (rest of England)........................................................................................... 32
Figure 9: % of achievement against targets, supporting participants from ethnic minorities – Priority
4 compared with Priority 1 (rest of England) ........................................................................................ 33
Figure 10: % of achievement against targets, supporting participants from ethnic minorities – Priority
5 compared with Priority 2 (rest of England) ........................................................................................ 34
Figure 11: % of achievement against targets, supporting female participants – Priority 5 compared
with Priority 2 (rest of England) ............................................................................................................ 35
Figure 12: % of achievement against targets, supporting female participants – Priority 4 compared
with Priority 1 (rest of England) ............................................................................................................ 36
Figure 13: Priority 4 – achievement against targets (actual numbers as at July 2015) ........................ 37
Figure 14: Priority 5 – achievement against targets (actual numbers as at July 2015) ........................ 38
Figure 15: Priority 4 - % of achievement against targets compared with the national average (Priority
1 contracts) ........................................................................................................................................... 39
Figure 16: Priority 5 - % of achievement against targets compared with the national average (Priority
2 contracts) ........................................................................................................................................... 40
Figure 17: Priority 5 - % of achievement against targets in Cornwall and the Isles of Scilly ................ 40
Figure 18: Summary of SFA contracts (where data available) % of achievement against targets ....... 41
Figure 19: Proportion of total number of participants achieving outcomes/outputs (SFA contracts
where data available)............................................................................................................................ 42
Figure 20: % of targets achieved for completion of training with GLH (SFA contracts where data
available) ............................................................................................................................................... 42
Figure 21: % of targets achieved for learning activity completions (SFA contracts where data
available) ............................................................................................................................................... 43
Figure 22: % of targets achieved for qualifications levels 1-5 (SFA contracts where data available) .. 44
Figure 23: % of targets achieved for companies supported (SFA contracts where data available) ..... 45
Figure 24: % of target achieved in the first and second halves of the programme – Priority 4 ........... 46
Figure 25: Actual numbers achieved in the first and second halves of the programme – Priority 4 ... 46
Figure 26: % of target achieved in the first and second halves of the programme – Priority 5 ........... 47
Figure 27: Actual numbers achieved in the first and second halves of the programme – Priority 5 ... 48
Figure 28: Regional demography compared with Great Britain 2007-2014 ......................................... 51

Evaluation of the ESF Convergence Programme
September 2015 Page 4 ISO9001:2008 QAP 01/01 Issue 8
Figure 29: Number of businesses in the region compared with the UK 2007-2014 ............................. 52
Figure 30: Number of new business start-ups in Cornwall and the Isles of Scilly 2007-2013 .............. 53
Figure 31: Number of closed businesses in Cornwall and the Isles of Scilly 2007-2013 ....................... 54
Figure 32: Numbers of people employed regionally and nationally 2007-2014 .................................. 55
Figure 33: Numbers of people aged 50-64 employed regionally and nationally 2007-2014 ............... 56
Figure 34: Unemployment rate regionally and nationally 2007-2014 .................................................. 56
Figure 35: Claimant counts Cornwall and the Isles of Scilly 2007-2015 ............................................... 57
Figure 36: Proportion of NEETs by region 2012 and 2014 .................................................................... 58
Figure 37: % of working age individuals and their qualification status in Cornwall 2007-2014 ........... 59
Figure 38: % of achievements against targets, participant starts - Priority 4 and Priority 1 (rest of
England) ................................................................................................................................................ 63
Figure 39: % of achievements against targets, participants that were unemployed and in work on
leaving - Priority 4 and Priority 1 (rest of England) ............................................................................... 64
Figure 40: % of achievements against targets, supporting participants that were economically
inactive - Priority 4 and Priority 1 (rest of England) .............................................................................. 65
Figure 41: % of achievements against targets, participants that were NEET and those supported into
EET - Priority 4 and Priority 1 (rest of England) .................................................................................... 66
Figure 42: % of achievements against targets, participants that were aged over 50 - Priority 4 and
Priority 1 (rest of England) .................................................................................................................... 67
Figure 43: % of achievements against targets, participant starts - Priority 5 and Priority 2 (rest of
England) ................................................................................................................................................ 73
Figure 44: % of achievements against targets, participants supported without basic skills and to gain
basic skills - Priority 5 and Priority 2 (rest of England) ......................................................................... 74
Figure 45: % of achievements against targets, participants supported without level 2 qualifications
and to gain them - Priority 5 and Priority 2 (rest of England) ............................................................... 75
Figure 46: % of achievements against targets, participants supported without level 3 qualifications
and to gain them - Priority 5 and Priority 2 (rest of England) ............................................................... 76
Figure 47: % of achievements against targets, participants that were aged over 50 - Priority 5 and
Priority 2 (rest of England) .................................................................................................................... 77
Figure 48: Priority 5 - % of achievements against targets .................................................................... 78
Figure 49: Cornwall Works WISE Awards .............................................................................................. 86
List of tables
Table 1: Convergence programme priority axis’ for investment .......................................................... 17
Table 2: Programme targets, Priority 4 ................................................................................................. 21
Table 3: Programme targets, Priority 5 ................................................................................................. 22
Table 4: Funding allocation for ESF Convergence 2007-2013 .............................................................. 23
Table 5: Technical Assistance projects, Convergence programme ....................................................... 84

Evaluation of the ESF Convergence Programme
September 2015 Page 5 ISO9001:2008 QAP 01/01 Issue 8
Glossary
C&IoS Cornwall and the Isles of Scilly
CFO Co-Financing Organisation
CMG Convergence Management Group
CUC Combined Universities Cornwall
DWP Department for Work and Pensions
EAFRD European Agricultural Fund for Rural Development
EFF European Fisheries Fund
ERDF European Regional Development Fund
ESF European Social Fund
FE Further Education
GDP Gross National Product
GOSW Government Office South West
GVA Gross Value Added
HE Higher Education
IB Intermediary Body
IP Industrial Partnership
ITI Integrated Territorial Investment
LCEA Low Carbon Economic Area
LEP Local Enterprise Partnership
LMC Local Management Committee
NEET Not in Education, Employment or Training
NOMS National Offender Management Service
NVQ National Vocational Qualification
OBR Office of Budgetary Responsibility
ONS Office for National Statistics
RDA Regional Development Agency
SFA Skills Funding Agency
SME Small or Medium Enterprise
SWRDA South West Regional Development Agency
TNA Training Needs Analysis
Evaluation of the ESF Convergence Programme
September 2015 Page 6 ISO9001:2008 QAP 01/01 Issue 8
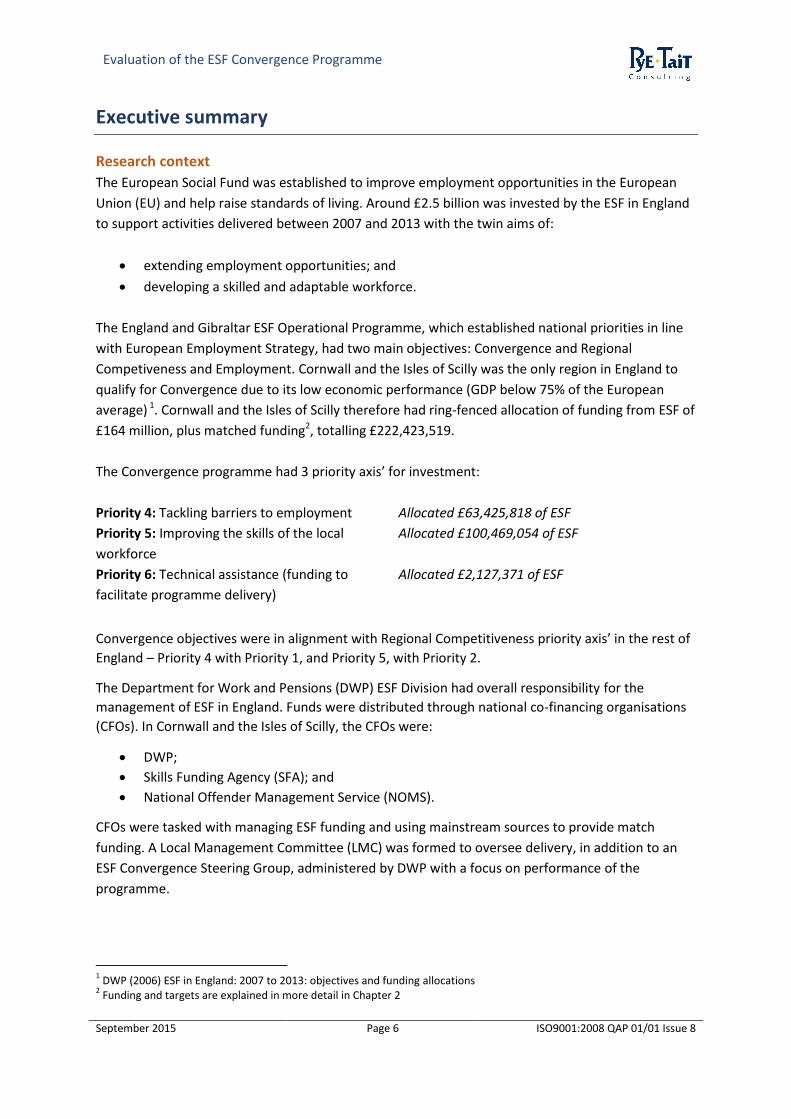
Executive summary
Research context
The European Social Fund was established to improve employment opportunities in the European
Union (EU) and help raise standards of living. Around £2.5 billion was invested by the ESF in England
to support activities delivered between 2007 and 2013 with the twin aims of:
extending employment opportunities; and
developing a skilled and adaptable workforce.
The England and Gibraltar ESF Operational Programme, which established national priorities in line
with European Employment Strategy, had two main objectives: Convergence and Regional
Competiveness and Employment. Cornwall and the Isles of Scilly was the only region in England to
qualify for Convergence due to its low economic performance (GDP below 75% of the European
average) 1. Cornwall and the Isles of Scilly therefore had ring-fenced allocation of funding from ESF of
£164 million, plus matched funding2, totalling £222,423,519.
The Convergence programme had 3 priority axis’ for investment:
Priority 4: Tackling barriers to employment Allocated £63,425,818 of ESF
Priority 5: Improving the skills of the local
workforce
Allocated £100,469,054 of ESF
Priority 6: Technical assistance (funding to
facilitate programme delivery)
Allocated £2,127,371 of ESF
Convergence objectives were in alignment with Regional Competitiveness priority axis’ in the rest of
England – Priority 4 with Priority 1, and Priority 5, with Priority 2.
The Department for Work and Pensions (DWP) ESF Division had overall responsibility for the
management of ESF in England. Funds were distributed through national co-financing organisations
(CFOs). In Cornwall and the Isles of Scilly, the CFOs were:
DWP;
Skills Funding Agency (SFA); and
National Offender Management Service (NOMS).
CFOs were tasked with managing ESF funding and using mainstream sources to provide match
funding. A Local Management Committee (LMC) was formed to oversee delivery, in addition to an
ESF Convergence Steering Group, administered by DWP with a focus on performance of the
programme.
1 DWP (2006) ESF in England: 2007 to 2013: objectives and funding allocations
2 Funding and targets are explained in more detail in Chapter 2

Evaluation of the ESF Convergence Programme
September 2015 Page 7 ISO9001:2008 QAP 01/01 Issue 8
Research aims and objectives
The aim of this evaluation is to understand and demonstrate impact on the local area and
effectiveness in delivering the targets and outputs of the ESF Convergence Programme in Cornwall
and the Isles of Scilly.
The main objectives of the evaluation were to:
Review the programme’s objectives and targets, in the context of changes to the external
landscape since it was developed, and analyse outputs compared with targets,
benchmarking where appropriate against other UK programmes;
Identify aspects of the programme that were particularly effective, as well as those that
were less effective, and the lessons learned from this to improve future programmes;
Appraise the counterfactual situation in respect of the ESF programme; i.e. would the
impacts still have been achieved in the absence of the funding, and determine how
effectively provision has aligned with other mainstream funding;
Analyse the social and economic impacts of the ESF programme including the extent to
which strategic partnerships/linkages between ESF projects and other programmes such as
ERDF were formed/sustained; and
Identify any other areas of improvement from a process and delivery perspective that would
be useful intelligence for future programmes.
This research has combined desk-based evaluation of a wide range of secondary data sources, with
in-depth interviews with nearly 50 individuals and organisations involved in the strategic
management and operational delivery of the ESF Convergence programme.
Key findings
Performance against targets
The Convergence programme has substantially over achieved its targets in respect of the numbers of
participants supported overall, and for a wide range of other deliverables including the numbers
gaining qualifications at levels 2, 3, 4 and 5 and those in work upon leaving the programme (Figures
1 and 2).
Furthermore, substantial overachievements against the majority of targets have been delivered in
spite of the fact that not all the funding has been spent3, with around 23% of ESF allocation unused
to date.
3 Based on data up to 1
st September 2015, subject to revision as final outputs are recorded and analysed

Evaluation of the ESF Convergence Programme
September 2015 Page 8 ISO9001:2008 QAP 01/01 Issue 8
Figure 1: Priority 4 – achievement against targets
Source: ESF Division, DWP (July 2015)
Figure 2: Priority 5 – achievement against targets
Source: ESF Division, DWP (July 2015)
Figures 3 and 4 show the percentage of achieved outputs against programme targets for Priorities 4
and 5 (compared with national averages, Priorities 1 and 2 respectively). These highlight the vast
24,500
10,200
8,400
4,900
5,900
2,200
71,843
35,489
17,782
16,714
11,881
13,748
0% 10% 20% 30% 40% 50% 60% 70% 80% 90% 100%
Total number of participants
Participants who are unemployed
Participants who are inactive
Participants aged 14 to 19 not in education,employment or training i.e. NEETS (or at risk)
Participants in work on leaving
14 to 19 NEETs or at risk in education, employment ortraining on leaving
%
Ou
tpu
ts a
nd
res
ult
s
2007-2013 targets Achievements
50,200
18,200
18,200
5,400
3,800
800
1,100
8,200
7,300
1,600
760
120
830
114,031
9,757
24,332
25,697
19801
1037
1494
10,357
14,584
6964
1316
632
952
0% 10% 20% 30% 40% 50% 60% 70% 80% 90% 100%
Total number of participants
Participants with basic skills needs
Participants without a level 2 qualification
Participants without a level 3 qualification
Participants without a level 4 or above qualification
Number participating in research qualifications (Masters/PhD)
Number of graduate placements
Participants gaining basic skills
Participants gaining a level 2 qualification
Participants gaining a level 3 qualification
Participants gaining a level 4 qualification
Participants undertaking post-graduate research gaining level…
Graduates placed within SMEs who gained employment
%
Ou
tpu
ts a
nd
res
ult
s
2007-2013 targets Achievements

Evaluation of the ESF Convergence Programme
September 2015 Page 9 ISO9001:2008 QAP 01/01 Issue 8
overachievement of targets in England and in Cornwall & the Isles of Scilly, in nearly all areas of the
programme.
Figure 3: Priority 4 - % of achievement against targets compared with the national average
(Priority 1 contracts)
Source: ESF Division, DWP (July 2015)
Figure 4: Priority 5 - % of achievement against targets compared with the national average
(Priority 2 contracts)
Source: ESF Division, DWP (July 2015) N.B. There was no equivalent target for level 4 in Priority 2
387
513
212
427
261
650
293
348
212
341
201
625
0 100 200 300 400 500 600 700
Participant total
Unemployed
Economically inactive
14-19 NEET
In work on leaving
14-19 NEET into EET
%
Del
iver
able
s
Cornwall & the Isles of Scilly England & Gibraltar
239
148
123
495
114
260
407
227
54
134
476
120
200
435
521
0 100 200 300 400 500 600
Participant total
With basic skills needs
Without level 2
Without level 3
Gained basic skills
Gained level 2
Gained level 3
Without level 4
%
Del
iver
able
s
Cornwall & the Isles of Scilly England & Gibraltar

Evaluation of the ESF Convergence Programme
September 2015 Page 10 ISO9001:2008 QAP 01/01 Issue 8
Differences between the first and second halves of the programme
For the most part, the majority of achieved numbers against the overall target were delivered in the
first half of the programme between 2008 and 2011 (Figures 5 and 6)4. For example around two-
thirds of total participants had been supported via Priority 4, and nearly three-quarters supported
via Priority 5, in the first half of the programme.
A slightly more balanced split could be seen in the number of unemployed people supported in
Priority 4, with 54% in the first half and 46% in the second half of the programme.
Figure 5: Comparison of % of target achieved in the first and second halves of the programme –
Priority 4
Source: Cornwall Council (August 2015)
4 Data correct as at August 2015
61%
54%
72%
62%
39%
46%
28%
38%
0%
10%
20%
30%
40%
50%
60%
70%
80%
Participanttotal
Unemployed Economicallyinactive
14-19 NEET
January 2008 - December 2011
January 2012 - April 2015

Evaluation of the ESF Convergence Programme
September 2015 Page 11 ISO9001:2008 QAP 01/01 Issue 8
Figure 6: Comparison of % of target achieved in the first and second halves of the programme –
Priority 5
Source: Cornwall Council (August 2015)
Programme governance was subject to change after the Coalition Government came to power in
May 2010. The Convergence programme lost significant local strategic oversight and input as a result
of organisations, such as Government Office South West, being wound up and the installation of a
more rigid, nationally-led approach to contract management within the CFOs, notably DWP and the
SFA.
In spite of these structural changes, local input was maintained in relation to the latter half of the
programme, with local stakeholders and delivery partners influencing factors such as wider eligibility
criteria to offer greater local flexibility directly influenced by the needs of local customers.
Stakeholders and partners worked more closely together in the context of austerity, which created
new models of delivery avoiding duplication of provision, and contributing to a more lasting legacy
of collaborative working in Cornwall and the Isles of Scilly.
The latter part of the programme experienced some issues as new prime providers were not based
in the region. It took some time to establish effective working relationships; this issue was
exacerbated by a new DWP payment model which meant providers had to absorb a higher
proportion of delivery costs before they were eligible to receive a payment. This model was revised
72% 73%
79%
70% 67%
65% 62%
28% 27%
21%
30%
33% 35%
38%
0%
10%
20%
30%
40%
50%
60%
70%
80%
90%
ParticipantTotal
Basic skillneeds
Withoutlevel 2
Withoutlevel 3
Withoutlevel 4
PhD Graduateplacements
January 2008 -December 2011
January 2012 -April 2015

Evaluation of the ESF Convergence Programme
September 2015 Page 12 ISO9001:2008 QAP 01/01 Issue 8
in response to local feedback and ultimately the affected contracts were able to achieve their
targets, however this did affect the programme, as there was less time available for engagement and
delivery while these issues were being resolved.
Critical success factors
Critical success factors underpinning the most effective delivery of the programme include:
Effective programme design
Underpinned by robust Labour Market Intelligence and a collaborative approach between
key regional stakeholders and CFOs
Partnership working
Underpinned a more seamless participant journey, reduced competition for the target group
and enabled a wider range of complementary provision
Engagement
Third sector organisations and social enterprises in particular have made good use of their
relationships in the community and understanding of the target group
Flexibility in using the funds
Bespoke provision tailored to meet the specific and local needs of individuals and businesses
more likely to result in long-lasting positive social and economic effects for the region
Capacity building
Use of Technical Assistance funds to build capacity in third sector organisations and this must
be sustained and developed
Dedicated projects targeting key target groups
Engagement with females and participants with disabilities particularly effective in Priorities
5 and 4 respectively, due to dedicated projects designed to target these cohorts5.
Barriers to effective delivery
There were a number of common barriers that obstructed providers from making the best use of the
funds:
Inflexibility
Less flexibility in relation to eligibility criteria in the latter part of the programme – for
example not able to support people to gain a second level 2 qualification in the second half –
which narrowed the target group and meant some people could not participate;
5 For example Cornwall Works for Learning Disabilities (Priority 4) and Empowering Smart Women (Priority 5)

Evaluation of the ESF Convergence Programme
September 2015 Page 13 ISO9001:2008 QAP 01/01 Issue 8
Structural conflicts
For example ERDF projects were not co-commissioned, State Aid rules were a barrier, and in
many cases, timescales were not in alignment and information not shared, which could have
helped create synergies between projects and make better use of the money;
Obstructions in the participant journey
Referrals diminished via Local Authority Children’s Schools and Families pathway through
plus impact of the prime contractor and revised payment model created blockages
Less ‘joined up’ strategically after 2010
Less joined up strategic leadership from a ‘top down’ perspective following the closure of
Government Office South West and the South West Regional Development Agency
Cross-cutting themes not always explicitly addressed in skills contracts
A longer-term risk as the EU is able to claw monies back if there is insufficient evidence
demonstrating how these were incorporated into programme delivery.
Impacts
There have been positive social and economic impacts for the region since the start of the
programme in 2007, through to 2014/15, notably6:
An 11% increase in the number of females employed between 2007 and 2014;
An increase of 14% in the total number of people employed between 2007 and 2014;
An increase of 25% of the number of people employed aged 50-64 between 2007 and 2014;
An increase of 25% in the number of new business start-ups between 2011 and 2013;
A decrease in the number of people with no qualifications from 10% to 6% between 2007
and 2014;
A decrease in the number of NEETs, from 5.1% to 4.2% in Cornwall between 2012 and 2014.
Other impacts can be attributed directly to the programme, for example:
Strong linkages between the Higher Education (HE) community and local businesses, with
closer collaborative relationships that are expected to be maintained after the funding ends;
Aspirations to access HE have been raised, and furthermore there has been development of,
and greater aspiration for, higher level skills in the region at levels 4 and 5;
Capacity building within the third sector notably among social enterprises, has been positive,
although there is less evidence to demonstrate that the effects will be sustained beyond the
life of the programme;
6 It should be noted that not all these impacts can be directly attributed to the impact of ESF alone, as other factors outside
the scope of this study will also have played a part

Evaluation of the ESF Convergence Programme
September 2015 Page 14 ISO9001:2008 QAP 01/01 Issue 8
A number of start-up businesses considered to be ‘cutting edge’ have been established as a
direct result of the programme, expected to have a sustainable economic benefit by creating
jobs and improving Gross Value Added (GVA) in the region.
Furthermore there are many case studies demonstrating positive impacts at an individual level,
which are expected to translate into longer-lasting social and economic benefits, as the influence of
the programme supports people to improve their skills and qualifications and progress into
employment or further learning.
Value for money and assessment of the counterfactual
Three core criteria are commonly used to assess value for money, also described as “the optimal use
of resources to achieve the intended outcomes”7:
1. How economical the approach was in spending the funds – i.e. minimising the costs of
resources or other inputs required;
2. How efficiently the funds were allocated – i.e. was it managed in the most appropriate way;
and
3. How effectively the funds were spent – i.e. did the programme bring about the desired
outputs and outcomes.
There is a consensus that without ESF, the impacts that can be directly attributed to the programme,
would not have been achieved, and furthermore that funding could not have been provided through
any other means that would have offered the same type and volume of provision.
Furthermore there has been substantial overachievement against the majority of targets in spite of
the fact that at the time of writing, around 23% of ESF funds had not been spent (not including
match funding). This does not take into account the performance/spend of contracts that are yet to
be completed; a full dataset will not be available until towards the end of 20158.
It is clear that the money has made a difference to the region, and has produced worthwhile outputs
and outcomes – socially and economically. However changes in the second half of the programme
meant some projects were not delivered as efficiently or as cost effectively as they could have been,
and there was less time left for actual delivery due to various delays. Whilst, therefore, funding has
not been fully maximised to best effect, this was due to factors that were predominantly outside the
control of the local management teams.
7 Criteria typically used by a number of Government departments and other public bodies including the National Audit
Office 8 It should be noted that as this evaluation has been funded by Technical Assistance, the work had to be completed by the
end of August 2015, to meet with payment regulations, and therefore it has not been possible to analyse a full dataset on programme performance and spend against targets
Evaluation of the ESF Convergence Programme
September 2015 Page 15 ISO9001:2008 QAP 01/01 Issue 8
In summary therefore, ultimately the majority of targets have been overachieved, using only around
75% of the ESF allocation. This suggests that value for money has been achieved, although lessons
can be learned for future programmes to maximise the funds to full effect.
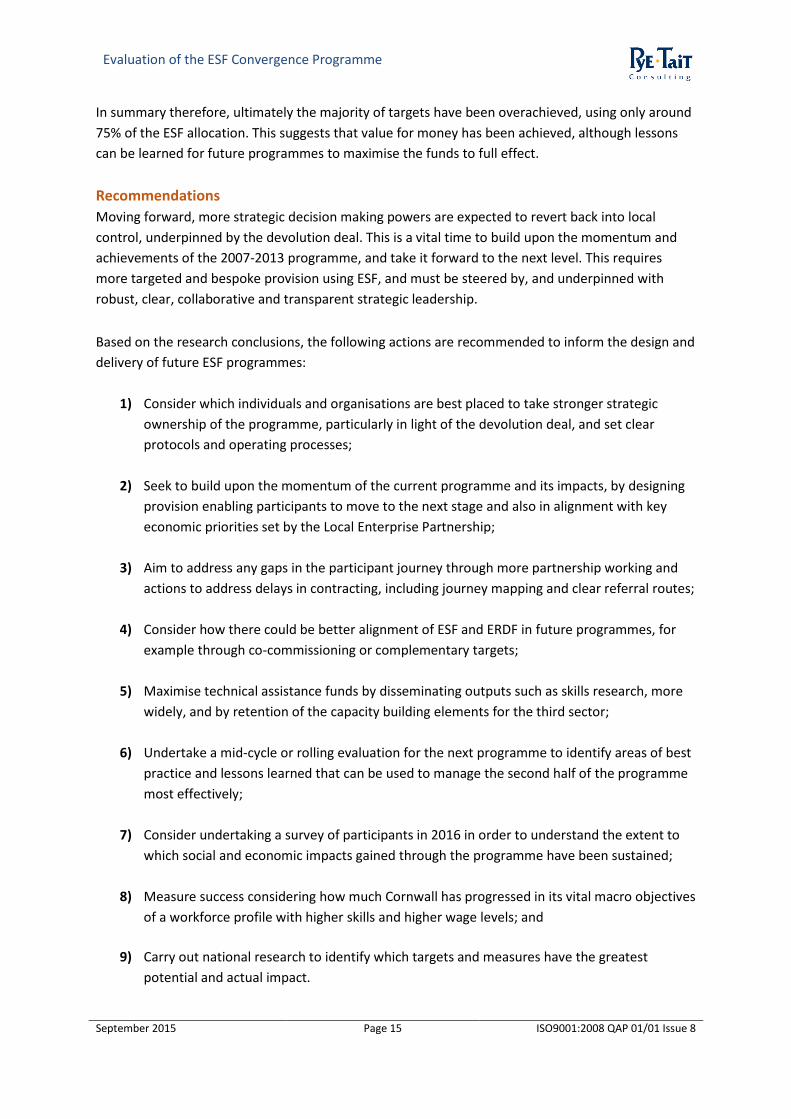
Recommendations
Moving forward, more strategic decision making powers are expected to revert back into local
control, underpinned by the devolution deal. This is a vital time to build upon the momentum and
achievements of the 2007-2013 programme, and take it forward to the next level. This requires
more targeted and bespoke provision using ESF, and must be steered by, and underpinned with
robust, clear, collaborative and transparent strategic leadership.
Based on the research conclusions, the following actions are recommended to inform the design and
delivery of future ESF programmes:
1) Consider which individuals and organisations are best placed to take stronger strategic
ownership of the programme, particularly in light of the devolution deal, and set clear
protocols and operating processes;
2) Seek to build upon the momentum of the current programme and its impacts, by designing
provision enabling participants to move to the next stage and also in alignment with key
economic priorities set by the Local Enterprise Partnership;
3) Aim to address any gaps in the participant journey through more partnership working and
actions to address delays in contracting, including journey mapping and clear referral routes;
4) Consider how there could be better alignment of ESF and ERDF in future programmes, for
example through co-commissioning or complementary targets;
5) Maximise technical assistance funds by disseminating outputs such as skills research, more
widely, and by retention of the capacity building elements for the third sector;
6) Undertake a mid-cycle or rolling evaluation for the next programme to identify areas of best
practice and lessons learned that can be used to manage the second half of the programme
most effectively;
7) Consider undertaking a survey of participants in 2016 in order to understand the extent to
which social and economic impacts gained through the programme have been sustained;
8) Measure success considering how much Cornwall has progressed in its vital macro objectives
of a workforce profile with higher skills and higher wage levels; and
9) Carry out national research to identify which targets and measures have the greatest
potential and actual impact.

Evaluation of the ESF Convergence Programme
September 2015 Page 16 ISO9001:2008 QAP 01/01 Issue 8
1. Introduction
1.1 Background context
1.1.1 The European Social Fund (ESF)
The European Social Fund was established to improve employment opportunities in the European
Union (EU) and help raise standards of living. Around £2.5 billion was invested by the ESF in England
to support activities delivered between 2007 and 2013 with the twin aims of:
extending employment opportunities; and
developing a skilled and adaptable workforce.
It is imperative that ESF funding adds value to regional employment and skills priorities by
supplementing existing mainstream funding. Activities are therefore tailored to meet regional needs,
with ESF funding focusing on activities intended to support those groups most disadvantaged.
These include:
those who are long-term unemployed;
people who face significant barriers to work (for example lone parents or those with few/no
qualifications); and
young people who are not in education, employment or training (NEETs).
The Managing Authority for the 2007-2013 ESF programme in England was the European Social Fund
Division (ESFD) of the Department for Work and Pensions (DWP).
1.1.2 ESF in Cornwall & the Isles of Scilly
The England and Gibraltar ESF Operational Programme, which established national priorities in line
with European Employment Strategy, had two main objectives: Convergence and Regional
Competiveness and Employment. Cornwall and the Isles of Scilly was the only region in England to
qualify for Convergence due to its low economic performance (GDP below 75% of the European
average) 9. Cornwall and the Isles of Scilly therefore had ring-fenced allocation of funding from ESF of
£164 million, plus matched funding10.
The ESF Operational Programme, which was the strategic document that summarised the aims and
investment priorities for the ESF Convergence framework, identified 3 priority axis’ for investment,
described in Table 1 below11:
9 DWP (2006) ESF in England: 2007 to 2013: objectives and funding allocations
10 Funding and targets are explained in more detail in Chapter 2
11 Cornwall and Isles of Scilly Convergence Operational Programme 2007 -2013

Evaluation of the ESF Convergence Programme
September 2015 Page 17 ISO9001:2008 QAP 01/01 Issue 8
Table 1: Convergence programme priority axis’ for investment
Priority axis
Description
4: Tackling barriers to employment Increase employment and reduce unemployment and inactivity by tackling barriers to work faced by disadvantaged groups such as people with disabilities or health conditions, lone parents and other disadvantaged parents, older workers, ethnic minorities, and people with no or low qualifications. Support young people make a successful transition to the world of work, in particular those not in education, employment or training (NEET), or at risk of becoming NEET.
5: Improving the skills of the local workforce Delivery of the learning and skills regional vision: to help all people in Cornwall achieve the highest levels of skills and qualifications they can in order to enable them to find jobs and improve their chances of career progression, spanning:
Adult Learning and Skills – increasing choice and access to learning and skills training for adults (19+).
Workforce Development – raising workforce and business skills at all levels across all sectors in Cornwall to match the best in the UK.
Higher Education and Skills – increasing the number of HE students enrolled at the Combined Universities in Cornwall and increasing the take-up of higher skills training by those in employment.
6: Technical assistance Funding to facilitate programme delivery and strengthen capacity to support participation of voluntary and community organisations. Includes the publicity and communication strategy, support for the cross-cutting themes of gender equality and equal opportunities and sustainable development, development and implementation of programme monitoring and evaluation systems.

Evaluation of the ESF Convergence Programme
September 2015 Page 18 ISO9001:2008 QAP 01/01 Issue 8
The Competitiveness programme also had a strategic aim to commission activities that provide
interventions to support employment and skills needs in respect of:
Priority 1:
1. Young people not in education, employment or training (NEET), including young people
at risk of becoming NEET;
2. Workless adults (unemployed and inactive).
Priority 2:
Young people and adults aged 16 years and over who require relevant qualifications at an
appropriate level to support their current and continuing and future employment needs: basic skills;
relevant qualifications at level 2; relevant qualifications at level 3.
Thus it can be seen that Priority 1 aligns with Priority 4; and Priority 2, with Priority 5.
As per the national ESF programme, two cross cutting themes were to be addressed within all
projects: Equality and Diversity and Sustainable Development. Equality targets were set for the
programme in respect of supporting:
People with disabilities;
People aged over 50;
Ethnic minorities; and
Females.
The design and delivery of projects was required to take account of environmental concerns and
respect the principles of sustainable development.
1.2 Research aim and objectives
The subject of this report is the research carried out to enable an evaluation of the ESF Convergence
Programme in Cornwall and the Isles of Scilly.
The purpose of the evaluation is to understand and demonstrate impact on the local area and
effectiveness in delivering the targets and outputs of the ESF Convergence Programme in Cornwall
and the Isles of Scilly.
The main objectives of the evaluation were to:
Review the programme’s objectives and targets, in the context of changes to the external
landscape since it was developed, and analyse outputs compared with targets,
benchmarking where appropriate against other UK programmes;
Identify aspects of the programme that were particularly effective, as well as those that
were less effective, and the lessons learned from this to improve future programmes;

Evaluation of the ESF Convergence Programme
September 2015 Page 19 ISO9001:2008 QAP 01/01 Issue 8
Appraise the counterfactual situation in respect of the ESF programme; i.e. would the
impacts still have been achieved in the absence of the funding, and determine how
effectively provision has aligned with other mainstream funding;
Analyse the social and economic impacts of the ESF programme including the extent to
which strategic partnerships/linkages between ESF projects and other programmes such as
ERDF were formed/sustained; and
Identify any other areas of improvement from a process and delivery perspective that would
be useful intelligence for future programmes.
1.3 Report structure
This report firstly provides a summary of the ESF Convergence programme, including its strategic
aims, funding and targets, in Chapter 2. This is followed by key findings at programme level,
including an appraisal of the policy and economic context since the start of the programme, the
impact of this on programme delivery, and how circumstances in the region have changed between
2007 and the present day (i.e. an update on the baseline statistics) in Chapter 3.
Chapters 4, 5 and 6 then present key findings by each of the priority axis’. Conclusions and
recommendations are outlined in Chapter 7.
A detailed explanation of the research methodology is provided in Appendix 1. A summary of the
projects that were in scope of this evaluation is in Appendix 2.
Please note, quotes from respondents have been provided where relevant; these have not been
attributed as this would have revealed identities. Quotes come from a mix of regional stakeholders
and ESF Convergence programme delivery partners and project managers.
Evaluation of the ESF Convergence Programme
September 2015 Page 20 ISO9001:2008 QAP 01/01 Issue 8
2. About the ESF Convergence programme
2.1 Programme strategic aims
In conjunction with the UK Government’s employment and skills strategies, the Regional
Employment and Skills Partnership (RESP) and the Government Office for the South West (GOSW),
the Convergence Framework was developed for Cornwall and the Isles of Scilly (C&IoS) for the
period up to December 201012. A revised framework was subsequently developed which covered the
period from 2011 onwards (often referred to here and elsewhere as the second half of the
programme) to consider changes in the labour market and government policies.
A number of key themes were developed within the Regional Convergence ESF Framework, which
required Co-Financing Organisations (CFOs)13 to align their delivery with these shared objectives.
These themes spanned:
Employment & Skills for low carbon economic development
Employment & Skills for enterprise & entrepreneurship
Employment & Skills for key sectors
Employment & Skills for the Eco-town
Employment & skills for the digital economy14
The approach outlined for C&IoS also took into account other types of investment across the region.
These included funding via the European Regional Development Fund (ERDF) and Rural
Development Programme for Europe (RDPE). In order to directly address regional employment and
skills needs, ESF funds were particularly aimed at supporting:
People with disabilities or health conditions, lone parents, older workers and ethnic
minorities who made up a significant number of the unemployed or economically inactive
population;
Young people not in education, employment or training (NEETs), or potential NEETs and
underqualified people without a full level 2 qualification;
Skills shortages in sectors where people did not have relevant qualifications at level 3, small
and medium sized enterprises with up to 250 employees, and in sectors and occupational
areas where women and ethnic minorities were under-represented; and managers and
workers in small enterprises of up to 50 employees; and
Strategies to provide training to address skills gaps and in anticipation of the future skill
needs of businesses15.
12
Department of Work and Pensions Convergence Framework 2007 -2013 13
In the South-West region as a whole the Learning and Skills Council (LSC) (as was) and National Offender Management Service (NOMS) were the other two CFOs alongside the DWP 14
DWP Co-Financing Plan Cornwall & the Isles of Scilly

Evaluation of the ESF Convergence Programme
September 2015 Page 21 ISO9001:2008 QAP 01/01 Issue 8
The Convergence Framework also saw an opportunity to support a shift towards a low carbon and
resource efficient economy16.
2.2 ESF Convergence Programme targets
The programme targets are summarised below by priority, in Tables 2 and 3.
Table 2: Programme targets, Priority 4
Priority 4: Tackling barriers to employment Outputs 2007-2013 targets
Total number of participants 24,500
Participants who are unemployed 10,200
Participants who are economically inactive 8,400
Participants aged 14 to 19 not in education, employment or training i.e. NEETs (or at risk of becoming NEET)
4,900
Participants with disabilities or health conditions 6,615
Participants who are lone parents 1,960
Participants aged 50 or over 7,350
Participants from ethnic minorities 245
Female participants 12,485
Results 2007-2013 targets
Participants in work on leaving 5,900
Participants in work six months after leaving 7,300
Economically inactive participants engaged in job search activity or further learning
3,800
14 to 19 NEETs or at risk in education, employment or training on leaving 2,200
15
DWP ESF Convergence Framework 2007- 2013 16
Convergence Programme for Cornwall and the Isles of Scilly Operational Programme 2007-13

Evaluation of the ESF Convergence Programme
September 2015 Page 22 ISO9001:2008 QAP 01/01 Issue 8
Table 3: Programme targets, Priority 5
Priority 5: Improving the skills of the local workforce Outputs 2007-2013 targets
Total number of participants 50,200
Participants with basic skills needs 18,200
Participants without a level 2 qualification 18,200
Participants without a level 3 qualification 5,400
Participants without a level 4 or above qualification 3,800
Number participating in research qualifications (Masters/PhD) 800
Number of graduate placements 1,100
Participants with disabilities or health conditions 8,534
Participants aged 50 and over 11,044
Participants from ethnic minorities 502
Female participants 25,602
Results 2007-2013 targets
Participants gaining basic skills 8,200
Participants gaining a level 2 qualification 7,300
Participants gaining a level 3 qualification 1,600
Participants gaining a level 4 qualification 760
Participants undertaking post-graduate research gaining level 5 qualifications
120
Graduates placed within SMEs who gained employment 830
It was expected that by 2015, Cornwall and the Isles of Scilly would have,
Made substantial progress towards the Leitch 2020 target17, which was aimed at training at
least 90% of the workforce to Level 2 standard;
Established an enterprising culture with a discernible difference in aspirations and
expectations;
Become a leading region in new and emerging green technologies; and
Developed an approach to learning and skills focused on the labour force, as a whole and
economic opportunity18.
2.3 Funding for Convergence
Table 4 shows the funding allocated for Convergence in the region, for 2007-2013.
17
Set by Lord Leitch in his final review of the nation’s skills in 2006 18
DWP ESF Convergence Framework 2007 - 2013
Evaluation of the ESF Convergence Programme
September 2015 Page 23 ISO9001:2008 QAP 01/01 Issue 8
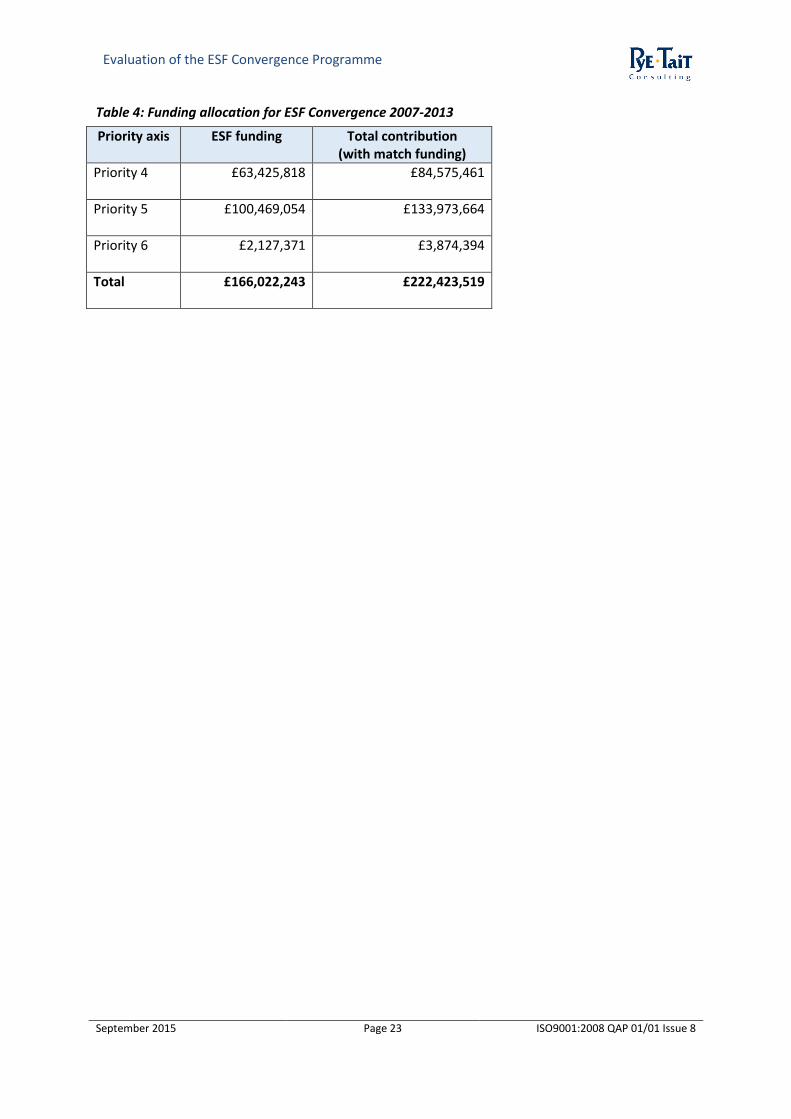
Table 4: Funding allocation for ESF Convergence 2007-2013
Priority axis ESF funding Total contribution (with match funding)
Priority 4 £63,425,818 £84,575,461
Priority 5 £100,469,054 £133,973,664
Priority 6 £2,127,371 £3,874,394
Total £166,022,243 £222,423,519

Evaluation of the ESF Convergence Programme
September 2015 Page 24 ISO9001:2008 QAP 01/01 Issue 8
3. Key findings – programme level
3.1 Policy and economic changes in the external landscape
Arguably the most influential changes affecting the external landscape for the Convergence
programme were the economic effects of the recession from 2008 onwards, and the change of
Government in 2010.
In 2008, the UK’s GDP was falling, but targets for the ESF programme had been set pre-recession, at
a time when Government policy was focusing on enterprise and the creation of an ‘innovation
nation’19. By 2010, the Office of Budget Responsibility (OBR) had forecast on-going decline in
unemployment by 2015, with 11% anticipated shrinkage of public sector jobs. The OBR also
predicted a recovery from negative GDP to be driven by private economy and opportunities in
export markets, particularly in Asia20.
However, the UK Government remained committed to policy supporting the creation of new jobs
and industry growth. The policy statement "Building Britain's Future - New Industry, New Jobs" in
2009 identified a number of critical areas for Government support, notably where investment could
support economic recovery, and clearer identification of the skills needed for future success, and
ensuring the education and training system could deliver them21. In the same year, Cornwall’s
economic strategy set out priorities to ensure the region’s position as an innovative, knowledge-
based and technologically-advanced area founded on environmental and sustainability principles22.
Concurrently, there was a strong focus on the creation of a UK low carbon economy. To support the
increasing importance of tackling climate change and meeting ambitious targets to reduce
emissions, Low Carbon Economic Areas (LCEA) were introduced through the Low Carbon Transition
Plan23. The Plan presented LCEAs as an opportunity to build on key industrial strengths of particular
areas to accelerate low carbon economic activity. Cornwall prioritised the Low Carbon Industrial
Strategy and focused its skills budget on the areas that were said to have the most potential for
growth and jobs such as Life Sciences, Digital Media and Technology, Engineering, Construction and
Low Carbon Energy. Cornwall Council’s Economic Ambition White Paper set out an aim of making
Cornwall an innovative business and low carbon technologies leader24.
In 2010, the new Coalition Government embarked upon a substantial programme of budget cuts,
with reductions in public expenditure set to reach £17 billion by 2014/1525. In 2010, following the
Comprehensive Spending Review which announced a 25% reduction in the Further Education budget
for 2014-15, the Government published its strategy26 for the reform of further education and
19
Department for Business, Innovation and Skills (BIS) (2008), Innovation nation (white paper) 20
Office of Budget Responsibility (2010), Budget 2010: The economy and public finances – supplementary material 21
HM Government (2009) New industry, new jobs 22
Cornwall Council Green Paper 2009 23
HM Government (2009), National Strategy for Climate Change and Energy 24
Cornwall Council Economy and Culture Strategy 2013-2020 25
Announced in the June 2010 budget 26
BIS (2010), Skills for sustainable growth

Evaluation of the ESF Convergence Programme
September 2015 Page 25 ISO9001:2008 QAP 01/01 Issue 8
training in England. Labour’s flagship adult training programme, Train to Gain was abolished and
replaced with a much smaller and more targeted initiative aimed at helping small employers train
low-skilled staff. As part of a drive to cut bureaucracy and red tape in the sector, colleges and
providers were given greater freedom to respond to the bespoke needs of learners and employers.
Another objective was to increase the number of adult apprenticeships, while also expecting
employers and learners to pay more towards the cost of training. For learners aged 24 and over, a
new system of government-backed loans was introduced in 2013, for those wishing to take level 3 or
higher qualifications.
Emerging at that time was a clear vision for greater employer ownership of, and investment into
skills development. This was underpinned by the creation of a number of industrial partnerships
(IPs)27 which are currently using collaborative approaches bringing together employers with training
providers and other key sector stakeholders, to develop and deliver bespoke skills and training
solutions in the context of specific industry requirements. The goal is to attract and manage funding
through sustainable co-investment training propositions whilst setting standards and accountability
structures so that investment goes further28.
A major closure programme was instigated by the Coalition Government, for example the Regional
Development Agencies (RDAs) and regional Government Offices. Greater responsibilities were
devolved to Local Authorities in the interim, but the longer-term goal was to establish Local
Enterprise Partnerships (LEPs) to replace the RDAs. The intention was for the LEPs to take the lead in
deciding on the priorities for the local area, including investment into infrastructure, skills and
training. LEPs (including for Cornwall and the Isles of Scilly) were first established in 2011, and to
date, 39 LEPs have been created.
3.2 Impact of policy and economic changes on the ESF Convergence programme
3.2.1 Programme management
Strategic governance
The Department for Work and Pensions (DWP) ESF Division had overall responsibility for the
management of ESF in England. Funds were distributed through national co-financing organisations
(CFOs). In Cornwall and the Isles of Scilly, the CFOs were:
DWP;
Skills Funding Agency (SFA); and
National Offender Management Service (NOMS).
CFOs were tasked with managing ESF funding and using mainstream sources to provide match
funding. A Local Management Committee (LMC) was formed to oversee delivery, in addition to an
ESF Convergence Steering Group, administered by DWP with a focus on performance of the
programme.
27
Industrial partnerships are industry-wide collaborative arrangements that extend the scale and impact of employer ownership in key sectors of the economy. They ensure skills and workforce development are intrinsic parts of an industry’s wider growth strategy and address the most pressing skills challenges the industry faces 28
UK Commission for Employment and Skills (2013) Employer Ownership of Skills: Building the Momentum

Evaluation of the ESF Convergence Programme
September 2015 Page 26 ISO9001:2008 QAP 01/01 Issue 8
From 2007-2011, the South West Regional Development Agency (SWRDA) was the designated
Intermediary Body responsible to the Department for Communities & Local Government (DCLG) for
managing the Convergence programme. Following its abolition, the Department for Work and
Pensions (DWP) assumed overall responsibility for ESF. At the same time, the closure of Government
Office South West (GOSW) removed a long-standing strategic layer from the programme’s
governance.
Local control had also been narrowed in April 2009, when a Unitary Authority for Cornwall was
established, replacing the previous structure of Cornwall County Council and six district authorities
plus the Council for the Isles of Scilly (which remained unchanged).
Operational delivery
Coalition Government policy therefore focused on creating a culture of stronger ownership for skills
and training among employers and individuals, whilst at the same time starting to devolve greater
responsibilities to LEPs, underpinned by the Localism Act introduced in 201129. Paradoxically,
however, in practice this had the effect of removing a great deal of local control over the
management of the ESF programme.
Policy and organisational change combined with spending cuts and redundancies in central and local
Government departments brought about important structural change within CFOs. The DWP was
tasked with concentrating its attention on provision to support troubled families. The SFA became a
more centralised organisation with a nationally-led approach to contract management. The net
result was a more rigid and very different approach after 2010, without the flexibility and local
control that had featured heavily in the first half of the programme.
“In the first half of the Convergence programme all targets on skills programmes were met and
exceeded because the projects were locally driven and delivered and in response to Cornwall’s
specific needs. However the second half was driven by Government policy, led by Government
departments running national programmes which were inflexible. We moved from a bottom up
approach in the projects initiation to a top down national project. I think that was the single biggest
issue – in terms of the performance of the whole programme”
This erosion of local ownership had a knock on effect in a number of areas, which affected
programme delivery (explained in more detail in section 3.7).
3.2.2 Effectiveness of programme governance
The Local Management Committee (LMC) benefited from a range of constituent members that have
worked closely together over a number of years – this shared knowledge and expertise of both ESF
and the local region and its needs helped ensure a robust approach to programme governance.
29
The aim of the act was to devolve more decision making powers from central government back into the hands of individuals, communities and councils. The act covers a wide range of issues related to local public services

Evaluation of the ESF Convergence Programme
September 2015 Page 27 ISO9001:2008 QAP 01/01 Issue 8
It was affected in the second half of the programme as a result of the changes in the external
landscape, notably upheaval within local organisations which meant existing members left the
committee, and new people joined or left more regularly than before. This meant it was harder to
maximise the group to best effect.
Post 2010, the Convergence Management Group (CMG) undertook regular reviews of progress,
focusing on whether numbers were in alignment with targets. However the group had limited ability
to bring about change due to the nationally-led strategic priorities, and over time became a means
to shape the agenda for the LMC, rather than offer strong strategic leadership.
Discussions therefore focused on the national position and targets as opposed to the local economy,
and suffered from limited data, with only an aggregate dataset which did not allow for detailed
analysis at a local level.
3.3 Programme design
The initial design of the programme for 2007 onwards was informed by a substantial amount of
research, dialogue between partners and effective use of Labour Market Intelligence (LMI). Co-
Financing Organisations (CFOs) worked closely together, building upon partnerships and
relationships forged during the previous Objective One programme.
Regional stakeholders and providers broadly agree that the right kinds of activities were
commissioned that met local social and economic needs. This was helped by commissioning shorter
term projects rather than committing the full monies for the full 6 years. CFOs recognised a need for
flexible and immediate provision for the ESF cohort.
ESF complemented mainstream funding and predominantly added value – in particular because
funding for adult learning “all but disappeared”. The need for ESF thus became more urgent,
especially after the introduction of adult learning loans. However some projects competed with one
another for the same client group, because of similar aims and outputs.
Support for businesses to undertake training was fundamental, notably in helping develop higher
level skills which could not have been funded through other means. However work-based learning
was not as flexible as it could have been. For many businesses, funding was only available for
accredited training, and some providers highlighted the challenges for employers compelled to
commit to a full qualification, when in reality only one or two aspects would have been relevant.
Greater flexibility, for instance in allowing businesses to just take relevant modules, would have met
needs more closely and reflected the limited time available for training. In relation to delivery, some
regional stakeholders noted that more could have been done to improve provision in rural areas
where it was traditionally difficult to access and therefore minimised participation.
Evaluation of the ESF Convergence Programme
September 2015 Page 28 ISO9001:2008 QAP 01/01 Issue 8
3.4 Effectiveness of strategic linkages with ERDF
ERDF is one of the main financial instruments of the European Cohesion Policy. It is intended to help
redress regional imbalances in the union through participation in the development and structural
adjustment of regions whose development is lagging and help with and the conversion of declining
industrial regions. It is mainly used to provide financial contributions to projects that are promoted
by the public sector, such as Government departments, local authorities and further and higher
education establishments30.
ERDF was one of the four funds that operated in the region during the period of 2007 -2013. The
others were the European Agricultural Fund for Rural Development (EAFRD) and the European
Fisheries Fund (EFF) as well as ESF. The strands of activity which were relevant to ESF and ERDF
during this period included:
Innovation and enterprise: EDRF prioritised the restructuring of the economy to one with a
higher proportion of high value added business, crucial in addressing low earnings and a low
skilled economy31. This was relevant to ESF Priority Axis’ 4 and 5, aimed at developing a
skilled and adaptable workforce and tackling barriers to employment32.
Renewable energy and environmental technologies: ERDF aimed to improve the
environmental performance of buildings and resource efficiency. It also planned to build a
research and innovation base, and build capacity of environmental goods and services sector
through networking and innovation networks. Environmental technologies would also have
innovation and enterprise support.33
There was a clear intent to form strategic linkages between ESF and ERDF. The Convergence
Management Group (CMG) looked at ERDF pipelines in meetings. The idea was that ESF would be
used to upskill people and help them take up jobs that would be created as a result of the ERDF
capital investments.
In practice this was only partly successful. Although skills plans were requested for each ERDF
project, they were not always provided. Furthermore there were structural barriers – ESF and ERDF
contract specifications inviting tenders were not typically released at the same time, nor did they
explicitly require linkages to be made between the funding streams. EU State Aid rules also
prevented some ERDF projects from benefitting from ESF skills training as they were already in
receipt of a set amount of funding and did not qualify for more support. This meant that synergies
between the funds could not be harnessed to maximum effect.
30
Cornwall and Isles of Scilly Convergence Operational Programme 2007 31
Cornwall and Isles of Scilly Convergence Operational Programme 2007 32
ERDF Cornwall Convergence Operational Programme 2007-2013 33
ERDF Cornwall Convergence Operational Programme 2007-2013

Evaluation of the ESF Convergence Programme
September 2015 Page 29 ISO9001:2008 QAP 01/01 Issue 8
A further issue arose with State Aid34 – some ERDF projects could not benefit from ESF skills training
due to the regulations if in receipt of more than 200,000 euros – this appears to be a major
structural conflict. State Aid, in effect, works against maximising the funding. Delivery timescales for
projects were not always in alignment, and this was exacerbated in the second half of the
programme as a result of contracting delays for ESF.
Stakeholders report that there appeared to be limited collaboration between DCLG as the ‘owner’ of
ERDF and DWP as the Managing Authority for ESF. Therefore there were barriers to linkages at top
down and bottom up levels.
However in spite of these obstacles there are a number of examples of effective collaborations that
made effective use of the funding. Fifteen, the restaurant offering training in the food and drink
sector was established via ERDF and ESF, and is a particularly good example of the impacts that have
been achieved for individual participants, as well as for the region.
CPR Regeneration partners were intrinsically linked to local ERDF investments and continually sought
opportunities to build skills into a major ERDF capital development (Pool Innovation Centre) then
underway and its surrounding business community.
The Skills Funding Agency designated specific funding to cover capacity building activities at
Newquay Airport before it passed from military to civilian control in 2009. This brought together
ERDF and ESF investment. The Newquay delivery partner was very well connected to local
development strategies and was able to ensure that skills funding supported local needs.
3.5 Cross-cutting themes
Coverage of cross-cutting themes appears to vary depending on the project, and provider. Large
organisations such as colleges typically had clear protocols on equality and diversity, and sustainable
development, which were incorporated into the approach to delivery. However they did not always
tailor standard practices to bespoke ESF contracts.
The National Offender Management Service (NOMS) recruited a sustainable champion and
undertook activities to promote sustainable development. A good example of sustainable
development within the programme is explained in the following case study:
34
The term ‘state aid’ refers to a form of assistance from public funded resources which is used to support organisations or businesses. The rules restrict the support the public sector may provide to civil society organisations that operate in a commercial or economic environment
Evaluation of the ESF Convergence Programme
September 2015 Page 30 ISO9001:2008 QAP 01/01 Issue 8
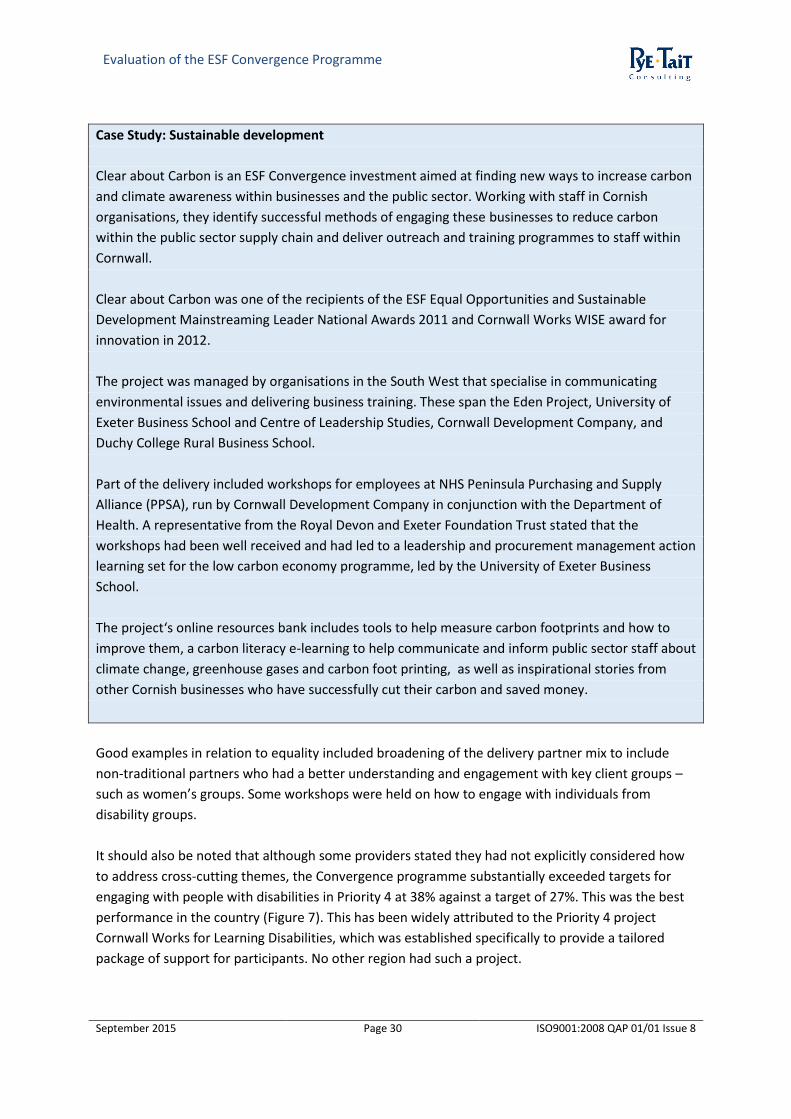
Case Study: Sustainable development
Clear about Carbon is an ESF Convergence investment aimed at finding new ways to increase carbon
and climate awareness within businesses and the public sector. Working with staff in Cornish
organisations, they identify successful methods of engaging these businesses to reduce carbon
within the public sector supply chain and deliver outreach and training programmes to staff within
Cornwall.
Clear about Carbon was one of the recipients of the ESF Equal Opportunities and Sustainable
Development Mainstreaming Leader National Awards 2011 and Cornwall Works WISE award for
innovation in 2012.
The project was managed by organisations in the South West that specialise in communicating
environmental issues and delivering business training. These span the Eden Project, University of
Exeter Business School and Centre of Leadership Studies, Cornwall Development Company, and
Duchy College Rural Business School.
Part of the delivery included workshops for employees at NHS Peninsula Purchasing and Supply
Alliance (PPSA), run by Cornwall Development Company in conjunction with the Department of
Health. A representative from the Royal Devon and Exeter Foundation Trust stated that the
workshops had been well received and had led to a leadership and procurement management action
learning set for the low carbon economy programme, led by the University of Exeter Business
School.
The project‘s online resources bank includes tools to help measure carbon footprints and how to
improve them, a carbon literacy e-learning to help communicate and inform public sector staff about
climate change, greenhouse gases and carbon foot printing, as well as inspirational stories from
other Cornish businesses who have successfully cut their carbon and saved money.
Good examples in relation to equality included broadening of the delivery partner mix to include
non-traditional partners who had a better understanding and engagement with key client groups –
such as women’s groups. Some workshops were held on how to engage with individuals from
disability groups.
It should also be noted that although some providers stated they had not explicitly considered how
to address cross-cutting themes, the Convergence programme substantially exceeded targets for
engaging with people with disabilities in Priority 4 at 38% against a target of 27%. This was the best
performance in the country (Figure 7). This has been widely attributed to the Priority 4 project
Cornwall Works for Learning Disabilities, which was established specifically to provide a tailored
package of support for participants. No other region had such a project.

Evaluation of the ESF Convergence Programme
September 2015 Page 31 ISO9001:2008 QAP 01/01 Issue 8
Furthermore the Technical Assistance project providing third sector programme support and
participation run by Cornwall Voluntary Sector Forum (CVSF) provided strategic engagement on the
cross cutting equalities theme.
Figure 7: % of achievement against targets, supporting participants with disabilities – Priority 4
compared with Priority 1 (rest of England)
Source: ESF Division, DWP (July 2015)
However no region achieved the target to support participants with disabilities for Priority 2 (Priority
5 in Convergence). Cornwall and the Isles of Scilly achieved 10% against a target of 17%. (Figure 8).
22%
27%
22%
22%
22%
22%
22%
22%
22%
20%
22%
22%
38%
24%
30%
25%
19%
28%
32%
36%
23%
23%
0% 5% 10% 15% 20% 25% 30% 35% 40%
England &Gibraltar
Cornwall & theIsles of Scilly
East of England
East Midlands
London
North-East
North-West
South-East
South-West
West Midlands
Yorkshire & theHumber
%
Achievement
Target

Evaluation of the ESF Convergence Programme
September 2015 Page 32 ISO9001:2008 QAP 01/01 Issue 8
Figure 8: % of achievement against targets, supporting participants with disabilities – Priority 5
compared with Priority 2 (rest of England)
Source: ESF Division, DWP (July 2015)
The Convergence programme also exceeded targets for supporting people from ethnic minorities in
Priority 4 –2% against a target of 1%, making it one of only three regions that exceeded the target
(Figure 9).
15%
17%
15%
15%
15%
15%
15%
15%
15%
15%
15%
7%
10%
6%
8%
5%
6%
7%
8%
11%
7%
7%
0% 5% 10% 15% 20%
England & Gibraltar
Cornwall & the Isles of…
East of England
East Midlands
London
North-East
North-West
South-East
South-West
West Midlands
Yorkshire & the Humber
%
Achievement
Target
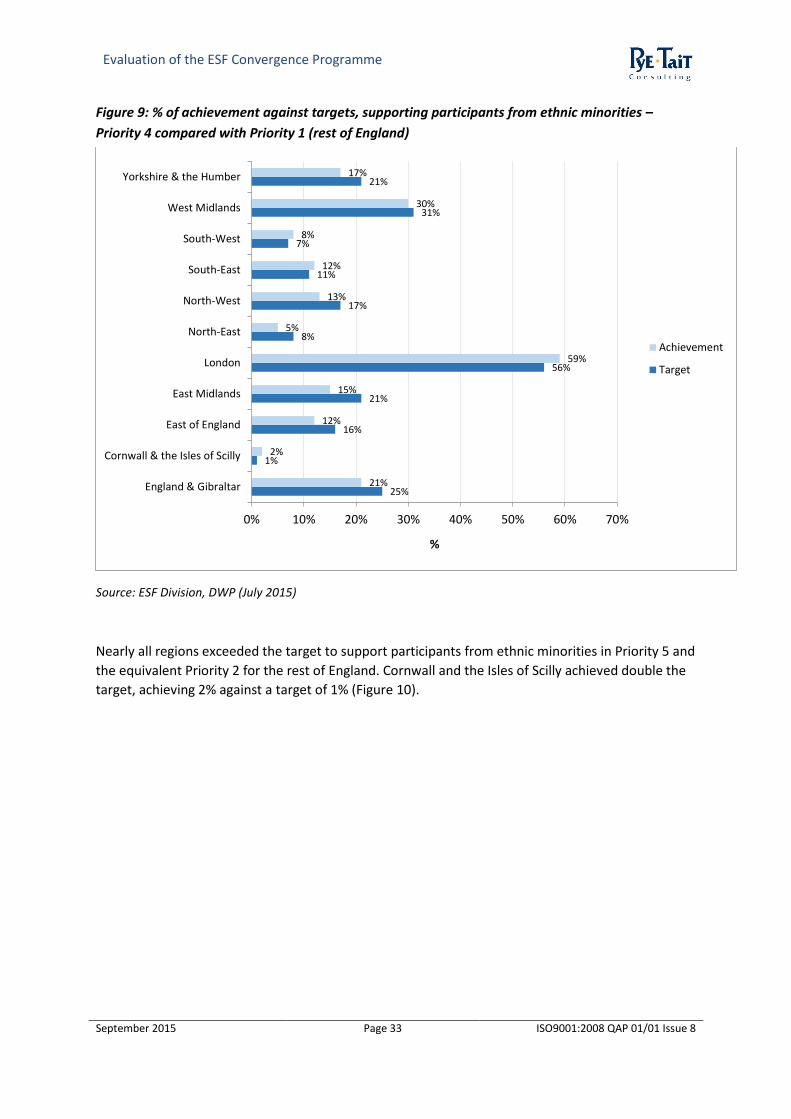
Evaluation of the ESF Convergence Programme
September 2015 Page 33 ISO9001:2008 QAP 01/01 Issue 8
Figure 9: % of achievement against targets, supporting participants from ethnic minorities –
Priority 4 compared with Priority 1 (rest of England)
Source: ESF Division, DWP (July 2015)
Nearly all regions exceeded the target to support participants from ethnic minorities in Priority 5 and
the equivalent Priority 2 for the rest of England. Cornwall and the Isles of Scilly achieved double the
target, achieving 2% against a target of 1% (Figure 10).
25%
1%
16%
21%
56%
8%
17%
11%
7%
31%
21%
21%
2%
12%
15%
59%
5%
13%
12%
8%
30%
17%
0% 10% 20% 30% 40% 50% 60% 70%
England & Gibraltar
Cornwall & the Isles of Scilly
East of England
East Midlands
London
North-East
North-West
South-East
South-West
West Midlands
Yorkshire & the Humber
%
Achievement
Target
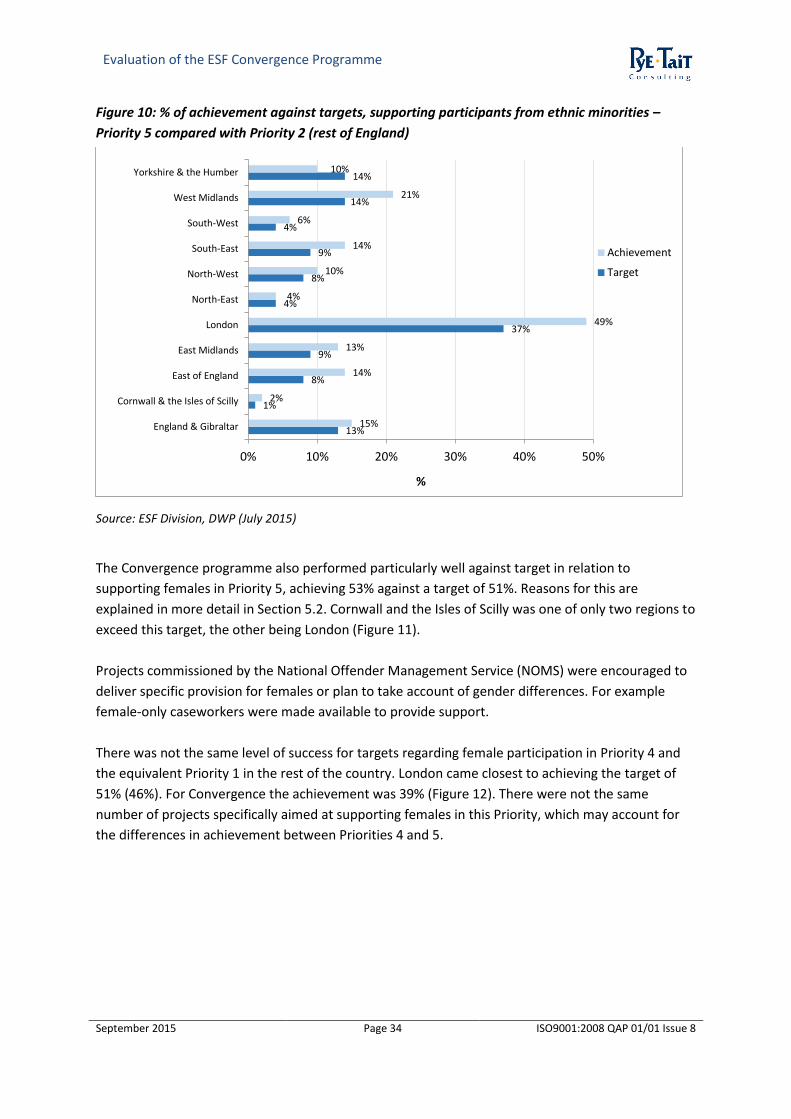
Evaluation of the ESF Convergence Programme
September 2015 Page 34 ISO9001:2008 QAP 01/01 Issue 8
Figure 10: % of achievement against targets, supporting participants from ethnic minorities –
Priority 5 compared with Priority 2 (rest of England)
Source: ESF Division, DWP (July 2015)
The Convergence programme also performed particularly well against target in relation to
supporting females in Priority 5, achieving 53% against a target of 51%. Reasons for this are
explained in more detail in Section 5.2. Cornwall and the Isles of Scilly was one of only two regions to
exceed this target, the other being London (Figure 11).
Projects commissioned by the National Offender Management Service (NOMS) were encouraged to
deliver specific provision for females or plan to take account of gender differences. For example
female-only caseworkers were made available to provide support.
There was not the same level of success for targets regarding female participation in Priority 4 and
the equivalent Priority 1 in the rest of the country. London came closest to achieving the target of
51% (46%). For Convergence the achievement was 39% (Figure 12). There were not the same
number of projects specifically aimed at supporting females in this Priority, which may account for
the differences in achievement between Priorities 4 and 5.
13%
1%
8%
9%
37%
4%
8%
9%
4%
14%
14%
15%
2%
14%
13%
49%
4%
10%
14%
6%
21%
10%
0% 10% 20% 30% 40% 50%
England & Gibraltar
Cornwall & the Isles of Scilly
East of England
East Midlands
London
North-East
North-West
South-East
South-West
West Midlands
Yorkshire & the Humber
%
Achievement
Target

Evaluation of the ESF Convergence Programme
September 2015 Page 35 ISO9001:2008 QAP 01/01 Issue 8
Figure 11: % of achievement against targets, supporting female participants – Priority 5 compared
with Priority 2 (rest of England)
Source: ESF Division, DWP (July 2015)
50%
51%
50%
50%
50%
50%
50%
50%
50%
50%
50%
46%
53%
48%
48%
51%
40%
48%
47%
50%
46%
39%
-5% 5% 15% 25% 35% 45% 55%
England & Gibraltar
Cornwall & the Isles of Scilly
East of England
East Midlands
London
North-East
North-West
South-East
South-West
West Midlands
Yorkshire & the Humber
%
Achievement
Target

Evaluation of the ESF Convergence Programme
September 2015 Page 36 ISO9001:2008 QAP 01/01 Issue 8
Figure 12: % of achievement against targets, supporting female participants – Priority 4 compared
with Priority 1 (rest of England)
Source: ESF Division, DWP (July 2015)
Analysis of the data indicates that projects designed specifically with a target group in mind, such as
females or those with disabilities, were able to engage very effectively with the cohort, enabling
over achievement of the targets. Performance was less strong, with not all targets achieved, where
cross-cutting themes were less explicitly addressed.
“Cross-cutting themes were an afterthought”
There were other opportunities to address cross-cutting themes more explicitly that were not taken.
For instance ERDF capital investment into structural developments could have used ESF funds to
provide skills and training on effective management of waste – which in turn could have linked into
recycling and work with social enterprises. One provider pointed out that hotels could work with
food banks to reduce waste and support disadvantaged groups.
3.6 Programme performance against targets
Figures 13 and 14 below show the numbers achieved compared with target numbers, for Priorities 4
and 5. It should be noted that it is not possible to show actual numbers achieved against targets in
51%
51%
51%
51%
51%
51%
51%
51%
51%
51%
51%
33%
39%
35%
39%
46%
35%
37%
37%
37%
37%
36%
0% 10% 20% 30% 40% 50% 60%
England & Gibraltar
Cornwall & the Isles of Scilly
East of England
East Midlands
London
North-East
North-West
South-East
South-West
West Midlands
Yorkshire & the Humber
%
Achievement
Target
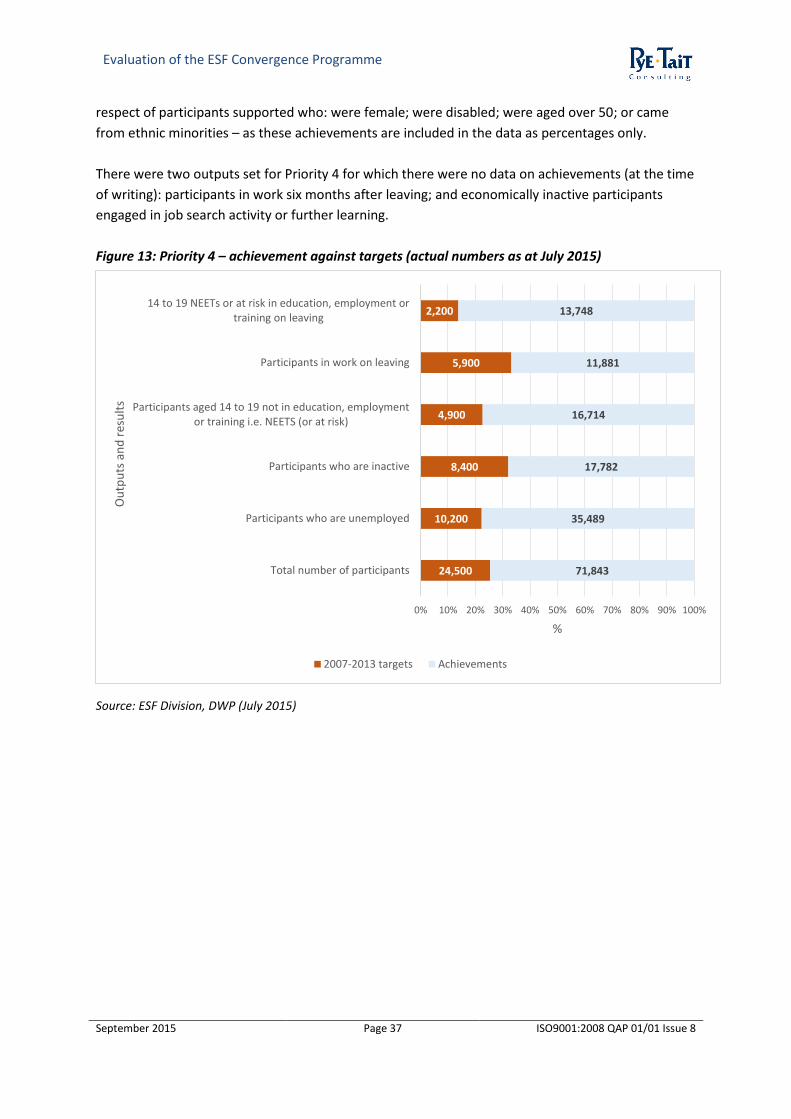
Evaluation of the ESF Convergence Programme
September 2015 Page 37 ISO9001:2008 QAP 01/01 Issue 8
respect of participants supported who: were female; were disabled; were aged over 50; or came
from ethnic minorities – as these achievements are included in the data as percentages only.
There were two outputs set for Priority 4 for which there were no data on achievements (at the time
of writing): participants in work six months after leaving; and economically inactive participants
engaged in job search activity or further learning.
Figure 13: Priority 4 – achievement against targets (actual numbers as at July 2015)
Source: ESF Division, DWP (July 2015)
24,500
10,200
8,400
4,900
5,900
2,200
71,843
35,489
17,782
16,714
11,881
13,748
0% 10% 20% 30% 40% 50% 60% 70% 80% 90% 100%
Total number of participants
Participants who are unemployed
Participants who are inactive
Participants aged 14 to 19 not in education, employmentor training i.e. NEETS (or at risk)
Participants in work on leaving
14 to 19 NEETs or at risk in education, employment ortraining on leaving
%
Ou
tpu
ts a
nd
res
ult
s
2007-2013 targets Achievements

Evaluation of the ESF Convergence Programme
September 2015 Page 38 ISO9001:2008 QAP 01/01 Issue 8
Figure 14: Priority 5 – achievement against targets (actual numbers as at July 2015)
Source: ESF Division, DWP (July 2015)
Figures 15, 16 and 17 show the percentage of achieved outputs against programme targets for
Priorities 4 and 5 (compared with national averages, Priorities 1 and 2 respectively). These highlight
the vast overachievement of targets in England and in Cornwall & the Isles of Scilly, in nearly all
areas of the programme.
50,200
18,200
18,200
5,400
3,800
800
1,100
8,200
7,300
1,600
760
120
830
114,031
9,757
24,332
25,697
19801
1037
1494
10,357
14,584
6964
1316
632
952
0% 10% 20% 30% 40% 50% 60% 70% 80% 90% 100%
Total number of participants
Participants with basic skills needs
Participants without a level 2 qualification
Participants without a level 3 qualification
Participants without a level 4 or above qualification
Number participating in research qualifications (Masters/PhD)
Number of graduate placements
Participants gaining basic skills
Participants gaining a level 2 qualification
Participants gaining a level 3 qualification
Participants gaining a level 4 qualification
Participants undertaking post-graduate research gaining level 5qualifications
Graduates placed within SMEs who gained employment
%
Ou
tpu
ts a
nd
res
ult
s
2007-2013 targets Achievements

Evaluation of the ESF Convergence Programme
September 2015 Page 39 ISO9001:2008 QAP 01/01 Issue 8
Figure 15: Priority 4 - % of achievement against targets compared with the national average
(Priority 1 contracts)
Source: ESF Division, DWP (July 2015)
387
513
212
427
261
650
293
348
212
341
201
625
0 100 200 300 400 500 600 700
Participant total
Unemployed
Economically inactive
14-19 NEET
In work on leaving
14-19 NEET into EET
%
Del
iver
able
s
Cornwall & the Isles of Scilly England & Gibraltar
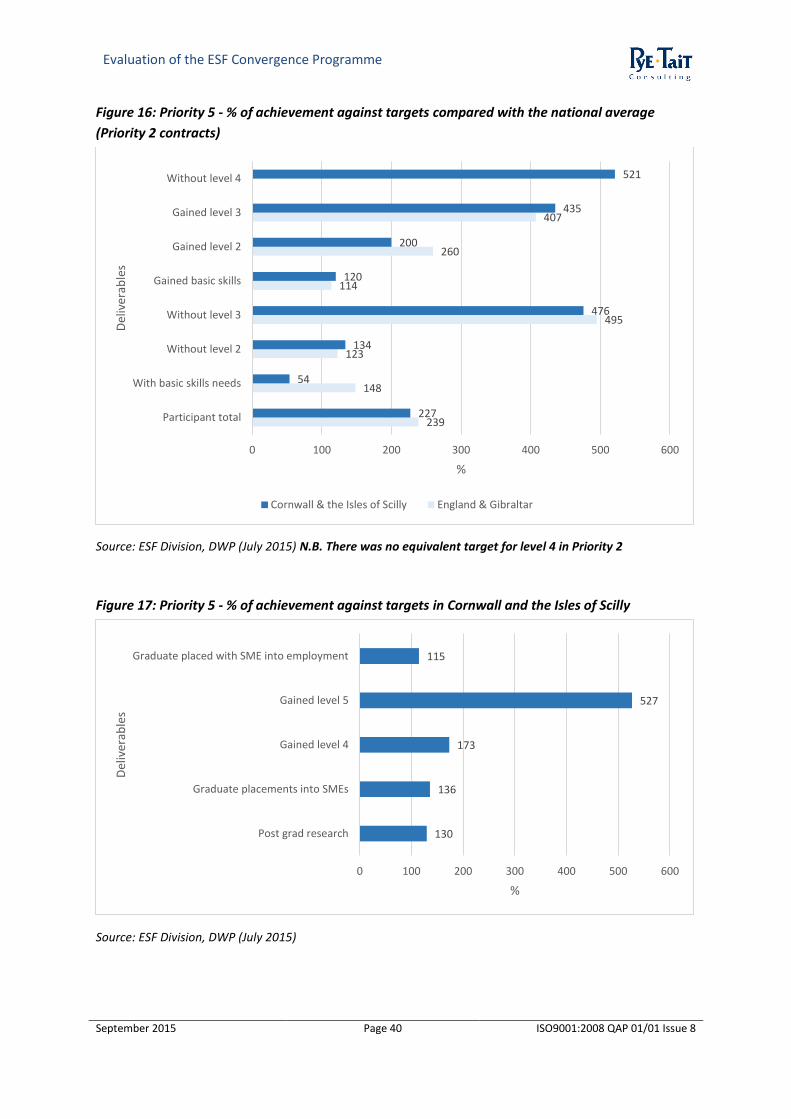
Evaluation of the ESF Convergence Programme
September 2015 Page 40 ISO9001:2008 QAP 01/01 Issue 8
Figure 16: Priority 5 - % of achievement against targets compared with the national average
(Priority 2 contracts)
Source: ESF Division, DWP (July 2015) N.B. There was no equivalent target for level 4 in Priority 2
Figure 17: Priority 5 - % of achievement against targets in Cornwall and the Isles of Scilly
Source: ESF Division, DWP (July 2015)
239
148
123
495
114
260
407
227
54
134
476
120
200
435
521
0 100 200 300 400 500 600
Participant total
With basic skills needs
Without level 2
Without level 3
Gained basic skills
Gained level 2
Gained level 3
Without level 4
%
Del
iver
able
s
Cornwall & the Isles of Scilly England & Gibraltar
130
136
173
527
115
0 100 200 300 400 500 600
Post grad research
Graduate placements into SMEs
Gained level 4
Gained level 5
Graduate placed with SME into employment
%
Del
iver
able
s

Evaluation of the ESF Convergence Programme
September 2015 Page 41 ISO9001:2008 QAP 01/01 Issue 8
Figure 18: Summary of SFA contracts (where data available) % of achievement against targets
Source: Skills Funding Agency, July 2015 Base: 59,729 participants
Figure 19 shows that nearly a quarter of the participants supported within SFA projects (data
available in respect of nearly 60,000 individuals) went on to achieve some form of non-accredited
learning activity. This links to the previous point about the programme supporting high numbers of
participants that accessed brief, rapid support such as a guidance or taster session.
94
102
120
73
102
80
53
103
111
92 92
63
102
77
70
103
0
20
40
60
80
100
120
140
Participantssupported
Achievementof
qualificationslevels 1-5
Achievementof Skills for
Life/Basic Skills
Completion oftraining GLH
10-76+
Completion ofwork
placement
Progressionsinto
employment
Progressionsinto HigherEducation
Progressionsinto job
search/furtherlearning
%
% of targetnumbersachieved
% of targetspend achieved

Evaluation of the ESF Convergence Programme
September 2015 Page 42 ISO9001:2008 QAP 01/01 Issue 8
Figure 19: Proportion of total number of participants achieving outcomes/outputs (SFA contracts
where data available)
Source: Skills Funding Agency, July 2015 Base: 59,729 participants
Figure 20: % of targets achieved for completion of training with GLH (SFA contracts where data
available)
Source: Skills Funding Agency, July 2015 Base: 2,923 participants
0.2
0.2
0.8
0.9
1.1
3.6
3.7
3.9
4.9
6.0
7.7
14.0
22.8
0.0 5.0 10.0 15.0 20.0 25.0
Progressions into voluntary work
Progressions into Higher Education
Completion of work placement
Progressions into employment
In-work progression
Progressions into job search/further learning
Improvement in work skills
Achievement of accredited learning activity
Completion of training GLH 10-76+
Improvement in personal/life skills
Achievement of Skills for Life/Basic Skills
Achievement of qualifications levels 1-5
Achievement of non-accredited learning activity
%
84
41 43
84
39 43
0
10
20
30
40
50
60
70
80
90
Completion of training - GLH10-54
Completion of training - GLH55-75
Completion of training - GLH76+
%
% of target numbersachieved
% of target spendachieved

Evaluation of the ESF Convergence Programme
September 2015 Page 43 ISO9001:2008 QAP 01/01 Issue 8
It was more difficult to engage with participants willing to complete more than 55 GLH (Figure 20).
This was predominantly because it was harder to get individuals to commit to this length of time.
However there was considerably greater success in achieving targets (numbers supported and
money spent) in relation to accredited, rather than non-accredited activity (Figure 21).
Figure 21: % of targets achieved for learning activity completions (SFA contracts where data available)
Source: Skills Funding Agency, July 2015 Base: 2,315 participants
The introduction of adult loans in 2013 restricted eligibility for level 2 qualifications – previously
participants could be supported to gain a second level 2, for example if they attained Certificates of
Secondary Education (CSEs) a long time ago but needed a more relevant qualification such as an
NVQ. Recent regulation changes meant these people could no longer access the funding – this had a
noticeable impact on achievement against targets for level 2 qualifications (Figure 22).
481
119 120 100
73 92
0
100
200
300
400
500
600
Achieved accreditedlearning activity
Achieved non-accredited learning
activity
Achieved Skills forLife/Basic Skills
%
% of target numbersachieved
% of target spendachieved
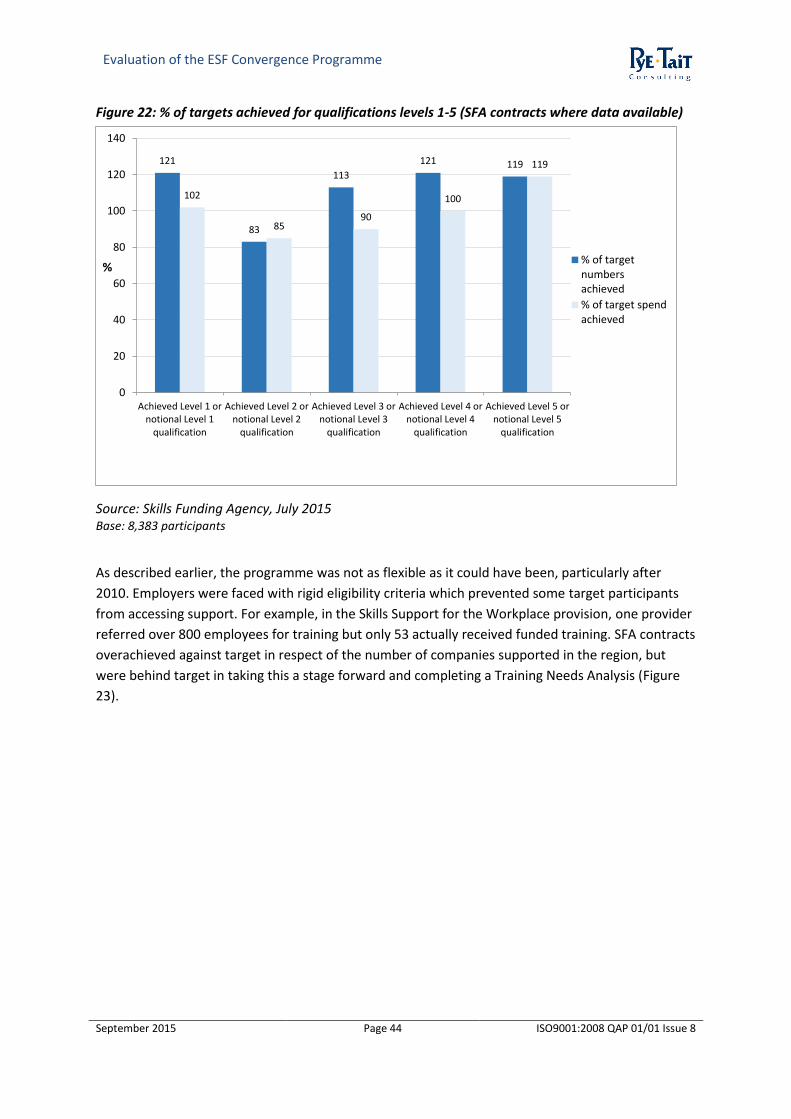
Evaluation of the ESF Convergence Programme
September 2015 Page 44 ISO9001:2008 QAP 01/01 Issue 8
Figure 22: % of targets achieved for qualifications levels 1-5 (SFA contracts where data available)
Source: Skills Funding Agency, July 2015 Base: 8,383 participants
As described earlier, the programme was not as flexible as it could have been, particularly after
2010. Employers were faced with rigid eligibility criteria which prevented some target participants
from accessing support. For example, in the Skills Support for the Workplace provision, one provider
referred over 800 employees for training but only 53 actually received funded training. SFA contracts
overachieved against target in respect of the number of companies supported in the region, but
were behind target in taking this a stage forward and completing a Training Needs Analysis (Figure
23).
121
83
113
121 119
102
85 90
100
119
0
20
40
60
80
100
120
140
Achieved Level 1 ornotional Level 1
qualification
Achieved Level 2 ornotional Level 2
qualification
Achieved Level 3 ornotional Level 3
qualification
Achieved Level 4 ornotional Level 4
qualification
Achieved Level 5 ornotional Level 5
qualification
%
% of targetnumbersachieved
% of target spendachieved

Evaluation of the ESF Convergence Programme
September 2015 Page 45 ISO9001:2008 QAP 01/01 Issue 8
Figure 23: % of targets achieved for companies supported (SFA contracts where data available)
Source: Skills Funding Agency, July 2015 Base: 7,118 participants
3.7 Differences between the first and second half of the programme
Analysis of the data shows that the majority of achieved numbers against the overall target were
delivered in the first half of the programme between 2008 and 2011 (Figures 24-27)35. For example
around two-thirds of total participants had been supported via Priority 4, and nearly three-quarters
supported via Priority 5, in the first half of the programme.
A slightly more even split could be seen in the number of unemployed people supported in Priority
4, with 54% in the first half and 46% in the second half of the programme.
35
Data correct as at August 2015
138
88
124
94
0
20
40
60
80
100
120
140
160
Companies supported Company Training Needs Analysescompleted
%
% of target numbersachieved
% of target spendachieved
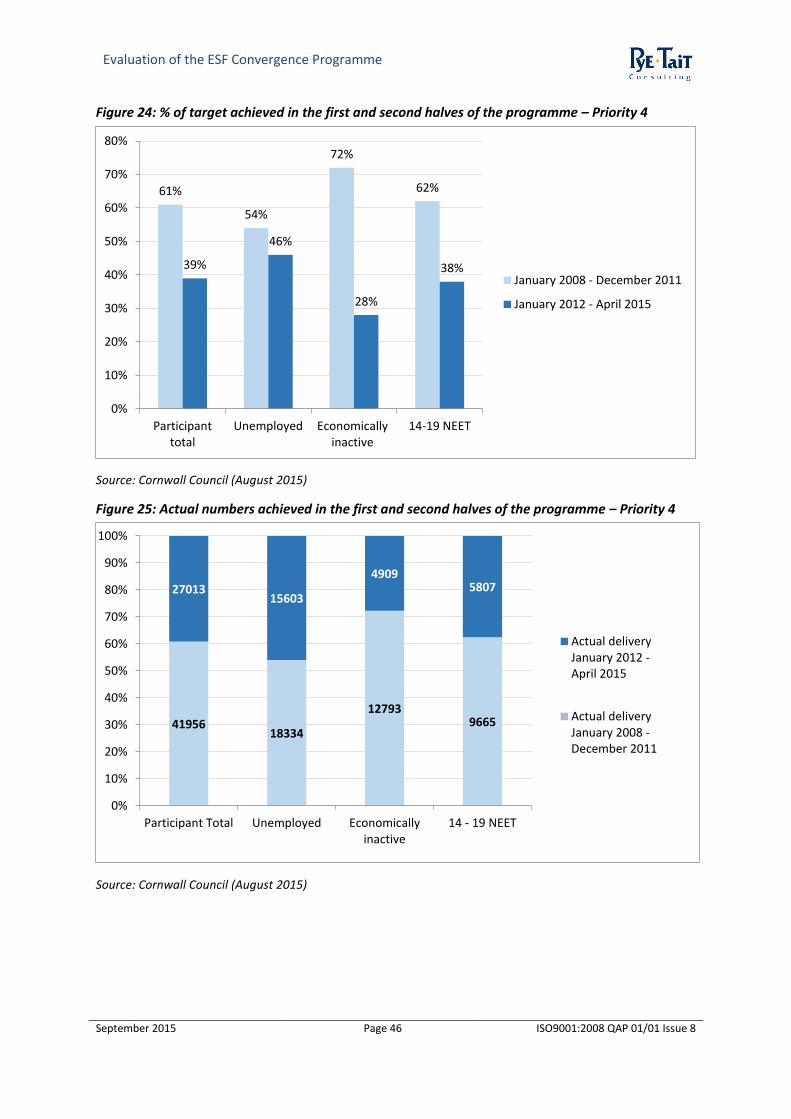
Evaluation of the ESF Convergence Programme
September 2015 Page 46 ISO9001:2008 QAP 01/01 Issue 8
Figure 24: % of target achieved in the first and second halves of the programme – Priority 4
Source: Cornwall Council (August 2015)
Figure 25: Actual numbers achieved in the first and second halves of the programme – Priority 4
Source: Cornwall Council (August 2015)
61%
54%
72%
62%
39%
46%
28%
38%
0%
10%
20%
30%
40%
50%
60%
70%
80%
Participanttotal
Unemployed Economicallyinactive
14-19 NEET
January 2008 - December 2011
January 2012 - April 2015
41956 18334
12793 9665
27013 15603
4909 5807
0%
10%
20%
30%
40%
50%
60%
70%
80%
90%
100%
Participant Total Unemployed Economicallyinactive
14 - 19 NEET
Actual deliveryJanuary 2012 -April 2015
Actual deliveryJanuary 2008 -December 2011

Evaluation of the ESF Convergence Programme
September 2015 Page 47 ISO9001:2008 QAP 01/01 Issue 8
Figure 26: % of target achieved in the first and second halves of the programme – Priority 5
Source: Cornwall Council (August 2015)
72% 73%
79%
70% 67%
65% 62%
28% 27%
21%
30%
33% 35% 38%
0%
10%
20%
30%
40%
50%
60%
70%
80%
90%
ParticipantTotal
Basic skillneeds
Withoutlevel 2
Withoutlevel 3
Withoutlevel 4
PhD Graduateplacements
January 2008 -December 2011
January 2012 -April 2015

Evaluation of the ESF Convergence Programme
September 2015 Page 48 ISO9001:2008 QAP 01/01 Issue 8
Figure 27: Actual numbers achieved in the first and second halves of the programme – Priority 5
Source: Cornwall Council (August 2015)
A major concern about the second half of the programme, expressed by many of the stakeholders
within this research, was that prime contractors were not actually based in Cornwall and the Isles of
Scilly. The main issues given by stakeholders to support their dissatisfaction were that prime
contractors had no or little relationship with local delivery partners, which is in direct contrast to the
strong traditions of successful collaborative partnership working in the region.
Furthermore, the DWP introduced a new payment model, which was intended to mitigate the risk of
the first half of the programme, and enable providers to be paid for participant starts, but with no
financial onus to then help participants progress. There was a concern that the investment may not
bring about the long-term intended consequences – for example progressions into employment. In
response, the revised model for the prime contractor projects introduced progress measure
payments linked to overcoming barriers, and impacts. The initial plan was that partners had to
engage with participants for 6 months and achieve 3 progress measures before they were eligible to
receive a payment.
Third sector organisations in particular found the revised payment model difficult as they did not
have the cash flow to keep them afloat while they undertook work to qualify for a first payment.
Some partners dropped out of the Convergence programme as a result, and others experienced
redundancies and operating problems. In turn this had a knock on effect on delivery, as it took time
76054 6746 17883
16470 12107 644 908
29306 2445 4864
7004 5891 351 563
0%
10%
20%
30%
40%
50%
60%
70%
80%
90%
100%
ParticipantTotal
Basic skillneeds
Withoutlevel 2
Withoutlevel 3
Withoutlevel 4
PhD Graduateplacements
Actual deliveryJanuary 2012 -April 2015
Actual deliveryJanuary 2008 -December 2011

Evaluation of the ESF Convergence Programme
September 2015 Page 49 ISO9001:2008 QAP 01/01 Issue 8
for issues to be resolved and new delivery partners to be recruited. Thus the available time in which
to support participants was reduced.
However in response to feedback from delivery organisations, the payment model was changed
again after approximately a year, with a requirement to engage with participants for 10 weeks,
devise an action plan and complete some form of activity in order to trigger a first payment. This
approach freed up cash for the smaller providers, although arguably some damage had already been
done which over time had a longer-term effect on programme delivery and achievement of targets.
There were delays, in some cases substantial, in agreeing and issuing contracts for the second half of
the programme, which appears to have been a particular issue for the SFA projects. This meant
some projects were late in starting, and thus there was a delay in engaging with the target cohort,
ultimately reducing the time available to deliver the achieved targets. This was exacerbated by a
reduction in the number of referrals from Local Authorities via the Children’s School and Families
pathway as these organisations were experiencing upheaval due to internal restructuring and
redundancies.
However in Cornwall and the Isles of Scilly Jobcentre Plus was able to make referrals from the start
of the programme, and limited referrals on a more general basis in the second half of the
programme via the Local Authority Children’s School and Families pathway meant that Jobcentre
Plus Work Coaches were tasked with increasing the number of referrals. This has been cited as a
critical factor in securing participation for the programme.
Furthermore, local CFO contract managers were not in a position to be as responsive or as proactive
as they had been in the first half of the programme, resulting in slow responses to queries and
resolutions of problems. Instead their remit had a stronger focus on ensuring the numbers were
being achieved, with a view to clawing monies back where targets were not being met. For some
providers, this meant innovation was constrained, as it was more prudent to choose to deliver
activities with a strong chance of engaging participants and achieving the outcomes. However these
“low hanging fruit” were not necessarily the right activities to meet participants’ specific needs,
particularly those experiencing multiple issues and barriers to work.

Evaluation of the ESF Convergence Programme
September 2015 Page 50 ISO9001:2008 QAP 01/01 Issue 8
Other operational issues related to the participant journey. In the first half of the programme sub-
contracted delivery partners were able to refer across a range of different partners – for instance if a
participant had drug problems or mental health issues, tailored support could be offered from one
provider, before referring the participant to another to move on – for example to a work experience
placement.
There was thus no need for the participant to come off the programme, but instead they would
benefit from a collaborative approach to providing support. The same level of flexibility was no
longer there for the second half of the programme.
Providers delivering ESF projects also that during the first half of the programme pricing appeared
more flexible reflecting the need for the wide range of support needed by some participant types in
far greater quantity than others. This approach was better for those at some distance from the
labour market thus needing greater levels of support.
Although some of these changes were not perceived particularly positively among ESF project
managers in particular, it should also be noted that the climate of austerity helped to bring partners
closer together, in some cases cementing much stronger working partnerships, and furthermore
contributing to a lasting legacy of collaboration. Furthermore local stakeholders and partners
retained an element of influence over provision in the latter half of the programme even though
there was a strong ‘top down’ culture imposed at national level. For instance securing agreement for
wider eligibility criteria, which was not available in any other area.
Notwithstanding these issues, the consensus among respondents is that the programme “came good
at the end” in spite of difficulties encountered along the way, and it is worth restating the
substantial overachievement against the majority of targets. However many respondents pointed
out that the second half of the programme has not been delivered in the most efficient or cost
effective way.
“If the barriers had not been there we could have achieved so much more”
3.8 Social and economic impacts
Impacts are discussed in more detail in Chapters 4 and 5 in relation to the individual Priority Axis’. At
programme level, key achievements include:
Linkages made between the HE community and local businesses, building strong
partnerships and working relationships expected to be sustained beyond the life of the
funding;
Development of and greater aspiration for, higher level skills in the region, in turn
contributing to more highly paid job roles and capacity building within businesses;

Evaluation of the ESF Convergence Programme
September 2015 Page 51 ISO9001:2008 QAP 01/01 Issue 8
Creation of cutting edge start-up companies, which could have a longer-lasting economic
benefit for the region in the form of job creation and GVA;
Capacity building in the third sector, notably among social enterprises. Ability to undertake
outreach activities has been greatly improved;
The ripple effect in the community appears strong but cannot be directly quantified;
regional stakeholders speculate there are economic and social impacts as fewer people are
seeing their GP or attending counselling on a regular basis after improving their confidence
and progressing off benefits (or aspiring to progress).
3.9 Changes to baseline conditions in the region since the start of the programme
This section presents an update on baseline conditions since the beginning of the Convergence
programme in 2007; it must be noted that it is not possible to attribute ESF funding as being the sole
cause of these effects, however clearly such a substantial sum of money must have played its part.
3.9.1 Demography
Figure 28: Regional demography compared with Great Britain 2007-2014
Source: Office for National Statistics (ONS)
Between 2007 and 2014 the population of Cornwall and the Isles of Scilly increased by just under
4%, slightly below the Great Britain average growth of 9% (Figure 28).
524,300 533,800 545,300
5,170,500 5,300,800
54,000,000 59,557,400 61,470,800 64,600,000
1,000
100,000
10,000,000
2007 2011 2014
C&IoS South West Great Britain

Evaluation of the ESF Convergence Programme
September 2015 Page 52 ISO9001:2008 QAP 01/01 Issue 8
3.9.2 Gross Value Added (GVA) and wage levels
Between 2010 and 2011 the value of local economic activity had increased by 2.7%, compared with a
national increase of 2.4%. Between 2006 and 2011, there was a slight increase in economic activity36.
Data sourced from the Office for National Statistics show the average annual salary in the region
increased from £19,706 in 2008, to £21,232 in 2014. Although figures remain lower than the UK
average (£26,137 in 2007 and £27,271 in 2014), the rate of growth in Cornwall and the Isles of Scilly
is, at 7.7%, higher than the national average of 4.2% during this period37.
Cornwall relies heavily on tourism and agriculture whereby wages within these sectors are relatively
low. Manpower Group in their Pay League 2014 for example, identify a link between high value
employers, skilled worker demand and high pay38. The Pay League table also shows that, although
the percentage of females working part-time was amongst the highest in the country, their average
wage rose by just 0.9% to £13.05 per hour whereas the rise for men was 3% to £15.79 per hour.
According to Manpower Group’s reports, one reason for the gender divide has been the growth in
traditionally male-dominated industries such as aerospace which have contributed to pay rises
within Cornwall. The percentage of working women in Cornwall is relatively high, however the
industries in which they tend to work are typically associated with lower rates of pay – such as the
care, hospitality sectors and associated industries such as cleaning.
3.9.3 Enterprise
The number of businesses in Cornwall and the Isles of Scilly increased between 2007 and 2011, but
declined again resulting in no net change between 2007 and 2014 (Figure 29).
Figure 29: Number of businesses in the region compared with the UK 2007-2014
36
Cornwall Council (2013), Cornwall’s Economy at a Glance 37 Office for National Statistics; UK Business: Activity, Size and Location 2007; 2011 and 2014 (data not available for 2015)
38 Manpower Group 2014
21665 25640
21665
2123940 2547840 2263645
20000
200000
2000000
2007 2011 2014
Cornwall & the Isles of Scilly South West UK

Evaluation of the ESF Convergence Programme
September 2015 Page 53 ISO9001:2008 QAP 01/01 Issue 8
Source: ONS; UK Business: Activity, Size and Location 2007; 2011 and 2014 (data not available for
2015)
The number of new business start-ups increased by 6% between 2007 and 2013. A slight decline in
2011 is consistent with the impact of the recession, and from 2011 to 2013, there was a 25%
increase (Figure 30).
Figure 30: Number of new business start-ups in Cornwall and the Isles of Scilly 2007-2013
Source: ONS; UK Business: Activity, Size and Location 2007; 2011 and 2014 (data not available for
2015)
Between 2007 and 2011, the number of businesses that closed in Cornwall and the Isles of Scilly rose
by nearly 6%. However this number dropped again following the immediate aftermath of the
recession, returning to 2007 figures by 2013 (Figure 31).
2145
1715
2285
0
500
1000
1500
2000
2500
Year 2007 2011 2013
Nu
mb
er o
f b
usi
nes
ses

Evaluation of the ESF Convergence Programme
September 2015 Page 54 ISO9001:2008 QAP 01/01 Issue 8
Figure 31: Number of closed businesses in Cornwall and the Isles of Scilly 2007-2013
Source: ONS; UK Business: Activity, Size and Location 2007; 2011 and 2014 (data not available for
2015)
3.9.4 Employment
Figure 32 shows an 11% increase in the number of females employed in Cornwall and the Isles of
Scilly between 2007 and 2014. There was also a 14% increase in the total numbers employed during
the same period, and concurrently the rate of unemployment fell slightly from 5.3% in 2007 to 5.1%
in 2014 (Figure 32). The numbers of people claiming benefits fell by just over a fifth (21.4%) between
2007 and 2015 (Figure 35).
There was an increase of 25% in the number of people aged between 50 and 64 employed in
Cornwall and the Isles of Scilly between 2007 and 2014 (Figure 33).
223600 229525 237660
18785 18805 19165 1725 1830 1725
0
50000
100000
150000
200000
250000
2007 2011 2013Nu
mb
er o
f cl
ose
d b
usi
nes
ses
Year
UK South West Cornwall & Isles of Scilly

Evaluation of the ESF Convergence Programme
September 2015 Page 55 ISO9001:2008 QAP 01/01 Issue 8
Figure 32: Numbers of people employed regionally and nationally 2007-2014
Source: ONS data for 2011 and 2014 is for the period Aug-Oct; taken from the Regional Labour
Market: HI09 - Headline Indicators for the South West. 2014 is the latest available data.
11
39
00
12
66
00
11
79
00
12
67
00
12
82
00
13
05
00
11
83
10
0
13
51
70
0
11
83
35
4.0
34
13
25
30
1.1
64
12
50
09
5.2
67
13
75
76
7.4
93
13
52
10
00
15
85
70
00
13
71
60
00
15
66
00
00
14
37
10
00
16
35
50
00
0
2000000
4000000
6000000
8000000
10000000
12000000
14000000
16000000
18000000
Female Male Female Male Female Male
2007 2011 2014
Nu
mb
er o
f p
eop
le
Cornwall (& the Isles of Scilly) South West UK

Evaluation of the ESF Convergence Programme
September 2015 Page 56 ISO9001:2008 QAP 01/01 Issue 8
Figure 33: Numbers of people aged 50-64 employed regionally and nationally 2007-2014
Source: ONS data for 2011 and 2014 is for the period Aug-Oct; taken from the Regional Labour
Market: HI09 - Headline Indicators for the South West. 2014 is the latest available data.
Figure 34: Unemployment rate regionally and nationally 2007-2014
Source: Annual Population Survey
78700 86800 104900
749800 799600 878500
7736500
8228200
9092200
0
1000000
2000000
3000000
4000000
5000000
6000000
7000000
8000000
9000000
10000000
2007 2011 2014
Nu
mb
er o
f p
eop
le
Cornwall (& the Isles of Scilly) South West UK
5.30% 5.20% 5.10%
3.90%
6.10%
5.20% 5.20%
8.20%
6.40%
0.00%
1.00%
2.00%
3.00%
4.00%
5.00%
6.00%
7.00%
8.00%
9.00%
2007 2011 2014
% o
f th
e la
bo
ur
forc
e cl
asse
d a
s u
nem
plo
yed
Year
Cornwall (& the Isles of Scilly) South West UK
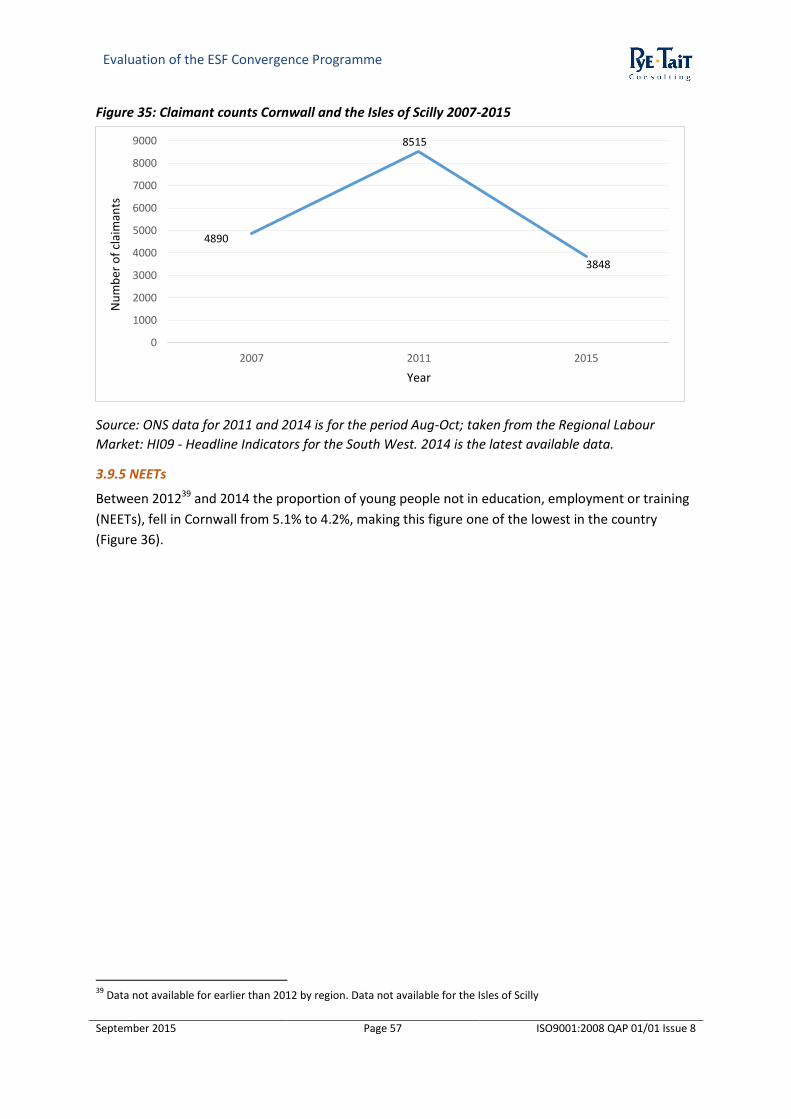
Evaluation of the ESF Convergence Programme
September 2015 Page 57 ISO9001:2008 QAP 01/01 Issue 8
Figure 35: Claimant counts Cornwall and the Isles of Scilly 2007-2015
Source: ONS data for 2011 and 2014 is for the period Aug-Oct; taken from the Regional Labour
Market: HI09 - Headline Indicators for the South West. 2014 is the latest available data.
3.9.5 NEETs
Between 201239 and 2014 the proportion of young people not in education, employment or training
(NEETs), fell in Cornwall from 5.1% to 4.2%, making this figure one of the lowest in the country
(Figure 36).
39
Data not available for earlier than 2012 by region. Data not available for the Isles of Scilly
4890
8515
3848
0
1000
2000
3000
4000
5000
6000
7000
8000
9000
2007 2011 2015
Nu
mb
er o
f cl
aim
ants
Year

Evaluation of the ESF Convergence Programme
September 2015 Page 58 ISO9001:2008 QAP 01/01 Issue 8
Figure 36: Proportion of NEETs by region 2012 and 2014
Source: Department for Education
3.9.6 Skill and knowledge levels
By 2012, the economy in England was picking up from the recession prompting anticipation for high
demand for a skilled workforce40. According to a report by the CBI in 2013, employers were already
reporting skill shortages and expecting shortages to worsen. Some employees were reported to be
lacking in core skills. These shortages were of particular cause of concern to SMEs.41
In Cornwall and the Isles of Scilly, an over-reliance on seasonal low value /low paid jobs,
underpinned by a significant proportion of the population with low or no qualification42 is often
identified as a significant contributing factor to skills shortages.
However the proportion of individuals holding qualifications at levels 1-4+ increased in Cornwall
during the Convergence programme. The number of people with no qualifications at all fell from
10% to 6%, a substantial drop (Figure 37)43.
40
CBI 2013 41
Cornwall Apprenticeships 2013 42
South West England Skills Priorities Statement 2011-2012 43
Source: data extracted from the Annual Population Survey; data for the period between Jan-Dec of each year. No available data for the Isles of Scilly
5.5%
5.1% 5.4%
4.7%
5.6%
6.2%
4.8%
6.3% 6.4%
8.3%
4.5% 4.2% 4.2%
3.4%
4.5%
5.4%
4.4%
5.1% 5.2%
7.1%
0.0%
1.0%
2.0%
3.0%
4.0%
5.0%
6.0%
7.0%
8.0%
9.0%
SouthWest
Cornwall South East London East ofEngland
WestMidlands
EastMidlands
Yorkshire& the
Humber
NorthWest
North East
%
end of 2012 end of 2014
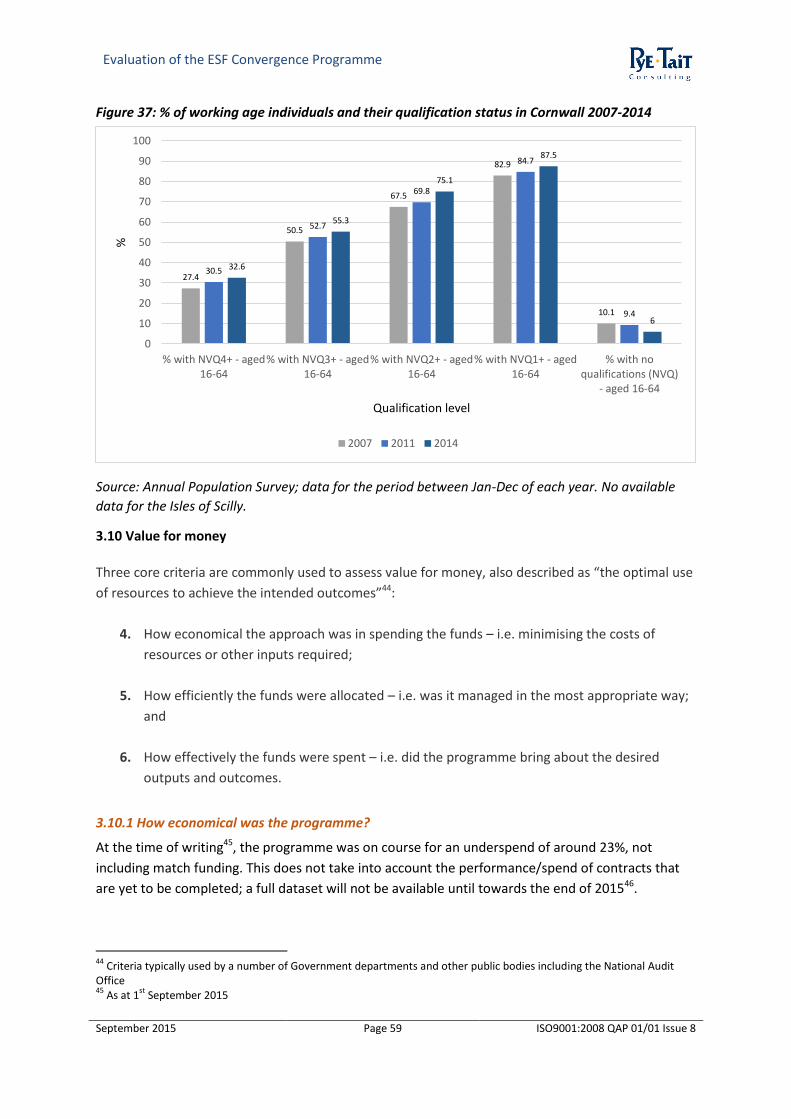
Evaluation of the ESF Convergence Programme
September 2015 Page 59 ISO9001:2008 QAP 01/01 Issue 8
Figure 37: % of working age individuals and their qualification status in Cornwall 2007-2014
Source: Annual Population Survey; data for the period between Jan-Dec of each year. No available
data for the Isles of Scilly.
3.10 Value for money
Three core criteria are commonly used to assess value for money, also described as “the optimal use
of resources to achieve the intended outcomes”44:
4. How economical the approach was in spending the funds – i.e. minimising the costs of
resources or other inputs required;
5. How efficiently the funds were allocated – i.e. was it managed in the most appropriate way;
and
6. How effectively the funds were spent – i.e. did the programme bring about the desired
outputs and outcomes.
3.10.1 How economical was the programme?
At the time of writing45, the programme was on course for an underspend of around 23%, not
including match funding. This does not take into account the performance/spend of contracts that
are yet to be completed; a full dataset will not be available until towards the end of 201546.
44
Criteria typically used by a number of Government departments and other public bodies including the National Audit Office 45
As at 1st
September 2015
27.4
50.5
67.5
82.9
10.1
30.5
52.7
69.8
84.7
9.4
32.6
55.3
75.1
87.5
6
0
10
20
30
40
50
60
70
80
90
100
% with NVQ4+ - aged16-64
% with NVQ3+ - aged16-64
% with NVQ2+ - aged16-64
% with NVQ1+ - aged16-64
% with noqualifications (NVQ)
- aged 16-64
%
Qualification level
2007 2011 2014

Evaluation of the ESF Convergence Programme
September 2015 Page 60 ISO9001:2008 QAP 01/01 Issue 8
More detailed data are available for some of the SFA contracts47 which highlight areas of
underspend, which featured particularly in relation to progressions48, namely:
Progressions into employment (underspend of 23%);
Progressions into Higher Education (underspend of 30%);
Achievement of level 2 qualifications (underspend of 15%);
Achievement of level 3 qualifications (underspend of 10%);
Achievement of non-accredited learning (underspend of 27%);
Completion of training with 10-76+ Guided Learning Hours (GLH) (underspend of 37%); and
Capacity building (underspend of 15%).
A range of factors have contributed to the underspend, notably:
The need for greater flexibility in the region than could actually be offered in the second half
of the programme, which was more nationally-led;
Changes to contracting as a result which were more output-driven, but which imposed
stringent evidence requirements that could be hard to achieve, examples being progressions
into employment just 13 weeks after leaving the programme;
The impact of the recession contributing to job cuts;
Delayed start to some contracts and issues experienced by the prime contractor model
which ate into available time for delivery; and
Inability to reallocate the funds to other regions or areas rather than underspend, due to EU
rules.
Furthermore providers have noted that Convergence was awarded a substantial sum of money and
despite the recession, it was challenging to spend it all. Response to redundancy contracts
performed relatively poorly in Cornwall and the Isles of Scilly, as the region was less badly affected
by the recession than was reflected in the amount of funding allocated.
3.10.2 How efficiently were funds allocated and managed?
Changes in the second half of the programme meant some projects were not delivered as efficiently
or as cost effectively as they could have been, predominantly because there was less time left for
46
It should be noted that as this evaluation has been funded by Technical Assistance, the work had to be completed by the end of August 2015, to meet with payment regulations, and therefore it has not been possible to analyse a full dataset on programme performance and spend against targets 47
Data were not yet available for contracts that have recently concluded delivery in late 2014/early or mid-2015 48
See Figure 18 in Section 3.6
Evaluation of the ESF Convergence Programme
September 2015 Page 61 ISO9001:2008 QAP 01/01 Issue 8
actual delivery because of delays while issues were being resolved49, as well as structural conflicts
such as those affecting linkages with ERDF50.
However it should be noted that many of the issues experienced were due to factors that were
predominantly outside the control of the local management teams, and that there has been
considerable praise of the approach to management during the first half of the programme.
3.10.3 How effectively were the funds spent?
As previously stated, the Convergence programme experienced substantial overachievements in
relation to the majority of targets. A number of reasons have been suggested for the hugely inflated
achievement levels:
Targets were set pre-recession, and as they had to forecast ahead for a 7 year period,
conservative estimates were used which were not as ambitious as they might have been.
Although the DWP made a request to update the targets at the mid-point of the
programme, the EU wished to maintain the original targets;
The Convergence programme was designed specifically with local needs in mind so providers
found it easier to engage with the target group, particularly during the first half of the
programme;
Participants were able to engage with multiple ESF projects in order to support their journey
and move closer to the labour market. Thus some participants moved from one type of ESF
supported provision to another as they progressed towards employment, evidence that
provision made available locally was effectively joined up;
A favourable exchange rate in 2009 to provide support during the recession, effectively
made available an additional £170 million of ESF funds nationally;
Many participants accessed short forms of support, such as information, advice and
guidance sessions, which were relatively quick to turnaround and meant higher numbers
could be supported.
Where targets were not met, the context of the recession, as well as other influences such as a high
proportion of seasonal employment in the region; a requirement to provide evidence of progression
into employment within a relatively short timescale following the programme; and a prevailing
culture of low aspiration in relation to accessing Higher Education, were all cited as factors.
Overall the view across the board is that ESF has made a difference, notably in relation to social
impacts, building confidence and raising aspirations; but also economically by helping people
progress out of benefits and into jobs.
49
Discussed in more detail in Section 3.7 50
Discussed in more detail in Section 3.4
Evaluation of the ESF Convergence Programme
September 2015 Page 62 ISO9001:2008 QAP 01/01 Issue 8
“When people’s lives are transformed, what price can you put on that?”
However some stakeholders questioned whether businesses genuinely have had transformational
support, stating that more provision was needed to develop leadership and management skills.
There is a consensus that without ESF, the impacts that can be directly attributed to the programme,
would not have been achieved, and furthermore that funding could not have been provided through
any other means that would have offered the same type and volume of provision.
In summary therefore, although the funds were not managed as efficiently as they could have been
in the earlier phase of the second half of the programme, ultimately the majority of targets have
been overachieved, using only around 75% of the ESF allocation. This suggests that value for money
has been broadly achieved, although lessons can be learned for future programmes to maximise the
funds to full effect.
3.11 Strategic considerations for future programmes
The management and delivery of the next ESF Programme in the region (Growth Programme) is
likely to revert back to a greater degree of local control. A devolution deal has been granted to
Cornwall, based upon an agreement between Government, Cornwall Council and the Cornwall and
Isles of Scilly Local Enterprise Partnership to devolve a range of powers and responsibilities to
Cornwall.
Notably the region will be able to identify and develop new apprenticeship opportunities and re-
shape further education training and learning provision for adults. Cornwall will also have
Intermediate Body status, which means decisions on allocating €603.7m of funding for ERDF and ESF
will now be made locally rather than at Westminster.
There are concerns among respondents about the role and remit of the Integrated Territorial
Investment (ITI) Board for the Growth Programme, and other similar committees or Steering Groups
to be formed to support delivery of the devolution deal. There seems to be a lack of clarity and
transparency in relation to the remit of the ITI Board, including how its members are/were selected,
whether and how it will be independently monitored, and whether there is a conflict of interest risk
due to self-interest among members when discussing bids for ESF projects.
Therefore, whilst local decision making is clearly the preferred option and accords with the localism
agenda, it seems that there is a lack of clarity in relation to the overarching strategic leadership,
notably in light of the devolution deal, as to who will take ownership for ESF, whether there will be
sufficient transparency within programme governance, and whether new arrangements could
become more complex as opposed to bringing about simplification. While these questions remained
unanswered, they clearly present an important risk for the delivery of the future programme.

Evaluation of the ESF Convergence Programme
September 2015 Page 63 ISO9001:2008 QAP 01/01 Issue 8
4. Key findings – Priority 4
4.1 Performance against targets – Priority 4
As previously stated in section 3.6, the Convergence programme has reported much higher numbers
of participants than was forecast in the actual targets. In Cornwall and the Isles of Scilly, 293% of
target was achieved for Priority 4. The national achievement for England and Gibraltar was 387% of
targets achieved in respect of participant starts (Figure 38).
Figure 38: % of achievements against targets, participant starts - Priority 4 and Priority 1 (rest of
England)
Source: ESF Division, DWP (July 2015)
Similarly, the Convergence programme also engaged with a higher volume of those that were
unemployed – 348% of target (Figure 39); and economically inactive - 212% of target (Figure 40).
387
293 302 271
304
452
295 300
361
304 326
0
50
100
150
200
250
300
350
400
450
500
%

Evaluation of the ESF Convergence Programme
September 2015 Page 64 ISO9001:2008 QAP 01/01 Issue 8
Figure 39: % of achievements against targets, participants that were unemployed and in work on
leaving - Priority 4 and Priority 1 (rest of England)
Source: ESF Division, DWP (July 2015)
513
348
377
334
355
688
362
406
438
452
483
261
201
197
206
200
357
203
182
273
213
206
0 100 200 300 400 500 600 700 800
England & Gibraltar
Cornwall & the Isles ofScilly
East of England
East Midlands
London
North-East
North-West
South-East
South-West
West Midlands
Yorkshire & the Humber
%
In work on leaving
Unemployed

Evaluation of the ESF Convergence Programme
September 2015 Page 65 ISO9001:2008 QAP 01/01 Issue 8
Figure 40: % of achievements against targets, supporting participants that were economically
inactive - Priority 4 and Priority 1 (rest of England)
Source: ESF Division, DWP (July 2015)
Cornwall and the Isles of Scilly appear on paper to have exceptionally high achievements against
target for moving young people not in education, employment or training (NEETs) into education,
employment or training (EET), at 625% against target (Figure 41). Evidence of highly effective routes
to engage with NEETs may well have been a contributory factor in this successful achievement
(explained in more detail in section 5.2).
212 212
105
149
238
81
157
113
224
100
72
0
50
100
150
200
250
%

Evaluation of the ESF Convergence Programme
September 2015 Page 66 ISO9001:2008 QAP 01/01 Issue 8
Figure 41: % of achievements against targets, participants that were NEET and those supported
into EET - Priority 4 and Priority 1 (rest of England)
Source: ESF Division, DWP (July 2015)
Convergence did not achieve its target to support those aged over 50 in Priority 4, but reasons for
this are less clear (Figure 42). This is of particular pertinence given the LEP has identified that an
ageing population will constitute a major social change over the next 20 years in Cornwall and the
Isles of Scilly.
427
341
475
359
320
553
379
393
430
332
454
650
625
899
565
537
909
633
651
653
566
690
0 200 400 600 800 1000
England & Gibraltar
Cornwall & the Isles of…
East of England
East Midlands
London
North-East
North-West
South-East
South-West
West Midlands
Yorkshire & the Humber
%
14-19 NEET into EET
14-19 NEET

Evaluation of the ESF Convergence Programme
September 2015 Page 67 ISO9001:2008 QAP 01/01 Issue 8
Figure 42: % of achievements against targets, participants that were aged over 50 - Priority 4 and
Priority 1 (rest of England)
Source: ESF Division, DWP (July 2015)
4.2 Effectiveness of project delivery – Priority 4
4.2.1 Partnership working
Close working relationships feature strongly in Cornwall and the Isles of Scilly, with partnerships
developed during Objective One and earlier, maintained and strengthened over time. During the
first half of the programme there is evidence of effective partnership working between strategic
organisations such as the CFOs, Local Authorities and Jobcentre Plus, as well as at an operational
delivery level between providers. A critical success factor was partnership working between project
deliverers and Jobcentre Plus Work Coaches so that advisors in job centres had a good
understanding of ESF and how to refer those that were eligible. Throughout the programme
providers worked closely together, where able to do so, to share information in order to maximise
the support available and complement, rather than displace existing mainstream provision.
4.2.2 Flexible use of funds
ESF has enabled bespoke delivery of tailored support. In some cases this has made the unit costs per
participant comparatively high when looking at more typical mainstream provision, however the
likelihood is that specific support brings about significant and long-lasting impacts. The award-
winning work undertaken by Fifteen, for example, has directly influenced positive changes for
18%
30%
18%
18%
18%
18%
18%
18%
18%
18%
18%
15%
19%
17%
19%
16%
13%
16%
19%
18%
16%
15%
0% 5% 10% 15% 20% 25% 30% 35%
England &Gibraltar
Cornwall & theIsles of Scilly
East of England
East Midlands
London
North-East
North-West
South-East
South-West
West Midlands
Yorkshire & theHumber
%
Achievement
Target

Evaluation of the ESF Convergence Programme
September 2015 Page 68 ISO9001:2008 QAP 01/01 Issue 8
individuals by not only providing catering training, but also dedicated support from personal
caseworkers to help participants overcome their issues and other barriers, as the following case
study indicates:
Case Study: Fifteen Cornwall
H works at a restaurant in Newquay. However, his career path was not certain until he was referred
to Fifteen Cornwall, in Watergate Bay. He had worked in the catering sector since he was 15 when
clashes with the police led him to be placed on a project aimed at people with the potential of
getting into trouble with them. Through the project, H found a catering job near where he lived.
Unfortunately, he had difficulties settling into the programme and because of his personal problems
with included alcohol and drugs abuse and anger management issues, he was referred to Fifteen
Cornwall.
Fifteen Cornwall is an apprentice programme managed by Cornwall Food Foundation. Supported by
ESF Convergence Programme for Cornwall, through Cornwall Works, the programme was set up to
encourage disadvantaged young people discover and develop their potential in catering.
As well as his training in catering, H was assigned a case worker from Fifteen Cornwall who worked
with him to overcome his issues with anger, drinks and drugs through counselling. This also helped
him to overcome the problems he experienced at the start of the programme, with discipline and
what was expected of him.
H is now passionate about cooking, citing his referral and acceptance of the Fifteen Cornwall
programme as the best decision he had ever made. His success in turning his life around has
impressed those who have worked with him and supported him on his journey.
‘Within the two years, he has just flown away, really. He is now a Head Chef and he’s doing great.’
Caseworker, Fifteen Cornwall
4.2.3 Engagement and referrals
Effective engagement with the target group has been underpinned by strong partnership working. It
was also reliant on provider approaches to engagement in the community in order to motivate
people to participate.
More referrals came via the Jobcentre Plus during the second half of the programme, as a result of
workshops to upskill staff, communicate the benefits of work experience via ESF projects and co-
locating work coaches in job centres to support referrals. A lot of work went into forging strong
relationships between providers and individual caseworkers, so that the engagement process could
be as streamlined as possible. There was also a high proportion of referrals via Cornwall Works Hub.
A major strength of the Convergence programme was the engagement work that social enterprise
and other third sector organisations undertook directly in the community. Their knowledge of the
client base and innovative, tried and tested approaches to engagement was a critical success factor,
arguably making capacity building in the voluntary sector even more important for the future. This
was of particular value in the second half of the programme, given that the prime contractors did
not have to be based in the region.
Evaluation of the ESF Convergence Programme
September 2015 Page 69 ISO9001:2008 QAP 01/01 Issue 8
This also helped the programme achieve its targets in respect of NEETs, many of whom needed a lot
of pre-engagement work to encourage them to access the support.
4.2.4 Participant journey
Referral routes and a proliferation of providers could be confusing for ESF participants. Learners did
not always understand when they were eligible or ineligible for support. Furthermore they could be
offered the same type of provision – for example confidence building – that they may have already
previously accessed through a different project.
The structure of payments in the second half of the programme also meant that there was
competition which obstructed a seamless participant journey. For example NEETs were targeted by
different projects – and often where collaboration would have benefited the participants, providers
competed with each other to provide a whole package because their payments were based on the
delivery of the package as a whole. Limited data sharing between providers contributed to this issue.
A Learning Partnership and Cornwall Council jointly managed project (180) to engage with young
people capitalised on the journey they themselves as project-managers have undertaken through
predecessor and multiple projects. They have been able to identify, and make use of existing
resources, including a dedicated database (funded by Cornwall Council) which monitors NEETs for
the purposes of providing Careers Information, Advice and Guidance (CIAG). As a result of hard work
and effort over several years in identifying the numerous resources – held in schools, colleges and by
the Council, for example, dedicated to maintaining data on NEETs in Cornwall, providers now have
access to a clear and up-to-date understanding and intelligence on the disengaged target group.
This benefits this and future projects as it enables more time to be spent on planning the best
engagement strategies. Previously providers spent time first identifying and seeking out relevant
young people – for example by going to youth clubs or speaking to people on the street before
undertaking planned interventions. Added value comes about by maximising the potential of existing
services to such young people and thus enhancing the services they receive.
It is a more coherent and co-ordinated means of making best use of resources, and again is
underpinned by strong partnership working. This example could be replicated for other target
groups with the added benefit of helping to avoid the risk of multiple but duplicated interventions.
4.3 Barriers – Priority 4
4.3.1 ‘Top down’ changes following the change of Government in 2010
The recession brought with it a higher volume of clients closer to the labour market, which in one
sense made engagement more straightforward. However at the same time the Government’s
spending reduction had a knock on effect on referrals via the Children’s School and Families
pathway, as Local Authorities were affected by job cuts and restructuring. As a result referrals via
Local Authorities substantially declined, however, as previously stated, there was a high volume of
referrals via Jobcentre Plus and via Cornwall Works Hub.

Evaluation of the ESF Convergence Programme
September 2015 Page 70 ISO9001:2008 QAP 01/01 Issue 8
Another issue was the commercial pressures of the prime contractor model. Until there was
evidence of outputs, the prime provider could not be paid. This created issues with sub-contractors,
some of whom were unable to maintain the contract as it was not financially viable. It was harder for
small providers including the voluntary sector and social enterprises to absorb the costs.
In some cases this prompted partners to leave the project so replacements needed to be recruited,
which resulted in delays in actually supporting participants and getting them on to the start of the
journey. Whilst the prime contractor model did ultimately build some very good delivery
partnerships, this took some time.
4.3.2 Paperwork and bureaucracy
Some participants found the requirement to complete multiple sets of paperwork to be very
onerous and this did put some people off. One provider stated that paperwork was “endlessly talked
about as a barrier”. A stakeholder talked about the dark art of the ESF language and process and in
itself is another barrier to those who are not well versed to the nature and requirements of the ESF,
an issue concerning some for the next programme.
“Some of the paperwork is a nightmare”
A number of regional stakeholders and project managers stated that the programme could have
been delivered more cost effectively in the second half had they been able to retain the approach of
the first half – instead they consider money was wasted on bureaucracy.
4.3.3 Disengagement and gaps
Providers had to deal with dropouts because the people targeted often faced a whole host of
barriers, such as mental health and other issues e.g. drug/alcohol problems.
The transport infrastructure also caused problems – for example enabling participants to attend
courses as well as get to work. Social anxiety is high among some participant groups, preventing
them from using public transport.
The issue relating to transport was intensified following nationally-led decisions by the SFA that
required employers to now fund training that had previously been provided via public funding.
Training for bus drivers came into this category, and despite a severe shortage of trained bus drivers
in Cornwall, this meant SFA ESF projects could no longer train bus drivers. This was a factor in the
cancellation of some bus routes. Instead more provision was funded that was typically cheaper on a
‘per head’ basis but did not meet the needs of the area – such as hair and beauty training, in a
market that was already saturated for this sector.
4.4 Impacts – Priority 4
4.4.1 Impact on the third sector
Although a number of third sector organisations were negatively affected by the change introducing
the prime contractor model, there is also evidence of capacity building. A number of stakeholders
have pointed to the likelihood of positive impact on third sector organisations if the value of

Evaluation of the ESF Convergence Programme
September 2015 Page 71 ISO9001:2008 QAP 01/01 Issue 8
contracts rises in the future, resulting in a need for increased partnership working. A social
enterprise apprenticeship framework has also been developed as a result of the funding.
It is less clear whether the positive impacts will be or can be sustained in the longer-term, and a
number of providers stated that it is vital that the new programme builds upon the established
momentum to help embed stronger and longer-lasting capacity building within small organisations
and social enterprises.
4.4.2 Distance travelled among participants
Individual projects have a wide range of evidence and case studies that demonstrate positive
impacts for participants. Just one example is summarised below:
Case Study: Distance travelled
Two years after moving to Cornwall KB was helped to build a career in Administration. KB initially
struggled to adjust to her new life and was assigned a family caseworker who put her in touch with
an ESF programme designed to help unemployed people overcome the difficulties of finding
employment by providing support through training in CV writing and interview skills as well as a 13-
week work placement.
Even though KB had some qualifications from previous courses, she was struggling to re-access the
labour market and had lost her confidence. She was encouraged to take an ECDL computer course
and received support even after she had completed this through regular progress update meetings.
“We support people for up to 3 months after they have left the programme, so that if they hit any
bumps in the road, they have got someone that they trust and who believes in them, to pick them
back up.”
ESF Programme Manager
Having successfully completed the programme, KB was able to gain employment as a receptionist.
The encouragement and support she received from the Programme Manager gave her the
confidence to apply for and get a job.
Evaluation of the ESF Convergence Programme
September 2015 Page 72 ISO9001:2008 QAP 01/01 Issue 8
Typically participants report positive changes such as:
Greater self-confidence;
Personal goals planned;
Reduced anxiety;
Stronger career aspirations; and
Better self-esteem.
These impacts cannot be underestimated among participants that face multiple barriers to work.
The National Offender Management Service (NOMS) undertook research into re-offending rates
among ESF participants, and found that they were less likely to reoffend compared with those that
had not been on the programme51.
4.4.3 Economic effect for the region
Economic benefits for the region are difficult to fully quantify, because of the “ripple effect” which is
not often measured – for instance costs saved if people do not need to visit their GP as regularly or
not taking medicines to control anxiety.
There are more tangible direct economic benefits evidenced through the numbers progressing into
employment, as well as longer-lasting legacies brought about by the programme. For instance the
Council of the Isles of Scilly reported that a golf instruction course had resulted in one learner
deciding to teach at the local club, a service that was not previously available and which is likely to
bring economic benefit through tourism.
A further sustainable benefit was highlighted by the project manager of Trade Union Congress, who
stated that “Without ESF, the St Austell Learning Centre would not have come about. It provides a
major springboard in terms of the capacity to host meetings and hold computer-based training.”
51
Feedback from telephone interview with NOMS

Evaluation of the ESF Convergence Programme
September 2015 Page 73 ISO9001:2008 QAP 01/01 Issue 8
5. Key findings – Priority 5
5.1 Performance against targets – Priority 5
In Cornwall and the Isles of Scilly, 227% of target numbers supported was achieved for Priority 5.
This was very slightly below the national achievement for England and Gibraltar (239% of targets
achieved in respect of participant starts) (Figure 43).
Figure 43: % of achievements against targets, participant starts - Priority 5 and Priority 2 (rest of
England)
Source: ESF Division, DWP (July 2015)
Analysis of the data shows that the Convergence programme was behind target for supporting
participants without basic skills (54% of target achieved) (Figure 44). This may reflect the
demographic in the region and the fact that numbers of people with no qualifications at all fell from
10% to 6% during the timeframe for the programme. Thus the target cohort could have narrowed.
The recession is also likely to have been a factor, as this resulted in a client group that was closer to
the labour market, the newly unemployed - unlikely to lack basic skills.
239 227
251
221
183
293 275
254
294
229 248
0
50
100
150
200
250
300
350
%

Evaluation of the ESF Convergence Programme
September 2015 Page 74 ISO9001:2008 QAP 01/01 Issue 8
Figure 44: % of achievements against targets, participants supported without basic skills and to
gain basic skills - Priority 5 and Priority 2 (rest of England)
Source: ESF Division, DWP (July 2015)
Although targets were exceeded in respect of supporting participants either without level 2 or level
3 qualifications to attain them, there was substantially greater overachievement for level 3 (Figures
45 and 46). This is likely to be as a result of regulation changes in the second half of the programme
which meant that participants could no longer be supported to gain a second level 2 qualification.
148
54
132
125
159
174
153
163
129
174
141
114
120
139
77
138
119
132
82
194
153
56
0 50 100 150 200
England & Gibraltar
Cornwall & the Isles of Scilly
East of England
East Midlands
London
North-East
North-West
South-East
South-West
West Midlands
Yorkshire & the Humber
%
Gained basic skills
With basic skills needs

Evaluation of the ESF Convergence Programme
September 2015 Page 75 ISO9001:2008 QAP 01/01 Issue 8
Figure 45: % of achievements against targets, participants supported without level 2 qualifications
and to gain them - Priority 5 and Priority 2 (rest of England)
Source: ESF Division, DWP (July 2015)
123
134
119
123
98
133
144
134
203
123
131
260
200
284
228
239
406
258
250
337
197
297
0 50 100 150 200 250 300 350 400 450
England & Gibraltar
Cornwall & the Isles of Scilly
East of England
East Midlands
London
North-East
North-West
South-East
South-West
West Midlands
Yorkshire & the Humber
%
Gained level 2
Without level 2

Evaluation of the ESF Convergence Programme
September 2015 Page 76 ISO9001:2008 QAP 01/01 Issue 8
Figure 46: % of achievements against targets, participants supported without level 3 qualifications
and to gain them - Priority 5 and Priority 2 (rest of England)
Source: ESF Division, DWP (July 2015)
As for Priority 4, Convergence did not achieve its target to support those aged over 50 in Priority 5;
only two regions in England either met or exceeded this target (Figure 47).
495
476
536
535
279
712
658
446
698
450
543
407
435
464
468
372
366
492
402
543
288
471
0 100 200 300 400 500 600 700 800
England & Gibraltar
Cornwall & the Isles of Scilly
East of England
East Midlands
London
North-East
North-West
South-East
South-West
West Midlands
Yorkshire & the Humber
%
Gained level 3
Without level 3

Evaluation of the ESF Convergence Programme
September 2015 Page 77 ISO9001:2008 QAP 01/01 Issue 8
Figure 47: % of achievements against targets, participants that were aged over 50 - Priority 5 and
Priority 2 (rest of England)
Source: ESF Division, DWP (July 2015)
There is evidence of strong overachievement against target for supporting higher level skills – with
over 500% of target reached for participants gaining a level 5 qualification (Figure 48).
20%
22%
20%
20%
20%
20%
20%
20%
20%
20%
20%
18%
18%
21%
17%
15%
19%
16%
19%
20%
18%
18%
0% 5% 10% 15% 20% 25%
England & Gibraltar
Cornwall & the Isles ofScilly
East of England
East Midlands
London
North-East
North-West
South-East
South-West
West Midlands
Yorkshire & the Humber
%
Achievement
Target

Evaluation of the ESF Convergence Programme
September 2015 Page 78 ISO9001:2008 QAP 01/01 Issue 8
Figure 48: Priority 5 - % of achievements against targets
Source: ESF Division, DWP (July 2015)
5.2 Effectiveness of delivery – Priority 5
5.2.1 Partnership working
Priority 5 projects benefitted from a breadth of different providers, underpinned by strong steering
groups with inclusive and shared goals. The holistic approach brought partners together to offer
joint elements of the project, which improved the offer for participants.
A wide range of training was developed between partners incorporating new progression routes for
further learning.
5.2.2 Engagement
Broad engagement activity was available to encourage those who had been previously disengaged
from learning, with needs established via high quality Information, Advice and Guidance (IAG). As an
example, the rural land-based project, Business Forward, appointed a Skills Broker to recruit new
learners, mainly from isolated areas/micro-businesses where it was extremely difficult to encourage
individuals to take time out for training. Sector knowledge helped to establish robust relationships
with beneficiaries and understand barriers.
The Empowering Smart Women project was a very good example of successful engagement with
females. This project established all female peer groups, able to identify and discuss barriers of
moving into middle/senior management roles and worked with participants to help overcome these.
Participants lacked confidence when they first joined, and cited lack of role models in their own
521
173
527
130 136 115
0
100
200
300
400
500
600
Without level 4 Gained level 4 Gained level 5 Post grad Grads into SMEs Placed with SMEinto employment
%
Evaluation of the ESF Convergence Programme
September 2015 Page 79 ISO9001:2008 QAP 01/01 Issue 8
organisations as a factor. The project helped them build confidence, run businesses more effectively
and move into management roles. Participants benefitted from had their own personal mentor, and
action learning workshops delivered by mentors, which were bespoke to their particular needs.
5.2.3 Higher level skills
ESF funds have been paramount in supporting higher level skills following severe cuts in funding for
adult training and the introduction of a loans system.
Providers welcomed the ability to use the Innovation Code to use elements from a range of
qualifications to build bespoke accredited that previously did not exist. However this introduced
quite late on in the programme and there is less evidence to demonstrate its impact.
5.3 Barriers – Priority 5
5.3.1 Lack of flexibility
There is a strong consensus that ESF provision, whilst still adding value for businesses, was not as
flexible as it could have been at meeting local needs.
“ESF was delivered as a push not a pull. Businesses were offered training and asked if they wanted to
do it – rather than building tailored provision based on Training Needs Analyses”
“ESF expects businesses to fit in with it, not the other way around”
Providers reported that there is less ambition among businesses in the region for attaining formal
qualifications, but there is greater interest in building competence for the longer-term, which may
require training in succession planning for instance. Businesses were instead compelled in some
cases to achieve a full qualification which may not have been necessary to meet their needs and
took up more of their time.
Gaps in middle management are a risk for the region, with a need for aspirational career pathways
for those that are not business owners – ESF could have helped to plug this gap.
Funds could also have been maximised had there been more flexibility. For instance PhD students
had to complete their research in a set timeframe with no provision for breaks such as maternity
leave. This placed a lot of pressure on students.
5.3.2 Engagement among businesses
Perceived complexity of paperwork was an issue for some businesses. Providers had concerns that
businesses considered accessing the money a “hassle” and are keen to overturn these perceptions in
future programmes, which would be helped by reducing jargon and using business language in
communications.

Evaluation of the ESF Convergence Programme
September 2015 Page 80 ISO9001:2008 QAP 01/01 Issue 8
“They (businesses) hear about the funding but are frustrated because they do not know how to
engage with it”
One provider felt it would have been better if businesses had to make a financial contribution to the
Combined Universities Cornwall (CUC) research programme linking businesses with graduates – as
this may have prompted more input from them.
5.3.3 Obstacles to effective partnership working
The main barrier to effective partnership working has been where partners dropped out, or
experienced capacity issues, which impacted on the project capacity to deliver the targets. Not all
project managers had assessed the risk of partner failure for any reason, and contingency planning
was not a high priority at the outset. There is a risk of reliance on goodwill in some cases rather than
establishing formal delivery arrangements.
5.3.4 Maximising opportunities for a seamless participant journey
Data for achievement against targets have already shown that a much higher volume of participants
were supported, compared with the targets set. The infrastructure therefore did allow for
participants to be referred between projects and there is evidence of locally joined up provision.
However stakeholders felt that there were still opportunities for participants to have gained more
had they been referred to other projects – creating more of a linear journey with a clear progression
to the next stage. There was a wide range of delivery partners offering different aspects which some
stakeholders feel was not fully harnessed, suggesting that an incentivised referral mechanism
between projects would be better for a seamless participant journey.
5.4 Impacts – Priority 5
5.4.1 Engagement with HE
The CUC research programme forged strong links with Cornwall businesses, and appears to be
building a lasting legacy. Furthermore universities are now working more closely together – partners
have stated there was no such dynamic between universities in Cornwall before this.
The programme has also brought about stronger interaction between Higher Education and
businesses, which is helping the economic development of the region, and according to partners
could not have been achieved through any other means.

Evaluation of the ESF Convergence Programme
September 2015 Page 81 ISO9001:2008 QAP 01/01 Issue 8
“The impact for Higher Education cannot be underestimated. In Cornwall we are still behind national
targets for level 4, but ESF has helped us take a huge leap forward. There is a very noticeable impact
among young people. In previous years whole generations used to move away from Cornwall at the
age of 18 and never return. Now there are clearer pathways to access Higher Education in the region.
Jobs at universities becoming more highly paid – which has a positive economic and social impact.
Interactions between local businesses and universities is improving all the time”
5.4.2 Benefits for businesses
Employers and businesses have been enabled to access higher quality training. A broad range of
provision was available at all levels, designed to meet the needs of the sector, resulting in high levels
of participant satisfaction.
Graduate start-up companies supported through ESF have been described as “really cutting edge”.
These are expected to build a strong legacy as the companies grow.
A lot of SME businesses were supported to recruit graduates. Regional stakeholders state that the
next programme needs to think about how to take SMEs to the next level, which can be a challenge
as there are still many ‘lifestyle’ businesses in the area which can be a barrier to growth.
Case studies and success stories have demonstrated the benefits and financial returns of training for
businesses, with some examples outlined below:
Case study: Digital Peninsula Network
Cornwall has over 15,000 people employed in ICT, digital and creative roles. This accounts for
around 6% of all business in Cornwall. Between 2008 and 2011, businesses in this sector accounted
for 6% of the growth in the region with 400 new jobs created.
Aimed at businesses supporting in Cornwall through ICT and digital support and training, Digital
Peninsula Network (DPN) is the largest ICT and Digital business network in Cornwall. The
programme is partly funded by ESF and their services range from training provision, marketing
supports and networking events.
As a framework support provider, DPN focuses on preparing businesses in the sector for the rapidly
changing world of digital media technologies by providing skills training, business advice and
encouraging the creation of more ICT related jobs. Support is created through networking events,
apprenticeship opportunities, ICT scouting and a sector specific job alert system. The organisation
also organises promotional events and international development projects to help businesses raise
their profile and market themselves accordingly.
DPN also works with Business Network for Enterprising Women (B-new), which was developed from
Network Cornwall, an organisation which connects professional and business women across

Evaluation of the ESF Convergence Programme
September 2015 Page 82 ISO9001:2008 QAP 01/01 Issue 8
Cornwall. B-new is a project to create a cross border network of women entrepreneurs around the
channel areas between the UK and France. Its purpose is to help and support women who own or
want to start a business and also to develop access to qualified jobs within the channel areas.
DPN was recommended to CN when he first moved to Cornwall and found the area’s dial up internet
connection problematic for his business working on websites. He found the broadband and technical
support as well as the networking centre useful to his business and has remained with DNP as an
affiliate since then. Although his business has developed and he no longer requires the broadband
and computer equipment provided by the organisation, CN still uses other facilities provided by DNP
for meetings with clients and networking. He believes that there are more than 60 companies that
are still in business because of the support they received from DNP.
Case study: CUC Research Programme
The CUC Research Programme is funded by ESF and includes the delivery of 40 PhDs, with each
collaborative project involving at least two CUC partner institutions and a Cornwall based business.
Cognitively Enabled Built Environments: New tools for Architects is an ESF funded PhD being
undertaken at Falmouth University. Focusing on a holistic approach to sustainability, the project
explores the interaction between buildings and their inhabitants to help make buildings more
comfortable for people while considering the sustainability and energy impacts on that
environment.
This particular CUC project is partnered with a firm of architects – a partnership that both student
and employer benefits from. The company has been supported to become more competitive
through the evaluation and development of new ways of approaching design.
The student partnership with PBWC beneficial because as well as being able to work in the
environment on which his project is based, he was able to apply his theories and discuss them with
people who are experts in the field.
“The advantage of doing this project in Cornwall is that I can test out things in different
environments. It would be very easy to get struck in the university doing the project, so I think it is
important to draw on wider collaborations working with a local architects who benefit from the
project and be able to test out concepts and talk about theories – and that is very useful, the
possibility for products and new skills”
ESF funded PhD student
Evaluation of the ESF Convergence Programme
September 2015 Page 83 ISO9001:2008 QAP 01/01 Issue 8
6. Key findings – Priority 6
6.1 About Technical Assistance
Technical Assistance is enabled by the European Council regulation 1083/2006, which states:
‘At the initiative of the Member State, the Funds may finance the preparatory, management,
monitoring, evaluation, information and control activities of operational programmes together
with activities to reinforce the administrative capacity for implementing the Funds’.
Technical Assistance funding was available for a variety of purposes, including:
communications and publicity;
administrative support;
monitoring and control;
evaluations and feasibility studies;
IT solutions; and
staff costs, specifically in relation to new posts funded through the programme.
In Cornwall and the Isles of Scilly, the ESF Convergence Framework established that Technical
Assistance funding would be used for:
supporting provision of labour market intelligence;
publicity and communications strategy;
support for voluntary and community sector organisations to underpin third sector
participation in the programme;
support for cross-cutting themes; and
monitoring and evaluation.
In May 2010, a refreshed Technical Assistance strategy for 2011-2013 was developed in line with
changing priorities and the evolving external landscape. The main areas of focus were:
evaluation (considering the programme as a whole);
labour market intelligence research;
engagement with voluntary sector; and
publicity and communications.
The Convergence programme had four Technical Assistance projects explained below in Table 5.
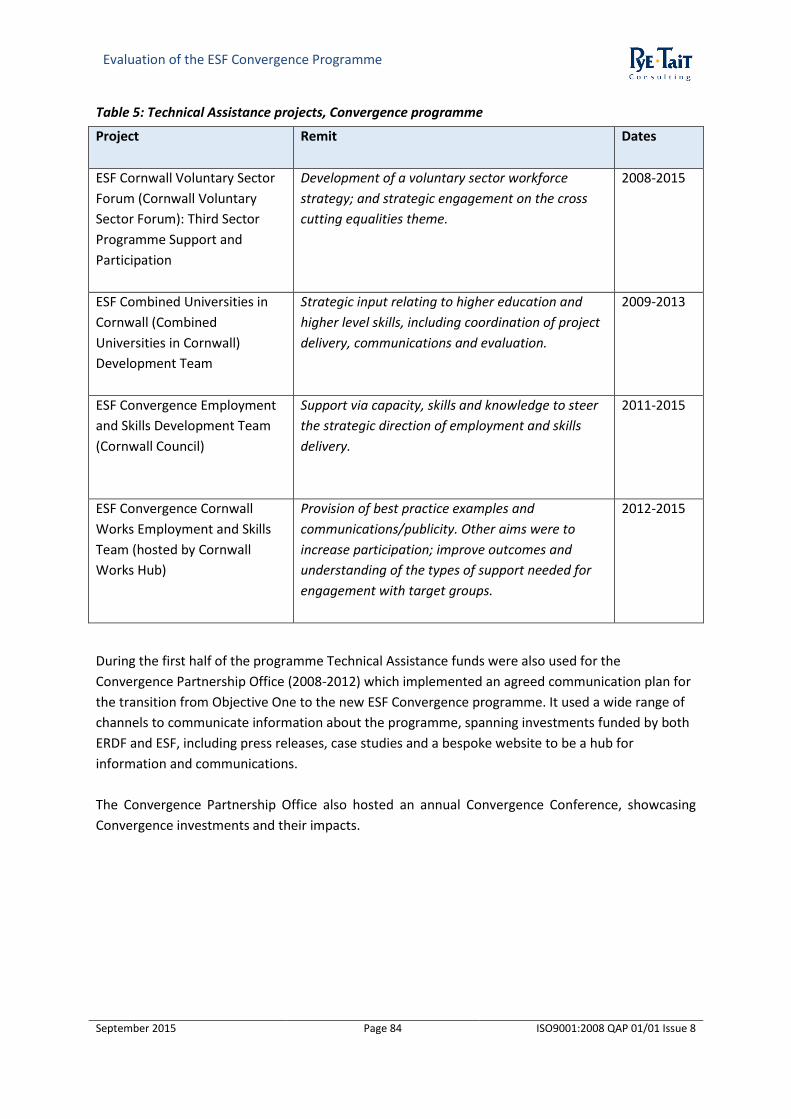
Evaluation of the ESF Convergence Programme
September 2015 Page 84 ISO9001:2008 QAP 01/01 Issue 8
Table 5: Technical Assistance projects, Convergence programme
Project Remit
Dates
ESF Cornwall Voluntary Sector
Forum (Cornwall Voluntary
Sector Forum): Third Sector
Programme Support and
Participation
Development of a voluntary sector workforce
strategy; and strategic engagement on the cross
cutting equalities theme.
2008-2015
ESF Combined Universities in
Cornwall (Combined
Universities in Cornwall)
Development Team
Strategic input relating to higher education and
higher level skills, including coordination of project
delivery, communications and evaluation.
2009-2013
ESF Convergence Employment
and Skills Development Team
(Cornwall Council)
Support via capacity, skills and knowledge to steer
the strategic direction of employment and skills
delivery.
2011-2015
ESF Convergence Cornwall
Works Employment and Skills
Team (hosted by Cornwall
Works Hub)
Provision of best practice examples and
communications/publicity. Other aims were to
increase participation; improve outcomes and
understanding of the types of support needed for
engagement with target groups.
2012-2015
During the first half of the programme Technical Assistance funds were also used for the
Convergence Partnership Office (2008-2012) which implemented an agreed communication plan for
the transition from Objective One to the new ESF Convergence programme. It used a wide range of
channels to communicate information about the programme, spanning investments funded by both
ERDF and ESF, including press releases, case studies and a bespoke website to be a hub for
information and communications.
The Convergence Partnership Office also hosted an annual Convergence Conference, showcasing
Convergence investments and their impacts.

Evaluation of the ESF Convergence Programme
September 2015 Page 85 ISO9001:2008 QAP 01/01 Issue 8
6.2 Effectiveness of use of technical assistance
6.2.1 What worked well
Technical assistance projects have been well managed, particularly in the first half of the
programme, and are generally accepted to have been fit for purpose. The consensus among
stakeholders is that the funding was used well, underpinned by a holistic approach encompassing a
range of different complementary projects.
“Partners were kept well informed. Communications were excellent and distilled useful information”
During the first half of the programme the ESF Convergence Partnership office fulfilled its role to
provide all the external marketing for ERDF and ESF very effectively, with excellent communications
and promotions. ESF national evaluations made regular use of the region’s good news stories, which
celebrated success well and helped projects to win awards.
The Convergence website hosted many good news stories and case studies. Technical Assistance
also widely promoted the success of Fifteen – the first ESF project anywhere in the country to win
one of the European RegioStars Awards.
Furthermore the establishment of the Cornwall Works WISE Awards (Figure 49) was viewed as a
positive means of recognising excellence in Cornwall and the Isles of Scilly, and also helped to spread
the message about the crucial role that ESF funding has played in employment and skills provisions.
Stakeholders commented that this was particularly useful in communicating the full extent of how
ESF can support the local area.

Evaluation of the ESF Convergence Programme
September 2015 Page 86 ISO9001:2008 QAP 01/01 Issue 8
Figure 49: Cornwall Works WISE Awards
Stakeholders perceived that the CUC co-ordination role was effective and worked very well with no
apparent gaps. There is a sense also that Technical Assistance helped to underpin better access to
ESF within the third sector, supported by the work of the Voluntary Sector Forum. The remit and
structure of the Employment and Skills Development Team provided greater opportunity to
influence strategic decisions and encouraged collaborative working between partners.
Technical Assistance funds (Cornwall Council Convergence Employment and Skills Development
Team Project) were also used to commission forward looking research into key sectors including
aerospace. Around 10 reports were produced in total, which provided detailed skills analysis, and
were distilled into factsheets placed on the LEP website. Local stakeholders that used this resource
found that it added value when planning ESF activity and designing projects to meet the needs of
local employers.
•one award for a business in welfare to work activity
•one award for a business in the workforce development agenda
•one award for personal achievement / contribution
•one award for project / group / organisation that has achieved excellence
•one award for personal achievement
•one award for project / group / organisation that achieved excellence
•one award for personal achievement
•one award for project / group / organisation that achieved excellence in delivering
Welfare to Work overcoming barriers to work or helping others to do so
Innovation
New approaches e.g. skills with a significant
impact on businesses
Employers recognising employers who
have contributed to key agendas
Skills enhancing progression and employment prospects

Evaluation of the ESF Convergence Programme
September 2015 Page 87 ISO9001:2008 QAP 01/01 Issue 8
6.2.2 Impacts
The legacy of Technical Assistance is already being felt in the new Growth programme, as the
research and LMI funded via Priority 6 is being used to inform strategic investment decisions, with a
call for skills gaps to be plugged.
Technical assistance funds were able to react to changing circumstances and were effective in raising
the profile of, and helping to build capacity, among smaller third sector organisations and social
enterprises. A small number of stakeholders raised concerns that this could be a ‘short-term fix’ if
technical assistance for capacity building is not retained in the next programme.
“Technical assistance did its job”
“Capacity building was the most successful element of Technical Assistance and should definitely be
retained”
The Cornwall Works Hub and the Cornwall Council Convergence Employment and Skills
Development Team are continuing beyond the scope of the funding to offer some level of
consistency and sustainability.
6.3 Gaps and opportunities to improve technical assistance
In relation to sharing success stories there was a slight barrier for the contracts managed by the
National Offender Management Service (NOMS), as not many participants were willing to disclose
their experiences due to their background, which made it a little more difficult to develop case
studies.
A number of stakeholders commented that the valuable research on skills needs analyses was not as
widely disseminated as it could have been, which meant that not all partners were able to benefit
from the outputs.
A mid-term review of Technical Assistance was undertaken which brought changes to the
Convergence Partnership Office and subsequently determined how ESF and ERDF communications
would be split, set within new organisations and managed during the second half of the Programme.
From 1st April 2012, Cornwall Works took over responsibility for the communications part of the
Convergence programme.
Evaluation of the ESF Convergence Programme
September 2015 Page 88 ISO9001:2008 QAP 01/01 Issue 8
On the whole respondents felt that alignment of ERDF and ESF was more effective, as it could
encompass the whole programme and become a common resource base. For example, via the
provision of shared intelligence and data sources. Post division of Technical Assistance resources for
the two programmes, a small number of stakeholders commented that more time was spent on
administration of ESF communications. However others stated that there was in fact more resource
in the form of a dedicated team for communications in respect of each of the programmes, and at
the same time the number of team members was increased.
In summary stakeholders felt there were no gaps as such within the overall provision of Technical
Assistance, but considered that it could have been more joined up.

Evaluation of the ESF Convergence Programme
September 2015 Page 89 ISO9001:2008 QAP 01/01 Issue 8
7. Conclusions and recommendations
7.1 Research conclusions
7.1.1 Performance against targets within the ESF programme in Cornwall and Isles of Scilly
The Convergence programme has substantially over achieved its targets in respect of the numbers of
participants supported overall, and for a wide range of other deliverables including the numbers
gaining qualifications at levels 2, 3, 4 and 5 and those in work upon leaving the programme.
Furthermore this substantial over achievement of outcomes was delivered in spite of the fact that
not all ESF funds had been spent, with around 23% not committed at the time of writing – though
this is subject to revision as final outputs are captured and analysed.
Programme governance was subject to upheaval and change after the Coalition Government came
to power in May 2010. The Convergence programme lost significant local strategic oversight and
input as a result of organisations, such as Government Office South West, being wound up and the
installation of a more rigid, nationally-led approach to contract management within the CFOs,
notably DWP and the SFA. The second half of the programme was thus deemed to be far less
flexible, and subject to delays in contracting which reduced the time available for delivery. These
delays were compounded by the fact that it took some time to ensure the interventions were
suitable for the target groups, particularly for Priority 4, where many participants were a long
distance from the labour market and needed significant work and help to overcome barriers to
encourage progression.
The latter part of the programme also experienced issues where prime contractors were not based
in the region, and it took some time to establish effective working relationships. This issue was
exacerbated by a new payment model which meant providers had to absorb a higher proportion of
delivery costs before they were eligible to receive a payment.
However some regional stakeholders argue that the climate of austerity was instrumental in
underpinning stronger and closer working relationships between partners, in turn ensuring that
provision was tailored to meet local needs, was joined up and avoided duplication of similar
offerings. In many instances a few key individuals in strategic roles were instrumental in overcoming
some of the barriers and smoothing the transition from the first half to the second half of the
programme.
For example in responding to provider feedback and bringing about change to the payment model
which enabled smaller organisations to be eligible for a payment in a much shorter timescale.
Furthermore the ‘top down’ approach was not embedded totally at the expense of all local input,
and some stakeholders were able to retain a certain amount of influence in the latter half of the
provision – for example when broadening eligibility criteria in some areas.
7.1.2 Critical success factors and barriers
Critical success factors underpinning the most effective delivery of the programme include:

Evaluation of the ESF Convergence Programme
September 2015 Page 90 ISO9001:2008 QAP 01/01 Issue 8
Effective programme design
At the outset the design of the programme and its constituent projects was informed by
robust Labour Market Intelligence and a collaborative approach between key regional
stakeholders and CFOs in order to create provision best suited to the needs of the region;
Partnership working
Where partners have worked closely together, sharing information in a collaborative way,
this has underpinned a more seamless participant journey, reduced competition for the
target group and enabled a wider range of complementary provision to be made available
across the region;
Engagement
Third sector organisations and social enterprises in particular have made good use of their
relationships in the community and understanding of the target group, in order to
successfully engage with participants and encourage them to remain on the programme,
even when facing multiple barriers; an expanding and successful social enterprise sector has
been noted as a positive development from the ESF era 2007 – 2013 thus becoming a
credible and valuable force for the future;
Flexibility in using the funds
A flexible approach to create bespoke provision tailored to meet the specific and local needs
of individuals and businesses has been more likely to result in long-lasting positive social and
economic effects for the region, and ensuring better value for money from the fund;
Capacity building
The use of Technical Assistance funds to build capacity in third sector organisations has been
welcomed and identified as a priority and pivotal for future programmes to ensure they can
be sustained and developed;
Dedicated projects targeting key target groups
Engagement with females and participants with disabilities has been particularly effective in
Priorities 5 and 4 respectively, largely as a result of dedicated projects designed to target
these cohorts. This approach enabled the region to exceed targets for engagement with
these groups, and also helped to address the cross-cutting theme of equality and diversity.
There was also a range of common barriers that obstructed providers from making the best use of
the funds:
Inflexibility
A more rigid structure after 2010 set targets and influenced provision type, using a
nationally-led approach, rather than one which was locally controlled. Furthermore there
was less flexibility in relation to eligibility criteria – for example the programme was not able

Evaluation of the ESF Convergence Programme
September 2015 Page 91 ISO9001:2008 QAP 01/01 Issue 8
to support people to gain a second level 2 qualification in the second half – which narrowed
the target group and meant some people could not participate;
Structural conflicts
There were structural barriers within the programme management which compromised its
capacity to build effective strategic linkages with other funding, notably ERDF. Although
there was a commitment on paper to join the programmes up, in reality projects were not
co-commissioned, State Aid rules were a barrier, and in many cases, timescales were not in
alignment and information not shared, which could have helped create synergies between
projects and make better use of the money;
Obstructions in the participant journey
The volume of referrals was affected via the Children’s School and Families pathway when
Local Authorities experienced restructuring and change following the Coalition
Government’s spending cuts. This had a knock on effect on the participant journey, although
in response Jobcentre Plus Work Coaches were tasked with increasing their numbers of
referrals. Further ripple effects such as delays in contracting as Co-Financing Organisations
were compelled to be reactive rather than proactive, and the impact of the prime contractor
and revised payment model also created blockages in the participant journey, which was a
factor in disengagement. There was competition between providers for the same cohort
group, as similar output and outcome targets had been set;
Less ‘joined up’ strategically after 2010
There was also less joined up strategic leadership from a ‘top down’ perspective following
the closure of Government Office South West and the South West Regional Development
Agency. The Local Management Committee (LMC) was maintained but arguably had a less
strategic or influential role as the programme was more nationally than locally driven;
Cross-cutting themes not always explicitly addressed in skills contracts
Providers have acknowledged that cross-cutting themes were not always high on the
agenda. Where explicitly addressed, notably by directly aiming provision at particular
cohorts, the region performed exceptionally well, exceeding targets. In other cases the
cross-cutting themes appeared to be less important, which presents a longer-term risk as
the EU is able to claw monies back if there is insufficient evidence demonstrating how these
were incorporated into programme delivery. The target for supporting participants aged
over 50 was not met and yet this is an important consideration against the context of an
ageing population.
Evaluation of the ESF Convergence Programme
September 2015 Page 92 ISO9001:2008 QAP 01/01 Issue 8
7.1.3 Impacts
There have been positive social and economic impacts for the region since the start of the
programme in 2007, through to 2014/15, notably52:
An 11% increase in the number of females employed between 2007 and 2014;
An increase of 14% in the total number of people employed between 2007 and 2014;
An increase of 25% of the number of people employed aged 50-64 between 2007 and 2014;
An increase of 25% in the number of new business start-ups between 2011 and 2013;
A decrease in the number of people with no qualifications from 10% to 6% between 2007
and 2014;
A decrease in the number of NEETs, from 5.1% to 4.2% in Cornwall between 2012 and 2014.
Other impacts can be attributed directly to the programme, for example strong linkages between
the Higher Education (HE) community and local businesses, with closer collaborative relationships
that are expected to be maintained after the funding ends. Aspirations to access HE have been
raised, and furthermore there has been development of, and greater aspiration for, higher level
skills in the region at levels 4 and 5. This has contributed to capacity building within businesses and
in the creation of more highly paid job roles.
Capacity building within the third sector notably among social enterprises, has been positive,
although there is less evidence to demonstrate that the effects will be sustained beyond the life of
the programme.
A number of start-up businesses considered to be ‘cutting edge’ have been established as a direct
result of the programme, and are expected to have a sustainable economic benefit by creating jobs
and improving Gross Value Added (GVA) in the region.
Furthermore there are many case studies demonstrating positive impacts at an individual level,
which are expected to translate into longer-lasting social and economic benefits, as the influence of
the programme supports people to improve their skills and qualifications and progress into
employment or further learning.
7.1.4 Value for money and assessment of the counterfactual
Nearly all providers and stakeholders interviewed agree without ESF, the impacts that can be
directly attributed to the programme, would not have been achieved. There is a strong consensus
that funding could not have been provided through any other means that would have offered the
same type and volume of provision.
The changes in the second half of the programme meant projects were not delivered as efficiently or
as cost effectively as they could have been, and there was less time left for actual delivery due to
52
It should be noted that not all these impacts can be directly attributed to the impact of ESF alone, as other factors outside the scope of this study will also have played a part.
Evaluation of the ESF Convergence Programme
September 2015 Page 93 ISO9001:2008 QAP 01/01 Issue 8
various delays. Where funding was not been fully maximised to best effect, this was predominantly
due to factors outside the control of the local management teams.
It is clear that the money has made a difference to the region, and has produced worthwhile outputs
and outcomes – socially and economically. The majority of targets have been overachieved, using
only around 75% of the ESF allocation. This suggests that value for money has been achieved,
although lessons can be learned for future programmes to maximise the funds to full effect.
7.1.5 Lessons learned to inform future programmes
Due to the devolution deal, more strategic decision making powers are expected to revert back into
local control. This is a vital time to build upon the momentum and achievements of the 2007-2013
programme, and take it forward to the next level. This requires more targeted and bespoke
provision using ESF, and must be steered by, and underpinned with robust, clear, collaborative and
transparent strategic leadership.
7.2 Recommendations
Based on the research conclusions, the following actions are recommended to inform the design and
delivery of future ESF programmes:
1) Consider which individuals and organisations are best placed to take stronger strategic
ownership of the programme, particularly in light of the devolution deal. This is likely to be
the ITI Board, but its current composition and remit is not well understood and lacks
transparency. Clear protocols and operating processes need to be developed for the ITI
Board, including allocation of responsibilities, and actions to ensure that it operates in an
objective manner avoiding conflicts of interest.
2) Seek to build upon the momentum of the current programme and its impacts, by designing
provision that will help participants move forward to the next stage of their journey, and
enable businesses, particularly SMEs, to move on to the next level of their growth and
development. This is likely to bring about stronger economic impacts for the region.
Maintain the approach of integrating cross-cutting themes through the design of bespoke
provision aimed at key groups such as females. Key economic sectors aligned with the
Cornwall LEP strategy should be targeted.
3) Aim to address gaps in the participant journey through more partnership working and
actions to address delays in contracting:
a. Undertake participant journey mapping to identify potential routes, tap into existing
resources in the region using all funding sources, not just ESF, in order to understand
how to maximise available monies; and
b. Establish clearer referral routes and a more seamless participant journey through
better sharing of information. The latter should include mechanisms for data sharing

Evaluation of the ESF Convergence Programme
September 2015 Page 94 ISO9001:2008 QAP 01/01 Issue 8
between providers about prior learning and achievements at individual level to
avoid duplication of provision – it may be possible to use the NEET database
developed and utilised for the current 180 project53 as a model for this.
4) Consider how there could be better alignment of ESF and ERDF in future programmes, for
example through co-commissioning however this needs to be carefully managed so that one
project is not affected if its counterpart does not take place for any reason. Identify where
complementary targets could be set, for example, numbers of jobs and apprenticeships
created alongside qualifications, training and skills gained that would be directly relevant for
these.
5) Maximise technical assistance funds by disseminating outputs such as skills research, more
widely, and by retention of the capacity building elements for the third sector.
6) Undertake a mid-cycle evaluation for the next programme to identify areas of best practice
and lessons learned that can be used to manage the second half of the programme most
effectively. Alternatively a rolling formative evaluation from day one with half-yearly or
quarterly reports could be an even more effective means of monitoring progress and
embedding improvements.
7) Consider undertaking a survey of participants in 2016 in order to understand the extent to
which social and economic impacts gained through the programme have been sustained.
8) Measure success. Making comparisons with other regions is challenging given the prevailing
situation and characteristics of Cornwall. However a first objective for the IB and next
programme ought to be clear understanding of what success looks like. Rather than a focus
on the ESF funds and details of the projects, we recommend that it should measure against
how much Cornwall has progressed in its vital macro objectives of a workforce profile with
higher skills and higher wage levels.
9) Carry out national research to identify which targets and measures have the greatest
potential and actual impact. There have been a number used over the life of the ESF
programme (for example, accredited learning, GLHs, programme starts and employments).
These shifts in focus have the potential to damage the opportunities and strengths of such a
programme and we recommend that there is consistency but breadth to allow for future,
local flexibility.
53
180 Turning Lives around is an ESF Convergence funded alternative education project run by Cornwall Learning Partnership and supports young people aged 14–19 who are either NEET or at risk of disengaging from education

Evaluation of the ESF Convergence Programme
September 2015 Page 95 ISO9001:2008 QAP 01/01 Issue 8
Appendix 1: Research methodology
This research has combined desk-based evaluation of a wide range of secondary data sources, with
in-depth interviews with nearly 50 individuals and organisations involved in the strategic
management and operational delivery of the ESF Convergence programme.
Desk-based research was conducted in two concurrent phases:
Phase 1: Strategic review of programme context
This spanned a literature and data review of a wide range of sources to identify the baseline position
upon programme inception (2007/08) and how this has changed as the programme has been
delivered.
Phase 2: Operational review of programme delivery
This required a comprehensive assessment of programme objectives, targets and how these may
have changed over the lifetime of the programme. Sources included:
South West and Cornwall/Isles of Scilly Co-Financing Plans and supplementary Co-Financing
Plans;
Operational Programme documentation;
Regional ESF Frameworks – original and revised;
Programme targets and objectives;
Regional strategy and economy research documentation e.g. Regional Economic Strategy for
South-West England 2006-2015, Economic development strategy for Cornwall & the Isles of
Scilly; and the Regional Skills Strategy;
List of ESF projects, providers and sub-contracted providers/partners;
Case studies available from sources such as Convergence Cornwall, ESF Works and ESF at
Work publications;
Evaluation activity commissioned and published by ESFD;
Project evaluation reports;
MI and programme monitoring/project delivery data;
ESF data from in other regions of the UK (for comparison/benchmarking).
It should be noted that the purpose of this evaluation was to assess the programme as a whole, and
that individual evaluations have already been written, or are in the process of being developed, for
each constituent project. We have therefore not attempted to provide detailed summaries at
project level (although we refer to examples in the main body of this report) as this would have been
duplication.
Desk work was supplemented with in-depth interviews with lead partners spanning the projects in
scope of the evaluation (see Appendix 2 for details) and a sample of sub-contracted delivery
partners and regional stakeholders. Evidence was triangulated from all sources and analysed in
detail along with data sources summarising the programme’s performance as at 2nd August 2015,
and latest spend data as at 1st September 2015, to produce this final report.

Evaluation of the ESF Convergence Programme
September 2015 Page 96 ISO9001:2008 QAP 01/01 Issue 8
Appendix 2: projects in scope of this evaluation
Lead provider Project Priority ESF funding Match funding
Total value Start date End date
Paragon Concord International Families Provision 4 £13,042,647 0 £13,042,647 12/12/2011 30/06/2015
Working Links Cornwall Works Plus 4 £11,220,764 0 £11,220,764 14/07/2008 13/07/2011
Cornwall Council Cornwall Works for Social Enterprise
4 £4,877,250 0 £4,877,250 23/06/2008 22/12/2011
Cornwall Council Cornwall Works for Learning Disabilities
4 £1,574,441 0 £1,574,441 23/06/2008 22/06/2011
Cornwall College Graduate Placement Phase 2 5 £3,999,984 £1,333,328 £5,333,312 01/01/2011 31/08/2015
Cornwall College Enterprise Programme 5 £5,000,000 £1,666,666 £6,666,666 01/01/2011 31/08/2015
University of Exeter CUC Research Programme Phase 2 5 £5,369,831 £1,790,406 £7,160,237 01/01/2011 31/08/2015
Cornwall College DEEP 5 £849,833 £283,278 £1,133,111 01/10/2008 29/02/2012
Cornwall College Graduate Placement 5 £4,533,010 £1,511,163 £6,044,173 01/04/2008 29/02/2012
Cornwall College Widening Participation in HE 5 £143,629 £47,877 £191,506 01/10/2008 31/12/2011
University of Exeter University of Exeter 5 £3,865,120 £1,290,582 £5,155,702 15/09/2008 31/11/2013
University of Plymouth Raising Aspirations Programme 5 £749,416 £249,806 £999,222 01/01/2011 31/12/2014
Truro & Penwith College HE for Business 5 £1,185,167 £407,150 £1,592,317 01/09/2008 29/02/2012
Cornwall Development Company 2011-13 Community Grant CDC 4 £698,488 0 £698,488 01/06/2011 31/12/2013
The Learning Partnership for C&IoS NEET Reduction/Prevention Programme
4 £6,571,724 0 £6,571,724 01/04/2011 31/12/2013
The Learning Partnership for C&IoS ESF NEET 4 £1,981,030 0 £1,981,030 04/09/2013 31/07/2015
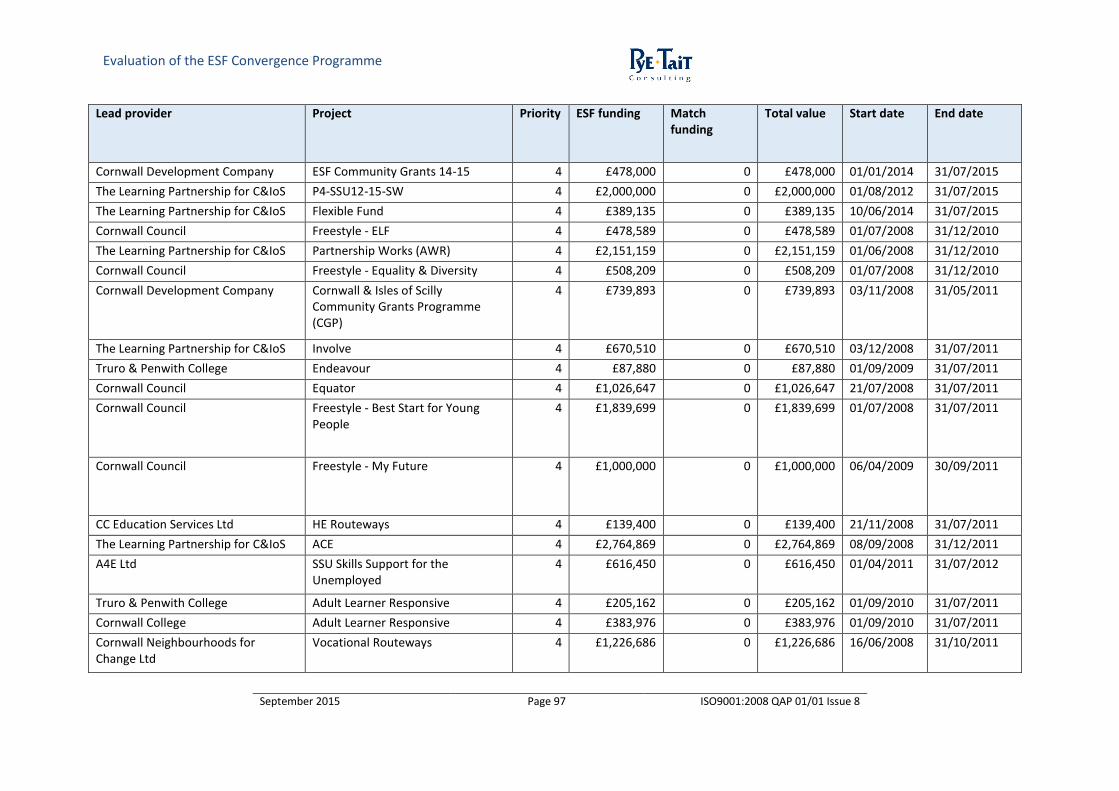
Evaluation of the ESF Convergence Programme
September 2015 Page 97 ISO9001:2008 QAP 01/01 Issue 8
Lead provider Project Priority ESF funding Match funding
Total value Start date End date
Cornwall Development Company ESF Community Grants 14-15 4 £478,000 0 £478,000 01/01/2014 31/07/2015
The Learning Partnership for C&IoS P4-SSU12-15-SW 4 £2,000,000 0 £2,000,000 01/08/2012 31/07/2015
The Learning Partnership for C&IoS Flexible Fund 4 £389,135 0 £389,135 10/06/2014 31/07/2015
Cornwall Council Freestyle - ELF 4 £478,589 0 £478,589 01/07/2008 31/12/2010
The Learning Partnership for C&IoS Partnership Works (AWR) 4 £2,151,159 0 £2,151,159 01/06/2008 31/12/2010
Cornwall Council Freestyle - Equality & Diversity 4 £508,209 0 £508,209 01/07/2008 31/12/2010
Cornwall Development Company Cornwall & Isles of Scilly Community Grants Programme (CGP)
4 £739,893 0 £739,893 03/11/2008 31/05/2011
The Learning Partnership for C&IoS Involve 4 £670,510 0 £670,510 03/12/2008 31/07/2011
Truro & Penwith College Endeavour 4 £87,880 0 £87,880 01/09/2009 31/07/2011
Cornwall Council Equator 4 £1,026,647 0 £1,026,647 21/07/2008 31/07/2011
Cornwall Council Freestyle - Best Start for Young People
4 £1,839,699 0 £1,839,699 01/07/2008 31/07/2011
Cornwall Council Freestyle - My Future 4 £1,000,000 0 £1,000,000 06/04/2009 30/09/2011
CC Education Services Ltd HE Routeways 4 £139,400 0 £139,400 21/11/2008 31/07/2011
The Learning Partnership for C&IoS ACE 4 £2,764,869 0 £2,764,869 08/09/2008 31/12/2011
A4E Ltd SSU Skills Support for the Unemployed
4 £616,450 0 £616,450 01/04/2011 31/07/2012
Truro & Penwith College Adult Learner Responsive 4 £205,162 0 £205,162 01/09/2010 31/07/2011
Cornwall College Adult Learner Responsive 4 £383,976 0 £383,976 01/09/2010 31/07/2011
Cornwall Neighbourhoods for Change Ltd
Vocational Routeways 4 £1,226,686 0 £1,226,686 16/06/2008 31/10/2011

Evaluation of the ESF Convergence Programme
September 2015 Page 98 ISO9001:2008 QAP 01/01 Issue 8
Lead provider Project Priority ESF funding Match funding
Total value Start date End date
The Learning Partnership for C&IoS P5-AGE 12-15-SW 5 £559,500 0 £559,500 01/08/2012 31/07/2015
Cornwall College SSW-LEP-Lot 1A C & IoS LEP 5 £11,290,000 0 £11,290,000 01/06/2013 31/07/2015
The Learning Partnership for C&IoS P5-SSR12-15-SW 5 £4,634,200 0 £4,634,200 01/08/2012 31/07/2015
Cornwall College SSW-LRF-1B-Cornwall & the Isles of Scilly
5 £2,542,000 0 £2,542,000 01/06/2013 31/07/2015
Cornwall College P5-WPLSME12-15SW 5 £4,275,000 0 £4,275,000 01/04/2012 31/07/2015
Cornwall College P5-WPLLE12-15SW 5 £827,205 0 £827,205 01/04/2012 31/07/2015
South West Regional Assessment Centre
SWRAC Train to Gain ESF Support 5 £124,910 0 £124,910 01/09/2010 31/05/2011
Truro & Penwith College Empowering Smart Women 5 £538,344 0 £538,344 10/09/2009 31/07/2011
The Learning Partnership for C&IoS Capacity Building Works 5 £2,418,824 0 £2,418,824 14/07/2008 31/07/2011
Working Links Rapid Response to Redundancy 5 £617,230 0 £617,230 20/04/2009 30/09/2011
The Learning Partnership for C&IoS Key Sectors 5 £8,572,444 0 £8,572,444 01/06/2008 31/07/2011
Cornwall Council Embark 5 £493,443 0 £493,443 14/09/2008 31/07/2011
Cornwall Council Workforce Cornwall 5 £956,399 0 £956,399 24/11/2008 31/12/2011
Truro & Penwith College Response to Redundancy 5 £512,600 0 £512,600 20/04/2009 11/11/2011
Cornwall Council Design and Innovation 5 £571,300 0 £571,300 14/12/2009 30/09/2011
CC Education Services Ltd Response to Redundancy 5 £768,010 0 £768,010 20/04/2009 11/11/2011
CC Education Services Ltd Rural Land-Based (Business Forward)
5 £1,289,995 0 £1,289,995 24/11/2008 31/08/2011
CC Education Services Ltd Workforce Led Programme 5 £3,844,351 0 £3,844,351 18/08/2008 31/07/2011
Trades Union Congress CRUNCH 5 £708,060 0 £708,060 30/06/2009 31/12/2011
The Learning Partnership for C&IoS Cornwall Clusters 5 £3,970,339 0 £3,970,339 10/12/2008 31/12/2011
Careers South West Ltd Convergence Apprenticeship Programme
5 £999,321 0 £999,321 01/05/2010 31/03/2012

Evaluation of the ESF Convergence Programme
September 2015 Page 99 ISO9001:2008 QAP 01/01 Issue 8
Lead provider Project Priority ESF funding Match funding
Total value Start date End date
CC Education Services Ltd Strengthening the Environment Sector
5 £655,985 0 £655,985 16/11/2009 30/06/2012
A4E Ltd A4E Convergence ASE Apps Support Employers
5 £156,750 0 £156,750 01/04/2011 31/07/2012
A4E Ltd Skills Support for Redundancy 5 £31,450 0 £31,450 01/04/2011 31/07/2012
Skills To Group Ltd ESF Workplace Learning 5 £135,255 0 £135,255 01/09/2010 31/07/2012
CC Education Services Ltd ESF Workplace Learning 5 £499,999 0 £499,999 01/09/2010 31/07/2012
CC Education Services Ltd Public Sector Leadership & Management
5 £1,999,800 0 £1,999,800 01/10/2010 31/08/2012
Cornwall Council Families Learning and Growing (FLAG)
5 £566,150 0 £566,150 20/10/2008 31/03/2012
Council of the Isles of Scilly Progressive Isles 5 £569,641 0 £569,641 01/06/2008 31/12/2011
The Learning Partnership for C&IoS Skills for Work 5 £4,551,317 0 £4,551,317 01/06/2008 31/03/2012
CC Education Services Ltd HE Interventions 5 £3,461,335 0 £3,461,335 21/11/2008 31/10/2012
CUC Civil Society Programme Support & Participation
6 £197,990 £71,354 £269,344 01/04/2012 31/01/2015
Cornwall Council Employment and Skills Development Team
6 £974,250 £324,750 £1,299,000 01/01/2011 31/03/2015
Cornwall Council Cornwall Works Employment and Skills
6 £778,248 £277,652 £1,055,900 01/10/2010 30/06/2015

Evaluation of the ESF Convergence Programme
September 2015 Page 100 ISO9001:2008 QAP 01/01 Issue 8
Lead provider Project Priority ESF funding Match funding
Total value Start date End date
Cornwall Council Convergence Partnership Office for C & IoS
6 £319,955 £106,624 £426,579 01/04/2008 31/03/2012
University College Falmouth for CUC Phase 3 CUC Central Team ESF Activity
6 £85,599 £28,533 £114,132 01/03/2009 29/02/2012
Cornwall Voluntary Sector Forum Third Sector Programme Support & Participation
6 £340,610 £90,205 £430,815 01/10/2008 29/02/2012
CUC Extra Phase 3 Central Team ESF Activity
6 £208,967 £69,657 £278,624 01/01/2012 31/12/2013

Evaluation of the ESF Convergence Programme
September 2015 Page 101 ISO9001:2008 QAP 01/01 Issue 8
September 2015
Related Documents