Evaluation of the Community Multiscale Air Quality (CMAQ) Model Version 5.1 K. Wyat Appel, Sergey Napelenok, Christian Hogrefe, Kristen M. Foley, George Pouliot, Shawn J. Roselle, Jonathan E. Pleim and the CMAQ development team U.S. EPA, National Exposure Research Laboratory, Atmospheric Modeling and Analysis Division, RTP, NC 1 CMAS Annual Conference – October 7, Chapel Hill, NC

Evaluation of the Community Multiscale Air Quality (CMAQ) Model Version 5.1 K. Wyat Appel, Sergey Napelenok, Christian Hogrefe, Kristen M. Foley, George.
Dec 14, 2015
Welcome message from author
This document is posted to help you gain knowledge. Please leave a comment to let me know what you think about it! Share it to your friends and learn new things together.
Transcript
1
Evaluation of the Community Multiscale Air Quality (CMAQ) Model Version 5.1
K. Wyat Appel, Sergey Napelenok, Christian Hogrefe, Kristen M. Foley, George Pouliot, Shawn J. Roselle, Jonathan E. Pleim and the CMAQ
development team
U.S. EPA, National Exposure Research Laboratory, Atmospheric Modeling and Analysis Division, RTP, NC
CMAS Annual Conference – October 7, Chapel Hill, NC

2
CMAQ Simulations DetailsModel Version CMAQ v5.0.2 CMAQ v5.1
Domain CONUS 12km CONUS 12km
Meteorological Model WRF v3.4 WRF v3.7
MCIP Version MCIPv4.1.3 MCIPv4.2 (w/ other updates)
Emissions 2011 NEI v1 (Inline) 2011 NEI v2 (inline)
BELD Version BELD Version 3 BELD Version 4
Lightning NO Emissions Yes Yes
OMI Data Yes Yes
Photolysis Inline Inline (updated)
AERO Version AERO6 AERO6
Chemical Mechanism CB05CLTU CB05e51
Boundary Conditions GEOS-Chem GEOS-Chem
Multi-pollutant Version No No
Gravitational Settling No Yes
Wind-blown Dust Yes Updated
Halogen Chemistry No Yes
3
Major Updates Affecting Ozone
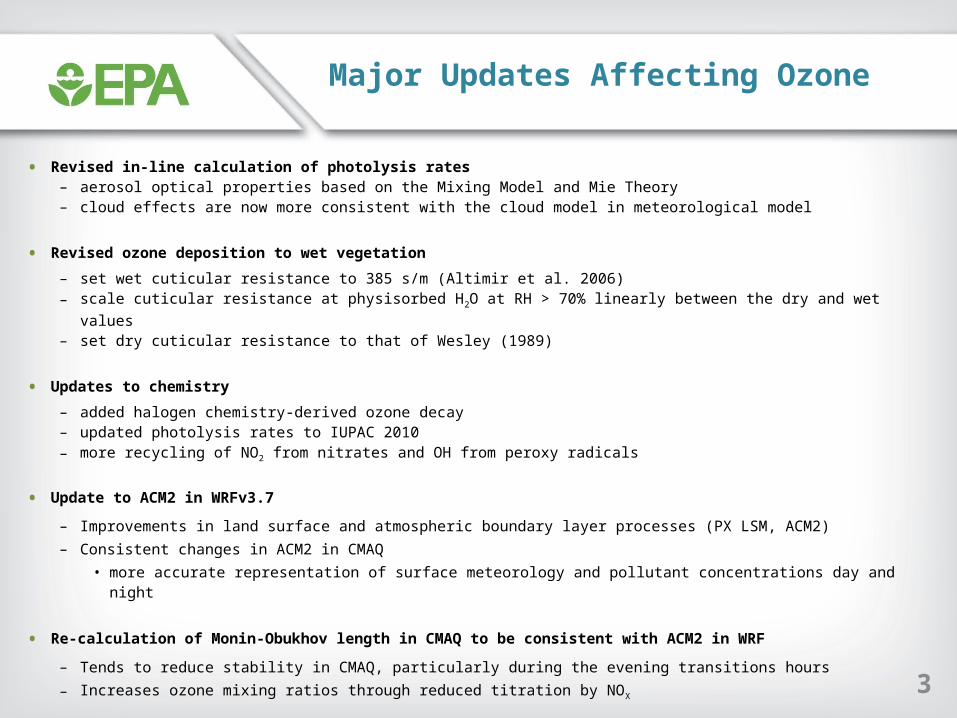
• Revised in-line calculation of photolysis rates– aerosol optical properties based on the Mixing Model and Mie Theory– cloud effects are now more consistent with the cloud model in meteorological model
• Revised ozone deposition to wet vegetation
– set wet cuticular resistance to 385 s/m (Altimir et al. 2006) – scale cuticular resistance at physisorbed H2O at RH > 70% linearly between the dry and wet
values – set dry cuticular resistance to that of Wesley (1989)
• Updates to chemistry
– added halogen chemistry-derived ozone decay– updated photolysis rates to IUPAC 2010– more recycling of NO2 from nitrates and OH from peroxy radicals
• Update to ACM2 in WRFv3.7
– Improvements in land surface and atmospheric boundary layer processes (PX LSM, ACM2)– Consistent changes in ACM2 in CMAQ
• more accurate representation of surface meteorology and pollutant concentrations day and night
• Re-calculation of Monin-Obukhov length in CMAQ to be consistent with ACM2 in WRF
– Tends to reduce stability in CMAQ, particularly during the evening transitions hours– Increases ozone mixing ratios through reduced titration by NOX
4
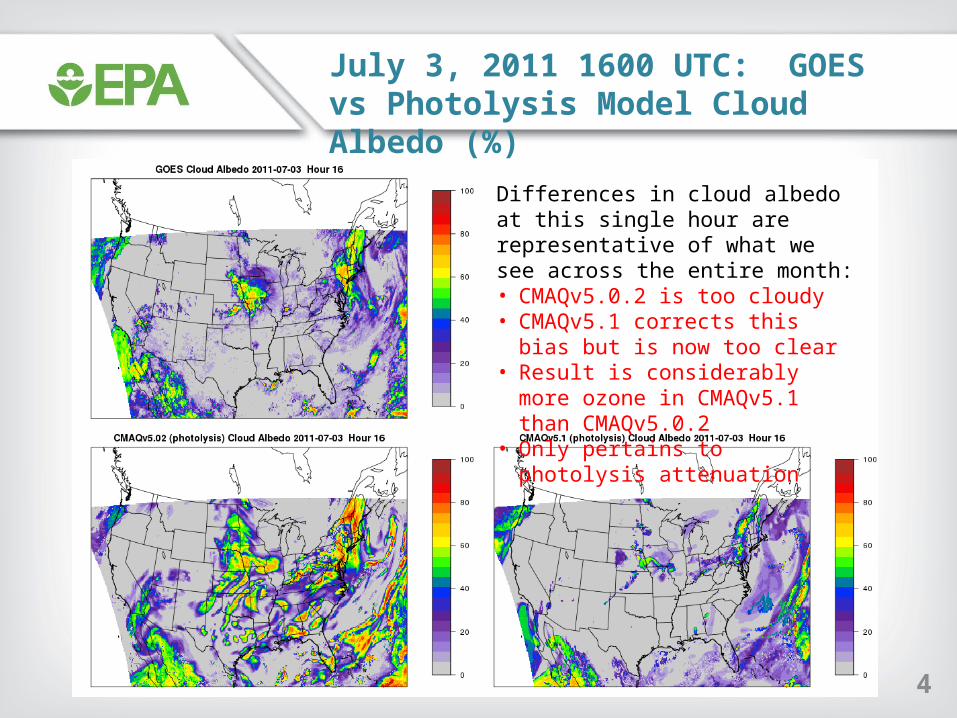
July 3, 2011 1600 UTC: GOES vs Photolysis Model Cloud Albedo (%)
Differences in cloud albedo at this single hour are representative of what we see across the entire month:• CMAQv5.0.2 is too cloudy• CMAQv5.1 corrects this bias but is now
too clear• Result is considerably more ozone in
CMAQv5.1 than CMAQv5.0.2• Only pertains to photolysis attenuation
5
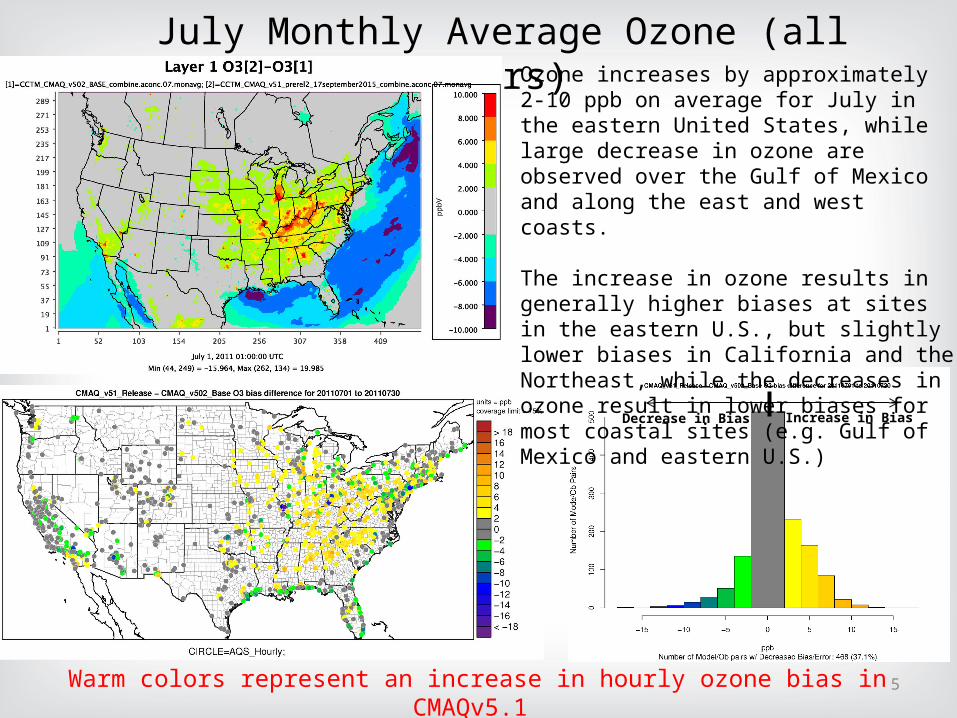
July Monthly Average Ozone (all hours)
Warm colors represent an increase in hourly ozone bias in CMAQv5.1 Cool colors represent a decrease in hourly ozone bias in CMAQv5.1
Ozone increases by approximately 2-10 ppb on average for July in the eastern United States, while large decrease in ozone are observed over the Gulf of Mexico and along the east and west coasts.
The increase in ozone results in generally higher biases at sites in the eastern U.S., but slightly lower biases in California and the Northeast, while the decreases in ozone result in lower biases for most coastal sites (e.g. Gulf of Mexico and eastern U.S.)
Increase in BiasDecrease in Bias
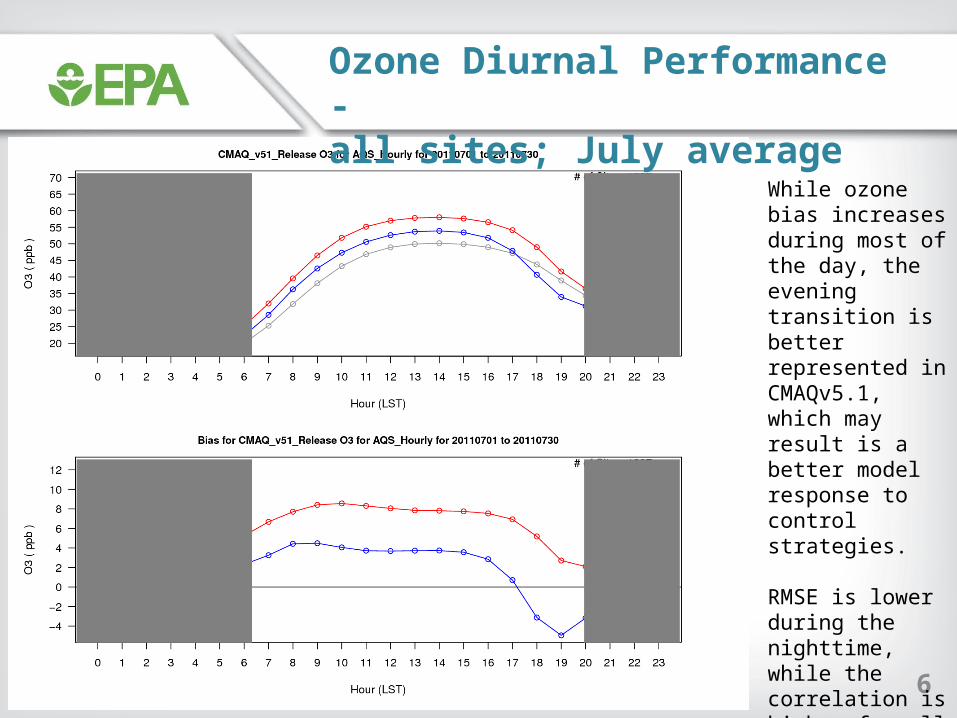
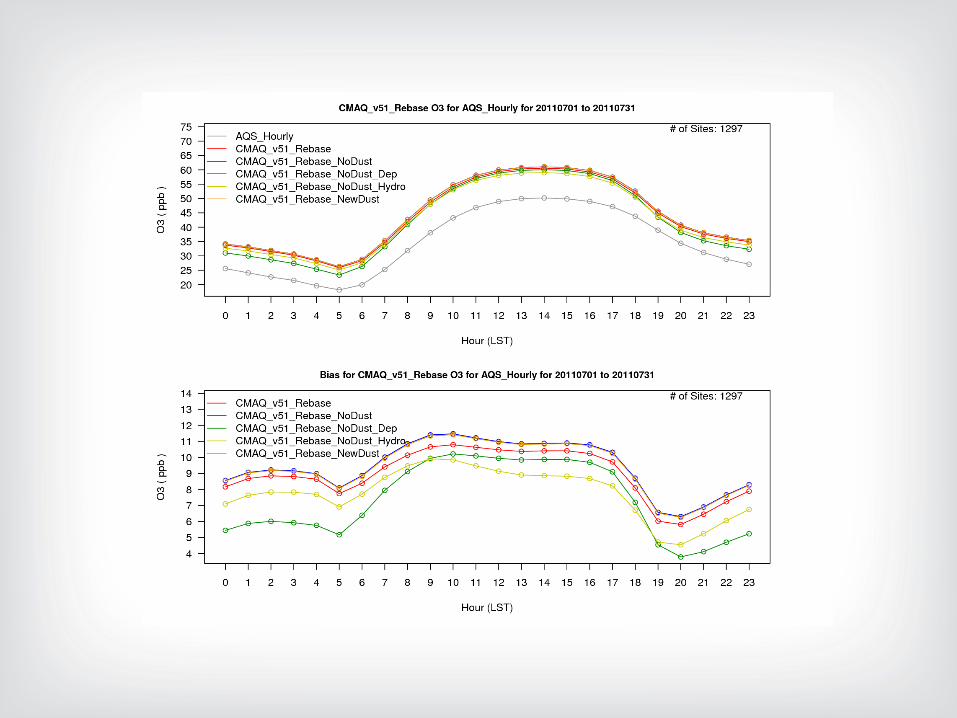
Ozone Diurnal Performance -all sites; July average
6
While ozone bias increases during most of the day, the evening transition is better represented in CMAQv5.1, which may result is a better model response to control strategies.
RMSE is lower during the nighttime, while the correlation is higher for all hours in CMAQv5.1 vs. v5.0.2, which should improve the model’s usefulness in health study applications.

July 2011 Monthly Average MDA8 Ozone Bias Change from CMAQv5.0.2 to CMAQv5.1
7
Warm colors represent an increase in MDA8 ozone bias in CMAQv5.1 Cool colors represent a decrease in MDA8 ozone bias in CMAQv5.1
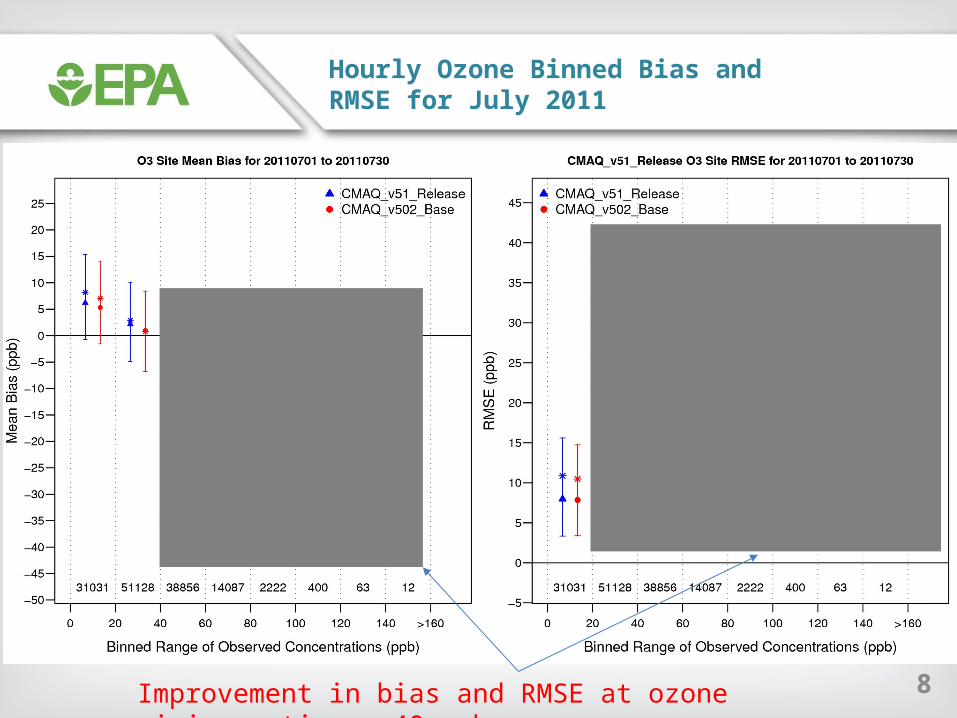
Hourly Ozone Binned Bias and RMSE for July 2011
8Improvement in bias and RMSE at ozone mixing ratios > 40 ppb.

MDA8 Ozone Binned Bias and RMSE for July 2011
9Improvement in MDA8 bias and RMSE at moderate to high (>70 ppb) ozone mixing ratios.

10
NOX Diurnal Performance -all sites; July average
Large improvement in the NOX mixing ratios biases during the morning and evening transitions, with a slight under-prediction in NOX mixing ratios during the middle of the day.
11
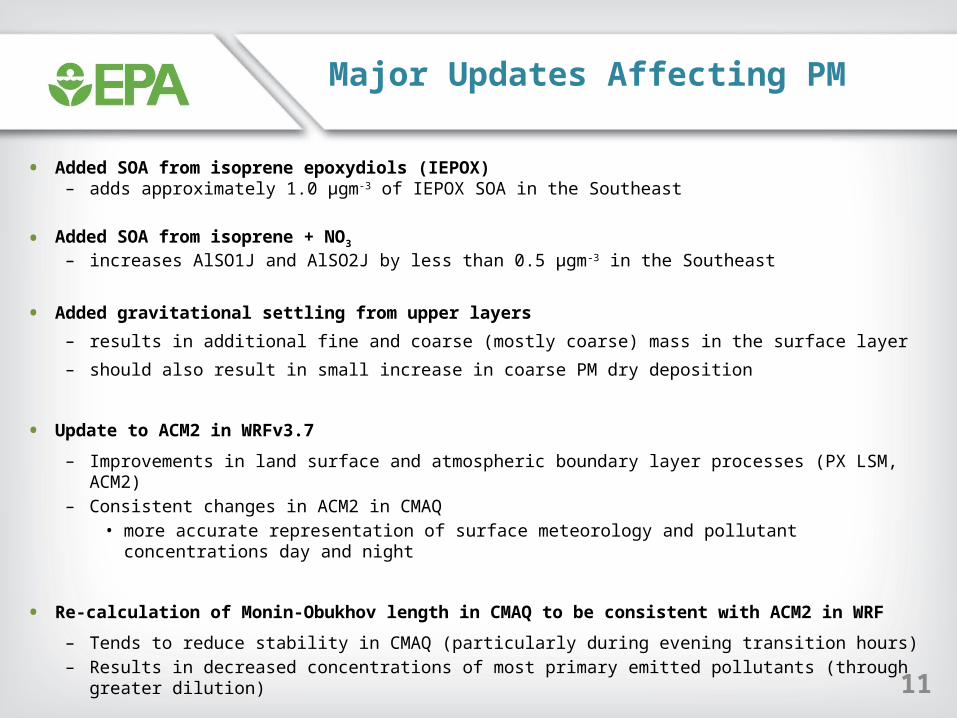
Major Updates Affecting PM
• Added SOA from isoprene epoxydiols (IEPOX)– adds approximately 1.0 µgm-3 of IEPOX SOA in the Southeast
• Added SOA from isoprene + NO3
– increases AlSO1J and AlSO2J by less than 0.5 µgm-3 in the Southeast
• Added gravitational settling from upper layers
– results in additional fine and coarse (mostly coarse) mass in the surface layer
– should also result in small increase in coarse PM dry deposition
• Update to ACM2 in WRFv3.7
– Improvements in land surface and atmospheric boundary layer processes (PX LSM, ACM2)– Consistent changes in ACM2 in CMAQ
• more accurate representation of surface meteorology and pollutant concentrations day and night
• Re-calculation of Monin-Obukhov length in CMAQ to be consistent with ACM2 in WRF
– Tends to reduce stability in CMAQ (particularly during evening transition hours)– Results in decreased concentrations of most primary emitted pollutants (through greater
dilution)

12
July Monthly Average PM2.5 (all hours)PM2.5 increases by approximately 0.5-3 µgm-3 on average for July, predominantly in the eastern United States. The increase in PM2.5 in CMAQv5.1 is primarily due to increased SO4
2- (from greater OH- concentrations) and additional secondary organic aerosol (SOA) from IEPOX, and changes affecting WRF (ACM2 and MOL).
As a result, PM2.5 biases decrease at most sites (since PM2.5 is predominately underestimated during the summer)
Warm colors represent an increase in PM2.5 bias in CMAQv5.1 Cool colors represent a decrease in PM2.5 bias in CMAQv5.1
Increase in BiasDecrease in Bias

13PM2.5 increases in CMAQv5.1 primarily due to increases in SO42-, OC, Soil and NCOM
CMAQv5.1 CMAQv5.0.2IMPROVE

14PM2.5 increases in CMAQv5.1 primarily due to increases in SO42-, OC and NCOM
CMAQv5.1 CMAQv5.0.2CSN

PM2.5 Diurnal Performance -all sites; July average
15
PM2.5 concentrations are higher in v5.1 than v5.0.2 throughout most of the day, which results in improved bias as PM2.5 is largely underestimated by the model in July 2011.
RMSE and correlation are also improved for v5.1 over v5.0.2, with lower RMSE values during the daytime and greater correlation for the entire day.
16
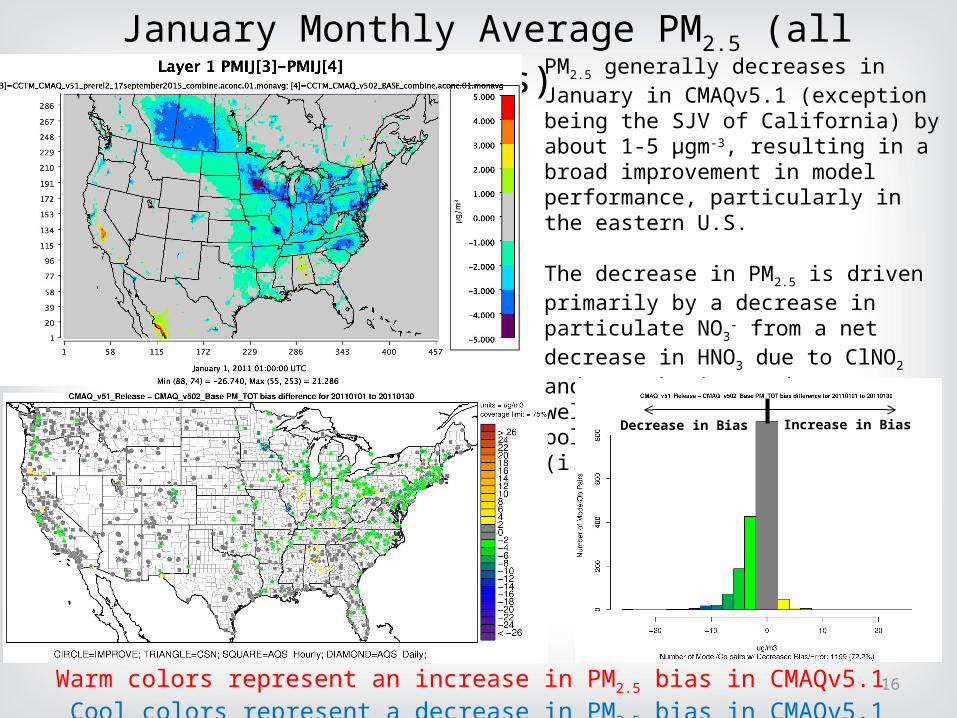
January Monthly Average PM2.5 (all hours)PM2.5 generally decreases in January in CMAQv5.1 (exception being the SJV of California) by about 1-5 µgm-3, resulting in a broad improvement in model performance, particularly in the eastern U.S.
The decrease in PM2.5 is driven primarily by a decrease in particulate NO3
- from a net decrease in HNO3 due to ClNO2 and NTR chemistry changes, as well as decreases in primary PM pollutants from changes in WRF (i.e. ACM2 updates).
Warm colors represent an increase in PM2.5 bias in CMAQv5.1 Cool colors represent a decrease in PM2.5 bias in CMAQv5.1
Increase in BiasDecrease in Bias
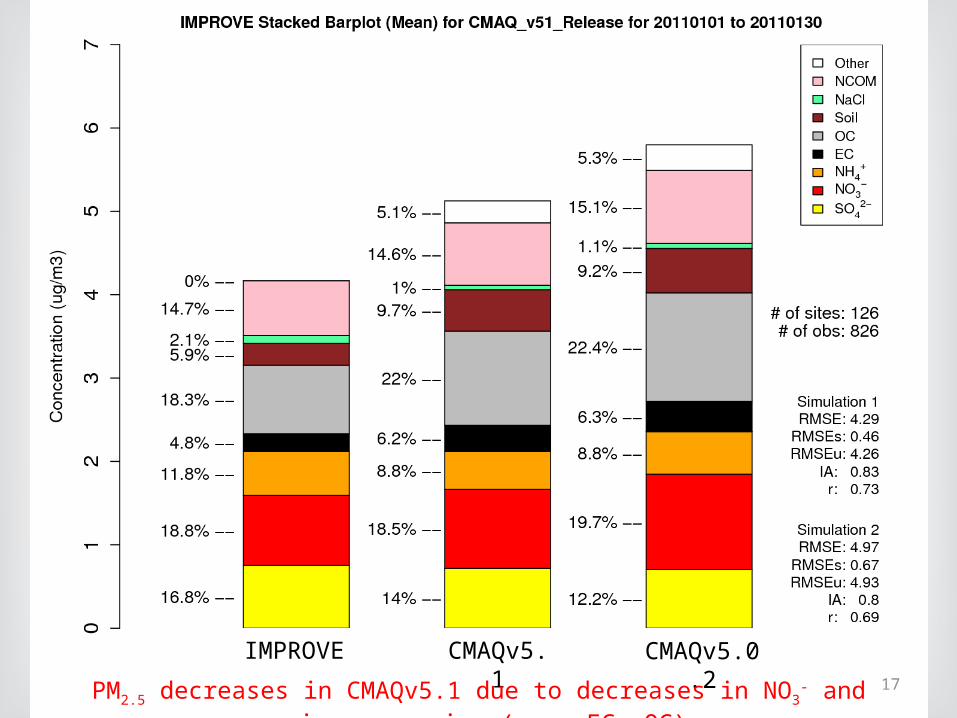
17
CMAQv5.1 CMAQv5.0.2IMPROVE
PM2.5 decreases in CMAQv5.1 due to decreases in NO3- and primary species (e.g. EC, OC)
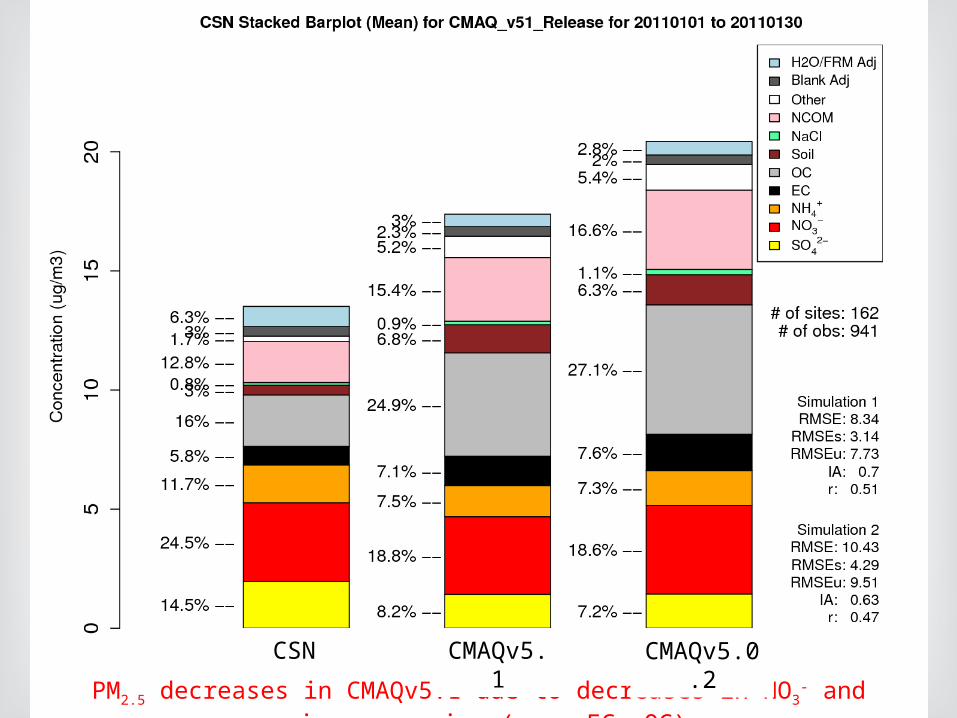
18PM2.5 decreases in CMAQv5.1 due to decreases in NO3- and primary species (e.g. EC, OC)
CMAQv5.1 CMAQv5.0.2CSN
PM2.5 Diurnal Performance -all sites; January average
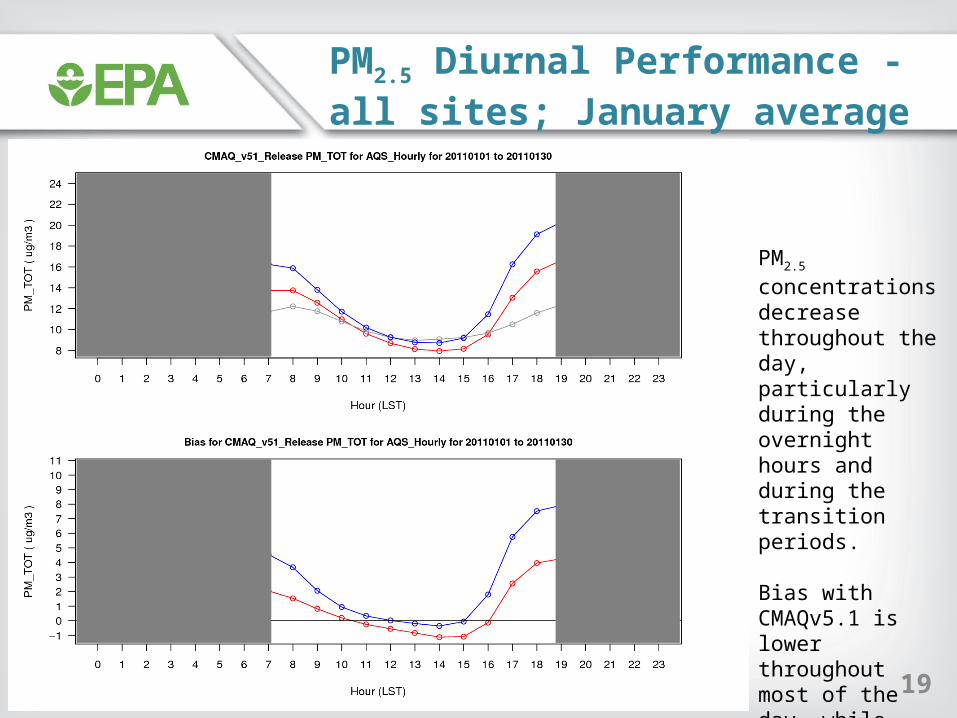
19
PM2.5 concentrations decrease throughout the day, particularly during the overnight hours and during the transition periods.
Bias with CMAQv5.1 is lower throughout most of the day, while RMSE is lower throughout the entire day, and correlation is greater throughout the entire day as well.
20
CMAQ Model Sensitivity to Emission Reductions
• Air Quality models are often used as tools to test emission control strategies
• Previous research has shown that CMAQ tends to underestimate the response to emission reductions
– i.e. ozone reduction is greater in the real world than simulated by the model
• Test CMAQ response to large cuts in input emissions
– 50% Anthropogenic NOX Cut– 50% Anthropogenic VOC Cut– 50% Anthropogenic SOX Cut
• Performed Base and Sensitivity (emission cut) simulations using CMAQv5.0.2 and CMAQv5.1
– Calculated the RRF for ozone at all non-water sites between the base/sensitivity runs for each version of the model to determine model responsiveness
– Then compared the RRFs for ozone between each simulation– Difference values > 1 indicate CMAQv5.1 is more responsive than v5.0.2 (and
vice versa)
21
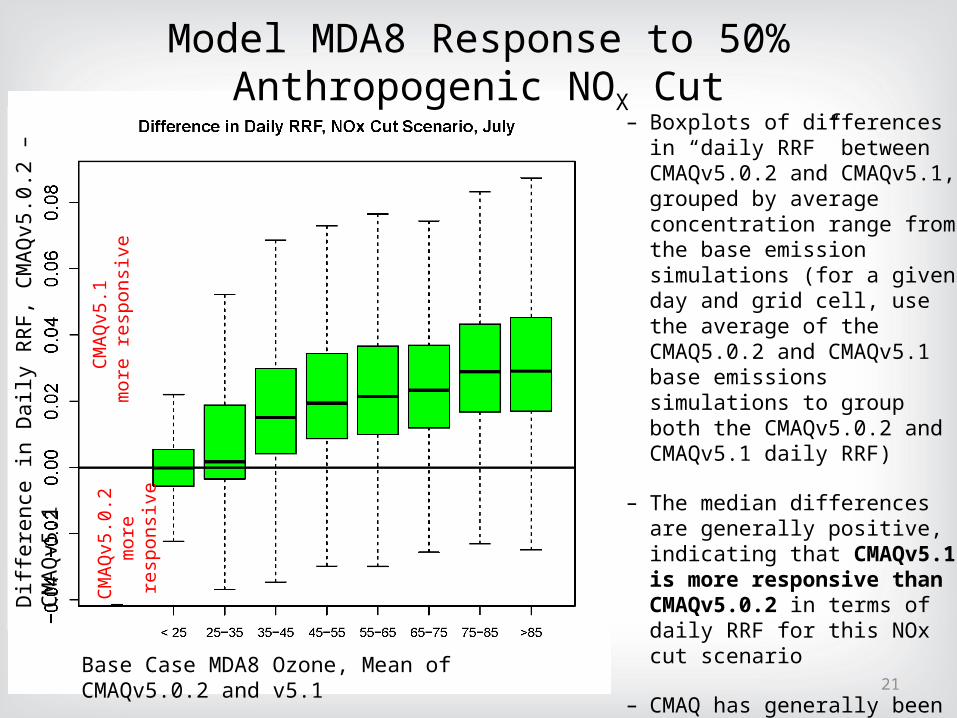
– Boxplots of differences in “daily RRF” between CMAQv5.0.2 and CMAQv5.1, grouped by average concentration range from the base emission simulations (for a given day and grid cell, use the average of the CMAQ5.0.2 and CMAQv5.1 base emissions simulations to group both the CMAQv5.0.2 and CMAQv5.1 daily RRF)
– The median differences are generally positive, indicating that CMAQv5.1 is more responsive than CMAQv5.0.2 in terms of daily RRF for this NOx cut scenario
– CMAQ has generally been criticized as being under-responsive to emission reductions (compared to the real-world), so a more responsive model is good
CMAQ
v5.1
m
ore
resp
onsi
veCM
AQv5
.0.2
m
ore
resp
onsi
ve
Model MDA8 Response to 50% Anthropogenic NOX Cut
Base Case MDA8 Ozone, Mean of CMAQv5.0.2 and v5.1
Diff
eren
ce in
Dai
ly R
RF, C
MAQ
v5.0
.2 –
CM
AQv5
.1
22
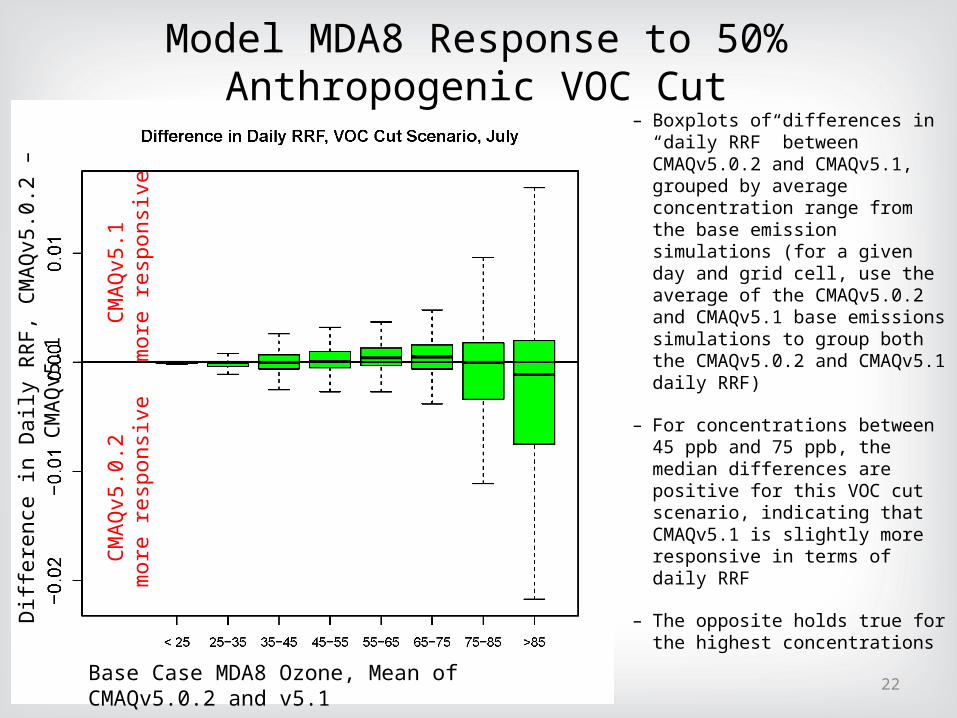
– Boxplots of differences in “daily RRF” between CMAQv5.0.2 and CMAQv5.1, grouped by average concentration range from the base emission simulations (for a given day and grid cell, use the average of the CMAQv5.0.2 and CMAQv5.1 base emissions simulations to group both the CMAQv5.0.2 and CMAQv5.1 daily RRF)
– For concentrations between 45 ppb and 75 ppb, the median differences are positive for this VOC cut scenario, indicating that CMAQv5.1 is slightly more responsive in terms of daily RRF
– The opposite holds true for the highest concentrations
CMAQ
v5.1
m
ore
resp
onsi
veCM
AQv5
.0.2
m
ore
resp
onsi
ve
Model MDA8 Response to 50% Anthropogenic VOC CutD
iffer
ence
in D
aily
RRF
, CM
AQv5
.0.2
– C
MAQ
v5.1
Base Case MDA8 Ozone, Mean of CMAQv5.0.2 and v5.1
Summary
• Increase in summertime ozone (~2-10 ppb) mixing ratios in CMAQv5.1
– Largest increase in the eastern United States– Result of increased photolysis due to fewer clouds in the model and updates to ACM2 and MOL calc– Results in a moderate increase in bias overall
• bias for mixing ratios above 70 ppb are reduced• Consistent may help improve model response to emission control scenarios
– RMSE and correlation are both improved for ozone in CMAQv5.1 over CMAQv5.0.2• may improve usefulness of model in health related studies
• Moderate increase in summertime PM2.5 (~0.5-3 µgm-3)
– Largest increase occurs in the eastern United States– Result of increased OH- radical concentrations and increased SOA from IEPOX and ACM2/MOL updates– Results in a moderate decrease in PM2.5 bias overall, RMSE and correlation both improve as well
• Moderate decrease in wintertime PM2.5 (1-5 µgm-3)
– Largest decrease in the eastern United States– Driven by lower NO3
- concentrations
• ClNO2 chemistry (lower HNO3 concentrations at night)
– Lower primary species concentrations • ACM2 updates and MOL fix
– Results in a lower PM2.5 bias and RMSE values, and improved correlation values
• Model response to changes in emissions
– increased model response to emission control strategies (studies show CMAQ typically underestimates the response)
– RRF values to NOX and VOC emissions cuts are larger (more responsive) w/ CMAQv5.1 than CMAQv5.0.211
23
24
Future Work
• Complete annual CMAQv5.1 simulation
– fully test model for all seasons
• Test the performance of CMAQv5.1 at fine scales (e.g. 4-km, 2-km and 1-km)
– DISCOVER-AQ Baltimore campaign in July 2011– DISCOVER-AQ San Joaquin Valley campaign in January/February 2013
• Perform hemispheric CMAQ simulation using v5.1
– use results from that simulation as BCs for 12-km CMAQv5.1 simulation
• Re-do 2002/2005 CMAQ Dynamic Evaluation Test Case
– Examine CMAQv5.1 response to “real-world” emission reductions
• Thanks to the AMAD development and evaluation teams!

25
• Extra Slides
26
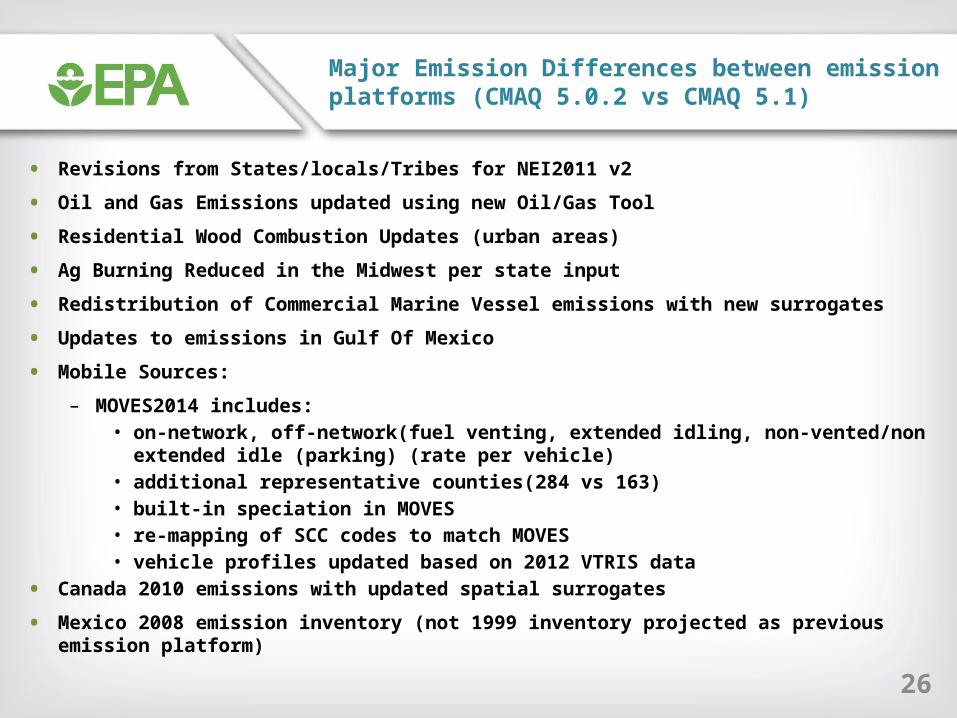
Major Emission Differences between emission platforms (CMAQ 5.0.2 vs CMAQ 5.1)
• Revisions from States/locals/Tribes for NEI2011 v2
• Oil and Gas Emissions updated using new Oil/Gas Tool
• Residential Wood Combustion Updates (urban areas)
• Ag Burning Reduced in the Midwest per state input
• Redistribution of Commercial Marine Vessel emissions with new surrogates
• Updates to emissions in Gulf Of Mexico
• Mobile Sources:
– MOVES2014 includes:• on-network, off-network(fuel venting, extended idling,
non-vented/non extended idle (parking) (rate per vehicle)• additional representative counties(284 vs 163)• built-in speciation in MOVES• re-mapping of SCC codes to match MOVES• vehicle profiles updated based on 2012 VTRIS data
• Canada 2010 emissions with updated spatial surrogates
• Mexico 2008 emission inventory (not 1999 inventory projected as previous emission platform)
27
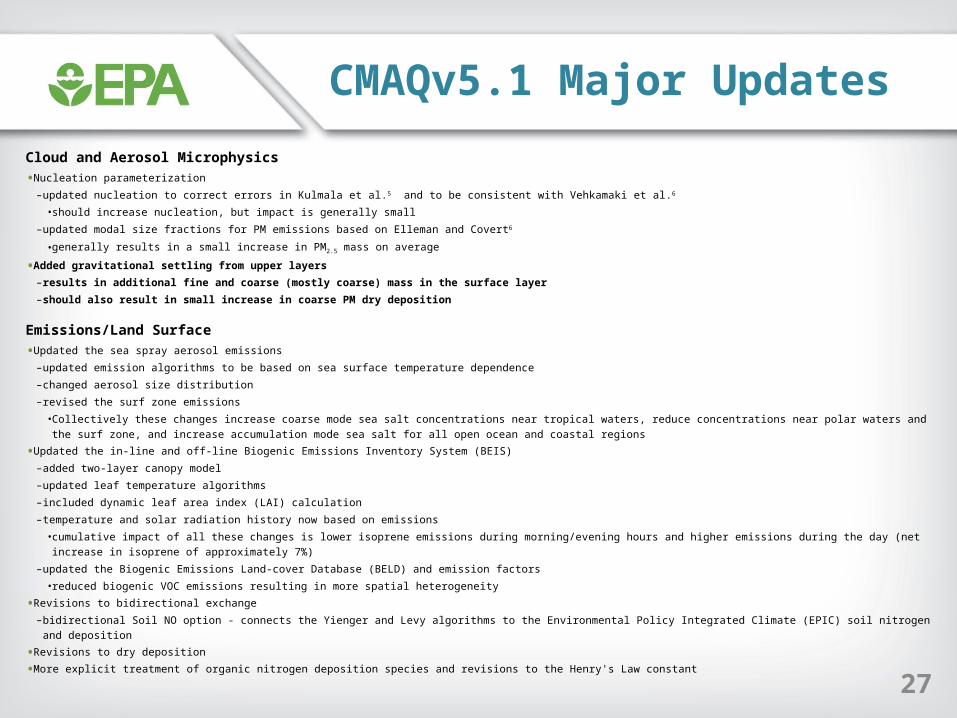
CMAQv5.1 Major Updates
Cloud and Aerosol Microphysics
• Nucleation parameterization
– updated nucleation to correct errors in Kulmala et al.5 and to be consistent with Vehkamaki et al.6
• should increase nucleation, but impact is generally small
– updated modal size fractions for PM emissions based on Elleman and Covert6
• generally results in a small increase in PM2.5 mass on average
• Added gravitational settling from upper layers
– results in additional fine and coarse (mostly coarse) mass in the surface layer
– should also result in small increase in coarse PM dry deposition
Emissions/Land Surface
• Updated the sea spray aerosol emissions
– updated emission algorithms to be based on sea surface temperature dependence
– changed aerosol size distribution
– revised the surf zone emissions
• Collectively these changes increase coarse mode sea salt concentrations near tropical waters, reduce concentrations near polar waters and the surf zone, and increase accumulation mode sea salt for all open ocean and coastal regions
• Updated the in-line and off-line Biogenic Emissions Inventory System (BEIS)
– added two-layer canopy model
– updated leaf temperature algorithms
– included dynamic leaf area index (LAI) calculation
– temperature and solar radiation history now based on emissions
• cumulative impact of all these changes is lower isoprene emissions during morning/evening hours and higher emissions during the day (net increase in isoprene of approximately 7%)
– updated the Biogenic Emissions Land-cover Database (BELD) and emission factors
• reduced biogenic VOC emissions resulting in more spatial heterogeneity
• Revisions to bidirectional exchange
– bidirectional Soil NO option - connects the Yienger and Levy algorithms to the Environmental Policy Integrated Climate (EPIC) soil nitrogen and deposition
• Revisions to dry deposition
• More explicit treatment of organic nitrogen deposition species and revisions to the Henry's Law constant

28
CMAQv5.1 Major Updates (Cont.)
Chemistry
• Updated the Carbon Bond 05 (CB05) chemical mechanism (included as CB05v51; CB6 not available at this time)– improved representation of organic nitrogen reaction rates, solubility, and products– updated PAN-type compound rates– added explicit acrolein and naphthalene species
• Added secondary organic aerosols (SOA) from Polycyclic Aromatic Hydrocarbons (PAHs) and alkanes– adds additional SOA of less than 0.1 µgm-3
• Added SOA from isoprene epoxydiols (IEPOX)– adds approximately 1 µgm-3 of IEPOX SOA in the Southeast
• Added SOA from isoprene+NO3
– increases AlSO1J and AlSO2J by less than 0.5 µgm-3 in the Southeast
• Corrected photolysis
• Other miscellaneous updates to NOY reactions
• Updated the SAPRC07 chemical mechanism based off California Air Resource Board (CARB) updates (included as SAPRC14T)– updated isoprene chemistry– updated NO2+OH reaction– improves temperature and pressure dependency against observations– updated HO2+RO2 production of OH
• introduces new sources of OH and formaldehyde– SOA from PAHs, alkanes, IEPOX, and isoprene+NO3 (as in CB05)
• Added ClNO2 chemistry– reduces aerosol and TNO3
- concentrations and increases ozone concentrations, particularly in the winter (small impact in the summer)
• Added halogen chemistry– results in reduced ozone mixing ratios over marine environments
• Revised in-line calculation of photolysis rates– alternative methods for determining aerosol optical properties based on the Mixing Model and Mie Theory– cloud effects are now more consistent with the cloud model in meteorological model– added an alternative method for calculating actinic fluxes based on a regression model
• Updated data and code representing mechanisms– replacement of include files with Fortran modules– reaction type representing heterogeneous reactions
• Reactions now possible between gas-phase concentrations (GC), aerosol (AE) and non-reactive (NR) species groups
29
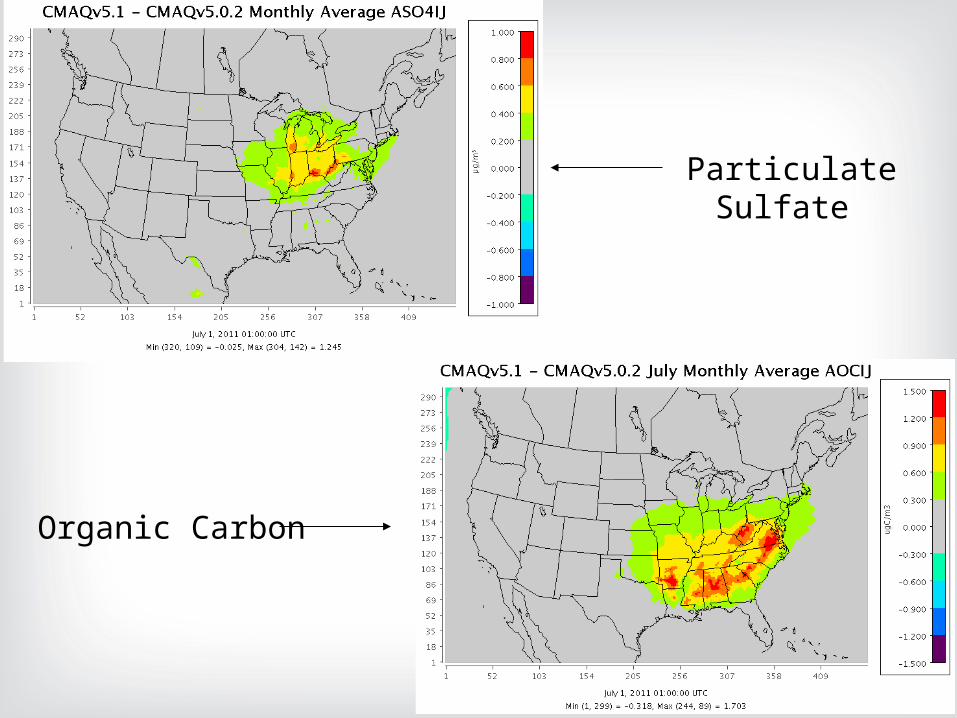
Particulate Sulfate
Organic Carbon
30
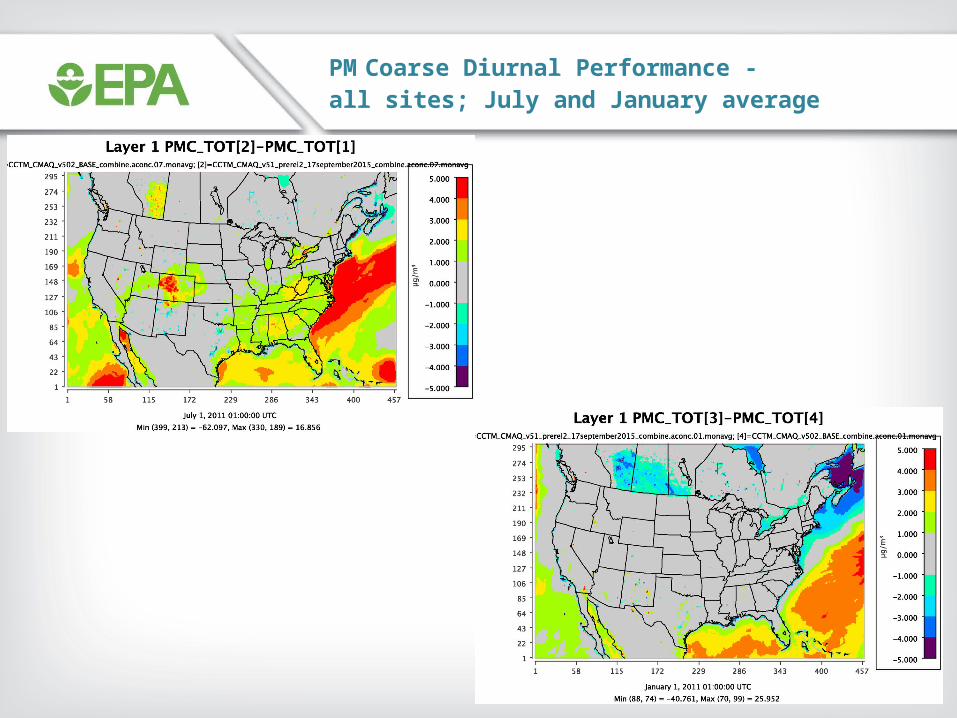
PM Coarse Diurnal Performance -all sites; July and January average
31
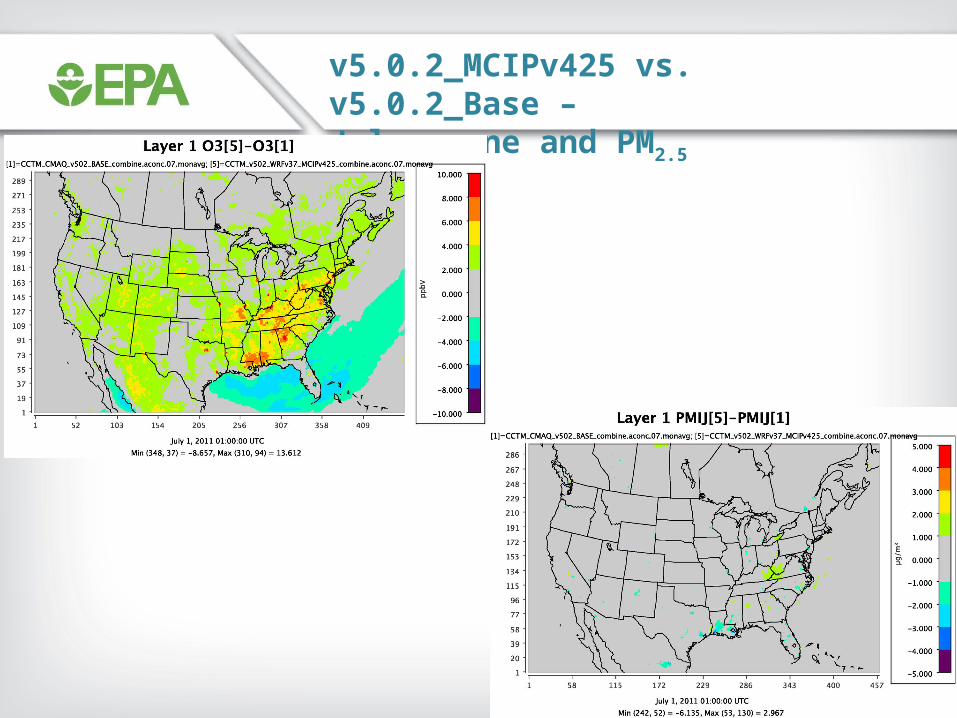
v5.0.2_MCIPv425 vs. v5.0.2_Base –July ozone and PM2.5
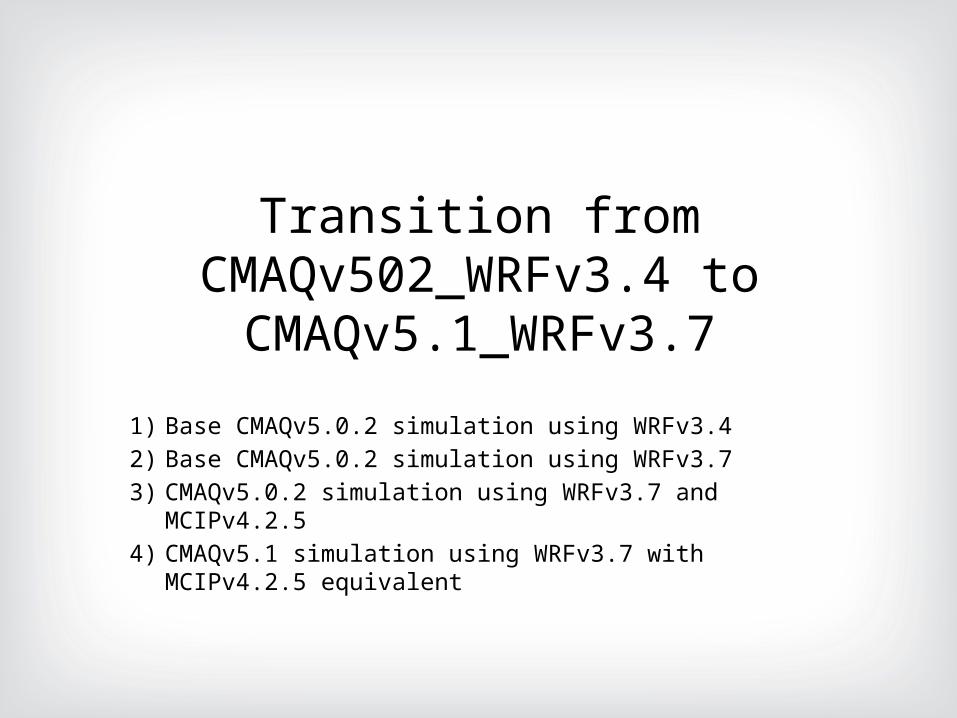
Transition from CMAQv502_WRFv3.4 to CMAQv5.1_WRFv3.7
1) Base CMAQv5.0.2 simulation using WRFv3.42) Base CMAQv5.0.2 simulation using WRFv3.73) CMAQv5.0.2 simulation using WRFv3.7 and MCIPv4.2.54) CMAQv5.1 simulation using WRFv3.7 with MCIPv4.2.5 equivalent


Related Documents