EVALUATION OF SOIL POTASSIUM TEST TO IMPROVE FERTILIZER RECOMMENDATIONS FOR CORN A Thesis Submitted to the Graduate Faculty of the North Dakota State University of Agriculture and Applied Science By Manbir Kaur Rakkar In Partial Fulfillment of the Requirements for the Degree of MASTER OF SCIENCE Major Program: Soil Science April 2015 Fargo, North Dakota

Welcome message from author
This document is posted to help you gain knowledge. Please leave a comment to let me know what you think about it! Share it to your friends and learn new things together.
Transcript
EVALUATION OF SOIL POTASSIUM TEST TO IMPROVE FERTILIZER
RECOMMENDATIONS FOR CORN
A Thesis
Submitted to the Graduate Faculty
of the
North Dakota State University
of Agriculture and Applied Science
By
Manbir Kaur Rakkar
In Partial Fulfillment of the Requirements
for the Degree of
MASTER OF SCIENCE
Major Program:
Soil Science
April 2015
Fargo, North Dakota

North Dakota State University
Graduate School
Title
EVALUATION OF SOIL POTASSIUM TEST TO IMPROVE FERTILIZER
RECOMMENDATIONS FOR CORN
By
Manbir Kaur Rakkar
The Supervisory Committee certifies that this disquisition complies with North Dakota State
University’s regulations and meets the accepted standards for the degree of
MASTER OF SCIENCE
SUPERVISORY COMMITTEE:
Amitava Chatterjee
Co-Chair
David Franzen
Co-Chair
Joel K. Ransom
Approved:
April 2, 2015 Frank Casey
Date Department Chair
iii
ABSTRACT
A study was conducted at thirteen locations in North Dakota and Minnesota in 2013 and
2014 with the objectives of determining difference between the soil potassium (K) results based
upon air-dried (KDry) and field-moist (KMoist) soil samples during the corn growing season and to
evaluate corn response to applied K-fertilizer. Overall, KDry tests showed higher K levels in the
soil test results compared to KMoist but the pattern of deviation was dependent upon various soil
properties such as initial soil K level. Temporal variation of soil K levels indicated a need to
consider time of soil sampling while making fertilizer recommendations. Potassium application
significantly increased corn yields at only five out of 11 sites with soil K levels below critical K
soil test levels (<150 ppm). Therefore, development of an improved soil testing strategy is
required to improve the predictability of corn response to applied K fertilizer in this region.

iv
ACKNOWLEDGEMENTS
I would like to thank my advisors, Dr. Amitava Chatterjee and Dr. David Franzen, for
their guidance and assistance throughout the research work and in the preparation of this
manuscript. I would like to express my gratitude to my committee member, Dr. Joel K Ransom
for his support in completing this project.
I would like to recognize all of the personnel who assisted in the field work, notably
Rakesh Awale, Norman Cattanach, Berdakh Utemuratov, Resham Thapa, Eric Schultz, Lakesh
Sharma and Heidi Rasmussen. Sincere thanks to my family for their continuous support and
encouragement throughout my graduate career.
For their financial support to accomplish this project, I would like to thank North Dakota
Corn Council.
v
TABLE OF CONTENTS
ABSTRACT ................................................................................................................................... iii
ACKNOWLEDGEMENTS ........................................................................................................... iv
LIST OF TABLES ....................................................................................................................... viii
LIST OF FIGURES ....................................................................................................................... ix
LIST OF ABBREVIATIONS ......................................................................................................... x
GENERAL INTRODUCTION ....................................................................................................... 1
LITERATURE REVIEW ............................................................................................................... 3
Comparison of soil potassium test based upon air-dried or field moist samples ................ 3
Effect of sample timing on soil K test results ..................................................................... 6
Corn response to applied K fertilizer rates ......................................................................... 8
IS AIR-DRYING OF SOIL SAMPLES AN APPROPRIATE STEP IN DETERMINING
PLANT AVAILABLE POTASSIUM FOR CORN? ................................................................... 11
Abstract ............................................................................................................................. 11
Introduction ....................................................................................................................... 11
Material and methods ........................................................................................................ 13
Description of experimental sites and treatments ................................................. 13
Soil sampling and analysis .................................................................................... 14
Plant sampling and analysis .................................................................................. 15
Data analysis ......................................................................................................... 16
Results ............................................................................................................................... 16
Initial soil samples ................................................................................................ 16
Differences in extracted soil K between air-dried and field-moist samples ......... 16
Temporal variations .............................................................................................. 16
Corn response to potassium fertilization............................................................... 17
vi
Discussion ......................................................................................................................... 17
Variation among extracted-K from air-dried and field-moist soil samples .......... 17
Temporal variations .............................................................................................. 18
Corn response to potassium fertilization............................................................... 18
Summary and conclusions ................................................................................................ 19
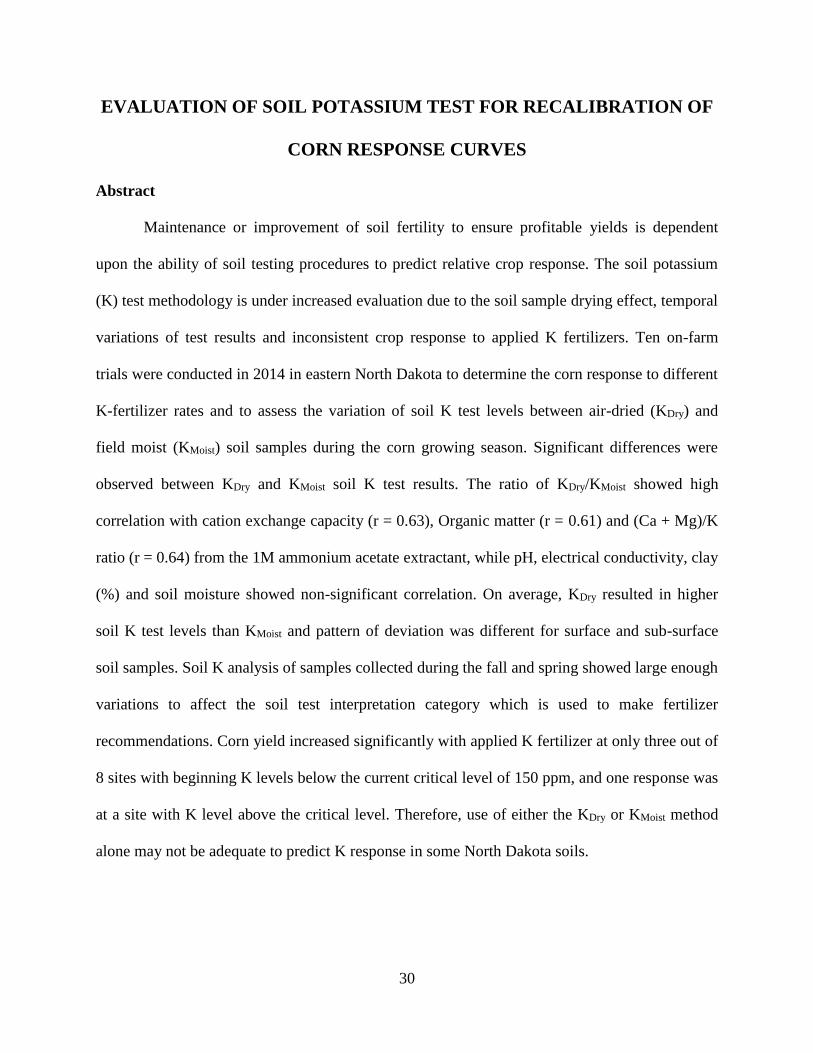
EVALUATION OF SOIL POTASSIUM TEST FOR RECALIBRATION OF CORN
RESPONSE CURVES .................................................................................................................. 30
Abstract ............................................................................................................................. 30
Introduction ....................................................................................................................... 31
Material and methods ........................................................................................................ 33
Site descriptions .................................................................................................... 33
Experimental design.............................................................................................. 33
Soil sampling ........................................................................................................ 34
Laboratory analysis ............................................................................................... 35
Yield analysis ........................................................................................................ 36
Statistical analysis ................................................................................................. 36
Results and discussions ..................................................................................................... 36
Basic soil properties .............................................................................................. 36
Comparison of soil potassium test based upon air-dried and field moist
samples .................................................................................................................. 37
Effect of time of sampling on soil K test results ................................................... 39
Corn response to applied K fertilizer rates ........................................................... 41
Summary and conclusions ................................................................................................ 42
GENERAL SUMMARY AND CONCLUSIONS........................................................................ 56
REFERENCES ............................................................................................................................. 57

vii
APPENDIX. RESULTS OF PAIRED-T TEST OF EACH SITE AT SPECIFIC
SAMPLING DATE ...................................................................................................................... 70
viii
LIST OF TABLES
Table Page
1. Average monthly air temperature (oC) and precipitation (cm) with 32-year of average
recorded at three experimental sites during growing season (NDAWN) ......................... 20
2. Corn stages corresponding to growing degree days and days after sowing ..................... 21
3. Basic soil properties of initial soil samples collected before planting from three
experimental sites.............................................................................................................. 22
4. Standard air-dried soil K (mg kg-1) of initial soil samples at Ada, Gardner and Valley
City and percent difference in available K (mg kg-1) of field-moist compared to
standard air- dried soil K................................................................................................... 22
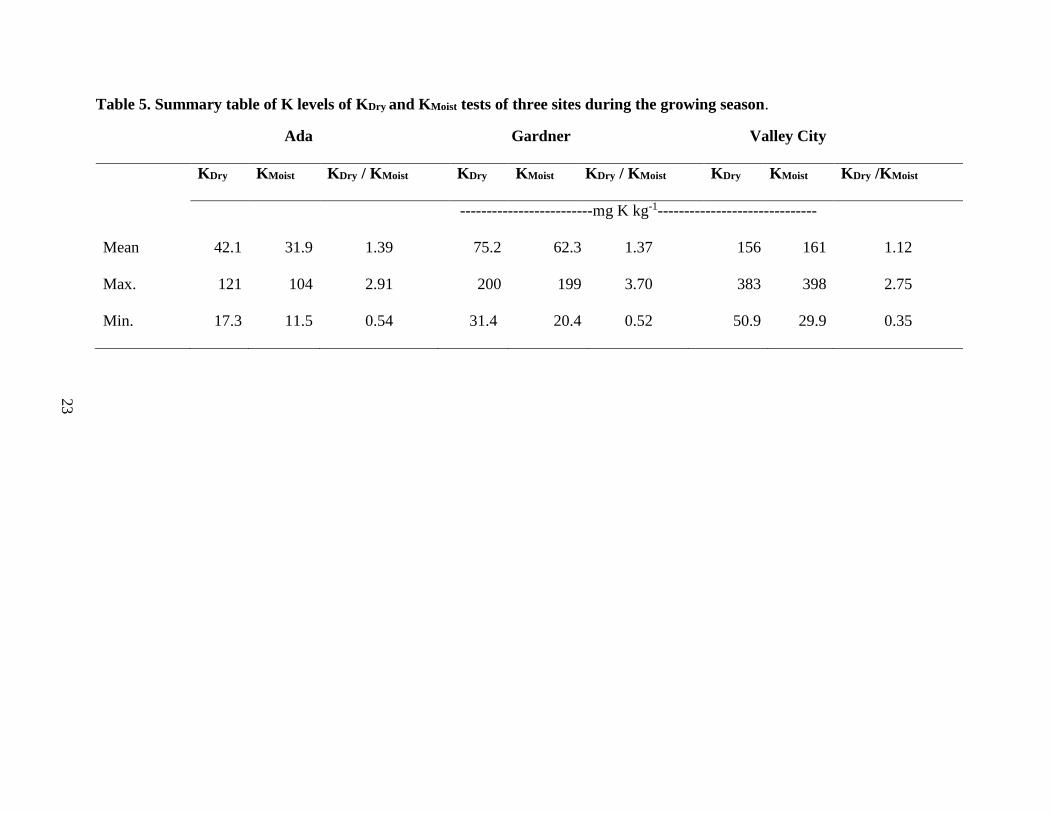
5. Summary table of K levels of KDry and KMoist tests of three sites during the growing
season ................................................................................................................................ 23
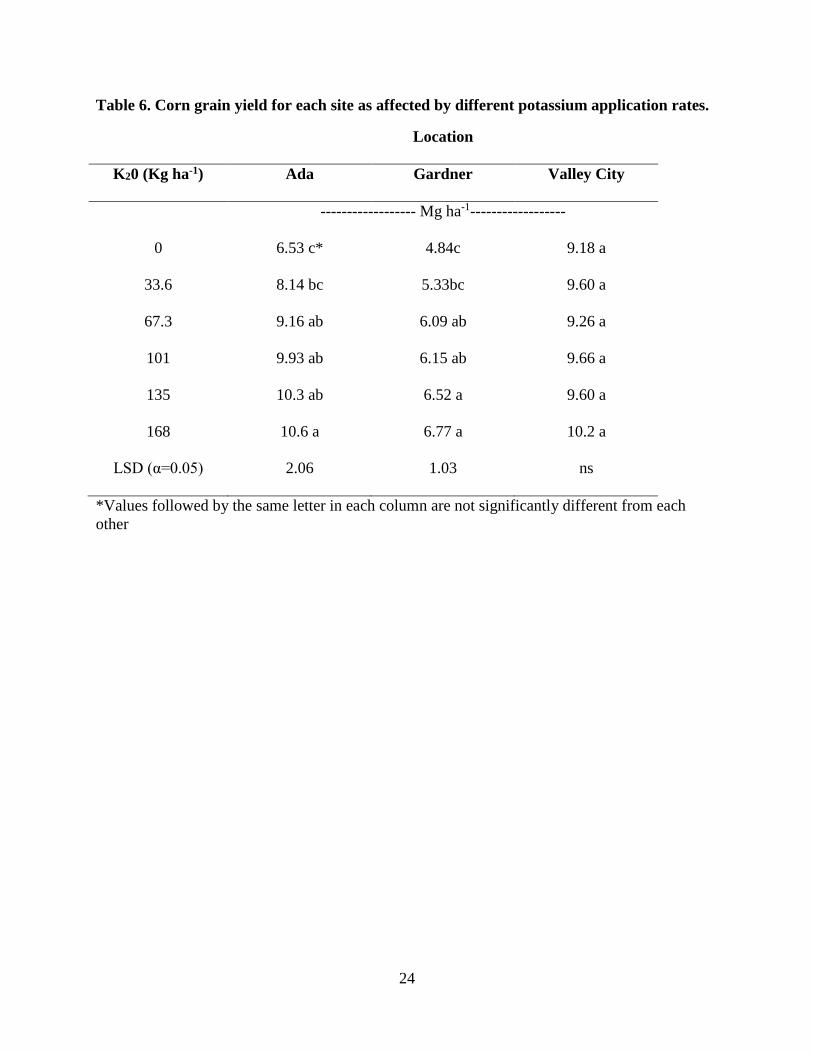
6. Corn grain yield for each site as affected by different potassium application rates ......... 24
7. Location and soil characterization information of K-experimental sites .......................... 43
8. Corn production details for all experimental sites ............................................................ 44
9. Soil test results of initial soil samples collected from 0-15 cm depth .............................. 45
10. Relationship between various soil properties (0-15 cm depth) and ratio of soil test K
results based upon air-dried and field-moist soil samples ................................................ 46
11. Changes in soil test K level between spring and fall soil sampling of control plots
and its impact on soil test K category ............................................................................... 47
12. Summary of soil K tests based on air-dried and field –moist soil samples during the
growing season.................................................................................................................. 48
13. Corn grain yield response of all sites to applied K-fertilizer treatments .......................... 49
ix
LIST OF FIGURES
Figure Page
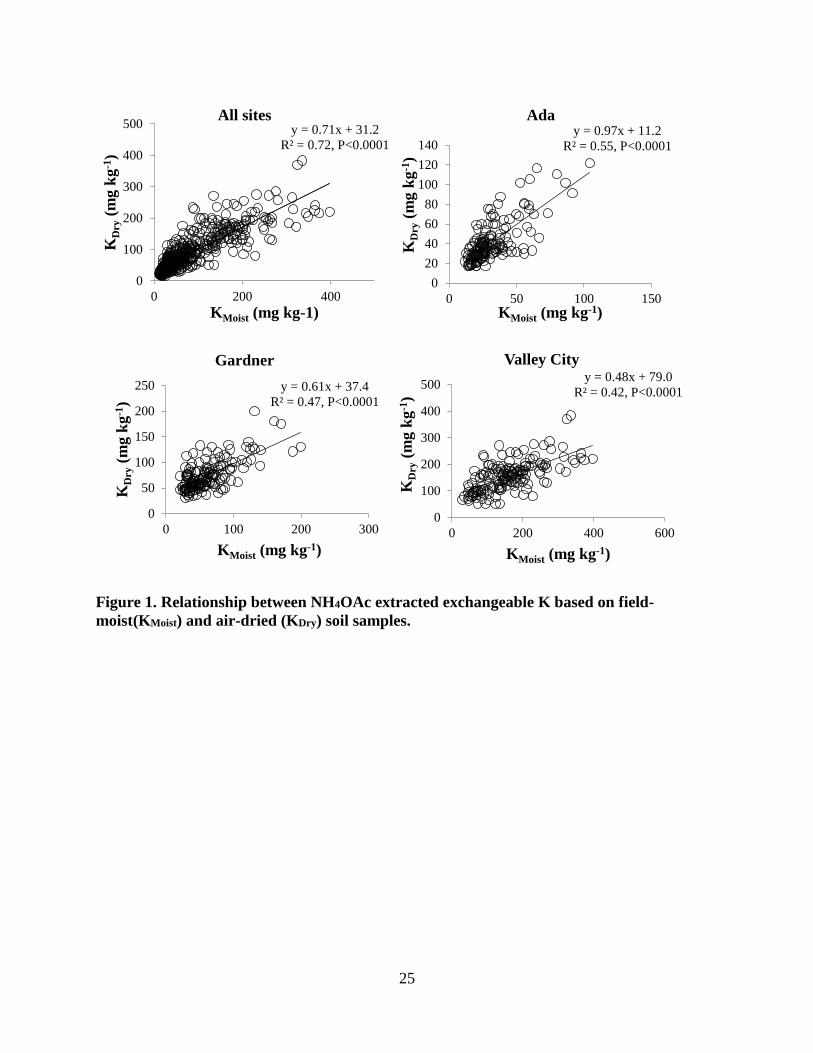
1. Relationship between NH4OAc extracted exchangeable K based on field-moist
(KMoist) and air-dried (KDry) soil sample ........................................................................... 25
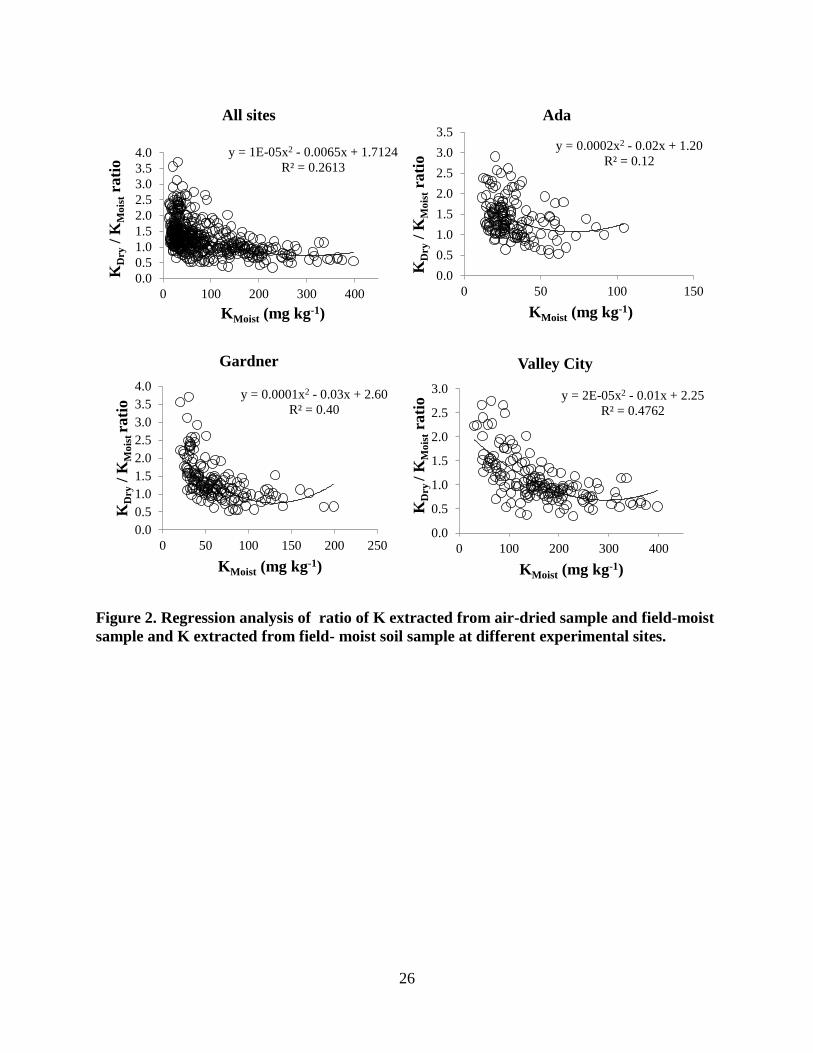
2. Regression analysis of ratio of K extracted from air-dried sample and field-moist
sample and K extracted from field- moist soil sample at different experimental sites ..... 26
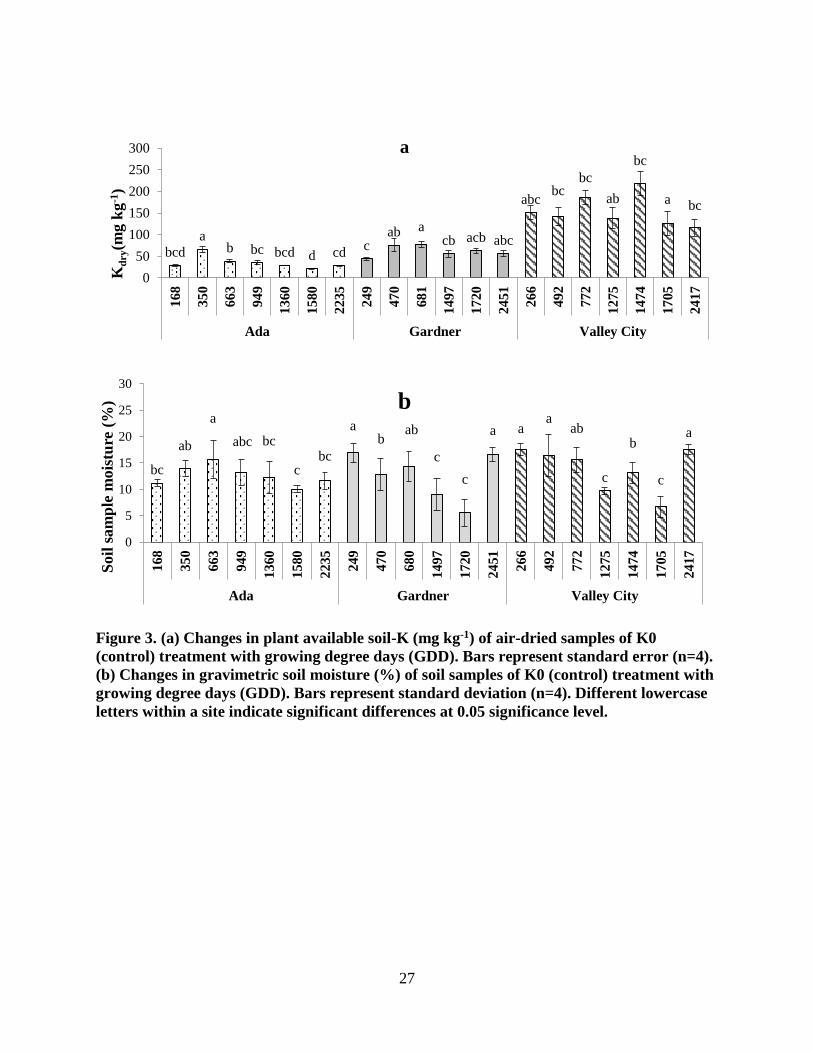
3. (a) Changes in plant available soil-K (mg kg-1) of air-dried samples of K0 (control)
treatment with growing degree days (GDD). Bars represent standard error (n=4). (b)
Changes in gravimetric soil moisture (%) of soil samples of K0 (control) treatment
with growing degree days (GDD). Bars represent standard deviation (n=4). Different
lowercase letters within a site indicate significant differences at 0.05 significance
level ................................................................................................................................... 27
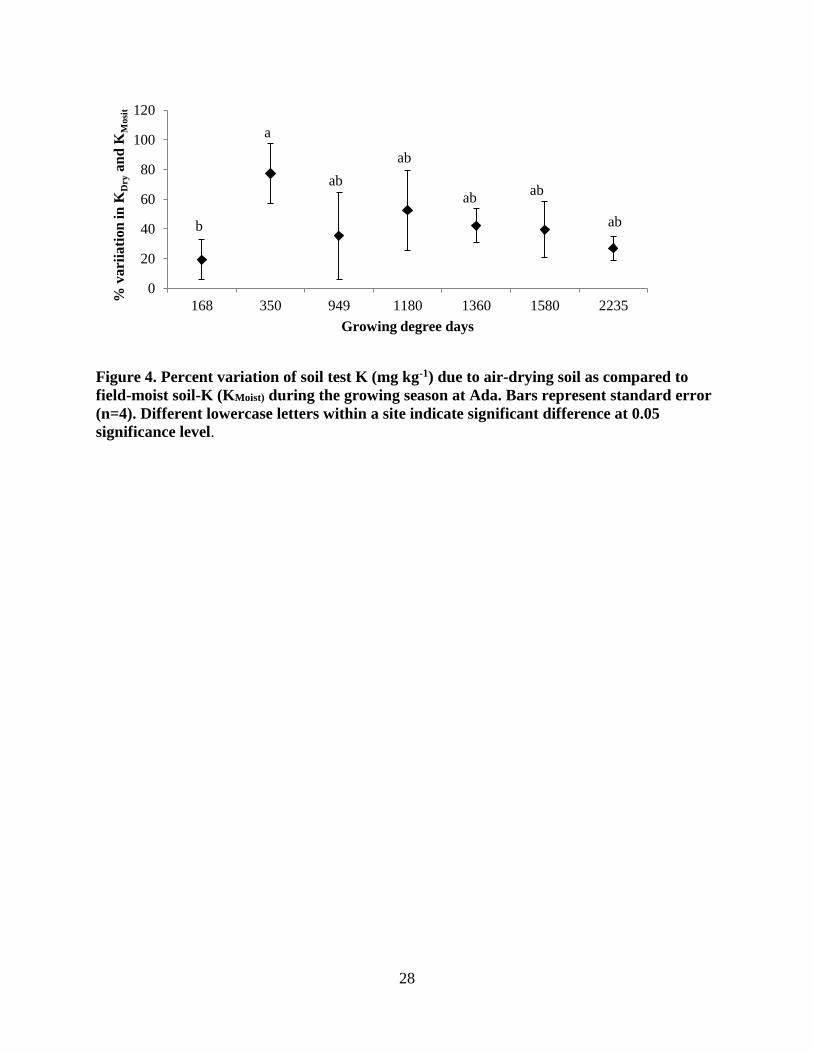
4. Percent variation of soil test K (mg kg-1) due to air-drying soil as compared to field-
moist soil-K (KMoist) during the growing season at Ada. Bars represent standard error
(n=4). Different lowercase letters within a site indicate significant difference at 0.05
significance level .............................................................................................................. 28
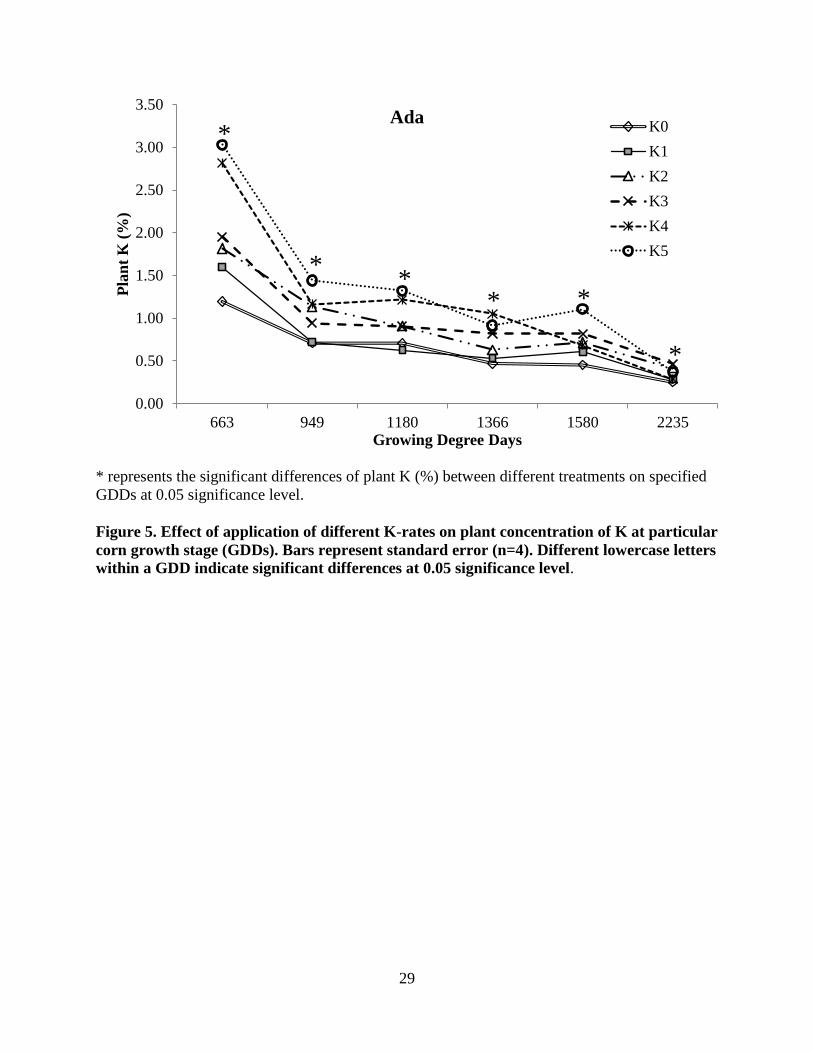
5. Effect of application of different K-rates on plant concentration of K at particular
corn growth stage (GDDs). Bars represent standard error (n=4). Different lowercase
letters within a GDD indicate significant differences at 0.05 significance level. ............. 29
6. North Dakota map showing experimental sites of 2014 ................................................... 50
7. Relationship between soil K-test values based upon air-dried and field-moist soil
samples of a) 0-15 cm and b) 15-30 cm depth .................................................................. 51
8. Relation of soil test K results based upon air-dried and field-moist soil samples of
a) Very low (0-40 ppm) soil K samples b) Low (41-80 ppm) soil K sample c)
Medium (81-120 ppm) and high (121-160 ppm) soil K samples d) Very high (>161
ppm) soil K samples.......................................................................................................... 52
9. Effect of time of sampling on soil test- K (ppm), KDry/KMoist ratio and soil moisture
(%) at Walcott W (low K site) and Fairmount (High K site.)........................................... 53
10. Effect of time of sampling on soil test- K (ppm), KDry/KMoist ratio and soil moisture
(%) at Very high K testing sites (Arthur, Page and Valley City) ..................................... 54
11. Effect of time of sampling on soil test- K (ppm), KDry/KMoist ratio and soil moisture
(%) at medium K testing sites (Buffalo, Gardner, Walcott E, Wyndmere and Milnor) ... 55

x
LIST OF ABBREVIATIONS
K .................................................................................potassium
KMoist ..........................................................................plant-available-K test of field-moist soil
samples.
KDry ............................................................................plant-available-K test of air-dried soil
samples
ANOVA .....................................................................analysis of variance
GDD ...........................................................................growing degree days
1
GENERAL INTRODUCTION
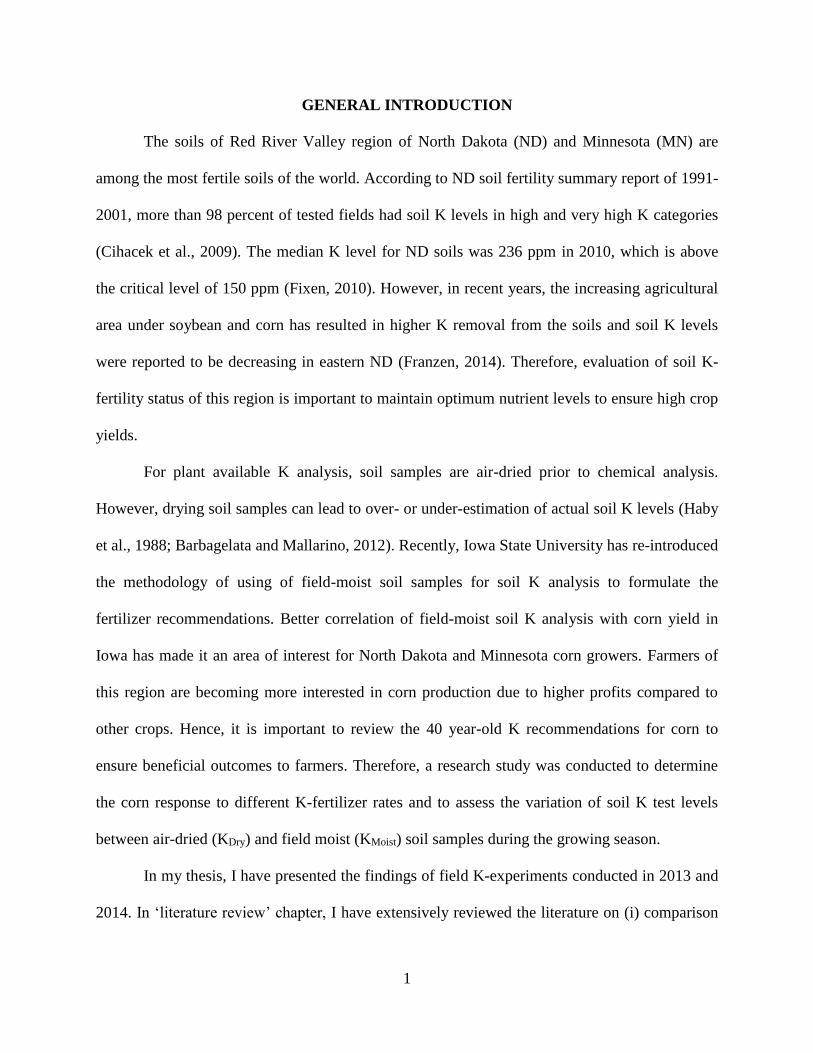
The soils of Red River Valley region of North Dakota (ND) and Minnesota (MN) are
among the most fertile soils of the world. According to ND soil fertility summary report of 1991-
2001, more than 98 percent of tested fields had soil K levels in high and very high K categories
(Cihacek et al., 2009). The median K level for ND soils was 236 ppm in 2010, which is above
the critical level of 150 ppm (Fixen, 2010). However, in recent years, the increasing agricultural
area under soybean and corn has resulted in higher K removal from the soils and soil K levels
were reported to be decreasing in eastern ND (Franzen, 2014). Therefore, evaluation of soil K-
fertility status of this region is important to maintain optimum nutrient levels to ensure high crop
yields.
For plant available K analysis, soil samples are air-dried prior to chemical analysis.
However, drying soil samples can lead to over- or under-estimation of actual soil K levels (Haby
et al., 1988; Barbagelata and Mallarino, 2012). Recently, Iowa State University has re-introduced
the methodology of using of field-moist soil samples for soil K analysis to formulate the
fertilizer recommendations. Better correlation of field-moist soil K analysis with corn yield in
Iowa has made it an area of interest for North Dakota and Minnesota corn growers. Farmers of
this region are becoming more interested in corn production due to higher profits compared to
other crops. Hence, it is important to review the 40 year-old K recommendations for corn to
ensure beneficial outcomes to farmers. Therefore, a research study was conducted to determine
the corn response to different K-fertilizer rates and to assess the variation of soil K test levels
between air-dried (KDry) and field moist (KMoist) soil samples during the growing season.
In my thesis, I have presented the findings of field K-experiments conducted in 2013 and
2014. In ‘literature review’ chapter, I have extensively reviewed the literature on (i) comparison
2
of soil potassium test based upon air-dried and field moist samples, (ii) effect of time of
sampling on soil K test results and (iii) corn response to applied K fertilizer rates. Chapter
entitled ‘Is air-drying of soil samples an appropriate step in determining plant available
potassium for corn?’ is a paper submitted to Journal of Plant Nutrition which includes findings
from field trials during 2013 growing season. In following chapter ‘evaluation of soil potassium
test for recalibration of corn response curves, I have presented my 2014 data. I have summarized
my two-year research results in ‘general summary and conclusion’.
3
LITERATURE REVIEW
Comparison of soil potassium test based upon air-dried or field moist samples
The reliability of soil test results for fertilizer recommendation is based upon the
correctness of soil sampling techniques and analytical procedures (Sabbe and Marx, 1987).
Therefore, soil sample preparation should involve minimal chemical and mechanical disturbance
to represent the field conditions. However, due to inconveniences in handling and analyzing
field-moist soil samples, air-drying of soil samples is a common pre-treatment utilized to conduct
most soil analysis (Gelderman and Mallarino, 1998). Several researchers have documented that
the drying of soil samples alters surface acidity, affecting the solubility of various nutrients
(Bartlett and James, 1980; Eric and Hoskins, 2011), while others have recognized that the
collapse of clay structure due to change in the oxidation state of iron during drying within clay
minerals may lead to release or entrapment of certain cations, particularly potassium (K) (Khaled
and Stucki, 1991).
Whether or not to dry soil samples prior to soil K analysis has been controversial since
the early 1900’s. Since then, various researchers have analyzed field-moist (KMoist) samples and
dry (KDry) soil samples to understand the extent of variation of soil test K levels due to sample
moisture and better correlate soil K analysis with crop response. Barbagelata and Mallarino
(2012) reported 1.92 times higher K values in KDry than KMoist, while Haby et al. (1988) found
decreases in K values when soil samples were dried before analyzing plant available K. These
conflicting results indicate that increases and decreases in soil K are both possible among
different soils. Efforts have been made to identify the factors responsible for release or fixation
of K upon drying (Steenkamp, 1928; Attoe, 1947; Luebs et al, 1956; Hanway and Scott, 1959;
4
Burns and Barber, 1961; Grava et al., 1961; Barbagelata and Mallarino, 2012; Schneider et al,
2013).
Potassium ions (K+) possess an appropriate size to become trapped in the interlattice
spaces within clay minerals. Dehydration of the K+ ion due to soil drying can result in
redistribution of interlayer cations. Clay layers are not often uniform in interlayer distances, and
ions such as Fe3+ may form ‘wedges’ that restrict normal flow of K+ and other ions in and out of
the interlayer space. Since calcium has a higher affinity for negative charged clays, it may
compete with K+ for wedge zones and K+ can be released into the soil solution upon drying
(Sparks and Huang, 1985). The chemistry of clay present in the soil has a great influence on soil
K levels. Clay mineral types show different behavior in release and fixation of K when exposed
to dry conditions. George (1947) while working with electro-dialyzed illite clay and acid-washed
Wyoming bentonite reported that illite and expanding type of clays fixed K upon drying.
Weathered micas were found to show characteristic of fixing potassium under dry as well as
moist soil conditions whereas montmorillonite (a smectitic, expanding clay type) fixed K only
under dry conditions (Rich, 1968). On the other hand, Fine (1940) reported release of K from
bentonite clay when exposed to freezing conditions (a drying process).
McLean and Watson (1985) stated that initial soil K level is an important factor in
determining an increase or decrease of K levels in air-dried soil K analysis. The effect of initial
soil K level is evident in Cook and Hutcheson’s (1960) research study where they identified that
Kentucky soils gave higher soil K levels upon drying if soil-K levels were below 0.5 meq 100g-1,
and lower K values if soils had K level of above 0.5meq 100g-1. Similarly, Haby et al. (1988)
found that soil drying leads to over-estimation of K if soil K levels were below 420 mg kg-1 and
5
under-estimation of K if soil K level were above 500 mg kg-1 in dry-land agricultural soils of the
Northern Great Plains.
Burns and Barber (1961) reported that soil texture and the relative level of exchangeable
K are the primary factors for controlling the extent of K variation between KDry and KMoist
results. Sandy soils showed little change, while silt loam showed appreciable change in the
results of KDry and KMoist (Hanway, 1962). Others have identified cation exchange capacity, clay
mineralogy, soil sample moisture content, soil organic matter, total base content, and Ca+2 plus
Mg+2 to K+ ratio as additional factors responsible for release or fixation of K upon drying
(Matthews and Sherrell, 1960; Barbagelata and Mallarino, 2012).
Soil samples collected from different depths of the same location have shown variable
KDry and KMoist results (Hanway and Scott, 1957). Air-dried sub-surface soils showed an increase
of 118% while surface soils showed an increase of 14.3% of K level compared to field-moist
sample K (Large, 1969). The extent of K-release depends upon the weathering state of clay
minerals (Steenkamp, 1928). Since soil’s surface layers are more prone to weathering, they have
less potential to release K than sub-surface soils (Thomas and Hipp, 1968).
After consideration of the relationship between KDry, KMoist and associated crop yield
response to K, the Iowa State University Soil and Plant Analysis Laboratory started using field
moist soil K analysis in the mid-1960s. It was later discontinued in 1988 due to the
inconvenience of moist soil sample handling and processing. Iowa State used a factor of 1.25
based upon relation of KDry/KMoist results in their experiments (Mallarino, 2005), while Bates et
al., (1969) proposed treating soils with an organic compound (dextrose) to overcome the effect of
sample drying. However, use of dextrose was not helpful in controlling the fixation of K
experienced in many soils upon drying (Bates et al., 1969). Also, Mallarino et al. (2003)
6
observed that KDry/KMoist ratio was dependent upon the soil drying temperature, soil drainage
class and many unknown factors. The use of a factor-1.25 was not sufficient to overcome the
sample drying effect.
Many researchers have tried to evaluate the variation of dry and moist K soil tests in the
past several decades. However, due to the extreme complexity of soil K dynamics, it is difficult
to propose a universal solution for the soil drying effect to all soil types. The extent of over or
underestimation of soil K test upon drying and factors responsible for release or fixation are
specific to soil and other unexplained factors. In the context of existing unpredictability of soil K
tests, it would be advisable to review the existing methodology of soil sample drying before K
analysis in North Dakota and to find the factors effecting the variation of air-dried soil K and
field- moist K analysis.
Effect of sample timing on soil K test results
Potassium management is often difficult due to the inconsistency of soil K test results
(Mallarino, 2011). Extensive research has been conducted to improve the soil K test calibration
to predict the yield response. However, current ability of the soil K test to estimate the plant-
available K in many soils has resulted in an effort to improve soil K test methodology (Romheld
and Kirby, 2010). One of the problems in K management is temporal variation of soil K;
however little consideration has been given to the time of sampling. A number of studies have
revealed the occurrence of huge variability in soil test results and nutrient availability with space
and time (Cain et al, 1999; Anonymous, 2012; Franzen, 2012).
Peterson and Krueger (1980) reported that soil K levels were variable within and between
the crop growing seasons in an 8-year experimental period. A cyclic trend of variation had been
reported for soil K, with highest K level in April and May and then gradual decrease up to
7
September, followed again by increase in winter season (Lockman and Molloy, 1984). In an
experiment conducted over five different locations in Wisconsin, large differences were observed
between the soil K levels of fall and spring that affected the soil test interpretation category and
the fertilizer recommendations (Vitko et al., 2010). Similarly, Mallarino et al. (2011) found large
variability of soil K results in a three-year experiment in Iowa. They observed that trend of
increase or decrease in K levels was not consistent and seasonal K fluctuations were concluded
to be site specific.
Various factors have been identified for seasonal variation in soil K test results. Under -
estimating the importance of short term equilibrium between exchangeable K and non-
exchangeable K is found to be one of the major factors for high temporal variations of soil K
levels (Mallarino, 2011). Current measurement methods for estimating plant available potassium
involve measurement of exchangeable and soil solution K. However, the exchangeable K-ion is
liable to transform into non-exchangeable K or vice–versa depending upon the chemical
equilibrium (Bray and DeTurk, 1938), such transformations can lead to increase or decrease of
soil-K test levels over the time.
Soil moisture has a profound influence on the release and fixation of soil K. An
exponential increase of soil K was observed by lowering the soil moisture level below 10 percent
(Luebs et al., 1956). Therefore, interpretation of soil K under different moisture regimes is likely
to show variable soil K results. Further, North Dakota often attain sub-zero temperatures in
winter months (NDAWN, http://ndawn.ndsu.nodak.edu/). Freezing and thawing can affect the
soil physical, chemical and biological properties (Oztas and Fayetorbay, 2003; Henry, 2007). In
a Saskatchewan study, freeze and thaw cycles decreased exchangeable K levels (Hinman, 1970).
8
Likewise, Fine et al. (1940) observed increase and decrease of soil exchangeable K due to
freezing depending upon initial soil K levels.
In addition to the soil moisture effect, plant uptake during the growing season can greatly
reduce the soil-K content (Murrell, 2011). At the end of the growing season, release of K from
crop residues with rainfall, or removal of the residue may have major roles in K recycling.
Potassium is present in plant tissue in an inorganic form and can be leached from tissues
following senescence into the soil (Tukey, 1966). Rosolem et al. (2005) found that crop residues
of millets can recycle up to 3 to 8 kg ha-1 K per ton of residue if the residue remains in the soil.
Mallarino et al. (2011) mentioned a sharp decrease of K content in corn and soybean residues
from physiological maturity to harvesting due to leaching of K. These results indicate that soil
test K results are likely to show variable results during the growing season depending upon the
plant K-uptake and leaching pattern, in addition to soil moisture trends.
In some of the Corn Belt areas, crop advisers have reported that farmers are requesting a
shift to spring, rather than fall soil sampling (Murrell, 2009). As there is considerable variability
between K results of samples taken in fall as compared to spring, fertilizer recommendations
may need to vary accordingly (Childs and Jencks, 1967; Liebhardt and Teel, 1977; James and
Wells, 1990). Since fluctuations in soil K tests are soil and environment dependent, it would be
important to inspect the temporal variation of soil K levels of North Dakota to further improve
K-fertilizer recommendations.
Corn response to applied K fertilizer rates
Potassium is an essential plant nutrient required in large quantities by corn (McLean and
Watson, 1985). Potassium is not a component of biochemical structure but it plays a vital role in
water uptake, translocation of assimilates, enzymatic activities and improving the quality of
9
grains and other plant products (Havlin et al., 2005). Therefore, yield losses can be expected in
potassium limited soils (Barber, 1959; Dessele, 1967, Pettigrew, 2008). Application of K on
high-K testing soils can lead to no or negative yield responses (Mallarino et al., 1991; Wortmann
et al., 2009).
For fertilizer recommendations in North Dakota, soil test levels are calibrated with yield
response and grouped into five categories. These five soil classes and corresponding probability
of getting yield response are very low (>80%), low (50-80%), medium (20-50%), high (10-20%)
and very high (<10%) (Franzen, 2010). However, there have been studies where even high K
soils have shown positive corn yield response to fertilizer application while others with very low
K fertility status have not (Kuchenbuch and Buczko, 2011). Other experiments showed minimal
benefits from K application (Hanway, 1962; Bruns et al, 2006). Barbagelata and Mallarino
(2012) reported increases in corn yield with added K on 41% of their experimental sites;
however, there was a great deal of unexplained variability. High temporal and spatial variability
of available soil K and soil test K values was reported as factor for unexpected yield responses
from twenty experimental sites in Iowa (Clover and Mallarino, 2013). There was no grain yield
response to K application for two consequent years in a study conducted by Heckman et al.
(1992) over loamy sand soil while yield increased linearly in third year of their experiment.
These studies illustrate that corn response may not be solely related to soil K analysis, but to
additional unconsidered factors. This is further affirmed by Kuchenbuch and Buczko (2011)
where they reported that soil test values and fertilizer application alone were insufficient to
predict the corn yields and they recommended the use of soil physical properties, soil moisture
dynamics and plant use efficiency to make appropriate fertilizer recommendations.
10
Nutrient utilization efficiency of a crop is the net effect of existing soil physical, chemical
and biological conditions. Nutrient acquisition by the plants is effected by the ionic form of the
nutrient present in soil as well as ability of roots to uptake that ion (Brouder and Volenec, 2008).
Different plant species show different K uptake and utilization efficiencies which lead to variable
K responses (Schenk and Barber, 1980; Rengel et al., 2008). In addition, certain plant species
have shown the ability to utilize even the non-exchangeable form of K from the minerals by
releasing organic acids as root exudates (Zorb et al., 2013).
Further, prevailing rainfall conditions have a great impact upon the maintenance of
moisture level which is responsible for different trends of K availability to plants. High rainfall
can lead to significant potassium leaching in coarse textured soils on the one hand, while
resultant increase in soil moisture content can increase the diffusion rate of K into the plant roots
(Havlin et al., 2005). Another theory of high uptake of K by plants after intercepting high rainfall
is that during low rainfall years, roots extend to deeper layers where K level is generally low. But
in high rainfall years, roots concentrate in upper layers where they intercept more K (Barber,
1959). Apart from climatic and plant factors, existing soil conditions such as pH, cation
exchange capacity (LaBarge and Lindsey, 2012) and clay content is known to effect the nutrient
availability to plants (Blake et al., 1999).
Most of the North Dakota soils have potential to supply K to fulfill the needs of the crops.
Since corn requires a large quantity of K during the growing season, it is likely to respond to K-
fertilizer application (Norum and Weiser, 1957). The fertilizer recommendation for corn was
established about 40 years ago (Franzen, 2014). Therefore, it is essential to refine the strategies
to ensure economic returns to farmers from corn. In the context of recent findings, it would be
necessary to recalibrate the corn response to the applied K-fertilizers in North Dakota soils.
11
IS AIR-DRYING OF SOIL SAMPLES AN APPROPRIATE STEP IN DETERMINING
PLANT AVAILABLE POTASSIUM FOR CORN?1
Abstract
Potassium (K) fertilizer recommendations are mainly based on air -dried soil samples
which can lead to over- or under-estimation of plant available soil K. Three on-farm trials were
conducted in North Dakota and Minnesota to determine the variation of soil test-K between air-
dried (KDry) and field moist (KMoist) soil samples. The differences between KDry and KMoist
decreased as soil K increased, but increased linearly with increasing soil moisture. Soil drying
influenced the plant available soil K-test value, producing higher K values compared to the moist
soil K. It is unclear based on these initial experiments which method might produce a more
predictable K critical value to aid in directing K application for corn in this region.
Introduction
Soil testing plays a key role in formulating fertilizer recommendations. Most of the
commercial soil testing labs and universities in the USA, with the exception of Iowa (Mallarino
et al., 2013) include air drying of soil sample as a standard soil preparation step.
Recommendations are based on extracting solutions, such as 1-N ammonium acetate or Mehlich-
3, added to the dried and ground soil sample (Erich and Hoskins, 2011; Nathan and NCERA-13
Soil Testing and Plant Analysis Committee, 2011). There is concern that air-drying soil samples
for plant available soil potassium (K) status prediction may lead to over- or under-estimation of
plant available K (Attoe, 1947; Luebs et al, 1956; Burns and Barber, 1961; Barbagelata and
1 The material in this chapter was co-authored by Manbir Rakkar, David Franzen and Amitava
Chatterjee. Manbir Rakkar had primary responsibility for collecting samples in the field and lab
analysis. Manbir Rakkar drafted and revised all versions of this chapter. David Franzen and
Amitava Chatterjee served as proofreader and checked the math in the statistical analysis
conducted by Manbir Rakkar.
12
Mallarino, 2012). When soil-K levels are high, clays may trap K inside interlattice spaces upon
drying. When soil-K levels are low, soil drying may cause clay edges to scroll outwards, and K
may be released from the interlayers, that results in a sort of chemical K equilibrium controlled
by inherent soil characteristics (McLean and Watson,1985). Variation between KMoist and KDry
has been reported by many studies. Barbagelata and Mallarino (2012) reported 1.92 times higher
K values in KDry than KMoist while Haby et al. (1988) found decreases in K values when soil
samples were dried. Burns and Barber (1961) reported that soil texture and the relative level of
exchangeable K were the primary factors controlling the extent of K variation between dry and
moist samples. Others have identified cation exchange capacity, clay mineralogy, initial soil
sample moisture content, soil organic matter, total base content, and Ca+2 plus Mg+2 to K ratio as
additional factors responsible for release or fixation of K upon drying (Barbagelata and
Mallarino, 2012).
Plant available soil test K levels are not only subject to moisture content through the
analysis procedure, but also from the timing of obtaining the soil sample. In a long-term Illinois
temporal variability study (Franzen, 2011) soil test K levels were lowest in August/September,
when the soil was driest, and highest in December/January when the soil was wettest. Because
soil wetness occurred in some years at normally dry season, but K levels persisted in the seasonal
variation despites peaks of moisture, the seasonality is probably not only soil moisture driven,
but may also include K leaching from crop residues, seasonal variability in moisture (high
moisture in winters and comparatively low moisture towards the end of growing season when
soils are driest), freezing and thawing, and microbial activity (Murrell, 2011). Temporal
variations of soil-K levels may need to be considered when making fertilizer recommendation,
and certainly when looking for trends in field K levels over years.
13
Potassium fertilization effects on corn yield and plant tissue K concentration needs to be
revisited for modern corn varieties and cultural management. Current corn K recommendations
in North Dakota are based on the categories for soil K analysis that are very low (<40 ppm), low
(41-80 ppm), medium (81-120 ppm), high (121-160 ppm) and very high (>161 ppm) (Franzen,
2010). Some studies have shown little to no increase in grain K concentration with increasing K
application rates (Clover et al., 2013). However, regardless of soil test K level or grain yield
response, K fertilization nearly always increases plant tissue K concentration during vegetative
stage (Clover et al., 2013; Mallarino et al., 2009). Corn yield increases have been recorded with
soil test-K values were <135 ppm in Ontario (Vyn et al., 2001), while Ebelhar et al. (2000) found
168 ppm as the critical level in Illinois for obtaining a yield increase.
Most of the USA including North Dakota was reported to have a negative potassium
budget (Fixen et al., 2010), which means that K removed from the soil is greater than the amount
returned as amendments. Although some of these soils currently have a K surplus, many others
do not. One reason that in many regions K is not being applied at rates required for soil
replacement is that the soil test values may not reflect critical levels of corn response. The
objectives of this study are: 1) to record the corn yield and corn plant K uptake response to K
fertilization, 2) examining the differences in soil test K levels between field-moist and air-dried
soil samples, 3) record the temporal variation of soil test K through a corn growing season.
Material and methods
Description of experimental sites and treatments
Three on-farm trials were conducted at (1) Gardner (N 47O 9’586, W 97o 02’830”) and (2)
Valley City (N 46O53’407” and W 97O55’033”) in North Dakota, and (3) Ada (N 47O 19’53” and
W 96O 23’33”) in Minnesota. The soils are classified at Gardner as Gardena fine sandy loams:
14
coarse silty, mixed, superactive, Pachic Hapludols; Valley City as Barnes loams Fine-loamy,
mixed, superactive, frigid calcic Hapludolls; Ada as a Ulen soil sandy, mixed, frigid Aeric
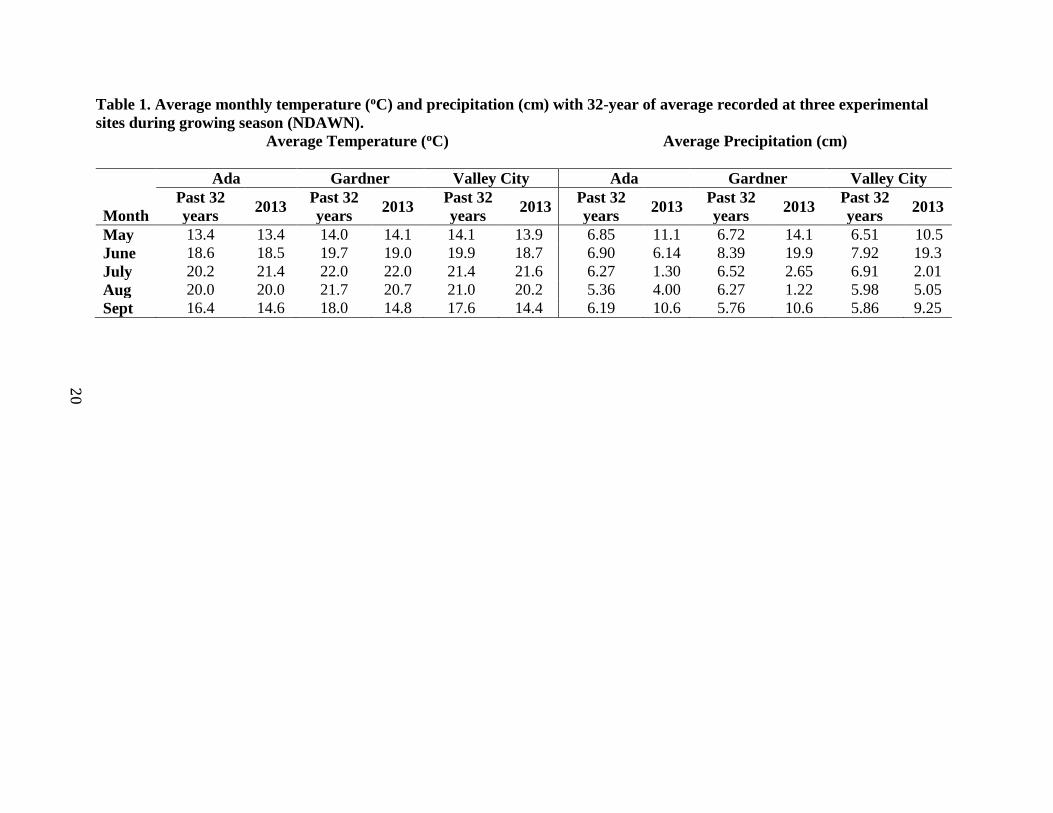
Calciaquolls (Soil Survey Staff, 2013). Annual average temperature and precipitation of the
growing season in 2013 and past 32 years are presented in Table 1.
The experimental design of the trials was a randomized block with six K application rates
in the form of KCl (0-0-60), control (K0), 33.60 (K1), 67.1 (K2), 100.8 (K3), 134.4 (K4), K5-
168.0 (K5) K2O kg ha-1 and four replications. Nitrogen and phosphorus were applied to the entire
site according to soil test recommendations (Franzen, 2010). Corn variety Pioneer 4086 was
planted at a population density of 87500 plants ha-1 with row spacing of 0.55 m at Ada and 0.76
m at Gardner and Valley City. Each experimental unit (plot) was 9.14 m long by 3.34 m wide
with 6 rows per plot at Ada and Valley City and 4 rows per plot at Gardner.
Soil sampling and analysis
Three initial composite soil samples per plot were collected from 0-15 cm and 15-30 cm
before planting and analyzed for plant available K using the 1-M ammonium acetate method,
with both the moist and dry soil methods. Texture, electrical conductivity, soil pH, organic
matter, and bulk density were analyzed (Elliot et al, 1999; Thomas, 1996; Combs and Nathan,
1998; and Blake and Hartge, 1986).
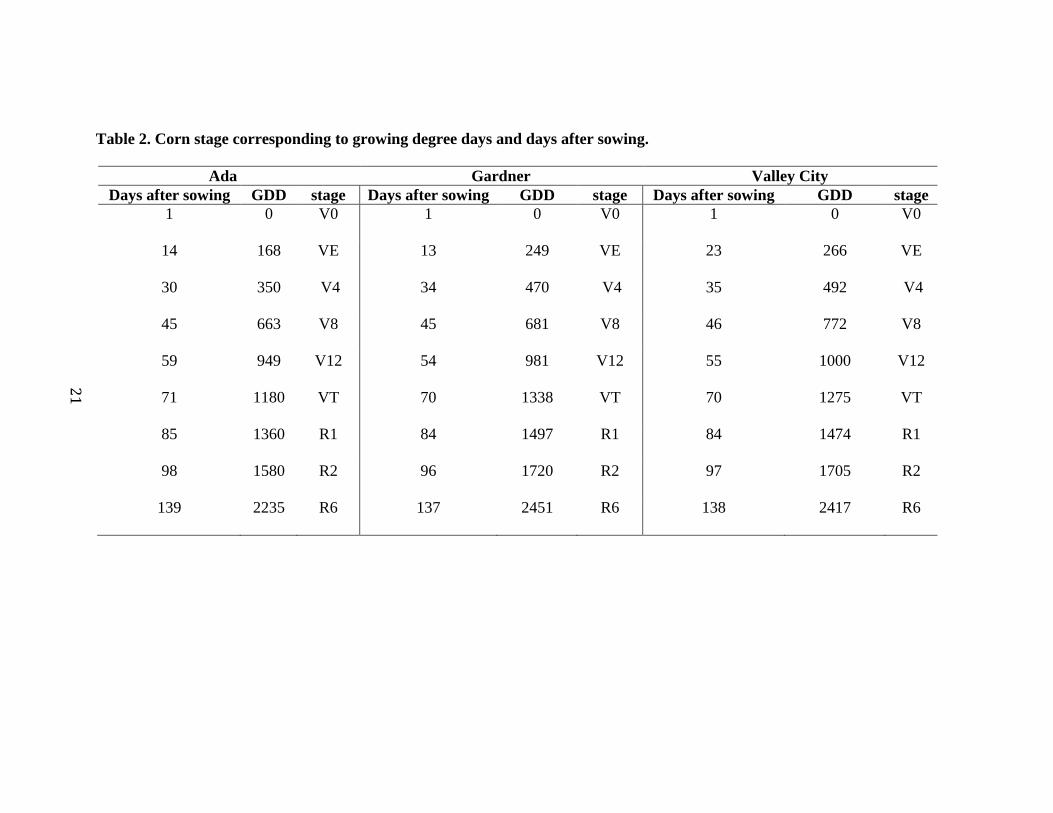
Soil and plant samples were collected during the growing season at corn growth stages
described in Table 2. Soil samples (0-15 cm depth) were collected from each plot and stored in
zip-lock plastic bags to retain moisture. Each soil sample was thoroughly mixed and divided into
three sub-samples. One intact sub-sample was analyzed for field moist soil-K (KMoist) and the
other sub-sample for dry soil-K (KDry) level according to procedure recommended by Warncke
and Brown (1998) with some modification. For KDry, 1g of sample with 20 mL of neutral 1M
15
NH4OAc and for KMoist, 2g of dry equivalent was used with 40 ml of neutral 1M NH4OAc
maintaining the ratio of 1:20 (soil to extracting solution). The soil and extractant was shaken for
5 min and filtered through Whatman No. 2 filter paper. Soil K concentration was determined on
the filtrate using a Buck Scientific Atomic Absorption Spectrometer - Model 200A (Norwalk,
CT, USA) using 766.5 nm of wavelength. The third subsample was used for gravimetric
moisture content determination by first weighing moist, then reweighing after oven-drying at 105
oC for at least 24 hours.
Plant sampling and analysis
Plant samples were collected at the same times as soil sample collection (Table 2). The
entire above ground plant was taken from an exterior row (V4), the uppermost mature leaves
within the same rows were obtained at V8, V12, VT and ear leaf at R1 and tasseling, were
obtained, transported in a cooler to the drier, dried , ground and analyzed for K concentration. At
harvest stover and grains were analyzed separately for K concentration (Clemson University,
2013). After drying in an oven at (55 oC) for 4-5 days until the weight was stable, the samples
were ground in a Wiley Mill (Swedesboro, NJ, USA) using 2 mm screens. About 0.5 to 1g
ground plant material was ashed in an electric muffle furnace using a gradually increased
temperature up to 500 oC for 2 hours followed by a constant temperature of 500 oC for 4 hours.
The ash was then acid-treated with 5 ml of 6 N HCl and then the sample was dried over a hot
plate at 285 oC. The sample was re-dissolved with 10 mL of 1N HCl and transferred to 50 mL
volumetric flasks. The K concentration was analyzed using the same atomic adsorption
spectrometer as was used for soil K analysis. To determine yield, a 2 m row was harvested from
two-middle rows and grain yield was estimated as Mg ha-1.
16
Data analysis
Analysis of variance for all soil and plant parameters was conducted using SAS
Enterprise Guide 4.3. Means of main effects were compared using Fisher’s least significant
difference (LSD). Pearson correlation coefficients were used to evaluate the relationship among
the parameters at a 95% significance level.
Results
Initial soil samples
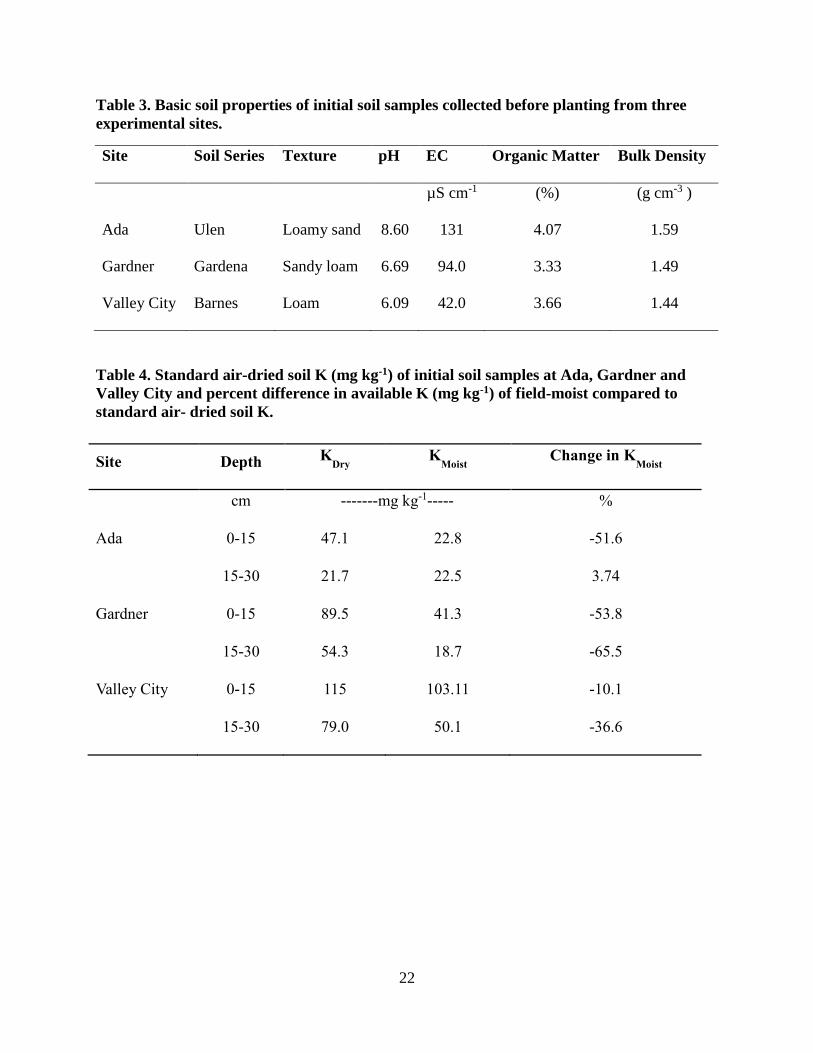
The initial soil test results of all three sites are presented in Table 3. Ada and Gardner
were coarser in texture compared to the Barnes soil at Valley City. The Ulen soil at Ada had a
higher pH and EC compared to the other sites. Initial soil K levels are presented in Table 4. On
average, percent variation between KDry and KMoist was 36%. The differences between KMoist and
KDry were greater at Ada and Gardner compared to Valley City. The difference between KDry and
KMoist in initial samples at Gardner was similar to that of Ada, with a 53.8% difference at the 0-
15 cm depth (Table 4). The percentage change was greater in KMoist for soil samples collected
from 15-30 cm depth as compared to 0-15 cm soil.
Differences in extracted soil K between air-dried and field-moist samples
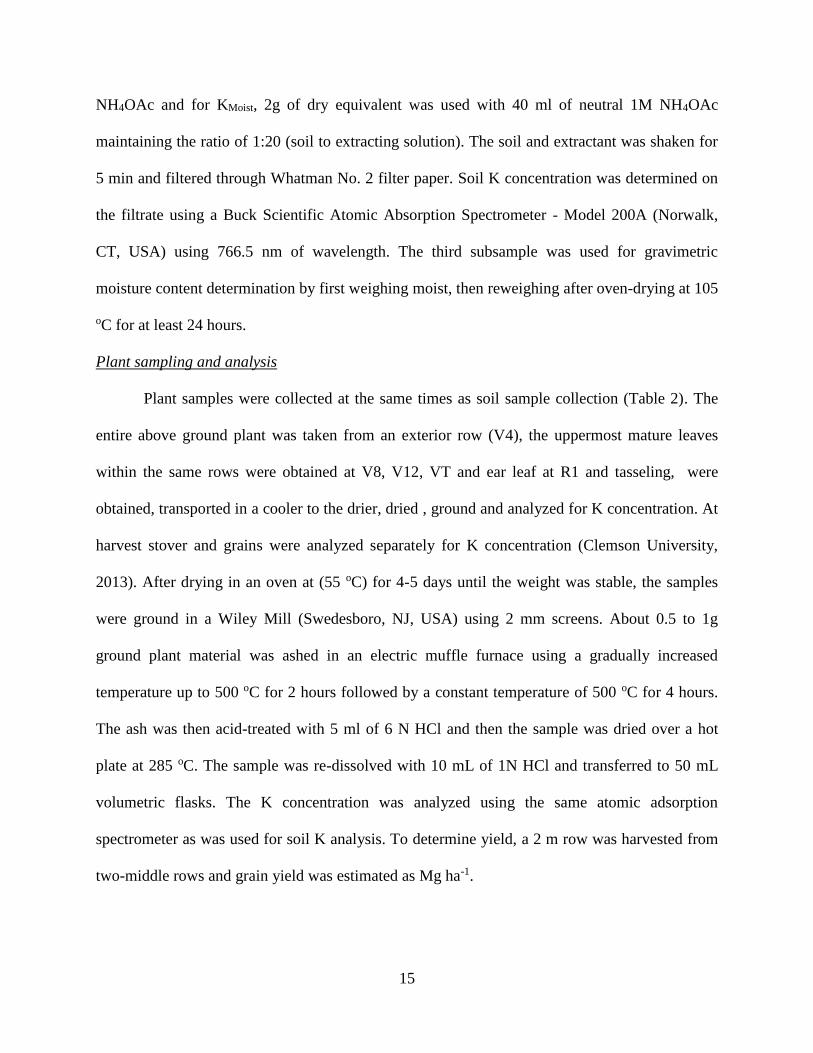
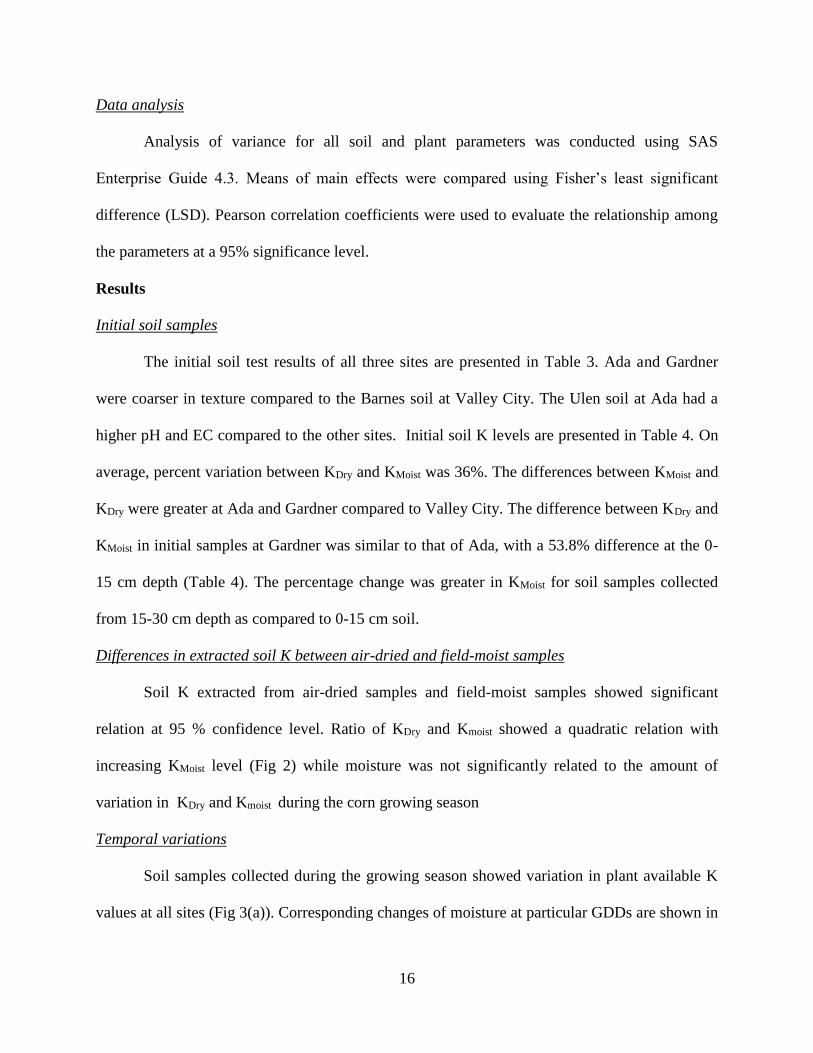
Soil K extracted from air-dried samples and field-moist samples showed significant
relation at 95 % confidence level. Ratio of KDry and Kmoist showed a quadratic relation with
increasing KMoist level (Fig 2) while moisture was not significantly related to the amount of
variation in KDry and Kmoist during the corn growing season
Temporal variations
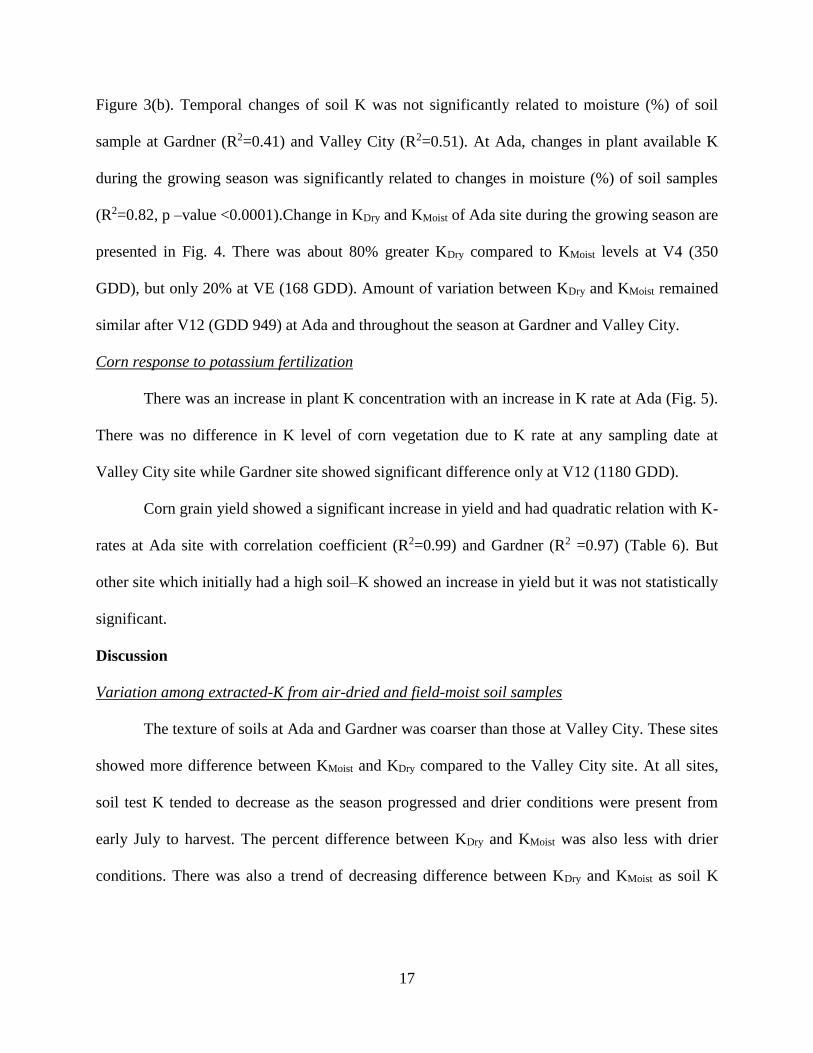
Soil samples collected during the growing season showed variation in plant available K
values at all sites (Fig 3(a)). Corresponding changes of moisture at particular GDDs are shown in
17
Figure 3(b). Temporal changes of soil K was not significantly related to moisture (%) of soil
sample at Gardner (R2=0.41) and Valley City (R2=0.51). At Ada, changes in plant available K
during the growing season was significantly related to changes in moisture (%) of soil samples
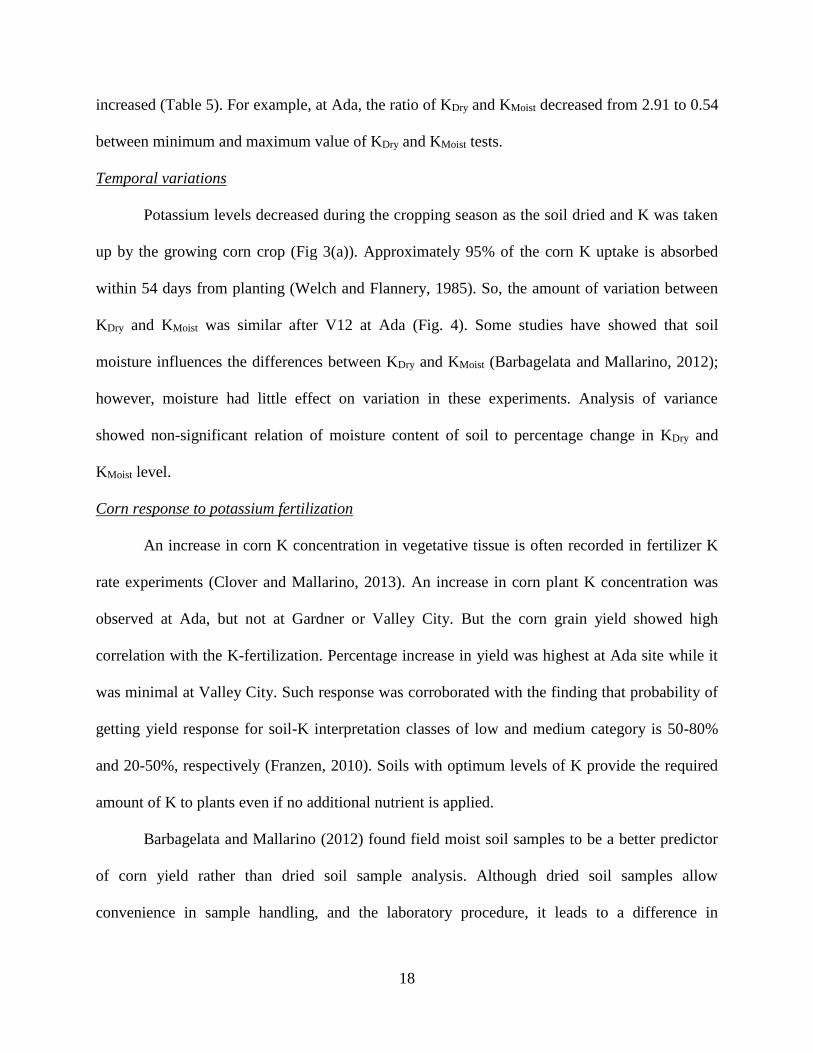
(R2=0.82, p –value <0.0001).Change in KDry and KMoist of Ada site during the growing season are
presented in Fig. 4. There was about 80% greater KDry compared to KMoist levels at V4 (350
GDD), but only 20% at VE (168 GDD). Amount of variation between KDry and KMoist remained
similar after V12 (GDD 949) at Ada and throughout the season at Gardner and Valley City.
Corn response to potassium fertilization
There was an increase in plant K concentration with an increase in K rate at Ada (Fig. 5).
There was no difference in K level of corn vegetation due to K rate at any sampling date at
Valley City site while Gardner site showed significant difference only at V12 (1180 GDD).
Corn grain yield showed a significant increase in yield and had quadratic relation with K-
rates at Ada site with correlation coefficient (R2=0.99) and Gardner (R2 =0.97) (Table 6). But
other site which initially had a high soil–K showed an increase in yield but it was not statistically
significant.
Discussion
Variation among extracted-K from air-dried and field-moist soil samples
The texture of soils at Ada and Gardner was coarser than those at Valley City. These sites
showed more difference between KMoist and KDry compared to the Valley City site. At all sites,
soil test K tended to decrease as the season progressed and drier conditions were present from
early July to harvest. The percent difference between KDry and KMoist was also less with drier
conditions. There was also a trend of decreasing difference between KDry and KMoist as soil K
18
increased (Table 5). For example, at Ada, the ratio of KDry and KMoist decreased from 2.91 to 0.54
between minimum and maximum value of KDry and KMoist tests.
Temporal variations
Potassium levels decreased during the cropping season as the soil dried and K was taken
up by the growing corn crop (Fig 3(a)). Approximately 95% of the corn K uptake is absorbed
within 54 days from planting (Welch and Flannery, 1985). So, the amount of variation between
KDry and KMoist was similar after V12 at Ada (Fig. 4). Some studies have showed that soil
moisture influences the differences between KDry and KMoist (Barbagelata and Mallarino, 2012);
however, moisture had little effect on variation in these experiments. Analysis of variance
showed non-significant relation of moisture content of soil to percentage change in KDry and
KMoist level.
Corn response to potassium fertilization
An increase in corn K concentration in vegetative tissue is often recorded in fertilizer K
rate experiments (Clover and Mallarino, 2013). An increase in corn plant K concentration was
observed at Ada, but not at Gardner or Valley City. But the corn grain yield showed high
correlation with the K-fertilization. Percentage increase in yield was highest at Ada site while it
was minimal at Valley City. Such response was corroborated with the finding that probability of
getting yield response for soil-K interpretation classes of low and medium category is 50-80%
and 20-50%, respectively (Franzen, 2010). Soils with optimum levels of K provide the required
amount of K to plants even if no additional nutrient is applied.
Barbagelata and Mallarino (2012) found field moist soil samples to be a better predictor
of corn yield rather than dried soil sample analysis. Although dried soil samples allow
convenience in sample handling, and the laboratory procedure, it leads to a difference in
19
alteration in nutrient extractability (Erich and Hoskins, 2011). On the other hand, field moist
samples keep moisture intact and are more likely to represent field conditions.
Summary and conclusions
The extent of variation between KDry and KMoist can be explained by initial soil K levels
of sites. Differences between KDry and KMoist changes as the soil K level decrease during the
growing season. Potassium application increased corn yield at the two sites having very low and
medium soil K status while vegetative K concentration was significantly increased at the site that
had lowest K level. More site data is required to construct the corn response curves to applied K
fertilizers based upon KMoist test results to change the existing K recommendation protocol.
20
Table 1. Average monthly temperature (oC) and precipitation (cm) with 32-year of average recorded at three experimental
sites during growing season (NDAWN).
Average Temperature (oC) Average Precipitation (cm)
Ada Gardner Valley City Ada Gardner Valley City
Month
Past 32
years 2013
Past 32
years 2013
Past 32
years 2013
Past 32
years 2013
Past 32
years 2013
Past 32
years 2013
May 13.4 13.4 14.0 14.1 14.1 13.9 6.85 11.1 6.72 14.1 6.51 10.5
June 18.6 18.5 19.7 19.0 19.9 18.7 6.90 6.14 8.39 19.9 7.92 19.3
July 20.2 21.4 22.0 22.0 21.4 21.6 6.27 1.30 6.52 2.65 6.91 2.01
Aug 20.0 20.0 21.7 20.7 21.0 20.2 5.36 4.00 6.27 1.22 5.98 5.05
Sept 16.4 14.6 18.0 14.8 17.6 14.4 6.19 10.6 5.76 10.6 5.86 9.25
21
Table 2. Corn stage corresponding to growing degree days and days after sowing.
Ada Gardner Valley City
Days after sowing GDD stage Days after sowing GDD stage Days after sowing GDD stage
1 0 V0 1 0 V0 1 0 V0
14 168 VE 13 249 VE 23 266 VE
30 350 V4 34 470 V4 35 492 V4
45 663 V8 45 681 V8 46 772 V8
59 949 V12 54 981 V12 55 1000 V12
71 1180 VT 70 1338 VT 70 1275 VT
85 1360 R1 84 1497 R1 84 1474 R1
98 1580 R2 96 1720 R2 97 1705 R2
139 2235 R6 137 2451 R6 138 2417 R6
22
Table 3. Basic soil properties of initial soil samples collected before planting from three
experimental sites.
Site Soil Series Texture pH EC Organic Matter Bulk Density
µS cm-1 (%) (g cm-3 )
Ada Ulen Loamy sand 8.60 131 4.07 1.59
Gardner Gardena Sandy loam 6.69 94.0 3.33 1.49
Valley City Barnes Loam 6.09 42.0 3.66 1.44
Table 4. Standard air-dried soil K (mg kg-1) of initial soil samples at Ada, Gardner and
Valley City and percent difference in available K (mg kg-1) of field-moist compared to
standard air- dried soil K.
Site Depth KDry
KMoist
Change in KMoist
cm -------mg kg-1----- %
Ada 0-15 47.1 22.8 -51.6
15-30 21.7 22.5 3.74
Gardner 0-15 89.5 41.3 -53.8
15-30 54.3 18.7 -65.5
Valley City 0-15 115 103.11 -10.1
15-30 79.0 50.1 -36.6
23
Table 5. Summary table of K levels of KDry and KMoist tests of three sites during the growing season.
Ada Gardner Valley City
KDry KMoist KDry / KMoist KDry KMoist KDry / KMoist KDry KMoist KDry /KMoist
-------------------------mg K kg-1------------------------------
Mean 42.1 31.9 1.39 75.2 62.3 1.37 156 161 1.12
Max. 121 104 2.91 200 199 3.70 383 398 2.75
Min. 17.3 11.5 0.54 31.4 20.4 0.52 50.9 29.9 0.35
24
Table 6. Corn grain yield for each site as affected by different potassium application rates.
Location
K20 (Kg ha-1) Ada Gardner Valley City
------------------ Mg ha-1------------------
0 6.53 c* 4.84c 9.18 a
33.6 8.14 bc 5.33bc 9.60 a
67.3 9.16 ab 6.09 ab 9.26 a
101 9.93 ab 6.15 ab 9.66 a
135 10.3 ab 6.52 a 9.60 a
168 10.6 a 6.77 a 10.2 a
LSD (α=0.05) 2.06 1.03 ns
*Values followed by the same letter in each column are not significantly different from each
other
25
Figure 1. Relationship between NH4OAc extracted exchangeable K based on field-
moist(KMoist) and air-dried (KDry) soil samples.
y = 0.71x + 31.2
R² = 0.72, P<0.0001
0
100
200
300
400
500
0 200 400
KD
ry
(mg k
g-1
)
KMoist (mg kg-1)
All sitesy = 0.97x + 11.2
R² = 0.55, P<0.0001
0
20
40
60
80
100
120
140
0 50 100 150
KD
ry
(mg k
g-1
)
KMoist (mg kg-1)
Ada
y = 0.61x + 37.4
R² = 0.47, P<0.0001
0
50
100
150
200
250
0 100 200 300
KD
ry
(mg k
g-1
)
KMoist (mg kg-1)
Gardnery = 0.48x + 79.0
R² = 0.42, P<0.0001
0
100
200
300
400
500
0 200 400 600
KD
ry
(mg k
g-1
)
KMoist (mg kg-1)
Valley City
26
Figure 2. Regression analysis of ratio of K extracted from air-dried sample and field-moist
sample and K extracted from field- moist soil sample at different experimental sites.
y = 1E-05x2 - 0.0065x + 1.7124
R² = 0.2613
0.0
0.5
1.0
1.5
2.0
2.5
3.0
3.5
4.0
0 100 200 300 400
KD
ry
/ K
Mo
istra
tio
KMoist (mg kg-1)
All sites
y = 0.0002x2 - 0.02x + 1.20
R² = 0.12
0.0
0.5
1.0
1.5
2.0
2.5
3.0
3.5
0 50 100 150
KD
ry
/ K
Mo
istra
tio
KMoist (mg kg-1)
Ada
y = 0.0001x2 - 0.03x + 2.60
R² = 0.40
0.0
0.5
1.0
1.5
2.0
2.5
3.0
3.5
4.0
0 50 100 150 200 250
KD
ry
/ K
Mo
ist ra
tio
KMoist (mg kg-1)
Gardner
y = 2E-05x2 - 0.01x + 2.25
R² = 0.4762
0.0
0.5
1.0
1.5
2.0
2.5
3.0
0 100 200 300 400
KD
ry
/ K
Mo
istra
tio
KMoist (mg kg-1)
Valley City
27
Figure 3. (a) Changes in plant available soil-K (mg kg-1) of air-dried samples of K0
(control) treatment with growing degree days (GDD). Bars represent standard error (n=4).
(b) Changes in gravimetric soil moisture (%) of soil samples of K0 (control) treatment with
growing degree days (GDD). Bars represent standard deviation (n=4). Different lowercase
letters within a site indicate significant differences at 0.05 significance level.
bcd
ab bc bcd d cd
cab a
cb acb abc
abcbc
bc
ab
bc
a bc
0
50
100
150
200
250
300
16
8
350
66
3
94
9
13
60
15
80
22
35
24
9
47
0
68
1
14
97
17
20
24
51
26
6
49
2
772
12
75
14
74
17
05
24
17
Ada Gardner Valley City
Kd
ry(m
g k
g-1
)
a
bc
ab
a
abc bc
cbc
ab
ab
c
c
a aa
ab
c
b
c
a
0
5
10
15
20
25
30
168
350
663
949
1360
1580
2235
249
470
680
1497
1720
2451
266
492
772
1275
1474
1705
2417
Ada Gardner Valley City
Soil
sam
ple
mois
ture
(%
) b
28
Figure 4. Percent variation of soil test K (mg kg-1) due to air-drying soil as compared to
field-moist soil-K (KMoist) during the growing season at Ada. Bars represent standard error
(n=4). Different lowercase letters within a site indicate significant difference at 0.05
significance level.
b
a
ab
ab
abab
ab
0
20
40
60
80
100
120
168 350 949 1180 1360 1580 2235
% v
ari
iati
on
in
KD
rya
nd
KM
osi
t
Growing degree days
29
* represents the significant differences of plant K (%) between different treatments on specified
GDDs at 0.05 significance level.
Figure 5. Effect of application of different K-rates on plant concentration of K at particular
corn growth stage (GDDs). Bars represent standard error (n=4). Different lowercase letters
within a GDD indicate significant differences at 0.05 significance level.
*
**
* *
*
0.00
0.50
1.00
1.50
2.00
2.50
3.00
3.50
663 949 1180 1366 1580 2235
Pla
nt
K (
%)
Growing Degree Days
AdaK0
K1
K2
K3
K4
K5
30
EVALUATION OF SOIL POTASSIUM TEST FOR RECALIBRATION OF
CORN RESPONSE CURVES
Abstract
Maintenance or improvement of soil fertility to ensure profitable yields is dependent
upon the ability of soil testing procedures to predict relative crop response. The soil potassium
(K) test methodology is under increased evaluation due to the soil sample drying effect, temporal
variations of test results and inconsistent crop response to applied K fertilizers. Ten on-farm
trials were conducted in 2014 in eastern North Dakota to determine the corn response to different
K-fertilizer rates and to assess the variation of soil K test levels between air-dried (KDry) and
field moist (KMoist) soil samples during the corn growing season. Significant differences were
observed between KDry and KMoist soil K test results. The ratio of KDry/KMoist showed high
correlation with cation exchange capacity (r = 0.63), Organic matter (r = 0.61) and (Ca + Mg)/K
ratio (r = 0.64) from the 1M ammonium acetate extractant, while pH, electrical conductivity, clay
(%) and soil moisture showed non-significant correlation. On average, KDry resulted in higher
soil K test levels than KMoist and pattern of deviation was different for surface and sub-surface
soil samples. Soil K analysis of samples collected during the fall and spring showed large enough
variations to affect the soil test interpretation category which is used to make fertilizer
recommendations. Corn yield increased significantly with applied K fertilizer at only three out of
8 sites with beginning K levels below the current critical level of 150 ppm, and one response was
at a site with K level above the critical level. Therefore, use of either the KDry or KMoist method
alone may not be adequate to predict K response in some North Dakota soils.
31
Introduction
The corn growing belt of the United States is shifting north and west of the traditional
Corn Belt due to changing climate patterns and improved corn hybrid varieties with short-season
yield potential. In North Dakota, corn acreage has increased three fold in the last decade and
farmers are becoming more interested in raising corn in some years due to higher economic
returns compared to other crop choices (Fletcher, 2013). Corn yields have increased more than
two folds in North Dakota in past three decades (NASS, 2011). The increase in corn yield in
North Dakota is the net result of improved corn genetics and higher rainfall during the growing
season (Ransom et al., 2004). Since higher yields are often accompanied with high nutrient
removal from the soil (Bender et al., 2013), maintaining an adequate supply of nutrients is the
next major challenge for the corn growers of North Dakota.
Providing an adequate supply of nutrients to corn is important for gaining yield benefits
from other management practices. Corn is known to take up substantial amounts of K during the
growing season. For instance, corn yielding 10.11 Mt/ha, can accumulate about 165 kg ha-1 of
potassium (Hanway, 2007). Crop response to K is not as great as that of N, but K plays a vital
role in every facet of crop growth. Positive correlation has been reported between K content of
crops and photosynthesis, carbohydrate metabolism, lodging and disease resistance (Havlin et
al., 2005). Potassium plays an important role in water uptake and helps in maintenance of yields
in adverse climatic conditions such as drought (Hu and Schmidhalter, 2005; Cakmak 2005; Zorb
et al. 2013). Therefore, maintaining an adequate level of K is important in the rain-fed
agricultural system of North Dakota.
Soil testing is an important diagnostic tool for estimating nutrient supplying capacity of
soils for growing crops. The most widely used procedure for estimating plant-available
32
potassium is extraction of K from air-dried soil samples using 1M ammonium acetate (Haby et
al., 1990). However, air-drying of soil samples is known to collapse or scroll up the clay lattice
structure leading to release or entrapment of K depending upon soil solution K concentration and
clay mineralogy (McLean and Watson, 1985), which can lead to over or under-estimation of soil-
K levels (Wells and Dollarhide, 2000). To overcome this issue, Iowa State University has
reintroduced the procedure of using field-moist soil samples for plant-available K analysis.
Analysis of field-moist soil samples from Iowa for available K have resulted in improved
correlation with corn yields compared to air-dried soil K analysis (Barbagelata et al, 2012).
Therefore, performance of this new methodology needs to be reviewed with the soils of North
Dakota.
Soil K results are not only subject to change due to the air-drying of soil samples, but K
results may also vary depending on the date of sampling (Franzen, 2011).The seasonality effect
is likely due to seasonal variability in moisture (high moisture in winters and comparatively low
moisture towards the end of growing season when soils are driest), K leaching from crop
residues, freezing and thawing, and microbial activity (Murrell, 2011). Switching from fall to
spring sampling can lead to significant changes in soil K values, affecting the rate of K-fertilizer
application (Vitko et al., 2010). Therefore, a better understanding of fluctuations of soil K level
during the growing season will be helpful in improving K-fertilizer recommendations.
In North Dakota, fertilizer recommendations for corn were formulated in the late 1970’s
and early 1980’s when yields were much lower than they are today. The new corn varieties for
the region are much more productive and generally soil tests K levels are much lower today.
33
To address the increase in corn acres in North Dakota, the relevance of the current soil K
test and response of modern corn hybrids to K fertilizer, a study was conducted with three main
objectives:
1.) To compare soil K test values based on air-dried and field moist samples,
2) To determine the effect of sampling time on soil K test levels during the corn growing
season.
3) To determine the corn response to applied K-fertilizer based on the predictability the
soil K test.
Materials and methods
Site descriptions
During 2014, trials were conducted at ten locations in the eastern part of North Dakota
including the Cass, Barnes, Richland and Sargent counties (Figure 6). All of these sites are
involved in agricultural production with corn and soybean as the main crops. These areas have a
humid-continental climate with mean precipitation about 55 cm and mean temperature varying
about 5 oC (Mean of temperature and precipitation from 1981 to 2010).
Soil series descriptions are listed in Table 7. Most of these soils are developed from
glacial lacustrine sediments, glacial outwash or till/moraines with somewhat poorly drained to
well drained characteristics.
Experimental design
Each experimental location was established with a minimum distance of 30 m from the
field edge. The experimental design of the trials was a randomized complete block design with
six K-fertilizer treatments and four replications. Nine of the total sites received a fertilizer
application of potassium chloride-KCl (0-0-60) at the rate of 0 (K0), 33.6 (K1), 67.2 (K2), 100.9
34
(K3), 134.5 (K4), K5-168.1 (K5) K2O kg ha-1 while the Milnor site received K application of 0
(K0), 67.2 (K1), 134.5 (K2), 201.7 (K3), 269.0 (K4), K5-336.2 (K5) K2O kg ha-1. Dimensions of
all plots were 9.14 m long by 3.05 m wide, with a 1.52 m of alley between each replication. The
alleyways were cut out when the corn had 8-12 leaves. Planting and all agronomic and cultural
operations were carried out by the farmers and were uniform for all plots within a location. Corn
was produced at each site. Corn production practices are listed in Table 8. The farmer did not
apply K fertilizer within the boundaries of experimental plots. When the grower applied K with
N or P fertilizer, the plot area was excluded from his field application and N, P and any other
nutrients determined necessary by the pre-plant soil test were broadcast applied by the
researchers.
Soil sampling
Initial composite soil samples were collected from 0-15 cm depth from each site before
planting and were analyzed for plant available nutrients and other basic soil properties. During
the growing season, soil samples were collected from the control plots (plots with no K-fertilizer
application) twice each month with an interval of about 15 days. A 2.5 cm diameter Hofer soil
tube was used to take the samples from the 0-15 cm and 15-30 cm depth throughout the growing
season .Soil samples were not taken from 15-30 cm on the second August sampling at Page and
Valley City due to soil hardness. Soil samples were collected by taking four to five cores at each
depth from the interior inter-row area within each plot. Samples from each depth were then
composited and stored in zip-lock polythene bags to maintain the moisture level comparable to
the field conditions. Samples were transported in a cooler to the laboratory and stored in
laboratory refrigerator at 7 oC for one to three weeks.
35
Laboratory analysis
Initial soil samples
Initial composite soil samples were analyzed for pH, N, P, K, EC and organic matter by
the NDSU Soil and Water Testing Laboratory using approved methods for the North Central
Region of the USA (Table 9). Soil texture was determined by a hydrometer method (Elliot et al,
1999) and bulk density was analyzed using soil core method which involves taking soil sample
with a soil probe with a defined volume and oven-drying the sample for at least 24 hours to
obtain the mass of soil solids (Blake and Hartge, 1986). Cation exchange capacity of the soil was
determined by saturating the soil with 1M sodium acetate solution and then washing the soil with
90% ethanol solution and replacing the sodium ions from exchange complex using 1 M
ammonium acetate (Chapman, 1965).
Methodology for KDry and KMoist
Each soil sample was thoroughly mixed and subdivided into two sub-samples. One of
them was analyzed with standard procedure of soil K test which involves air-drying of soil,
grinding and passing through 2 mm sieve. Two grams of air-dried sample was extracted with 20
ml of 1M NH40Ac, shaken for 5 min and filtered through Whatman No. 2 filter paper.
Gravimetric water content of air-dried and field-moist soil was determined by oven drying a sub-
sample at 105o C for at least 24 hours (Black, 1965). For KMoist, sub-sample was not air-dried but
was sieved through a 2 mm sieve. Two grams of sieved field-moist soil was treated with 20 ml of
NH4OAc by adjusting the molarity of extracting solution to 1M according to the moisture content
of the sample. The resulting slurry was then shaken for 5 min and filtered through Whatman No-
2 filter paper. Soil K concentration of filtrate was determined with necessary dilutions using a
36
Buck Scientific Atomic Absorption Spectrometer - Model 200A (Norwalk, CT, USA) using
766.5 nm wavelength.
Yield analysis
For yield analysis, corn ears were harvested from one of the middle two rows leaving first
and last plant in each row. Ears were shelled and grain weight was measured in grams. Grain
moisture and test weight were measured using Dickey-John Grain Moisture tester (GAC500
XT). Grain yield was calculated in kg ha-1 adjusted to 15.5% grain moisture content.
Statistical analysis
Statistical software - SAS 9.3 and SAS Enterprise Guide 4.3 were used for data analyses.
A paired t-test was used to compare KDry and KMoist results. Linear regression was imposed on
KDry and KMoist collectively over all sites as well as separately at very low, low, medium, high
and very high K soil test K-levels. Pearson correlation coefficients were used to evaluate the
relationship of KDry/KMoist ratio with clay content, soil moisture, cation exchange capacity,
organic matter, and (Ca + Mg)/K at p<0.10. Analysis of variance for yield response was
calculated by SAS PROC GLM procedure using Randomized Complete Block Design with K-
fertilizer rates as the main factor. Means of main effects were compared using Fisher’s least
significant difference (LSD) at 90% confidence level.
Results and discussions
Basic soil properties
Initial soil test results of all experimental sites are presented in Table 9. The pH of soils
ranged from moderately acidic to moderately alkaline (Soil Survey Division Staff, 1993). Based
upon the EC levels, all sites had non-saline soils (Whitney, 1998). Seven of the total sites had
sandy loam texture, while two of them had loam and one of the sites was categorized as loamy
37
sand. Organic matter determined by loss of weight on Ignition method (Combs and Nathan,
1998) ranged from 1.5 % to 3.1%. The CEC level of soils varied from 10.6 to 23.1 cmol kg-1.
Comparison of soil potassium test based upon air-dried and field moist samples
Soil test-K values of surface soil samples (0- 15 cm depth) determined by KDry ranged
from 21 ppm to 824 ppm across all sites with an average of 93 ppm. The KMoist test values had an
average of 99 ppm with K values ranging from 14 ppm to 837 ppm. Based on the paired t-test
results, overall KDry test results were significantly different from KMoist levels for surface as well
as subsurface soils. The results of paired-t test of each site at specific sampling time are listed in
appendix (Table A). On average, KDry test of surface soils (0-15 cm) were 1.07 times higher in K
compared to KMoist values but the change of Soil K test varied between soils. Out of 366 soil
samples, 47% showed a decrease in K content upon drying while 53% of samples showed an
increase in K content. The ratio of KDry/KMoist varied from 0.32 to 2.66 across all sites for surface
soil samples. The KDry of sub-surface soil samples (15-30 cm) was 1.52 times greater in K
content compared to KMoist. Only 20% of the total samples showed a decrease in K content upon
drying while 80% samples showed an increase in K values. The linear trend line deviated from
the 1:1 line, with the greatest difference in the high and very high K range (Fig 7). Such variation
in soil K levels of moist and dried soil samples had been observed in various earlier studies in
Iowa (Luebs et al., 1956; Barbagelata and Mallarino, 2012)
Since the variation between KDry and KMoist was different for different sites throughout
the growing season, probable factors that might contribute to the difference in drying response
were correlated to the KDry/KMoist ratio and summarized in Table 10.
Soil moisture content was poorly correlated (r = -0.02) with KDry/KMoist ratio. Similar
conclusions were found by Barbagelata and Mallarino (2012) who determined r2 = 0.03 between
38
KDry and KMoist ratio and soil moisture in Iowa. Burns and Barber (1961) also showed no
significant relation of soil moisture to release of exchangeable K upon soil drying.
Clay percentage of initial soil samples was not significantly correlated with ratio of
KDry/KMoist (r = 0.45, p = 0.19). Texture has previously been reported as the main factor for
influencing of the degree of K release or fixation (Barber et al., 1961). However, clay type may
have influenced the KDry/KMoist ratio (Dowdy and Hutcheson, 1963). Presence of illite is usually
responsible for release while montmorillonite (a smectitic clay) is known to fix K (McLean and
Watson, 1985). Analysis of clay mineralogy of all these sites might be more helpful in
explaining the release and fixation of K upon drying than the determination of clay content of
soil per se.
Ratio of (Ca+Mg)/ K was significantly correlated with KDry/KMoist with a correlation
coefficient r = 0.64 (p<0.10). A relationship between (Ca+Mg)/ K and KDry/KMoist was also
reported by Barbagelata and Mallarino (2012). It signifies that the concentration of cations
present in soil solution can affect the release and fixation of K upon drying. It occurs because
cations such as calcium which show high affinity for negative charged clays can compete with
potassium ions for K fixation inducing wedge zones within clay interlayers which results in a
release of K ions into the soil solution (Sparks and Huang, 1985.)
KDry and KMoist were significantly related for both depths (0-15 cm and 15-30 cm).
Potassium levels of sub-soil samples were always lower in K compared to surface soil samples.
Overall, sub-surface soils showed an appreciable increase in K levels in KDry compared to KMoist
tests of surface soil samples (Fig 7). Since the sub-surface soils are less prone to weathering
compared to surface soils, thereby, they show a high potential of release of K upon drying
(McLean and Watson, 1985).
39
KDry compared to KMoist were significantly related in very low, low and very high
category K soils (Fig. 8). When the KDry content was below 120 ppm, K was released upon
drying. Dry K analysis gave lower K values when the soils had >120 ppm initial K. Barbagelata
and Mallarino (2012) results agree with these data where an exponential decrease of KDry/KMoist
ratios was observed as soil K levels were increased.
Cation exchange capacity was correlated (r= 0.63, p < 0.10) with the KDry/KMoist ratio.
The CEC of a soil partially depends upon the amount and type of clay minerals. CEC was
observed to be positively related to the change of K levels in the soil samples when exposed to
drying (Barbagelata, 2006)
KDry/KMoist ratio was significantly related to organic matter content with a correlation
coefficient of r = 0.61(p<0.10). The relationship of organic matter (non- volatile organic
compounds) to the release of K from soils upon drying is also noted by Welch and Flannery
(1985) where organic compounds were found to retard the process of diffusion of K from
interlayer of clay minerals.
As the season progressed, the difference between KDry and KMoist also changed (Fig 9, 10
and 11). During April, with the exceptions of the Milnor and Arthur sites, KMoist levels were
greater than KDry. By late September, this trend was reversed; KDry levels were greater K
compared to KMoist.
Effect of time of sampling on soil K test results
Soil KDry levels of all sites decreased as the growing season progressed (Fig. 9, 10 and
11). This change was greater in Very high- K soils as compared to low K soils. There was a
decrease of 265 ppm of K content at Valley City (Very high K –site) at the end of September as
compared to those collected the previous April. In comparison, the decrease in K between April
40
and September was only 25 ppm at Walcott West (Low K site). Greater variation of K levels in
high K soils was also reported previously (Lockman and Molloy, 1984). Temporal change of soil
K level was significantly correlated with soil moisture content at three sites (Buffalo, Walcott
East and Wyndmere) while temporal changes of K at other sites were poorly correlated with soil
moisture content. An increase in non-exchangeable K was also observed by September in all
sites except at Valley City. The temporal variation of soil K can at least be partially attributed to
changing soil moisture and a reversion of exchangeable K to non-exchangeable forms. In
addition, plant uptake during the growing season and leaching of K after physiological maturity
until harvesting have been reported as the other possible factors responsible for temporal K
variations (Murrell, 2011).
Except at the Valley City site, soil K level of all sites dropped to Very low and Low
categories with time (Table 11). Lower K levels during the fall may mislead farmers in applying
fertilizer K rates for next year’s crop. However, soil K levels usually recover during the winter
season due to freezing and thawing effect and leaching of K from the crop residues, and
comparatively higher exchangeable K is observed in April and May (Fine et al, 1940; Mallarino,
2011). It may be necessary to construct critical levels for early fall and June soil sampling, where
the soil K levels are more stable over a practical length of time.
Among the KDry and KMoist soil test results, moist K soil levels were observed to be more
variable within a corn growing season. Except for Arthur site, the coefficient of variation was
greater for KMoist soil results compared to KDry for all other sites (Table 12). Some possible
reasons for higher variation in KMoist results could be the manual error during molarity
adjustments of extracting solution and while mixing of the moist samples to get a representative
sample. This indicates that the current methodology used in determining soil K involving air-
41
drying as a pre-treatment, have more potential in providing precise estimates of K levels over a
growing season.
Corn response to applied K fertilizer rates
Experimental locations were quite variable in K- status, varying from 80 ppm to 485 ppm
of plant available KDry levels. According to North Dakota’s published K fertility categories
(Franzen, 2010), five of the sites had medium soil K level, three had soil K levels in the very
high category while low and high categories were represented by one site each. Potassium in the
profile was stratified; surface samples (0-15 cm) had higher K levels than the sub-surface layer
(15-30 cm). Corn grain yield was increased at four sites at the 10% probability level compared to
plots receiving no K application. Maximum yield was obtained at 101 kg ha-1 fertilizer rate at 5
sites and at 67 kg ha-1 K rate over 4 out of 10 sites. None of the sites gave highest yield at
maximum K fertilizer rate of 168 kg/ha of K. Only one site achieved maximum response at 134
kg/ha of K rate (Table 13).
The present K category recommendations based on KDry predicted crop response at only 3
of 10 locations. The KMoist did not improve crop response prediction. In addition, the non-
exchangeable K levels were not helpful in predicting crop response.
North Dakota experienced frequent rain in the spring and summer of 2014 (NDAWN,
http://ndawn.ndsu.nodak.edu/) and good soil moisture conditions were maintained until August.
Favorable soil moisture conditions promotes diffusion of K+ ions (Schaff and skogley, 1982;
Zeng and Brown, 2000; Mackay and Barber, 1985) and may have resulted in comparable yields
of control plots as that of plots receiving K-fertilizer.
42
Based upon the observations of corn response to applied fertilizers, it can be concluded
that a refined strategy is required to better predict corn yield response, or a different soil testing
method is required for prediction improvement.
Summary and conclusions
Air-drying of soil samples prior to soil analysis of plant-available K significantly affected
soil K test results. Change of soil K test levels due to air-drying was not consistently increased or
decreased, and was found to be significantly related to cation exchange capacity, organic matter
and (Ca+Mg)/K ratio of the soil samples. Soil moisture content, clay content, pH and EC showed
minimal influence over KDry/KMoist ratios. Time of soil sampling had considerable effect on soil
K levels as well as KDry/KMoist ratios. Temporal K- variations of soil samples collected in fall and
spring were large enough to change the soil test interpretation category of a site for making
fertilizer recommendations, unless soil test interpretations were constructed for different
sampling times. Corn response to applied K fertilizer was site specific and only related to initial
soil K levels at three of ten sites.
Based upon these results, it can be concluded that air-drying of soil sample prior to soil K
analysis alters the actual plant available-K levels, but KMoist is not a better predictor of corn yield
response compared with KDry. The extent of K variation is dependent upon various factors and is
likely to change over the time. Corn K response curves needs re-calibration in North Dakota.
Moreover, soil K levels along with time of sampling, soil moisture dynamics and plant’s nutrient
utilization potential should be taken into consideration when making K-fertilizer
recommendations.
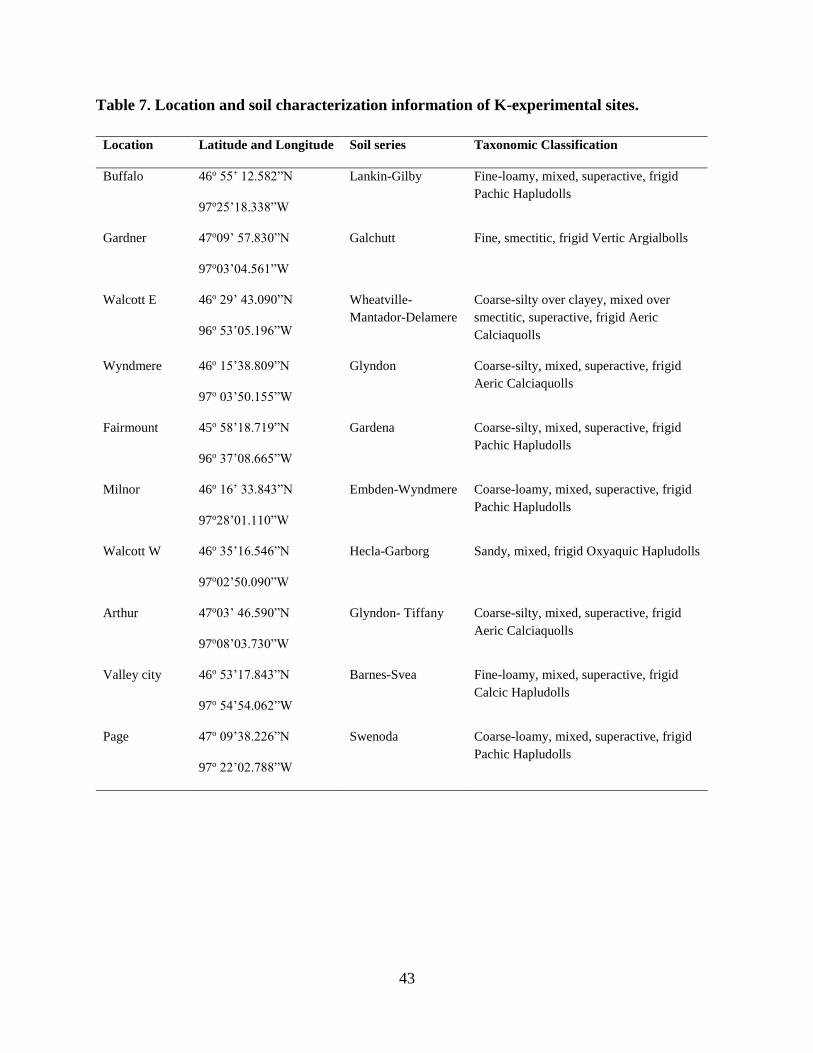
43
Table 7. Location and soil characterization information of K-experimental sites.
Location Latitude and Longitude Soil series Taxonomic Classification
Buffalo 46o 55’ 12.582”N Lankin-Gilby Fine-loamy, mixed, superactive, frigid
Pachic Hapludolls
97o25’18.338”W
Gardner 47o09’ 57.830”N Galchutt Fine, smectitic, frigid Vertic Argialbolls
97o03’04.561”W
Walcott E 46o 29’ 43.090”N Wheatville-
Mantador-Delamere
Coarse-silty over clayey, mixed over
smectitic, superactive, frigid Aeric
Calciaquolls
96o 53’05.196”W
Wyndmere 46o 15’38.809”N Glyndon Coarse-silty, mixed, superactive, frigid
Aeric Calciaquolls
97o 03’50.155”W
Fairmount 45o 58’18.719”N Gardena Coarse-silty, mixed, superactive, frigid
Pachic Hapludolls
96o 37’08.665”W
Milnor 46o 16’ 33.843”N Embden-Wyndmere Coarse-loamy, mixed, superactive, frigid
Pachic Hapludolls
97o28’01.110”W
Walcott W 46o 35’16.546”N Hecla-Garborg Sandy, mixed, frigid Oxyaquic Hapludolls
97o02’50.090”W
Arthur 47o03’ 46.590”N Glyndon- Tiffany Coarse-silty, mixed, superactive, frigid
Aeric Calciaquolls
97o08’03.730”W
Valley city 46o 53’17.843”N Barnes-Svea Fine-loamy, mixed, superactive, frigid
Calcic Hapludolls
97o 54’54.062”W
Page 47o 09’38.226”N Swenoda Coarse-loamy, mixed, superactive, frigid
Pachic Hapludolls
97o 22’02.788”W
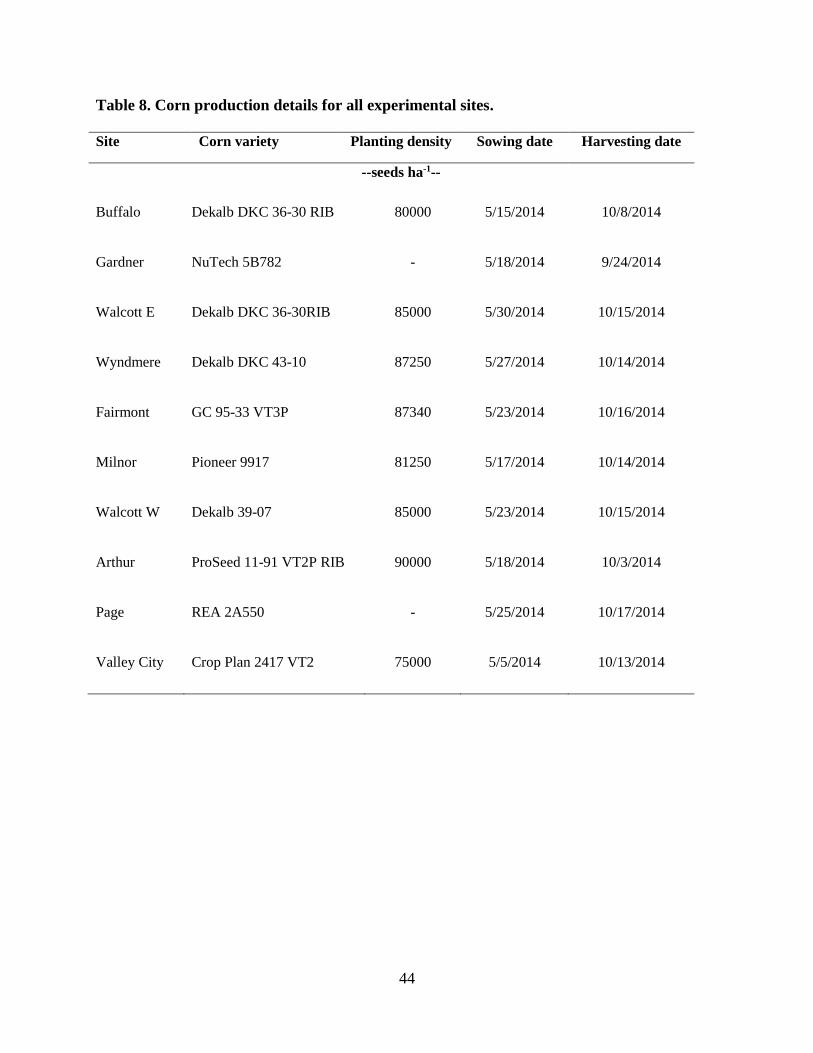
44
Table 8. Corn production details for all experimental sites.
Site Corn variety Planting density Sowing date Harvesting date
--seeds ha-1--
Buffalo Dekalb DKC 36-30 RIB 80000 5/15/2014 10/8/2014
Gardner NuTech 5B782 - 5/18/2014 9/24/2014
Walcott E Dekalb DKC 36-30RIB 85000 5/30/2014 10/15/2014
Wyndmere Dekalb DKC 43-10 87250 5/27/2014 10/14/2014
Fairmont GC 95-33 VT3P 87340 5/23/2014 10/16/2014
Milnor Pioneer 9917 81250 5/17/2014 10/14/2014
Walcott W Dekalb 39-07 85000 5/23/2014 10/15/2014
Arthur ProSeed 11-91 VT2P RIB 90000 5/18/2014 10/3/2014
Page REA 2A550 - 5/25/2014 10/17/2014
Valley City Crop Plan 2417 VT2 75000 5/5/2014 10/13/2014
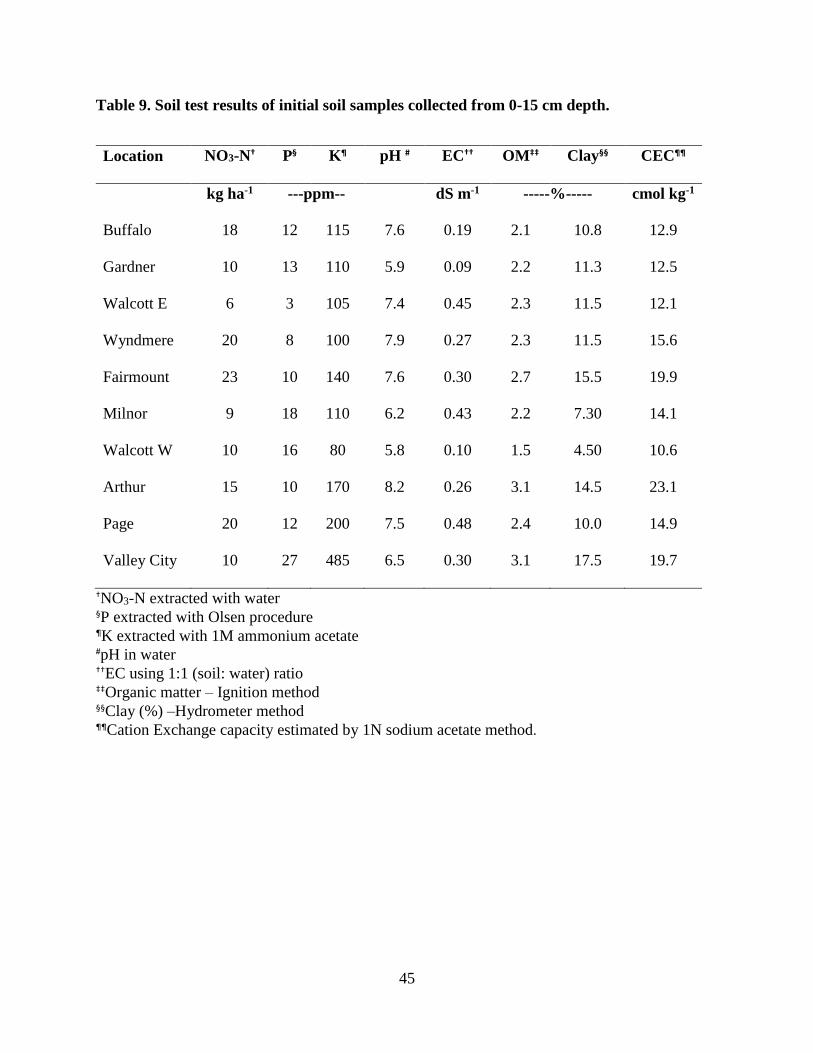
45
Table 9. Soil test results of initial soil samples collected from 0-15 cm depth.
Location NO3-N† P§ K¶ pH # EC†† OM‡‡ Clay§§ CEC¶¶
kg ha-1 ---ppm-- dS m-1 -----%----- cmol kg-1
Buffalo 18 12 115 7.6 0.19 2.1 10.8 12.9
Gardner 10 13 110 5.9 0.09 2.2 11.3 12.5
Walcott E 6 3 105 7.4 0.45 2.3 11.5 12.1
Wyndmere 20 8 100 7.9 0.27 2.3 11.5 15.6
Fairmount 23 10 140 7.6 0.30 2.7 15.5 19.9
Milnor 9 18 110 6.2 0.43 2.2 7.30 14.1
Walcott W 10 16 80 5.8 0.10 1.5 4.50 10.6
Arthur 15 10 170 8.2 0.26 3.1 14.5 23.1
Page 20 12 200 7.5 0.48 2.4 10.0 14.9
Valley City 10 27 485 6.5 0.30 3.1 17.5 19.7
†NO3-N extracted with water §P extracted with Olsen procedure ¶K extracted with 1M ammonium acetate #pH in water ††EC using 1:1 (soil: water) ratio ‡‡Organic matter – Ignition method §§Clay (%) –Hydrometer method ¶¶Cation Exchange capacity estimated by 1N sodium acetate method.
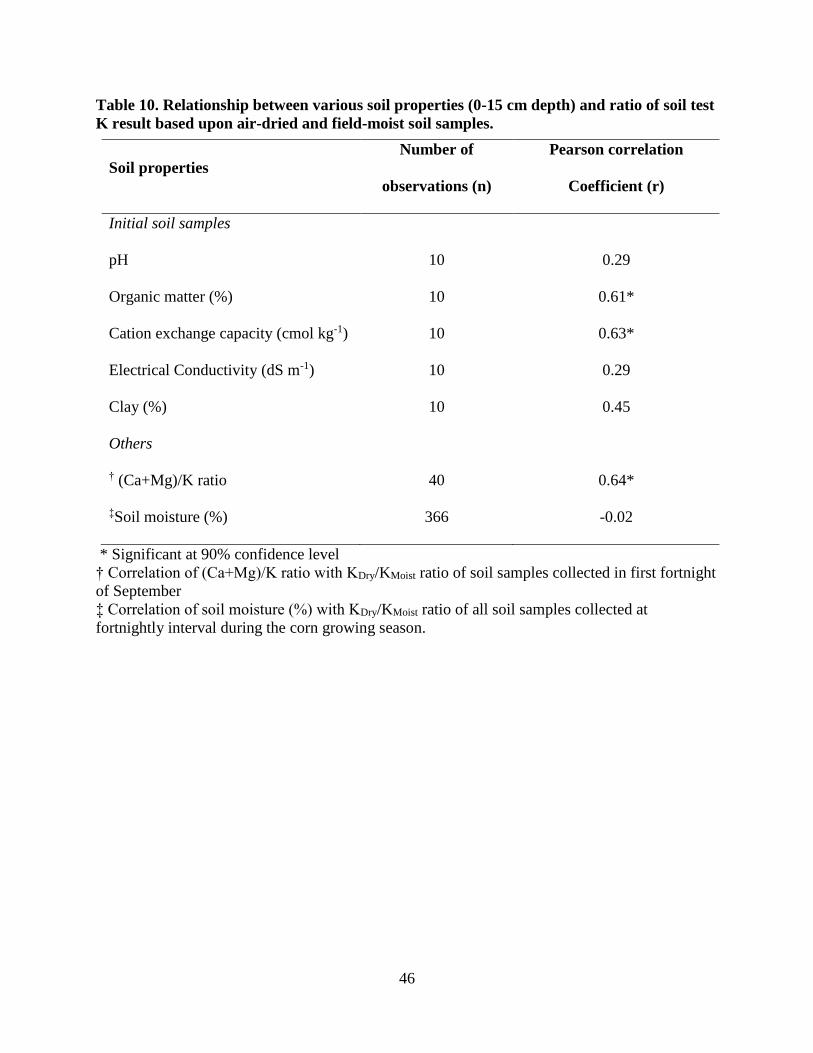
46
Table 10. Relationship between various soil properties (0-15 cm depth) and ratio of soil test
K result based upon air-dried and field-moist soil samples.
* Significant at 90% confidence level
† Correlation of (Ca+Mg)/K ratio with KDry/KMoist ratio of soil samples collected in first fortnight
of September
‡ Correlation of soil moisture (%) with KDry/KMoist ratio of all soil samples collected at
fortnightly interval during the corn growing season.
Soil properties
Number of
observations (n)
Pearson correlation
Coefficient (r)
Initial soil samples
pH 10 0.29
Organic matter (%) 10 0.61*
Cation exchange capacity (cmol kg-1) 10 0.63*
Electrical Conductivity (dS m-1) 10 0.29
Clay (%) 10 0.45
Others
† (Ca+Mg)/K ratio 40 0.64*
‡Soil moisture (%) 366 -0.02
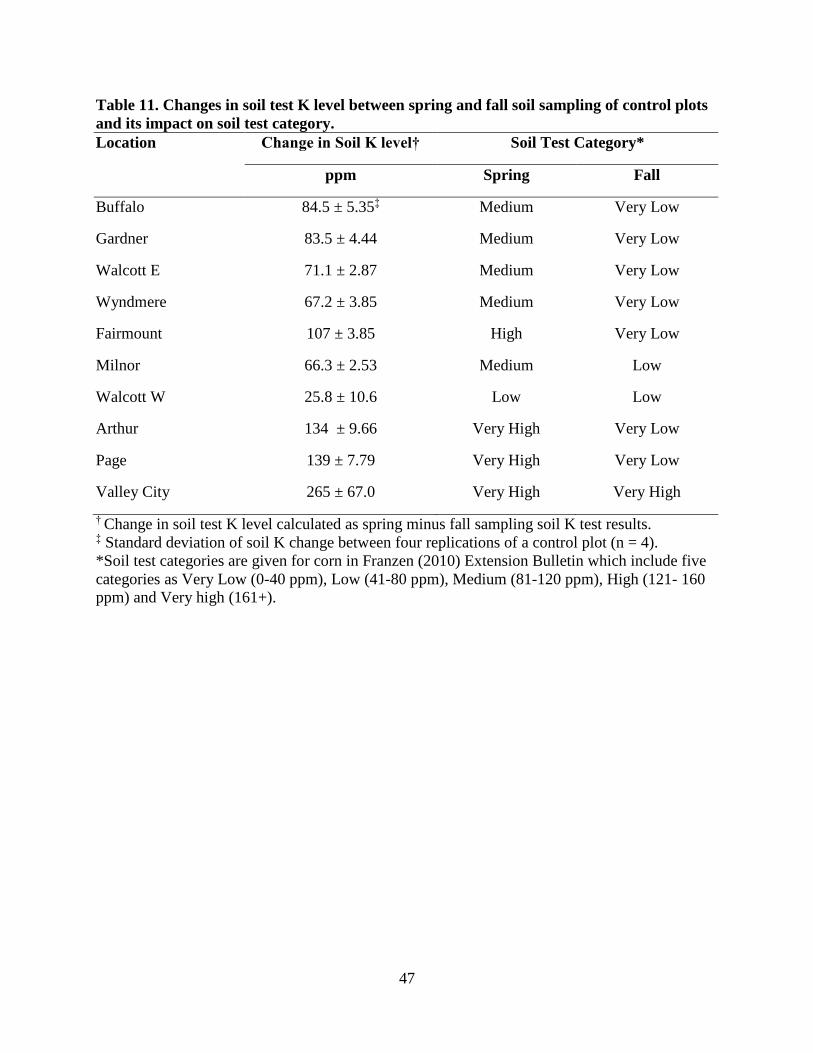
47
Table 11. Changes in soil test K level between spring and fall soil sampling of control plots
and its impact on soil test category.
Location Change in Soil K level† Soil Test Category*
ppm Spring Fall
Buffalo 84.5 ± 5.35‡ Medium Very Low
Gardner 83.5 ± 4.44 Medium Very Low
Walcott E 71.1 ± 2.87 Medium Very Low
Wyndmere 67.2 ± 3.85 Medium Very Low
Fairmount 107 ± 3.85 High Very Low
Milnor 66.3 ± 2.53 Medium Low
Walcott W 25.8 ± 10.6 Low Low
Arthur 134 ± 9.66 Very High Very Low
Page 139 ± 7.79 Very High Very Low
Valley City 265 ± 67.0 Very High Very High
† Change in soil test K level calculated as spring minus fall sampling soil K test results. ‡ Standard deviation of soil K change between four replications of a control plot (n = 4).
*Soil test categories are given for corn in Franzen (2010) Extension Bulletin which include five
categories as Very Low (0-40 ppm), Low (41-80 ppm), Medium (81-120 ppm), High (121- 160
ppm) and Very high (161+).
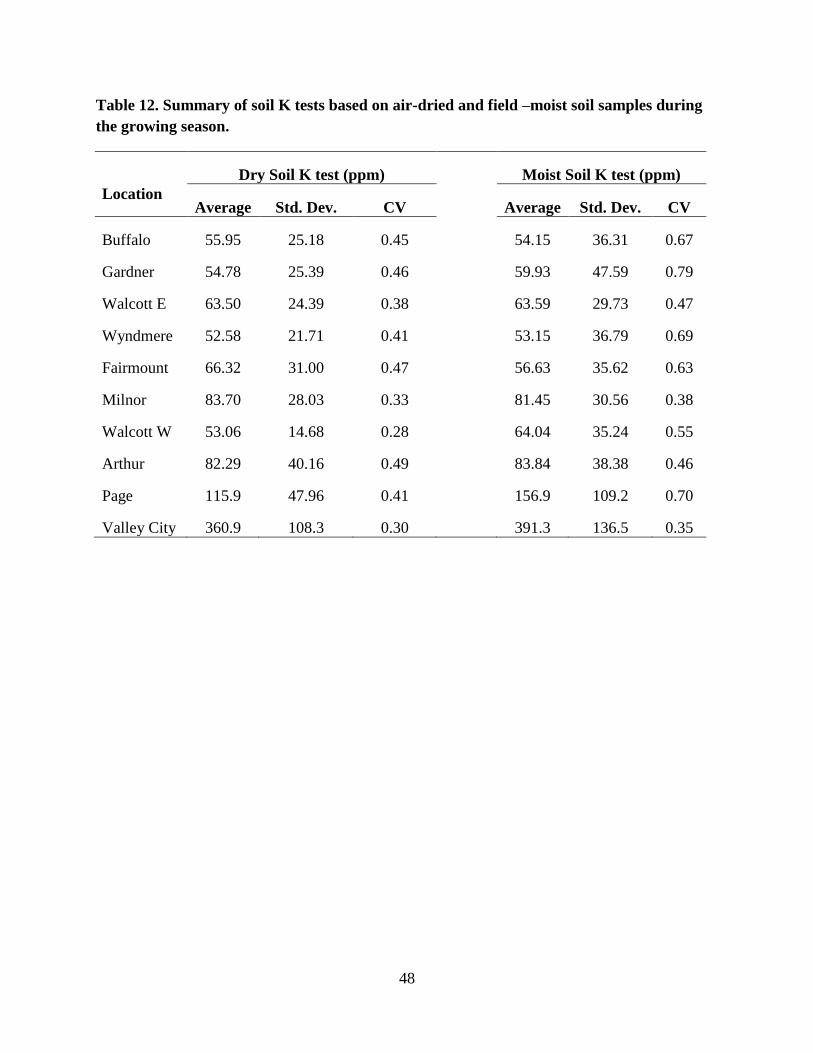
48
Table 12. Summary of soil K tests based on air-dried and field –moist soil samples during
the growing season.
Dry Soil K test (ppm)
Moist Soil K test (ppm)
Location Average Std. Dev. CV
Average Std. Dev. CV
Buffalo 55.95 25.18 0.45
54.15 36.31 0.67
Gardner 54.78 25.39 0.46
59.93 47.59 0.79
Walcott E 63.50 24.39 0.38
63.59 29.73 0.47
Wyndmere 52.58 21.71 0.41
53.15 36.79 0.69
Fairmount 66.32 31.00 0.47
56.63 35.62 0.63
Milnor 83.70 28.03 0.33
81.45 30.56 0.38
Walcott W 53.06 14.68 0.28
64.04 35.24 0.55
Arthur 82.29 40.16 0.49
83.84 38.38 0.46
Page 115.9 47.96 0.41
156.9 109.2 0.70
Valley City 360.9 108.3 0.30
391.3 136.5 0.35
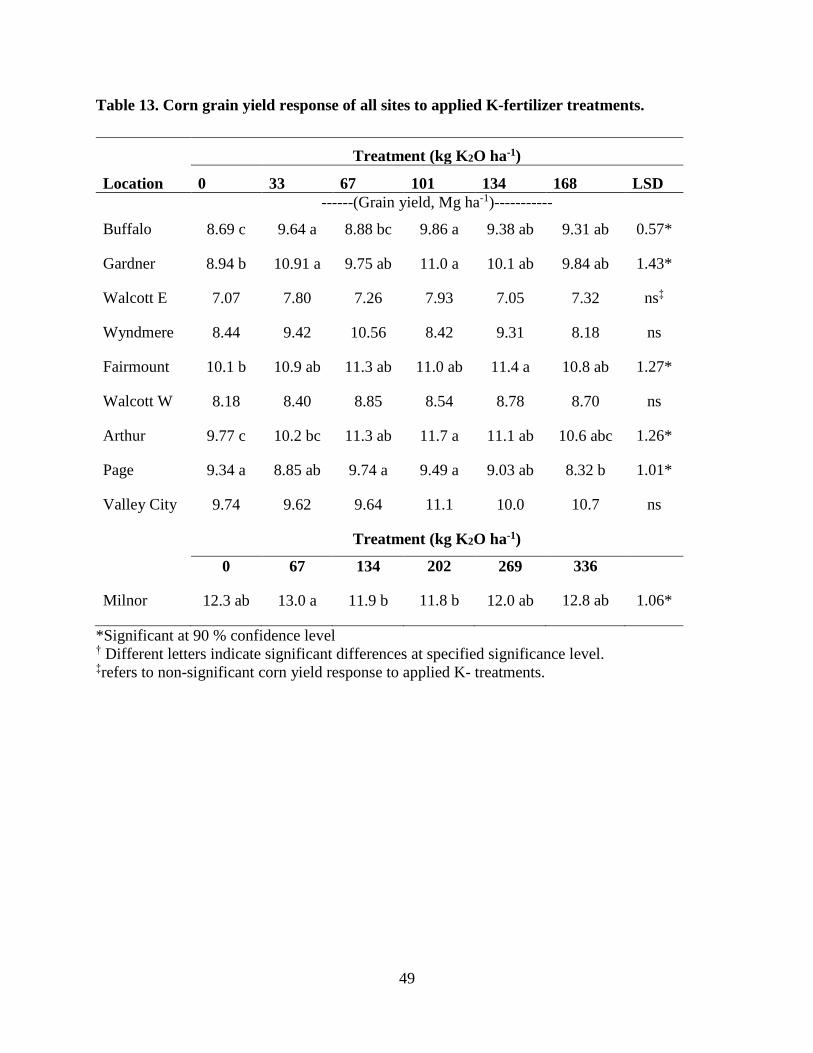
49
Table 13. Corn grain yield response of all sites to applied K-fertilizer treatments.
*Significant at 90 % confidence level † Different letters indicate significant differences at specified significance level. ‡refers to non-significant corn yield response to applied K- treatments.
Treatment (kg K2O ha-1)
Location 0 33 67 101 134 168 LSD
------(Grain yield, Mg ha-1)-----------
Buffalo 8.69 c 9.64 a 8.88 bc 9.86 a 9.38 ab 9.31 ab 0.57*
Gardner 8.94 b 10.91 a 9.75 ab 11.0 a 10.1 ab 9.84 ab 1.43*
Walcott E 7.07 7.80 7.26 7.93 7.05 7.32 ns‡
Wyndmere 8.44 9.42 10.56 8.42 9.31 8.18 ns
Fairmount 10.1 b 10.9 ab 11.3 ab 11.0 ab 11.4 a 10.8 ab 1.27*
Walcott W 8.18 8.40 8.85 8.54 8.78 8.70 ns
Arthur 9.77 c 10.2 bc 11.3 ab 11.7 a 11.1 ab 10.6 abc 1.26*
Page 9.34 a 8.85 ab 9.74 a 9.49 a 9.03 ab 8.32 b 1.01*
Valley City 9.74 9.62 9.64 11.1 10.0 10.7 ns
Treatment (kg K2O ha-1)
0 67 134 202 269 336
Milnor 12.3 ab 13.0 a 11.9 b 11.8 b 12.0 ab 12.8 ab 1.06*
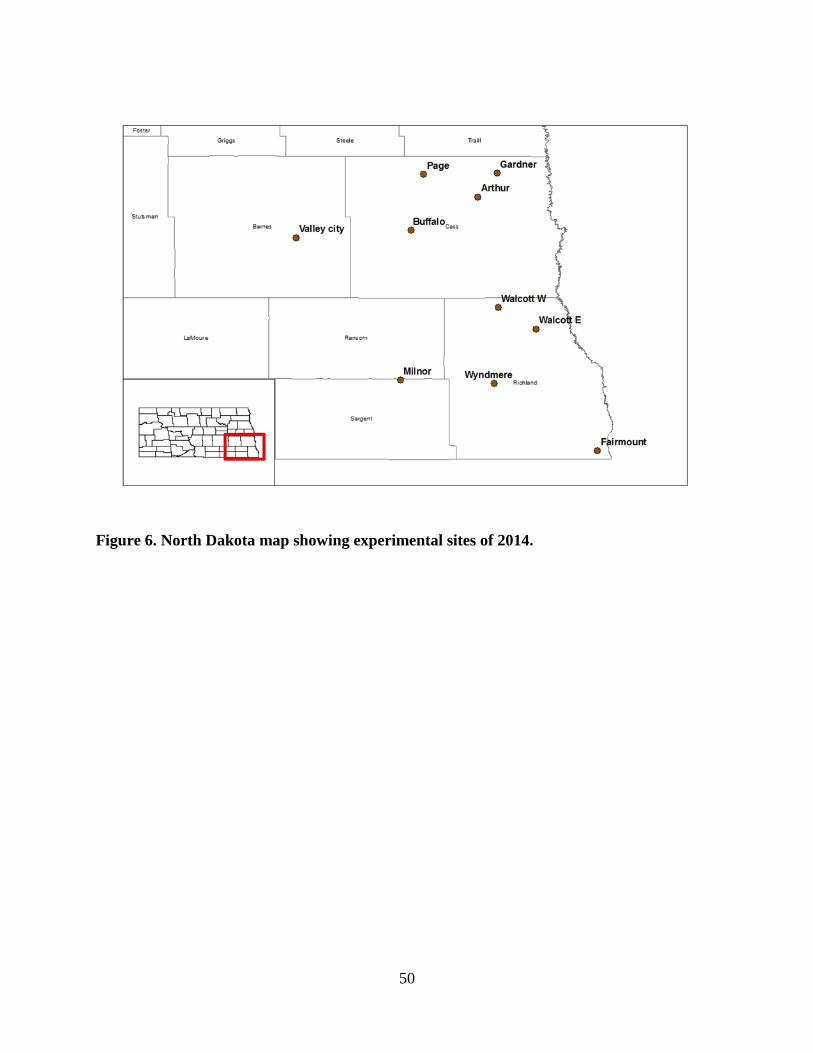
50
Figure 6. North Dakota map showing experimental sites of 2014.
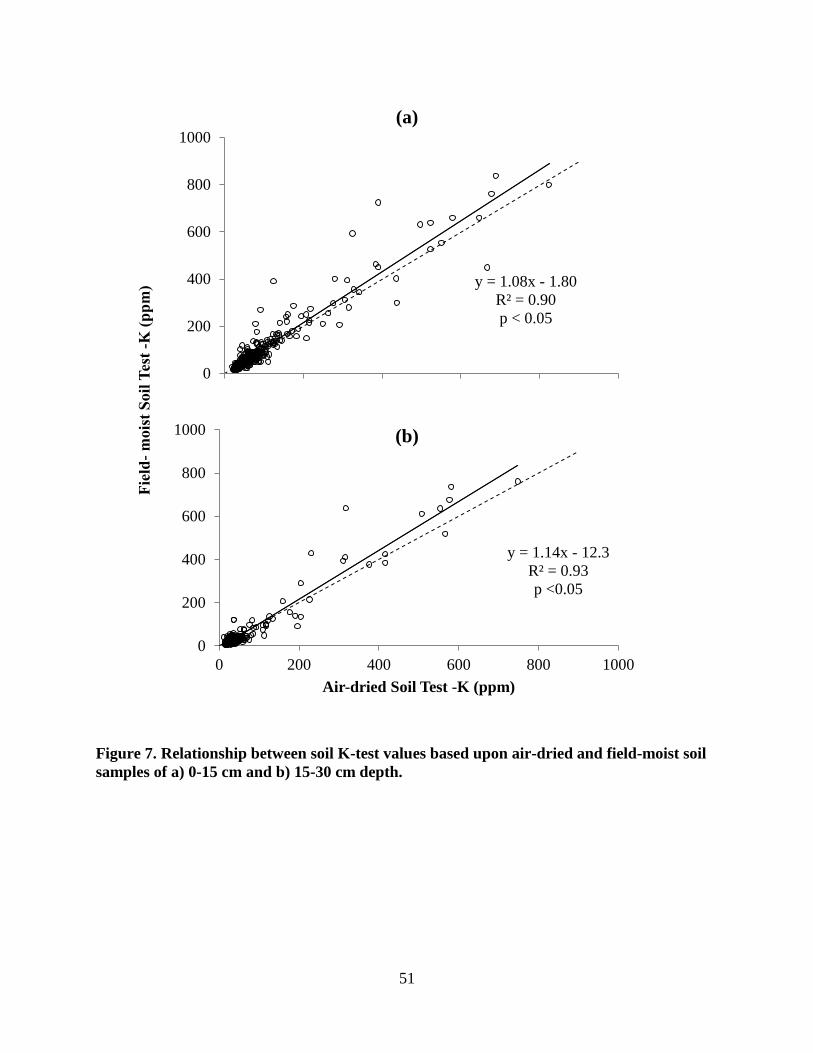
51
Figure 7. Relationship between soil K-test values based upon air-dried and field-moist soil
samples of a) 0-15 cm and b) 15-30 cm depth.
y = 1.08x - 1.80
R² = 0.90
p < 0.05
0
200
400
600
800
1000
(a)
y = 1.14x - 12.3
R² = 0.93
p <0.05
0
200
400
600
800
1000
0 200 400 600 800 1000
Air-dried Soil Test -K (ppm)
(b)
Fie
ld-
mois
t S
oil
Tes
t -K
(p
pm
)
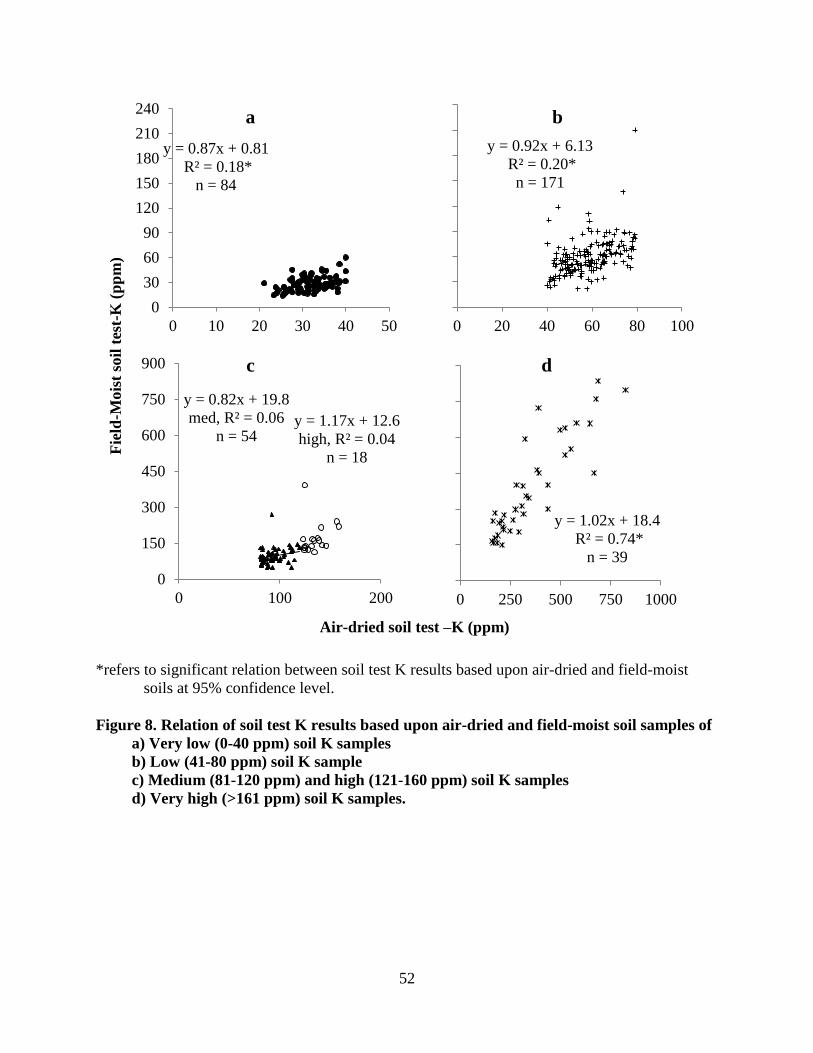
52
*refers to significant relation between soil test K results based upon air-dried and field-moist
soils at 95% confidence level.
Figure 8. Relation of soil test K results based upon air-dried and field-moist soil samples of
a) Very low (0-40 ppm) soil K samples
b) Low (41-80 ppm) soil K sample
c) Medium (81-120 ppm) and high (121-160 ppm) soil K samples
d) Very high (>161 ppm) soil K samples.
y = 0.87x + 0.81
R² = 0.18*
n = 84
0
30
60
90
120
150
180
210
240
0 10 20 30 40 50
a
y = 0.92x + 6.13
R² = 0.20*
n = 171
0 20 40 60 80 100
b
y = 0.82x + 19.8
med, R² = 0.06
n = 54y = 1.17x + 12.6
high, R² = 0.04
n = 18
0
150
300
450
600
750
900
0 100 200
c
y = 1.02x + 18.4
R² = 0.74*
n = 39
0 250 500 750 1000
d
Air-dried soil test –K (ppm)
Fie
ld-M
ois
t so
il t
est-
K (
pp
m)
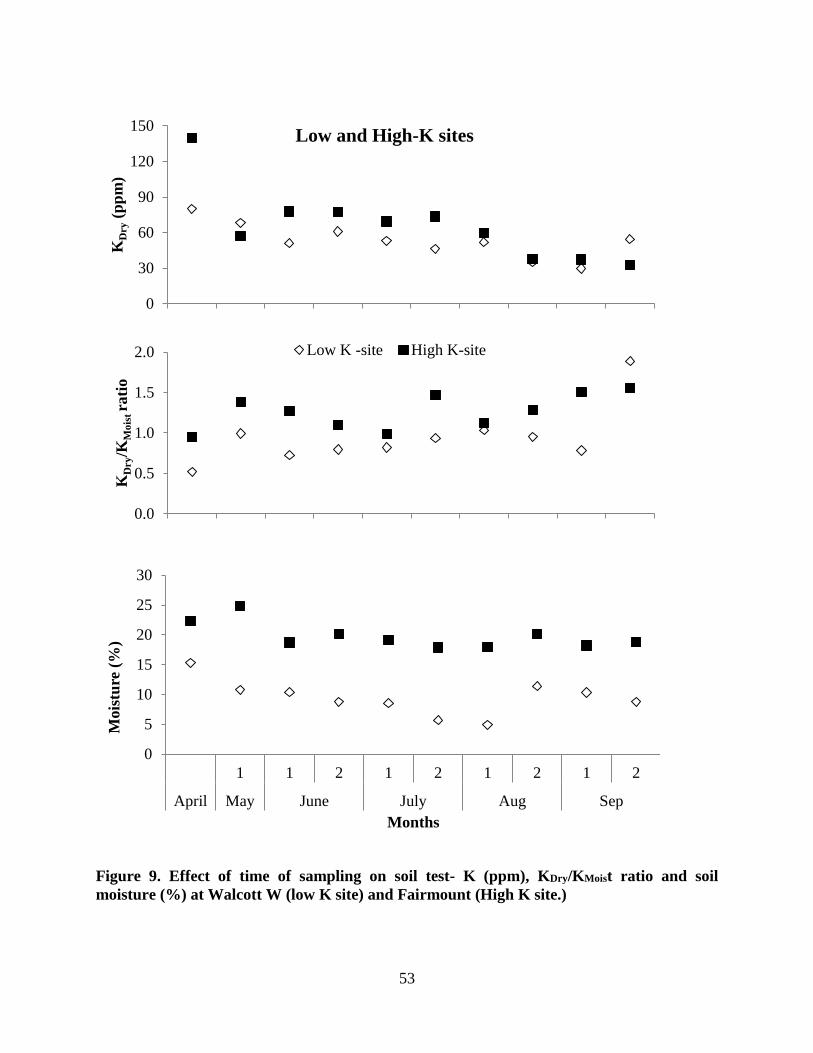
53
Figure 9. Effect of time of sampling on soil test- K (ppm), KDry/KMoist ratio and soil
moisture (%) at Walcott W (low K site) and Fairmount (High K site.)
0
30
60
90
120
150K
Dry
(pp
m)
Low and High-K sites
0.0
0.5
1.0
1.5
2.0
KD
ry/K
Mo
ist ra
tio
Low K -site High K-site
0
5
10
15
20
25
30
1 1 2 1 2 1 2 1 2
April May June July Aug Sep
Mo
istu
re (
%)
Months
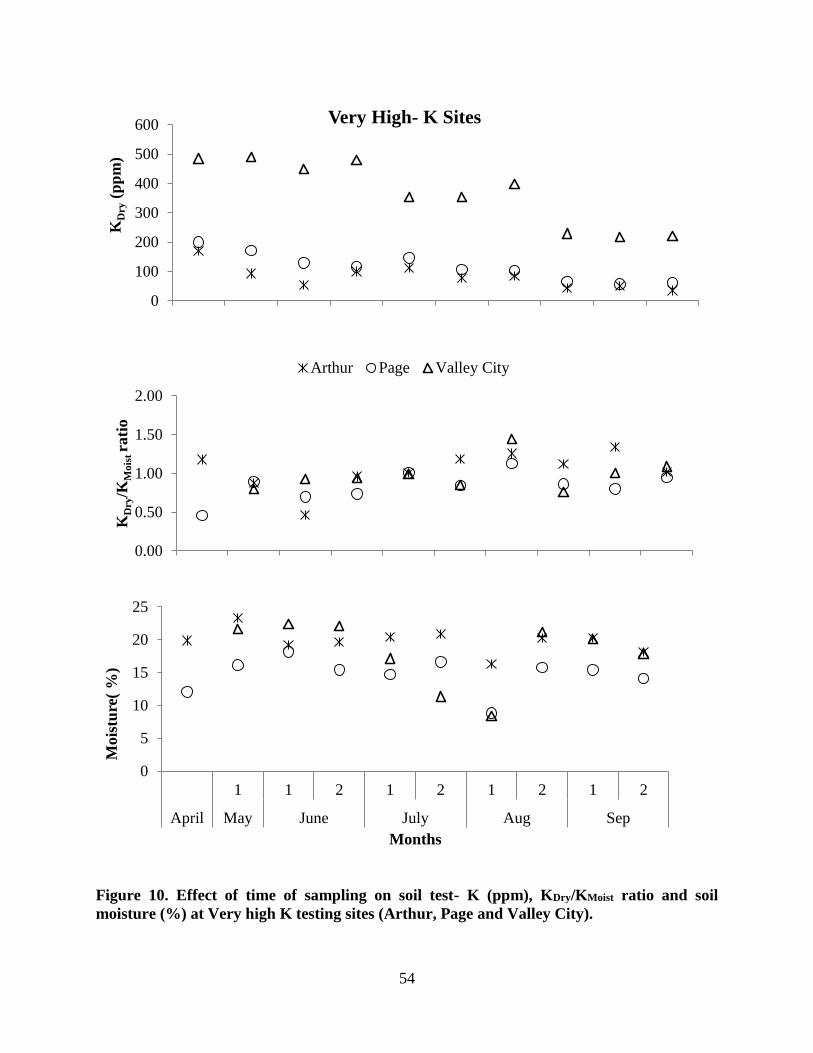
54
Figure 10. Effect of time of sampling on soil test- K (ppm), KDry/KMoist ratio and soil
moisture (%) at Very high K testing sites (Arthur, Page and Valley City).
0
100
200
300
400
500
600K
Dry
(pp
m)
Very High- K Sites
0.00
0.50
1.00
1.50
2.00
KD
ry/K
Mo
ist ra
tio
Arthur Page Valley City
0
5
10
15
20
25
1 1 2 1 2 1 2 1 2
April May June July Aug Sep
Mois
ture
( %
)
Months
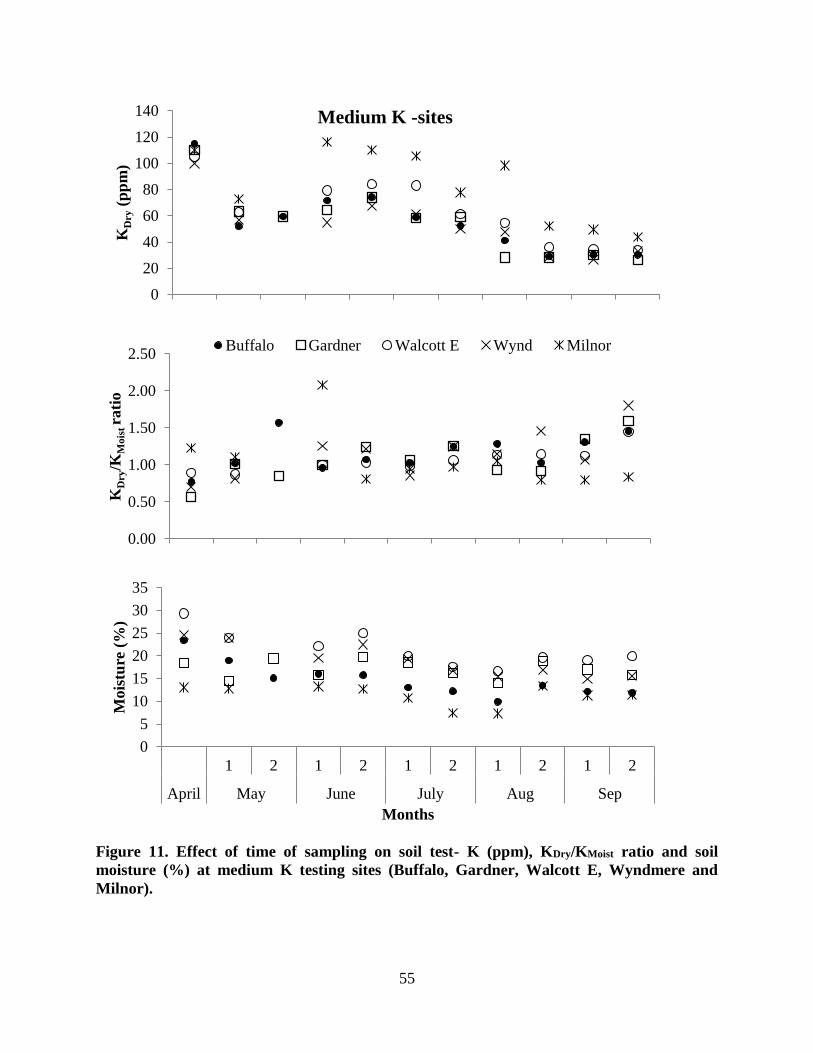
55
Figure 11. Effect of time of sampling on soil test- K (ppm), KDry/KMoist ratio and soil
moisture (%) at medium K testing sites (Buffalo, Gardner, Walcott E, Wyndmere and
Milnor).
0
20
40
60
80
100
120
140K
Dry
(pp
m)
Medium K -sites
0.00
0.50
1.00
1.50
2.00
2.50
KD
ry/K
Mo
ist ra
tio
Buffalo Gardner Walcott E Wynd Milnor
0
5
10
15
20
25
30
35
1 2 1 2 1 2 1 2 1 2
April May June July Aug Sep
Mois
ture
(%
)
Months
56
GENERAL SUMMARY AND CONCLUSIONS
The potassium fertilizer recommendation for corn needs a review in North Dakota.
Significant differences between KDry and KMoist levels revealed that air-drying of soil samples
prior to the soil analysis can provide misleading levels of plant available K levels. Deviation of
soil K results of air-dried and field-moist soils is dependent upon the specific soil properties such
as concentration of other salts, soil sample depth, etc. The soil K levels show high temporal
variations, therefore, time of soil sampling must be considered while formulating fertilizer
recommendations. Corn’s non-response to applied fertilizer at sites having less than the critical
level of potassium has questioned the existing critical level of 150 ppm for corn. A more
intensive collection of information such as soil mineralogy, soil moisture dynamics and plant
nutrient efficiencies may prove to be more helpful in improving the predictability of corn yield
response to applied fertilizers.
57
REFERENCES
Attoe, O.J. 1947. Potassium fixation and release in soils occurring under moist and dry
conditions. Soil Sci. Soc. Am. Pro. 11:145-149.
doi:10.2136/sssaj1947.036159950011000C0027x
Anonymous. 2012. Pros and Cons on Winter Sampling. Midwest Laboratories, NE. Available
online: https://www.midwestlabs.com/wp-content/uploads/2012/09/138_with_graph.pdf.
(accessed 11 March, 2015)
Barbagelata, P.A. 2006. Evaluation of potassium soil tests and methods for mapping soil fertility
properties in Iowa corn and soybean fields. Ph.D. diss., Iowa State Univ., Ames.
Barbagelata, P.A., and A.P. Mallarino. 2012. Field correlation of potassium soil test methods
based on dried and field- moist soil samples for corn and soybean. Soil Sci. Soc. Am. J.
77: 630-642. doi:10.2136/sssaj2012.0253.
Barber, S.A. 1959. Relation of fertilizer placement to nutrient uptake and crop yield: II. Effects
of row potassium, potassium soil-level, and precipitation. Agron. J. 51:97-99.
doi:10.2134/agronj1959.00021962005100020011x.
Bartlett, R., and B. James. 1980. Studying dried, stored soil samples-some pitfalls. Soil Sci. Soc.
Am. J. 44:721-724. doi:10.2136/sssaj1980.03615995004400040011x.
Bates, T.E., and A.D. Scott. 1969. Control of potassium release and reversion associated with
changes in soil moisture. Soil Sci. Soc. Am. Pro. 33(4):566-568.
doi:10.2136/sssaj1969.03615995003300040024x
Bender, R.R., J. W. Haegele, M. L. Ruffo, and F. E. Below. 2013. Modern corn hybrids’ nutrient
uptake patterns. Better Crops. 97: 7-10.
Black, C.A. 1965. Methods of Soil Analysis: Part I Physical and mineralogical properties.
American Society of Agronomy, Madison, Wisconsin, USA.
58
Blake, L., S. Merick, M. Koerschens, K.W.T. Goulding, S. Stempen, A. Weigel, P.R. Poulton
and D.S. Powlson. 1999. Potassium content in soil, uptake in plants and the potassium
balance in three European long-term field experiments. Plant Soil. 216(1-2): 1-14. doi:
10.1023/A:1004730023746.
Brady, N.C. and R.R. Weil. 2008. Soil phosphorus and potassium. In: The Nature and Properties
of Soils, Fourteenth edition. Pearson Education Inc. p- 671-718.
Bray, R.H. and E.E. DeTurk. 1939. The release of potassium from non-replaceable forms in
Illinois soils. Soil Sci. Soc. Am. Pro. 3: 101-106.
doi:10.2136/sssaj1939.036159950003000C0021x
Burns, A.F. and S.A. Barber. 1961. The effect of temperature and moisture on exchangeable
potassium. Soil Sci. Soc. Am. Pro. 23: 349-352.
doi:10.2136/sssaj1961.03615995002500050013x.
Brouder, S.M. and J.J. Volenec. 2008. Impact of climate change on crop nutrient and water use
efficiencies. Physiol. Plant. 133: 705-724. doi: 10.1111/j.1399-3054.2008.01136.x.
Bruns, H.A. and M.W. Ebelhar. 2006. Nutrient uptake of maize affected by nitrogen and
potassium fertility in humid subtropical environments. Commun. Soil Sci. Plant Anal.37:
275-293. doi: 10.1080/00103620500408829.
Cain, M.J., S.Subler, J.P. Evans, and M.J. Fortin. 1999. Sampling spatial and temporal variation
in soil nitrogen availability. Oecologia. 118(4): 397-404. doi:10.1007/s004420050741.
Cakmak, I. 2005. The role of potassium in alleviating detrimental effects of abiotic stresses in
plants. J. Plant Nutr. Soil Sci. 168: 521–530. doi: 10.1002/jpln.200420485.
Chapman, H.D. 1965 Cation-exchange capacity. In: C.A. Black, editor, Method of Soil Analysis,
Part 2: Chemical and Microbiological Properties. ASA, Madison, Wisconsin. 891-900.
59
Childs, F.D. and E.M. Jencks. 1967. Effect of time and depth of sampling upon soil test results.
Agron. J. 59:537-540.
Cihacek, L.J., D.W.Franzen, J.Seaholm, L. J. Swenson, A.Johnson, J.Gunderson, and W.C.
Dahnke. 2009. Summary of soil fertility levels for North Dakota, 1991-2001. NDSU
Extension Services. SF–1397. p. 9
Clemson University 2013. Dry Ash Procedure for P, K, Ca, Mg, Zn, Cu, Fe. Available at
http://www.clemson.edu/public/regulatory/ag_svc_lab/plant_tissue/plant_tissue_feed_for
age_analysis_procedure5.html (cited 4 Feb.2014).
Clover, M.W. and A.P. Mallarino. 2013. Corn and soybean tissue potassium content responses to
potassium fertilization and relationships with grain yield. Soil Sci. Soc. Am. J. 77(2):630-
642. doi :10.2136/sssaj2012.0223
Combs, S. M. and M. V. Nathan. 1998. Soil Organic Matter. In: J. R. Brown, editor,
Recommended chemical soil test procedures for North Central Region. North Central
Reg. Res. Publ. No. 221. Missouri Ag. Expt. Station SB 1001, University of Missouri-
Columbia. P. 53-58
Cook, M.G. and T.B. Hutcheson. 1960. Soil potassium related to clay mineralogy of selected
Kentucky soils. Soil Sci. Soc. Pro. 24(4): 525-256.
doi:10.2136/sssaj1960.03615995002400040012x.
Desselle, L.J. 1967. Effect of various soil, climatic and management factors in the response of
corn to applied fertilizer. Retrospective Theses and Disertations. Paper 3451. Iowa State
University.
60
Dowdy, R. H. and T. B. Hutcheson. 1963 Effect of exchangeable potassium level and drying on
release and fixation of potassium by soils as related to clay mineralogy. Soil Soil Science
Society of America Journal, 27, 31–34. doi:10.2136/sssaj1963.03615995002700010014x.
Ebelhar, S.A. and E.C. Varsa. 2000. Tillage and potassium placement effects on potassium
utilization by corn and soybean. Commun. Soil Sci. Plant Anal. 31(11-14): 2367-2377.
doi:10.1080/00103620009370591
Elliott, E.T., J.W. Heil, , E.F. Kelly, and H.C. Monger. 1999. Soil structural and other physical
properties. In: G.P. Robertson et al., editors, Standard Soil Methods for Long term
Ecological Research. Oxford University Press, Inc., Madison Ave., New York,74–88.
Erich, M.S., and B.R. Hoskins. 2011. Effect of soil drying on soil pH and nutrient extractability.
Commun. Soil Sci. Plant Anal. 42:1167-1176. doi:10.1080/00103624.2011.566961.
Fine, L.O., T.A. Bailey and E. Truog. 1940. Availability of Fixed Potassium as Influenced by
Freezing and Thawing. Soil Sci. Soc. Pro. 5:183-186.
doi:10.2136/sssaj1941.036159950005000C0031x.
Fixen P.E., T.W. Bruulsema., T.L.Jensen., Robert Mikkelsen., T.S. Murrell., S.B.Phillips.,
Q.Rund, and W.M. Stewart. 2010. Fertility of North American soils - Summary 2010.
Better Crops with Plant foods. 94(4): 6-8.
Fletcher. O., 2013. U.S. Corn Belt Expands to North. The wall street Journal. Available
online:http://www.wsj.com/articles/SB1000142412788732490400457853935256631738
8 (accessed 11 March, 2015)
Franzen, D.W. 2010. North Dakota Fertilizer recommendation Tables and Equations. NDSU
Extension service. SF-882 (Revised). p-7.
61
Franzen, D.W. 2011. Variability of soil test potassium in space and time. In: North Central
Extension-Industry Soil Fertility Conference, Des Moines, IA. p. 74-82.
Gelderman, R.H. and A.P. Mallarino. 1998. Soil sample Preparation. In Recommended Chemical
Soil Test Procedures for the North Central Region (revised). Missouri Agri. Exp. Stat. SB
1001. Columbia, MO.
Grava, J., G.E. Spalding, and A.C. Caldwell. 1961. Effect of drying upon the amounts of easily
extractable potassium and phosphorous in Nicollet clay loam. Agron. J. 53(4): 219-221.
doi:10.2134/agronj1961.00021962005300040004x.
Haby, V.A., J.R. Sims., E.O. Skogley, and R.E. Lund. 1988. Effect of sample pretreatment on
extractable soil potassium. Commun. Soil Sci. Plant Anal. 19: 91-1016.
doi:10.1080/00103628809367922
Haby,V.A., M.P. Russelle, and E.O. Skogley. 1990. Testing soils for potassium, calcium and
magnesium. In: Westerman RL, editor. Soil testing and Plant Analysis. 3rd. Madison,
WI:SSSA.
Henry, H.A.L. 2007. Soil freeze–thaw cycle experiments: Trends, methodological weaknesses
and suggested improvements. Soil Bio. Biochem. 39:977–986.
doi:10.1016/j.soilbio.2006.11.017.
Hanway, J.J. 1963. Growth stages of corn. Agron. J. 55:487-492.
Hanway, J.J. 2007. Iowa State University Research. Integrated Crop. 22 -498 Available online
:http://www.ipm.iastate.edu/ipm/icm/2007/8-6/nutrients.html (accessed 11 March, 2015).
Hanway, J.J. and A.D.Scott. 1959. Soil potassium-moisture relations: III. Determining the
increase in exchangeable soil potassium on drying soils. Soil Sci. Soc. Am. J. 23(1): 22-
24. doi:10.2136/sssaj1959.03615995002300010014x.
62
Hanway, J.J. and A.D. Scott. 1957. Soil potassium-moisture relations: II. Profile distribution of
exchangeable K in Iowa soils as influenced by drying and rewetting. Soil Sci. Soc. Am. J.
21:501–504.doi:10.2136/sssaj1957.03615995002100050011x.
Hanway, J.J., S.A. Barber, R.H. Bray, A.C. Caldwell, M. Fried, L.T. Kurtz, K. Lawton, J.T.
Pesek, K. Petty, M. Reed, and F.W. Smith. 1962. North Central Regional Potassium
Studies. III. Field Studies with Corn. North Central Regional Publication No. 135. 407-
426.
Havlin. J.L., J.D. Beaton, S.M. Tisdale, and W.L. Nelson. 2005. Potassium. In: Soil Fertility and
Fertilizers. Pearson Prentice Hall, New Jersey. p. 199-218
Heckman, J.R. and E.J. Kamparth. 1992. Potassium accumulation and corn yield to potassium
fertilizer rate and placement. Soil Sci. Soc. Am. J. 56:141-148.
doi:10.2136/sssaj1992.03615995005600010022x.
Hu, Y. and U. Schmidhater. 2005. Drought and salinity: A comparison of their effects on mineral
nutrition of plants. J. Plant Nutr. Soil Sci. 168:541–549. doi: 10.1002/jpln.200420516.
James, D.W. and K.L. Wells. 1990. Soil sample collection and handling: Techniques based on
source and degree of field variability. In: Westermann, editor, Soil Testing and Plant
Analysis. SSSA Book Series -3. Madison, WI
Johnston, A.E. and K.W.T Goulding. 1990. Development of K- fertilizer Recommendation.
Proceedings of the 22nd Colloquium of the International potash Institute held at
Soligorsk/USSR. IPI, Bern Switzerland
Khaled, E.M. and J.W. Stucki. 1991. Iron oxidation state effects on cation fixation in smectites.
Soil Sci. Soc. Am. J. 55(2):550-554. doi:10.2136/sssaj1991.03615995005500020045x
63
Kuchenbuch, R.O. and U. Buczko. 2011. Revisiting potassium and phosphate fertilizer responses
in field experiments and soil test interpretations by means of data mining. J. Plant Nutr.
Soil Sci. 174, 171-185. doi: 10.1002/jpln.200900162.
LaBarge, G. and L. Linsey. 2012. Developing Phosphorus and Potassium Recommendations for
Field Crops. The Ohio State University Extension Publication. AGF-515-12. Available
online:http://ohioline.osu.edu/agffact/pdf/Developing_Phosphorus_and_Potassium_Reco
mmendations_for_Field_Crops_AGF-515-12.pdf) (accessed 11 March, 2015)
Large, R.L. 1969. The fixation and release of native and applied potassium from soils as affected
by drying, chopping, and mineralogy. Ph.D. diss. Ohio State Univ., Columbus
(Diss.abstr.Int.31:469B, 1970)
Lockman, R.B. and M.G. Malloya. 1984. Seasonal variation in soil test results. Commun. Soil
Sci. Plant Anal. 15(7): 741-757. doi:10.1080/00103628409367514.
Liebhardt, W.C., and M.R. Teel. 1977. Fluctuations in soil test values for potassium as
influenced by time of sampling. Commun. Soil Sci. Plant Anal. 8:591-597.
doi:10.1080/00103627709366750.
Luebs, R.E., G. Stanfoed, and Scott. A.D. 1956. Relation of available potassium to soil moisture.
Soil Sci. Soc. Am. J. 20: 45-50. doi:10.2136/sssaj1956.03615995002000010011x.
Mackay, A.D. and S.A. Barber. 1985. Soil moisture effect on potassium uptake by corn. Agron.
J. 77(4): 524-527. doi:10.2134/agronj1985.00021962007700040005x.
Mallarino, A.P. 2011. Identification of Release for High Temporal Soil test Potassium Variation.
North Central Extension-Industry Soil Fertility Conference. 2011. Vol. 27. Des Moines,
IA.
64
Mallarino, A.P. 2005. Revision of potassium soil test interpretations and fertilizer
recommendations. Availble online:
http://www.agronext.iastate.edu/soilfertility/info/CCA-Indy_2004_Krecs_Pub.pdf
(accessed 11 March, 2015)
Mallarino, A.P., J.E. Sawyer, and S.K. Barnhart. 2013. A general guide for crop nutrient and
limestone recommendations in Iowa. Iowa State University Extension Circular PM 1688.
Ames, IA.
Mallarino, A.P., J.R. Webb, and A.M. Blackmer. 1991. Corn and soybean yields during 11 years
of phosphorus and potassium fertilization on a high-testing soil. J. Prod. Agric. 4(3): 312-
317. doi:10.2134/jpa1991.0312.
Mallarino, A.P., P.A. Barbagelata, M.W. Clover, C.X., Villavicencio, and L.B. Thompson. 2011.
Factors determining high temporal soil-test potassium variation and soil sampling and
testing alternatives. In: Proceedings, North Central Region Soil and Plant Analyst
Workshop. Feb. 23-24, 2011. Bettendorf, IA.
Mallarino, A.P., R.Borges, and D.J. Whitney. 2001. Corn and soybean response to potassium
fertilization and placement. In North- Central Extension –Industry Soil Fertility Conf.
proceedings. Vol. 16. Des Moines, IA.
Mallarino, A.P., and S.L Higashi. 2009. Assessment of potassium supply for corn by analysis of
plant parts. Soil Sci. Soc. Am. J. 73: 2177-2183.
Mallarino, A.P., D.J. Wittry, and P.A. Barbagelata. 2003. New soil test interpretation classes for
potassium. Better Crops. 87:12-14.
65
Matthews, B.C. and C.G. Sherrell. 1960. Effect of drying on exchangeable potassium of Ontario
soils and the relation of exchangeable potassium to crop yields. Can. J. Soil. Sci. 40:35-
41. doi:10.4141/cjss60-004.
McLean, E.O. and M.E. Watson. 1985. Soil measurements of Plant available potassium In: R.D.
Munson, editor, Potassium in Agriculture. ASA, CSSA, and SSSA. Madison, WI: p. 277-
308.
Murdock, L. and D. Call. Managing seasonal fluctuations of soil tests. AGR-198. UK
Cooperative Extension Service. Available online:
http://www2.ca.uky.edu/agc/pubs/agr/agr189/agr189.pdf (accessed 11 March, 2015)
Murrell, T.S. 2009. Keep an eye on potassium this season. Insights. International Plant Nutrition
Inst., Norcross, GA. Available online at http://www.ipni.net/insights.
Murrell, T.S. 2011. Why are soil test potassium levels so variable over time in the corn belt?
Available online: http://fyi.uwex.edu/discoveryfarms/files/2011/06/murrell-k-
variability.pdf (accessed 11 March, 2015)
Nathan, M. and NCERA-13 Soil Testing and Plant Analysis Committee. 2011. Recommended
Soil Test Procedures for the North Central Region. University of Missouri, Columbia
MO.
National Agricultural Statistical Service (NASS). 2011. Corn for grain yield per acre-North
Dakota. U.S. Department of Agriculture. Available online:
http://www.nass.usda.gov/Statistics_by_State/North_Dakota/Charts_and_Maps/Crops/co
rnyd.gifhttp:// (accessed 6 April, 2015)
66
National Climatic Data Centre. 2011. NOAA's 1981-2010 climate normals. Available Online:
http://www.currentresults.com/Weather/North-Dakota/average-yearly-precipitation.php
(accessed 11 March, 2015)
North Dakota Agricultural Weather Network. Available online at http://ndawn.ndsu.nodak.edu/
(accessed 11 March 2015)
Norum, E.B. and V.L. Weiser. 1957. Fertilizer for Better Crops. NDSU Extension Circular 271.
Oztas, T., and F. Fayetorbay. 2003. Effect of freezing and thawing processes on soil aggregate
stability. Catena. 52:1–8. doi: 10.1016/S0341-8162(02)00177-7.
Pal, Y., R.J. Gilkes, and M.T.F. Wong. 2001. Soil factors affecting the availability of potassium
to plants for Western Australian soils: a glasshouse study. Aust. J. Soil. Res. 39, 611-625.
doi:10.1071/SR00030.
Peterson, L.A. and A.R. Kruegera. 1980. Variation in content of available P and K (bray 1) in
soil samples from a cropped N, P and K fertility experiment over 8 years. Commun. Soil
Sci. Plant Anal. 11(10): 993-1004. doi:10.1080/00103628009367098.
Pettigrew, W.T. 2008. Review: Potassium influences on yield and quality production for maize,
wheat, soybean and cotton. Physiol. Plant. 133:670-681. doi: 10.1111/j.1399-
3054.2008.01073.x
Ransom, J., D. Franzen P. Glogoza, K. Hellevang, V. Hofman, M. McMullen, and R. Zollinger
.2004. Basics of corn production in North Dakota. North Dakota Extension Service. A-
834 (Revised).
Rengel, Z. and P.M. Damon. 2008. Crops and genotype differ in efficiency of potassium uptake
and use. Physiol. Plant. 133:624-636. doi :10.1111/j.1399-3054.2008.01079.x
67
Rich, C.I. 1968. Mineralogy of soil potassium. In: V.J. Kilmer et al. (ed.) The Role of Potassium
in Agriculture. American Society of Agronomy, Madison, WI. p. 79-91
Romheld,V. and E. R. Kirby. 2010. Research on potassium in agriculture: needs and prospects.
Plant Soil. 335:155-180. doi:10.1007/s11104-010-0520-1.
Rosolem, C.A., Juliano C. Calonego, and José S. S. Folon. 2005. Potassium Leaching from
Millet Straw as Affected by Rainfall and Potassium Rates. Commun. Soil Sci. Plant Anal.
36 (7-8): 1063-1074. doi:10.1081/CSS-200050497.
Sabbe, W.E. and D.B. Marx. 1987. Soil Sampling: Spatial and Temporal Variability. In: Soil
Testing: Sampling, Correlation, Calibration, and Interpretation. SSSA Special publication
21. Madison, USA. doi:10.2136/sssaspecpub21.c1.
SAS Institute. 2013. SAS Version 9.3. SAS Inst., Cary, NC.
SAS Institute. 2013. SAS Enterprise Guide 4.3. SAS Inst., Cary, NC.
Schaff, B.E. and E.O. Skogley. 1982. Diffusion of potassium, calcium and magnesium in
Bozeman silt loam as influenced by temperature and moisture. Soil Sci. Soc. Am. J. 46:
521-524. doi:10.2136/sssaj1982.03615995004600030015x
Schenk, M.K. and S.A. Barber. 1980. Potassium and phosphorus uptake by corn genotypes
grown in the field as influenced by root characteristics. Plant Soil. 54(1): 65-76.335: 155-
180.doi:10.1007/s11104-010-0520-1
Schneider, A., R. Tesileanu, R. Charles & S. Sinaj. 2013. Kinetics of Soil Potassium Sorption–
Desorption and Fixation. Commun. Soil Sci. Plant Anal. 44(1-4): 837-849.
doi:10.1080/00103624.2013.749442.
Sparks, D.L. and P.M. Huang. 1985. Physical chemistry of soil potassium. In: ed. D.R. Munson,
Potassium in Agriculture. Madison, WI, USA: ASA, CSSA and SSSA. pp. 201-265
68
Sparks, D.L. Dynamics of Potassium in soils and their Role in Management of potassium
Nutrition. In: Technical session – 1, Potassium in soils. IPNI. Available online:
http://www.ipipotash.org/udocs/Dynamics%20of%20K%20in%20Soils%20and%20Their
%20Role%20in%20Management%20of%20K%20Nutrition.pdf. (accessed 11 March,
2015)
Soil Survey Division Staff. 1993. Soil survey manual. Soil Conservation Service. U.S.
Department of Agriculture Handbook 18. Retrieved 02 Feb, 2015.
Soil Survey Staff. 2013. Natural Resources Conservation Service, United States Department of
Agriculture. Official Soil Series Descriptions. Available online :
http://www.nrcs.usda.gov/wps/portal/nrcs/site/soils/home/ (accessed 11 March, 2015)
Steenkamp, J.L. 1928. The effect of dehydration of soils upon their colloid constituents: I. Soil
Sci. 25(2):163-182.
Thomas, G.W. 1996. Soil pH and acidity. In: D.L. Sparks, editor, Methods of Soil Analysis. Part
3. ASA and SSSA. Madison, WI, USA. p. 475–490.
Thomas, G.R. and B.W. Hipp, 1968. The Role of Potassium in Agriculture- Soil factors affecting
availability of potassium availability. V. J. Kilmer, S. E. Younts, N. C. Brady (Eds.)
Madison, Wisconsin: ASA.CSA, SSSA.
Tukey, H.B. 1966. Leaching of Metabolites from the Above-Ground Plant Parts and Its
Implications. Bulletin of the Torrey Botanical Club by Torrey Botanical Society. 93(6):
385-401.
Vitko, L.F., C.A.M. Laboski, and T.W. Andraski. 2010. Effect of sample time on soil test
potassium levels. Proceedings of Wisconsin Crop Management Conference. 49: 32-38.
69
Vyn, T.J., and K.J. Janovicek. 2001. Potassium placement and tillage system effects on corn
response following long term no till. Agron. J. 38:173-185.
Warncke, D., and J.R. Brown. 1998. Potassium and other basic cations. In: J.R. Brown, editor,
Recommended chemical soil test procedures for the North Central region. North Central
Regional Publ. 221 (Revised). Missouri Exp. Stat. Publ. SB 1001. p. 31–33.
Welch, L.F. and R.L. Flannery. 1985. Potassium nutrition of corn. In: D.R. Munson, editor,
Potassium in Agriculture. Madison, WI, USA: ASA, CSSA and SSSA. p. 647-664.
Wells, K.L. and J.E. Dollarhide. 2000. The effect of drying soil samples on soil test potassium
Values. Agronomy Notes Vol. 32, no.5 Available online:
http://www.uky.edu/Ag/Tobacco/agr_notes/agvl32_5.pdf (accessed 11 March, 2015)
Whitney, D.A. 1998. Soil salinity. In: J.R. Brown, editor, Recommended chemical soil test
procedures for the North Central Region. North Central Reg. Res. Publ. No. 221
(Revised). Missouri Agric. Exp. Sta. SB 1001, Columbia, MO. p.59-60.
Wortmann, C.S., A. R. Dobermann, R. B. Ferguson, G. W. Hergert, C. A. Shapiro, D. D.
Tarkalson, and D. T. Walters. 2009. High-yielding corn response to applied phosphorus,
potassium, and sulfur in Nebraska. Agron. J. 101(3):546-555.
doi:10.2134/agronj2008.0103x.
Zeng, Q. and P.H. Brown. 2000. Soil potassium mobility and uptake by corn under differential
soil moisture regimes. Plant Soil. 221: 121-134. doi: 10.1023/A:1004738414847.
Zorb, C., M. Senbayram, and E. Peiter. 2013. Potassium in agriculture: Status and perspectives.
J. Plant Physiol. 171(9): 656-669. doi:10.1016/j.jplph.2013.08.008

70
APPENDIX. RESULTS OF PAIRED-T TEST OF EACH SITE AT SPECIFIC
SAMPLING DATE
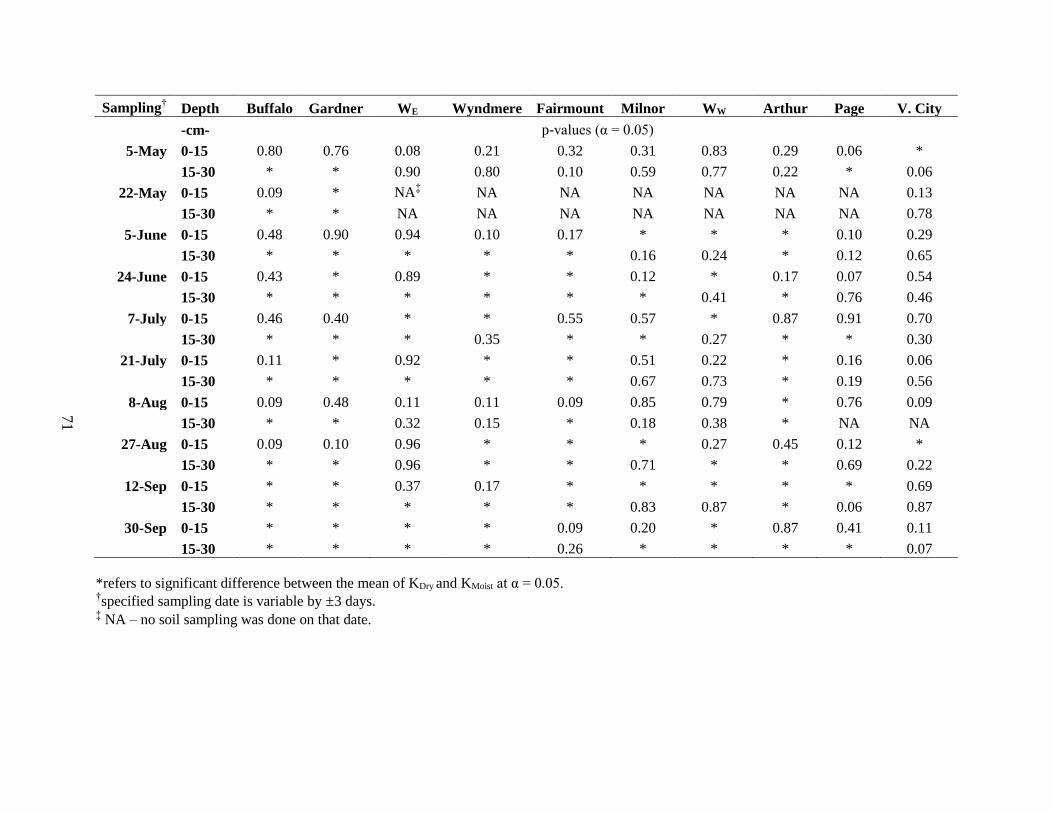
71
Sampling† Depth Buffalo Gardner WE Wyndmere Fairmount Milnor WW Arthur Page V. City
-cm- p-values (α = 0.05)
5-May 0-15 0.80 0.76 0.08 0.21 0.32 0.31 0.83 0.29 0.06 *
15-30 * * 0.90 0.80 0.10 0.59 0.77 0.22 * 0.06
22-May 0-15 0.09 * NA‡ NA NA NA NA NA NA 0.13
15-30 * * NA NA NA NA NA NA NA 0.78
5-June 0-15 0.48 0.90 0.94 0.10 0.17 * * * 0.10 0.29
15-30 * * * * * 0.16 0.24 * 0.12 0.65
24-June 0-15 0.43 * 0.89 * * 0.12 * 0.17 0.07 0.54
15-30 * * * * * * 0.41 * 0.76 0.46
7-July 0-15 0.46 0.40 * * 0.55 0.57 * 0.87 0.91 0.70
15-30 * * * 0.35 * * 0.27 * * 0.30
21-July 0-15 0.11 * 0.92 * * 0.51 0.22 * 0.16 0.06
15-30 * * * * * 0.67 0.73 * 0.19 0.56
8-Aug 0-15 0.09 0.48 0.11 0.11 0.09 0.85 0.79 * 0.76 0.09
15-30 * * 0.32 0.15 * 0.18 0.38 * NA NA
27-Aug 0-15 0.09 0.10 0.96 * * * 0.27 0.45 0.12 *
15-30 * * 0.96 * * 0.71 * * 0.69 0.22
12-Sep 0-15 * * 0.37 0.17 * * * * * 0.69
15-30 * * * * * 0.83 0.87 * 0.06 0.87
30-Sep 0-15 * * * * 0.09 0.20 * 0.87 0.41 0.11
15-30 * * * * 0.26 * * * * 0.07
*refers to significant difference between the mean of KDry and KMoist at α = 0.05. †specified sampling date is variable by ±3 days. ‡ NA – no soil sampling was done on that date.
Related Documents