RESEARCH ARTICLES CURRENT SCIENCE, VOL. 86, NO. 10, 25 MAY 2004 1390 *For correspondence. (e-mail: [email protected]) 25. Snider, J. R. and Berenguier, J. L., Cloud condensation nuclei and cloud droplet measurements during ACE-2. Tellus, Ser. B, 2000, 52, 828–842. 26. McFarquhar, G. M. and Heymsfield, A. J., Parameterizations of INDOEX micro-physical measurements and calculations of cloud susceptibility: Applications for climate studies. J. Geophys. Res. – Atmos., 2001, 106, 28675–28698. 27. Heymsfield, A. J. and McFarquhar, G. M., Microphysics of INDOEX clean and polluted trade cumulus cloud. J. Geophys. Res. – Atmos., 2001, 106, 28653–28673. 28. Ricchiazzi, P., Yang, S., Gautier, C. and Sowle, D., SBDART, A research and teaching tool for plane-parallel radiative transfer in the earth’s atmosphere. Bull. Am. Meteorol. Soc., 1998, 79, 2101– 2114. 29. Hess, M., Koepke, P. and Schult, I., Optical properties of aerosols and clouds: The software package OPAC. Bull. Am. Meteorol. Soc., 1998, 79, 831–844. ACKNOWLEDGEMENTS. The study was carried out as part of ISRO–GBP and ARMEX. We thank Prof. J. Srinivasan, Centre for Atmo- spheric and Oceanic Sciences, Indian Institute of Science, Bangalore for valuable suggestions and guidance. Received 17 October 2003; revised accepted 27 January 2004 Evaluation of sambar and muntjak habitats using geostatistical modelling S. P. S. Kushwaha 1, *, A. Khan 2 , B. Habib 2 , A. Quadri 2 and A. Singh 1 1 Indian Institute of Remote Sensing, Dehradun 248 001, India 2 Aligarh Muslim University, Aligarh 202 002, India We report here the habitat evaluation for sambar (Cervus unicolor var. niger) and muntjak (Muntiacus muntjak var. vaginalis) in Ranikhet forests of Kumaon Himalaya using field survey, geostatistical analysis and geospatial tools. The geostatistical analysis was attempted at three levels: first, cases of animal sight- ing were taken (inclusive of mixed sightings) and sub- jected to principal components analysis to find the micro-habitat ‘preference’ by the respective animal. Secondly, cases where either sambar or muntjak were sighted were grouped into three categories, viz. pure sambar, pure muntjak and mixed and subsequently subjected to a discriminant function analysis to elicit the factors responsible for habitat use differentiation. Thirdly, a multiple binomial logistic regression was run on the dataset using cases of animal sighting used as Boolean values as the dependent and six physical habitat variables, viz. forest density, drainage, aspect, slope, elevation and the human settlements variables as independents to derive the distribution of the res- pective species. Both the species showed highest pre- ference for oak forests. Only 4.07% area was found highly suitable for sambar and 2.37% (200 ha) was so for muntjak. About 20% area in case of sambar and 10% in case of muntjak turned out to be moderately suitable to less suitable. The two species had only 0.35% (29.71 ha) habitat overlap. The sensitivity of the model was found to be 87.8% for sambar and 97.62% for muntjak. The study highlights synergistic use of field survey, geostatistical analysis and geospa- tial tools for evaluation of the sambar and muntjak habitats. WILDLIFE includes non-domestic plants and animals and holds the key for the well being of humans. In recent years, much interest has been shown towards protection and conservation of wildlife at various levels. The work on conservation and management of wildlife is often hampered due to non-availability of good quality data on species, habitats and suitability of the habitats for differ- ent species. The problem is more acute in the developing world, where wildlife and biodiversity conservation is often subordinated to more pressing demands like hunger and poverty 1 . Habitat evaluation is the first step towards meaningful wildlife conservation and management. Eva- luation of wildlife habitats based on ecological principles is well established in USA in connection with environ- mental impact assessments, where the aim has been to ensure that appropriate consideration is given to wildlife in the development planning process. At the same time, there has been considerable pressure for the use of stan- dardized procedures for habitat evaluation, both for eco- nomical as well as ecological reasons among various organizations and professionals. This pressure for stan- dardization was one of the reasons why the Habitat Evaluation Procedure (HEP) was developed (initially by the U.S. Fish and Wildlife Service) for use in the evalua- tion of water and related land resources development pro- jects 2 . First developed in 1976, the HEP has been modified since then after detailed assessments and there are now

Welcome message from author
This document is posted to help you gain knowledge. Please leave a comment to let me know what you think about it! Share it to your friends and learn new things together.
Transcript
RESEARCH ARTICLES
CURRENT SCIENCE, VOL. 86, NO. 10, 25 MAY 2004 1390
*For correspondence. (e-mail: [email protected])
25. Snider, J. R. and Berenguier, J. L., Cloud condensation nuclei and cloud droplet measurements during ACE-2. Tellus, Ser. B, 2000, 52, 828–842.
26. McFarquhar, G. M. and Heymsfield, A. J., Parameterizations of INDOEX micro-physical measurements and calculations of cloud susceptibility: Applications for climate studies. J. Geophys. Res. – Atmos., 2001, 106, 28675–28698.
27. Heymsfield, A. J. and McFarquhar, G. M., Microphysics of INDOEX clean and polluted trade cumulus cloud. J. Geophys. Res. – Atmos., 2001, 106, 28653–28673.
28. Ricchiazzi, P., Yang, S., Gautier, C. and Sowle, D., SBDART, A research and teaching tool for plane-parallel radiative transfer in
the earth’s atmosphere. Bull. Am. Meteorol. Soc., 1998, 79, 2101–2114.
29. Hess, M., Koepke, P. and Schult, I., Optical properties of aerosols and clouds: The software package OPAC. Bull. Am. Meteorol. Soc., 1998, 79, 831–844.
ACKNOWLEDGEMENTS. The study was carried out as part of ISRO–GBP and ARMEX. We thank Prof. J. Srinivasan, Centre for Atmo-spheric and Oceanic Sciences, Indian Institute of Science, Bangalore for valuable suggestions and guidance. Received 17 October 2003; revised accepted 27 January 2004
Evaluation of sambar and muntjak habitats using geostatistical modelling S. P. S. Kushwaha1,*, A. Khan2, B. Habib2, A. Quadri2 and A. Singh1 1Indian Institute of Remote Sensing, Dehradun 248 001, India 2Aligarh Muslim University, Aligarh 202 002, India
We report here the habitat evaluation for sambar (Cervus unicolor var. niger) and muntjak (Muntiacus muntjak var. vaginalis) in Ranikhet forests of Kumaon Himalaya using field survey, geostatistical analysis and geospatial tools. The geostatistical analysis was attempted at three levels: first, cases of animal sight-ing were taken (inclusive of mixed sightings) and sub-jected to principal components analysis to find the micro-habitat ‘preference’ by the respective animal. Secondly, cases where either sambar or muntjak were sighted were grouped into three categories, viz. pure sambar, pure muntjak and mixed and subsequently subjected to a discriminant function analysis to elicit the factors responsible for habitat use differentiation. Thirdly, a multiple binomial logistic regression was run on the dataset using cases of animal sighting used
as Boolean values as the dependent and six physical habitat variables, viz. forest density, drainage, aspect, slope, elevation and the human settlements variables as independents to derive the distribution of the res-pective species. Both the species showed highest pre-ference for oak forests. Only 4.07% area was found highly suitable for sambar and 2.37% (200 ha) was so for muntjak. About 20% area in case of sambar and 10% in case of muntjak turned out to be moderately suitable to less suitable. The two species had only 0.35% (29.71 ha) habitat overlap. The sensitivity of the model was found to be 87.8% for sambar and 97.62% for muntjak. The study highlights synergistic use of field survey, geostatistical analysis and geospa-tial tools for evaluation of the sambar and muntjak habitats.
WILDLIFE includes non-domestic plants and animals and holds the key for the well being of humans. In recent years, much interest has been shown towards protection and conservation of wildlife at various levels. The work on conservation and management of wildlife is often hampered due to non-availability of good quality data on species, habitats and suitability of the habitats for differ-ent species. The problem is more acute in the developing world, where wildlife and biodiversity conservation is often subordinated to more pressing demands like hunger and poverty1. Habitat evaluation is the first step towards meaningful wildlife conservation and management. Eva-
luation of wildlife habitats based on ecological principles is well established in USA in connection with environ-mental impact assessments, where the aim has been to ensure that appropriate consideration is given to wildlife in the development planning process. At the same time, there has been considerable pressure for the use of stan-dardized procedures for habitat evaluation, both for eco-nomical as well as ecological reasons among various organizations and professionals. This pressure for stan-dardization was one of the reasons why the Habitat Evaluation Procedure (HEP) was developed (initially by the U.S. Fish and Wildlife Service) for use in the evalua-tion of water and related land resources development pro-jects2. First developed in 1976, the HEP has been modified since then after detailed assessments and there are now
RESEARCH ARTICLES
CURRENT SCIENCE, VOL. 86, NO. 10, 25 MAY 2004 1391
many habitat evaluation models. The US Fish and Wild-life Service has developed as many as 157 habitat suit-ability models for large number of fish and other wildlife in the last 20 years. This is the most comprehensive data-base anywhere in the world3.
Geospatial technology for wildlife habitat evaluation
The geospatial technology, including remote sensing and geographic information system (GIS), holds the potential for timely and cost-effective assessment of natural re-sources. Remotely sensed data provides capabilities for synoptic, frequent, real-time assessment, monitoring and management of large areas. Earlier studies suggest a sig-nificant role for geospatial technology in wildlife conser-vation and management. Remotely sensed data have been used for habitat assessment of elk, Cervus canadensis4, and kangaroo, Macropus giganteus5. LANDSAT image classification, in combination with habitat model, helped in prediction of the nesting sites of American kestrel, Falco sparverius6. Visual LANDSAT image interpreta-tion has been used as an effective tool in re-introduction programme of the white oryx, Oryx leucoryx7. An exam-ple of habitat evaluation, based on the ecology of the marten, Martes americana, was used by earlier workers8. Habitats of Indian one-horned rhino, Rhinoceros unicor-nis, wild buffalo, Bubalis bubalis, swamp deer, Cervus duvacelli, hog deer, Axis porcinus and Asian elephant, Elephus maximus have been evaluated using high resolu-tion space photographs and LANDSAT multispectral data9. Landscape variables were used to assess the habitat suitability for goral, Naemorhedus goral10. Vegetation, terrain and water parameters were converted into food and shelter values for assessment of the habitat suitability for sambar11. Criteria-based spatial data integration for goral and sambar habitat evaluation have shown promis-ing results12–14. Remote sensing and GIS have been used for chinkara, Gezella bennetti habitat suitability analysis in Rajasthan15. GIS has assumed a central role over the years in numerous species-specific applications but there is more scope for GIS in modelling species assemblages, scale-dependent habitat preferences, geographical frag-mentation of populations, habitat heterogeneity and eco-logical integrity16,17. By now, it is well established that geospatial tools are indispensable for habitat evaluation. Some authors have reported on cost-coverage analysis of remote sensing and GIS-based habitat evaluations18,19. The fragmentation, degradation and depletion of natu-ral habitats have created an adverse impact on the popula-tions of faunal species in general, and the ungulates in particular in Kumaon region of western Himalaya. The changes in the landuse pattern here have brought about the decline and total disappearance of large and medium-sized mammalian fauna from many sites20. In a recent study on the status and distribution of deer species in
Kumaon Himalaya, the researchers could record sambar and muntjak only from 14 sites. This was attributed to high human pressure and habitat shrinkage21. Hence, we took up evaluation of habitats of sambar and muntjak using geostistical and geospatial tools. Such a study has not been carried out in this region.
Study area
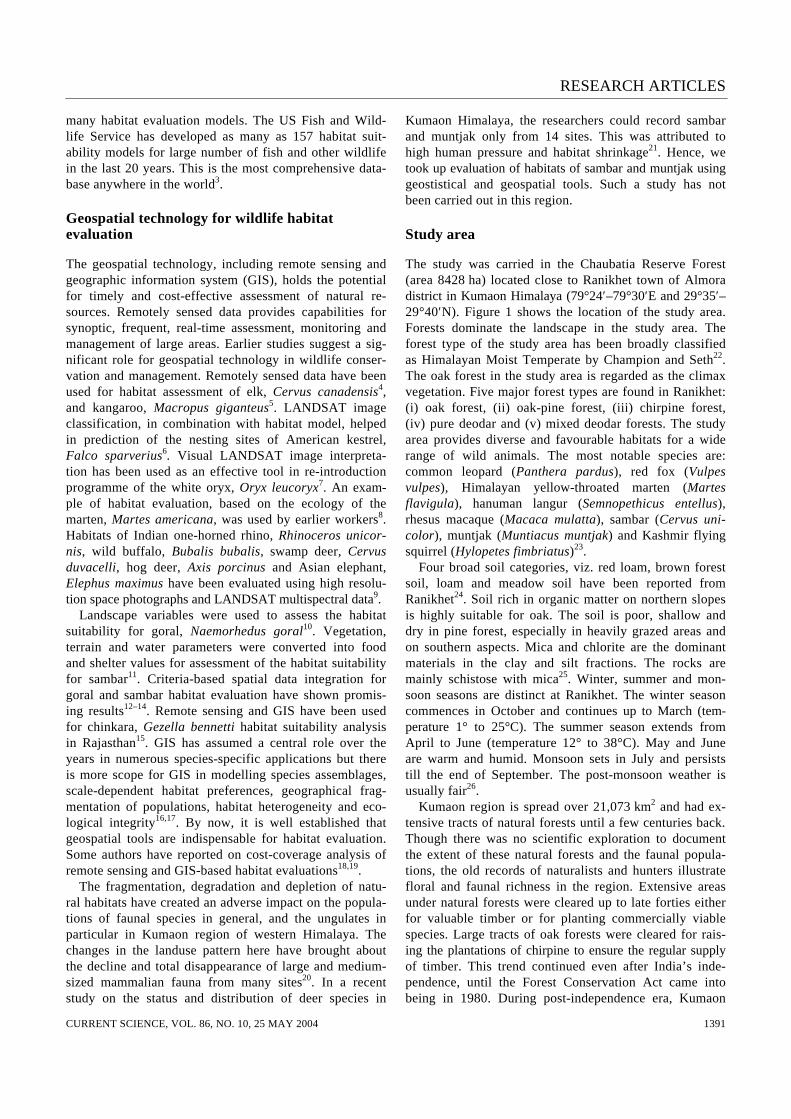
The study was carried in the Chaubatia Reserve Forest (area 8428 ha) located close to Ranikhet town of Almora district in Kumaon Himalaya (79°24′–79°30′E and 29°35′–29°40′N). Figure 1 shows the location of the study area. Forests dominate the landscape in the study area. The forest type of the study area has been broadly classified as Himalayan Moist Temperate by Champion and Seth22. The oak forest in the study area is regarded as the climax vegetation. Five major forest types are found in Ranikhet: (i) oak forest, (ii) oak-pine forest, (iii) chirpine forest, (iv) pure deodar and (v) mixed deodar forests. The study area provides diverse and favourable habitats for a wide range of wild animals. The most notable species are: common leopard (Panthera pardus), red fox (Vulpes vulpes), Himalayan yellow-throated marten (Martes flavigula), hanuman langur (Semnopethicus entellus), rhesus macaque (Macaca mulatta), sambar (Cervus uni-color), muntjak (Muntiacus muntjak) and Kashmir flying squirrel (Hylopetes fimbriatus)23. Four broad soil categories, viz. red loam, brown forest soil, loam and meadow soil have been reported from Ranikhet24. Soil rich in organic matter on northern slopes is highly suitable for oak. The soil is poor, shallow and dry in pine forest, especially in heavily grazed areas and on southern aspects. Mica and chlorite are the dominant materials in the clay and silt fractions. The rocks are mainly schistose with mica25. Winter, summer and mon-soon seasons are distinct at Ranikhet. The winter season commences in October and continues up to March (tem-perature 1° to 25°C). The summer season extends from April to June (temperature 12° to 38°C). May and June are warm and humid. Monsoon sets in July and persists till the end of September. The post-monsoon weather is usually fair26. Kumaon region is spread over 21,073 km2 and had ex-tensive tracts of natural forests until a few centuries back. Though there was no scientific exploration to document the extent of these natural forests and the faunal popula-tions, the old records of naturalists and hunters illustrate floral and faunal richness in the region. Extensive areas under natural forests were cleared up to late forties either for valuable timber or for planting commercially viable species. Large tracts of oak forests were cleared for rais-ing the plantations of chirpine to ensure the regular supply of timber. This trend continued even after India’s inde-pendence, until the Forest Conservation Act came into being in 1980. During post-independence era, Kumaon
RESEARCH ARTICLES
CURRENT SCIENCE, VOL. 86, NO. 10, 25 MAY 2004 1392
Ranikhet
Figure 1. Location of the study area in India.
Himalaya witnessed large-scale changes in its landuse pat-tern due to rapid urbanization and agricultural expansion. This has depleted the forest cover and degraded the land-scape. Much of the low and middle altitude oak forests have been either replaced with chirpine or lost to terrace cultiva-tion. The existing patches, including plantations, are highly fragmented and degraded. The study area represents a cross-section of habitat types in Kumaon Himalaya.
Materials and methods
The study was carried out in three phases. The first phase included field survey to collect information on habitat use
by sambar and muntjak. During the second phase, a data-base was created and statistical analysis of the field data was carried out. The third phase work included geospatial modelling.
Field survey
An intensive field survey was carried out for a period of two months (from 1 October to 30 November 2000) to ana-lyse the habitat use by sambar and muntjak. Presence of pellet groups was taken as indirect evidence of habitat use for both the species27. Twelve transects were laid in different habitat types – 2 in oak, 2 in oak mixed, 4 in
RESEARCH ARTICLES
CURRENT SCIENCE, VOL. 86, NO. 10, 25 MAY 2004 1393
oak-pine, 2 in pine and 2 in deodar. In each transect, pel-let groups were counted in 10 m radius plots. A total of 96 plots (eight in each transect) were sampled. The den-sity, diversity and the richness of the tree species were assessed using the same 10 m radius circular plots. The canopy cover was measured using a gridded mirror of 25 cm × 25 cm in four different directions inside the cir-cular plot. Shrub richness and height were measured from a 3 m-radius circular plot. Shrub cover was measured in five equal density classes of 0–20%, 20–40%, 40–60%, 60–80% and 80–100%. The grass and herbs were quanti-fied from four plots of 50 cm × 50 cm at four different locations inside the circular plot. A tape was laid on the ground in four directions and intercepting features of ground cover such as herbs, grasses, shrubs, litter, rock outcrops were recorded. At each sample plot, location, slope, aspect, elevation, evidence of fire, number of cut/ lopped trees and cattle dung were also recorded. The num-ber of pellet groups for each species in each plot was used to calculate pellet group density per ha. Two sets of field data were made: one set was used to derive the habitat use information through statistical analysis and the other set for mapping accuracy and model sensitivity determination.
Database creation
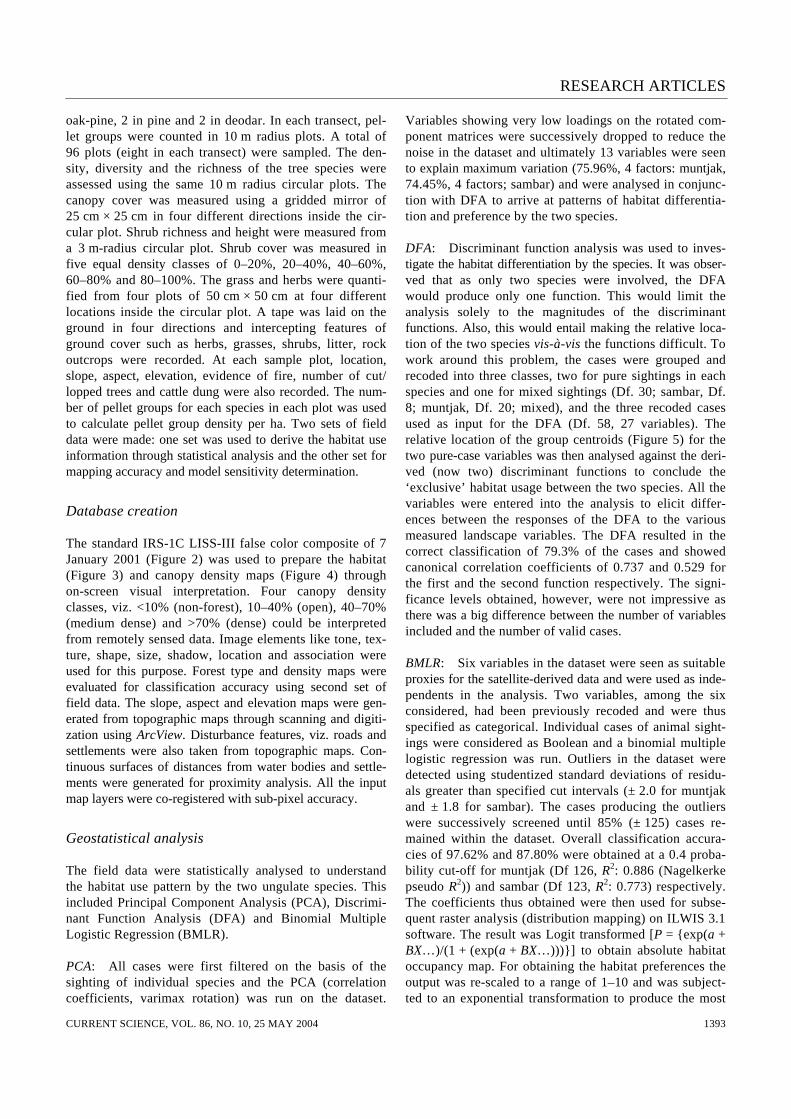
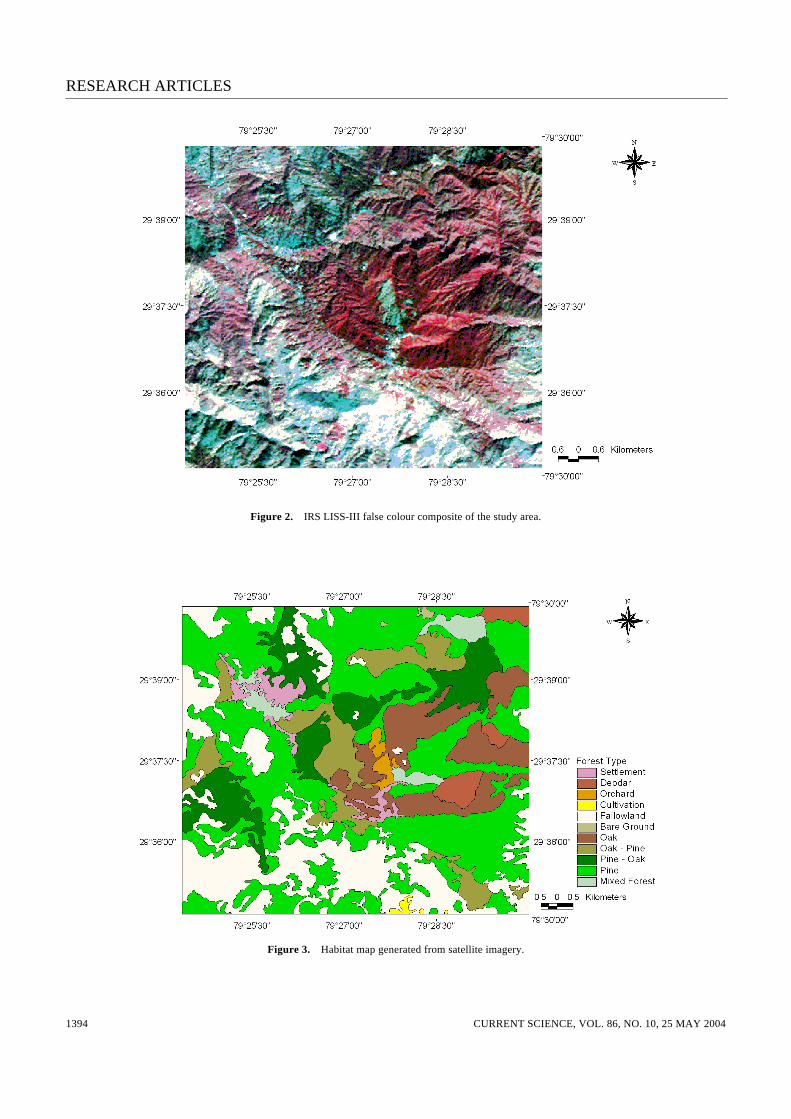
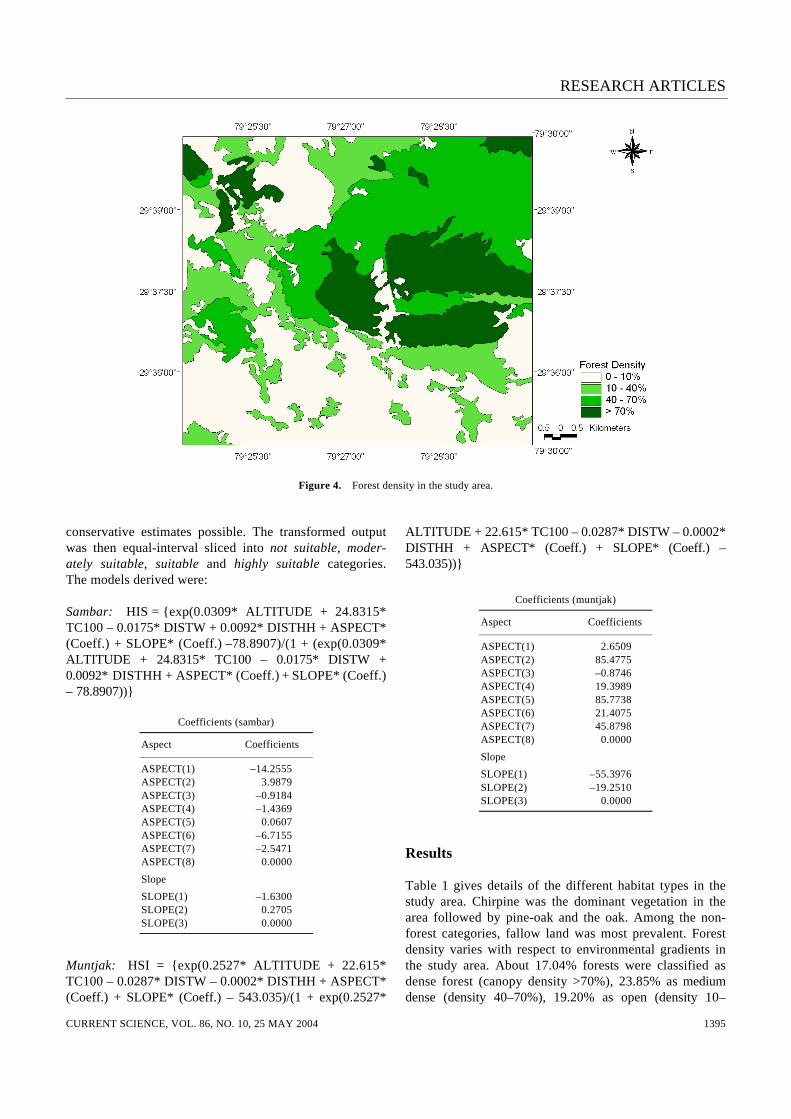
The standard IRS-1C LISS-III false color composite of 7 January 2001 (Figure 2) was used to prepare the habitat (Figure 3) and canopy density maps (Figure 4) through on-screen visual interpretation. Four canopy density classes, viz. <10% (non-forest), 10–40% (open), 40–70% (medium dense) and >70% (dense) could be interpreted from remotely sensed data. Image elements like tone, tex-ture, shape, size, shadow, location and association were used for this purpose. Forest type and density maps were evaluated for classification accuracy using second set of field data. The slope, aspect and elevation maps were gen-erated from topographic maps through scanning and digiti-zation using ArcView. Disturbance features, viz. roads and settlements were also taken from topographic maps. Con-tinuous surfaces of distances from water bodies and settle-ments were generated for proximity analysis. All the input map layers were co-registered with sub-pixel accuracy.
Geostatistical analysis
The field data were statistically analysed to understand the habitat use pattern by the two ungulate species. This included Principal Component Analysis (PCA), Discrimi-nant Function Analysis (DFA) and Binomial Multiple Logistic Regression (BMLR). PCA: All cases were first filtered on the basis of the sighting of individual species and the PCA (correlation coefficients, varimax rotation) was run on the dataset.
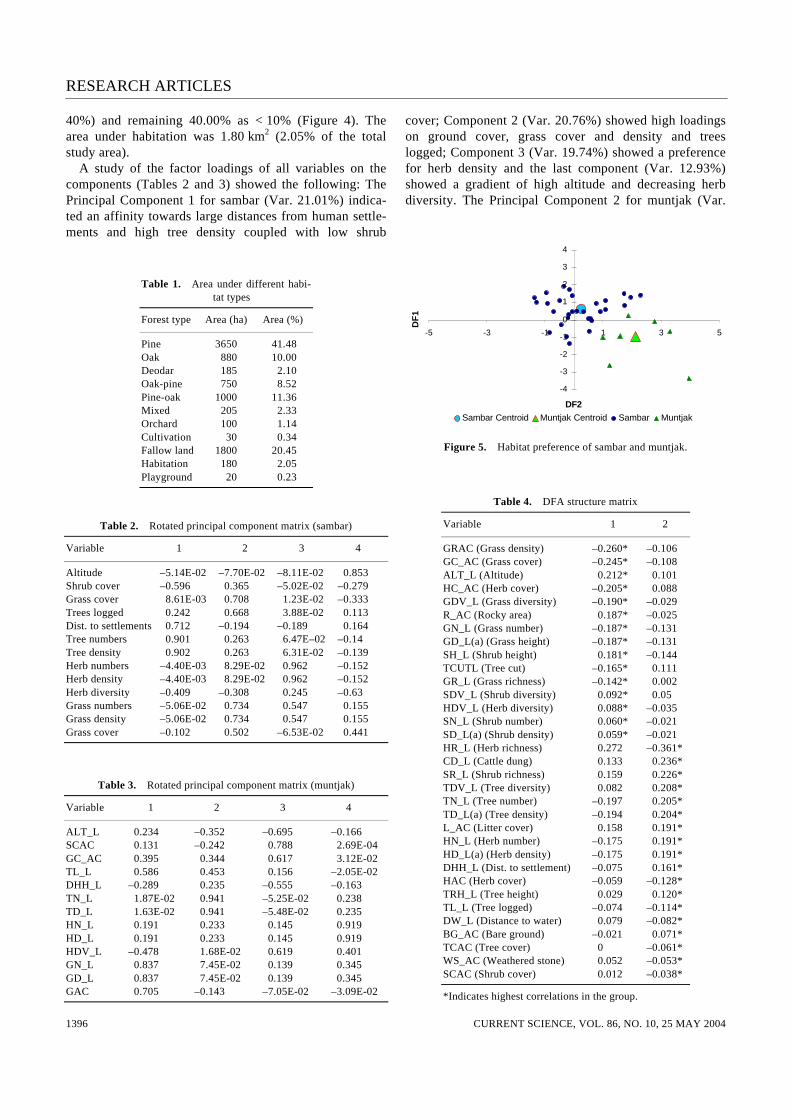
Variables showing very low loadings on the rotated com-ponent matrices were successively dropped to reduce the noise in the dataset and ultimately 13 variables were seen to explain maximum variation (75.96%, 4 factors: muntjak, 74.45%, 4 factors; sambar) and were analysed in conjunc-tion with DFA to arrive at patterns of habitat differentia-tion and preference by the two species. DFA: Discriminant function analysis was used to inves-tigate the habitat differentiation by the species. It was obser-ved that as only two species were involved, the DFA would produce only one function. This would limit the analysis solely to the magnitudes of the discriminant functions. Also, this would entail making the relative loca-tion of the two species vis-à-vis the functions difficult. To work around this problem, the cases were grouped and recoded into three classes, two for pure sightings in each species and one for mixed sightings (Df. 30; sambar, Df. 8; muntjak, Df. 20; mixed), and the three recoded cases used as input for the DFA (Df. 58, 27 variables). The relative location of the group centroids (Figure 5) for the two pure-case variables was then analysed against the deri-ved (now two) discriminant functions to conclude the ‘exclusive’ habitat usage between the two species. All the variables were entered into the analysis to elicit differ-ences between the responses of the DFA to the various measured landscape variables. The DFA resulted in the correct classification of 79.3% of the cases and showed canonical correlation coefficients of 0.737 and 0.529 for the first and the second function respectively. The signi-ficance levels obtained, however, were not impressive as there was a big difference between the number of variables included and the number of valid cases. BMLR: Six variables in the dataset were seen as suitable proxies for the satellite-derived data and were used as inde-pendents in the analysis. Two variables, among the six considered, had been previously recoded and were thus specified as categorical. Individual cases of animal sight-ings were considered as Boolean and a binomial multiple logistic regression was run. Outliers in the dataset were detected using studentized standard deviations of residu-als greater than specified cut intervals (± 2.0 for muntjak and ± 1.8 for sambar). The cases producing the outliers were successively screened until 85% (± 125) cases re-mained within the dataset. Overall classification accura-cies of 97.62% and 87.80% were obtained at a 0.4 proba-bility cut-off for muntjak (Df 126, R2: 0.886 (Nagelkerke pseudo R2)) and sambar (Df 123, R2: 0.773) respectively. The coefficients thus obtained were then used for subse-quent raster analysis (distribution mapping) on ILWIS 3.1 software. The result was Logit transformed [P = {exp(a + BX…)/(1 + (exp(a + BX…)))}] to obtain absolute habitat occupancy map. For obtaining the habitat preferences the output was re-scaled to a range of 1–10 and was subject-ted to an exponential transformation to produce the most
RESEARCH ARTICLES
CURRENT SCIENCE, VOL. 86, NO. 10, 25 MAY 2004 1394
Figure 2. IRS LISS-III false colour composite of the study area.
Figure 3. Habitat map generated from satellite imagery.
RESEARCH ARTICLES
CURRENT SCIENCE, VOL. 86, NO. 10, 25 MAY 2004 1395
Figure 4. Forest density in the study area.
conservative estimates possible. The transformed output was then equal-interval sliced into not suitable, moder-ately suitable, suitable and highly suitable categories. The models derived were: Sambar: HIS = {exp(0.0309* ALTITUDE + 24.8315* TC100 – 0.0175* DISTW + 0.0092* DISTHH + ASPECT* (Coeff.) + SLOPE* (Coeff.) –78.8907)/(1 + (exp(0.0309* ALTITUDE + 24.8315* TC100 – 0.0175* DISTW + 0.0092* DISTHH + ASPECT* (Coeff.) + SLOPE* (Coeff.) – 78.8907))}
Coefficients (sambar)
Aspect Coefficients
ASPECT(1) –14.2555 ASPECT(2) 3.9879 ASPECT(3) –0.9184 ASPECT(4) –1.4369 ASPECT(5) 0.0607 ASPECT(6) –6.7155 ASPECT(7) –2.5471 ASPECT(8) 0.0000
Slope
SLOPE(1) –1.6300 SLOPE(2) 0.2705 SLOPE(3) 0.0000
Muntjak: HSI = {exp(0.2527* ALTITUDE + 22.615* TC100 – 0.0287* DISTW – 0.0002* DISTHH + ASPECT* (Coeff.) + SLOPE* (Coeff.) – 543.035)/(1 + exp(0.2527*
ALTITUDE + 22.615* TC100 – 0.0287* DISTW – 0.0002* DISTHH + ASPECT* (Coeff.) + SLOPE* (Coeff.) –
543.035))}
Coefficients (muntjak)
Aspect Coefficients
ASPECT(1) 2.6509 ASPECT(2) 85.4775 ASPECT(3) –0.8746 ASPECT(4) 19.3989 ASPECT(5) 85.7738 ASPECT(6) 21.4075 ASPECT(7) 45.8798 ASPECT(8) 0.0000
Slope
SLOPE(1) –55.3976 SLOPE(2) –19.2510 SLOPE(3) 0.0000
Results
Table 1 gives details of the different habitat types in the study area. Chirpine was the dominant vegetation in the area followed by pine-oak and the oak. Among the non-forest categories, fallow land was most prevalent. Forest density varies with respect to environmental gradients in the study area. About 17.04% forests were classified as dense forest (canopy density >70%), 23.85% as medium dense (density 40–70%), 19.20% as open (density 10–
RESEARCH ARTICLES
CURRENT SCIENCE, VOL. 86, NO. 10, 25 MAY 2004 1396
40%) and remaining 40.00% as < 10% (Figure 4). The area under habitation was 1.80 km2 (2.05% of the total study area). A study of the factor loadings of all variables on the components (Tables 2 and 3) showed the following: The Principal Component 1 for sambar (Var. 21.01%) indica-ted an affinity towards large distances from human settle-ments and high tree density coupled with low shrub
Table 1. Area under different habi- tat types
Forest type Area (ha) Area (%)
Pine 3650 41.48 Oak 880 10.00 Deodar 185 2.10 Oak-pine 750 8.52 Pine-oak 1000 11.36 Mixed 205 2.33 Orchard 100 1.14 Cultivation 30 0.34 Fallow land 1800 20.45 Habitation 180 2.05 Playground 20 0.23
Table 2. Rotated principal component matrix (sambar)
Variable 1 2 3 4
Altitude –5.14E-02 –7.70E-02 –8.11E-02 0.853 Shrub cover –0.596 0.365 –5.02E-02 –0.279 Grass cover 8.61E-03 0.708 1.23E-02 –0.333 Trees logged 0.242 0.668 3.88E-02 0.113 Dist. to settlements 0.712 –0.194 –0.189 0.164 Tree numbers 0.901 0.263 6.47E–02 –0.14 Tree density 0.902 0.263 6.31E-02 –0.139 Herb numbers –4.40E-03 8.29E-02 0.962 –0.152 Herb density –4.40E-03 8.29E-02 0.962 –0.152 Herb diversity –0.409 –0.308 0.245 –0.63 Grass numbers –5.06E-02 0.734 0.547 0.155 Grass density –5.06E-02 0.734 0.547 0.155 Grass cover –0.102 0.502 –6.53E-02 0.441
Table 3. Rotated principal component matrix (muntjak)
Variable 1 2 3 4
ALT_L 0.234 –0.352 –0.695 –0.166 SCAC 0.131 –0.242 0.788 2.69E-04 GC_AC 0.395 0.344 0.617 3.12E-02 TL_L 0.586 0.453 0.156 –2.05E-02 DHH_L –0.289 0.235 –0.555 –0.163 TN_L 1.87E-02 0.941 –5.25E-02 0.238 TD_L 1.63E-02 0.941 –5.48E-02 0.235 HN_L 0.191 0.233 0.145 0.919 HD_L 0.191 0.233 0.145 0.919 HDV_L –0.478 1.68E-02 0.619 0.401 GN_L 0.837 7.45E-02 0.139 0.345 GD_L 0.837 7.45E-02 0.139 0.345 GAC 0.705 –0.143 –7.05E-02 –3.09E-02
cover; Component 2 (Var. 20.76%) showed high loadings on ground cover, grass cover and density and trees logged; Component 3 (Var. 19.74%) showed a preference for herb density and the last component (Var. 12.93%) showed a gradient of high altitude and decreasing herb diversity. The Principal Component 2 for muntjak (Var.
-4
-3
-2
-1
0
1
2
3
4
-5 -3 -1 1 3 5
DF2D
F1
Sambar Centroid Muntjak Centroid Sambar Muntjak
Figure 5. Habitat preference of sambar and muntjak.
Table 4. DFA structure matrix
Variable 1 2
GRAC (Grass density) –0.260* –0.106 GC_AC (Grass cover) –0.245* –0.108 ALT_L (Altitude) 0.212* 0.101 HC_AC (Herb cover) –0.205* 0.088 GDV_L (Grass diversity) –0.190* –0.029 R_AC (Rocky area) 0.187* –0.025 GN_L (Grass number) –0.187* –0.131 GD_L(a) (Grass height) –0.187* –0.131 SH_L (Shrub height) 0.181* –0.144 TCUTL (Tree cut) –0.165* 0.111 GR_L (Grass richness) –0.142* 0.002 SDV_L (Shrub diversity) 0.092* 0.05 HDV_L (Herb diversity) 0.088* –0.035 SN_L (Shrub number) 0.060* –0.021 SD_L(a) (Shrub density) 0.059* –0.021 HR_L (Herb richness) 0.272 –0.361* CD_L (Cattle dung) 0.133 0.236* SR_L (Shrub richness) 0.159 0.226* TDV_L (Tree diversity) 0.082 0.208* TN_L (Tree number) –0.197 0.205* TD_L(a) (Tree density) –0.194 0.204* L_AC (Litter cover) 0.158 0.191* HN_L (Herb number) –0.175 0.191* HD_L(a) (Herb density) –0.175 0.191* DHH_L (Dist. to settlement) –0.075 0.161* HAC (Herb cover) –0.059 –0.128* TRH_L (Tree height) 0.029 0.120* TL_L (Tree logged) –0.074 –0.114* DW_L (Distance to water) 0.079 –0.082* BG_AC (Bare ground) –0.021 0.071* TCAC (Tree cover) 0 –0.061* WS_AC (Weathered stone) 0.052 –0.053* SCAC (Shrub cover) 0.012 –0.038*
*Indicates highest correlations in the group.
RESEARCH ARTICLES
CURRENT SCIENCE, VOL. 86, NO. 10, 25 MAY 2004 1397
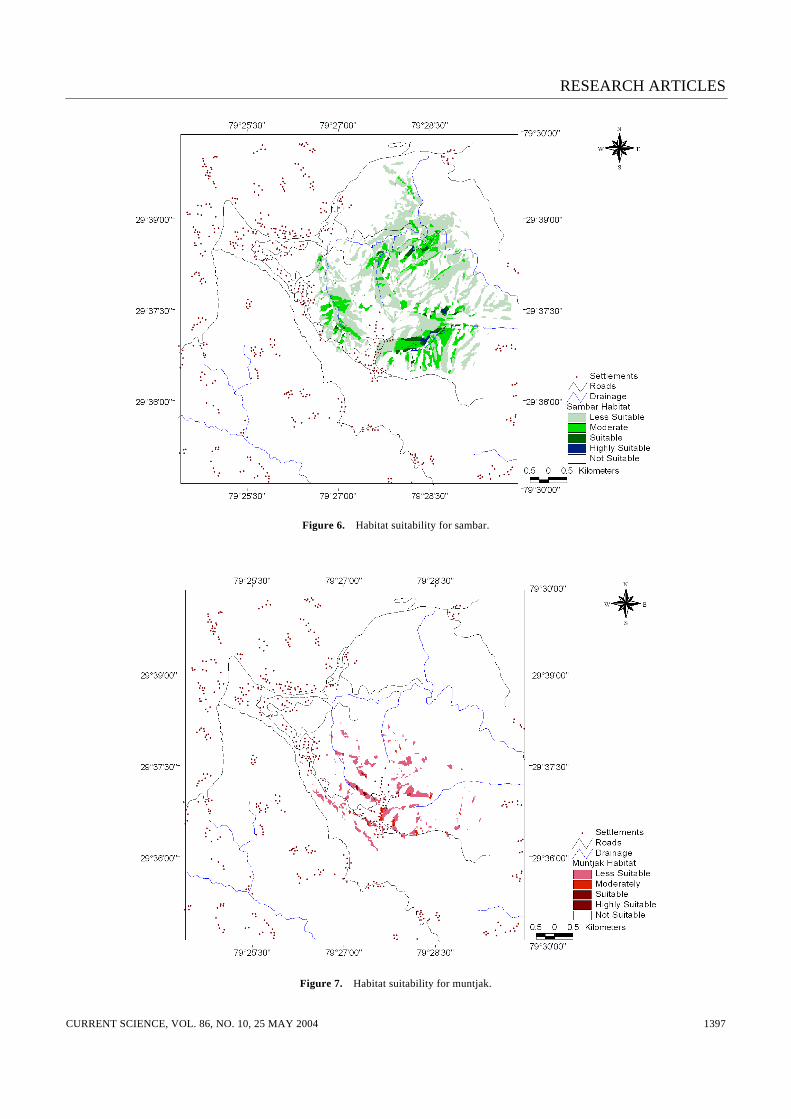
Figure 6. Habitat suitability for sambar.
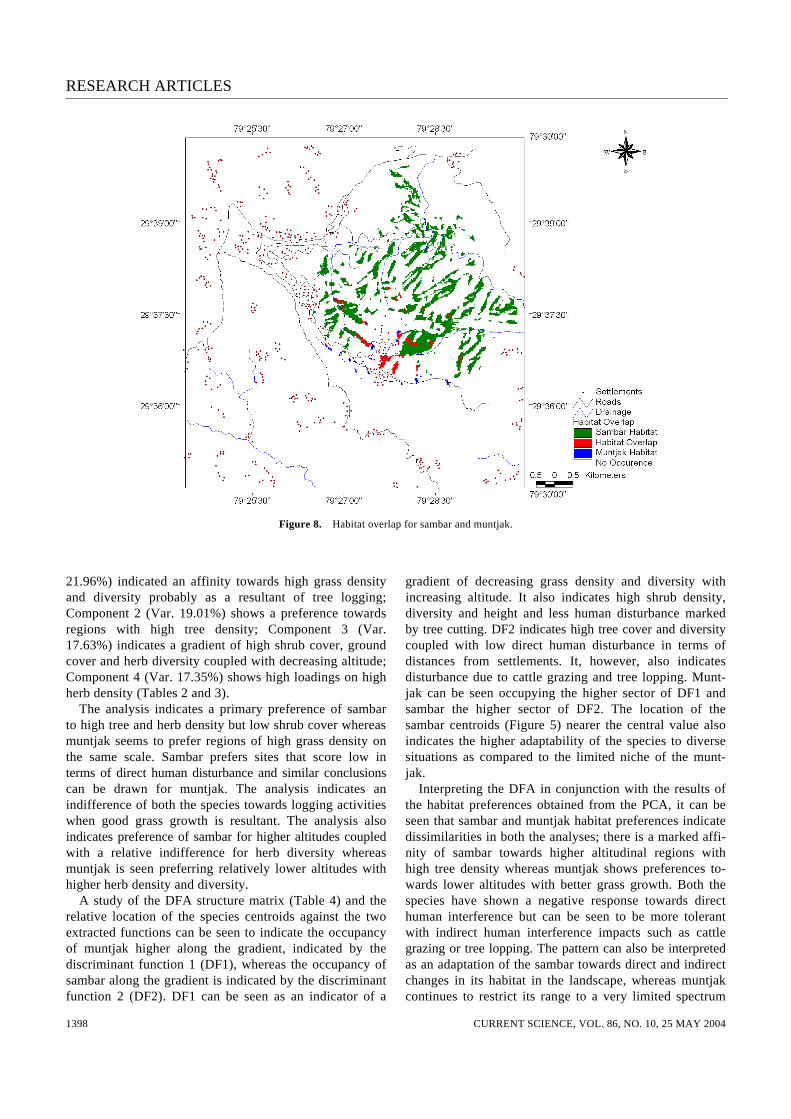
Figure 7. Habitat suitability for muntjak.
RESEARCH ARTICLES
CURRENT SCIENCE, VOL. 86, NO. 10, 25 MAY 2004 1398
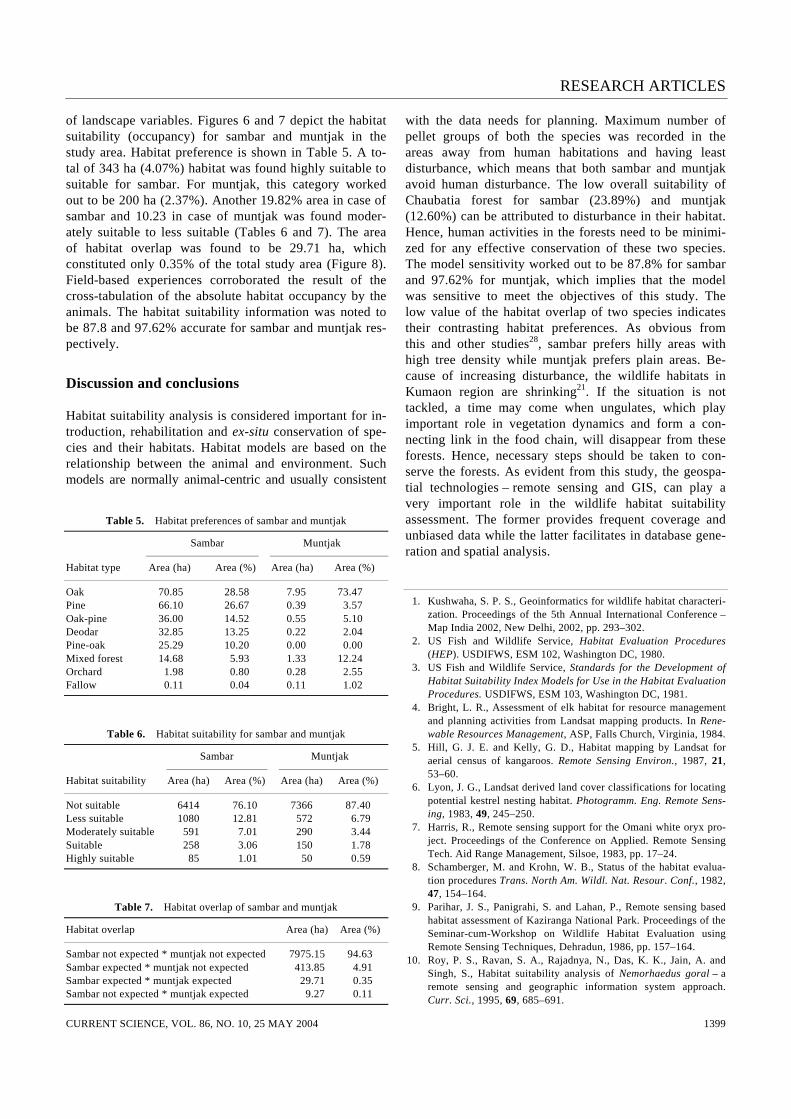
Figure 8. Habitat overlap for sambar and muntjak.
21.96%) indicated an affinity towards high grass density and diversity probably as a resultant of tree logging; Component 2 (Var. 19.01%) shows a preference towards regions with high tree density; Component 3 (Var. 17.63%) indicates a gradient of high shrub cover, ground cover and herb diversity coupled with decreasing altitude; Component 4 (Var. 17.35%) shows high loadings on high herb density (Tables 2 and 3). The analysis indicates a primary preference of sambar to high tree and herb density but low shrub cover whereas muntjak seems to prefer regions of high grass density on the same scale. Sambar prefers sites that score low in terms of direct human disturbance and similar conclusions can be drawn for muntjak. The analysis indicates an indifference of both the species towards logging activities when good grass growth is resultant. The analysis also indicates preference of sambar for higher altitudes coupled with a relative indifference for herb diversity whereas muntjak is seen preferring relatively lower altitudes with higher herb density and diversity. A study of the DFA structure matrix (Table 4) and the relative location of the species centroids against the two extracted functions can be seen to indicate the occupancy of muntjak higher along the gradient, indicated by the discriminant function 1 (DF1), whereas the occupancy of sambar along the gradient is indicated by the discriminant function 2 (DF2). DF1 can be seen as an indicator of a
gradient of decreasing grass density and diversity with increasing altitude. It also indicates high shrub density, diversity and height and less human disturbance marked by tree cutting. DF2 indicates high tree cover and diversity coupled with low direct human disturbance in terms of distances from settlements. It, however, also indicates disturbance due to cattle grazing and tree lopping. Munt-jak can be seen occupying the higher sector of DF1 and sambar the higher sector of DF2. The location of the sambar centroids (Figure 5) nearer the central value also indicates the higher adaptability of the species to diverse situations as compared to the limited niche of the munt-jak. Interpreting the DFA in conjunction with the results of the habitat preferences obtained from the PCA, it can be seen that sambar and muntjak habitat preferences indicate dissimilarities in both the analyses; there is a marked affi-nity of sambar towards higher altitudinal regions with high tree density whereas muntjak shows preferences to-wards lower altitudes with better grass growth. Both the species have shown a negative response towards direct human interference but can be seen to be more tolerant with indirect human interference impacts such as cattle grazing or tree lopping. The pattern can also be interpreted as an adaptation of the sambar towards direct and indirect changes in its habitat in the landscape, whereas muntjak continues to restrict its range to a very limited spectrum
RESEARCH ARTICLES
CURRENT SCIENCE, VOL. 86, NO. 10, 25 MAY 2004 1399
of landscape variables. Figures 6 and 7 depict the habitat suitability (occupancy) for sambar and muntjak in the study area. Habitat preference is shown in Table 5. A to-tal of 343 ha (4.07%) habitat was found highly suitable to suitable for sambar. For muntjak, this category worked out to be 200 ha (2.37%). Another 19.82% area in case of sambar and 10.23 in case of muntjak was found moder-ately suitable to less suitable (Tables 6 and 7). The area of habitat overlap was found to be 29.71 ha, which constituted only 0.35% of the total study area (Figure 8). Field-based experiences corroborated the result of the cross-tabulation of the absolute habitat occupancy by the animals. The habitat suitability information was noted to be 87.8 and 97.62% accurate for sambar and muntjak res-pectively.
Discussion and conclusions
Habitat suitability analysis is considered important for in-troduction, rehabilitation and ex-situ conservation of spe-cies and their habitats. Habitat models are based on the relationship between the animal and environment. Such models are normally animal-centric and usually consistent
Table 5. Habitat preferences of sambar and muntjak
Sambar Muntjak
Habitat type Area (ha) Area (%) Area (ha) Area (%)
Oak 70.85 28.58 7.95 73.47 Pine 66.10 26.67 0.39 3.57 Oak-pine 36.00 14.52 0.55 5.10 Deodar 32.85 13.25 0.22 2.04 Pine-oak 25.29 10.20 0.00 0.00 Mixed forest 14.68 5.93 1.33 12.24 Orchard 1.98 0.80 0.28 2.55 Fallow 0.11 0.04 0.11 1.02
Table 6. Habitat suitability for sambar and muntjak
Sambar Muntjak
Habitat suitability Area (ha) Area (%) Area (ha) Area (%)
Not suitable 6414 76.10 7366 87.40 Less suitable 1080 12.81 572 6.79 Moderately suitable 591 7.01 290 3.44 Suitable 258 3.06 150 1.78 Highly suitable 85 1.01 50 0.59
Table 7. Habitat overlap of sambar and muntjak
Habitat overlap Area (ha) Area (%)
Sambar not expected * muntjak not expected 7975.15 94.63 Sambar expected * muntjak not expected 413.85 4.91 Sambar expected * muntjak expected 29.71 0.35 Sambar not expected * muntjak expected 9.27 0.11
with the data needs for planning. Maximum number of pellet groups of both the species was recorded in the areas away from human habitations and having least disturbance, which means that both sambar and muntjak avoid human disturbance. The low overall suitability of Chaubatia forest for sambar (23.89%) and muntjak (12.60%) can be attributed to disturbance in their habitat. Hence, human activities in the forests need to be minimi-zed for any effective conservation of these two species. The model sensitivity worked out to be 87.8% for sambar and 97.62% for muntjak, which implies that the model was sensitive to meet the objectives of this study. The low value of the habitat overlap of two species indicates their contrasting habitat preferences. As obvious from this and other studies28, sambar prefers hilly areas with high tree density while muntjak prefers plain areas. Be-cause of increasing disturbance, the wildlife habitats in Kumaon region are shrinking21. If the situation is not tackled, a time may come when ungulates, which play important role in vegetation dynamics and form a con-necting link in the food chain, will disappear from these forests. Hence, necessary steps should be taken to con-serve the forests. As evident from this study, the geospa-tial technologies – remote sensing and GIS, can play a very important role in the wildlife habitat suitability assessment. The former provides frequent coverage and unbiased data while the latter facilitates in database gene-ration and spatial analysis.
1. Kushwaha, S. P. S., Geoinformatics for wildlife habitat characteri-zation. Proceedings of the 5th Annual International Conference – Map India 2002, New Delhi, 2002, pp. 293–302.
2. US Fish and Wildlife Service, Habitat Evaluation Procedures (HEP). USDIFWS, ESM 102, Washington DC, 1980.
3. US Fish and Wildlife Service, Standards for the Development of Habitat Suitability Index Models for Use in the Habitat Evaluation Procedures. USDIFWS, ESM 103, Washington DC, 1981.
4. Bright, L. R., Assessment of elk habitat for resource management and planning activities from Landsat mapping products. In Rene-wable Resources Management, ASP, Falls Church, Virginia, 1984.
5. Hill, G. J. E. and Kelly, G. D., Habitat mapping by Landsat for aerial census of kangaroos. Remote Sensing Environ., 1987, 21, 53–60.
6. Lyon, J. G., Landsat derived land cover classifications for locating potential kestrel nesting habitat. Photogramm. Eng. Remote Sens-ing, 1983, 49, 245–250.
7. Harris, R., Remote sensing support for the Omani white oryx pro-ject. Proceedings of the Conference on Applied. Remote Sensing Tech. Aid Range Management, Silsoe, 1983, pp. 17–24.
8. Schamberger, M. and Krohn, W. B., Status of the habitat evalua-tion procedures Trans. North Am. Wildl. Nat. Resour. Conf., 1982, 47, 154–164.
9. Parihar, J. S., Panigrahi, S. and Lahan, P., Remote sensing based habitat assessment of Kaziranga National Park. Proceedings of the Seminar-cum-Workshop on Wildlife Habitat Evaluation using Remote Sensing Techniques, Dehradun, 1986, pp. 157–164.
10. Roy, P. S., Ravan, S. A., Rajadnya, N., Das, K. K., Jain, A. and Singh, S., Habitat suitability analysis of Nemorhaedus goral – a remote sensing and geographic information system approach. Curr. Sci., 1995, 69, 685–691.
RESEARCH ARTICLES
CURRENT SCIENCE, VOL. 86, NO. 10, 25 MAY 2004 1400
11. Porwal, M. C., Roy, P. S. and Chellamuthu, V., Wildlife habitat analysis for sambar (Cervus unicolor) in Kanha National Park us-ing remote sensing. Int. J. Remote Sensing, 1996, 17, 2683–2697.
12. Kushwaha, S. P. S., Roy, P. S., Azeem, A., Boruah, P. and Lahan, P., Land area change and rhino habitat suitability analysis in Kaziranga National Park, Assam. Tigerpaper, 2000, 27, 9–17.
13. Kushwaha, S. P. S., Munkhtuya, S. and Roy, P. S., Mountain goat habitat evaluation in Rajaji National Park using remote sensing and GIS. J. Indian Soc. Remote Sensing, 2000, 28, 293–303.
14. Pant, A., Chavan, S. G., Roy, P. S. and Das, K. K., Habitat analy-sis for sambar in Corbett National Park using remote sensing and GIS. J. Indian Soc. Remote Sensing, 2000, 27, 133–139.
15. Alfred, J. R. B., Kankane, P. L., Kumar, A., Roy, P. S., Singh, S. and Verma. M., Habitat suitability analysis for chinkara, Gazella bennetti in Rajasthan: a remote sensing and GIS approach. ZSI Occ. Pap., 2001, 189, 1–73.
16. Duncan, B. W., Breininger, D. R., Schmalzer, P. A. and Larson, V. L., Validating a Florida scrub jay habitat suitability model us-ing demography data on Kennedy Space Center, Photogramm. Eng. Remote Sensing, 1995, 61, 1361–1370.
17. Goldblatt, I. A., Using ARC/INFO and the national wetland inven-tory to model swamp rabbit (Sylviilagus aquaticus) habitats. Pro-ceedings of the 13th Annual ESRI Conference, Wetlands, Environmental System Research Institute, 1993, vol. 1, pp. 215–276.
18. Wiersema, G., Ibex habitat analysis using Landsat imagery. ITC J., 1983, 2, 139–147.
19. Kushwaha, S. P. S. and Roy, P. S., Geospatial technology for wildlife habitat evaluation. Trop. Ecol., 2002, 43, 137–150.
20. Johnsingh, A. J. T. and Negi, A. S., Chowgarh hills, where tiger once prowled. WII Newsl., 1997, 4, 1–4.
21. Ilyas, Orus, Khan, J. A. and Khan, A., Status, abundance and fac-tors governing distribution of ungulates in Kumaon Himalaya. India. Int. J. Ecol. Environ. Sci., 2003, 29, 123–130.
22. Champion, H. G. and Seth, S. K., A Revised Survey of Forest Types of India, Manager of Publications, Government of India, New Delhi, 1968.
23. Prater, S. H., Book of Indian Animals, Oxford University Press, London, 1971.
24. Ghildiyal, B. P., In The Himalaya: Aspects of Change (ed. Lal, J. S.), Oxford University Press, New Delhi, 1981, pp. 120–130.
25. Ahmed, A., Population status, distribution and some aspects of behaviour of white crested kaleej (Loohura leucomelena) in Ranikhet region of Kumaon Himalaya. Unpublished Ph D thesis, Aligarh Muslim University, Aligarh, 1995.
26. Mani, A., The climate of Himalaya. The Himalaya: Aspects of Change, Oxford University Press, New Delhi, 1981, pp. 3–15.
27. McCain, R., A method for measuring deer range use. Trans. North Am. Wildl. Nat. Resour. Conf., 1948, 13, 431–441.
28. Jathanna, D., Ullas Karanth, K. and Johnsingh, A. J. T., Density, biomass and habitat occupancy of ungulates in Bhadra Tiger Re-serve, Karnataka. Final Report, Save the Tiger Fund, National Fish and Wildlife Foundation, Washington DC, 2003, pp. 1–57.
ACKNOWLEDGEMENTS. We thank Dr R. R. Navalgund, Director, National Remote Sensing Agency, Hyderabad; Dr P. S. Roy, Dean, In-dian Institute of Remote Sensing, Dehradun, and Prof. H. S. A. Yahya, Chairman, Department of Wildlife Science, Aligarh Muslim University, Aligarh for encouragement and the opportunity. Thanks are also due to the officials of Uttaranchal Forest Department for their co-operation during this study. We thank Dr G. S. Rawat, Head, Habitat Ecology Division, Wildlife Institute of India, Dehradun for critical comments on the manuscript.
Received 26 May 2003; revised accepted 14 January 2004
Related Documents