Evaluation of Rural Intersection Treatments Final Report | May 2018 Sponsored by Iowa Highway Research Board (IHRB Project TR-695) Iowa Department of Transportation (InTrans Project 15-549) Midwest Transportation Center U.S. DOT Office of the Assistant Secretary for Research and Technology

Welcome message from author
This document is posted to help you gain knowledge. Please leave a comment to let me know what you think about it! Share it to your friends and learn new things together.
Transcript
Evaluation of Rural Intersection Treatments
Final Report | May 2018
Sponsored byIowa Highway Research Board (IHRB Project TR-695)Iowa Department of Transportation (InTrans Project 15-549)Midwest Transportation CenterU.S. DOT Office of the Assistant Secretary for Research and Technology

About MTCThe Midwest Transportation Center (MTC) is a regional University Transportation Center (UTC) sponsored by the U.S. Department of Transportation Office of the Assistant Secretary for Research and Technology (USDOT/OST-R). The mission of the UTC program is to advance U.S. technology and expertise in the many disciplines comprising transportation through the mechanisms of education, research, and technology transfer at university-based centers of excellence. Iowa State University, through its Institute for Transportation (InTrans), is the MTC lead institution.
About CTREThe mission of the Center for Transportation Research and Education (CTRE) at Iowa State University is to develop and implement innovative methods, materials, and technologies for improving transportation efficiency, safety, and reliability while improving the learning environment of students, faculty, and staff in transportation-related fields.
ISU Non-Discrimination Statement Iowa State University does not discriminate on the basis of race, color, age, ethnicity, religion, national origin, pregnancy, sexual orientation, gender identity, genetic information, sex, marital status, disability, or status as a U.S. veteran. Inquiries regarding non-discrimination policies may be directed to Office of Equal Opportunity, 3410 Beardshear Hall, 515 Morrill Road, Ames, Iowa 50011, Tel. 515-294-7612, Hotline: 515-294-1222, email [email protected].
NoticeThe contents of this report reflect the views of the authors, who are responsible for the facts and the accuracy of the information presented herein. The opinions, findings and conclusions expressed in this publication are those of the authors and not necessarily those of the sponsors.
This document is disseminated under the sponsorship of the U.S. DOT UTC program in the interest of information exchange. The U.S. Government assumes no liability for the use of the information contained in this document. This report does not constitute a standard, specification, or regulation.
The U.S. Government does not endorse products or manufacturers. If trademarks or manufacturers’ names appear in this report, it is only because they are considered essential to the objective of the document.
Quality Assurance StatementThe Federal Highway Administration (FHWA) provides high-quality information to serve Government, industry, and the public in a manner that promotes public understanding. Standards and policies are used to ensure and maximize the quality, objectivity, utility, and integrity of its information. The FHWA periodically reviews quality issues and adjusts its programs and processes to ensure continuous quality improvement.
Iowa DOT Statements Federal and state laws prohibit employment and/or public accommodation discrimination on the basis of age, color, creed, disability, gender identity, national origin, pregnancy, race, religion, sex, sexual orientation or veteran’s status. If you believe you have been discriminated against, please contact the Iowa Civil Rights Commission at 800-457-4416 or the Iowa Department of Transportation affirmative action officer. If you need accommodations because of a disability to access the Iowa Department of Transportation’s services, contact the agency’s affirmative action officer at 800-262-0003.
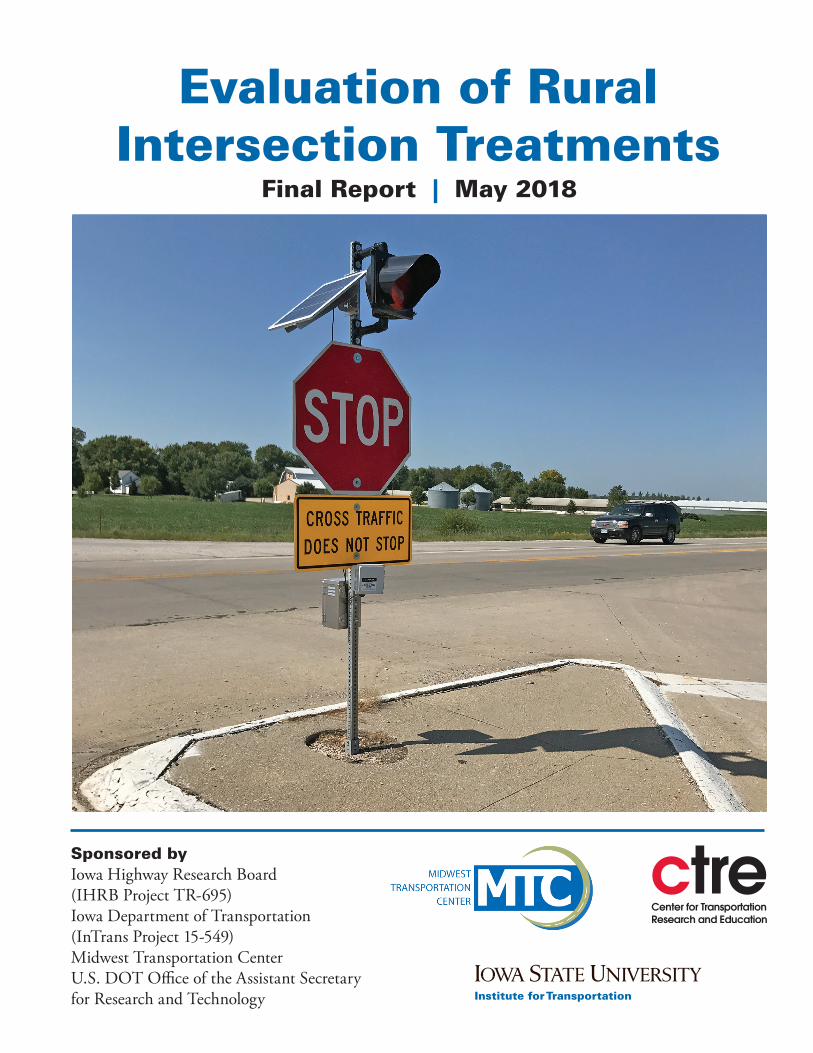
Front Cover Image Raju Thapa/Institute for Transportation
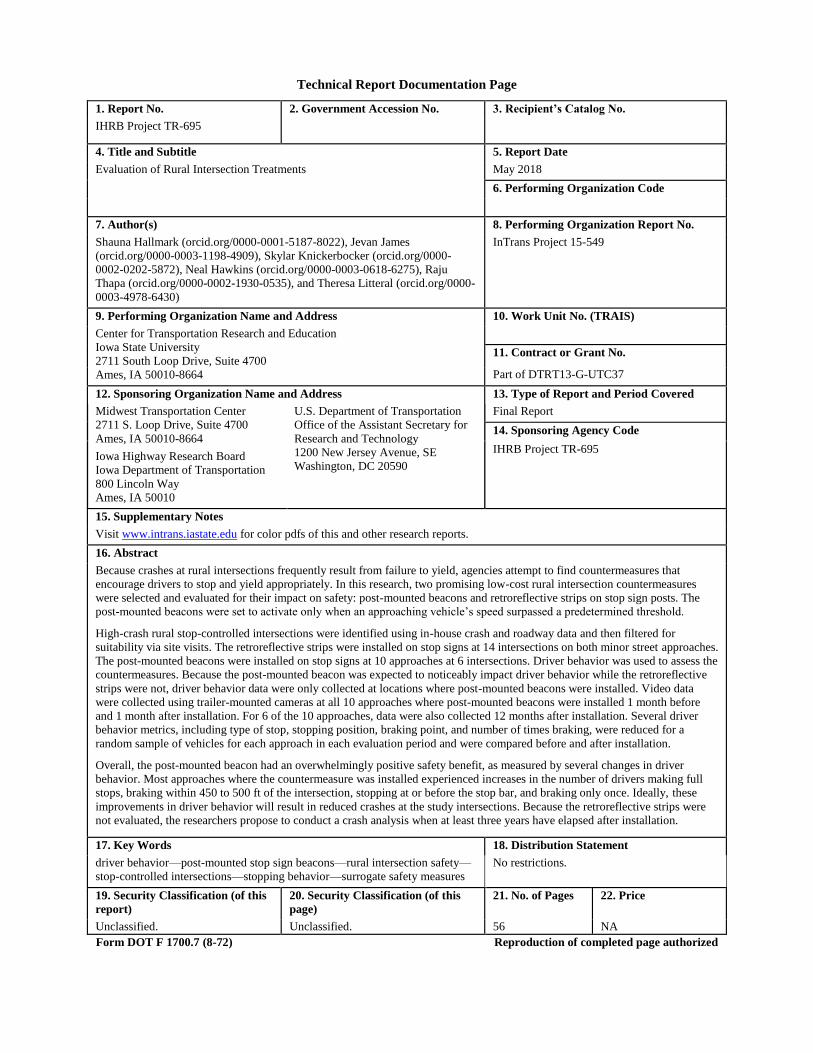
Technical Report Documentation Page
1. Report No. 2. Government Accession No. 3. Recipient’s Catalog No.
IHRB Project TR-695
4. Title and Subtitle 5. Report Date
Evaluation of Rural Intersection Treatments May 2018
6. Performing Organization Code
7. Author(s) 8. Performing Organization Report No.
Shauna Hallmark (orcid.org/0000-0001-5187-8022), Jevan James
(orcid.org/0000-0003-1198-4909), Skylar Knickerbocker (orcid.org/0000-
0002-0202-5872), Neal Hawkins (orcid.org/0000-0003-0618-6275), Raju
Thapa (orcid.org/0000-0002-1930-0535), and Theresa Litteral (orcid.org/0000-
0003-4978-6430)
InTrans Project 15-549
9. Performing Organization Name and Address 10. Work Unit No. (TRAIS)
Center for Transportation Research and Education
Iowa State University
2711 South Loop Drive, Suite 4700
Ames, IA 50010-8664
11. Contract or Grant No.
Part of DTRT13-G-UTC37
12. Sponsoring Organization Name and Address 13. Type of Report and Period Covered
Midwest Transportation Center
2711 S. Loop Drive, Suite 4700
Ames, IA 50010-8664
Iowa Highway Research Board
Iowa Department of Transportation
800 Lincoln Way
Ames, IA 50010
U.S. Department of Transportation
Office of the Assistant Secretary for
Research and Technology
1200 New Jersey Avenue, SE
Washington, DC 20590
Final Report
14. Sponsoring Agency Code
IHRB Project TR-695
15. Supplementary Notes
Visit www.intrans.iastate.edu for color pdfs of this and other research reports.
16. Abstract
Because crashes at rural intersections frequently result from failure to yield, agencies attempt to find countermeasures that
encourage drivers to stop and yield appropriately. In this research, two promising low-cost rural intersection countermeasures
were selected and evaluated for their impact on safety: post-mounted beacons and retroreflective strips on stop sign posts. The
post-mounted beacons were set to activate only when an approaching vehicle’s speed surpassed a predetermined threshold.
High-crash rural stop-controlled intersections were identified using in-house crash and roadway data and then filtered for
suitability via site visits. The retroreflective strips were installed on stop signs at 14 intersections on both minor street approaches.
The post-mounted beacons were installed on stop signs at 10 approaches at 6 intersections. Driver behavior was used to assess the
countermeasures. Because the post-mounted beacon was expected to noticeably impact driver behavior while the retroreflective
strips were not, driver behavior data were only collected at locations where post-mounted beacons were installed. Video data
were collected using trailer-mounted cameras at all 10 approaches where post-mounted beacons were installed 1 month before
and 1 month after installation. For 6 of the 10 approaches, data were also collected 12 months after installation. Several driver
behavior metrics, including type of stop, stopping position, braking point, and number of times braking, were reduced for a
random sample of vehicles for each approach in each evaluation period and were compared before and after installation.
Overall, the post-mounted beacon had an overwhelmingly positive safety benefit, as measured by several changes in driver
behavior. Most approaches where the countermeasure was installed experienced increases in the number of drivers making full
stops, braking within 450 to 500 ft of the intersection, stopping at or before the stop bar, and braking only once. Ideally, these
improvements in driver behavior will result in reduced crashes at the study intersections. Because the retroreflective strips were
not evaluated, the researchers propose to conduct a crash analysis when at least three years have elapsed after installation.
17. Key Words 18. Distribution Statement
driver behavior—post-mounted stop sign beacons—rural intersection safety—
stop-controlled intersections—stopping behavior—surrogate safety measures
No restrictions.
19. Security Classification (of this
report)
20. Security Classification (of this
page)
21. No. of Pages 22. Price
Unclassified. Unclassified.
56 NA
Form DOT F 1700.7 (8-72) Reproduction of completed page authorized


EVALUATION OF RURAL INTERSECTION
TREATMENTS
Final Report
May 2018
Principal Investigator
Shauna Hallmark, Director
Institute for Transportation, Iowa State University
Co-Principal Investigator
Neal Hawkins, Associate Director
Institute for Transportation, Iowa State University
Research Assistants
Jevan James and Raju Thapa
Authors
Shauna Hallmark, Jevan James, Skylar Knickerbocker, Neal Hawkins,
Raju Thapa, and Theresa Litteral
Sponsored by
Iowa Highway Research Board
(IHRB Project TR-695),
Iowa Department of Transportation,
Midwest Transportation Center, and
U.S. Department of Transportation
Office of the Assistant Secretary for Research and Technology
Preparation of this report was financed in part
through funds provided by the Iowa Department of Transportation
through its Research Management Agreement with the
Institute for Transportation
(InTrans Project 15-549)
A report from
Institute for Transportation
Iowa State University
2711 South Loop Drive, Suite 4700
Ames, IA 50010-8664
Phone: 515-294-8103 / Fax: 515-294-0467
www.intrans.iastate.edu


v
TABLE OF CONTENTS
ACKNOWLEDGMENTS ............................................................................................................ vii
EXECUTIVE SUMMARY ........................................................................................................... ix
Background and Objectives ............................................................................................... ix Site and Countermeasure Selection ................................................................................... ix Data Collection ....................................................................................................................x Results and Summary ..........................................................................................................x Discussion ......................................................................................................................... xii
1. BACKGROUND .........................................................................................................................1
1.1 Scope of Problem ...........................................................................................................1
1.2 Objectives ......................................................................................................................1
1.3 Selection of Countermeasures........................................................................................1 1.4 Treatment Selection .......................................................................................................7
2. SITE SELECTION ......................................................................................................................9
3. DESCRIPTION OF TREATMENT AND INSTALLATION ..................................................13
3.1 Speed-Activated Stop Sign Beacons ............................................................................13 3.2 Retroreflective Strips on Stop Sign Posts ....................................................................14
4. DATA COLLECTION AND REDUCTION.............................................................................20
4.1 Data Collection ............................................................................................................20
4.2 Data Reduction.............................................................................................................23
5. ANALYSIS AND RESULTS ....................................................................................................29
5.1 Type of Stop .................................................................................................................29 5.2 Point of Initial Braking ................................................................................................32
5.3 Stopping Location ........................................................................................................36 5.4 Number of Times Braking ...........................................................................................38
6. CONCLUSIONS........................................................................................................................39
7. IMPLEMENTATION/TECHNOLOGY TRANSFER ..............................................................40
REFERENCES ..............................................................................................................................41

vi
LIST OF FIGURES
Figure 1-1. Overhead flashing beacon .............................................................................................2 Figure 1-2. Additional reflective material on stop sign post ...........................................................4
Figure 1-3. Use of LEDs around stop sign face ...............................................................................5 Figure 1-4. Beacon on a stop sign ....................................................................................................6 Figure 2-1. Location of treatment sites ..........................................................................................12 Figure 3-1. Flashing beacon installation ........................................................................................14 Figure 3-2. Reflective strip installation at four-lane divided highways .........................................15
Figure 3-3. Retroreflective strip installation on regular telspar posts ............................................16 Figure 3-4. Retroreflective strip placement on smaller telespar post ............................................17 Figure 3-5. Retroreflective strip installation on wooden post........................................................18 Figure 3-6. Installation not possible due to sign and spacing constraints ......................................19
Figure 3-7. Nighttime view of retroreflective strip ........................................................................19 Figure 4-1. Video data collection array .........................................................................................20
Figure 4-2. Video data collection setup .........................................................................................21 Figure 4-3. White lines marked in the field ...................................................................................22 Figure 4-4. Marks placed in video frame to ensure distances are visible to data
reductionists .......................................................................................................................22 Figure 4-5. First appearance of vehicle in video frame .................................................................24
Figure 4-6. Brake activation ..........................................................................................................25 Figure 4-7. Activated beacon in Dallas County .............................................................................26 Figure 4-8. Example of conflict .....................................................................................................28
Figure 5-1. Changes in type of stop (Benton and Buena Vista Counties) .....................................30 Figure 5-2. Changes in type of stop (Clay and Dallas Counties) ...................................................31
Figure 5-3. Changes in type of stop (Johnson and Sioux Counties) ..............................................32 Figure 5-4. Changes in initial braking point (Benton and Buena Vista Counties) ........................33
Figure 5-5. Changes in initial braking point (Clay and Dallas Counties) ......................................34 Figure 5-6. Changes in type of stop (Johnson and Sioux Counties) ..............................................34
LIST OF TABLES
Table 2-1. Intersections receiving additional reflective strips on stop signs .................................11 Table 2-2. Intersections receiving stop sign beacons .....................................................................12 Table 4-1. Variables extracted from video ....................................................................................23
Table 5-1. Change in vehicles stopping at or before stop bar ........................................................37
Table 5-2. Percentage of vehicles only braking once ....................................................................38

vii
ACKNOWLEDGMENTS
The authors would like to thank the Iowa Highway Research Board, the Iowa Department of
Transportation, the Midwest Transportation Center, and the U.S. Department of Transportation
Office of the Assistant Secretary for Research and Technology for sponsoring this research.
The research team would like to thank Vanessa Goetz for serving as project monitor. The team
would also like to thank Nicole Fox, Jan Laaser-Webb, Al Miller, Todd Christiansen, Kurt
Bailey, James Armstrong, Scott Dockstader, Jim Schnoebelen, and Gary Kretlow for serving as
technical advisory committee members. Special thanks are due to the counties and other agencies
that allowed the team to install countermeasures and assisted with installation.


ix
EXECUTIVE SUMMARY
Background and Objectives
Crashes at rural intersections are frequently a result of failure to yield. As a result, agencies
attempt to find countermeasures that encourage drivers to stop and yield appropriately. A number
of countermeasures have been utilized to reduce crashes and improve intersection safety.
However, some treatments have been shown to have mixed results, while for others only limited
information about effectiveness is available. Because even low-cost treatments require some
maintenance, it is important for agencies to have good information about the effectiveness of the
various treatments before investments are made.
The objective of this research was to select promising low-cost rural intersection
countermeasures and evaluate their impact on improving safety. The research team, in
conjunction with the technical advisory committee, selected two low-cost countermeasures: post-
mounted beacons and retroreflective strips on stop sign posts. The post-mounted beacon included
a radar so that the system could be set to only activate when an approaching vehicle’s speed
surpassed a predetermined threshold. This threshold was based on whether a vehicle would be
likely to stop.
Site and Countermeasure Selection
High-crash intersections on rural minor street stop-controlled intersections were identified using
in-house crash and roadway data and then filtered for suitability via site visits. The
retroreflective strips were installed on stop signs on both approaches of the minor street at 14
intersections. Beacons were installed on stop signs at 10 approaches at 6 intersections.
The ideal metric for evaluating the safety impacts of a countermeasure is to evaluate crashes
before and after installation. However, this requires several years of data after installation of the
countermeasure, which was beyond the timeframe of this project. As a result, only driver
behavior could be evaluated in the short term to assess the impacts of the countermeasures in this
study.
Because the stop sign beacon only activates for vehicles traveling over a certain speed threshold,
the countermeasure was expected to have a noticeable impact on stopping point, type of stop,
and other similar characteristics. While the retroreflective strip increases sign conspicuity and
ideally alerts a driver to the presence of the stop sign, it was not expected to impact driver
behavior in a measurable way similar to the stop sign beacon. As a result, driver behavior data
were only collected at locations where stop sign beacons were installed, and driver behavior,
such as type of stop, was monitored before and after installation of the beacons.

x
Data Collection
Because it is difficult to conduct a crash analysis in the short term, measures of effectiveness
focused on unsafe driver behaviors. Portable data collection trailers with speed sensors and
cameras were used for the data collection. The trailers were placed upstream of the intersection,
which allowed the cameras to monitor vehicles as they approached the intersection. A trailer was
placed at each approach with a post-mounted beacon.
A variety of driver behavior metrics, including type of stop, stopping position, point at which
vehicles first began braking, and number of times braking, were reduced for a random sample of
vehicles for each approach during three evaluation periods: before, 1 month after, and 12 months
after installation. The trailers were deployed for a full week at each data collection period.
Beacons were installed much earlier at several sites than at other sites, so the 1-month after data
included measurements at 10 intersection approaches and the 12-month after data included
measurements at 6 intersection approaches. Driver behavior metrics were compared before and
after installation.
Results and Summary
Results are summarized for each measure of effectiveness in the following sections. Results by
individual intersection are provided in Chapter 5.
Type of Stop
The type of stop was reported as “full stop,” “slow rolling,” “fast rolling,” or “non-stop.” In
summary, 8 of the 10 approaches where a stop sign beacon was installed experienced an increase
in the number of vehicles coming to a full stop, with an average increase of 10.8% at 1 month
after installation. The percentage of vehicles that did not stop decreased at 4 of the 10
intersections. At 5 approaches, there were no vehicles reported as not stopping in either the
before or 1-month after periods, and as a result no change was observed. At one approach, an
increase of 0.7% in vehicles not stopping was reported.
At 12 months after installation, 4 of the 6 approaches where data were available experienced
increases in the number of vehicles coming to a full stop, with an average increase of 11.3%.
Two sites experienced decreases in the percentage of vehicles coming to a full stop (15.9% and
20.1%).
Point of Initial Braking
Earlier braking is an indicator that vehicles are preparing to stop, and this behavior was analyzed
to determine whether vehicles are stopping earlier based on the installation of the post-mounted
beacon. The point at which drivers initially began to brake was recorded and evaluated. Distance
was aggregated into the following bins:

xi
450 to 500 ft
350 to 400 ft
Less than or equal to 300 ft
Stopping sight distance was calculated based on an approach speed of 55 to 60 mph using a
standard deceleration value. Depending on the assumed coefficient of friction, stopping distance
ranged from 300 to 350 ft. It was assumed that braking at 350 ft or more represented normal
braking and braking at a distance of less than 350 ft would result in harder braking. Although
harder braking does not pose a safety risk in and of itself, it was assumed that drivers who began
braking sooner were more likely to be aware of the upcoming intersection.
Six of the 10 approaches where a stop sign beacon was placed experienced increases in the
number of vehicles that stopped between 450 and 500 ft of the approach stop bar. An average
increase of 10.3% was found at 1 month. Four of the approaches experienced a decrease in the
percentage of vehicles stopping between 450 and 500 ft, with an average decrease of 21.1%.
At 12 months, 5 of the 6 approaches evaluated experienced increases in the percentage of
vehicles first braking at 450 to 500 ft upstream of the intersection, with an average increase of
8.4%, while one approach experienced a decrease (-9.6%).
Mixed results were found for the change in the percent of vehicles that first began braking within
300 ft of the intersection for the 1-month after period. with 5 of the 10 approaches experiencing a
decrease and 5 experiencing an increase. At 12 months, 4 of the 6 approaches experienced a
decrease in the percentage of vehicles stopping within 300 ft. Two of the 6 experienced an
increase.
It was expected that vehicles would overall begin braking sooner when the beacon was present.
Overall, the majority of approaches in the 1-month and 12-month after periods experienced an
increase in vehicles that began braking early (450 to 500 ft) and a decrease in vehicles that first
began braking within 300 ft of the intersection.
Stopping Location
The stopping location for each vehicle was also recorded to determine whether the post-mounted
beacons impacted the location where drivers stopped. Stop location was initially coded as before,
at, or after the intersection approach stop bar or as a non-stop when the vehicle did not clearly
stop at any point. Data were aggregated to just two conditions that the team felt were the most
meaningful:
At: includes vehicles that stopped at or before the approach stop bar
After: includes vehicles that stopped after the approach stop bar or did not stop
xii
It was assumed that drivers who came to a stop before the stop bar were better prepared to assess
and scan on-coming traffic and react if needed. As a result, an improvement in the percentage of
drivers stopping at or before the stop bar was treated as a positive safety benefit.
At 1-month after installation of the flashing beacon, eight of the 10 approaches where data were
collected experienced an increase in the percentage of vehicles stopping at or before the
intersection approach stop bar at 1 month after installation of the flashing beacon. The average
increase was 6.3%. At the west approach of the intersection in Johnson County, all vehicles
stopped at or before the stop bar before installation, and this trend continued at the 1-month and
12-month after periods. As a result, no change was noted at this location. The percentage of
vehicles stopping at or before the stop bar decreased at the south approach of the Clay County
intersection (20.4%).
At 12 months, 5 of the 6 approaches where data were recorded experienced an increase in the
percentage of vehicles stopping at or before the stop bar. The average increase was 6.6%. No
change was noted at the west approach of the Johnson County intersection and an increase was
noted at the north approach of the Benton County intersection (12.5%).
Overall, driver stopping locations were more compliant after installation of the flashing beacons.
Number of Times Braking
The number of times the brake lights were activated for each vehicle was also extracted from the
field video. It is not known whether the frequency of braking behavior impacts safety. However,
the premise for collecting this information is that drivers who brake multiple times may not be
prepared for the upcoming intersection. As a result, the number of times vehicles only had one
braking event was compared to the number of times vehicles had multiple braking events. At 1
month after installation of the stop sign beacons, 6 of the 10 approaches experienced an increase
in the number of vehicles that only stopped once (average increase of 12.6%). Four of the 10
approaches experienced a decrease in the percentage of vehicles that only had one braking event.
At 12 months after installation, all six approaches experienced an increase in the percentage of
vehicles that braked only once, with an average increase of 21.0%.
Overall, the number of vehicles braking a single time increased at the majority of the intersection
approaches at 1 month after installation, and all approaches where data were collected at 12
months after installation experienced an increase in the number of vehicles braking only once.
As a result, it can be inferred that the presence of the beacons had a positive impact on braking
behavior.
Discussion
The addition of a speed-activated flashing red beacon at the approach stop sign was found to
positively impact driver behavior in terms of the following:
xiii
Stopping behavior, including the number of vehicles coming to a full stop at the intersection
as well as the number of vehicles stopping at or before the stop bar
Intersection awareness, including the number of drivers who first began braking within 450
to 500 feet as well as the number of drivers only braking once
Ideally, these improvements in driver behavior will result in reduced crashes at the study
intersections. The cost of each stop sign beacon was approximately $3,000, and they require
regular maintenance. Overall, they were found to be a reasonably low-cost countermeasure.
There were some concerns from participating agencies that having the beacon only activate at a
set speed threshold rather than continuously may be confusing to drivers. However, studies of
other dynamic countermeasures that only present a message to drivers who are speeding have
been widely used and have been shown to be very effective (Hallmark et al. 2015, Zineddin et al.
2015, Fitzsimmons et al. 2007).
The addition of retroreflective strips on stop sign posts was not evaluated because they were
installed on a large number of stop signs and collection of data was not feasible given project
resources. The intent is therefore to conduct a crash analysis when at least three years have
elapsed after installation of the countermeasure.


1
1. BACKGROUND
1.1 Scope of Problem
In Iowa, intersection crashes account for 30% of severe crashes, with 40 % of those crashes
occurring in rural areas. Rural intersection crashes are frequently a result of drivers failing to
yield right of way. Failure to yield may be due to speeding, which can result in failure to react in
time, or may be due to a failure to recognize the presence of the intersection or traffic control due
to sight distance issues or driver inattention. Retting et al. (2003) investigated crashes at stop-
controlled intersections in four cities and found that stop sign violations accounted for about 70%
of crashes.
Both older and younger drivers have been attributed responsibility in failure to yield crashes at
intersections. Retting et al. (2003) report that younger drivers (< 18) and older driver (65+) were
more likely to be at fault at stop-controlled intersections. Massie et al. (1993) created a collision
typology to assess crash types and investigated 50 crashes involving failure to yield. They found
that older drivers were more likely to stop first and then pull out and collide with another vehicle
while younger drivers were more likely not to stop.
Intersection characteristics such as sight distance, skew angle, presence of horizontal or vertical
curvature, presence of a median, or lighting have also been correlated to failure to yield and
intersection crash risk (Harwood et al. 1995, Burchett and Maze 2006).
1.2 Objectives
Crashes at rural intersections are frequently a result of failure to yield. As a result, agencies
attempt to find countermeasures that encourage drivers to stop and yield appropriately. A number
of countermeasures have been utilized to reduce crashes and improve intersection safety.
However, some treatments have been shown to have mixed results, while for others only limited
information about effectiveness is available. Because even low-cost treatments require some
maintenance, it is important for agencies to have good information about the effectiveness of the
various treatments before investments are made.
The objective of this research was to select one or two promising low-cost rural intersection
countermeasures and evaluate their impact on improving safety. The research team selected
high-crash intersections and then evaluated the effectiveness of treatments installed at those
intersections. Because it is difficult to conduct a crash analysis in the short term, measures of
effectiveness focused on unsafe driver behaviors.
1.3 Selection of Countermeasures
Team first identified several potential countermeasures, as described in the following sections.
Next, they met with the project’s technical advisory committee (TAC), as described in Section
1.4, and selected final countermeasures. The objective was to evaluate lower cost

2
countermeasures that were appropriate for rural high-speed roadways. As a result, more
expensive alternatives such as intersection realignment, roundabouts, channelization, intersection
collision warning systems, and alternative intersection designs (i.e. J-turn, reduced conflict) were
not assessed. Additionally, countermeasures that would typically be used within a city or village,
such as a traffic signal, were not considered.
Overhead Beacons
Overhead flashing beacons have been widely used to warn drivers that an upcoming intersection
is present. Overhead beacons also remind drivers of who has the right of way (see Figure 1-1). In
general, overhead beacons have shown mixed results.
Shutterstock
Figure 1-1. Overhead flashing beacon
Several studies have found overhead beacons to be effective. Brewer and Fitzpatrick (2004)
found a 43% reduction in crashes after installation. Stackhouse and Cassidy (1996) analyzed
crash data at eight rural intersections in Minnesota for three years before and after overhead
beacons were installed. All were four-way intersections with stop control on the minor
approaches. A simple crash analysis indicated a 39% reduction in crashes. Murphy and Hummer
(2007) developed crash reduction factors for overhead flashing beacons at 34 four-leg two-way
stop-controlled rural intersections in North Carolina.
Results from an empirical Bayes analysis of overhead beacons that considered traffic increases
showed a 12% decrease in total crashes, a 9% decrease in injury crashes, a 40% decrease in
severe injury crashes, a 9% decrease in frontal impact crashes, and a 26% reduction in “ran stop
sign” crashes.

3
Srinivasan et al. (2008) conducted an empirical Bayes analysis on standard overhead beacons,
beacons mounted on stop signs, and actuated beacons in North Carolina and South Carolina.
They conducted a before and after analysis that included control sites. All types of beacons were
combined in one analysis (90 test sites). The authors found a 13.3% reduction in angle crashes
and a 10.2% reduction in injury crashes and found a 12% reduction in crashes. They further
evaluated sites with stop sign-mounted beacons and found a 58.2% reduction in angle crashes.
However only five sites were represented. They also further evaluated standard overhead
beacons (84 sites) and found an 11.9% reduction in angle crashes.
Several other studies have found little change in crashes. Pant et.al. (2007) compared crashes at
13 rural intersections with beacons and 13 stop-controlled intersections with no beacons in Ohio.
They found that vehicular speeds in the major directions of traffic were reduced at intersections
with beacons, especially at intersections with inadequate stopping sight distance. However, the
beacons were found to have little effect on reducing stop sign violations or crashes. Hammer et
al. (1987) evaluated 14 intersections with yellow-red beacons and 10 intersections with red-red
beacons in California. The study reported a reduction in right-angle accidents at all four-leg
intersections regardless of type of flasher, but results were not statistically significant. Fatal
accidents were not significantly reduced when a flashing beacon was installed.
Although some studies have indicated the effectiveness of overhead beacons, some concerns
have been raised about whether drivers understand the flashing yellow/red lights. Stackhouse and
Cassidy (1996) conducted a driver opinion survey (of 144 drivers) on the installation of overhead
beacons. Approximately one-half of older drivers (65+) and 42% of younger drivers (18 to 35
years old) stated some confusion about intersection beacons. A yellow indication normally
indicates a clearance interval, which may be confusing to drivers
Overhead beacons also require overhead wiring and a power source, which make them difficult
to install in some settings. Additionally, they incur on-going operating costs for electricity.
Additionally, because overhead flashing beacons are continuously activated, regular drivers may
become acclimated to their presence and begin to ignore them.
Use of Additional Retroreflective Material on Stop Sign Posts
Some agencies have begun adding an additional strip of retroreflective material to stop sign posts
to increase their conspicuity (see Figure 1-2).

4
Neal Hawkins, Institute for Transportation
Figure 1-2. Additional reflective material on stop sign post
Only one study evaluated the addition of this treatment to a stop sign post. A 100% reduction in
crashes was found, but only one intersection was evaluated (Fitzpatrick et al. 2011).
As a result of this lack of studies, very little information is available about the effectiveness of
this countermeasure.
LED Stop Signs
The addition of LEDs embedded in the stop sign face is another strategy that has been used by
agencies to increase the conspicuity of the stop sign, as shown in Figure 1-3.

5
Davis et al. 2014
Figure 1-3. Use of LEDs around stop sign face
The Federal Highway Administration (FHWA) (2009) summarized information about use of
embedded LEDs in signs. The agency indicated that the LED units increase sign conspicuity and
enhance visibility and recognition of regulatory and warning signs, particularly under low-light
or low-visibility conditions.
Davis et al. (2014) evaluated the impact of flashing LED stop signs at 15 locations in Minnesota
and at 240 intersections where no treatment was installed. The sites were through-stop-controlled
intersections on undivided major roads. Controls sites were along trunk highways within 20
miles of a treated intersection. The author conducted a hierarchical Bayes observational before-
and-after study and found a 41.5% decrease in right-angle crashes at intersections where the
treatment was installed (confidence interval: 0 to 70.8%).
Davis et al. (2014) also recorded driver stopping behavior at one intersection before and after
installation of an LED stop sign. Results indicated that when opposing traffic was present,
drivers were significantly more likely to engage in a full stop. But no change was observed when
no opposing traffic was present.
Another study reported a 29% reduction in vehicles not fully stopping and a 53% reduction in
vehicles moving through the intersection without slowing after LED stop signs were installed
(FHWA 2009). Arnold and Lantz (2007) evaluated a T-intersection in Virginia where a flashing
LED stop sign face was installed. They found that average speeds decreased by 1 to 3 mph after

6
installation of the signs and that the speed decreases were greater during the nighttime. They also
evaluated stop sign compliance but noted that their results were inconclusive.
As noted, a few studies have shown the LED treatment to be promising. However, each sign
costs $2,000 to $4,000 depending on whether radar activation is used, and the signs require more
maintenance than a regular stop sign. As a result, more information about the effectiveness of the
countermeasure would be helpful for agencies before they invest in this type of treatment.
Stop Sign-Mounted Beacons
Standard stop sign beacons are usually mounted on a stop sign (Figure 1-4). In some cases, there
may also be a warning beacon upstream.
Srinivasan et al. 2008
Figure 1-4. Beacon on a stop sign
Srinivasan et al. (2008) conducted an empirical Bayes analysis on standard stop sign-mounted
beacons and flashing overhead beacons in North Carolina and South Carolina. The following
CMFs were reported, but these included both countermeasures:
0.95 for all crashes
0.90 for injury crashes
0.42 to 0.88 for angle crashes
7
Brewer and Fitzpatrick (2004) investigated various treatments for rural highways and
intersections. They found that a flashing beacon mounted on a “stop ahead” sign for a single
intersection reduced crashes from 0.06 to 0.03 crashes/month based on a comparison of the crash
data three years before and three years after installation.
As noted, some evidence is available that suggests flashing beacons are effective, but the results
are based on just a few intersections. Additionally, the treatment costs $1,500 or more per
installation. As a result, more information is necessary about the effectiveness of the treatment.
1.4 Treatment Selection
The original project goal was to select two or three rural intersection treatments to install at two
or three intersections each. Driver behavior would be recorded and compared at each intersection
before and after installation. Identified potential treatments were summarized in Section 1.3 and
include the following:
Overhead flashing beacon
Additional strip of retroreflective material on stop sign post
LED stop sign
Stop sign-mounted flashing beacon
Advance stop sign rumble strips are already widely used in Iowa. Their effectiveness is not well
established, but it was determined that because they are so widespread, preference should be
given to countermeasures that are not commonly used. Additionally, concerns have been raised
about whether drivers understand the overhead flashing beacon, and in some cases these beacons
are being removed in Iowa. As a result, it was decided that this treatment would not be included
in this study.
Flashing beacons and LED stop signs were identified in the proposal for this project as the
treatments that were the most likely to be evaluated. The research team met with the TAC, which
was made up of state and county representatives. Many of the TAC members were not in favor
of the LED treatment. Although it was agreed that it may be useful in a few isolated situations,
they were concerned that a pilot study may encourage others to more unilaterally apply the
treatment. There were also concerns that the LED stop sign would be attractive to the public,
who may begin requesting its widespread use due to its perceived safety effectiveness. As a
result, it was decided that the study would not include the LED stop sign.
The team and TAC discussed alternative countermeasures. It was decided that the additional
reflective strip on the stop sign post was a reasonable countermeasure that was not likely to be
overused. Additionally, the stop sign-mounted beacon that could be selectively activated only for
vehicles not likely to stop was selected.
Initially, funds were allocated to treat three to five intersections with each countermeasure and to
collect data after one month for both countermeasures. Beacons were installed at 7 approaches at

8
4 intersections. The retroreflective strips were also slated for installation at 14 intersections.
Once the beacons were installed were installed and the retroreflective strips purchased, the team
reviewed the budget. Because the retroreflective strip on the stop sign post was cheaper than had
been budgeted, it was decided that there were sufficient funds to install three additional stop sign
beacons. It was also decided, as noted in Chapter 4, to only collect data at the beacon locations
because the retroreflective strips were not expected to have a significantly measurable impact on
observable driver behavior. As a result, it was decided to utilize the remaining resources to
collect data at 12 months after installation for beacons installed in 2016.

9
2. SITE SELECTION
The focus of the project was rural two-way stop-controlled intersections at the intersection of
two-lane roadways and rural four-lane divided highways with two-lane stop-control at the
intersection. Treatment locations were identified using the following methodology.
A database of intersections in Iowa was previously developed by the Iowa Department of
Transportation (DOT) in conjunction with the Institute for Transportation at Iowa State
University. The following information was available in the intersection database and was used to
query rural stop-controlled intersections:
Number of approaches
Signing by approach
Presence and type of medians
Presence and type of lighting
Roadway surface type
Channelization
The database was overlain with crash data from 2010 to 2014 (five years), and the total number
of intersection crashes was extracted for each intersection. Intersections were sorted by number
of crashes, and any intersection with 9 or more crashes was flagged. This resulted in a list of 60
potential locations. The team then used aerial imagery and Google Street View to inventory other
characteristics that were not available in the intersection database. These included the following:
Advance stop line rumble strips
Overhead beacons
Stop sign beacons
Advance signing
Type of pavement markings
Roadway surface type
Presence of lighting
The initial list of potential intersections was further reviewed and prioritized based on the
following:
Number of crashes or crash rate
Presence of other countermeasures (ideally, the fewer existing countermeasures the better)
Intersection configuration (unusual configurations may not be used if they are significantly
atypical)
Location (all other things being equal, closer locations facilitate data collection)
Volume (it may difficult to collect data at locations with low traffic volumes)

10
Locations were also screened for their suitability for the application of stop sign treatments.
Locations with stop sign beacons or overhead flashing beacons were removed from further
consideration because they already have a prominent countermeasure that may confound further
analysis. Several locations turned out to have a traffic signal or were located in an urbanized area
and were also removed. Several other locations had adverse geometry (i.e., significant skew) or a
railroad crossing near the intersection and were also removed.
A total of 23 intersections remained after the screening process. The team then solicited location
information and suitability advice from the TAC and other stakeholders. This feedback resulted
in minor location changes due to recent intersection countermeasure treatments that the team was
unaware of or due to preference from local agencies that were more familiar with the location
characteristics.
Site visits were made prior to the final selection of the sites to collect any relevant variables not
available through other means. This also ensured that the proposed treatments could be installed.
The objective of the study was to apply two different stop sign countermeasures. Project funds
were available for installation of stop sign beacons at 6 locations and additional reflective
treatment on stop sign poles at 14 locations. Each treatment is described in more detail below.
Table 2-1 shows intersection characteristics and installation dates for the 14 intersections where
the additional reflective strip treatment was placed. Intersection configuration, speed limit, and
installation data are also provided.
11
Table 2-1. Intersections receiving additional reflective strips on stop signs
Configuration
(speed limit in mph) County Coordinates Installation Date
two-lane/two-lane
55/55 Washington 41.3808,-91.7155 10/5/2017
two-lane/two-lane
55/55 Fayette 42.714934, -92.038 10/5/2017
two-lane/two-lane
55/55 Monroe 41.016247, -92.639 10/5/2017
two-lane/two-lane
45/30 Calhoun 42.517, -94.54 10/5/2017
two-lane/two-lane
55/55 Pottawattamie 41.289, -95.537 10/5/2017
two-lane/two-lane
55/55 Sac 42.421, -94.954 10/5/2017
four-lane divided/two-lane
65/55 Clinton 41.815338, -90.451 10/6/2017
four-lane divided/two-lane
65/55 Dubuque 42.439922, -90.800 10/6/2017
four-lane divided/two-lane
65/55 Dubuque 42.466315, -91.077 10/6/2017
four-lane divided/two-lane
55/55 Lee 40.726023, -91.563 10/6/2017
four-lane divided/two-lane
54/40 Linn 41.925920, -91.555 10/6/2017
four-lane divided/two-lane
65/55 Jones 42.25, -91.161 10/6/2017
four-lane divided/two-lane
65/55 Mahaska 41.2050, -92.6401 10/6/2017
four-lane divided/two-lane
55/55 Marion 41.384, -93.28 10/6/2017
Table 2-2 shows the intersections selected for the stop sign beacons. All intersections had a 55
mph speed limit on both the major and minor approaches.
12
Table 2-2. Intersections receiving stop sign beacons
Configuration Intersection County Coordinates
Installation
Date
two-lane/two-lane West approach of US 75 and
450th St Sioux 42.997, -96.175 9/24/2017
two-lane/two-lane East and west approach of
590th St and 130th Ave
Buena
Vista 42.662, -95.152 9/24/2017
two-lane/two-lane North and south approach of
Lincoln Hwy & 21st Ave Benton 41.963, -92.085 10/21/2016
two-lane/two-lane West approach of Hwy 1 and
140th St Johnson 41.831, -91.498 10/21/2016
two-lane/two-lane North and south approach of
360th St and M-50 Clay 43.1262, -95.1125 10/6/2016
two-lane/two-lane North and south approach of
240th St and W Ave Dallas 41.688, -93.852 10/6/2016
The locations of these intersections are shown in Figure 2-1.
Green dots = two-way stops on four-lane divided roadways; Blue dots = two-way stops on undivided two-lane
roadways; Red dots = flashing beacons
Figure 2-1. Location of treatment sites
13
3. DESCRIPTION OF TREATMENT AND INSTALLATION
Once final sites were selected, the team followed up with the corresponding agencies to confirm
their participation. The installation process varied depending on the type of installment and is
described in the section below.
3.1 Speed-Activated Stop Sign Beacons
Stop sign beacons were purchased from TAPCO. The particular configuration used in this study
was purchased because it included a radar and the system could be set to only activate when an
approaching vehicle’s speed was over a predetermined threshold. This threshold was based on
whether a vehicle would be likely to stop.
This configuration was selected to contrast actuated versus continuous beacon operation at rural
intersections. The objective was to target vehicles that are not likely to stop, similar to a dynamic
speed feedback sign, rather than to target all vehicles.
Formal authorization was requested before installation of the flashing beacons by submitting an
application for approval of the traffic control to the Iowa DOT state traffic engineer. The
application describes the details of the project and the operation of the control to be installed. A
separate agreement had to be acquired for each intersection being treated.
Once approval was received, the team scheduled the installation of each beacon with the
corresponding agency. Because installation was a rather involved process, assistance from the
district technicians was necessary. The team coordinated with the district sign crew to meet with
the team at the site location. Some locations were more challenging than others due to the
varying conditions of the existing sign control at the intersections.
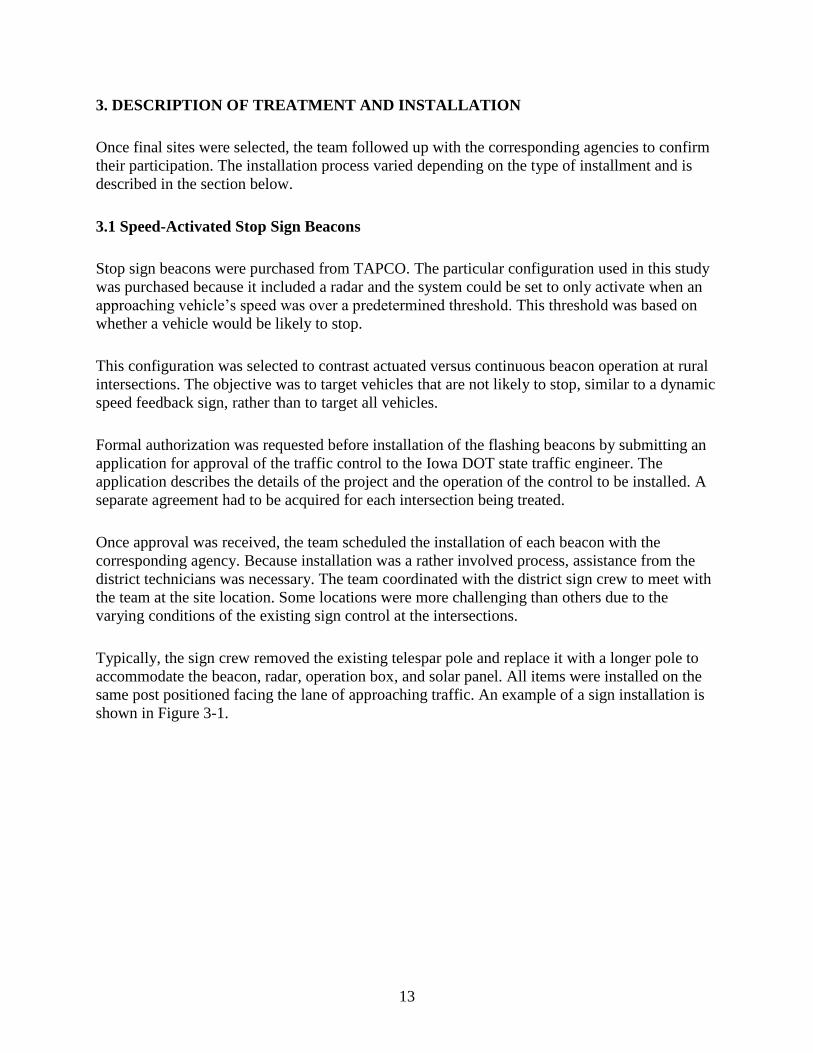
Typically, the sign crew removed the existing telespar pole and replace it with a longer pole to
accommodate the beacon, radar, operation box, and solar panel. All items were installed on the
same post positioned facing the lane of approaching traffic. An example of a sign installation is
shown in Figure 3-1.

14
Raju Thapa, Institute for Transportation
Figure 3-1. Flashing beacon installation
After installation, the beacon was configured to flash when vehicles were approaching over a set
threshold. The radar detected speeds approximately 350 to 400 ft before the stop sign. When a
vehicle’s speed was greater than 40 miles per hour from an approaching distance of 350 ft, the
beacon would activate. When activated, the beacon flashed at a standard flashing rate for 9
seconds, allowing the driver to register and respond to the intersection ahead. The threshold of
40 mph was used based on calculations of normal stopping distance.
3.2 Retroreflective Strips on Stop Sign Posts
Retroreflective strips were added to the stop sign posts at selected intersection approaches. Sign
posts and sign congurations varied. Most of the approaches along two-way/two-way roadways
had a single wooden or single telespar post with a stop sign. At the approaches on four-lane
divided highways, double telspar posts were present, and additional signs were placed along with
the stop sign, as shown in Figure 3-2. This presented challenges because installation techniques
had to vary due to differences in post configurations and sign placements.

15
Theresa Litteral, Institute for Transportation
Figure 3-2. Reflective strip installation at four-lane divided highways
The team also had to adapt due to inconsistencies between the design constraints of the
retroreflective strips supplied by the manufacturer and the post sizes at each intersection. For
telspar posts, the retroreflective strips were mounted by first drilling holes through the center of
the strips and then attaching the strips to the posts with bolts, as shown in Figure 3-3.

16
Theresa Litteral, Institute for Transportation
Figure 3-3. Retroreflective strip installation on regular telspar posts
Several telspar posts were smaller than the standard post size. In this case, additional brackets
were used, as shown in Figure 3-4.
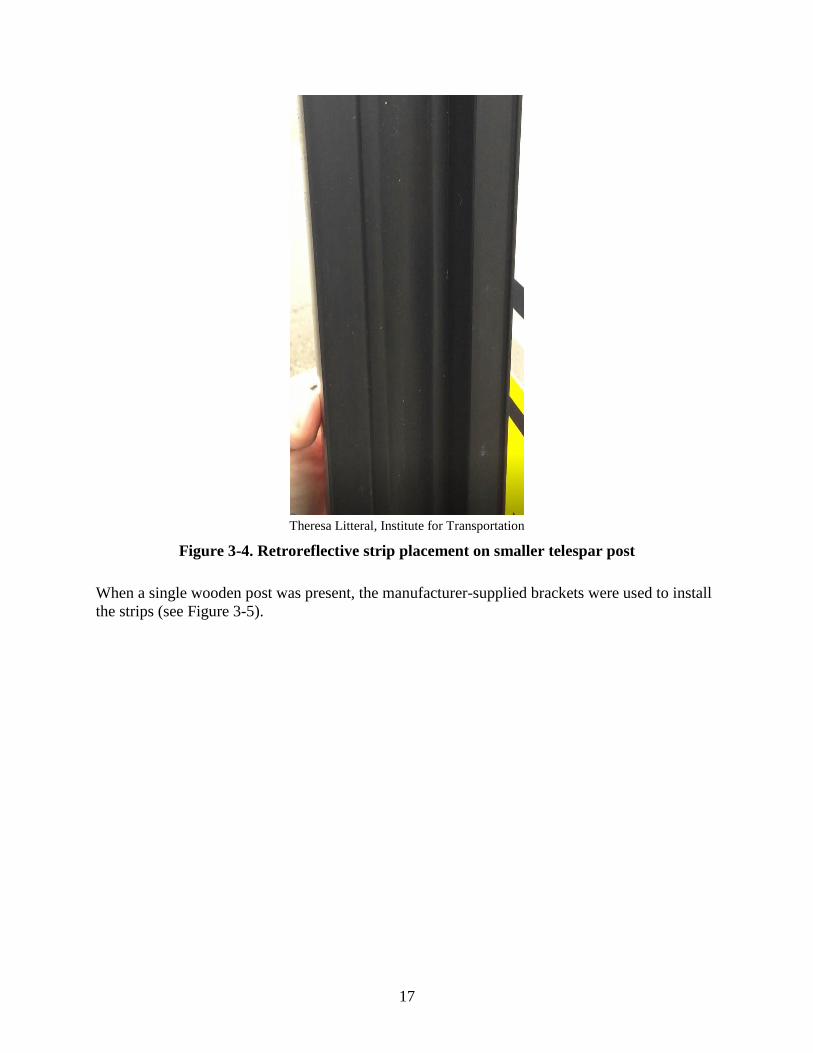
17
Theresa Litteral, Institute for Transportation
Figure 3-4. Retroreflective strip placement on smaller telespar post
When a single wooden post was present, the manufacturer-supplied brackets were used to install
the strips (see Figure 3-5).
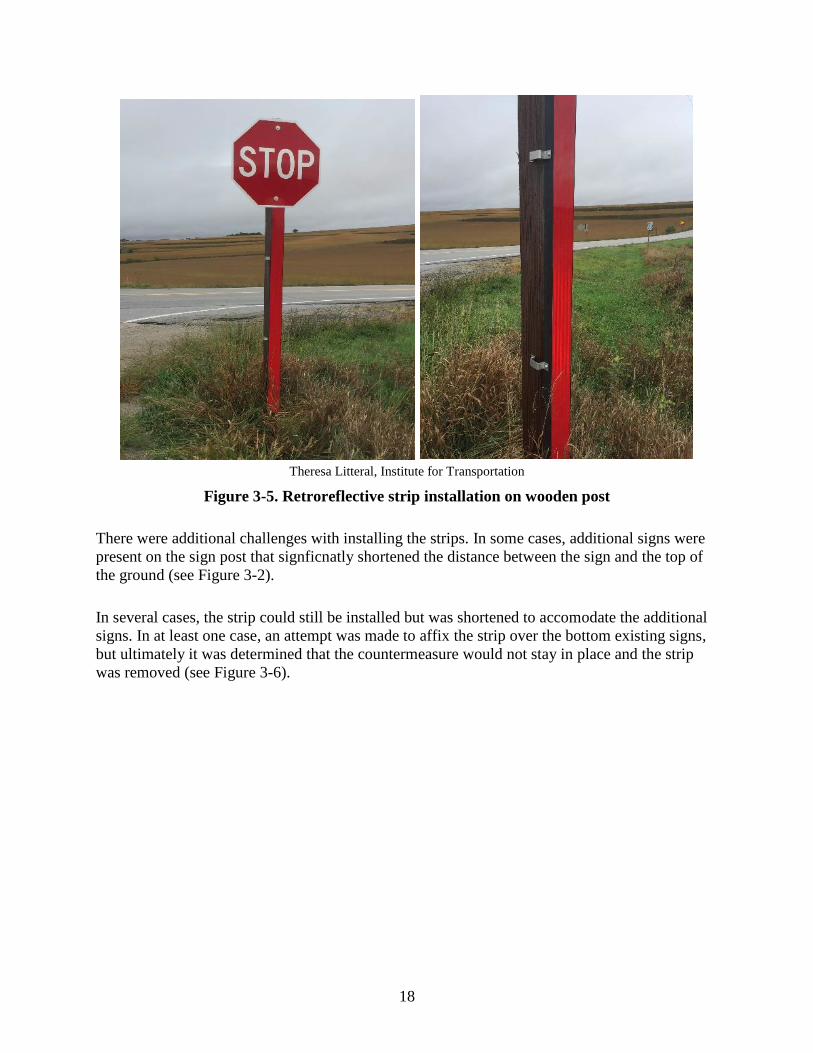
18
Theresa Litteral, Institute for Transportation
Figure 3-5. Retroreflective strip installation on wooden post
There were additional challenges with installing the strips. In some cases, additional signs were
present on the sign post that signficnatly shortened the distance between the sign and the top of
the ground (see Figure 3-2).
In several cases, the strip could still be installed but was shortened to accomodate the additional
signs. In at least one case, an attempt was made to affix the strip over the bottom existing signs,
but ultimately it was determined that the countermeasure would not stay in place and the strip
was removed (see Figure 3-6).
19
Theresa Litteral, Institute for Transportation
Figure 3-6. Installation not possible due to sign and spacing constraints
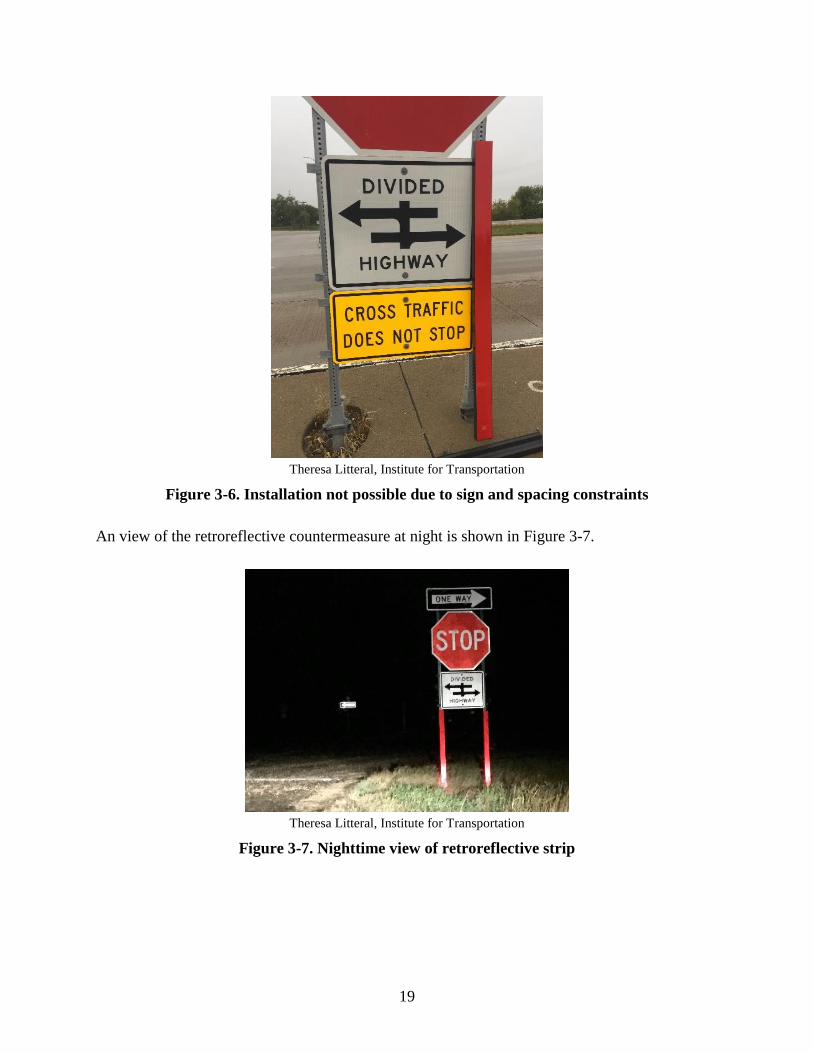
An view of the retroreflective countermeasure at night is shown in Figure 3-7.
Theresa Litteral, Institute for Transportation
Figure 3-7. Nighttime view of retroreflective strip

20
4. DATA COLLECTION AND REDUCTION
The ideal metric for the evaluation of safety impacts is an evaluation of crashes before and after
installation. However, this requires several years of data after installation of the countermeasure,
which was beyond the timeframe of this project. As a result, only driver behavior in the short
term could be evaluated to assess the impacts of the countermeasures. Because the stop sign
beacon only activates for vehicles traveling over a certain speed threshold, the countermeasure
was expected to have a noticeable impact on stopping point, type of stop, and other
characteristics. While the retroreflective strip increases sign conspicuity and ideally alerts a
driver to the presence of the stop sign, it was not expected to impact driver behavior in a
measurable way similar to the stop sign beacon. As a result, driver behavior data were only
collected at locations where stop sign beacons were installed, and driver behavior, such as type
of stop, was monitored before and after installation.
4.1 Data Collection
Portable data collection trailers with speed sensors and cameras were used for the data collection.
A trailer array was set up at each approach where beacons were installed, as shown in Figure 4-1.
This ensured coverage of some portion of the upstream approach as well as the intersection.
Institute for Transportation
Figure 4-1. Video data collection array

21
Figure 4-2 illustrates a schematic of the data collection setup.
Figure 4-2. Video data collection setup
Video data were collected approximately one month before installation at all approaches where
the flashing beacons were to be installed. Data were also collected at all 10 approaches around
one month after installation of the stop sign beacons.
Beacons were installed at the Benton, Johnson, Clay and Dallas County intersections in 2016.
For those intersections, data were also collected 12 months after installation, except for Clay
County north. The intersection configuration at the Clay County north approach was
characterized by a significant grade, which made it difficult to orient the cameras properly.
Additionally, there were several issues with the beacon at that location. As a result, data were
collected at 12 months after installation for the south approach at the Clay County intersection
but not for the north approach. Because beacons were installed at the Buena Vista and Sioux
County intersections in 2017, there was not sufficient time to collect data 12 months after
installation. As a result, data were collected at only 6 intersection approaches for the 12-month
after period.
Once the video data collection trailers were placed in the field, data were collected continuously
for around one week during each period.

22
To accurately record the distance from each vehicle to the flashing beacon, white lines were
painted on the pavement at 100 ft increments upstream of the intersection, as shown in Figure 4-
3.
Figure 4-3. White lines marked in the field
These markings were placed for a distance of 500 ft upstream of the intersection stop bar. These
markings were used as a reference in the video to approximate the point at which drivers began
applying their brakes. The lines were then located in the video frame and marked (see Figure 4-
4) so that they were clearly visible to the data reductionists.
Figure 4-4. Marks placed in video frame to ensure distances are visible to data
reductionists

23
4.2 Data Reduction
Once data were collected for each intersection, a sampling of minor approach events, each of
which consists of one driver negotiating the intersection from the minor approach where the
treatment was installed, was manually reduced.
Table 4-1 shows the variables that were reduced for each event. Data were not coded during the
nighttime or during inclement weather due to visibility issues.
Table 4-1. Variables extracted from video
Data Reduced Summary
First Time Vehicle Appears in
Video
The time a car appears in the video frame
Brake activation Time The time at which the brake is applied before arriving at the
intersection
Brake Activation Distance Lines placed on the road at 100-meter increments
Number in Queue Indicates if there is a queue formed at the intersection as a vehicle
slows down and, if so, how many cars
Following Shows if the vehicle being coded is following another vehicle
Number of Time Braking How many times a driver brakes in the 500-meter area leading up
to the intersection
Vehicle Stopped at Opposing
Minor Road
Indicates if a vehicle is stopped at an opposing minor road
Vehicle Visible How many vehicles are seen moving perpendicular to the
intersection as a car approaches the stop sign
Turning Movement Indicates the turning movement of the car approaching the
intersection
Type of Stop Choices are a complete stop, slow rolling, fast rolling, and nonstop
Stop Location Before the stop bar, after the stop bar, or right at the stop bar are
the options coded
Conflict A description of any conflict that is observed while coding the
vehicles
Beacon Status and Time Whether the beacon is activated based on the approaching speed
and the time this beacon is illuminated
Data were initially coded for every vehicle. The process of coding is described below for each
variable. Variables were manually reduced by data coders. The coders were all trained and their
work reviewed periodically to ensure that coding was consistent from one coder to another. After
completing two intersections (Benton County north and Clay County north), the team realized
that the process was more resource intensive than expected. As a result, it was decided to code a
sample of vehicles rather than code all vehicles. The sampling plan consisted of coding every
fourth vehicle, which represented a random sample of available vehicles.
24
Type of Vehicle
The type of vehicle was recorded using the following designations:
Motorcycles
Passenger cars
Minivans/SUVs
Pickups: single-unit vehicles with an open back with two axles and four tires
Buses
Farm vehicles: any vehicles that cannot be classified into any other category and that are
used on a farm
Single-unit trucks: vehicles on a single frame, including trucks, camping and recreational
vehicles, motor homes, etc., with two axles and dual rear wheels
Multi-unit trucks: vehicles with five or fewer axles consisting of two or more units
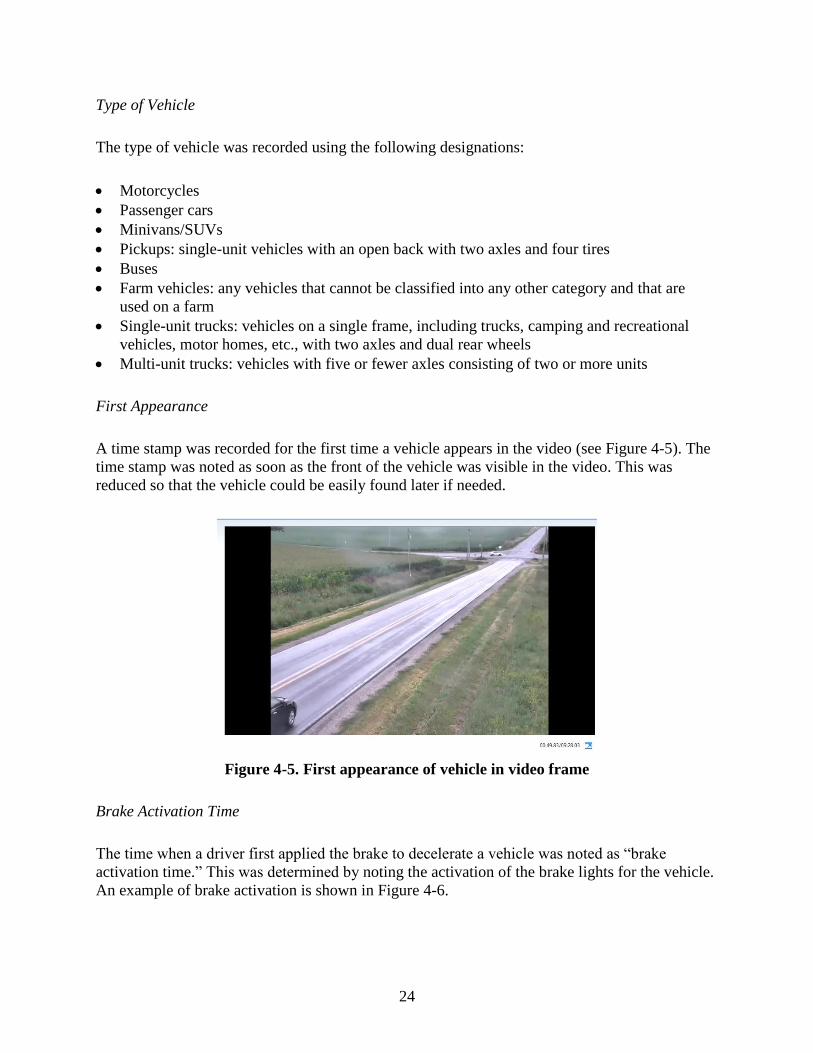
First Appearance
A time stamp was recorded for the first time a vehicle appears in the video (see Figure 4-5). The
time stamp was noted as soon as the front of the vehicle was visible in the video. This was
reduced so that the vehicle could be easily found later if needed.
Figure 4-5. First appearance of vehicle in video frame
Brake Activation Time
The time when a driver first applied the brake to decelerate a vehicle was noted as “brake
activation time.” This was determined by noting the activation of the brake lights for the vehicle.
An example of brake activation is shown in Figure 4-6.

25
Figure 4-6. Brake activation
Brake Activation Distance
The approximate distance from the intersection approach stop bar where a vehicle began braking
was noted as “brake activation distance.” This was noted by estimating the vehicle location
based on the 100 ft markings and assuming the vehicle stopped at the stop bar. As a result, this
distance indicates the distance between the initial braking and the subsequent stopping at the
intersection. If a vehicle was approximately midway between the second and third set of
markings, the distance was recorded as 250 ft. Because the distance was estimated, it can be
assumed that the distance was accurate to approximately 50 ft. If the vehicle did not visibly
apply its brakes within the video frame, braking distance was reported as N/A. However, for this
study the majority of drivers applied their brakes.
Number in Queue
The number in queue indicated the position of the subject vehicle in the queue as it approached
and stopped at the intersection. Number in queue thus also indicated the number of vehicles
ahead of the subject vehicle. If no vehicles were ahead of the subject vehicle, number in queue
was noted as 0.
Following
Whether the subject vehicle was following another vehicle was also recorded because the
braking behavior of the following car may be influenced by the lead car. Following was a
subjective measure.
Beacon Status
The status of the flashing beacon was noted for vehicles only in the after period because the
beacons were not present in the before period. Beacon status was noted as “active” or “not
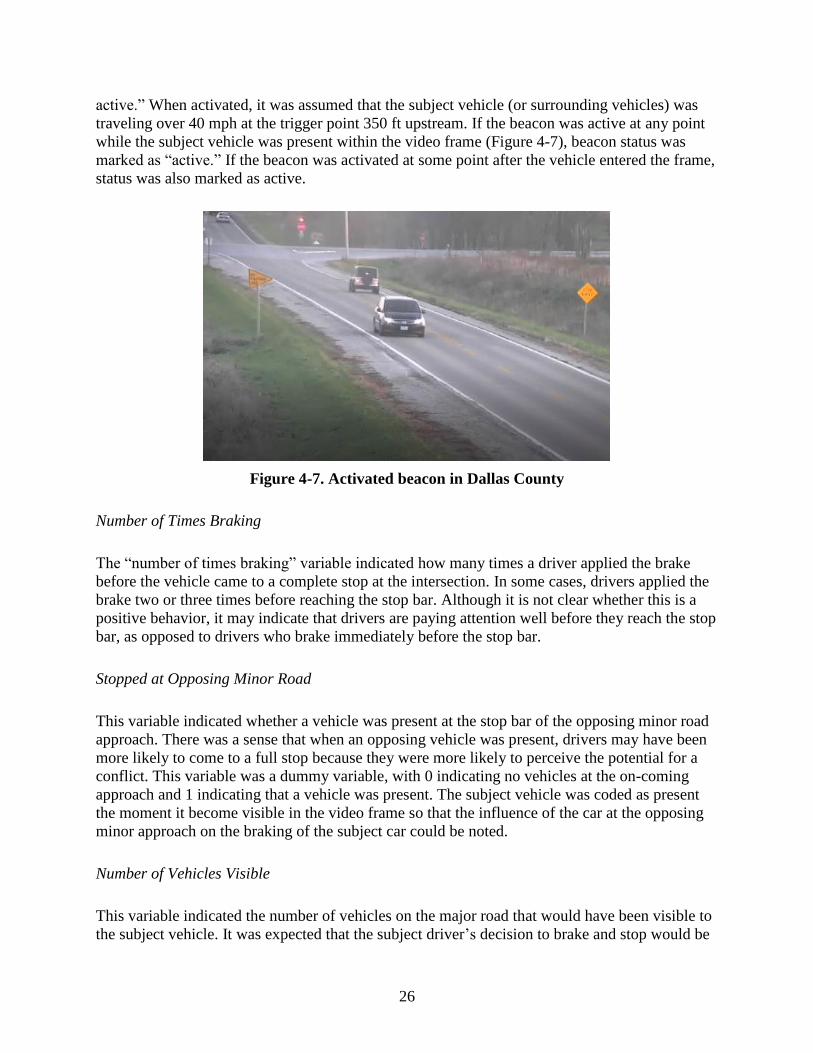
26
active.” When activated, it was assumed that the subject vehicle (or surrounding vehicles) was
traveling over 40 mph at the trigger point 350 ft upstream. If the beacon was active at any point
while the subject vehicle was present within the video frame (Figure 4-7), beacon status was
marked as “active.” If the beacon was activated at some point after the vehicle entered the frame,
status was also marked as active.
Figure 4-7. Activated beacon in Dallas County
Number of Times Braking
The “number of times braking” variable indicated how many times a driver applied the brake
before the vehicle came to a complete stop at the intersection. In some cases, drivers applied the
brake two or three times before reaching the stop bar. Although it is not clear whether this is a
positive behavior, it may indicate that drivers are paying attention well before they reach the stop
bar, as opposed to drivers who brake immediately before the stop bar.
Stopped at Opposing Minor Road
This variable indicated whether a vehicle was present at the stop bar of the opposing minor road
approach. There was a sense that when an opposing vehicle was present, drivers may have been
more likely to come to a full stop because they were more likely to perceive the potential for a
conflict. This variable was a dummy variable, with 0 indicating no vehicles at the on-coming
approach and 1 indicating that a vehicle was present. The subject vehicle was coded as present
the moment it become visible in the video frame so that the influence of the car at the opposing
minor approach on the braking of the subject car could be noted.
Number of Vehicles Visible
This variable indicated the number of vehicles on the major road that would have been visible to
the subject vehicle. It was expected that the subject driver’s decision to brake and stop would be

27
affected by the presence of on-coming vehicles on the major approach. The number of vehicles
on the major approach was counted from the time the subject vehicle was 500 ft upstream of the
intersection stop bar until the time the subject vehicle reached the stop bar.
Turning Movement
Turning movement indicated the direction of intended travel for the subject vehicle (i.e., left,
through, right).
Type of Stop
The type of stop is identified as the extent to which a vehicle complied with the stop control.
Type of stop was coded using the following criteria:
Complete stop: The vehicle comes to a complete stop at the stop bar (velocity = 0 for at least
an identifiable fraction of a second).
Slow rolling: Clear braking is evident as the vehicle slows down, but at no point does the
vehicle make a complete stop.
Fast rolling: The vehicle is moving at a fast pace as it approaches the stop sign and the brake
light is visible to indicate that the brake has been applied, but at no point does the vehicle
make a complete stop. If no brake light were visible, the type of stop would be coded as a
non-stop.
Non-stop: There was no noticeable effort to slow and the vehicle does not stop at the stop
sign.
Stop Location
This variable indicates where the vehicle stopped at the intersection based on the location of the
front tip of the vehicle. The following designations were used:
Before: The subject vehicle stops well before the stop bar. The subject vehicle should be at
least a foot from stop bar for the stop location to be classified as “before.”
At: The subject vehicle stops exactly at the stop bar but does not cross the stop bar line.
After: The subject vehicle stops after crossing the stop bar.
Conflict
A conflict was defined as a near-crash or evasive maneuvers at the intersection involving at least
one minor street vehicle. Conflicts included actions such as significant slowing, brake
application, or lane changes of major stream vehicles due to the movement of minor stream
vehicles. A near-crash was an event where vehicles nearly collided or made significant evasive
maneuvers to avoid a collision.
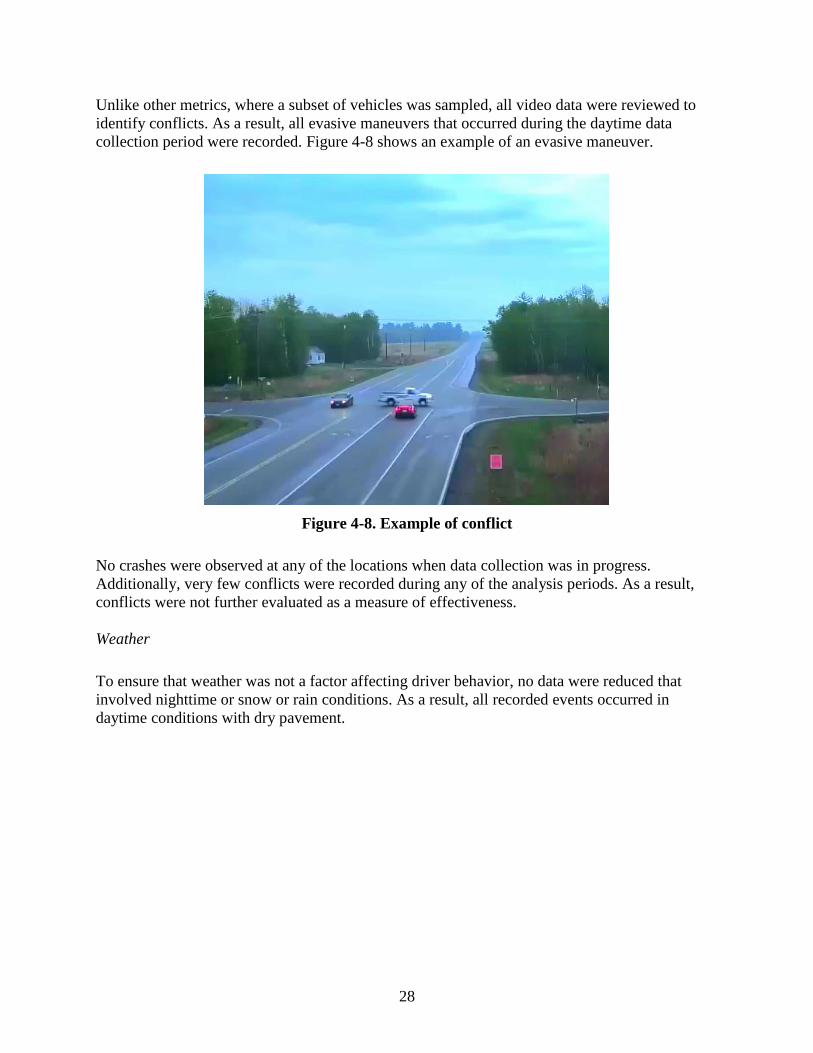
28
Unlike other metrics, where a subset of vehicles was sampled, all video data were reviewed to
identify conflicts. As a result, all evasive maneuvers that occurred during the daytime data
collection period were recorded. Figure 4-8 shows an example of an evasive maneuver.
Figure 4-8. Example of conflict
No crashes were observed at any of the locations when data collection was in progress.
Additionally, very few conflicts were recorded during any of the analysis periods. As a result,
conflicts were not further evaluated as a measure of effectiveness.
Weather
To ensure that weather was not a factor affecting driver behavior, no data were reduced that
involved nighttime or snow or rain conditions. As a result, all recorded events occurred in
daytime conditions with dry pavement.

29
5. ANALYSIS AND RESULTS
The following section will show the results for each of the measures of effectiveness. In some
cases, 12-month after data were not extracted, as noted in Section 4.1. In most cases, data are
presented for each approach because sample sizes and intersection characteristics differed among
intersection approaches.
5.1 Type of Stop
As noted in Section 4.2, the type of stop was reported as “full stop,” “slow rolling,” “fast
rolling,” or “non-stop.” Results are presented as simple arithmetical differences in percentages
between the before and after periods. For example, if the percentage of full stops was 33.9% in
the before period and 41.8% in 1-month after period, the difference would be indicated as an
increase in full stops of 7.8%.
Summary of Results
In summary, 9 of the 10 approaches experienced an increase in the number of vehicles coming to
a full stop, with an average increase of 13% at 1 month after installation. One approach
experienced an increase of 26.2%. The percentage of vehicles that did not stop decreased at 5 of
the 10 intersections. At 4 approaches, no vehicles were reported as not stopping in either the
before or 1-month after periods; as a result, no change was observed. At one approach, an
increase of 0.7% in vehicles not stopping was reported.
At 12 months after installation, all 6 approaches where data were available experienced increases
in the number of vehicles coming to a full stop, with one site experiencing a 20.4% increase. One
site (Benton County north) experienced a decrease of 15.9% in the percentage of vehicles
coming to a full stop. Two intersections experienced decreases in the percentage of vehicles
making a full stop (-1.2% and -0.4%, respectively). Five of the approaches had no instances of
vehicles not stopping in both the before and 12-month after periods. As a result, no change was
reported for these approaches.
Results by Individual Intersection
In this section, results are presented by individual intersection approach for the before, 1-month
after, and 12-month after periods. Changes in type of stop for the north and south approaches of
the intersection of Lincoln Highway and 21st Ave (Benton County) are shown in Figure 5-1.
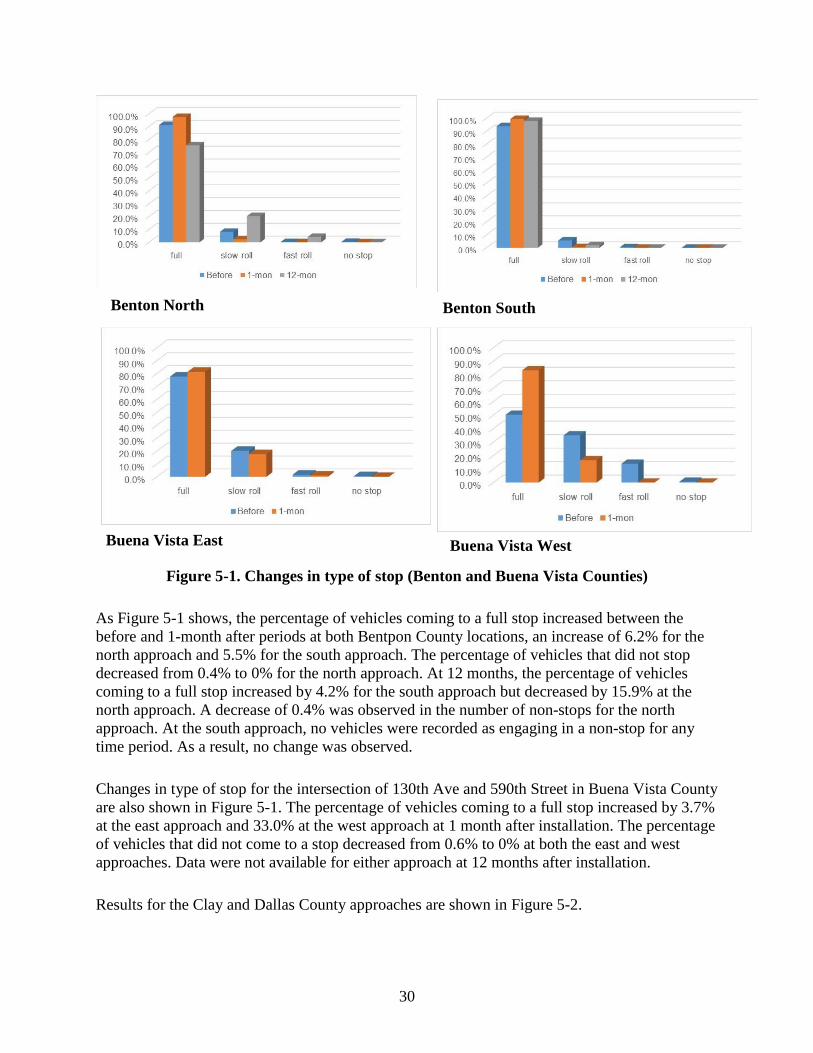
30
Figure 5-1. Changes in type of stop (Benton and Buena Vista Counties)
As Figure 5-1 shows, the percentage of vehicles coming to a full stop increased between the
before and 1-month after periods at both Bentpon County locations, an increase of 6.2% for the
north approach and 5.5% for the south approach. The percentage of vehicles that did not stop
decreased from 0.4% to 0% for the north approach. At 12 months, the percentage of vehicles
coming to a full stop increased by 4.2% for the south approach but decreased by 15.9% at the
north approach. A decrease of 0.4% was observed in the number of non-stops for the north
approach. At the south approach, no vehicles were recorded as engaging in a non-stop for any
time period. As a result, no change was observed.
Changes in type of stop for the intersection of 130th Ave and 590th Street in Buena Vista County
are also shown in Figure 5-1. The percentage of vehicles coming to a full stop increased by 3.7%
at the east approach and 33.0% at the west approach at 1 month after installation. The percentage
of vehicles that did not come to a stop decreased from 0.6% to 0% at both the east and west
approaches. Data were not available for either approach at 12 months after installation.
Results for the Clay and Dallas County approaches are shown in Figure 5-2.
Benton North
Benton South
Buena Vista East Buena Vista West

31
Figure 5-2. Changes in type of stop (Clay and Dallas Counties)
The north approach of intersection of W Ave and 240th Street (Dallas County) experienced an
increase in the percentage of vehicles making a full stop (2.3%) at the 1-month after period but a
decrease of 20.1% at the 12-month after period. The south approach experienced a decrease of
26.2% at the 1-month after period but an increase of 29.2% at the 12-month after period.
Neither of the Dallas County approaches experienced non-stops in the before period, and no
change was observed for the 1-month or 12-month after periods.
Changes in type of stop for the west approach of the intersection of Hwy 1 and 140th St NE
(Johnson County) and the west approach of the intersection of US 75 and 8th St SW (Sioux
County) are shown in Figure 5-3.
Clay North
Clay South
Dallas North
Dallas South

32
Figure 5-3. Changes in type of stop (Johnson and Sioux Counties)
As Figure 5-3 shows, the percentage of vehicles coming to a full stop increased for the 1-month
after period in both counties (13.1% and 7.1% for Johnson and Sioux Counties, respectively).
The Johnson County site experienced a 15.9% increase in full stops for the 12-month after
period. No vehicles were recorded as non-stops for Johnson County in the before period, and no
change was noted in the after periods. At the Sioux County intersection, 1.2% of drivers did not
stop in the before period, and no drivers were observed as not stopping in the after periods.
5.2 Point of Initial Braking
The point at which drivers initially began to brake was recorded, and results are provided in this
section. Figures 5-4 to 5-6 show results by individual approaches, and information is provided as
the percentage of vehicles that began braking within a specified distance.
Johnson West
Sioux West

33
Figure 5-4. Changes in initial braking point (Benton and Buena Vista Counties)
Benton North
Benton South
Buena Vista East Buena Vista West
34
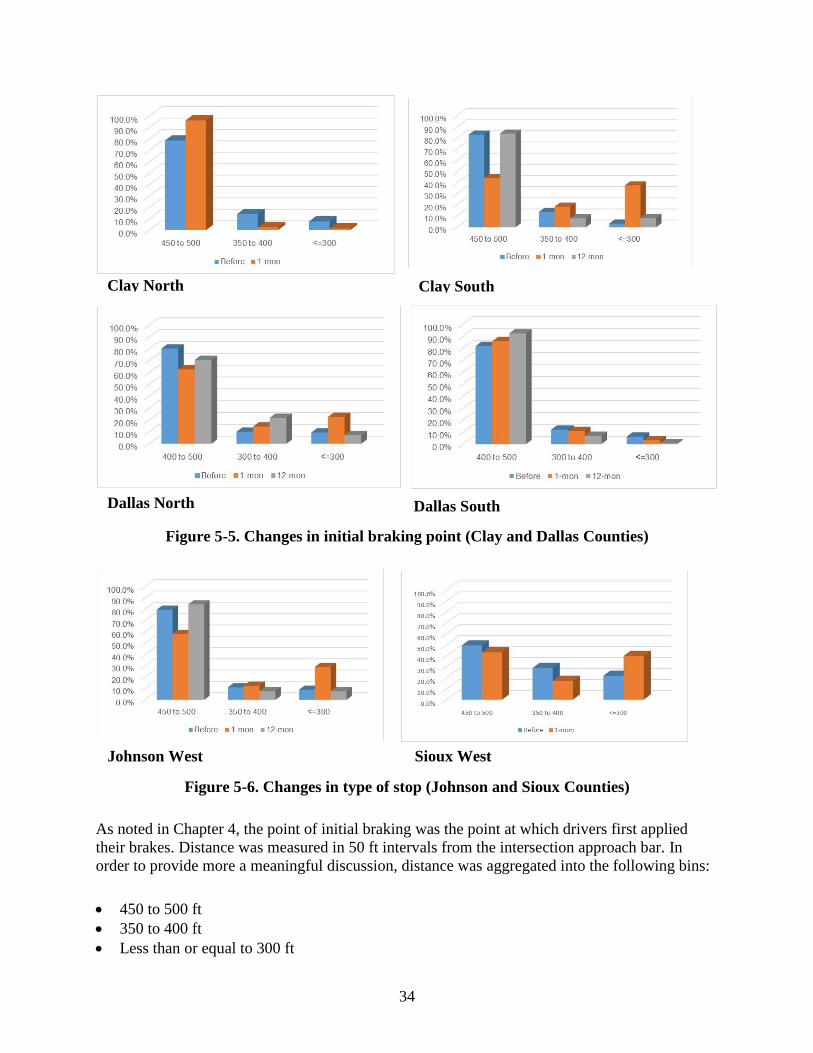
Figure 5-5. Changes in initial braking point (Clay and Dallas Counties)
Figure 5-6. Changes in type of stop (Johnson and Sioux Counties)
As noted in Chapter 4, the point of initial braking was the point at which drivers first applied
their brakes. Distance was measured in 50 ft intervals from the intersection approach bar. In
order to provide more a meaningful discussion, distance was aggregated into the following bins:
450 to 500 ft
350 to 400 ft
Less than or equal to 300 ft
Clay North
Clay South
Dallas North
Dallas South
Johnson West
Sioux West
35
Stopping sight distance was calculated based on an approach speed of 55 to 60 mph using a
standard deceleration value. Depending on the assumed coefficient of friction, stopping distance
ranged from 300 to 350 ft. It was assumed that braking at 350 ft or more represented normal
braking and that braking at a distance of less than 350 ft would result in harder braking.
Although harder braking does not pose a safety risk in and of itself, it was assumed that drivers
who began braking sooner were more likely to be aware of the upcoming intersection.
Summary of Results
Six of the 10 approaches where a stop sign beacon was installed experienced increases in the
number of vehicles that initiated braking between 450 and 500 ft of the approach stop bar. An
average increase of 10.3% was found at 1 month after installation. Four of the approaches
experienced a decrease in the percentage of vehicles stopping between 450 and 500 ft, with an
average decrease of 21.1%. At 12 months after installation, 5 of the 6 approaches evaluated
experienced increases in the percentage of vehicles first braking at 450 to 500 ft upstream of the
intersection, with an average increase of 8.4%, while one approach experienced a decrease (-
9.6%).
Mixed results were found for the change in the percent of vehicles that first began braking within
300 ft of the intersection at 1 month after installation, with 5 of the 10 approaches experiencing a
decrease (min = -2.9 and max = -54.8%) and 5 experiencing an increase (min = 4.2 and max =
34.2%). At 12 months after installation, 4 of the 6 intersections evaluated experienced a decrease
in the percentage of vehicles stopping within 300 ft (min = -1.3% and max = -45.3%). Two of
the 6 experienced an increase (min = 4.8% and max = 12.0%).
It was expected that vehicles would overall begin braking sooner when the beacon was present.
Overall, the majority of approaches in the 1-month and 12-month after periods experienced an
increase in vehicles that began braking early (450 to 500 ft) and a decrease in vehicles that first
began braking within 300 ft of the intersection.
Results by Individual Intersection
Results are presented in Figures 5-4 to 5-6 by individual intersection approach for the periods
before, 1 month after, and 12 months after installation.
At the Benton County north approach, the percentage of vehicles stopping within 450 to 500 ft of
the intersection increased by 7.2% at 1 month and by 5.0% at 12 months after installation. At the
south approach, the percentage increased by 4.8% at 1 month and by 20.8% at 12 months after
installation.
The percentage of vehicles that first began braking within 300 ft of the intersection increased for
Benton County north for both the 1-month and 12-month after periods (4.2% and 12.0%,
respectively). The percentage significantly decreased for the Benton County south approach for
both the 1-month and 12-month after periods (54.8% and 45.3%, respectively).
36
Similar results were found for both the east and west Buena Vista County approaches, with a
14.2% increase in the number of vehicles stopping between 450 and 500 ft at 1 month after
installation for the east approach and a 13.9% increase for the west approach. The percentage of
vehicles stopping within 300 ft decreased by 17.7% at 1 month after installation for the east
approach and decreased by 12.0% for the west approach.
The Clay County north approach (see Figure 5-5) experienced a significant increase in the
number of vehicles initially braking within the 450 to 500 ft range (17.6%) at 1 month after
installation. The south approach experienced a decrease of 38.9% at 1 month after installation.
However, at 12 months after installation the percentage of drivers braking within that distance
increased slightly (by 0.9%) at the south approach. The percentage of drivers who initially began
braking within 300 ft of the intersection declined for the north approach (-6.1%) at 1 month after
installation, while this percentage increased for the south approach by 34.2% at 1 month and
4.8% at 12 months after installation.
The percentage of vehicles initially braking within 450 to 500 ft of the intersection decreased at
the north approach of the Dallas County intersection by 17.6% and 9.6% for the 1-month and 12-
month after periods, respectively. At the south approach, this percentage increased by 4.1% and
10.6% for the 1-month and 12-month after periods, respectively. Similarly, an increase in the
percentage of vehicles initially braking within 300 ft of the intersection was noted for the north
approach for the 1-month after period (13.2%), while a decrease was observed for the 12-month
after period (-2.2%). At the south approach, decreases were noted for both the 1-month and 12-
month after periods (-2.9 and -5.5%).
Changes in initial braking distance are shown in Figure 5-6 for the west approach of the Johnson
County intersection and the west approach of the Sioux County intersection. As the figure shows,
a mixed effect was observed in Johnson County, with a decrease in the percentage of vehicles
stopping within 450 to 500 ft of the intersection at 1 month after installation (-21.5%) and an
increase in this percentage at 12 months after installation (4.8%).
The percentage of vehicles initially braking between 450 and 500 ft of the intersection decreased
at 1 month after installation (-6.2%) at the Sioux County intersection, while the number initially
braking within 300 ft of the intersection increased (18.0%) in the same period.
5.3 Stopping Location
The point at which drivers stopped at the intersection approach was recorded. Stop location was
initially coded as before, at, or after the intersection approach stop bar or as a non-stop when the
vehicle did not clearly stop at any point. Data were aggregated to just two conditions that the
team felt were the most meaningful:
At: includes vehicles that stopped at or before the approach stop bar
After: includes vehicles that stopped after the approach stop bar or did not stop

37
The percentage of vehicles that stopped after the stop bar is the inverse of the percentage that
stopped before. For instance, at the Benton County north approach, the percentage of vehicles
that stopped at the stop bar increased from 90.9% before installation of the beacon to 94.8% at 1
month after installation (an increase of 3.9%). Conversely, the percentage that stopped after the
stop bar decreased from 9.1% before installation to 5.2% at 1 month after installation (a decrease
of 3.9%).
It was assumed that drivers who came to a stop before the stop bar were better prepared to assess
and scan on-coming traffic and react if needed. As a result, an improvement in the percentage of
drivers stopping at or before the stop bar was treated as a positive safety benefit.
Only a summary of the results of stopping location is presented because presenting a table of
changes in behavior is more concise than showing all information available. Table 5-1 shows the
changes in the number of vehicles stopping at or before the stop bar for the 10 intersections
where beacons were installed.
Table 5-1. Change in vehicles stopping at or before stop bar
1 month after 12 months after
Benton County north 3.9% -12.5%
Benton County south 5.6% 3.8%
Buena Vista County east 10.2% NA
Buena Vista County west 3.9% NA
Clay County south -20.4% 9.4%
Clay County north 8.5% NA
Dallas County north 3.7% 1.5%
Dallas County south 5.8% 11.7%
Johnson County west 0.0% 0.0%
Sioux County west 8.9% NA
As Table 5-1 shows, 8 of the 10 approaches where data were collected experienced an increase
in the percentage of vehicles stopping at or before the intersection approach stop bar at 1 month
after installation of the flashing beacon. The average increase was 6.3% (min = 3.7% and max =
10.2%). At the west approach of the Johnson County intersection, all vehicles stopped at or
before the stop bar before installation, and this trend continued at the 1-month and 12-month
after periods. As a result, no change was noted for this approach. The percentage of vehicles
stopping at or before the stop bar decreased at the south approach of the Clay County intersection
in the 1-month after period (20.4%).
At 12 months after installation, 5 of the 6 approaches where data were recorded experienced an
increase in the percentage of vehicles stopping at or before the stop bar. The average increase
was 6.6%. No change was noted at the Johnson County west approach, and an increase was
noted at the north approach of the Benton County intersection (12.5%).

38
Overall, it was felt that stop location improved in a positive manner, with most of the sites
experiencing an increase in the percentage of vehicles stopping near the stop bar after
installation.
5.4 Number of Times Braking
The number of times the brake lights were activated for each vehicle was also extracted. It is not
known whether braking behavior impacts safety. However, the premise for collecting this
information is that drivers who brake multiple times may not be prepared for the upcoming
intersection. As a result, the number of times vehicles only had one braking event was compared
to the number of times vehicles had multiple braking events. The difference in the percentage of
vehicles braking once is shown in Table 5-2.
Table 5-2. Percentage of vehicles only braking once
1 month after 12 months after
Benton County north -24.1% 0.3%
Benton County south 5.2% 3.4%
Buena Vista County east -14.2% NA
Buena Vista County west 7.3% NA
Clay County south 13.7% 51.7%
Clay County north 11.7% NA
Dallas County north 25.5% 16.6%
Dallas County south -26.2% 29.2%
Johnson County west 12.3% 24.8%
Sioux County west -3.9% NA
As Table 5-2 shows, at 1 month after installation 6 of the 10 approaches experienced an increase
in the number of vehicles that only braked once, with an average increase of 12.6%. Four of the
10 experienced a decrease in the percentage of vehicles that only had one braking event.
At 12 months after installation, all six approaches where data were collected experienced an
increase in the percentage of vehicles that braked only once, with an average increase of 21.0%.
Overall, the number of vehicles braking only once increased at the majority of the intersection
approaches at 1 month after installation, and all approaches where data were collected at 12
months after installation experienced an increase in the number of vehicles braking only once.
As a result, it can be inferred that the presence of the beacons had a positive impact on braking
behavior.

39
6. CONCLUSIONS
Overall, the stop sign-mounted beacon had an overwhelmingly positive safety benefit, as
measured by several changes in driver behavior. At the majority of approaches where the stop
sign beacon was installed, an increase in the following was observed:
Full stops
Number of drivers who first began braking within 450 to 500 ft
Vehicles stopping at or before the stop bar
Number of vehicles only braking once
Ideally, these improvements in driver behavior will result in reduced crashes at the study
intersections. The cost of each stop sign beacon was approximately $3,000, and they require
regular maintenance. Overall, they were found to be a reasonably low-cost countermeasure.
There were some concerns from participating agencies that having the beacon only activate at a
set speed threshold rather than continuously may be confusing to drivers. However, studies of
other dynamic countermeasures that only present a message to drivers who are speeding have
been widely used and have been shown to be very effective (Hallmark et al. 2015, Zineddin et al.
2015, Fitzsimmons et al. 2007).
The stop sign beacon differed from common beacon applications in that it was set to activate
only when a vehicle was traveling 40 mph or more at a set point upstream of the intersection
approach stop bar. In this situation, only those drivers who were less likely to stop were provided
the flashing beacon. The objective was to only target “problem” drivers because drivers may
become habituated to countermeasures that they observe regularly.
Overall it was felt that use of the targeted approach was effective. This type of system, however,
does requires a radar or other speed sensor, which adds an additional expense on top of the cost
of the regular beacon setup. (The cost above includes the cost of the radar with the flashing
beacon.)
The addition of retroreflective strips on stop sign posts is expected to increase sign conspicuity,
particularly at night, which will ideally result in a reduction in crashes. However, reduction of
nighttime video is challenging, and the countermeasure was not expected to have a measurable
impact on driving behaviors such as braking point. As a result, video data were not collected at
locations where this countermeasure was installed. The intent is therefore to conduct a crash
analysis when at least three years have elapsed after installation of the countermeasure.

40
7. IMPLEMENTATION/TECHNOLOGY TRANSFER
The main venue for Iowa cities and counties to access the results of this research will be through
updates to a current Synthesis of Safety-Related Research webpage. This webpage lists a number
of countermeasures for rural intersections and provides a comprehensive resource. Integration of
the results from this research will add Iowa-specific information about the treatments evaluated
in this project so that agencies can apply the results.
Additionally, the research team will work with the Iowa Local Technical Assistance Program to
disseminate the results to Iowa agencies.
The main benefit of this work is that the results are “shovel-ready.” Using the provided
background and results, agencies can make a determination about their use of the stop sign
beacon.
41
REFERENCES
Arnold, E.D and K.E. Lantz. 2007. Evaluation of Best Practices in Traffic Operations and
Safety: Phase I: Flashing LED Stop Sign and Optical Speed Bars. Virginia
Transportation Research Council, Charlottesville, VA.
http://www.virginiadot.org/vtrc/main/online_reports/pdf/07-r34.pdf.
Brewer, M. A. and K. Fitzpatrick. 2004. Preliminary Evaluations of Safety Treatments on Rural
Highways in Texas. Texas Transportation Institute, Texas A&M University, College
Station, TX.
Burchett, G. D. and T. H. Maze. 2006. Rural Expressway Intersection Characteristics as Factors
in Reducing Safety Performance. Transportation Research Record: Journal of the
Transportation Research Board, No. 1953, pp. 71–80.
Davis, G., J. Hourdos, and H. Xiong. 2014. Estimating the Crash Reduction and Vehicle
Dynamics Effects of Flashing LED Stop Signs. Minnesota Department of Transportation.
St. Paul, MN. https://www.lrrb.org/pdf/201402.pdf.
FHWA. 2009. Embedded LEDs in Signs. FHWA-SA-09-006. Federal Highway Administration,
Washington, DC.
Fitzsimmons, E., S. Hallmark, N. Hawkins, J. Resler, and D. Plazak. 2007. Electronic Speed
Feedback Signs as a Rural Community Traffic Calming Measure. Paper presented at the
Mid-Continent Transportation Research Symposium. Iowa State University, Ames, IA.
Fitzpatrick, K., S. Chrysler, S. Sunkari, J. Cooper, B. Park, and L. Higgins. 2011. Modern Traffic
Control Devices to Improve Safety at Rural Intersections. Texas Transportation Institute,
Texas A&M University, College Station, TX.
Hallmark, S. L., Y. Qui, N. Hawkins, and O. Smadi. 2015. Crash Modification Factors for
Dynamic Speed Feedback Signs on Rural Curves. Journal of Transportation
Technologies, Vol. 5, No. 1, pp. 9–23.
Hammer, J. B. and E. J. Tye. 1987. Overhead Yellow-Red Flashing Beacons. California
Department of Transportation, Sacramento, CA.
Harwood, D. W., M. T. Pietrucha, M. D. Wooldridge, R. E. Brydia, and K. Fitzpatrick. 1995.
NCHRP Report 375: Median Intersection Design. National Cooperative Highway
Research Program, Washington, DC.
Massie, D. L., K. L. Campbell, and D. F. Blower. 1993. Development of a Collision Typology
for Evaluation of Collision Avoidance Strategies. Accident Analysis and Prevention. Vol.
25, No. 3, pp. 241–257.
Murphy, B. G. and J. E. Hummer. 2007. Development of Crash Reduction Factors for Overhead
Flashing Beacons at Rural Intersections in North Carolina. Transportation Research
Record: Journal of the Transportation Research Board, No. 2030, pp. 15–21.
Pant, P.D., Y. Park, S. Neti, and A. Hossain. 1999. Comparative Study of Rural Stop-Controlled
and Beacon-Controlled Intersections. Transportation Research Record: Journal of the
Transportation Research Board, No. 1692, pp. 164–172.
Retting, R. A., H. B. Weinstein, and M. G. Solomon. 2003. Analysis of Motor-Vehicle Crashes
at Stop Signs in Four U.S. Cities. Journal of Safety Research, Vol. 34, No. 5, pp. 485–
489.
42
Srinivasan, R., D. Carter, K. Eccles, B. Persaud, N. Lefler, C. Lyon, and R. Amjadi. 2008. Safety
Evaluation of Flashing Beacons at STOP-Controlled Intersections. FHWA-HRT-08-044.
Federal Highway Administration, Turner-Fairbank Highway Research Center, McLean,
VA.
Stackhouse, S. and P. Cassidy. 1996. Warning Flashers at Rural Intersections. Minnesota
Department of Transportation, St. Paul, MN.
Zineddin, A, S. Hallmark, O. Smadi, and N. Hawkins. 2016. Spotlighting Speed Feedback Signs.
Public Roads, Vol 79, No. 5.
https://www.fhwa.dot.gov/publications/publicroads/16marapr/04.cfm.


Visit www.InTrans.iastate.edu for color pdfs of this and other research reports.
THE INSTITUTE FOR TRANSPORTATION IS THE FOCAL POINT FOR TRANSPORTATION AT IOWA STATE UNIVERSITY.
InTrans centers and programs perform transportation research and provide technology transfer services for government agencies and private companies;
InTrans manages its own education program for transportation students and provides K-12 resources; and
InTrans conducts local, regional, and national transportation services and continuing education programs.
Related Documents