Evaluation of Reverse Tone Mapping Through Varying Exposure Conditions Belen Masia 1 Sandra Agustin 1 Roland W. Fleming 2 Olga Sorkine 3 Diego Gutierrez 1,4 1 Universidad de Zaragoza 2 Max Planck Institute for Biological Cybernetics 3 New York University 4 Instituto de Investigaci´ on en Ingenier´ ıa de Arag ´ on (I3A) Abstract Most existing image content has low dynamic range (LDR), which necessitates effective methods to display such legacy content on high dynamic range (HDR) devices. Reverse tone mapping oper- ators (rTMOs) aim to take LDR content as input and adjust the contrast intelligently to yield output that recreates the HDR expe- rience. In this paper we show that current rTMO approaches fall short when the input image is not exposed properly. More specifi- cally, we report a series of perceptual experiments using a Bright- side HDR display and show that, while existing rTMOs perform well for under-exposed input data, the perceived quality degrades substantially with over-exposure, to the extent that in some cases subjects prefer the LDR originals to images that have been treated with rTMOs. We show that, in these cases, a simple rTMO based on gamma expansion avoids the errors introduced by other methods, and propose a method to automatically set a suitable gamma value for each image, based on the image key and empirical data. We validate the results both by means of perceptual experiments and using a recent image quality metric, and show that this approach enhances visible details without causing artifacts in incorrectly- exposed regions. Additionally, we perform another set of experi- ments which suggest that spatial artifacts introduced by rTMOs are more disturbing than inaccuracies in the expanded intensities. To- gether, these findings suggest that when the quality of the input data is unknown, reverse tone mapping should be handled with simple, non-aggressive methods to achieve the desired effect. CR Categories: I.3.7 [Computing Methodologies]: Computer Graphics—; I.4.10 [Computing Methodologies]: Image Processing and Computer Vision—Image Representation Keywords: Tone management, high dynamic range imaging, im- age processing, perception, psychophysics, human visual system 1 Introduction High dynamic range display devices are becoming increasingly common [Seetzen et al. 2004], yet very large amount of existing low dynamic range legacy content and prevalence of 8-bit photog- raphy persist. This presents us with the problem of reverse tone mapping. The aim of reverse tone mapping operators (rTMOs) is to endow low dynamic range (LDR) imagery with the appearance of a higher dynamic range without introducing objectionable arti- facts. Ideally, an rTMO should take a standard LDR image as input and reconstruct as accurately as possible the true luminance values of the original scene. As depicted in Figure 1, this is an ill-posed problem. For most scenes and imaging devices, the image data is irreversibly distorted by unknown nonlinearities, sensor noise, lens flare, blooming, and perhaps most importantly, sensor satura- tion, which clips high intensities to a constant value. Reverse tone mappers must somehow reconstruct the missing data, or boost the contrast in a way that does not cause the clipped regions to appear visually unpleasant. Existing rTMOs tackle this ill-posed problem in different ways, leading them to succeed and fail in different conditions. For exam- ple, some reverse tone mapping strategies may handle small clipped highlights well, but cause large saturated regions to appear unnat- ural. Conversely, other rTMOs may avoid introducing artifacts in over-exposed conditions, but fail to enhance under-exposed images sufficiently. The key is to understand which strategies produce the best possible visual experience, for which a number of user studies have recently been conducted [Yoshida et al. 2006; Seetzen et al. 2006; Aky¨ uz et al. 2007; Banterle et al. 2009b]. These experiments have yielded many valuable insights which may guide future rTMO and even HDR display design. However, they have been applied only to subjectively correctly exposed images, usually with knowl- edge of the dynamic range of the original, real-world scene. A key challenge in rTMO design is how to handle non-optimal LDR con- tent, particularly images that are incorrectly exposed. Our research is dedicated to finding non-intrusive ways to take ad- vantage of the higher dynamic range of the display medium, irre- spective of the dynamic range of the original image. Reverse tone mapping also sheds light on a general problem in signal process- ing: taking partial, distorted or corrupted data and reconstructing the original as faithfully as possible. Here our quality criterion is perceptual faithfulness rather than physical accuracy. The vast amount of LDR legacy content spans a large range of ex- posures. Under- or over-exposure may be due to different reasons, including bad choices by the photographer or pure artistic inten- tions. Legacy professional material may have been shot to make the most appropriate use of the dynamic range available at the time, very different from what is currently available. Additionally, the information about the dynamic range of the real scene is typically not recorded. It is therefore crucial to extend previous studies by taking into consideration varying exposure conditions for a set of images without additional information. We have performed a series of psychophysical studies assessing how rTMOs handle images across a wide range of exposure levels. We have found that, while existing rTMOs perform sufficiently well for dimmer (under-exposed) images, their performance systemati- cally decreases for brighter (over-exposed) input images. This sug- gests that there is a need for an rTM method that effectively deals with over-exposed content. We show that simply boosting the dy- namic range by means of an adaptive γ curve achieves good results that outperform the current rTMOs, and propose a simple method to obtain a suitable value of γ for each image. We additionally observe that artifacts produced by some rTMOs are also visible in low dynamic range renditions of the images. This is because many artifacts are not simply due to inappropriate intensity levels, but also have a spatial component. We perform a second user study to shed light on which type of inaccuracies introduced

Welcome message from author
This document is posted to help you gain knowledge. Please leave a comment to let me know what you think about it! Share it to your friends and learn new things together.
Transcript

Evaluation of Reverse Tone Mapping Through Varying Exposure Conditions
Belen Masia1 Sandra Agustin1 Roland W. Fleming2 Olga Sorkine3 Diego Gutierrez1,4
1Universidad de Zaragoza 2Max Planck Institute for Biological Cybernetics 3New York University4Instituto de Investigacion en Ingenierıa de Aragon (I3A)
Abstract
Most existing image content has low dynamic range (LDR), whichnecessitates effective methods to display such legacy content onhigh dynamic range (HDR) devices. Reverse tone mapping oper-ators (rTMOs) aim to take LDR content as input and adjust thecontrast intelligently to yield output that recreates the HDR expe-rience. In this paper we show that current rTMO approaches fallshort when the input image is not exposed properly. More specifi-cally, we report a series of perceptual experiments using a Bright-side HDR display and show that, while existing rTMOs performwell for under-exposed input data, the perceived quality degradessubstantially with over-exposure, to the extent that in some casessubjects prefer the LDR originals to images that have been treatedwith rTMOs. We show that, in these cases, a simple rTMO based ongamma expansion avoids the errors introduced by other methods,and propose a method to automatically set a suitable gamma valuefor each image, based on the image key and empirical data. Wevalidate the results both by means of perceptual experiments andusing a recent image quality metric, and show that this approachenhances visible details without causing artifacts in incorrectly-exposed regions. Additionally, we perform another set of experi-ments which suggest that spatial artifacts introduced by rTMOs aremore disturbing than inaccuracies in the expanded intensities. To-gether, these findings suggest that when the quality of the input datais unknown, reverse tone mapping should be handled with simple,non-aggressive methods to achieve the desired effect.
CR Categories: I.3.7 [Computing Methodologies]: ComputerGraphics—; I.4.10 [Computing Methodologies]: Image Processingand Computer Vision—Image Representation
Keywords: Tone management, high dynamic range imaging, im-age processing, perception, psychophysics, human visual system
1 Introduction
High dynamic range display devices are becoming increasinglycommon [Seetzen et al. 2004], yet very large amount of existinglow dynamic range legacy content and prevalence of 8-bit photog-raphy persist. This presents us with the problem of reverse tonemapping. The aim of reverse tone mapping operators (rTMOs) isto endow low dynamic range (LDR) imagery with the appearanceof a higher dynamic range without introducing objectionable arti-facts. Ideally, an rTMO should take a standard LDR image as inputand reconstruct as accurately as possible the true luminance valuesof the original scene. As depicted in Figure 1, this is an ill-posedproblem. For most scenes and imaging devices, the image data
is irreversibly distorted by unknown nonlinearities, sensor noise,lens flare, blooming, and perhaps most importantly, sensor satura-tion, which clips high intensities to a constant value. Reverse tonemappers must somehow reconstruct the missing data, or boost thecontrast in a way that does not cause the clipped regions to appearvisually unpleasant.
Existing rTMOs tackle this ill-posed problem in different ways,leading them to succeed and fail in different conditions. For exam-ple, some reverse tone mapping strategies may handle small clippedhighlights well, but cause large saturated regions to appear unnat-ural. Conversely, other rTMOs may avoid introducing artifacts inover-exposed conditions, but fail to enhance under-exposed imagessufficiently. The key is to understand which strategies produce thebest possible visual experience, for which a number of user studieshave recently been conducted [Yoshida et al. 2006; Seetzen et al.2006; Akyuz et al. 2007; Banterle et al. 2009b]. These experimentshave yielded many valuable insights which may guide future rTMOand even HDR display design. However, they have been appliedonly to subjectively correctly exposed images, usually with knowl-edge of the dynamic range of the original, real-world scene. A keychallenge in rTMO design is how to handle non-optimal LDR con-tent, particularly images that are incorrectly exposed.
Our research is dedicated to finding non-intrusive ways to take ad-vantage of the higher dynamic range of the display medium, irre-spective of the dynamic range of the original image. Reverse tonemapping also sheds light on a general problem in signal process-ing: taking partial, distorted or corrupted data and reconstructingthe original as faithfully as possible. Here our quality criterion isperceptual faithfulness rather than physical accuracy.
The vast amount of LDR legacy content spans a large range of ex-posures. Under- or over-exposure may be due to different reasons,including bad choices by the photographer or pure artistic inten-tions. Legacy professional material may have been shot to makethe most appropriate use of the dynamic range available at the time,very different from what is currently available. Additionally, theinformation about the dynamic range of the real scene is typicallynot recorded. It is therefore crucial to extend previous studies bytaking into consideration varying exposure conditions for a set ofimages without additional information.
We have performed a series of psychophysical studies assessinghow rTMOs handle images across a wide range of exposure levels.We have found that, while existing rTMOs perform sufficiently wellfor dimmer (under-exposed) images, their performance systemati-cally decreases for brighter (over-exposed) input images. This sug-gests that there is a need for an rTM method that effectively dealswith over-exposed content. We show that simply boosting the dy-namic range by means of an adaptive γ curve achieves good resultsthat outperform the current rTMOs, and propose a simple methodto obtain a suitable value of γ for each image.
We additionally observe that artifacts produced by some rTMOs arealso visible in low dynamic range renditions of the images. This isbecause many artifacts are not simply due to inappropriate intensitylevels, but also have a spatial component. We perform a seconduser study to shed light on which type of inaccuracies introduced

by reverse tone mapping most hamper our perception of the finalimage. This information can further help future rTMO design.
2 Previous Work
Reverse tone mapping. Dynamic range expansion, along withrelated subsequent problems such as contour artifacts, has been ini-tially addressed by bit-depth extension techniques [Daly and Feng2003] and decontouring methods [Daly and Feng 2004]. How-ever, these techniques are designed for extension to bit-depths muchlower than that of HDR displays. More recently, a few works havelooked at the problem of reverse tone mapping for the display ofLDR images and videos on HDR displays. The general approachof these reverse tone mapping techniques has been to identify thebright areas within the image, and in particular areas that have beenclamped due to sensor saturation, such as light sources. Those areasare typically significantly expanded, while the rest is left unchangedor mildly expanded, to prevent noise amplification. We offer here abrief discussion on reverse tone mapping techniques, and refer thereader to the work by Banterle and colleagues [2009a] for a com-prehensive review on the topic.
Banterle et al. [2006; 2007] apply the inverse of Reinhard’s tonemapping operator [Reinhard et al. 2002] to the LDR image and de-tect areas of high luminance in the resultant HDR image. They thenproduce a so-called expand-map by density estimation of the brightareas, and use this map to interpolate between the LDR image andthe initial inverse tone mapped HDR image, thus modulating theexpansion range. This framework has been extended to video bydesigning a temporally-coherent version of the expand-map [Ban-terle et al. 2008]. The LDR2HDR framework of Rempel et al. [2007]is similar in spirit, but their expand-map (which they term bright-ness enhancement function) can be computed in real time using theGPU. The image intensity is first linearized, and a binary maskis computed by thresholding the saturated pixels; the brightnessenhancement map is computed as a blurred version of the binarymask, combined with an edge stopping function to retain contrastof prominent edges. The contrast of the LDR image is then scaledaccording to the enhancement map. Note that the expansion is af-fected by the size of the bright objects: larger objects may receivemore brightness boost. Recently, Kovaleski and Oliveira [2009]presented a reverse tone mapping technique which is also based onreal-time computation of a brightness enhancement function, butsubstitutes a bilateral filter for the combination of a Gaussian blurand an edge stopping function used by Rempel et al. [2007].
Meylan et al. [2006; 2007] explicitly focus on specular highlightdetection and apply a steep linear tone mapping curve to the pre-sumably clamped areas, whereas the rest of the image is expandedby a mild linear curve. A more sophisticated segmentation and clas-sification of bright areas in the image is done in the work of Didykand colleagues [2008]: they segment the bright image areas and la-bel them as diffuse surfaces, light sources, specular highlights andreflections using a trained classifier. Different expansion functionsare designed for each class to reproduce the dynamic range moreaccurately (in particular, the luminance of light sources and high-lights is expanded more than that of reflections, while bright diffusesurfaces are not expanded). The method is suitable for high-qualityvideo enhancement thanks to the temporal coherence of the seg-mentation and the expansion function. Finally, Wang et al. [2007]propose to fill in the texture information of the clamped bright areasby transferring texture from other (well exposed) areas, althoughthe method may not be viable if a suitable region for transferring de-tail is not found elsewhere. Both methods [Didyk et al. 2008; Wanget al. 2007] rely on user assistance to guide the process, whereas weare interested in more automatic approaches.
User studies. It is now generally accepted that HDR displaysprovide a richer visual experience than their LDR counterparts.However, different parameters such as luminance, contrast or spa-tial resolution influence our visual experience, which makes it dif-ficult to come up with an ideal combination. Additionally, imagecontent probably also affects our preferences. In computer graph-ics, several researchers have performed a series of user studies, thefindings of which may even influence future hardware development.
Yoshida et al. [2006] judged subjective preference (without a refer-ence image) and fidelity (by comparing to a real world scene) for aseries of tone mapped images. Users could adjust brightness, con-trast and saturation for each individual image. Although their workwas geared towards the design of a forward tone mapping opera-tor, their conclusions are also useful for rTMO development: theyfound that, in general, brighter images were preferred over dimmerones. Interestingly, however, in certain cases users would break thistendency and keep a significant portion of the image dark, reducingoverall brightness and giving more importance to contrast.
Seetzen et al. [2006] analyzed the influence of luminance, contrastand amplitude resolution of HDR displays, to guide future displaydesigns. Their studies show that the preferred luminance and con-trast levels are related: for a given contrast, perceived image qual-ity increases with peak luminance, reaches a maximum and thenslowly decreases.
Akyuz and colleagues [2007] performed a series of psychophysicalstudies which revealed that a linear range expansion of the LDRimage could surpass the appearance of a true HDR image, sug-gesting that simple solutions may suffice for reverse tone mapping.Recently, Banterle et al. [2009b] have presented a psychophysicalevaluation of existing reverse tone mapping techniques, the resultsof which indicate that nonlinear contrast enhancement may yieldbetter results overall.
These previous studies provide useful insight into the desirable be-havior of tone mapping operators. A key difference with our workis that they were performed on correctly exposed images, whereaswe are interested in analyzing reverse tone mapping across varyingexposure conditions. In this work, we define over-exposed pixelsas those with values≥ 254, and under-exposed pixels as those withnull values [Rempel et al. 2007; Martin et al. 2008].
3 Experiment One: rTMO Evaluation
To assess the overall performance of an rTMO, it is important toevaluate it across a range of different imaging conditions. To thisend, we have performed a user study in which subjects directlycompared the output of three reverse tone mapping schemes (plusstandard LDR visualization) across a range of exposures, fromclearly under-exposed to clearly over-exposed images. We askedsubjects to rate the appearance of the reverse tone mapped im-ages on a calibrated Brightside DR37-P monitor (32.26′′ wide and18.15′′ high), with a black level of 0.015 cd/m2 and a peak lumi-nance of over 3000 cd/m2. Calibration of the Brightside monitorwas performed to confirm linearity and stable performance duringthe experiment and to enable comparison to specific intensities incd/m2 should the need have arisen in the analysis, as per standardpractice in psychophysics. Temperature compensation was turnedoff to avoid changes in intensity (this was possible thanks to the airconditioning in the room). The LDR versions of the images weredisplayed by approximately matching the contrast to a typical desk-top TFT (Dell).
Ambient luminance was kept at about 20 cd/m2, and the partici-pants were seated approximately one meter away from the monitor.Based on the subjects’ ratings, we can infer which rTMOs are most

High dynamic range scene HDR Raster Line
LDR Raster Line
log
scen
e in
tens
ity
- 6
- 5
- 4
- 3
- 2
- 1
0
1
pixel position
inversetonemapping
Iscene
Iimage
Φ Φ-1?
standard digital photography
log
imag
e in
tens
ity
- 6
- 5
- 4
- 3
- 2
- 1
0
1
Iimage Φ= Iscene( )
Figure 1: The reverse tone mapping problem. Standard imagingloses data by transforming the raw scene intensities Iscene throughsome unknown function Φ, which clips and distorts the originalscene values to create the Iimage , shown in the bottom panel (val-ues clipped from the original are shown in red). The goal of anrTMO is to invert Φ to reconstruct the original scene data, or toconvincingly “fake” it.
effective at recreating the experience of an HDR scene without vi-sually objectionable side-effects. As opposed to other studies, wedo not provide a ground truth HDR image for direct comparison,since it is almost always unavailable in the case of legacy content.
Stimuli: The stimuli consist of photographs of nine scenes withdifferent lighting conditions, captured with a Nikon D200 at anoriginal resolution of 3872 by 2592 (down-sampled for visualiza-tion purposes on the Brightside monitor, which has a 1920 by 1080pixel resolution). Each scene was captured with four different ex-posure times. Five scenes were made up of bright images (fromapproximately correct exposure to clearly over-exposed), and theremaining four were made up of dark images (from clearly under-exposed to approximately correct). Figure 2 shows a representativeimage of each scene, while Figure 3 shows the four exposures fortwo example scenes. The stimuli (please refer to the supplementarymaterial for the complete series of all the scenes) have been ob-tained from a previous study on exposure perception [Martin et al.2008], where the authors analyze basic image data to try to obtaina correlation between image statistics and the perception of under-and over-exposure.
From each exposure in the bracketed sequence, we obtainedthree candidate renditions for display on the HDR monitor us-ing a representative subset of reverse tone mapping algorithms:LDR2HDR [Rempel et al. 2007], Banterle’s operator [Banterle et al.2006] and linear contrast scaling [Akyuz et al. 2007]. Except forthe straightforward linear scaling (in Yxy color space, and thus per-formed on linearized values) we obtained the images from the au-thors of the original algorithms, in order to ensure accuracy in theimplementation. For the LDR2HDR algorithm the parameters usedwere 150 pixels for the standard deviation of the large Gaussian blurapplied to the mask, a brightness amplification factor α = 4 and agradient image baseline width for divided differences of 5 pixels,
plus a 9×9-pixel kernel for the antialiasing blur and a 4-pixel ra-dius for the open operator used to clean up the final edge stoppingfunction (please refer to the original paper for a detailed explanationof these parameters). In the case of Banterle’s operator, when gen-erating the expand-map, the parameters of the density estimationwere a radius ranging from 16 to 42 pixels (smaller radius for lowerexposures) and a threshold of 1 to 4 light sources (lower thresholdfor higher exposures), being 2048 the number of generated lightsources for Median Cut sampling. In both cases, Banterle’s opera-tor and LDR2HDR, images were linearized using gamma correction(γ = 2.2). We also added a fourth LDR rendition in which theoriginal images are presented within a luminance range matched toa typical desktop TFT monitor. The goal of this fourth image is tostudy whether the established assumption that visual preference isgiven to HDR holds over a range of exposures.
Subjects: A gender-balanced set of twelve subjects with nor-mal or corrected-to-normal acuity and normal color vision wererecruited to participate in the experiment. All subjects were un-aware of the purpose of the study, and were unfamiliar with HDRimaging.
Procedure: Participants viewed the stimuli on the BrightsideHDR display in a dark room. On each trial, subjects were pre-sented with all four renditions of a given exposure of a given scenein a 2×2 array (a stimulus quadruple). The positions of the fourrenditions within the array were random across trials, and the orderof the trials was random with the constraint that consecutive trialsdid not present the same scene. The subjects’ task was to rate thequality of the four renditions on a scale from 1 to 7, according tohow accurately the images depicted how the scene would appearto the subject if they were actually present in the scene. Thus thekey criterion for comparison was the subjective fidelity of the ren-ditions. Subjects were given unlimited time for each trial and couldmodify their rating of any of the renditions on a given trial beforeproceeding to the next trial. Additionally, they were free to assignthe same values to all four renditions on a given trial, although theywere instructed to try to use as much of the 1-7 scale as possiblewithin the experiment as a whole. To aid them in setting their scale,and to accustom them to the experimental procedure, the subjectswere presented with a number of practice trials before the start ofthe experiment.
Results: Several conclusions can be drawn from this test. First,for our images, there was a clear difference in perceived qualitybetween the bright and the dark series: subjects clearly preferred thereverse tone mapped depictions of darker images over brighter ones.This can be seen in Figure 4: not only is the overall mean valuesignificantly higher in the former case, but it is relatively stableacross exposure as well. In contrast, for the bright images, there isa general downward trend in ratings across the four exposure levels.
Note that this gradual decrease in performance does not correlatewith the subjective perception of quality of the original LDR im-age: in a previous pilot study, users picked different exposures foreach series as the subjective best, not necessarily the same as theobjective best (defined as the one with the smallest proportion ofunder- and over-exposed pixels [Akyuz et al. 2007]). The trend in-stead correlates with the proportion of over-exposed pixels and themean luminance, which do increase with exposure.
Secondly, we can observe systematic differences between therTMOs. On average, subjects rated the LDR2HDR and the LinearrTMOs best (the difference between the two failed to reach sta-tistical significance), followed by the LDR images, and finally theoutput of the Banterle’s rTMO (see Figure 4). Pairwise Wilcoxon
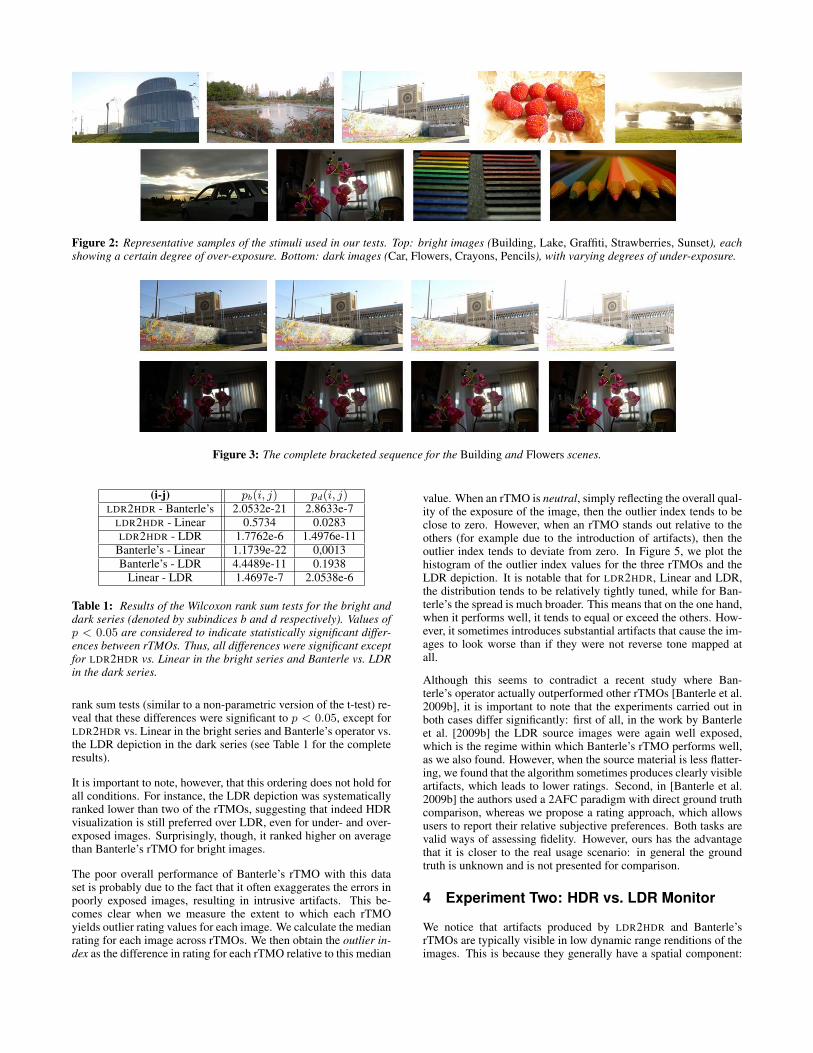
Figure 2: Representative samples of the stimuli used in our tests. Top: bright images (Building, Lake, Graffiti, Strawberries, Sunset), eachshowing a certain degree of over-exposure. Bottom: dark images (Car, Flowers, Crayons, Pencils), with varying degrees of under-exposure.
Figure 3: The complete bracketed sequence for the Building and Flowers scenes.
(i-j) pb(i, j) pd(i, j)LDR2HDR - Banterle’s 2.0532e-21 2.8633e-7
LDR2HDR - Linear 0.5734 0.0283LDR2HDR - LDR 1.7762e-6 1.4976e-11
Banterle’s - Linear 1.1739e-22 0,0013Banterle’s - LDR 4.4489e-11 0.1938
Linear - LDR 1.4697e-7 2.0538e-6
Table 1: Results of the Wilcoxon rank sum tests for the bright anddark series (denoted by subindices b and d respectively). Values ofp < 0.05 are considered to indicate statistically significant differ-ences between rTMOs. Thus, all differences were significant exceptfor LDR2HDR vs. Linear in the bright series and Banterle vs. LDRin the dark series.
rank sum tests (similar to a non-parametric version of the t-test) re-veal that these differences were significant to p < 0.05, except forLDR2HDR vs. Linear in the bright series and Banterle’s operator vs.the LDR depiction in the dark series (see Table 1 for the completeresults).
It is important to note, however, that this ordering does not hold forall conditions. For instance, the LDR depiction was systematicallyranked lower than two of the rTMOs, suggesting that indeed HDRvisualization is still preferred over LDR, even for under- and over-exposed images. Surprisingly, though, it ranked higher on averagethan Banterle’s rTMO for bright images.
The poor overall performance of Banterle’s rTMO with this dataset is probably due to the fact that it often exaggerates the errors inpoorly exposed images, resulting in intrusive artifacts. This be-comes clear when we measure the extent to which each rTMOyields outlier rating values for each image. We calculate the medianrating for each image across rTMOs. We then obtain the outlier in-dex as the difference in rating for each rTMO relative to this median
value. When an rTMO is neutral, simply reflecting the overall qual-ity of the exposure of the image, then the outlier index tends to beclose to zero. However, when an rTMO stands out relative to theothers (for example due to the introduction of artifacts), then theoutlier index tends to deviate from zero. In Figure 5, we plot thehistogram of the outlier index values for the three rTMOs and theLDR depiction. It is notable that for LDR2HDR, Linear and LDR,the distribution tends to be relatively tightly tuned, while for Ban-terle’s the spread is much broader. This means that on the one hand,when it performs well, it tends to equal or exceed the others. How-ever, it sometimes introduces substantial artifacts that cause the im-ages to look worse than if they were not reverse tone mapped atall.
Although this seems to contradict a recent study where Ban-terle’s operator actually outperformed other rTMOs [Banterle et al.2009b], it is important to note that the experiments carried out inboth cases differ significantly: first of all, in the work by Banterleet al. [2009b] the LDR source images were again well exposed,which is the regime within which Banterle’s rTMO performs well,as we also found. However, when the source material is less flatter-ing, we found that the algorithm sometimes produces clearly visibleartifacts, which leads to lower ratings. Second, in [Banterle et al.2009b] the authors used a 2AFC paradigm with direct ground truthcomparison, whereas we propose a rating approach, which allowsusers to report their relative subjective preferences. Both tasks arevalid ways of assessing fidelity. However, ours has the advantagethat it is closer to the real usage scenario: in general the groundtruth is unknown and is not presented for comparison.
4 Experiment Two: HDR vs. LDR Monitor
We notice that artifacts produced by LDR2HDR and Banterle’srTMOs are typically visible in low dynamic range renditions of theimages. This is because they generally have a spatial component:
l2h Ban Lin LDR1
2
3
4
5
6
7Exposure 1
Mea
n Ra
ting
l2h Ban Lin LDR1
2
3
4
5
6
7Exposure 2
Mea
n Ra
ting
l2h Ban Lin LDR1
2
3
4
5
6
7Exposure 3
Mea
n Ra
ting
l2h Ban Lin LDR1
2
3
4
5
6
7Exposure 4
Mea
n Ra
ting
l2h Ban Lin LDR1
2
3
4
5
6
7Exposure 1
Mea
n Ra
ting
l2h Ban Lin LDR1
2
3
4
5
6
7Exposure 2
Mea
n Ra
ting
l2h Ban Lin LDR1
2
3
4
5
6
7Exposure 3
Mea
n Ra
ting
l2h Ban Lin LDR1
2
3
4
5
6
7Exposure 4
Mea
n Ra
ting
1 2 3 41
2
3
4
5
6
7Ratings as a function of Exposure
Mea
n Ra
ting
Exposure
ldr2hdrBanterleLinearLDRGamma
1 2 3 41
2
3
4
5
6
7Ratings as a function of Exposure
Mea
n Ra
ting
Exposure
ldr2hdrBanterleLinearLDR
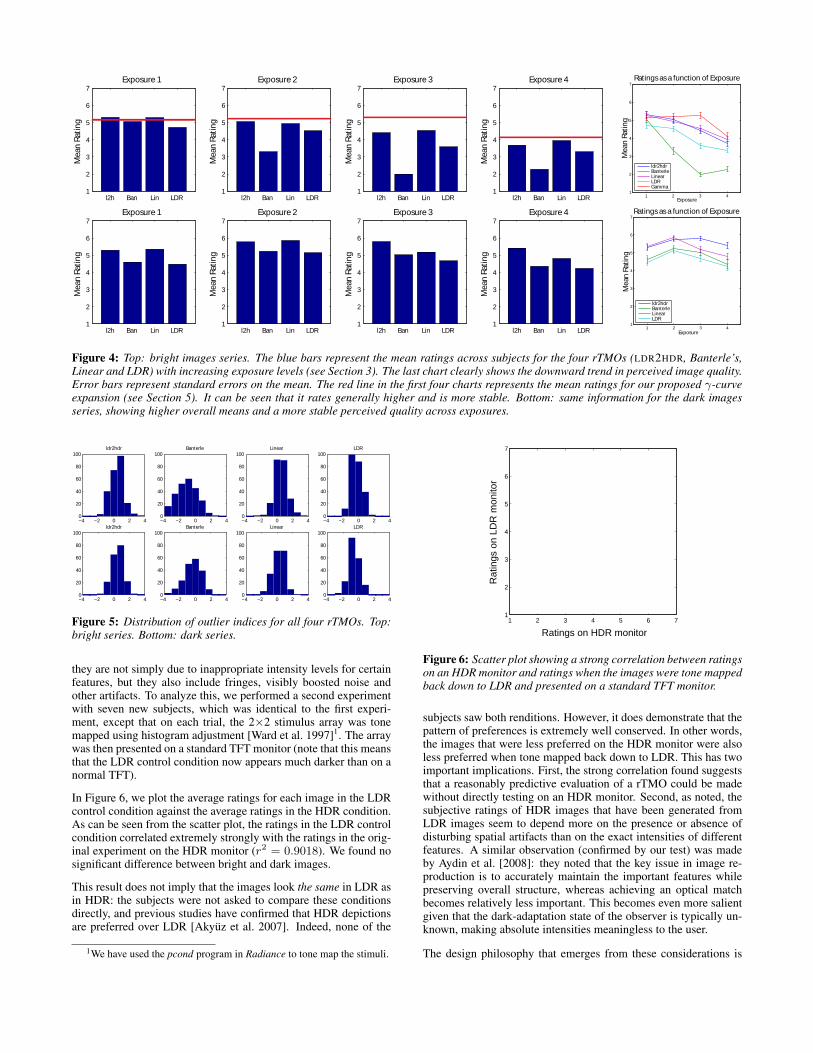
Figure 4: Top: bright images series. The blue bars represent the mean ratings across subjects for the four rTMOs (LDR2HDR, Banterle’s,Linear and LDR) with increasing exposure levels (see Section 3). The last chart clearly shows the downward trend in perceived image quality.Error bars represent standard errors on the mean. The red line in the first four charts represents the mean ratings for our proposed γ-curveexpansion (see Section 5). It can be seen that it rates generally higher and is more stable. Bottom: same information for the dark imagesseries, showing higher overall means and a more stable perceived quality across exposures.
−4 −2 0 2 40
20
40
60
80
100ldr2hdr
−4 −2 0 2 40
20
40
60
80
100Banterle
−4 −2 0 2 40
20
40
60
80
100Linear
−4 −2 0 2 40
20
40
60
80
100LDR
−4 −2 0 2 40
20
40
60
80
100ldr2hdr
−4 −2 0 2 40
20
40
60
80
100Banterle
−4 −2 0 2 40
20
40
60
80
100Linear
−4 −2 0 2 40
20
40
60
80
100LDR
Figure 5: Distribution of outlier indices for all four rTMOs. Top:bright series. Bottom: dark series.
they are not simply due to inappropriate intensity levels for certainfeatures, but they also include fringes, visibly boosted noise andother artifacts. To analyze this, we performed a second experimentwith seven new subjects, which was identical to the first experi-ment, except that on each trial, the 2×2 stimulus array was tonemapped using histogram adjustment [Ward et al. 1997]1. The arraywas then presented on a standard TFT monitor (note that this meansthat the LDR control condition now appears much darker than on anormal TFT).
In Figure 6, we plot the average ratings for each image in the LDRcontrol condition against the average ratings in the HDR condition.As can be seen from the scatter plot, the ratings in the LDR controlcondition correlated extremely strongly with the ratings in the orig-inal experiment on the HDR monitor (r2 = 0.9018). We found nosignificant difference between bright and dark images.
This result does not imply that the images look the same in LDR asin HDR: the subjects were not asked to compare these conditionsdirectly, and previous studies have confirmed that HDR depictionsare preferred over LDR [Akyuz et al. 2007]. Indeed, none of the
1We have used the pcond program in Radiance to tone map the stimuli.
1 2 3 4 5 6 71
2
3
4
5
6
7
Rat
ings
on
LDR
mon
itor
Ratings on HDR monitor
Figure 6: Scatter plot showing a strong correlation between ratingson an HDR monitor and ratings when the images were tone mappedback down to LDR and presented on a standard TFT monitor.
subjects saw both renditions. However, it does demonstrate that thepattern of preferences is extremely well conserved. In other words,the images that were less preferred on the HDR monitor were alsoless preferred when tone mapped back down to LDR. This has twoimportant implications. First, the strong correlation found suggeststhat a reasonably predictive evaluation of a rTMO could be madewithout directly testing on an HDR monitor. Second, as noted, thesubjective ratings of HDR images that have been generated fromLDR images seem to depend more on the presence or absence ofdisturbing spatial artifacts than on the exact intensities of differentfeatures. A similar observation (confirmed by our test) was madeby Aydin et al. [2008]: they noted that the key issue in image re-production is to accurately maintain the important features whilepreserving overall structure, whereas achieving an optical matchbecomes relatively less important. This becomes even more salientgiven that the dark-adaptation state of the observer is typically un-known, making absolute intensities meaningless to the user.
The design philosophy that emerges from these considerations is

that it is generally better to apply simpler, less-aggressive rTMOschemes if the original image is imperfect. Failing to fully recre-ate the HDR experience is less disturbing to users than unintendedartifacts that can occur when poorly-exposed images are adjustedtoo aggressively. In the following section we present a simple androbust approach to boosting the dynamic range of over-exposed im-ages, and show that it is less prone to artifacts than other rTMOs.
5 Expanding over-exposed content
Our experiments have shown that the danger with computationallysophisticated reverse tone mapping schemes is the potential to makethe image appear worse than before processing, through the intro-duction of objectionable artifacts. However, the goal of a rTMOis to make the image content look better in general and avoid, un-der any circumstances, making it look worse. Simple global re-verse tone mappers, such as linear scaling and gamma boosting,never cause polarity reversals, ringing artifacts or spuriously boostregions well beyond their context. Our first experiment clearly in-dicates that there is room for improvement in devising an rTMO forbright input images with large saturated areas, whilst darker imagesturn out much better. We thus focus on the former in this section.
Examining the bright sequence in Figure 3 we observe that as ex-posure increases, more detail is lost as pixel values become satu-rated, and colors fade to white. It thus seems reasonable to attemptto depict the image in a way that the remaining details becomemore prominent, as opposed to boosting saturated areas as exist-ing rTMOs do. Note that we do not aim to recover information lostto over-exposure, for which existing hallucination techniques maywork [Wang et al. 2007], but rather to increase perceived quality.
We make the following key observations, which have been con-firmed by previous studies on reverse tone mapping: on the onehand, darker HDR depictions are usually preferred for bright inputLDR images [Meylan et al. 2006]; on the other hand, in many casescontrast enhancements improve perceived image quality [Rempelet al. 2007]. These suggest expansion of the linearized luminancevalues following a simple γ curve, which has the desired effect ofdarkening the overall appearance of the images while increasingcontrast. Linearization of the luminance values prior to the dy-namic range expansion was done with a gamma curve (γ = 2.2),following the findings by Rempel et al. [2007] which note that sim-ple gamma correction can be used for linearization instead of theinverse of the camera response without producing visible artifacts.To avoid amplifying noise, a bilateral filter [Tomasi and Manduchi1998] can be used prior to expansion [Rempel et al. 2007]. Gammaexpansion may potentially boost noise; however, over-exposed im-ages tend to be significantly less noisy than under-exposed ones.Our psychophysical tests confirmed that noise amplification did notaffect the final perceived quality.
Obviously, the problem with the proposed expansion lies in auto-matically obtaining an image-dependent suitable γ value, to avoidthe cumbersome manual readjustment of the display settings foreach individual image to be shown. For this, we first obtain a mea-
1 2 3 4Building 0.697 / 1.22 0.762 / 1.5 0.816 / 1.75 0.845 / 2.6Lake 0.7714 / 1.1 0.7453 / 1.2 0.7487 / 1.5 0.7830 / 2.25Graffiti 0.7666 / 1.2 0.8193 / 1.35 0.8738 / 1.5 0.9184 / 1.75Strawberries 0.6696 / 1.22 0.7218 / 1.35 0.7218 / 1.55 0.8479 / 1.9Sunset 0.7022 / 1.1 0.8103 / 1.35 0.8016 / 1.4 0.8713 / 1.75
Table 2: Key and γ values for the five scenes and the four exposurelevels.
sure of image brightness, for which we compute its key value; thiskey acts as an indicator of whether the scene is subjectively darkor light. Since overall brightness can be approximated with log-luminance [Tumblin and Rushmeier 1993; Reinhard et al. 2002],we estimate the key of an image as [Akyuz and Reinhard 2006]:
k =logLavg − logLm
logLM − logLm(1)
where logLavg = (∑
x,ylog(L(x, y) + δ))/n. Lm and LM are
the minimum and maximum image luminances respectively, n isthe number of pixels and L(x, y) is the pixel luminance. The smalloffset δ prevents singularities when L(x, y) = 0. We exclude1% of the highest and lowest pixel values following the suggestionin [Akyuz and Reinhard 2006], to make the estimation less sensi-tive to outliers. We asked users in a pilot study to manually adjustthe value of γ in a set of images, and fitted empirical data with alinear regression γ = a · k + b (with a = 10.44 and b = −6.282),which relates γ as a function of the image key (r2 = 0.82). Wehave used this expression in this work to compute the reverse tonemapped results in this paper. Table 2 shows the key and γ valuesused for all the stimuli.
To provide a subjective evaluation of the performance of this strat-egy, we repeated Experiment One (Section 3), substituting the LDRdepiction with our γ-expanded versions in order to maintain the2×2 stimulus array. The red line in Figure 4 shows the results.
Experiment One provides useful information about the subjectiveperception of image quality. However, we are also interested inevaluating our approach from an objective point of view. The prob-lem is the fact that the intended comparison needs to be performedbetween an LDR and an HDR image. Recently, Aydin and col-leagues [2008] have presented a novel image quality metric whichidentifies visible distortions between two images, independently oftheir respective dynamic ranges. The metric uses a model of the hu-man visual system, and classifies visible changes between a refer-ence and a test image. The authors identify three types of structuralchanges: loss of visible contrast (when contrast visible in the ref-erence image becomes invisible in the second one), amplificationof invisible contrast (when invisible contrast in the reference imagebecomes visible in the second one), and reversal of visible contrast(when contrast polarity is reversed in the second image with respectto the reference). It is important to remember that, as Rempel andcolleagues noted [2007], contrast enhancement tends to increaseperceived quality, and therefore is a desired outcome of the rTMO.
Figure 7 shows the results of this metric2 comparing two of the orig-inal LDR images (reference images) with the corresponding outputsusing linear expansion, LDR2HDR, Banterle’s operator and our pro-posed γ curve. Our method reveals more detail, shows no loss ofcontrast and minimizes gradient reversals. Note that while our ap-proach may fail to utilize the dynamic range to its full extent insome cases, it has the important and experimentally validated ad-vantage of avoiding objectionable and unpredictable artifacts.
6 Discussion and Conclusions
Previous works on the perception of HDR images and rTM designhave assumed that the input images were, in general, correctly ex-posed. While these provide valuable knowledge that could guidethe development of both HDR display hardware and reverse tonemapping algorithms, existing LDR legacy content actually covers awide range of exposures, including material that suffers from badexposure. As currently designed, existing rTMOs tend to boost
2We have used the online implementation provided by the original au-thors of the paper: http://drim.mpi-inf.mpg.de/generator.php

Linear expansion LDR2HDR Banterle’s operator our γ curve
Figure 7: Comparing the results of several rTMOs with the image quality metric from Aydin et al.[2008]. The reference LDR images areLake (top) and Building (bottom) as depicted in Figure 2 (which correspond to the third and second exposure levels in the series. Please referto the supplementary material for all the exposures in all the scenes). Green, blue and red identify loss of visible contrast, amplification ofinvisible contrast and contrast reversal respectively. Our γ expansion does not lose any contrast, while minimizing gradient reversals. Moreimportantly, it reveals more detail in the most significant areas of the images (trees, grass, bushes and buildings in the images shown).
over-exposed areas more than the rest of the image. The strategyworks well for small areas such as light sources or highlights if therest of the image is correctly exposed, but no performance evalua-tion on generally over-exposed imagery had been performed.
Experiment One shows that performance of rTMOs decreases forinput images containing a large number of over-exposed pixels,while they seem to perform significantly better for darker images.This suggests that for bright images the consensual approach ofboosting bright areas could be improved. We have shown that asimple rTMO based on γ expansion, without the need for explic-itly detecting saturated areas, outperforms existing rTMOs in thesecases, and propose an empirical expression to automatically find asuitable γ as a function of the image’s key, without user interaction.This rTMO has the desired properties of boosting contrast and de-tail in non-saturated areas of the image, visually compensating forthe lack of information in the saturated ones.
We have performed two validation studies, both subjective and ob-jective. The first one has confirmed that our approach increasesthe perceived image quality for these kind of images. PairwiseWilcoxon rank sum tests revealed that the differences in ratingwere statistically significant with respect to all other rTMOs tested.Given that it produces darker overall images with increased con-trast, this result is in accordance with previous suggestions [Meylanet al. 2006; Rempel et al. 2007]. The second evaluation uses a re-cently published image quality metric which operates with arbitrarydynamic ranges [Aydin et al. 2008]. The metric concludes that ourmethod reveals more detail in non-saturated areas, does not reducecontrast and shows less gradient reversals than the other rTMOstested. Thus, the artists’ original intentions are better preserved.
In both experiments we used typical numbers of subjects for awithin-subject design in psychophysics, and the results were highlycoherent across subjects. In Experiment One the reported resultsare statistically significant to the p < 0.05 level, meaning thatthe chances that the outcome of the pairwise comparisons wouldchange after running more subjects from the same population isless than 5%. Indeed, for many of the results, the probability ismany orders of magnitude lower than this, which implies that thequalitative pattern of the results is well conserved across subjects.Likewise, data from Experiment Two exhibit a correlation coeffi-cient of 0.9018, notably conclusive in statistical terms.
Our findings seem to indicate that superior rTMOs should take into
account global statistics about the image, and not just individualpixel values. We have derived a simple strategy based on the keyvalue of the images, but more sophisticated strategies could also bedevised, possibly including high-level semantics.
We also ran the same expansion on the images from the dark se-ries: as expected, we found no significant improvements over thetested rTMOs, given that our expansion is designed for bright im-ages (please refer to the supplementary material for the completedata).
The results from our second experiment confirm that spatial arti-facts are more disturbing than inaccuracy in reproduced intensitylevels [Aydin et al. 2008]. We found a very strong correlation inthe pattern of preferences when viewing images on HDR and LDRdisplays. This does not mean that the images looked the same, butit does suggest that the artifacts that emerge with poorly-exposedinput images are spatial in nature and severe enough that HDR eval-uation is not necessary: they can also be clearly seen in LDR.
We do not aim to create new depictions of LDR material, whichwould potentially interfere with the original intentions and artisticvision. Our goal is much like that of an audio mastering engineer:we wish to increase the illusion of power, presence and fidelity inthe final display medium, while preserving the author’s original vi-sion of the content. Our results complement those in the work byAkyuz et al. [2007], where the authors show that, for correctly ex-posed imagery, a simple linear expansion works well and suggestthat sophisticated treatment of LDR data may not be necessary. Infact, our work is consistent with that of Akyuz et al. [2007] in thesense that our proposed γ curves approach linear scaling when theimage is approximately correctly exposed. Together, both studiessuggest that potentially complex operators might not be needed.
The conclusions drawn aim to be valuable for further develop-ment of HDR display technology, HDR imaging in general andthe development of future LDR expansion algorithms in particu-lar. However, further tests on LDR expansion are desirable. Asthe community investigates this issue further, this and similar stud-ies will surely be extended and updated. Future reverse tone map-ping strategies could allow the user to control dynamic range expan-sion based on her own preferences or intended goal. Aspects suchas tonal balance or mood could potentially be independently con-trolled by the user, in a similar manner to existing tools for LDR orHDR images [Bae et al. 2006; Lischinski et al. 2006; Farbman et al.

2008]. Similarly, reverse tone mapping for video content is a keychallenge in this field. In order to develop operators that gracefullyhandle changes in exposure over time, it is crucial to first under-stand how they fail in the static case, for which we hope this workstimulates future research.
7 Acknowledgements
We would like to express our gratitude to the anonymous reviewersfor their valuable comments. We would also like to thank MiguelMartin for contributing the original images, the authors of the otherrTMOs, especially Francesco Banterle, Allan Rempel and Wolf-gang Heidrich, for running their algorithms on our images, Aydinet al. for making their quality metric publicly available, and the par-ticipants in the experiments for their time. This research has beenpartially funded by the Spanish Ministry of Science and Technol-ogy (TIN2007-63025) and the Gobierno de Aragon (project OTRI2009/0411). Roland Fleming was funded by DFG FL624/1-2, byBW-FIT grant “Information at your Fingertips” and by the MaxPlanck Society. Olga Sorkine’s research is supported in part by anNYU URCF grant.
References
AKYUZ, A. O., AND REINHARD, E. 2006. Color appearance inhigh dynamic range imaging. SPIE Journal of Electronic Imag-ing 15, 3.
AKYUZ, A. O., FLEMING, R., RIECKE, B. E., REINHARD, E.,AND BULTHOFF, H. H. 2007. Do HDR displays support LDRcontent?: a psychophysical evaluation. ACM Trans. Graph. 26,3, 38.
AYDIN, T. O., MANTIUK, R., MYSZKOWSKI, K., AND SEIDEL,H.-P. 2008. Dynamic range independent image quality assess-ment. ACM Trans. Graph 27, 3, 69.
BAE, S., PARIS, S., AND DURAND, F. 2006. Two-scale tonemanagement for photographic look. ACM Trans. Graph. 25, 3,637–645.
BANTERLE, F., LEDDA, P., DEBATTISTA, K., AND CHALMERS,A. 2006. Inverse tone mapping. In GRAPHITE ’06, ACM, NewYork, NY, USA, 349–356.
BANTERLE, F., LEDDA, P., DEBATTISTA, K., CHALMERS, A.,AND BLOJ, M. 2007. A framework for inverse tone mapping.Vis. Comput. 23, 7, 467–478.
BANTERLE, F., LEDDA, P., DEBATTISTA, K., AND CHALMERS,A. 2008. Expanding low dynamic range videos for high dynamicrange applications. In Proceedings of the Spring Conference onComputer Graphics, ACM, New York, NY, USA.
BANTERLE, F., DEBATTISTA, K., ARTUSI, A., PATTANAIK, S.,MYSZKOWSKI, K., LEDDA, P., BLOJ, M., AND CHALMERS,A., 2009. High dynamic range imaging and LDR expansion forgenerating HDR content. Annex Eurographics 2009, April.
BANTERLE, F., LEDDA, P., DEBATTISTA, K., BLOJ, M., AR-TUSI, A., AND CHALMERS, A. 2009. A psychophysical eval-uation of inverse tone mapping techniques. Computer GraphicsForum 28, 1, 13–25.
DALY, S., AND FENG, X. 2003. Bit-depth extension using spa-tiotemporal microdither based on models of the equivalent inputnoise of the visual system. In Proceedings of Color ImagingVIII: Processing, Hardcopy, and Applications, SPIE, vol. 5008,455.
DALY, S., AND FENG, X. 2004. Decontouring: prevention and re-moval of false contour artifacts. In Proceedings of Human Visionand Electronic Imaging IX, SPIE, vol. 5292, 130.
DIDYK, P., MANTIUK, R., HEIN, M., AND SEIDEL, H.-P. 2008.Enhancement of bright video features for HDR displays. Com-puter Graphics Forum 27, 4, 1265–1274.
FARBMAN, Z., FATTAL, R., LISCHINSKI, D., AND SZELISKI, R.2008. Edge-preserving decompositions for multi-scale tone anddetail manipulation. ACM Trans. Graph. 27, 3, 67.
KOVALESKI, R. P., AND OLIVEIRA, M. M. 2009. High-quality brightness enhancement functions for real-time reversetone mapping. The Visual Computer 25, 5-7 (April), 539–547.
LISCHINSKI, D., FARBMAN, Z., UYTTENDAELE, M., ANDSZELISKI, R. 2006. Interactive local adjustment of tonal val-ues. ACM Trans. Graph. 25, 3, 646–653.
MARTIN, M., FLEMING, R., SORKINE, O., AND GUTIERREZ,D. 2008. Understanding exposure for reverse tone mapping. InCongreso Espanol de Informatica Grafica, 189–198.
MEYLAN, L., DALY, S., AND SUSSTRUNK, S. 2006. The repro-duction of specular highlights on high dynamic range displays.In IS&T/SID 14th Color Imaging Conference.
MEYLAN, L., DALY, S., AND SUSSTRUNK, S. 2007. Tonemapping for high dynamic range displays. In Proc. IS&T/SPIEElectronic Imaging: Human Vision and Electronic Imaging XII,vol. 6492.
REINHARD, E., STARK, M., SHIRLEY, P., AND FERWERDA, J.2002. Photographic tone reproduction for digital images. ACMTrans. Graph. 21, 3, 267–276.
REMPEL, A. G., TRENTACOSTE, M., SEETZEN, H., YOUNG,H. D., HEIDRICH, W., WHITEHEAD, L., AND WARD, G. 2007.Ldr2Hdr: on-the-fly reverse tone mapping of legacy video andphotographs. ACM Trans. Graph. 26, 3, 39.
SEETZEN, H., HEIDRICH, W., STUERZLINGER, W., WARD,G., WHITEHEAD, L., TRENTACOSTE, M., GHOSH, A., ANDVOROZCOVS, A. 2004. High dynamic range display systems.ACM Trans. Graph. 23, 3, 760–768.
SEETZEN, H., LI, H., YE, L., WARD, G., WHITEHEAD, L., ANDHEIDRICH, W. 2006. Guidelines for contrast, brightness, andamplitude resolution of displays. In Society for Information Dis-play (SID) Digest, 1229–1233.
TOMASI, C., AND MANDUCHI, R. 1998. Bilateral filtering forgray and color images. In ICCV, 839–846.
TUMBLIN, J., AND RUSHMEIER, H. E. 1993. Tone reproductionfor realistic images. IEEE Computer Graphics and Applications13, 6, 42–48.
WANG, L., WEI, L.-Y., ZHOU, K., GUO, B., AND SHUM, H.-Y.2007. High dynamic range image hallucination. In EurographicsSymposium on Rendering, 321–326.
WARD, G., RUSHMEIER, H., AND PIATKO, C. 1997. A visibil-ity matching tone reproduction operator for high dynamic rangescenes. IEEE Trans. on Visualization and Computer Graphics 3,4, 291–306.
YOSHIDA, A., MANTIUK, R., MYSZKOWSKI, K., AND SEIDEL,H.-P. 2006. Analysis of reproducing real-world appearance ondisplays of varying dynamic range. Computer Graphics Forum25, 3, 415–426.
Related Documents