0011-9164/07/$– See front matter © 2007 Elsevier B.V. All rights reserved Desalination 208 (2007) 238–259 Evaluation of reverse osmosis and nanofiltration for in situ persulfate remediated groundwater Chenju Liang a* , Clifford J. Bruell b , Michael F. Albert c , Paul E. Cross d , David K. Ryan e a Department of Environmental Engineering, National Chung Hsing University, 250 Kuo-Kuang Rd., Taichung City 402, Taiwan Tel. +886 (4) 2285 6610; Fax: +886 (4) 2286 2587; email: [email protected] b Department of Civil and Environmental Engineering, University of Massachusetts Lowell, One University Avenue, Lowell, MA 01854, USA c Tetra Tech, Inc., 800 Oak Ridge Turnpike, Suite A-600, Oak Ridge, TN 37830, USA d Camp Dresser & McKee, Inc. (CDM), 3930 US 23 South, Piketon, OH 45661, USA e Department of Chemistry, University of Massachusetts, One University Avenue, Lowell, MA 01854, USA Received 7 November 2005; Accepted 10 June 2006 Abstract Sodium persulfate is a common oxidant used for in situ chemical oxidation (ISCO) remediation of ground water contaminants (e.g., trichloroethylene (TCE)). Following ISCO unused persulfate and oxidation by-products such as sulfates remain within the groundwater at elevated levels. In this laboratory study the performance of three membranes: one nanofiltration (NF) membrane (designated DK) and two reverse osmosis (RO) membranes (designated AE and AG), manufactured by GE Osmonics, Inc., were evaluated for the removal of total dissolved solids (TDS), mainly persulfate and sulfates, and other associated by-products from a simulated groundwater. Experiments consisted of short-term sheet membrane evaluations, long-term spiral wound membrane evaluations and membrane compatibility tests. The general order of membrane performance was AE >AG>DK. SEM analysis of membrane surfaces clearly showed that both the DK and AG membranes experienced degradation and cracking after exposure to elevated sodium persulfate solutions for 30 days while the AE membrane appeared unchanged. This finding is in agreement with the membrane performance test results, again confirming that the AE membrane was the best membrane of this group. Keywords: In situ chemical oxidatin (ISCO); Trichloroethylene; Sulfate free radical; Groundwater *Corresponding author. (At the time of this study Dr. Liang was a Post Doctoral Research Associate at the University of Massachusetts Lowell.)

Welcome message from author
This document is posted to help you gain knowledge. Please leave a comment to let me know what you think about it! Share it to your friends and learn new things together.
Transcript
0011-9164/07/$– See front matter © 2007 Elsevier B.V. All rights reserved
Desalination 208 (2007) 238–259
Evaluation of reverse osmosis and nanofiltration for in situpersulfate remediated groundwater
Chenju Lianga*, Clifford J. Bruellb, Michael F. Albertc, Paul E. Crossd,David K. Ryane
aDepartment of Environmental Engineering, National Chung Hsing University,250 Kuo-Kuang Rd., Taichung City 402, Taiwan
Tel. +886 (4) 2285 6610; Fax: +886 (4) 2286 2587; email: [email protected] of Civil and Environmental Engineering, University of Massachusetts Lowell,
One University Avenue, Lowell, MA 01854, USAcTetra Tech, Inc., 800 Oak Ridge Turnpike, Suite A-600, Oak Ridge, TN 37830, USAdCamp Dresser & McKee, Inc. (CDM), 3930 US 23 South, Piketon, OH 45661, USA
eDepartment of Chemistry, University of Massachusetts, One University Avenue, Lowell, MA 01854, USA
Received 7 November 2005; Accepted 10 June 2006
Abstract
Sodium persulfate is a common oxidant used for in situ chemical oxidation (ISCO) remediation of ground watercontaminants (e.g., trichloroethylene (TCE)). Following ISCO unused persulfate and oxidation by-products such assulfates remain within the groundwater at elevated levels. In this laboratory study the performance of threemembranes: one nanofiltration (NF) membrane (designated DK) and two reverse osmosis (RO) membranes(designated AE and AG), manufactured by GE Osmonics, Inc., were evaluated for the removal of total dissolvedsolids (TDS), mainly persulfate and sulfates, and other associated by-products from a simulated groundwater.Experiments consisted of short-term sheet membrane evaluations, long-term spiral wound membrane evaluations andmembrane compatibility tests. The general order of membrane performance was AE >AG>DK. SEM analysis ofmembrane surfaces clearly showed that both the DK and AG membranes experienced degradation and cracking afterexposure to elevated sodium persulfate solutions for 30 days while the AE membrane appeared unchanged. Thisfinding is in agreement with the membrane performance test results, again confirming that the AE membrane wasthe best membrane of this group.
Keywords: In situ chemical oxidatin (ISCO); Trichloroethylene; Sulfate free radical; Groundwater
*Corresponding author. (At the time of this study Dr. Liang was a Post Doctoral Research Associate at the University ofMassachusetts Lowell.)
C. Liang et al. / Desalination 208 (2007) 238–259 239
1. Introduction
In situ chemical oxidation (ISCO) is a treat-ment method used to remediate soil and ground-water contamination caused by organic con-taminants (e.g., trichloroethylene (TCE)). Thistechnology is based on the delivery of oxidizingagents to a contaminated source zone in order toconvert the contaminants into harmless endproducts within the soil mass. Sodium persulfate(Na2S2O8) is a popular oxidant that is commonlyused for ISCO [1–4]. The persulfate anion(S2O8
2!) is a strong oxidant with a redox potentialof 2.01 V. For the purposes of ISCO the persul-fate anion can be thermally or chemicallyactivated to produce a stronger oxidant known asthe sulfate free radical (SO4
!·) (Eo = 2.6 V). Theproduction of the sulfate free radical (SO4
!·) canbe described by the following reactions [5]:
(1)Thermal Activation2- -2 8 4S O 2 SO •⎯⎯⎯⎯⎯⎯→
(2)Chemical Activation2- 2 -
2 8 4
2- 34
S O Me SO
SO Me
+
+
•+ ⎯⎯⎯⎯⎯⎯→
++
where Me2+ represents divalent transition metals(e.g., Fe2+).
When SO4!· enters into an oxidation reaction,
the reduction of SO4!· results in the production of
sulfate (SO42!) as follows:
Eo = 2.6 V (3)- 2-4 4SO SOe−+ →i
The reaction between SO4!· and transition metals
would also result in the production of sulfate asfollows:
(4)- 2 2- 34 4 SO Me SO Me + +• ++ →
Following ISCO residual sodium persulfate orelevated sulfate concentrations in groundwaterresulting as end-products when persulfate anionsare used to oxidize organic contaminants or when
persulfate is decomposed to form sulfate inaccordance with the above mentioned reactionscould pose environmental concerns. The USNational Secondary Drinking Water StandardRegulations for sulfate is 250 mg/L [6]. This is anon-enforceable guideline that is recommendedby the USEPA. However, if sulfate is associatedwith hydrogen ion under acidic condition, theformation of sulfuric acid would cause corrosiveconditions within the groundwater. Also, drinkingof groundwater containing high sulfate concen-trations can result in illnesses such as diarrhea[7].
A common issue pertaining to ISCO remedi-ation of contaminated soil and groundwater is thatthis treatment might increase metal mobility dueto reaction mechanisms such as the oxidationdestruction of natural organic matter and minerallinkages [8]. Also, oxidation induced by low pHcan result in increases in dissolved metal concen-trations in groundwater. For example, experi-ments conducted by Liang et al. [3] revealed thatferrous ion activated persulfate oxidation of thecommon groundwater contaminant trichloro-ethylene (TCE) in an aqueous phase usuallyresulted in pH changes from an initial value ofapproximately 5 that dropped to around 3 as thereaction proceeded. The form of persulfate saltselected could contribute significant amounts ofdissociated metal cations. For example, sodiumpersulfate is commonly used for in situ remedi-ation due to its high water solubility. Therefore,elevated sodium concentrations would be ex-pected in sodium persulfate treated groundwater.
During ISCO the oxidant is often injected onone side of a contaminated area while extractinggroundwater on the other side. This method isused to induce the migration of oxidant throughthe target subsurface area and is known as in situchemical oxidation with recirculation (ISCOR).In practice it is anticipated that the groundwaterextraction system portion of the ISCOR wouldcollect more water than is injected. The excessgroundwater may contain high concentrations of
C. Liang et al. / Desalination 208 (2007) 238–259240
total dissolved solids (TDS) (mainly sulfate andresidual persulfate) and these must be removedfrom the system prior to reinjection or discharge.In order to reduce the environmental impact ofISCO remediation with persulfate, it is necessaryto explore a method for removing elevated sulfateor residual persulfate from the remediatedgroundwater.
Membrane separation processes such asreverse osmosis (RO) and nanofiltration (NF)have been widely used to purify water includingremoval of hardness [9–11], metals such as: iron(Fe), manganese (Mn), calcium (Ca), silicon (Si)[12–14] and natural organic matter (NOM) [11,15]. Visser et al. [7] successfully applied NFmembranes for the removal of sulfate and otherions (e.g., Ca2+, Na+, Cl!) which existed in watercontaminated by mining activity. Barr [16]developed a sulfur removal system (SRS) incor-porating NF membrane technology and demon-strated that a NF membrane can effectivelyseparate sulfate from chloralkali brine at NFpressures of 20.7–41.4 bar and achieve sulfaterejection levels above 92% from a solution con-taining a sodium sulfate concentration of 180 g/L.Note that for general purposes NF systems aretypically operated at pressures of 5–10 bar [17].In addition, Visser et al. [7] also found that theperformance of sulfate removal decreased in alow pH solution (< pH 2) due to the high fractionof bisulfate ion (HSO4
!) present. Note that a pKavalue for the system of bisulfate and sulfate ionsis 2.0 [18], which indicates that at a pH less than2 the HSO4
! prevails over the SO42!. The appli-
cation of ISCO using persulfate usually results inacidic pH conditions somewhat greater than 2[2–4] unless an extremely high persulfate concen-tration (e.g., 1 M) is used. Therefore, SO4
2! wouldbe the dominant species when persulfate isdecomposed in general applications.
This study was conducted to evaluate thefeasibility of using selected commercial RO andNF membranes for the removal of TDS (e.g.,sulfates and persulfate) and other ions from
synthetic groundwater. The synthetic groundwater was designed to mimic groundwater thatwould result from ISCO with sodium persulfate.Many membrane materials are effective inremoving impurities (e.g., sulfate), however,concerns pertaining to the treatment of ISCOremediated groundwater which also containsresidual oxidant (e.g., persulfate) needed to beresolved. Therefore, it was necessary to inves-tigate membrane sensitivity to ISCO oxidants(i.e., persulfate or sulfate free radicals) whilesimultaneously evaluating membrane perfor-mance. Also, the materials compatibilities of thesolutions and the membranes tested wereexamined.
2. Experimental2.1. Materials
Barium chloride (BaCl2, 98.0% min.), potas-sium sulfate, (K2SO4, 99.0% min.), magnesiumsulfate heptahydrate (MgSO4·7H2O, 99.0–102.0%), boron (B, 1000 mg/mL), silica gel(SiO2, 60–200 Mesh), sodium bicarbonate(NaHCO3, 99.7–100.3%), trichloroethylene(C2HCl3, 99.5 min.), and sodium sulfate (Na2SO4,99.0% min.) were purchased from J.T.Baker.Sodium persulfate (Na2S2O8, 98%) and sodiumchloride (NaCl, 99.0 min.) were purchased fromAlfa Aesar and VWR International, respectively.Calcium chloride (CaCl2, 96% min.), sodium car-bonate (Na2CO3, 99.5%), and sodium nitrate(NaNO3, 99.0% min.) were purchased from EMDChemical Inc. The NF membrane tested desig-nated as DK is one of the GE Osmonics D-series.The two types of RO membrane tested designatedas AG and AE tested are of the GE OsmonicsA-series designed for desalination of brackishwater and seawater families, respectively. Thespecifications of the three membranes are pro-vided in Table 1. Water (deionized water (DI))was produced from a Barnstead B-pureTM systemequipped with a pretreatment deionization car-tridge and an ultrapure deionization cartridge.
C. Liang et al. / Desalination 208 (2007) 238–259 241
Table 1Membrane characteristics (GE Osmonics, Inc.)
Membrane DK nanofiltrationmembrane
AE reverse osmosismembrane
AG reverse osmosismembrane
Descriptions Proprietary nanofiltration thin-filmmembrane (TFM®)
Thin-film membrane(TFM®)
Thin-film membrane(TFM®)
Applications Dye removal/concentration, heavymetal removal, acid purification
Seawater desalination Brackish water desalination,reactive silica removal
Rejectioncharacteristics
Moleculare weight cut-off of 150-300 daltons for unchargedorganic molecules
NaCl rejectiona:99.2% average
NaCl rejectionb:99% average
Operating pH range 2.0–11.0 4.0–11.0 4.0–11.0
aNaCl 32,000 ppm at 55.1 bar and 25EC.bNaCl 500 ppm at 7.9 bar and 25EC.
2.2. Synthetic groundwater preparation
The water was spiked with variety of inor-ganic chemicals and TCE in accordance with thedesign concentrations presented in Table 2. Thesynthetic groundwater was prepared in a 275 literhigh-density polyethylene tank at room tempera-ture and allowed to sit overnight. The totalvolume of solution prepared was 265 liters. Thewater was then analyzed for metals, sulfates,persulfate, pH, alkalinity, total dissolved solids,carbonate species, and hardness before the testingstarted.
2.3. Short-term evaluation of membraneperformance
The schematic diagram of a high pressure celltest unit (GE Osmonics, Inc.) is shown in Fig. 1.The sample membrane sheets were placed over 2stainless test cells, each cell with an area of81.03 cm2. The test unit was operated accordingto the following sequence: fully open the back-pressure regulator, turn on power switch to startpump, allow system to run for a couple ofminutes, slowly close both backpressure regu-lators simultaneously, while monitoring the pres-sure gauge until the desired pressure is reached.
Table 2Composition of synthetic groundwater
Component Designconcentration (mg/L)
Chemicals
Barium (Ba) 0.11 BaClCalcium (Ca) 77.66 CaCl2
Potassium (K) 27.93 K2SO4
Sodium (Na) 5,151a 16,273b
20,219c
Magnesium (Mg) 51.06 MgSO4·7H2O
Boron (B) 0.05 B standard,(1 mg/mL)
Silicon (Si) 28.34 SiO2
Alkalinity asCaCO3
138.00 NaHCO3/Na2CO3
Nitrate/Nitrite as N2 27.00 NaNO3
Chloride (Cl!) 183.72 NaClTrichloroethylene 1.00 TCESulfate (SO4
2!) 10,270.39 Na2SO4Sodium persulfate(Na2S2O8)
2,000(1) 10,000(2)
80,000(3)Na2S2O8
aShort-term evaluation of membrane performance tests.bLong-term evaluation of spiral wound membrane elementperformance tests. cCompatibility tests. Note: sodium con-tents are not produced from a specific chemical (e.g., NaCl),but are the sum of all associated sodium ions resulting fromthe addition of all chemicals used. Chloride and sulfatecontents included the associated Cl! and SO4
2! ions from theaddition of chemicals used.

C. Liang et al. / Desalination 208 (2007) 238–259242
\
Fig. 1. Schematic representation of a high pressure cell test unit (modified from a figure provided by DesalTM MembraneProducts). [1] Feed tank, [2] P.D., Pump 800 psig 1.1 gpm, [3] Test cell 1, [4] Test cell 2, [5] Membrane (12 sq. in.), [6]Back pressure regulator, [7] Test cell 2 permeate, [8] Test cell 1 permeate, [9] Test cell 2 concentrate, [10] Test cell 1concentrate, [11] Bypass flow, [12] Relief, [13] Pressure relief valve, [14] Operating pressure monitor, [15] Flow meters.Dashed lines are subject to removal depending on design experimental conditions.
reached. Since two test cells were assembled andrun in parallel, a relatively high pressure appliedto one test cell would cause higher feed waterflow rates to the other test cell. Therefore, bothbackpressure regulators were opened to promoteequal pressurization at the beginning of theexperiments by monitoring concentrate and per-meate flows through the in-line flow meters. Theoperating pressure was applied when both per-meate flow rates were approximately equal andthe sum of both flow rates reached a maximumvalue. All tests were run in a recycle mode (bothconcentrate and permeate were recycled back tothe feed tank) for 4 days, and thereafter, permeatewas collected and removed from the feed for theremainder of the test period (2 days) similar to thework of [19]. It was anticipated that the removalof permeate water would result in more concen-trated feed water and eventually lead to mem-brane clogging.
2.4. Long-term evaluation of spiral woundmembrane element performance
In these long-term tests a high pressure stain-less steel 1812 spiral wound membrane elementtest unit (GE Osmonics, Inc.) equipped withspiral wound membrane elements was used toreplace the two flat square membrane sheet cellsused in previous tests. In the test unit the spiralwound membrane element is positioned around acentral stainless steel permeate collection tube.For brevity these spiral wound membrane ele-ments will often be referred to as simply “DKmembrane, AG membrane or AE membrane”.The synthetic feed groundwater used in thesetests was prepared as described in Table 2, withexception that elevated sodium persulfate andsulfate ion concentrations of 10,000 and30,000 mg/L were used. The system was run in arecycle mode throughout the duration of opera-tion and the operating pressure was set in
C. Liang et al. / Desalination 208 (2007) 238–259 243
accordance with procedures previously describedfor the membrane tests.
2.5. Membrane compatibility testsThe water prepared for this test was prepared
as described in Table 1 with the exception thatthe sodium persulfate concentration was in-creased to 80,000 mg/L and no TCE was added.The membrane was soaked in the spiked ground-water for 30 days. After removing membranesfrom solution, the membrane was rinsed withfresh DI water. Before and after the test, themembrane surface was examined using a scan-ning electron microscope (SEM) and an energydispersive X-ray spectrometer (EDXS).
2.6. AnalysisTCE standards were prepared to determine a
GC response factor and linear nature of cali-bration data. An HP Model 5890 GC/FIDequipped with an HP7673 autosampler was usedfor sample analysis. Samples were analyzed fol-lowing solvent extraction of samples with pen-tane. Analytical parameters were in accordancewith those detailed in Liang et al. [2].
The metals Ba, K, B, Ca, Mg and Si wereanalyzed with a direct current plasma (DCP)atomic emission spectrometer model IIIB manu-factured by Spectrametrics, Inc. Na was analyzedvia flame atomic absorption (FAA) spectrometry.
The pH was measured using a pH probe(Fisher Accumet AR15) and chloride ions weremeasured using a benchtop pH/ISE meter (Orionmodel EATM 940 expandable ionanalyzer)equipped with a Fisher chloride ion selectiveelectrode and a double junction reference Ag/AgCl electrode. In accordance with analyticalprocedures described in Standard Methods for theExamination of Water and Wastewater [20], hard-ness was measured using an EDTA titrimetricmethod; TDS were determined by drying at180EC; carbonate and bicarbonate species were
measured using a titration method; sulfate ionwas measured with a turbidimetric method.Langelier Saturation Index (LSI) was determinedin accordance with the calculation for concentratestream of a reverse osmosis device [21].
To examine membrane materials with a SEM,the membrane samples were initially carbonevaporated in a Denton Vacuum DV-502A toimprove conductivity. The samples were pumpeddown to a vacuum of 1.33×(10!3 to 10!4) Pa.Under these conditions the coating thickness isbetween 5 to 15 nm. The samples were thenplaced in the chamber of an Amray 1820I SEMwith EDXS and pumped to a vacuum of 1.33 ×(10!4 to 10!5) Pa, depending on how muchthe samples out-gassed. The samples werethen imaged under the SEM and digitallyphotographed.
3. Results and discussion
3.1. Short-term evaluation of membraneperformance
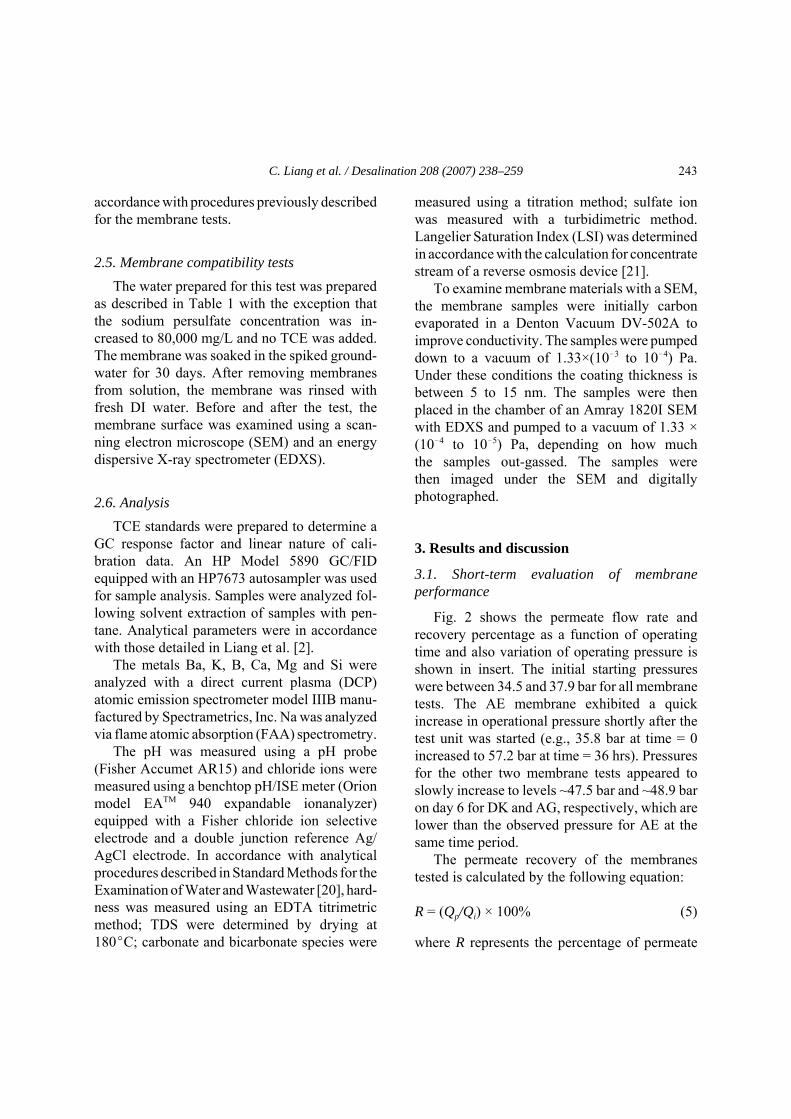
Fig. 2 shows the permeate flow rate andrecovery percentage as a function of operatingtime and also variation of operating pressure isshown in insert. The initial starting pressureswere between 34.5 and 37.9 bar for all membranetests. The AE membrane exhibited a quickincrease in operational pressure shortly after thetest unit was started (e.g., 35.8 bar at time = 0increased to 57.2 bar at time = 36 hrs). Pressuresfor the other two membrane tests appeared toslowly increase to levels ~47.5 bar and ~48.9 baron day 6 for DK and AG, respectively, which arelower than the observed pressure for AE at thesame time period.
The permeate recovery of the membranestested is calculated by the following equation:
R = (Qp/Qi) × 100% (5)
where R represents the percentage of permeate
C. Liang et al. / Desalination 208 (2007) 238–259244
Fig. 2. Variation of permeate flowrate and percentage recovery rate as a function of operating time. Insert shows operatingpressure vs. time.
water recovered (i.e, produced), and Qp is thepermeate flow rate, and Qi is the inlet flow ratewhich equals the sum of concentrate and per-meate flow rates (excluding bypass flow rate).
In general, the permeate production for AEand AG RO membranes is more stable than theDK NF membrane which exhibited declines inrecovery and permeate flow rates with time.However, there was also a fluctuation of thepercentage recovery for two RO membranes (AEand AG). Particle size ranges removed by RO
membranes (AE and AG) are from 0.1–1 nm andthe NF membrane (DK) has a range of 0.4–6 nm[17]. Fouling of membranes could increaseresistance to flow and cause a decrease in thepermeate flow rate. This was observed asincreases of bypass flow rates and decreasedrecoveries with respect to time.
The TDS levels in all streams (i.e., feed,concentrate and permeate) are shown in Fig. 3. Itwas observed that all three membranes couldsignificantly reduce TDS in the permeate water.
C. Liang et al. / Desalination 208 (2007) 238–259 245
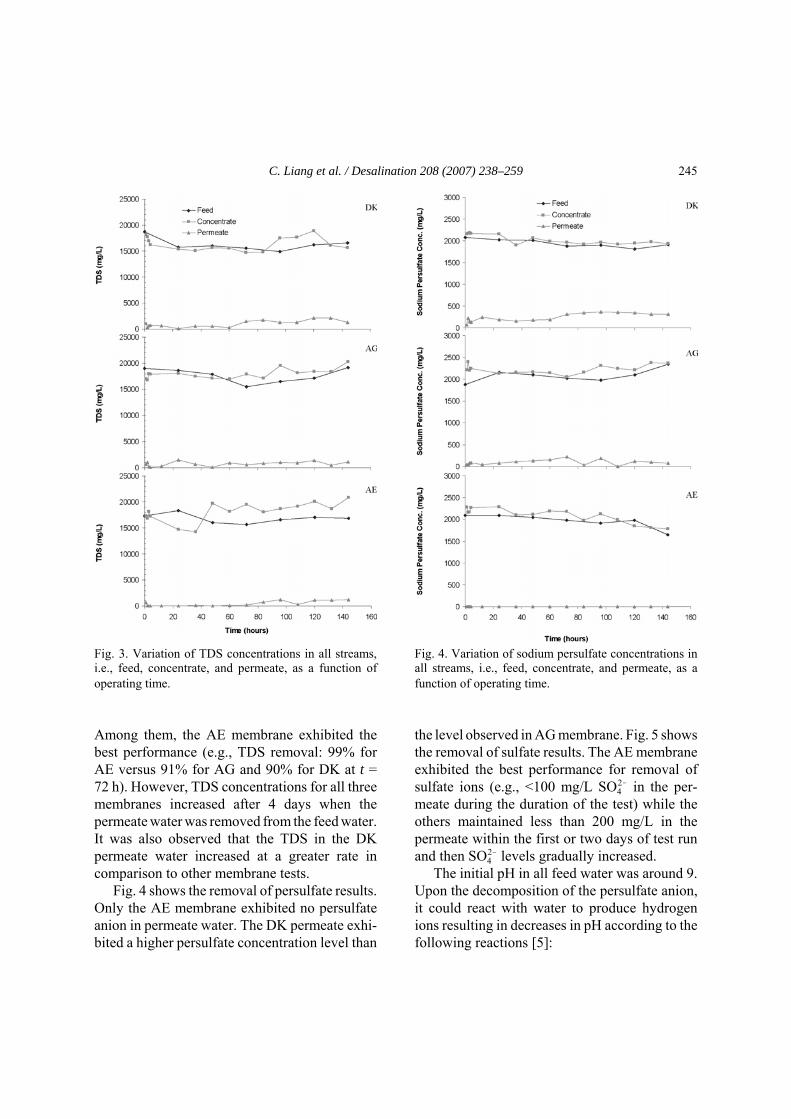
Fig. 3. Variation of TDS concentrations in all streams,i.e., feed, concentrate, and permeate, as a function ofoperating time.
Among them, the AE membrane exhibited thebest performance (e.g., TDS removal: 99% forAE versus 91% for AG and 90% for DK at t =72 h). However, TDS concentrations for all threemembranes increased after 4 days when thepermeate water was removed from the feed water.It was also observed that the TDS in the DKpermeate water increased at a greater rate incomparison to other membrane tests.
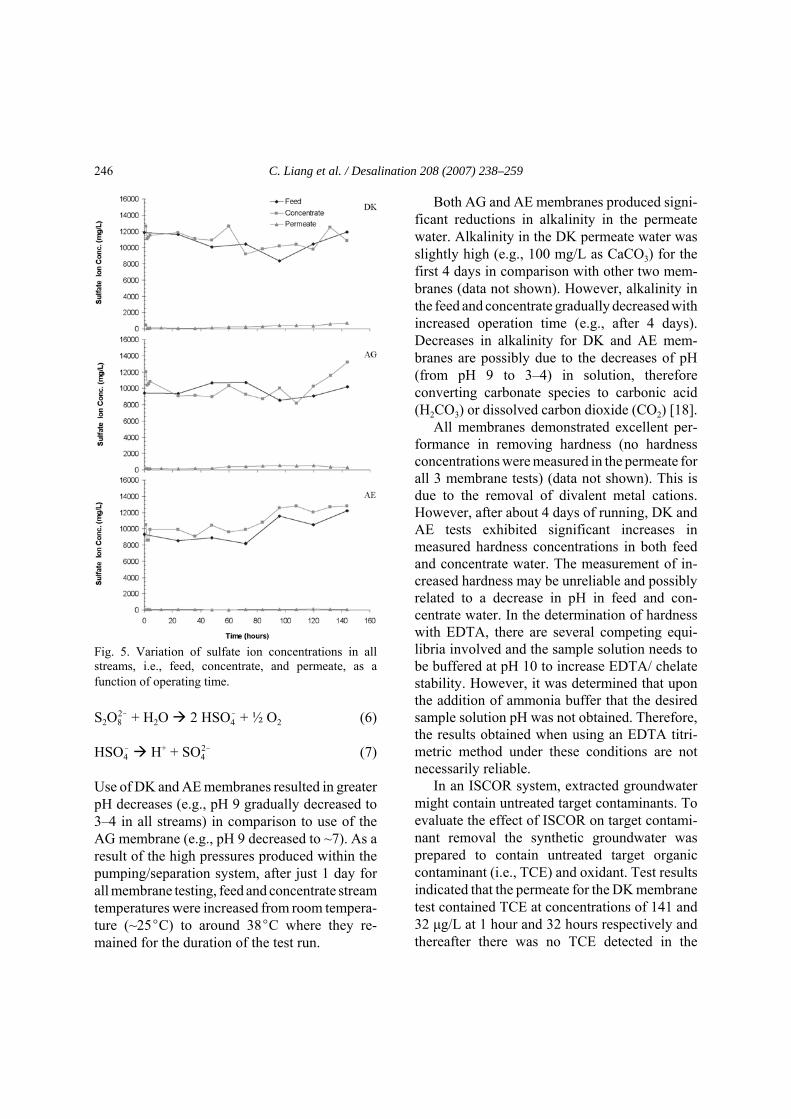
Fig. 4 shows the removal of persulfate results.Only the AE membrane exhibited no persulfateanion in permeate water. The DK permeate exhi-bited a higher persulfate concentration level than
Fig. 4. Variation of sodium persulfate concentrations inall streams, i.e., feed, concentrate, and permeate, as afunction of operating time.
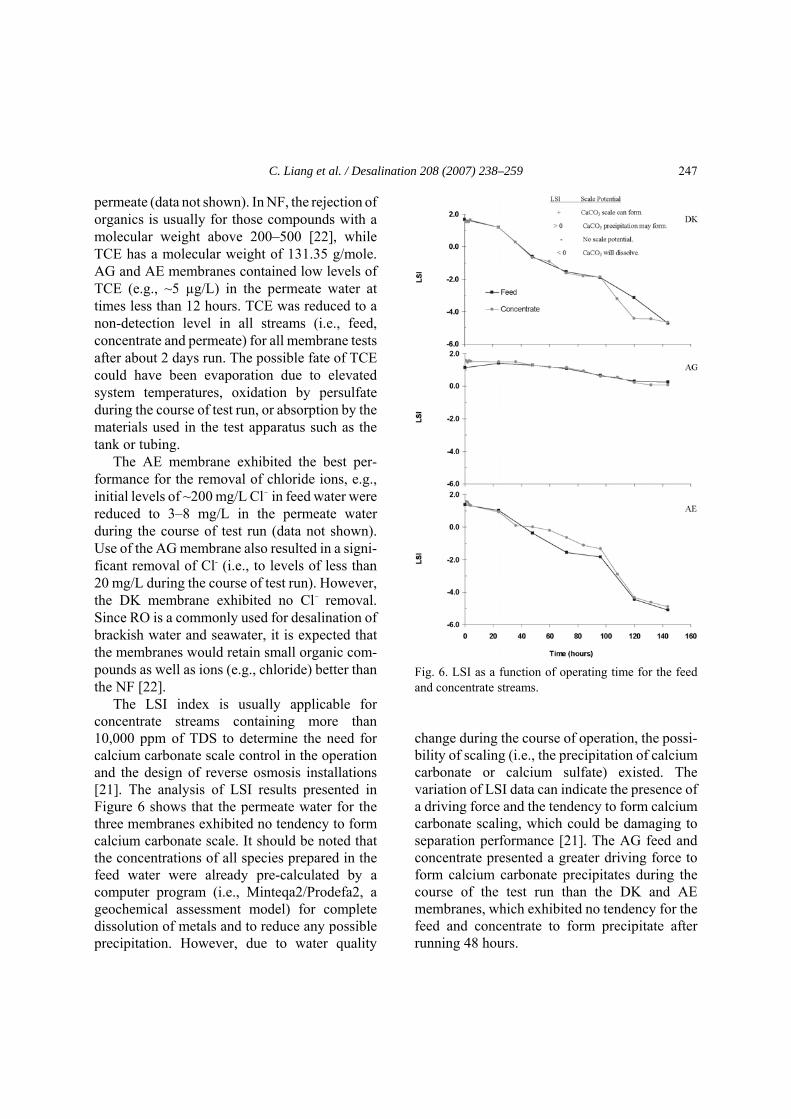
the level observed in AG membrane. Fig. 5 showsthe removal of sulfate results. The AE membraneexhibited the best performance for removal ofsulfate ions (e.g., <100 mg/L SO4
2! in the per-meate during the duration of the test) while theothers maintained less than 200 mg/L in thepermeate within the first or two days of test runand then SO4
2! levels gradually increased. The initial pH in all feed water was around 9.
Upon the decomposition of the persulfate anion,it could react with water to produce hydrogenions resulting in decreases in pH according to thefollowing reactions [5]:
C. Liang et al. / Desalination 208 (2007) 238–259246
Fig. 5. Variation of sulfate ion concentrations in allstreams, i.e., feed, concentrate, and permeate, as afunction of operating time.
S2O82! + H2O 2 HSO4
! + ½ O2 (6)
HSO4! H+ + SO4
2! (7)
Use of DK and AE membranes resulted in greaterpH decreases (e.g., pH 9 gradually decreased to3–4 in all streams) in comparison to use of theAG membrane (e.g., pH 9 decreased to ~7). As aresult of the high pressures produced within thepumping/separation system, after just 1 day forall membrane testing, feed and concentrate streamtemperatures were increased from room tempera-ture (~25EC) to around 38EC where they re-mained for the duration of the test run.
Both AG and AE membranes produced signi-ficant reductions in alkalinity in the permeatewater. Alkalinity in the DK permeate water wasslightly high (e.g., 100 mg/L as CaCO3) for thefirst 4 days in comparison with other two mem-branes (data not shown). However, alkalinity inthe feed and concentrate gradually decreased withincreased operation time (e.g., after 4 days).Decreases in alkalinity for DK and AE mem-branes are possibly due to the decreases of pH(from pH 9 to 3–4) in solution, thereforeconverting carbonate species to carbonic acid(H2CO3) or dissolved carbon dioxide (CO2) [18].
All membranes demonstrated excellent per-formance in removing hardness (no hardnessconcentrations were measured in the permeate forall 3 membrane tests) (data not shown). This isdue to the removal of divalent metal cations.However, after about 4 days of running, DK andAE tests exhibited significant increases inmeasured hardness concentrations in both feedand concentrate water. The measurement of in-creased hardness may be unreliable and possiblyrelated to a decrease in pH in feed and con-centrate water. In the determination of hardnesswith EDTA, there are several competing equi-libria involved and the sample solution needs tobe buffered at pH 10 to increase EDTA/ chelatestability. However, it was determined that uponthe addition of ammonia buffer that the desiredsample solution pH was not obtained. Therefore,the results obtained when using an EDTA titri-metric method under these conditions are notnecessarily reliable.
In an ISCOR system, extracted groundwatermight contain untreated target contaminants. Toevaluate the effect of ISCOR on target contami-nant removal the synthetic groundwater wasprepared to contain untreated target organiccontaminant (i.e., TCE) and oxidant. Test resultsindicated that the permeate for the DK membranetest contained TCE at concentrations of 141 and32 μg/L at 1 hour and 32 hours respectively andthereafter there was no TCE detected in the
C. Liang et al. / Desalination 208 (2007) 238–259 247
permeate (data not shown). In NF, the rejection oforganics is usually for those compounds with amolecular weight above 200–500 [22], whileTCE has a molecular weight of 131.35 g/mole.AG and AE membranes contained low levels ofTCE (e.g., ~5 µg/L) in the permeate water attimes less than 12 hours. TCE was reduced to anon-detection level in all streams (i.e., feed,concentrate and permeate) for all membrane testsafter about 2 days run. The possible fate of TCEcould have been evaporation due to elevatedsystem temperatures, oxidation by persulfateduring the course of test run, or absorption by thematerials used in the test apparatus such as thetank or tubing.
The AE membrane exhibited the best per-formance for the removal of chloride ions, e.g.,initial levels of ~200 mg/L Cl! in feed water werereduced to 3–8 mg/L in the permeate waterduring the course of test run (data not shown).Use of the AG membrane also resulted in a signi-ficant removal of Cl- (i.e., to levels of less than20 mg/L during the course of test run). However,the DK membrane exhibited no Cl! removal.Since RO is a commonly used for desalination ofbrackish water and seawater, it is expected thatthe membranes would retain small organic com-pounds as well as ions (e.g., chloride) better thanthe NF [22].
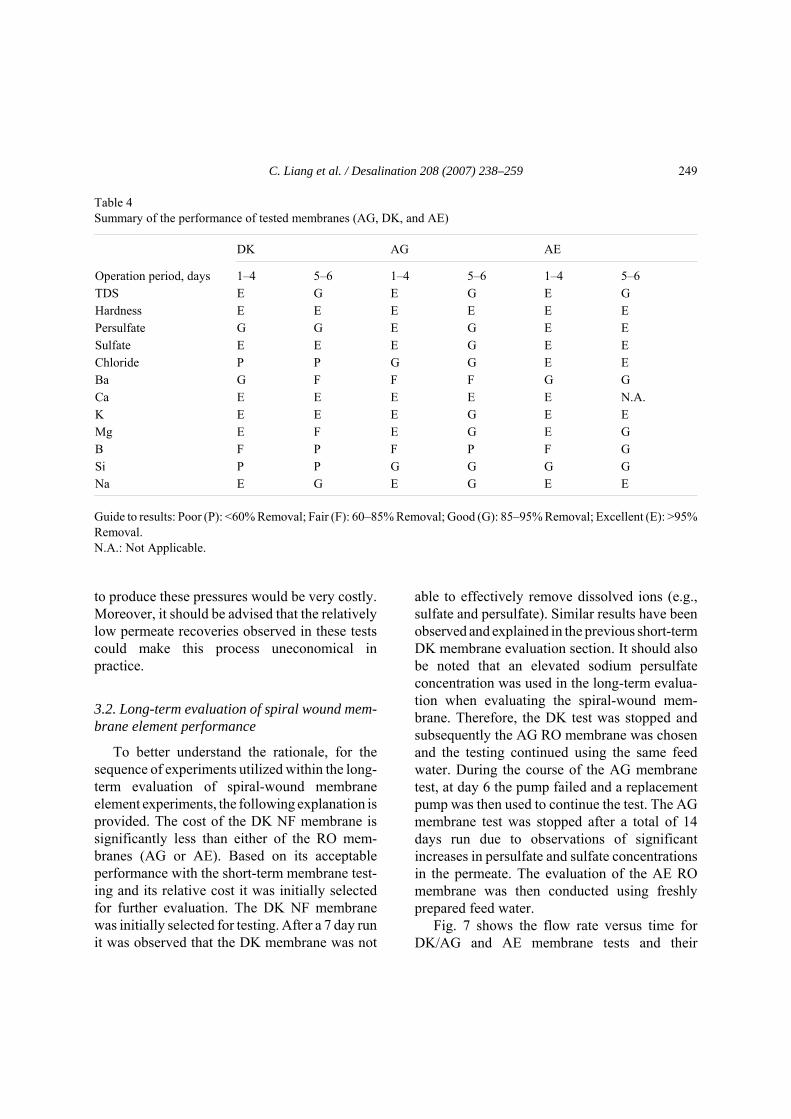
The LSI index is usually applicable forconcentrate streams containing more than10,000 ppm of TDS to determine the need forcalcium carbonate scale control in the operationand the design of reverse osmosis installations[21]. The analysis of LSI results presented inFigure 6 shows that the permeate water for thethree membranes exhibited no tendency to formcalcium carbonate scale. It should be noted thatthe concentrations of all species prepared in thefeed water were already pre-calculated by acomputer program (i.e., Minteqa2/Prodefa2, ageochemical assessment model) for completedissolution of metals and to reduce any possibleprecipitation. However, due to water quality
Fig. 6. LSI as a function of operating time for the feedand concentrate streams.
change during the course of operation, the possi-bility of scaling (i.e., the precipitation of calciumcarbonate or calcium sulfate) existed. Thevariation of LSI data can indicate the presence ofa driving force and the tendency to form calciumcarbonate scaling, which could be damaging toseparation performance [21]. The AG feed andconcentrate presented a greater driving force toform calcium carbonate precipitates during thecourse of the test run than the DK and AEmembranes, which exhibited no tendency for thefeed and concentrate to form precipitate afterrunning 48 hours.

C. Liang et al. / Desalination 208 (2007) 238–259248
Table 3Inorganic removal percentage in the permeate water of each membrane in the short-term evaluation of membraneperformance tests
Membrane Operation period Removal percentage (%)a
Ba Ca K Mg B Si Na
DK 1–4 days 88 95 96 98 61 23 955–6 days 69 95 95 76 33 10 94
AG 1–4 days 74 97 97 98 70 94 975–6 days 69 98 94 94 55 87 94
AE 1–4 days 93 96 98 96 83 89 985–6 days 90 N.A. 97 94 93 92 98
aMean of percentage removal is an averaged value of triplicate sample analysis.N.A. = not applicable.
Metal removal data for the three membranesare summarized in Table 3. All membranes exhi-bited good metals removal performance with theexception of the DK membrane that exhibited apoor Si removal efficiency. The EDXS analysisof the three membranes surfaces conducted beforeand after the test run indicated that all originalmembranes exhibited the presence of a sulfurcomponent (note: sulfur was the only componentdetected) and after separation silica appeared todeposit on all membrane surfaces (i.e., silica-scaling). Sodium was also retained on both AGand AE membranes.
The membrane surfaces were examined beforeand after each run by SEM analysis (e.g., 5000×for original membrane, and 1000× for testedmembrane). The original AE membrane hasnoticeable texture in comparison with DK andAG membranes which appeared to have smoothsurfaces (see Fig. 13). The SEM images of thetested membranes showed that a variety offoulants were evenly distributed over the entiremembrane surface. AG membranes exhibitedmore pits or foulant accumulated on its surfacethan the other two membranes. According toEDXS analysis, Si was the major componentfound on the membrane surface. It has been
reported that a silica level of less than 10 mg/L inthe RO feed water will not result in a scalingproblem and the associated significant reductionof water recovery rate [23]. However, the silicalevel (28 mg/L) in feed water in this study wasgreater than the recommended silica level. Itshould be noted that at lower pH and highersolution temperatures the solubility of silica isgenerally reduced. Hence, the major foulantscould be inorganic and organic combined Si. Inaddition, since no Si existed in the permeate ofAE and AG, it was evident that the foulantsretained on the membrane surfaces were possiblycaused by Si or Si species.
A comparison of the performance of testedmembranes is presented in Table 4. In summarythe AE membrane exhibited superior performancewith respect to the removal of typical targetspecies such as TDS, persulfate, and sulfate ionsover the six-day period of evaluation. The orderof performance for membranes tested in generalwas AE > AG > DK. However, the superior per-formance of AE membrane required a higherpressure (i.e., approximate 57.2 bar) while theDK and AG membranes were operated atapproximately 47.5 and 48.9 bar, respectively. Inall of these cases, the associated energy required
C. Liang et al. / Desalination 208 (2007) 238–259 249
Table 4Summary of the performance of tested membranes (AG, DK, and AE)
DK AG AE
Operation period, days 1–4 5–6 1–4 5–6 1–4 5–6TDS E G E G E GHardness E E E E E EPersulfate G G E G E ESulfate E E E G E EChloride P P G G E EBa G F F F G GCa E E E E E N.A.K E E E G E EMg E F E G E GB F P F P F GSi P P G G G GNa E G E G E E
Guide to results: Poor (P): <60% Removal; Fair (F): 60–85% Removal; Good (G): 85–95% Removal; Excellent (E): >95%Removal.N.A.: Not Applicable.
to produce these pressures would be very costly.Moreover, it should be advised that the relativelylow permeate recoveries observed in these testscould make this process uneconomical inpractice.
3.2. Long-term evaluation of spiral wound mem-brane element performance
To better understand the rationale, for thesequence of experiments utilized within the long-term evaluation of spiral-wound membraneelement experiments, the following explanation isprovided. The cost of the DK NF membrane issignificantly less than either of the RO mem-branes (AG or AE). Based on its acceptableperformance with the short-term membrane test-ing and its relative cost it was initially selectedfor further evaluation. The DK NF membranewas initially selected for testing. After a 7 day runit was observed that the DK membrane was not
able to effectively remove dissolved ions (e.g.,sulfate and persulfate). Similar results have beenobserved and explained in the previous short-termDK membrane evaluation section. It should alsobe noted that an elevated sodium persulfateconcentration was used in the long-term evalua-tion when evaluating the spiral-wound mem-brane. Therefore, the DK test was stopped andsubsequently the AG RO membrane was chosenand the testing continued using the same feedwater. During the course of the AG membranetest, at day 6 the pump failed and a replacementpump was then used to continue the test. The AGmembrane test was stopped after a total of 14days run due to observations of significantincreases in persulfate and sulfate concentrationsin the permeate. The evaluation of the AE ROmembrane was then conducted using freshlyprepared feed water.
Fig. 7 shows the flow rate versus time forDK/AG and AE membrane tests and their
C. Liang et al. / Desalination 208 (2007) 238–259250
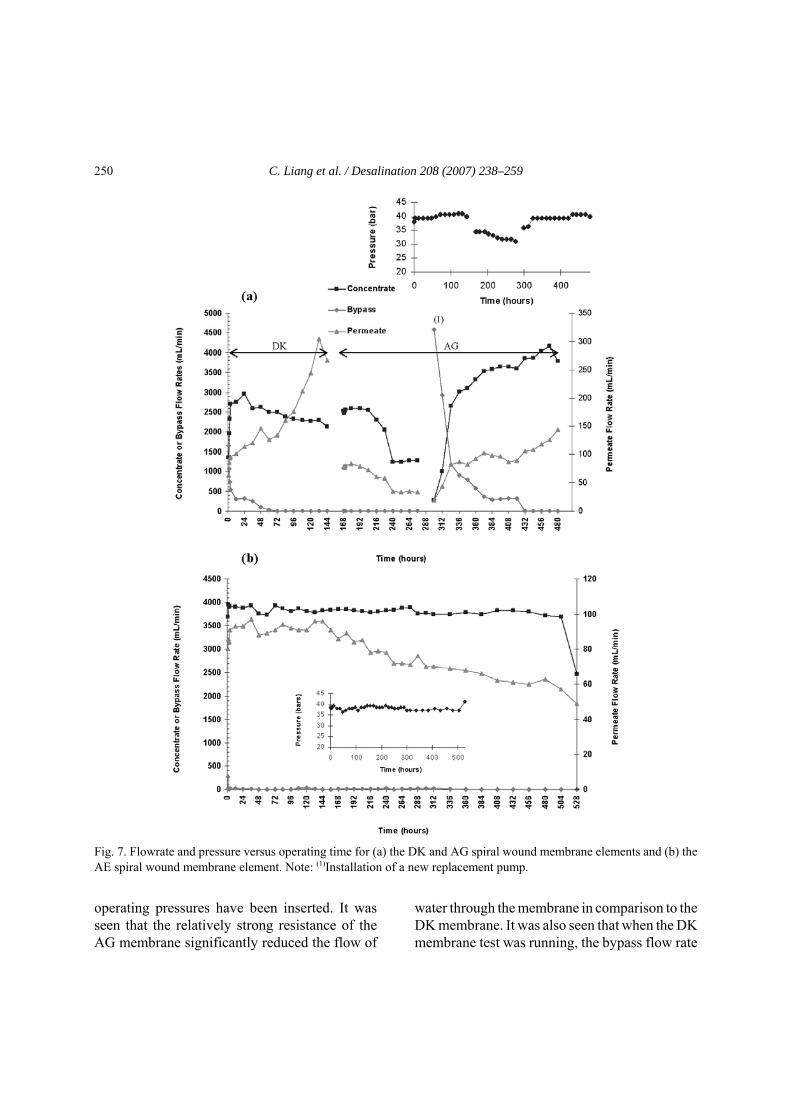
Fig. 7. Flowrate and pressure versus operating time for (a) the DK and AG spiral wound membrane elements and (b) theAE spiral wound membrane element. Note: (1)Installation of a new replacement pump.
operating pressures have been inserted. It wasseen that the relatively strong resistance of theAG membrane significantly reduced the flow of
water through the membrane in comparison to theDK membrane. It was also seen that when the DKmembrane test was running, the bypass flow rate
C. Liang et al. / Desalination 208 (2007) 238–259 251
gradually decreased, while both concentrate andpermeate flow rates gradually increased and thenbypass flow rate finally decreased to zero. It wassuspected that with time the small openings in themembrane active layer (i.e., nano size) of the DKmembrane might have become altered or evendeveloped surface cracks leading to an increase ineffective pore size, resulting in a diminishedability to trap dissolved ions under these ope-rating conditions and therefore resulting inincreased outputs (i.e., the permeate). For the first7 day run of the AG membrane test (before thepump broke), the bypass flow rate was zero andboth concentrate and permeate flow rates grad-ually decreased from their initial rates. A slightdecrease in operating pressure (i.e., ~3.4 bar) wasalso observed. These observations indicated thatthe pump was failing and membrane clogging hadpossibly occurred. Before the replacement pumpwas turned on the bypass flow valve was fullyopened and the back pressure regulator was keptin the same position where it was when using theoriginal pump. Thereafter, only the bypass flowvalve was adjusted to increase the operatingpressure. The bypass flow valve was only slightlyclosed and this resulted in a 34.4 bar operatingpressure. Under these conditions, concentrate andpermeate flow started at very low rates (e.g., 19mL/min) and thereafter they gradually increasedas operation time increased. However, bypassflow rate decreased to zero after a few days run.Operating pressure for the AE membrane waswithin a range of 37–39 bar during the test periodwith exception that on day 22 (528 hours) whenthe pressure suddenly increased to 42 bar andserious leaking was observed near the inletconnector and at this time the AE test wasterminated. All streams in the AE test exhibitedmore stable flow rates than those observed in theDK and AG test. However, the permeate revealeda gradual decrease to about 40% of flow rateduring the test period.
Because both persulfate and sulfate concen-trations were significantly increased in these tests
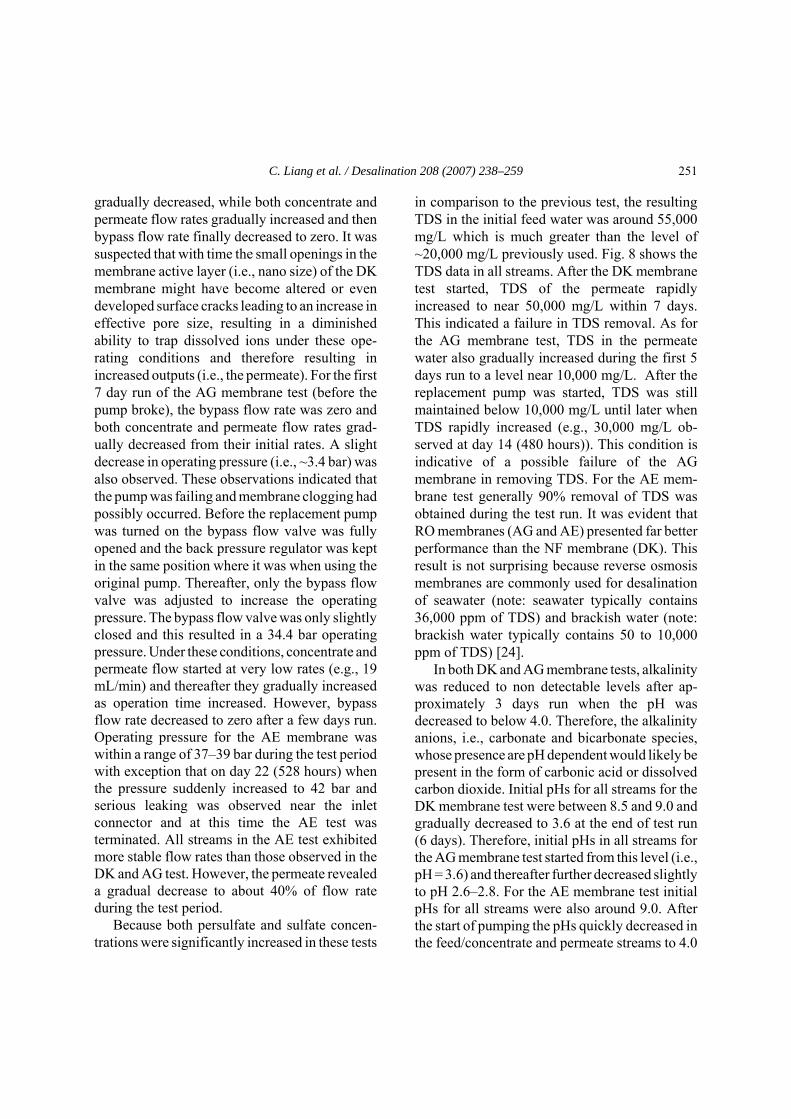
in comparison to the previous test, the resultingTDS in the initial feed water was around 55,000mg/L which is much greater than the level of~20,000 mg/L previously used. Fig. 8 shows theTDS data in all streams. After the DK membranetest started, TDS of the permeate rapidlyincreased to near 50,000 mg/L within 7 days.This indicated a failure in TDS removal. As forthe AG membrane test, TDS in the permeatewater also gradually increased during the first 5days run to a level near 10,000 mg/L. After thereplacement pump was started, TDS was stillmaintained below 10,000 mg/L until later whenTDS rapidly increased (e.g., 30,000 mg/L ob-served at day 14 (480 hours)). This condition isindicative of a possible failure of the AGmembrane in removing TDS. For the AE mem-brane test generally 90% removal of TDS wasobtained during the test run. It was evident thatRO membranes (AG and AE) presented far betterperformance than the NF membrane (DK). Thisresult is not surprising because reverse osmosismembranes are commonly used for desalinationof seawater (note: seawater typically contains36,000 ppm of TDS) and brackish water (note:brackish water typically contains 50 to 10,000ppm of TDS) [24].
In both DK and AG membrane tests, alkalinitywas reduced to non detectable levels after ap-proximately 3 days run when the pH wasdecreased to below 4.0. Therefore, the alkalinityanions, i.e., carbonate and bicarbonate species,whose presence are pH dependent would likely bepresent in the form of carbonic acid or dissolvedcarbon dioxide. Initial pHs for all streams for theDK membrane test were between 8.5 and 9.0 andgradually decreased to 3.6 at the end of test run(6 days). Therefore, initial pHs in all streams forthe AG membrane test started from this level (i.e.,pH = 3.6) and thereafter further decreased slightlyto pH 2.6–2.8. For the AE membrane test initialpHs for all streams were also around 9.0. Afterthe start of pumping the pHs quickly decreased inthe feed/concentrate and permeate streams to 4.0
C. Liang et al. / Desalination 208 (2007) 238–259252
Fig. 8. Variation of TDS concentrations in all streams for (a) the DK and AG spiral wound membrane elements and (b) theAE spiral wound membrane element. Note: (1)Installation of a new replacement pump.
and 5.1 within 3 days and for the remaining testrun (day 4–day 23) dropped further to around 2.4and 3.0, respectively. As a result, alkalinity wasnot detected under those low pH conditions. Thesystem temperature gradually increased for theDK membrane test (e.g., 25 to 38EC) during the
first two days run and thereafter decreased (38 to31EC). This decrease in temperature occurred twodays after the concentrate flow rate starteddecreasing and as permeate flow increased. Theresistance of the DK membrane seemed todecrease which resulted in an increased permeate

C. Liang et al. / Desalination 208 (2007) 238–259 253
Fig. 9. Variation of sodium persulfate concentrations in all streams for (a) the DK and AG spiral wound membraneelements and (b) the AE spiral wound membrane element. Note: (1) Installation of a new replacement pump.
flow rate and an associated slight decrease intemperature. However, the temperature is stillhigher than that observed in previous DK mem-brane test (“previous” data not presented). For theAG spiral membrane test, the temperaturegradually increased with time (e.g., 25 to 36ECfor the permeate). The temperature changes forthe AE membrane are similar to that in the
previous membrane tests with exception thattemperature in the permeate increased from 25ECto 32EC. Hardness removal in the spiral mem-brane tests appeared to be similar to observationsin the previous membrane test.
Fig. 9 shows the persulfate removal results.After one day run, a rapid increase in persulfateconcentration in the permeate water was observed
C. Liang et al. / Desalination 208 (2007) 238–259254
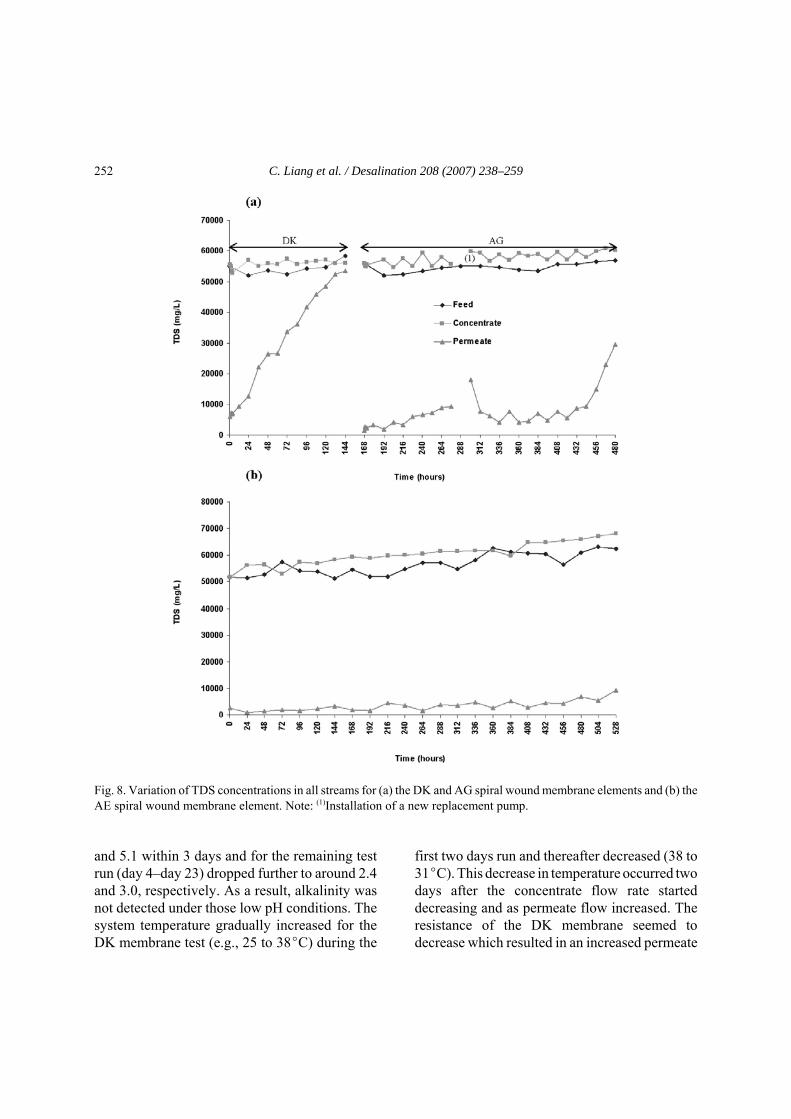
Fig. 10. Variation of sulfate ion concentrations in all streams for (a) the DK and AG spiral wound membrane elements and(b) the AE spiral wound membrane element. Note: (1) Installation of a new replacement pump.
in the DK membrane test. The AG membrane testexhibited better performance than the DK mem-brane. For example, sodium persulfate concen-tration was less than 1,000 mg/L in the permeatestream except for the first day when the replace-ment pump was started and the last two days ofthe AG membrane test. The AE membrane pre-sented the best performance in removing per-
sulfate anion (e.g., less than 300 mg/L sodiumpersulfate observed in the permeate for 15 dayswith a gradual increase to near 1,100 mg/L on thelast day, i.e., day 23). Fig. 10 shows the removalof sulfate results. The DK membrane was not ableto remove sulfate ion and therefore the sulfateconcentration level observed in the permeatewater was close to the level found in the feed
C. Liang et al. / Desalination 208 (2007) 238–259 255
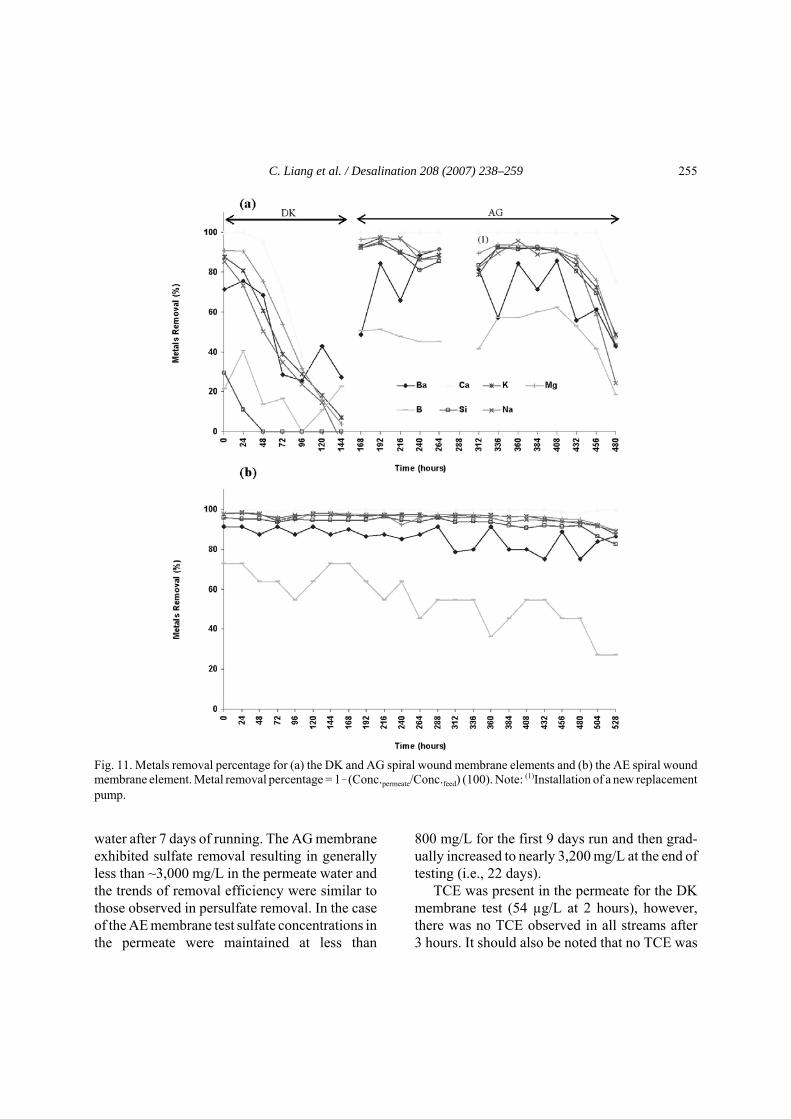
Fig. 11. Metals removal percentage for (a) the DK and AG spiral wound membrane elements and (b) the AE spiral woundmembrane element. Metal removal percentage = 1!(Conc.permeate/Conc.feed) (100). Note: (1)Installation of a new replacementpump.
water after 7 days of running. The AG membraneexhibited sulfate removal resulting in generallyless than ~3,000 mg/L in the permeate water andthe trends of removal efficiency were similar tothose observed in persulfate removal. In the caseof the AE membrane test sulfate concentrations inthe permeate were maintained at less than
800 mg/L for the first 9 days run and then grad-ually increased to nearly 3,200 mg/L at the end oftesting (i.e., 22 days).
TCE was present in the permeate for the DKmembrane test (54 µg/L at 2 hours), however,there was no TCE observed in all streams after3 hours. It should also be noted that no TCE was
C. Liang et al. / Desalination 208 (2007) 238–259256
present in all steams following the AG tests. Asfor the AE test, TCE was initially detected in thepermeate (e.g., 17 μg/L at 1 hour), however noTCE was detected in all streams after a few hoursof running (e.g., 2 hours). Both RO membranestested (AG and AE membranes) effectivelyremoved chloride ion ,e.g., in general <50 mg/Land 0 mg/L Cl! was observed in the permeate forthe AG and AE, tests respectively. However, theNF (DK membrane) was incapable in removingchloride (~0% removal). The LSI analysisshowed that all streams exhibited no tendency toform calcium carbonate scale, with the onlyexception being the feed and concentrate streamswithin the first few hours of the DK membranetest run (data not shown).
Metal removals are shown in Fig. 11. Theresults show that the DK membrane attainedsignificant removals of Ba, Ca, K, and Mg duringinitial 1 or 2 days run, then these metal concen-trations in the permeate stream steadily increasedin a manner similar to that observed for otheranions (e.g., SO4
2!), as was previously discussed.The DK membrane appeared to be incapable ofremoving B and Si. The AG membrane exhibitedgood performance in removing metals except forB which in general was less than 60% removal.However, metal removal trends followed thesame pattern as the removal of other anions (e.g.,SO4
2!), where high concentrations of ions wereobserved on the first day after the replacementpump was started and on the last few days of theAG membrane test. The AE membrane exhibitedmore than 90% metal removal for all metalsexcept for Ba and B on the last two days of thetest. The element Boron always presented thelowest removal efficiency in all of the membranetests. Because the pHs were usually low in allsteams for all membrane tests, the major boronspecies would be boric acid in molecular form.Note that pKa for boric acid is 9.14. Therefore,due to the absence of ionic charges, the non-dissociated boric acid is a molecule that is smallerthan the dissociated form. This would result in
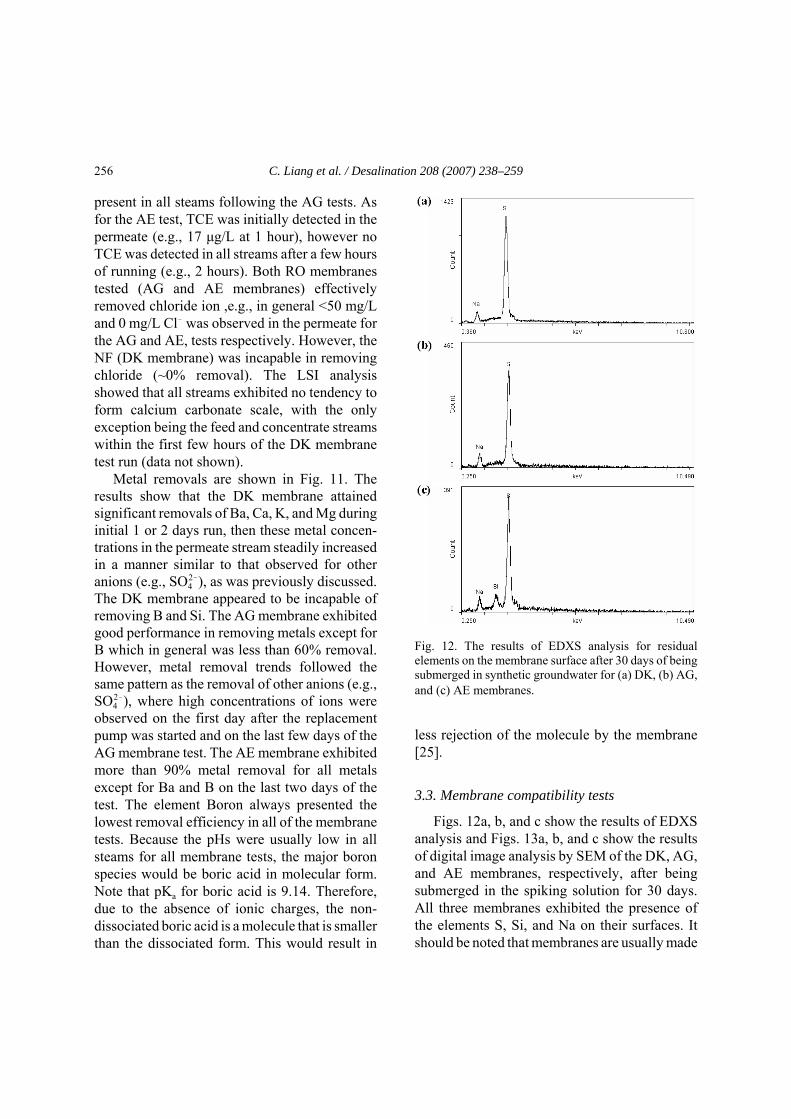
Fig. 12. The results of EDXS analysis for residualelements on the membrane surface after 30 days of beingsubmerged in synthetic groundwater for (a) DK, (b) AG,and (c) AE membranes.
less rejection of the molecule by the membrane[25].
3.3. Membrane compatibility tests
Figs. 12a, b, and c show the results of EDXSanalysis and Figs. 13a, b, and c show the resultsof digital image analysis by SEM of the DK, AG,and AE membranes, respectively, after beingsubmerged in the spiking solution for 30 days.All three membranes exhibited the presence ofthe elements S, Si, and Na on their surfaces. Itshould be noted that membranes are usually made

C. Liang et al. / Desalination 208 (2007) 238–259 257
Fig. 13. SEM images of the (a) DK, (b) AG, and (c) AE membrane surfaces after 30 days of being submerged in syntheticgroundwater. (1), (2), and (3) annotation represent original membrane (× 5000), treated membrane (×1000) and (×5000),respectively.
from organic polymers (e.g., polysulfone) and theelement S was originally present on all three newmembranes as determined by EDXS analysis(data not shown). The SEM images revealed thatboth DK and AG membranes exhibited degra-dation at high levels of sodium persulfate (i.e.,
80,000 mg/L). For example, the DK and AGmembranes showed cracks on the membranes(see Figs. 13(a3) and 13(b3)); moreover, the AGmembrane appears to have an uneven density onthe membrane surface (see Fig. 13(b2)). Itappears that the original textures of DK and AG
C. Liang et al. / Desalination 208 (2007) 238–259258
have been altered. In the DK membrane test itwas evident that the water quality drasticallydecreased with an increase in operation time. It isspeculated that this behavior could be as a resultof membrane sensitivity to persulfate and sulfatefree radicals (e.g., sodium persulfate concen-tration of 80,000 mg/L) resulting in membranecracking. Therefore it is speculated the mem-branes had suffered oxidative degradation. Astudy by Platt et al. [26] who tested stability ofseveral NF membranes including the DK mem-brane under acidic conditions observed that DKmembrane was unstable after 1 month immersedin 20% sulfuric acid. They speculated that acid-catalyzed hydrolysis was the cause of membranedegradation. They also mentioned that aggressivechemicals can irreversibly degrade the membraneby processes such as oxidation. Platt et al. [26]said that one of the key indicators of chemicaldegradation of membranes is surface cracking,which is similar to our observations for the DKand AG membrane surfaces. As for the AEmembrane, its surface texture appeared to beintact when compared to the original. Therefore,it is believed that the AE has a relatively strongresistance to persulfate or associated sulfate freeradical attack. Therefore, the AE membranealways resulted in better separation performancethan other membranes tested (i.e., DK and AG).
4. ConclusionThe AE membrane proved to be the best
within the group and it exhibited superior per-formance with respect to the removal of the targetspecies: persulfate; sulfate ions; and TDS over theevaluation period. Additionally the AE membraneachieved more than 90% removals of metals suchas Ba, Ca, K and Mg for the majority of the testperiod. For the membranes evaluated the generalorder of performance was AE > AG > DK.However, the AE membrane requires the highestoperating pressure resulting in the highest energycosts.
SEM analysis of membrane surfaces wasconducted in an attempt to explain membraneperformance. The SEM images clearly showedthat both the DK and AG membranes experienceddegradation and cracking after exposure to80,000 mg/L sodium persulfate solutions for30 days while the AE membrane appearedunchanged. This finding is in agreement with themembrane performance test results, again con-firming that the AE membrane was the best ofthis group.
Acknowledgement
The research was supported by the USDepartment of Energy through Tetra Tech, Inc.The authors are grateful to graduate studentYamini Priya Palvadi from the University ofMassachusetts Lowell for her help on thegroundwater analysis and also to Dr. Ernest T.Dobi for his assistance on the SEM analysis.
References
[1] K.-C. Huang, R.A. Couttenye and G.E. Hoag,Chemosphere, 49 (2002) 413–420.
[2] C. Liang, C.J. Bruell, M.C. Marley and K.L. Sperry,Soil Sediment Contam., 12 (2003) 207–228.
[3] C. Liang, C.J. Bruell, M.C. Marley and K.L. Sperry,Chemosphere, 55 (2004) 1213–1223.
[4] C. Liang, C.J. Bruell, M.C. Marley and K.L. Sperry,Chemosphere, 55 (2004) 1225–1233.
[5] D.A. House, Chem. Rev., 62 (1962) 185–203.[6] USEPA, Current Drinking Water Standards, National
primary and secondary drinking water regulations,2000, http://www.epa.gov.
[7] T.J.K. Visser, S.J. Modise, H.M. Krieg and K.Keizer, Desalination, 140 (2001) 79–86.
[8] ITRC (Interstate Technology Regulatory Coope-ration), Technical and Regulatory Guidance for insitu Chemical Oxidation of Contaminated Soil andGroundwater, 2nd ed., 2004.
[9] M. Bodzek, S. Koter and K. Wesolowska, Desali-nation, 145 (2002) 321–327.

C. Liang et al. / Desalination 208 (2007) 238–259 259
[10] A.F. Viero, A.C.R. Mazzarollo, K. Wada and I.C.Tessaro, Desalination, 149 (2002) 145–149.
[11] A. Gorenflo, D. Velázquez-Padrón and F.H.Frimmel, Desalination, 151 (2002) 253–265.
[12] Z. Teng, J.Y. Huang, K. Fujita and S. Takizawa,Desalination, 139 (2001) 411–418.
[13] A. Lastra, D. Gómez, J. Romero, J.L. Francisco,S. Luque and J.R. Álvarez, J. Membr. Sci., 242(2004) 97–105.
[14] E.-M. Gwon, M.-J. Yu, H.-K. Oh and Y.-H. Ylee,Water Res., 37 (2003) 2989–2997.
[15] I. Bremere, M. Kennedy, P. Michel, R.V. Emmerik,G.-J. Witkamp and J. Schippers, Desalination, 124(1999) 51–62.
[16] A. Barr, Filtr. Separ., 38 (2001) 18–20.[17] R.L. Droste, Theory and Practice of Water and
Wastewater Treatment, Wiley, New York, 1997.[18] W.L. Snoeyink, Water Chemistry, Wiley, New York,
1980.
[19] A. Sagiv and R. Semiat, Desalination, 179 (2005)1–9.
[20] APHA, AWWA, WEF, Standard Methods for theExamination of Water and Wastewater, 18th ed.,American Public Health Association, Washington,DC, 1982.
[21] ASTM International. Annual Book of ASTMStandards, West Conshohocken, PA. 2003, pp. 784–807.
[22] B.V.D. Bruggen, L. Lejon and C. Vandecasteele,Env. Sci. Technol., 37 (2003) 3733–3738.
[23] D.E. Potts, R.C. Ahlert and S.S. Wang, Desalination,36 (1981) 235–264.
[24] DOW Chemical Company, Reverse Osmosis forDesalination of Seawater, 2004, www.dow.com.
[25] J. Redondo, M. Busch and J.-P.D. Witte, Desali-nation, 156 (2003) 229–238.
[26] S. Platt, M. Nyström, A. Bottino and G. Capannelli,J. Membr. Sci., 239 (2004) 91–103.
Related Documents
![Preparation of hydrophilic nanofiltration membranes for …...ing nanofiltration (NF) and reverse osmosis (RO) membranes [6, 7]. Membrane fouling reduces membrane performance, increases](https://static.cupdf.com/doc/110x72/611b4ef3f07ac85c23709bed/preparation-of-hydrophilic-nanofiltration-membranes-for-ing-nanofiltration-nf.jpg)