University of South Florida Scholar Commons Graduate eses and Dissertations Graduate School January 2013 Evaluation of Pulmonary Risks Associated with Selected Occupations Stephen Casey Harbison University of South Florida, [email protected] Follow this and additional works at: hp://scholarcommons.usf.edu/etd Part of the Occupational Health and Industrial Hygiene Commons is Dissertation is brought to you for free and open access by the Graduate School at Scholar Commons. It has been accepted for inclusion in Graduate eses and Dissertations by an authorized administrator of Scholar Commons. For more information, please contact [email protected]. Scholar Commons Citation Harbison, Stephen Casey, "Evaluation of Pulmonary Risks Associated with Selected Occupations" (2013). Graduate eses and Dissertations. hp://scholarcommons.usf.edu/etd/4687

Welcome message from author
This document is posted to help you gain knowledge. Please leave a comment to let me know what you think about it! Share it to your friends and learn new things together.
Transcript

University of South FloridaScholar Commons
Graduate Theses and Dissertations Graduate School
January 2013
Evaluation of Pulmonary Risks Associated withSelected OccupationsStephen Casey HarbisonUniversity of South Florida, [email protected]
Follow this and additional works at: http://scholarcommons.usf.edu/etd
Part of the Occupational Health and Industrial Hygiene Commons
This Dissertation is brought to you for free and open access by the Graduate School at Scholar Commons. It has been accepted for inclusion inGraduate Theses and Dissertations by an authorized administrator of Scholar Commons. For more information, please [email protected].
Scholar Commons CitationHarbison, Stephen Casey, "Evaluation of Pulmonary Risks Associated with Selected Occupations" (2013). Graduate Theses andDissertations.http://scholarcommons.usf.edu/etd/4687

Evaluation of Pulmonary Risks Associated with Selected Occupations
by
Stephen Casey Harbison
A dissertation submitted in partial fulfillment of the requirements for the degree of
Doctor of Philosophy Department of Environmental and Occupational Health
College of Public Health University of South Florida
Major Professor: Jay Wolfson, Dr.P.H., J.D. Jim McCluskey, M.D., M.P.H., Ph.D.
Thomas Truncale, D.O., M.P.H. Steve Morris, M.D., R.N.
Date of Approval: May 23, 2013
Keywords: occupational health surveillance, pulmonary function, spirometry
Copyright © 2013, Stephen Casey Harbison

Dedication
This is dedicated to my father who always encouraged me to do my best, my mother who
always believed in me, and my wife who loves me unconditionally.

Acknowledgments
I would like to acknowledge my Doctoral Committee, Dr. Jay Wolfson, Dr. Jim
McCluskey, Dr. Steve Morris, and Dr. Tom Truncale for the effort given and the
guidance provided to me during this journey.
I would like to acknowledge Dr. Giffe Johnson for his assistance and guidance in
conducting this research. Your willingness to provide feedback and always answer the
phone when I had questions made this dissertation possible.
Additional acknowledgement goes to John and Mary Jim Ramsey who always knew this
day would come.

i""
Table of Contents
List of Tables iii List of Figures iv List of Acronyms and Abbreviations vi Abstract viii Chapter 1 Introduction 1 Chapter 2 Spirometry and Lung Function 13 2.1 History of Spirometry 14 2.2 Spirometry and the Respiratory System 17 2.3 Spirometry Testing and Results 24 Chapter 3 Health Surveillance 27 3.1 Disease Surveillance 27 3.1.1 National Health and Nutrition Examination Survey 27 3.1.2 Occupational Respiratory Disease Surveillance 36 3.1.3 Pulmonary Function Surveillance Data 39 Chapter 4 Literature Review 43 4.1 Boat Manufacturing 44 4.2 Utilities 50 4.3 First Responders 51 Chapter 5 Methods 55 5.1 Study Population 55 5.2 Pulmonary Function 56 5.3 Statistical Analysis 57 Chapter 6 Pulmonary Function Testing in Boat Manufacturing Workers 59 6.1 Data Source 59 6.2 Results 59 6.2.1 Univariate Analysis 59 6.2.2 Multivariate Analysis 70 6.3 Discussion 72

ii""
Chapter 7 Pulmonary Function Testing in Utility Workers 75 7.1 Data Source 75 7.2 Results 75 7.2.1 Univariate Analysis 75 7.2.2 Multivariate Analysis 84 7.3 Discussion 86 Chapter 8 Pulmonary Function Testing in First Responders 89 8.1 Data Source 89 8.2 Results 89 8.2.1 Univariate Analysis 89 8.2.2 Multivariate Analysis 100 8.3 Discussion 102 Chapter 9 Conclusion 105 References 110 Appendix I: IRB Approval Letter 118

iii""
List of Tables
Table 1: History of Spirometry 16 Table 2: Lung Volumes 20 Table 3: Overview of Occupational Disease 26 Table 4: American Thoracic Society Acceptability and Reproducibility Criteria 56 Table 5: Summary of Study Population and NHANES III Control Population 60 Table 6: Predictors of FEV1 from Linear Regression Analysis 71 Table 7: Predictors of FVC from Linear Regression Analysis 71 Table 8: Logistic Regression Analysis of FEV1/FVC to Examine the Effect of
Predictors on Producing an Abnormal Ratio (<0.80 FEV1/FCV) 71 Table 9: Summary of Study Population and NHANES III Control Population 76 Table 10: Predictors of FEV1 from Linear Regression Analysis 85 Table 11: Predictors of FVC from Linear Regression Analysis 85 Table 12: Logistic Regression Analysis of FEV1/FVC to Examine the Effect of
Predictors on Producing an Abnormal Ratio (<0.80 FEV1/FCV) 85 Table 13: Summary of Study Population and NHANES III Control Population 90 Table 14: Predictors of FEV1 from Linear Regression Analysis 101 Table 15: Predictors of FVC from Linear Regression Analysis 101 Table 16: Logistic Regression Analysis of FEV1/FVC to Examine the Effect of
Predictors on Producing an Abnormal Ratio (<0.80 FEV1/FCV) 102

iv""
List of Figures
Figure 1: Spirogram with Volume and Measurements 10 Figure 2: Diagram of the Respiratory System 18 Figure 3: Particle Size Distribution Graph in Microns 23 Figure 4: Normal Volume Time Curve and Flow Volume Curve 25 Figure 5: Black Lung Poster 38 Figure 6: Pulmonary Function Mean for the Total Population 61 Figure 7: Pulmonary Function Mean for Males 62 Figure 8: Pulmonary Function Mean for Females 63 Figure 9: Pulmonary Function Mean for Smoking History (YES) 64 Figure 10: Pulmonary Function Mean for Smoking History (NO) 65 Figure 11: Pulmonary Function Mean for Height at or Above Median (67 inches) 66 Figure 12: Pulmonary Function Mean for Height Below Median (67 inches) 67 Figure 13: Pulmonary Function Mean for Age at or Above Median (29 years) 68 Figure 14: Pulmonary Function Mean for Age Below Median (29 years) 69 Figure 15: Pulmonary Function Mean for the Total Population 77 Figure 16: Pulmonary Function Mean for Smoking History (YES) 78 Figure 17: Pulmonary Function Mean for Smoking History (NO) 79 Figure 18: Pulmonary Function Mean for Height at or Above Median (70 inches) 80 Figure 19: Pulmonary Function Mean for Height Below Median (70 inches) 81

v""
Figure 20: Pulmonary Function Mean for Age at or Above Median (46 years) 82 Figure 21: Pulmonary Function Mean for Age Below Median (46 years) 84 Figure 22: Pulmonary Function Mean for the Total Population 91 Figure 23: Pulmonary Function Mean for Males 92 Figure 24: Pulmonary Function Mean for Females 93 Figure 25: Pulmonary Function Mean for Smoking History (YES) 94 Figure 26: Pulmonary Function Mean for Smoking History (NO) 95 Figure 27: Pulmonary Function Mean for Height at or Above Median (70 inches) 96 Figure 28: Pulmonary Function Mean for Height Below Median (70 inches) 97 Figure 29: Pulmonary Function Mean for Age at or Above Median (38 years) 98 Figure 30: Pulmonary Function Mean for Age Below Median (38 years) 99

vi""
List of Acronyms
American College of Chest Physicians ACCP
Bureau of Environmental Public Health Medicine EPHM
Centers for Disease Control and Prevention CDC
Center for the Health Assessment of Mothers and Children of Salinas CHAMACOS
Chronic Obstructive Pulmonary Disease COPD
Clinical Antipsychotic Trials of Intervention Effectiveness CATIE
Coal Workers’ Pneumoconiosis CWP
Community Programs for Clinical Research on AIDS CPCRA
Council of State and Territorial Epidemiologist CSTE
Enhanced Coal Workers’ Health Surveillance Program ECWHSP
Epidemiology of Diabetes Interventions and Complications EDIC
Expiratory Reserve Volume ERV
Forced Expiratory Flow at 25%-75% Vital Capacity FEF25-75
Forced Expiratory Volume at 1 Second FEV1
Forced Vital Capacity FVC
Heart and Estrogen/Progestin Replacement Study HERS
Inspiratory Capacity IC
Inspiratory Reserve Volume IRV
Institutional Review Board IRB
Maximum Expiratory Flow MEF
Maximum Voluntary Ventilation MVV

vii""
National Health and Nutrition Examination Survey NHANES
National Institute for Occupational Safety and Health NIOSH
Nitrogen Oxide NO
Nitrogen Dioxide NO2
Occupational Safety and Health Administration OSHA
Peak Expiratory Flow Rate PEFR
Polychlorinated Biphenyl PCB
Progressive Massive Fibrosis PMF
Pulmonary Arterial Hypertension PAH
Registry to Evaluate Early and Long-term PAH Disease Management REVEAL
Slow Vital Capacity SVC
Sulfur Dioxide SO2
United States Environmental Protection Agency USEPA
Vital Capacity VC

viii""
Abstract
Occupational health surveillance programs are designed to evaluate and reduce
injury, illness, and deaths related to workplace hazards. In the state of Florida, there are
numerous industries where workers are potentially exposed to airborne hazards from
gases, vapors and dusts. Airborne occupational exposures to irritants, vesicants, and
fibrogens have the potential to cause pulmonary function impairment if exposures are not
properly controlled for high-level acute exposure as well as chronic exposure. For
occupations that demand workers be exposed to substances known to be associated with
pulmonary function impairment, respirators may be a principal method for exposure
control. OSHA requires pulmonary function testing for specific substances and it is a
best practice that is utilized in a majority of occupational settings and is typically
included in an organizations respiratory protection program. A literature review
identified that boat manufacturing, utilities, and first responders in the State of Florida
have the potential for increased pulmonary impairment amongst workers. This research
demonstrated the feasibility of using pulmonary function data collected for the purposes
of compliance and/or best practices for workers who use respiratory protection because
they are potentially exposed to pulmonary toxicants in the workplace. This research did
not identify any pulmonary function deficits in the target occupational populations and it
demonstrated that in most cases, the study populations had modestly superior pulmonary
function compared to a baseline population.

1""
Chapter 1
Introduction
Occupational health surveillance programs are designed to evaluate and reduce
injury, illness, and deaths related to workplace hazards. Since potential adverse health
effects may not present for many years, it is imperative that surveillance tools be
developed and utilized to identify potential hazards in the workplace before they cause
substantial and potentially irreversible health outcomes. Proven methods and procedures
used to capture critical occupational health data is the basis for an effective surveillance
program. Alli (2008) states:
Workers’ health surveillance entails procedures for the assessment of
workers’ health by means of detection and identification of any abnormalities.
Such procedures may include biological monitoring, medical examinations,
questionnaires, radiological examinations and reviews of workers’ health records,
among others.
The National Institute for Occupational Safety and Health (NIOSH) has
recognized the importance for in-depth investigations and prevention aimed at particular
diseases, injuries, hazards, and specific worker populations. Occupational health
surveillance has been a priority at NIOSH since its inception by the Occupational Safety
and Health Act in 1970. Since that time, NIOSH has been able to identify areas that need

2""
additional research and prevention efforts for both existing and new problems alike.
NIOSH (2012a) has established that data and information derived from surveillance can
be used to:
• Guide immediate action for cases of public health importance
• Measure the burden of an injury or disease including changes in related
factors, the identification of populations at high risk, and the identification of
new or emerging health concerns
• Guide the planning, implementation, and evaluation of programs to prevent
and control injuries, disease, or adverse exposures
• Evaluate public policy
• Detect changes in health practices and the effects of the changes
• Prioritize the allocation of health resources
• Describe the clinical course of disease
• Provide a basis for epidemiologic research
While NIOSH has made significant progress in helping reduce work-related
diseases and injuries, occupational health surveillance in the United States is not
consistent and data gaps exist. Baker et al. (1988) recognized such deficiencies and
stated:
Unfortunately, in the minds of many occupational health professionals,
surveillance systems are viewed as passive and ponderous systems designed to
collect information of uncertain utility. To achieve a broader involvement of
occupational health professionals in surveillance of occupational disorders,

3""
systems must be developed that are intrinsically active and allow for rapid
response to emerging trends of illness and injury.
This recognition by NIOSH and other public health professionals has led to the
development and continued funding of state-based occupational safety and health
surveillance programs. These state-based surveillance programs use existing reporting
systems to collect data on occupational safety and health hazards and effects; identify
new sources of data; conduct surveillance; interpret findings; and develop and/or
recommend interventions (NIOSH, 2012b). Currently, NIOSH is providing financial and
technical assistance for twenty-three state-based surveillance programs. These states
include California, Colorado, Connecticut, Florida, Georgia, Illinois, Iowa, Kentucky,
Louisiana, Maryland, Massachusetts, Michigan, Minnesota, Nebraska, New Hampshire,
New Jersey, New Mexico, New York State, North Carolina, Oregon, Texas, Washington,
and Wisconsin.
Part of the strategic plan for NIOSH includes the development and expansion of
mechanisms for occupational health surveillance on both the state and federal levels
(NIOSH, 2012c). It is clear that there is a continued need to develop and utilize
surveillance methodologies that are capable of efficiently evaluating occupational
populations for health status, identifying changes in health status over time, and
comparing the health status of occupational populations to baseline populations. The use
of existing health data to quickly evaluate the health status of a population provides
efficiency in both cost and time by limiting the need to perform prospective data
collection on a population of interest.

4""
Florida is one of the twenty-three states receiving financial and technical
assistance from NIOSH for a state-based occupational safety and health surveillance
program. The ultimate goal of the program is to continually improve the overall health of
the workforce in the state. A preliminary description of the NIOSH state-based
surveillance program for Florida is as follows (NIOSH, 2012b):
The Florida Department of Health, Division of Environmental Health,
Bureau of Environmental Public Health Medicine (EPHM) will develop and
implement a Fundamental State-Based Occupational Safety and Health
Surveillance Program by collecting and analyzing various data sets including data
from the Bureau of Labor Statistics and Surveys, Florida hospital discharge,
ambulatory and emergency departments, vital statistics death file, Florida Cancer
Registry, census information and other data sources in order to produce and
disseminate information on the Centers for Disease Control and Prevention
(CDC)/Council of State and Territorial Epidemiologists (CSTE) occupational
health indicators relevant to Florida. Additionally, EPHM will work
collaboratively with numerous partners including universities, local, state, and
federal agencies to identify new data sources to enhance ongoing surveillance
activities. EPHM plans to use these data sources to gain a better understanding of
the health impact of occupational exposures and injuries in Florida. EPHM will
compare Florida's experience with statistics from other states in order to develop a
better overall view of Florida's experience compared to the nation. Florida also
plans to convene an Occupational Health Surveillance Program Advisory Board.
This group will have representatives from clinical medicine, public health,

5""
academia, and industry in Florida and will serve to guide the program in its efforts
and help to prioritize surveillance efforts, disseminate findings and participate in
research and prevention activities. EPHM plans to form a collaborative
partnership with the University of South Florida's OSHA Training Institute
Education Center to identify occupations and industries that would benefit from
more in-depth surveys and investigations designed to identify interventions that
reduce workplace morbidity.
In the state of Florida, there are numerous industries where workers are
potentially exposed to airborne hazards from gases, vapors, and dusts. Airborne
occupational exposures to irritants, vesicants, and fibrogens have the potential to cause
pulmonary function impairment if exposures are not properly controlled for high-level
acute exposure as well as extended periods of time.
For occupations that demand workers be exposed to substances known to be
associated with pulmonary function impairment, respirators may be a principal method
for exposure control. Therefore, governmental standards have been established to ensure
the protection of workers when the elimination of the airborne hazard cannot be removed
and engineering controls are not possible. Occupational Safety and Health
Administration (OSHA) Respirator Protection Standard 1910.134 (OSHA, 2012a) states:
In the control of those occupational diseases caused by breathing air
contaminated with harmful dusts, fogs, fumes, mists, gases, smokes, sprays, or
vapors, the primary objective shall be to prevent atmospheric contamination. This
shall be accomplished as far as feasible by accepted engineering control measures
6""
(for example, enclosure or confinement of the operation, general and local
ventilation, and substitution of less toxic materials). When effective engineering
controls are not feasible, or while they are being instituted, appropriate respirators
shall be used pursuant to this section.
When respirators are required to be used in the workplace, it is universally
recognized that a respiratory protection program be established. The safe use of a
respirator requires at a minimum that the following program elements be addressed
(Colton & Nelson, 2003):
• Program administration
• Written work site specific operating procedures
• Exposure assessment
• Medical evaluation of respirator wearers
• Proper selection of respiratory protective equipment
• Training
• Respirator fitting
• Cleaning, inspection, maintenance, and storage
• Program evaluation
As stated above, a medical evaluation of respirator wearers is a required element
of a respiratory protection program. To comply with this requirement, employees may be
required to undergo pulmonary function testing to determine if they are able to safely
wear a respirator. It is important to note that the respiratory protection standard only
requires a physician to establish the necessary health and physical conditions for a worker

7""
to be able to perform their assigned job functions while wearing a respirator. It does not
make it mandatory to administer a particular evaluation procedure, such as a pulmonary
function test unless it is required in the provisions of specific OSHA standards.
OSHA substance specific standards such as Asbestos (1910.1001), Cadmium
(1910.1027), Coke Oven Emissions (1910.1029), Cotton Dust (1910.1043), Benzene
(1910.1028), and Formaldehyde (1910.1048) require pulmonary function tests as part of
the medical evaluation and are to include forced vital capacity (FVC) and forced
expiratory volume at one second (FEV1). Some of these substance specific standards
have detailed sections that present pulmonary function testing requirements while other
specific standards include pulmonary function testing as part of the medical surveillance
requirements. For example, the pulmonary function standard for Cotton Dust
(1910.1043) includes sections regarding the apparatus, the technique for measurement of
forced vital capacity maneuver, the interpretation of the spirogram, and the qualifications
of personnel administering the test. The Interpretation of Spirogram section presented in
Cotton Dust (1910.1043) Appendix D (OSHA, 2012b) is as follows:
• The first step in evaluating a spirogram should be to determine whether or not
the patient has performed the test properly or as described in II above. From
the three satisfactory tracings, the FVC and FEV1 shall be measured and
recorded. The largest observed FVC and largest observed FEV1 shall be used
in the analysis regardless of the curve(s) on which they occur.
• The following guidelines are recommended by NIOSH for the evaluation and
management of workers exposed to cotton dust. It is important to note that

8""
employees who show reductions in FEV1/FVC ratio below .75 or drops in
Monday FEV1 of five percent or greater on their initial screening exam,
should be re-evaluated within a month of the first exam. Those who show
consistent decrease in lung function, as shown on the following table, should
be managed as recommended.
Figure 1 presents an example of a spirogram with volumes and measurements including
FVC and FEV1.
For other OSHA substance specific standards such as Benzene (1910.1028)
(OSHA, 2012c), pulmonary function testing is covered under the medical surveillance
section:
• 1910.1028(i)(1)(iii)
o The employer shall assure that persons other than licensed physicians
who administer the pulmonary function testing required by this section
shall complete a training course in spirometry sponsored by an
appropriate governmental, academic or professional institution.
• 1910.1028(i)(2)(i)(E)
o For all workers required to wear respirators for at least thirty days a
year, the physical examination shall pay special attention to the
cardiopulmonary system and shall include a pulmonary function test.
• 1910.1028(i)(3)(iii)
o For persons required to use respirators for at least thirty days a year, a
pulmonary function test shall be performed every three years. A

9""
specific evaluation of the cardiopulmonary system shall be made at the
time of the pulmonary function test.
Individual medical surveillance required by the respiratory protection program
and substance specific standards provide an opportunity to collect group health
information that can be integrated into an occupational health surveillance database.
Pastides & Mundt (2003) state the importance of such information:
Surveillance, however, cannot be accomplished at the individual level, but
becomes possible only when data from groups of employees are pooled and
evaluated. This group perspective is the fundamental attribute that launched
epidemiology into the forefront of communicable disease research, and it
continues to be a cornerstone of the profession today. Typically, the rate or
prevalence of disease, or prevalence of some indicator of exposure or risk, are
compared among groups of employees or with some other referent group (such as
the general population).
The development of an occupational health surveillance database and the
subsequent use of such health data (pulmonary function tests) provide an opportunity to
quickly evaluate the health status of a population in an efficient manner by limiting the
need to perform prospective data collection on a population of interest.

10##
Figure 1: Spirogram with Volume and Measurements. FEF25-75, forced expiratory flow at 25%-75% vital capacity; FEV1, forced expiratory volume in 1 second; FVC, forced vital capacity.(Adapted from Siberry GK, Iannone R (Eds.) The Johns Hopkins Hospital Harriet Lane Handbook, 15th ed. St. Louis: Mosby, 1999.)

11""
While pulmonary function testing is not required for all employees who wear
respirators, it is a best practice that is utilized in a majority of occupational settings and is
typically included in an organizations respiratory protection program. Spirometry is the
most frequently performed pulmonary function test and is the cornerstone of occupational
respiratory evaluation programs (Townsend, 2011).
In the occupational health setting, spirometry plays a critical role in the primary,
secondary, and tertiary prevention of workplace-related lung disease (American College
of Occupational and Environmental Medicine, 2000). Spirometry data collected as a
result of both standard medical practice and required testing provides a unique
opportunity to perform occupational health surveillance among workers in targeted
industrial occupations known to have potentially harmful exposures in the workplace. It
also provides another opportunity to perform a vital function of occupational health
surveillance as identified by Markowitz (2007):
Occupational health surveillance is an important means of discovering
new associations between occupational agents and accompanying diseases. The
potential toxicity of approximately eighty percent of the chemicals used in the
workplace has not been evaluated in humans or in in vivo or in vitro test systems.
Discovery of rare diseases, patterns of common diseases, or suspicious exposure-
disease associations through surveillance activities in the workplace can provide
vital leads for more conclusive scientific evaluation of the problem and possible
verification of new occupational diseases.
12""
Unfortunately, the vast majority of this data is used to simply validate individual
capacity for respirator use and is ignored for population level analysis. Determining
whether such data can be used efficiently to conduct a population level analysis is in line
with the directive of EPHM to identify new data sources to enhance ongoing surveillance
activities with the ultimate goal of gaining a better understanding of the health impact of
occupational exposures in Florida.
The objectives of the current study are as follows:
• Identify industries in the State of Florida that have the potential for increased
pulmonary impairment amongst workers
• Evaluate the feasibility of using pulmonary function data collected for purposes of
compliance and/or best practices for workers who use respiratory protection
because they are potentially exposed to pulmonary toxicants in the workplace
This study will attempt to test the following hypothesis:
• Pulmonary function is impaired among workers of selected industries exposed to
various airborne toxicants
13""
Chapter 2
Spirometry and Lung Function
In order to evaluate the data produced from pulmonary function testing, it is
important to have a basic understanding of lung function and how is it measured.
Pulmonary function tests evaluate the functionality of the lungs. Spirometry is the most
basic type of pulmonary function test and provides air volume and flow rate within the
lungs. Schlegelmilch and Kramme state:
Spirometers are noninvasive diagnostic instruments for screening and
basic testing of pulmonary function. Offering essential diagnostic insight into the
type and extent of lung function impairment, spirometry tests can be performed
fast at fairly low cost. In the light of ever-increasing prevalence of airway
diseases such as asthma, bronchitis, and emphysema, pulmonary function
instruments have become indispensible diagnostic tools, in clinical and office
settings, in industrial and preventive medicine, as well as in epidemiology.
As mentioned in Chapter 1, spirometry is the most frequently performed
pulmonary function test other than an arterial blood gas study and plays an important role
in diagnosing the presence and type of lung ‘abnormality’ and classifying its severity
(Sood et al., 2007). The utility of spirometry as a tool to evaluate pulmonary health is
further discussed by Petty (2005):

14""
Normal spirometry predicts a high likelihood of long-time survival;
abnormal spirometry indicates an adverse prognosis. Simple spirometric
measures provide an important database for the primary care physician and
specialist. One example is the patient who comes to the physician with cough and
dyspnea thought to be associated with a certain occupation. Knowledge of prior
spirometry will give a baseline for comparison.
Results of such testing that is already being collected for select occupational
populations can be integrated into a functional database and used to conduct medical
health surveillance in a cost effective and efficient manner.
2.1 History of Spirometry
Scientific inquiry into the understanding of lung function as a process, goes far
back into history and has led scientists to develop various methods and instruments to
measure lung capacity. This was an important endeavor because measurement of lung
volumes provides fundamental information that makes categorization and the staging of
lung diseases possible. The concept of spirometry has been traced back to a doctor
named Claudius Galen who lived during the time of the Roman Empire. He studied
human ventilation by having a subject breathe into a bladder and discovered that over a
period of time the volume of gas did not change.
The next documented experiment involving lung volumes took place around 1681
by a mathematician named Giovanni Alfonso Borelli. His experiment involved having a
subject suck liquid through a cylindrical glass tube. The volume was calculated from the

15""
bore of the tube and the height of the meniscus, which unfortunately led to a significant
underestimation of true lung volumes (Garay, 2007). In the early 1700s Stephen Hales
confirmed the absolute measurements of air volume recorded by James Jurin in 1718. He
recorded the maximum volume of air, which could expire into a bladder using
displacement of water according to the principle of Archimedes (Spriggs, 1978).
While experiments were conducted in the past, the practice of determining lung
volumes began to advance in the 17th century and continued to progress with the
improvement of technology and data collection methods. For example, in 1947 Tifineau
introduced the concept of the timed vital capacity, which resulted in FEV1 (Petty, 2005).
Since that time, spirometry has continued to evolve but still remains an easy and effective
tool to measure pulmonary function. Petty (2005) states:
Spirometry is a highly useful, yet simple instrument for the measurement
of expiratory air flow and volume. Spirometry is key to the diagnosis of
obstructive ventilatory diseases, that is, asthma and chronic obstructive
pulmonary disease (COPD), and in monitoring responses to therapy. Spirometry
also identifies restrictive disease and helps monitor therapy and predicts prognosis
over time.
Table 1 presents some of the main contributors and significant achievements in
the history of spirometry over the past two centuries.

16""
Table 1: History of Spirometry
Year Contributor Achievement
1800 Davy Measurement of residual volume using a hydrogen gas
dilution technique.
1844 Hutchinson Designed the first spirometer. Designated the expiratory
vital capacity and developed normal standards based
upon approximately 2,000 assorted English persons.
1940s Cournand &
Richards
Established standard methods of assessment and
published normal values of pulmonary function tests.
1947 Tiffeneau & Pinelli Contributions to the measurement of timed vital
capacity.
1949 Tiffeneau, Bousser,
& Drutel
First advocated the use of the FEV1/FVC ratio.
1951 Gaensler Analysis of the ventilation defect by timed vital capacity
measurements.
1955 Leuallen & Fowler Contributed the maximum mid-expiratory flow test.
1957 Gandevia & Hugh-
Jones
Published widely accepted terminology for pulmonary
physiology.
1958 Hyatt, Schilder, &
Fry
The expiratory flow-volume curve was introduced.
1963 American College
of Chest Physicians
(ACCP)
Modification of the terminology of dynamic lung
volumes.
1975 ACCP & American
Thoracic Society
Published a broad exposition on pulmonary
nomenclature.
(Adapted from Morris, J. F. (1976). Spirometry in the evaluation of pulmonary function (Medical Progress) Western Journal of Medicine, Volume 125, 110-118.)

17""
2.2 Spirometry and the Respiratory System
As described previously, spirometry is considered a medical screening test that
helps evaluate lung function in individuals. The lungs are part of the respiratory system
which provides essential oxygen to all parts of the body as well as enabling the body to
get rid of carbon dioxide. The amount and delivery of oxygen needed for human cells to
function properly is a delicate balance and important for overall health. Lung
morphology is determined by three major constraints: limited volume allocated to the
structure, a need to protect the delicate gas exchange airways, and the large surface area
needed for air-blood oxygen and carbon dioxide exchange (Miguel, 2012).
The respiratory system is made up of organs and tissues that help an individual
breathe, with the main parts of this system being the airways, the lungs, and linked blood
vessels, and the muscles that enable breathing (National Heart, Lung, and Blood Institute,
2012a). The airways that deliver vital oxygen-rich air to the lungs include the nose,
mouth, larynx, trachea, and bronchial tree. These same airways also carry out carbon
dioxide which is a waste product of cellular respiration. The oxygen that is transported
through the respiratory system is ultimately transferred to the bloodstream at the alveoli
located at the end of the bronchial tree. It is estimated that an adult has approximately
three hundred million alveoli with a surface area for gas exchange of about seventy-five
square meters, which are perfused by more than two thousand kilometers of capillaries
(Miguel, 2012). Figure 2 presents a basic diagram of the respiratory system, airways, and
gas exchange between the capillaries and alveoli.

18##
Figure 2: Diagram of the Respiratory System. (Source: National Heart Lung and Blood Institute, http://www.nhlbi.nih.gov/health/health-topics/topics/hlw/system.html, accessed 2012)

19##
When an individual breathes, air is moving in and out of the lung which is
referred to as ventilation. Muscles located near the lungs allow this process to happen by
expanding and contracting the lungs. Muscles used in this process include the
diaphragm, intercostal muscles, abdominal muscles, and muscles in the neck and
collarbone area.
The movement of air into the lung is an active process called inspiration. The
movement of air out of the lung is a passive process call expiration and involves elastic
recoil which returns the lung to its normal size. Pulmonary compliance (stiffness) can
affect elastic recoil by influencing the amount of pressure needed to increase or decrease
the volume of the lung. Airflow resistance can also negatively affect lung volumes due to
the difficulty of air passing through the airways. The responses of the lung to toxicants
may be divided into the following general categories (Menzel & McClelln, 1980):
• Irritation of the air passages, which results in constriction of the airways. Edema
often occurs and secondary infection frequently compounds the damage
• Damage to the cells lining the airways, which results in necrosis, increased
permeability, and edema
• Production of fibrosis, which may become massive and cause obliteration of the
respiratory capacity of the lung. Local fibrosis of the pleura also occurs,
restricting the movement of the lung and producing pain through the irritation of
pleural surfaces
• Constriction of the airways through allergic responses
• Oncogenesis leading to primary lung tumors

20##
The above categories of pulmonary response to toxicants can affect pulmonary
function by altering normal lung volumes. Table 2 presents a number of different lung
volumes accompanied by a brief description. A spirometer can measure most lung
volumes with the exceptions being total lung capacity, functional capacity, and residual
volume.
Table 2: Lung Volumes
Tidal Volume
The volume of gas which is inhaled or exhaled during the course of a normal resting
breath.
Residual Volume
The volume of gas that remains in the lungs after a maximal forced expiration.
Inspiratory Reserve Volume
The volume of gas that can be further inhaled after the end of a normal tidal inhalation.
Expiratory Reserve Volume
The volume of gas that can be exhaled from the resting end-expiratory level.
Capacity
The sum of one of more lung volumes.
Vital Capacity
The volume of gas inhaled when a maximal expiration is followed immediately by a
maximal inspiration.
Functional Residual Capacity
The volume of gas that remains in the lungs after a normal tidal expiration.
(Adapted from Physics, Pharmacology and Physiology for Anesthetists, 2008)

21##
Airborne contaminants in the form of gases, liquids, or solids have the potential to
harm the lungs if inhaled and ultimately decrease pulmonary function. NIOSH (1977)
recognizes the importance of the inhalation route in occupational settings and states:
Some of the highly reactive industrial gases and vapors of low solubility
can produce an immediate irritation and inflammation of the respiratory tract and
pulmonary edema. Prolonged or continued exposure to these gases and vapors
may lead to chronic inflammatory or neoplastic changes or to fibrosis of the lung.
Fibrosis, as well as granulomatosis and malignancy, also may be produced by
certain insoluble and relatively inert fibrous and nonfibrous solid particulates
found in industry. Indeed, it is now thought that one of the prerequisites for
particulate-induced bronchogenic carcinoma may be the insolubility of the
particulate in the fluids and tissues of the respiratory tract, which thereby allows
requisite residence time in the lung for tumor induction.
The fact that the surface area of the lungs is so large, potential for occupational
lung disease is a concern if airborne hazards of the workplace are not controlled through
appropriate measures. Consider that many occupations require physical exertion which
can increase the amount of air inhaled. For example, a person at rest inhales
approximately six liters of air a minute compared to approximately seventy-five liters per
minute during heavy exercise (NIOSH, 2003).
An airborne contaminant can affect pulmonary function if they pass through the
respiratory system and reach the alveoli. Menzel & McClellan (1980) state the following
about the toxic responses of the respiratory system:

22##
The deposition and retention of inhaled gases and aerosols are influenced
by many anatomic features of the respiratory tract, including lung volume,
alveolar surface area, and structure and spatial relationships of conducting
airways into alveoli. Distribution of deposited material as a function of time, in
combination with the location of the over forty cell types identified in the
respiratory tract, determines the cells at risk for any inhaled material.
Gases, fumes, and vapors all have the potential to affect lung function. This
group includes irritant acid gases, very soluble gases, and gases and vapors of low water
solubility but high fat solubility. Irritant acid gases for the most part are fast acting
chemicals that affect the upper airway passages. Very soluble gases typically deposit in
the upper or proximal airways and if the dose is sufficient, emphysema and fibrosis may
develop. Gases and vapors of low water solubility and high fat solubility are more likely
to reach the distal airways and ultimately the blood.
The deposition, retention, distribution, and ultimate health effects of particulates
differs from that of gases, fumes and vapors. The aerodynamic properties of particles and
fibers determine how far they can travel into the body and ultimately determine where
they are deposited in the respiratory system. Particles up to one hundred microns can be
inhaled though the nose, however particles larger than fifty microns typically do not
remain airborne long enough to be inhaled. If they are inhaled, they become trapped in
the nasal passage. Particles less than ten microns are considered to be respirable and
have the potential to reach deep into the lungs. Particles one to five microns in size are
more likely to deposit in the trachea and bronchi while particles 0.01 to one micron in

23##
size are likely to reach the bronchioles, alveolar ducts, and alveoli. Figure 3 presents size
ranges for various particles.
Figure 3: Particle Size Distribution Graph in Microns. (Source: National Institute of Environmental Health Sciences, www.niehs.nih.gov/health/assets/docs_a_e/ehp_student_edition_lesson_particles_size_makes_all_the_difference.pdf, accessed 2012)

24##
2.3 Spirometry Testing and Results
Spirometry is conducted using a spirometer, which measures the quantity of air a
person inhales or exhales and the rate at which the air is moved in and out of the lungs.
The process of obtaining spirometric volumes is relatively easy and is explained by
Garay (2007):
The subject is instructed to breathe normally with a resting tidal pattern as
the volume is being recorded. Next, the subject inspires maximally, then exhales
as completely as possible with a slow, continuous, smooth exhalation and returns
to tidal breathing. The result is the slow vital capacity (SVC). FVC is measured
with virtually the same maneuver, but the patient is instructed to exert maximal
forced expiratory effort.
Spirograms are graphic representations of the information obtained from the test.
Spirometers can measure volume through the amount of air exhaled or inhaled within a
certain time or they can measure flow by determining how fast the air flows in or out as
the volume of air inhaled or exhaled increases. Figure 4 presents a flow-volume loop and
a volume-time curve.

25##
Figure 4: Normal Volume Time Curve and Flow Volume Curve. (Source: NIOSH Spirometry Training Guide, 2003)

26##
Spirometry results indicate the presence of lung abnormalities which include
obstructive patterns, restrictive patterns, or a combination of both. In obstructive
diseases, less air flows in and out of the airways because of one or more of the following:
airways and air sacs lose their elastic quality; walls between many of the air sacs are
destroyed; walls of the airways become thick and inflamed; airways make more mucus
than usual, which can clog them (National Heart Lung and Blood Institute, 2012b).
Restrictive disease is a condition marked most obviously by a reduction in total lung
capacity caused by a pulmonary deficit, such as pulmonary fibrosis (abnormally stiff,
non-compliant lungs) (John Hopkins University School of Medicine, 2012). Table 3
presents an overview of occupational obstructive and restrictive lung diseases.
Table 3: Overview of Occupational Lung Disease
Pulmonary Diseases that Show
Obstructive Patterns
Pulmonary Diseases that Show
Restrictive Patterns
Occupational Asthma Pneumoconioses
Reactive Airways Dysfunction Syndrome Hypersensitivity Pneumonitis
Emphysema Granulomatous Disease
Chronic Bronchitis Other Health Conditions
(Adapted from NIOSH Spirometry Training Guide, 2003)

27##
Chapter 3
Health Surveillance
The purpose of surveillance is to target work-related diseases and injuries so that
prevention can occur (Millar, 1986). This chapter presents a number of studies that use
surveillance data to determine the health status of various groups of individuals. In
addition, this chapter will look specifically at pulmonary function data and its utility in
comparative analysis.
3.1 Disease Surveillance
3.1.1 National Health and Nutrition Examination Survey
National Health and Nutrition Examination Survey III (NHANES III) data has
been successfully used as a baseline population for health surveillance. NHANES is a
program of studies designed to assess the health and nutritional status of adults and
children in the United States (Center for Disease Control and Prevention, 2012). The
South Carolina Department of Health and Environmental Control (1999) recognized that
NHANES III data provides the most recent and most accurate estimate of the prevalence
of overweight and obesity in the United States and that when these data are applied to the
adult population in South Carolina, it provides useful estimates of the number of
overweight and obese individuals in the State. This is just one example of how NHANES
III data can be used to determine if a population level abnormality exists with a specific

28##
group of individuals. The following studies provide further examples of the use of the
NHANES data set in comparative analyses.
McEvoy et al. (2005) conducted a study to determine the prevalence of metabolic
syndrome (a risk factor for cardiovascular disease) in United States patients with
schizophrenia. They used baseline data from the Clinical Antipsychotic Trials of
Intervention Effectiveness (CATIE) Schizophrenic Trial. Comparative analyses were
performed using a randomly selected sample from NHANES III matched 1:1 on basis of
age, gender, and race/ethnicity. In a logistic regression model with age, race, and
ethnicity as covariates, CATIE males and females were more likely to have metabolic
syndrome than the NHANES matched samples. The conclusion of the study indicated
that metabolic syndrome is highly prevalent in United States schizophrenic patients and is
a source of cardiovascular risk. They suggest that clinical attention be given to
monitoring for metabolic syndrome and minimizing metabolic risks associated with
antipsychotic treatment.
Lamberti et al. (2006) conducted a study to compare the prevalence of the
metabolic syndrome among outpatients with schizophrenia and schizoaffective disorder
receiving clozapine with a matched group from NHANES III. Ninety-three outpatients
were compared to a group of 2,701 individuals matched for age, body mass index, and
race/ethnicity. Logistic regression analyses were performed to determine if study
variables were associated with the presence or absence of metabolic syndrome. The
results of the study found that the prevalence of the metabolic syndrome was significantly
higher among clozapine patients than among the NHANES III comparison group. This

29##
research identified that regular monitoring may be especially critical for schizophrenic
patients taking clozapine due to the high prevalence of metabolic abnormalities reported
in this study and others.
Herrington et al. (1998) conducted a comparative analysis to determine the
efficacy of postmenopausal estrogen/progestin therapy for secondary prevention of
coronary heart disease. To conduct the analysis, they compared the baseline
cardiovascular risk factor data from the Heart and Estrogen/Progestin Replacement Study
(HERS) cohort with similar data from women presumed to have coronary heart disease
from NHANES III. Age, race, and cardiovascular disease risk factors were compared in
the 2,763 postmenopausal women younger than eighty years old, with a uterus, and with
documented cardiovascular disease in HERS to 145 similarly aged women with clinical
or electrocardiographic evidence of coronary heart disease from NHANES III. The
results indicated that the HERS cohort had fewer cardiovascular risk factors than women
with myocardial infarction or angina in NHANES III. It was determined that due to the
number of women with diabetes and hypertriglyceridemia in the NHANES III group,
these results emphasized the importance of testing strategies for secondary prevention of
coronary heart disease in this high risk subgroup.
Dickerson et al. (2006) conducted a study to examine the distribution and
correlates of body mass index among individuals with serious mental illness. A
comparison of body mass index was made between 169 out-patients receiving
community-based psychiatric care and 2,404 matched individuals from the NHANES III
data set. The distribution of body mass index in individuals with serious mental illness

30##
differed significantly form the NHANES III comparison group. The results showed that
fifty percent of women and forty-one percent of men in the psychiatric sample were
obese compared with twenty-seven percent and twenty percent in the NHANES III
group. In addition, the higher body mass index linked to individuals with serious mental
illness was associated with current hypertension, diabetes, a wish to weigh less, and
reduced health-related functioning.
Goff et al. (2005) conducted a study to compare ten-year cardiac risk estimates in
schizophrenia patients from the CATIE study to matched controls. Ten-year risk for
coronary heart disease was calculated for 689 out-patients with a diagnosis of
schizophrenia who participated in the CATIE study. They were compared to 687
NHANES III subjects matched for age, race, and gender. Ten-year coronary heart
disease was significantly higher in male and female schizophrenia patients compared to
the NHANES III control population. The results of this research were consistent with
other studies which find that schizophrenia patients in the CATIE study at baseline have a
significantly higher risk for coronary heart disease compared to matched controls. This
holds true even after controlling for body mass index. The authors conclude that based
upon the findings of the study that cardiac risk factors should be evaluated and monitored
by clinicians and behavioral or pharmacological interventions should be implemented as
indicated.
Streeten et al. (2004) conducted a study to compare hip fracture incidence and
bone mineral density in Older Order Amish to the general population. To assess the bone
health of the Older Order Amish population, bone mineral density data was selected from

31##
among participants of the Amish Family Osteoporosis Study and compared to a United
States non-Amish white population obtained from NHANES III. Statistical significance
between the groups was assessed by estimating the variance of the pooled difference in
bone mineral density across age groups. Results indicated that the Older Order Amish
had a higher mean bone mineral density that was significant in women but not in men
compared to the NHANES III population. The authors concluded that based upon the
findings of the study that additional research of lifestyle and/or genetic differences
between Amish and the general population may provide insights into etiologic factors
influencing hip fracture risk.
Castorina et al. (2010) conducted a study to compare current-use pesticide and
other toxicant urinary metabolite levels among pregnant women in the Center for the
Health Assessment of Mothers and Children of Salinas (CHAMACOS) cohort to the
general population. They measured thirty-four metabolites of current-use pesticides and
other precursor compounds in urine samples collected twice a day from 538 women
living in the Salinas Valley of California. Metabolite concentrations from the
CHAMACOS cohort were compared with United States national reference data for 342
pregnant women sampled by NHANES to determine the impact of the women’s regional
environment. The results of the study found that the 95th percentile values of six of the
most commonly detected compounds were significantly higher among the CHAMACOS
women compared to the NHANES group after controlling for age, race, socioeconomic
status, and smoking. The authors conclude that findings indicate that the CHAMACOS
cohort has an additional burden of precursor pesticide exposure compared to the general
population, which is possibly due to living and/or working in an agricultural area.

32##
Xu et al. (2009) conducted a study to compare the prevalence of chronic kidney
disease among native Chinese and American ethnicities. In 2006, a stratified multistage
clustered screening for chronic kidney disease was conducted in Beijing and resulted in
13,626 participants. The data collected from the screening was compared to NHANES
data which included 9,006 American whites, 3,447 African Americans, and 4,626
Hispanics. The results indicated that when compared to NHANES data, Chinese had a
lower prevalence of adjusted albuminuria as well as the lowest risk of albuminuria when
diagnosed with diabetes. Chronic renal insufficiency among Chinese when diagnosed
with diabetes or hypertension was found to be lower when compared to African
Americans but not significantly different than whites or Hispanics. The authors
concluded that the prevalence of chronic kidney disease was significantly different
between native Chinese and American ethnicities.
Brar et al. (2007) conducted a study to compare diabetes mellitus prevalence and
its predictors in antiretroviral-naïve HIV-infected patients compared to the general
population. A cross-sectional analysis of 2,565 participants enrolled in three Terry Beirn
Community Programs for Clinical Research on AIDS (CPCRA) clinical trials were
compared to 6,585 adults from the NHANES cohort for the years 2001 through 2002.
The results indicated that the prevalence of diabetes mellitus was significantly lower
among CPCRA subjects compared to NHANES subjects. However, after adjusting for
age, race/ethnicity, and body mass index, there was no significant difference in the
prevalence of diabetes mellitus between CPCRA subjects and NHANES subjects.

33##
Burger et al. (2011) conducted a study to investigate the correlation between body
mass index and pulmonary artery systolic pressure in patients enrolled in the Registry to
Evaluate Early and Long-term Pulmonary Arterial Hypertension (PAH) Disease
Management (REVEAL) to NHANES subjects. The two groups were matched for age
and gender with ultimate goal of determining whether obesity is linked with PAH. The
results indicated that there was no significant difference in mean body mass index for
patients with PAH compared to the NHANES control group. However, results did find
that there were higher percentages of obese and underweight patients in REVEAL. The
authors concluded that further research is needed to determine the reason for increased
obesity in idiopathic PAH.
Dickerson et al. (2004) conducted a study to compare sexual reproductive
behaviors among persons with mental illness to the general population. The study sample
consisted of 191 men and women with schizophrenia or a mood disorder recruited from
two outpatient psychiatric centers. The comparison group was selected from the
NHANES III data set and for age and race. The responses from the two groups were
compared using regression analysis for each outcome variable by gender. The findings of
this study suggest gender differences in sexual behaviors among people with mental
illness. Women with mental illness reported having more partners than the NHANES III
comparison group. In addition, women with mental illness had fewer live births and were
less likely to get pregnant compared to the NHANES III comparison group. The authors
conclude that as a result of the findings, there is a need to prevent sexually transmitted
diseases and victimization of women with mental illness and that physicians need to pay
special attention to the sexual and reproductive health of this group.

34##
Sarma et al. (2009) conducted a study to determine the urinary incontinence
among women with type 1 diabetes to a population based sample of women with normal
glucose. A group of 550 women enrolled in the Epidemiology of Diabetes Interventions
and Complications (EDIC) study were compared to 383 women with complete
incontinence information from the NHANES 2001 to 2002 sample. Women from the
EDIC study that had type 1 diabetes had a two-fold greater prevalence of weekly or
greater urge incontinence compared to the NHANES III comparison group. Based on the
findings of this study, the authors concluded that physicians treating women with type 1
diabetes should look for incontinence because it is often unrecognized and therefore
untreated in women with diabetes.
Abalkhail and Shawky (2002) conducted a study to compare the body mass index,
triceps skin fold thickness and mid-arm muscle circumference in Saudi adolescents to a
recognized reference population. Data was collected from 2,737 Saudi adolescents
selected from forty-two boys’ and forty-two girls’ schools in Jeddah and compared with
corresponding values from NHANES I. The results of the study showed that the 85th
percentile and 95th percentile for body mass index and triceps skin fold thickness were
higher for Saudi adolescents compared to the NHANES I comparison group. In addition,
Saudi adolescents had lower mid-arm muscle circumference at the 90th percentile and 95th
percentile compared to the NHANES I reference population curves. The authors
concluded that Saudi adolescents show increased weight and obesity along with increased
body fat and decreased body muscle compared to the NHANES I comparison group.
They suggest that public health interventions are needed to improve quality of food,
35##
encourage physical activity, and change the perception of appropriate body stature in
Saudi Arabia.
Huang et al. (2004) conducted a study to compare 1-hydroxypyrene exposure in
the United States population with that in occupational exposure studies. Data was
analyzed for fourteen monohydroxy polycyclic aromatic hydrocarbons from urine
samples collected as part of NHANES. Reference range values were calculated for these
metabolites in the United States population. As part of the analysis, it was determined
that 1-hydroxypyrene was detected in more than ninety-nine percent of the samples with
an overall geometric mean concentration of 79.8 nanograms per liters in the United States
population. This data was used to compare the reference range of urinary 1-
hydroxypyrene levels in the United States population with levels reported from various
occupations by other researchers. Comparative analysis indicated that at some
occupations, such as coke oven plants and carbon electrode plants, workers’ urinary 1-
hydroxypyrene concentration levels could be a few hundred times higher than the general
United States population. The authors of this study concluded that additional research is
needed that directly correlates urinary 1-hydroxypyrene with health effects such as cancer
risk to gain a better understanding of occupational polycyclic aromatic hydrocarbon
exposure and determination of biological limit values.
Comparative research provides an opportunity to investigate health data across
different populations. This type of research is important so that evaluations can be made
between different groups to identify populations at high risk and identify new or

36##
emerging health concerns. The studies referenced in this section show the utility and
strength of using NHANES data in comparative research and analysis.
3.1.2 Occupational Respiratory Disease Surveillance
In terms of occupational respiratory disease surveillance, NIOSH and the Mine
Safety and Health Administration have implemented the Enhanced Coal Workers’ Health
Surveillance Program (ECWHSP). According to NIOSH (2012d):
Coal mining-related respiratory diseases can affect the gas exchanging
tissues of the lungs. These lung tissues remove carbon dioxide and take up
oxygen. The diseases can also affect the lung passages that carry air back and
forth during breathing. The passages are called airways. Depending on what is in
the coal mine dust that is inhaled and the part of the lung that is affected, coal
miners may develop several different types of respiratory diseases.
This program was developed due to the observed onset of advanced pneumoconiosis in
younger coal miners along with regional clustering of rapidly progressive cases.
Pneumoconiosis is a disease of the lung and refers to the scaring of the tissue between the
air sacs. The two primary pneumoconioses related to coal mining are coal workers’
pneumoconiosis (CWP) and silicosis:
• CWP, commonly called Black Lung, is type of pneumoconiosis caused by
inhaling respirable coal mine dust. Chest x-rays can show shadows in the lungs
called opacities. In severe cases, there are more opacities in a given area of the

37##
lung. The most severe type of CWP is called progressive massive fibrosis (PMF).
In PMF, the opacities come together and become large (NIOSH, 2012d).
• Silicosis is a type of pneumoconiosis caused by inhaling respirable crystalline
silica. Quartz is a type of crystalline silica that causes silicosis in coal miners
because it is a major component of rocks. Silicosis causes x-ray changes similar
to CWP; and it is especially seen in coal miners who are exposed to rock dust,
such as roof bolters in underground mines and drillers in surface mines (NIOSH
2012d).
Surveillance of coal miners includes surveys, health questionnaires, work
histories, spirometry testing, radiographic examinations, and other pertinent health
information. This data is collected by specially trained personnel using a mobile
examination unit. Figure 5 presents a poster promoting the participation in the Coal
Workers’ Health Surveillance Program.

38##
Figure 5: Black Lung Poster. (Source: DHHS (NIOSH) Publication Number 2003-123 (2003))

39##
In addition to the to the ECWHSP, NIOSH has a separate projected called ‘Dust
Control Technology for Black Lung Hot Spots’ which collects coal mineralogy, mining
conditions, respirable dust and silica exposure concentrations, mining and dust control
strategies, and other pertinent data in regions with disease clusters. The results of these
NIOSH activities are intended to facilitate preventive actions, through the derivation of
representative current estimates of the burden, distribution, and determinants of
occupational lung disease in relation to coal mining in the United States (NIOSH, 2012e).
3.1.3 Pulmonary Function Surveillance Data
NIOSH (2003) recommends that employment settings where workers use
respirators or are potentially exposed to airborne toxicants should have a respiratory
surveillance program which should include the use of spirometry. Such programs
generate pulmonary function data that can be used to conduct a population level analysis.
The potential outcome of such research includes the prevention, early detection, and
treatment of occupational diseases. This leads to a healthier workforce, which in turn can
lessen the unnecessary burdens associated with worker’s compensation claims, litigation
fees, insurance premiums, and medical bills.
Pulmonary function testing is particularly well suited for occupational
surveillance with the availability of the NHANES III Raw Spirometry data set. NHANES
III was conducted from 1988 to 1994, and is comprised of a random sample of the United
States population living in households. In terms of spirometry data, NHANES III
improved upon data collection and data quality. Hankinson et al. (1999) describe such
improvements:

40##
One significant aspect of NHANES III was the use of equipment and
procedures that met the 1987 American Thoracic Society’s spirometry
recommendations, and featured automated quality assessment during test
performance. To maintain the highest level of technician performance, a quality
control center continuously reviewed the data and provided quality control reports
and follow-up training as appropriate. In 1994, as NHANES III was completing
data collection, the American Thoracic Society revised its 1987 spirometry
recommendations, which included changes in both the extrapolated volume and
the reproducibility criteria. In addition the NHANES III spirometry protocol
called for each participant to perform a minimum of five maneuvers, which
differed from the three acceptable maneuvers recommended by the American
Thoracic Society. To make findings from NHANES III useful to future
investigations utilizing the 1994 American Thoracic Society’s recommendations,
the raw data were also reanalyzed to follow the 1994 American Thoracic
Society’s recommendations, and the impact of using a minimum of five versus
three maneuvers was investigated.
This data allows for population level analysis of worker spirometry data to be compared
to a standard population, adjusted for age, height, tobacco smoking, and other factors that
impact pulmonary function not related to the occupational environment.
Spirometric interpretation utilizes reference equations as threshold criteria for the
diagnosis of lung disease. Many studies have published lung function values, so there
has been considerable debate in the past regarding the applicability of the various

41##
reference equations used for analysis. Pellegrino et al. (2005) determined that in the
United States, ethnically appropriate NHANES III reference equations are recommended
for those aged eight to eighty years. Furthermore, Collen et al. (2008) has conducted
research on discordance in spirometric interpretations using three commonly used
reference equations versus NHANES III and found that:
Although our study was not designed to identify the optimal reference
equation for this population, we believe the NHANES III equations are the best
available to date. The NHANES III equations are based on a sample size that was
ten-fold greater than those in any of the prior studies and included a
heterogeneous population that was enrolled from 1988 to 1994. These equations
are less subject to cohort effect in comparison to those derived by the Crapo,
Morris, and Knudson studies, which enrolled patients in earlier decades.
The NHANES III Raw Spirometry data contains over 15,000 individual
spirograms matched to standard NHANES demographic and survey data. Once
compiled, mandatory pulmonary function data from exposed workers can be reliably
analyzed for comparison to NHANES III data to determine if a population level
abnormality exists within a specific occupation.
The objective of this research is to compile raw data from occupational health
monitoring reports into a coherent database to determine the utility and feasibility of this
data as an instrument for evaluating potential health effects associated with working in
various occupational sectors. The results of this research can be used to develop and
implement safe work practices that reduce chemical exposure for workers in the State of

42##
Florida. The hypothesis that was tested was: Pulmonary function is impaired among
workers of selected industries exposed to various toxicants. Three principle occupational
sectors represented in the data source include boat manufacturers, electric utility workers,
and first responders. Previous findings indicate that these occupational sectors have
unique exposures that put them at risk for specific pulmonary diseases.

43##
Chapter 4
Literature Review
Various occupational sectors including the public sector, general industry,
construction, and maritime have unique exposures, which if uncontrolled, may lead to
adverse health effects. While regulations exist to protect workers from these exposures,
it is necessary to monitor certain health outcomes to ensure these exposure controls are
effective for each individual. Analysis of this health outcome data on the population
level may provide insight into health effects that occur in occupational sectors despite the
presence of protective regulatory measures. This research focuses on boat manufacturers,
electric utility workers, and first responders. Previous findings indicate that these
occupational sectors have an increased risk for pulmonary function impairment to occur
among workers because of potential exposure to airborne hazards.
It should be noted that uncertainty is inherent in pulmonary function
measurements. However, the objective of this research is to collect available pulmonary
function data and use this information to evaluate potential health effects associated with
working in various occupational sectors. The articles presented as part of the literature
review were included to provide some justification to investigate and identify
occupational sectors that may be susceptible to pulmonary function impairment with the
ultimate goal of minimizing exposure of workers through hazard control.

44##
4.1 Boat Manufacturing
Manufacturing is an important part of Florida’s growing economy. In 2011,
Florida was the home to nearly eighteen thousand manufacturing facilities that employed
close to 312,000 people with a total payroll of more than sixteen million dollars
(eFlorida, 2012). The National Marine Manufacturers Association (NMMA) reported
that in 2008, there were 242 active boat builders in Florida (NMMA, 2012). The United
States Environmental Protection Agency (USEPA) (2008) states:
Several types of boats are manufactured in the United States, including
sailboats, powerboats, yachts, personal watercraft, and small miscellaneous boats
such as kayaks and canoes. These boats are manufactured from a variety of
materials, including, but not limited to, fiber glass (also known as fiber reinforced
plastic or FRP), aluminum, rotationally molded (rotomolded) polyethylene, and
wood. Fiberglass is the most common material used in boat manufacturing.
During the manufacturing of fiberglass boats, there are a number of sources of
volatile organic compound emissions. The USEPA (2008) reports:
Styrene and methyl methacrylate are the primary volatile organic
compounds emitted from fiberglass boat manufacturing materials. The resins
contain styrene and the gel coats contain both compounds. Styrene and methyl
methacrylate are monomers. A monomer is a volatile organic compound that
partially combines itself, or other similar compounds, by a cross-linking reaction

45##
to become a part of the cured resin. A fraction of each monomer evaporates
during resin and gel coat application and curing.
In the boat manufacturing industry, styrene is widely used in the production of
fiberglass based hulls. In 1995, Florida had thirty-nine boat manufacturing facilities that
reported styrene emissions to the Toxic Release Inventory database (USEPA, 2001).
Styrene is used as an intermediate for chemical synthesis resins and in the manufacture of
polymeric plastics (Baselt, 2002). Styrene is a respiratory irritant, and acute exposures of
three hundred to seven hundred parts per million result in nasal and pulmonary irritation
and inflammation (Carpenter, 1944; Stewart, 1968; NIOSH, 1983). Obstructive
pulmonary disorders have been observed in chronically exposed workers, though
exposures controlled at the OSHA permissible exposure limit of one hundred parts per
million are thought to prevent chronic pulmonary impairment (Chmielewski & Renke,
1975). However, not all respiratory system studies are conclusive. For example, Stewart
et al. (1968) studied the effects of styrene on pulmonary function and found that FEV1
was significantly decreased in only twenty percent of a group of workers exposed to
styrene.
While some studies are inconclusive regarding long term styrene inhalation and
occupational asthma due to additional chemicals in the environment to which the workers
may have been exposed, styrene has been reported as a cause of occupational asthma in a
few case reports. Oner et al. (2004) conducted a study to investigate the risk for
occupational asthma in relation to exposure to styrene in a large number of workers. He
used pulmonary function testing as a measure to associate styrene exposure and

46##
occupational asthma. The findings of the study were not conclusive about the causative
role of styrene in occupational asthma but concluded that further research in this area
should be conducted.
Current research by Sati et al. (2011) evaluated pulmonary function in workers
exposed to styrene in a plastic factory and found a statistically significant reduction (p-
value less than 0.05) in most of the lung volumes, capacities (FVC, FEV1, Vital Capacity
(VC), Expiratory Reserve Volume (ERV), Inspiratory Reserve Volume (IRV), and
Inspiratory Capacity (IC)) and flow rates (Peak Expiratory Flow Rate (PEFR), Maximum
Expiratory Flow (MEF) (75%), and Maximum Voluntary Ventilation (MVV)) in the
study group (workers) as compared to controls.
In the boat manufacturing industry, methyl methacrylate is also used in the
production of fiberglass based hulls. Methyl methacrylate has an odor threshold of less
than 0.4 parts per million and is immediately dangerous to life and health at a
concentration of one thousand parts per million (Ungers, 2007). A number of studies
have shown occupational asthma associated with exposures to methacrylates or more
specifically methyl methacrylate in an occupational setting. Occupational asthma is a
disease characterized by variable airflow limitation and/or airway hyper responsiveness
due to causes and conditions attributable to a particular occupational environment and not
to stimuli encountered outside the workplace (Bernstein, 1993).
Piirila et al. (1998) conducted a study of occupational respiratory hypersensitivity
caused by preparations containing acrylates in dental personnel. The objective of the
study was to report the cases of acrylates induced respiratory hypersensitivity in dental

47##
personnel over a six year period. The results of the study found that twelve cases of
respiratory hypersensitivity caused by acrylates were diagnosed in dental personnel in
Finland from 1992 to 1997. Nine cases of occupational asthma were verified according
to challenge tests with dental acrylate compounds (acrylates, methacrylates, and epoxy
acrylates). Peak expiratory flow follow-up showed an occupational effect in the eight
examined patients with diagnosed asthma.
In 2002, Piirila et al. published a follow-up study regarding occupational
respiratory hypersensitivity in dental personnel. The objective of the study was to
evaluate the causes of respiratory hypersensitivity in dental personnel based upon
statistics provided by the Finnish Register of Occupational Diseases (1975-1998) and the
patient material of the Finnish Institute of Occupational Health (1990-1998). Results of
the study found that a total of sixty-four cases of occupational respiratory diseases were
diagnosed in dental personnel during 1975 to 1998. Twenty-eight of the reported cases
were of occupational asthma with eighteen of those caused by methacrylates. The study
showed an increasing frequency of respiratory hypersensitivity among dental personnel
with methacrylates being an important cause of the condition.
Marez et al. (1993) investigated bronchial symptoms and respiratory function in
workers exposed to methyl methacrylate. The study showed that spirometric values at
the start of the work shift were similar in the control group and study group, but a mild
airways obstruction appeared during the work shift. The maximum expiratory flow when
50 percent of the forced vital capacity remained to be exhaled (MEF50) and the ratio of
MEF50 to maximal expiratory flow decreased significantly during the work shift among

48##
exposed workers compared to the controls. It should be noted that the differences
remained the same after adjusting for smoking habits. The results of this study support
the hypothesis that methyl methacrylate can cause pulmonary function disorders and
airway obstruction among exposed workers.
Pickering et al. (1986) evaluated occupational asthma due to methyl methacrylate
in an orthopeadic theatre sister. A fifty-six year old theatre sister who presented with
asthma had worked in an orthopaedic operating theatre for eleven years in which the
mixing process used to make dental implants created a brief period of a high
concentration of methyl methacrylate in the air. Her asthmatic symptoms consistently
resolved when she was absent from work for a period of time. Testing was conducted
and results found that a late asthmatic reaction occurred in the patient after challenge with
methyl methacrylate which resulted in a maximal fall in FEV1 of twenty-five percent.
The authors concluded that brief but repeated exposure to high peak concentrations of
methyl methacrylate which is a known pulmonary sensitizer is undesirable and that the
use of a fume cupboard for the initial mixing process is strongly recommended.
Lozewicz et al. (1985) evaluated occupational asthma due to methyl methacrylate
and cyanoacrylates in seven patients. One of two patients exposed to methyl
methacrylate had an asthmatic reaction. The patient was a dental assistant that produced
paste by mixing polymethyl methacrylate powder with monomethyl methacrylate liquid
for the production of dental prosthetic trays. Inhalation testing included modeling his
exposure at work to methyl methacrylate for twenty minutes, which provoked a fall in
PEF of twenty-four percent. The test was repeated two weeks later and produced similar

49##
immediate asthmatic reaction, which also resolved over a two-hour period. The author’s
conclusion included substitution of less volatile, longer chain alkl cyanoacrylate
homologues as well as the use of appropriate ventilation when using acrylates.
Jerdrychowski et al. (1982) assessed the biological effect of styrene and methyl
methacrylate on the respiratory system in an industrial population. Four hundred and
fifty four males from the exposed group and 683 workers from the control were evaluated
by standardized interviews on chest symptoms and lung function testing. The frequency
of lung obstruction appeared to be more than twice as high among the exposed group
compared to the control group. The exposed group showed much poorer lung function as
well when compared to the control group. The overall results of the study showed that
the harmful effect of styrene and methyl methacrylate on lung function was strong
despite the rather low prevalence of chronic chest symptoms. The results of the study
further support the need for epidemiological evidence aimed at explaining a cause-effect
relationship between low-level concentrations of styrene and methyl methacrylate in the
industrial environment and potential harmful effects.
Due to the potential for occupational exposure to styrene and methyl methacrylate
during the boat manufacturing process, the potential for pulmonary function impairment
among workers exist. Spirometry data provides an opportunity to perform occupational
health surveillance and further determine the potential association between styrene
exposure and pulmonary function impairment as well as develop safe work practices in
this industry with the ultimate goal of reducing chemical exposure.

50##
4.2 Utilities
In Florida, fossil fuel power generation is used to provide electricity to sustain
commercial, agricultural, and residential needs. Operations involved in these power
plants include coal handling, boiler-turbine operation, and routine maintenance. Utility
workers that perform these operations have the potential to be exposed to chemicals in
the workplace that can affect pulmonary function. For example, coal handling includes
coal receiving, storage, and recovery for fueling the turbine generator units and leads to
certain tasks which are associated with high coal dust air levels and require respiratory
protection (Jackson, 1998).
During boiler maintenance, cleaning, and repair, utility workers can be exposed to
fossil fuel ash particles. Hauser et al. (2001) conducted a two-year longitudinal study of
lung function among 118 boilermakers and found that working at gas, oil, and coal-fired
plants is associated with an annual loss in FEV1.
Bridbord et al. (1979) identified a number of irritants, vesicants, and fibrogens
within coal-fired power plants which included sulfur dioxide (SO2), SO2 reaction
products, nitrogen oxide (NO), nitrogen dioxide (NO2), fly ash, aldehydes, coal dust, and
asbestos. Potential sources of these chemicals included boiler leaks, flue gas leaks, stack
emissions, all stages of coal handling, and insulation material. Over sixty-five percent of
SO2 released to the air, or more than thirteen million tons per year, comes from electric
utilities, especially those that burn coal (Scientific Committee on Occupational Exposure
Limits, 2008). NIOSH (1978) has identified SO2 as a respiratory irritant and indicates
that studies have shown increased pulmonary resistance at various concentrations.

51##
Asbestos is another airborne risk that electric utility workers encounter during
routine maintenance. Vathesatogkit et al. (2004) conducted a study related to asbestos
exposure by using subjects recruited from Consolidated Edison, which is an electric
utility located in New York City. In regard to pulmonary function, the study concluded
that in individuals with a history of asbestos exposure, the presence of asbestos bodies in
BAL cells is associated with a higher prevalence of parenchymal abnormalities,
respiratory symptoms, and a reduction in pulmonary function.
Utility workers also have the potential to be exposed to polychlorinated biphenyl
(PCB) when working with transformers and capacitors. Warshaw et al. (1979) found a
decrease in vital capacity in PCB-exposed workers in a capacitor manufacturing facility.
This finding indicates the potential for compromise in pulmonary function after PCB
exposure.
Due to the potential for occupational exposure of electrical utility workers during
fossil fuel power generation and routine maintenance to a variety of chemicals that may
decrease pulmonary function, spirometry data provides an opportunity to perform
occupational health surveillance and evaluate safe work practices in this industry with the
ultimate goal of reducing chemical exposure.
4.3 First Responders
First responders are exposed to a variety of fumes, gases, and particulates during
the course of their job. They often disregard the risk of chemical exposure in order to
attend to injured victims and/or contain the release. Consider the first responders that

52##
were on the scene after the collapse of the World Trade Center. They encountered high
levels of airborne pollutants and have since reported respiratory symptoms and developed
pulmonary function abnormalities. Banauch et al. (2006) found that World Trade
Center–exposed workers experienced a substantial reduction in adjusted average FEV1
during the year after 09/11/2001 and that this exposure-related FEV1 decrement equaled
twelve years of aging-related FEV1 decline.
First responders include fire fighters, police, and emergency medical personnel.
All of theses occupations are physically demanding and challenging, with potential for
exposing workers to toxic agents in a dynamic and uncontrolled environment. For
example, toxic chemicals emitted as a result of incomplete combustion and pyrolysis
include hydrochloric acids, carbon monoxide, vinyl chloride, hydrogen sulfide, etc.
(Becker, 1985). These chemicals have the potential to cause pulmonary function
impairment if exposures are not properly controlled. Burgess et al. (2001) state:
Occupational smoke exposure may result in acute adverse health effects,
particularly during periods when respiratory protection is not worn. These
changes include transient reductions in spirometric measurements and increased
airway reactivity. Chronic respiratory effects may also occur, although the
increased use of respiratory protection appears to have had a beneficial effect.
Musk et al. (1979) found that following smoke exposure, the average decrease in
FEV1 was 0.05 liters among firefighters and that this decline in FEV1 was related to the
severity of smoke exposure as estimated by the firefighter and to the measured particulate
concentration of the smoke to which he was exposed. In addition, the effect of

53##
pulmonary function impairment following exposure to house fires has shown a decrease
in FEV1 with a small subgroup of firefighters who develop more substantial and
potentially clinically important decreases in pulmonary function after smoke exposure
(Large, 1990).
Chattopadhyay et al. (2004) conducted a study on the effect of respiratory
function of firefighters as a result of a chemical warehouse fire and found restrictive,
obstructive and combined restrictive and obstructive types of pulmonary dysfunction as a
result of exposure. Research conducted by Sparrow et al. (1982) also found that
firefighters had a greater loss of pulmonary function (FVC and FEV1) than non-
firefighters, which confirm earlier reports of a chronic effect of firefighting on pulmonary
function and suggest an association of this occupation with increased respiratory
symptoms and disease.
Burgess et al. (2001) evaluated adverse respiratory effects following overhaul in
firefighters. A total of fifty-one firefighters were monitored for exposure to products of
combustion to determine any changes in spirometric measurements and lung
permeability. Approximately half of the firefighters in the study wore no respiratory
protection during overhaul while the other half wore cartridge respirators. The results of
the study revealed acute changes in spriometric measurements and lung permeability
following firefighter overhaul even in those participants wearing full-face cartridge
respirators. Changes in FEV1 were associated with levels of specific products of
combustion, demonstrating a dose-response relationship. Based on the results of the

54##
study, the authors recommend that a self-contained breathing apparatus continue to be
used during overhaul.
First responders are potentially exposed to a variety of chemicals in uncontrolled
situations that could affect pulmonary function. Spirometry data provides an opportunity
to perform occupational health surveillance to evaluate pulmonary function impairment
as well develop safe work practices in this industry with the ultimate goal of reducing
chemical exposure.

55##
Chapter 5
Methods
5.1 Study Population
A record review was conducted on pulmonary function tests from the workers of
boat manufacturing companies, electric utility companies, and first responders in the state
of Florida. Inclusion criteria included any worker over the age of eighteen whose
respirator use required pulmonary function testing. Records included data for principal
confounding factors regarding pulmonary function outcomes including smoking history,
age, gender, and height.
A standard population for comparison consisted of the NHANES III Raw
Spirometry cohort, which consists of pulmonary function tests for 16,606 individuals
sampled in the United States. The Raw Spirometry file was merged by respondent
identification number with the NHANES III Household Adult Data file to obtain
demographic and behavioral confounder data. The NHANES III control population was
further restricted by age to reflect the age range of the study population and unacceptable
tests were removed from analysis by technician quality code. Record reviews were
approved under the University of South Florida Institutional Review Board (IRB) #
00001348. A copy of the IRB approval letter is presented in Appendix I.

56##
5.2 Pulmonary Function
All study population pulmonary function testing was conducted using the Koko
spirometry system. The best attempt of a minimum of three spirometry trials was used
for analysis in both the study population and the control population. The pulmonary
function test outcomes used for analysis included FEV1 and FVC. All spirograms were
reviewed by a licensed physician and spirograms not meeting American Thoracic Society
acceptability and reproducibility criteria presented in Table 4 were removed from
analysis.
Table 4: American Thoracic Society Acceptability and Reproducibility Criteria
ACCEPTABILITY CRITERIA
Good start-of-test: • Extrapolated volume is less than 5% of FVC or 0.15 L, whichever is greater; • No hesitation or false start; • A rapid start to rise time; • No cough, especially during the first second on the maneuver; • No early termination of exhalation; • A minimum exhalation time of 6 seconds is recommended, unless there is an
obvious plateau of reasonable duration or the subject cannot or should not continue to exhale further;
• No maneuver should be eliminated solely because of early termination. REPRODUCIBILITY CRITERIA After three acceptable spirograms have been obtained, apply the following tests:
• Are the two largest FVCs within 0.2L of each other? • Are the two largest FEV1s within 0.2L of each other?
Number of trials: • A minimum of 3 acceptable FVC maneuvers should be performed. • If a subject is unable to perform a single acceptable maneuver after 8 attempts,
testing may be discontinued. However, after additional instruction and demonstration, more maneuvers may be performed depending on the subject’s clinical condition and tolerance.
(Adapted from American Association for Respiratory Care. AARC Clinical Practice Guideline: Spirometry, 1996 Update. Respiratory Care, Volume 41, Number 7, 629-636)

57##
5.3 Statistical Analysis
The role of statistical analysis in research is vital because it gives meaning to the
data that is collected. The goal in any data analysis is to extract from raw information the
accurate estimation (Alexopoulos, 2010). The appropriate statistical tests chosen for this
research are described in the paragraphs below.
To determine if the worker population experienced abnormal pulmonary function
compared to the standard population, mean values were produced for FEV1 and FVC and
the significance of the differences were evaluated using the students t-test. These
analyses were further stratified by median age, median height, gender, and smoking
history. To determine which factors were most predictive of pulmonary function,
multivariate linear regression analysis was performed for the outcomes of FEV1 and
FVC. Linear regression is the procedure that estimates the coefficients of the linear
equation, involving one or more independent variables that best predict the value of the
dependent variable which should be quantitative (Alexopoulos, 2010). Multivariate
analysis evaluated the following variables as predictors of pulmonary function outcomes:
age, gender, height, pack-years of smoking, and status as a worker.
There is currently an active debate regarding the use of the FEV1/FVC ratio as a
definitive criterion for the diagnosis of obstructive disorders, but it is generally
acknowledged that lowered FEV1/FVC ratio is indicative of obstruction when taken into
context with other pulmonary function testing data for the individual and patient
demographics (Mohamed, 2011). This research evaluated the study population for
deficits at the higher end of the normal FEV1/FVC range, 0.80. A categorical approach

58##
was used to evaluate potential pre-clinical pulmonary obstruction using logistic
regression to evaluate associations with producing an abnormal FEV1/FVC ratio, defined
as less than 0.80. Logistic regression coefficients can be used to estimate odds ratios for
each of the independent variables in the model (Alexopoulos, 2010). Categories for
independent variables were defined as above and below median height and median age,
females vs. males, nonsmokers vs. those with a smoking history. Statistical significance
was determined by a p-value less than 0.05 for all analytical tests. All statistical analyses
were performed using SAS version 9.1.2.

59##
Chapter 6
Pulmonary Function Testing in Boat Manufacturer Workers
6.1 Data Source
A record review was conducted on seventy-five pulmonary function tests from the
workers of three boat manufacturing companies in the state of Florida based upon the
inclusion criteria provided in the Chapter 5.1. Restriction of the NHANES III data and
removal of unacceptable spirometry tests resulted in a final control population of 4,729
subjects.
6.2 Results
6.2.1 Univariate Analysis
The population demographics for both the study population (boat manufacturer
workers) and the NHANES III segment used for analysis are reported in Table 5. The
study population was largely male and approximately forty-one percent had a history of
tobacco smoking. The study population was somewhat younger overall, compared to the
NHANES III median age.
Figure 6 provides the results of means testing for FEV1 and FVC comparing the
total study population to the NHANES III segment. The study population demonstrated a
modestly higher mean FEV1, while no statistically significant differences were found

60##
between mean FVC values when comparing the populations as a whole. The differences
in age and disproportionate gender represented in the study population necessitated the
use of stratified analysis to determine the effect of these population differences on
evaluating the effect of boat manufacturer worker status on pulmonary function.
Stratification by age (below median), height, and smoking status yielded
statistically significant larger mean values for FEV1 and FVC measurements for the
study population. When analyzing females and those at or above median age, no
statistically significant differences were found. The results of the analysis are reported in
Figures 7 through 14.
Table 5: Summary of Study Population and NHANES III Control Population
Study Population NHANES III
Total population n = 75 4,729
Males n = 66 3,446
Females n = 9 1,283
Smoking History (YES) 31 2,897
Smoking History (NO) 44 1,832
Median Height (Inches) 67 69
Median Age (Years) 29 40

61##
Figure 6: Pulmonary Function Mean for the Total Population. Bolded values are statistically significant.
3.88
4.97
3.56
4.5
0#
1#
2#
3#
4#
5#
6#
FEV1#(Liters)# FVC#(Liters)#
Study#Popula>on#
NHANES#III#
95%
CI =
3.7
1 - 4
.01
95%
CI =
3.5
4 - 3
.58
p-va
lue
= 0.
0004
95%
CI =
4.7
4 - 5
.19
95%
CI 4
.48
– 4.
33
p-va
lue
= 0.
9606
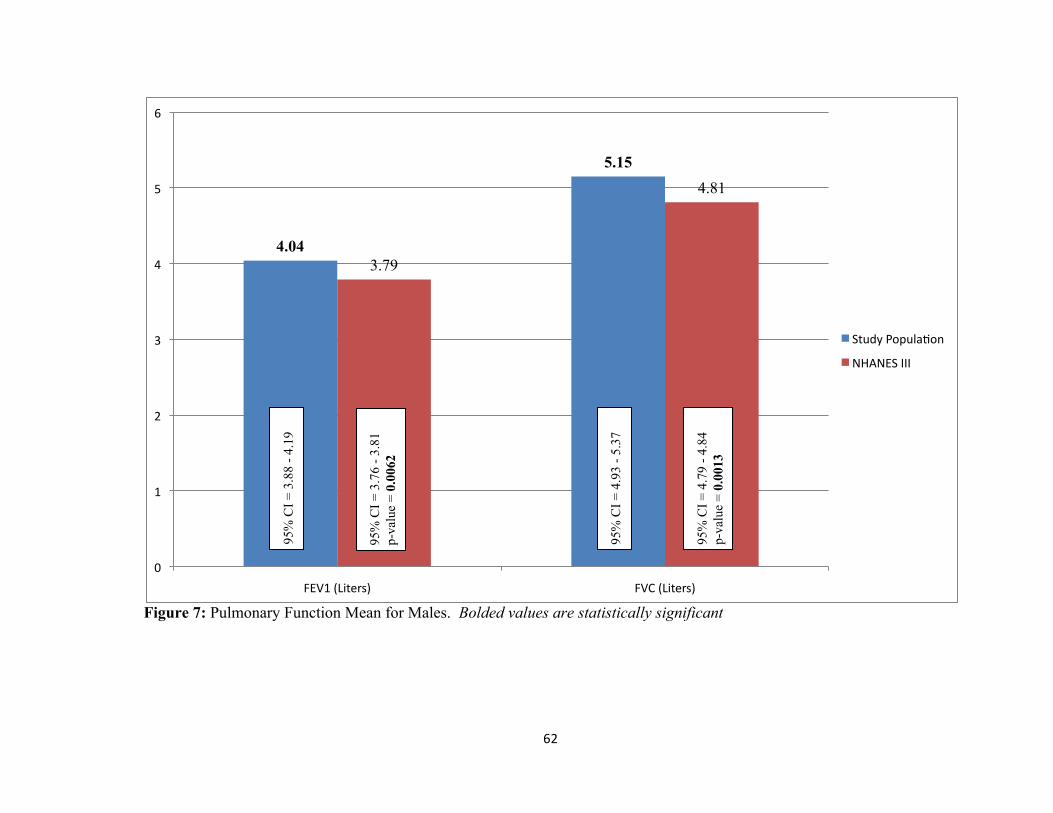
62##
Figure 7: Pulmonary Function Mean for Males. Bolded values are statistically significant
4.04
5.15
3.79
4.81
0#
1#
2#
3#
4#
5#
6#
FEV1#(Liters)# FVC#(Liters)#
Study#Popula>on#
NHANES#III#
95%
CI =
3.8
8 - 4
.19
95%
CI =
3.7
6 - 3
.81
p-va
lue
= 0.
0062
95%
CI =
4.9
3 - 5
.37
95%
CI =
4.7
9 - 4
.84
p-va
lue
= 0.
0013
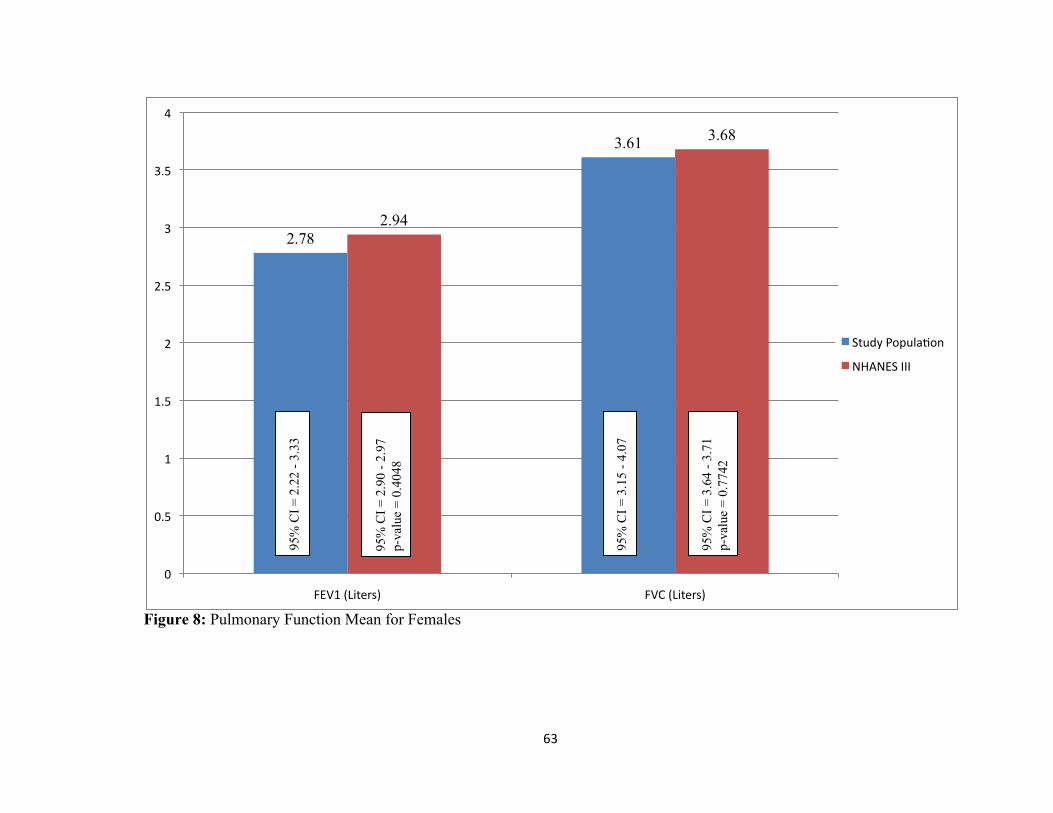
63##
Figure 8: Pulmonary Function Mean for Females
2.78
3.61
2.94
3.68
0#
0.5#
1#
1.5#
2#
2.5#
3#
3.5#
4#
FEV1#(Liters)# FVC#(Liters)#
Study#Popula>on#
NHANES#III#
95%
CI =
2.2
2 - 3
.33
95%
CI =
2.9
0 - 2
.97
p-va
lue
= 0.
4048
95%
CI =
3.1
5 - 4
.07
95%
CI =
3.6
4 - 3
.71
p-va
lue
= 0.
7742

64##
Figure 9: Pulmonary Function Mean for Smoking History (YES). Bolded values are statistically significant.
3.88
5.03
3.54
4.55
0#
1#
2#
3#
4#
5#
6#
FEV1#(Liters)# FVC#(Liters)#
Study#Popula>on#
NHANES#III#
95%
CI =
3.5
8 - 4
.17
95%
CI =
3.5
0 - 3
.56
p-va
lue
= 0.
0163
95%
CI =
4.6
5 - 5
.42
95%
CI =
4.5
1 - 4
.58
p-va
lue
= 0.
0035

65##
Figure 10: Pulmonary Function Mean for Smoking History (NO). Bolded values are statistically significant
3.89
4.92
3.59
4.44
0#
1#
2#
3#
4#
5#
6#
FEV1#(Liters)# FVC#(Liters)#
Study#Popula>on#
NHANES#III#
95%
CI =
3.6
7 - 4
.11
95%
CI =
3.5
6 - 3
.63
p-va
lue
= 0.
0139
95%
CI =
4.6
3 - 5
.21
95%
CI =
4.4
0 - 4
.48
p-va
lue
= 0.
0012

66##
Figure 11: Pulmonary Function Mean for Height At or Above Median (67 inches). Bolded values are statistically significant.
4.11
5.21
3.66
4.64
0#
1#
2#
3#
4#
5#
6#
FEV1#(Liters)# FVC#(Liters)#
Study#Popula>on#
NHANES#III#
95%
CI =
3.9
1 - 4
.30
95%
CI =
3.6
4 - 3
.69
p-va
lue
= 0.
0002
95%
CI =
4.9
3 - 5
.50
95%
CI =
4.6
2 - 4
.67
p-va
lue
= <0
.000
1
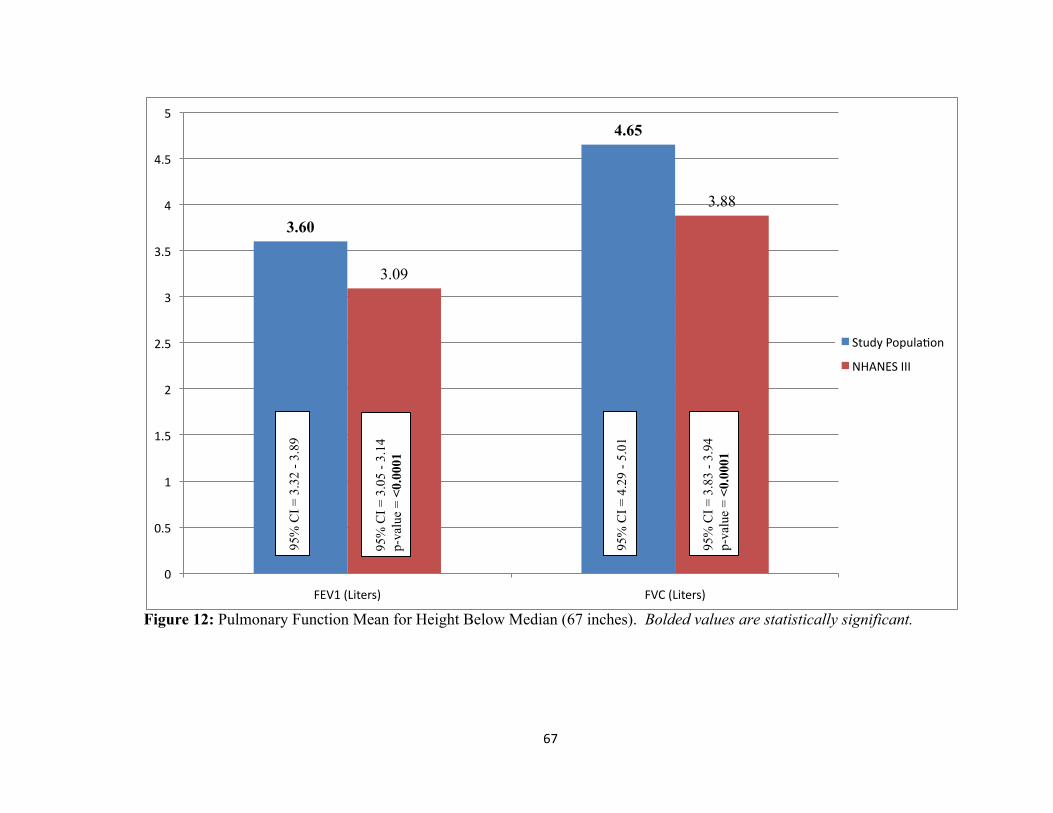
67##
Figure 12: Pulmonary Function Mean for Height Below Median (67 inches). Bolded values are statistically significant.
3.60
4.65
3.09
3.88
0#
0.5#
1#
1.5#
2#
2.5#
3#
3.5#
4#
4.5#
5#
FEV1#(Liters)# FVC#(Liters)#
Study#Popula>on#
NHANES#III#
95%
CI =
3.3
2 - 3
.89
95%
CI =
3.0
5 - 3
.14
p-va
lue
= <0
.000
1
95%
CI =
4.2
9 - 5
.01
95%
CI =
3.8
3 - 3
.94
p-va
lue
= <0
.000
1

68##
Figure 13: Pulmonary Function Mean for Age at or Above Median (29 years)
3.62
4.66
3.53
4.49
0#
0.5#
1#
1.5#
2#
2.5#
3#
3.5#
4#
4.5#
5#
FEV1#(Liters)# FVC#(Liters)#
Study#Popula>on#
NHANES#III#
95%
CI =
3.4
1 - 3
.83
95%
CI =
3.5
1 - 3
.56
p-va
lue
= 0.
4783
95%
CI =
4.3
9 - 4
.93
95%
CI =
4.4
6 - 4
.52
p-va
lue
= 0.
2286

69##
Figure 14: Pulmonary Function Mean for Age Below Median (29 years). Bolded values are statistically significant
4.28
5.43
3.88
4.70
0#
1#
2#
3#
4#
5#
6#
FEV1#(Liters)# FVC#(Liters)#
Study#Popula>on#
NHANES#III#
95%
CI =
4.0
5 - 4
.53
95%
CI =
3.8
0 - 3
.96
p-va
lue
= 0.
0049
95%
CI =
5.0
7 - 5
.78
95%
CI =
4.6
0 - 4
.80
p-va
lue
= <0
.000
1

70##
6.2.2 Multivariate Analysis
Multivariate analysis was conducted by constructing linear regression models
including all data elements known to impact pulmonary function including age, height,
gender, and smoking history. The parameter estimates identify the magnitude of effect
each predictor has on either increasing or decreasing pulmonary function in the total
population. Statistically significant predictors were identified as having a p-value less
than 0.05. The results of the linear regression analysis for FEV1 are reported in Table 6.
The analysis identified age, height, gender, and smoking pack-years as statistically
significant predictors of FEV1. The adjusted outcome for status as a boat manufacturer
worker was not a statistically significant predictor of FEV1.
The results of the linear regression analysis for FVC are reported in Table 7. The
analysis identified age, height, gender, but not smoking pack-years as statistically
significant predictors of FVC. The adjusted outcome for status as a boat manufacturer
worker was also a significant predictor of FVC in this analysis. With a parameter
estimate of 0.2957, status as a boat manufacturer conferred a modest increase to FVC
compared to the control population.
Logistic regression analysis was used to determine the effect of pulmonary
function predictors on generating an FEV1/FVC ratio less than 0.80 (Table 8). From this
analysis, two statistically significant factors impacted the FEV1/FVC ratio: age and
smoking history. Height, gender, and status as a boat manufacturer worker were not
associated with the production of a FEV1/FVC ratio less than 0.80. Those in the
population over the median age for boat manufacturer workers (29) were approximately

71##
twice as likely to produce an FEV1/FVC ratio less than 0.80. Similarly, those with no
smoking history were nearly half as likely to produce an FEV1/FVC ratio less than 0.80.
Table 6: Predictors of FEV1 from Linear Regression Analysis
FEV1 Predictor Parameter Estimate Standard Error p-value Age at test -0.0394 0.0017 <0.0001 Height at test (in) 0.0829 0.0057 <0.0001 Gender (females vs. males) -0.6491 0.0376 <0.0001 Smoking History (pk-yrs) -0.0034 0.0011 0.0030 Boat Manufacturer Status 0.1077 0.0706 0.1276 Bolded values are statistically significant.
Table 7: Predictors of FVC from Linear Regression Analysis FVC Predictor Parameter Estimate Standard Error p-value Age at test -0.0328 0.0021 <0.0001 Height at test (in) 0.1063 0.0070 <0.0001 Gender (females vs. males) -0.8538 0.0461 <0.0001 Smoking History (pk-yrs) 0.0023 0.0014 0.0951 Boat Manufacturer Status 0.2957 0.0865 0.0006 Bolded values are statistically significant.
Table 8: Logistic Regression Analysis of FEV1/FVC to Examine the Effect of Predictors on Producing an Abnormal Ratio (<0.80 FEV1/FVC) FEV1/FVC <0.80 Predictor Odds Ratio 95% Confidence Limit Age above median >29 years 2.16 1.82 – 2.56 Height above median >67 inches 1.11 0.97 – 1.27 Gender (females vs. males) 0.92 0.80 – 1.07 Smoking History (effect on non-smoking) 0.55 0.48 – 0.62 Boat Manufacturer Status 0.96 0.59 – 1.56 Bolded values are statistically significant.

72##
6.3 Discussion
This research examined the feasibility of conducting a cross sectional surveillance
evaluation of workers in the boat manufacturing industry from three boat manufacturing
facilities in the state of Florida, which had maintained records of pulmonary function
testing for workers required to use respiratory protection. Statistical comparisons
between the occupational population and the NHANES III population segment, limited
by age and height to reflect the occupational population’s demographics, demonstrated
the putative factors that altered pulmonary function in our population of interest.
The results of this research indicated that the boat manufacturer workers
experienced a modest, but statistically significant, increase in FEV1 mean values over the
NHANES III population in both total and stratified analyses, including stratification by
gender, age, height, and smoking history. While the analysis of the total population for
FVC mean values did not demonstrate a difference from the control population, stratified
analyses demonstrated modest, significant increases in mean FVC for some stratified
analyses by gender, age, height, and smoking history. No analysis that examined mean
values demonstrated better pulmonary function in the control group versus the target
worker population.
In the linear regression analysis performed to examine the effect of salient
cofactors on pulmonary function, FEV1 analysis demonstrated that age, height, gender,
and smoking pack-years all significantly affected pulmonary function of the population in
the expected direction. That is to say, increased age, female gender, and increased pack-
years of smoking decreased FEV1, while increased height increased FEV1. Status as a

73##
boat manufacturer worker was not found to have a statistically significant effect on
FEV1.
Similar results were reported for the analysis of FVC, with the exception of pack-
year history of smoking, which did not demonstrate statistical significance in this
analysis. As well, status as a boat manufacturer worker conferred a modest, significant
increase in FVC. The results of the linear regression analysis for FEV1 and FVC
outcomes indicate that the predominate factors that affect pulmonary function values are
those traditionally known to impact lung volume and clearance, e.g. age, height, gender,
and smoking history. A modest positive effect on FVC was observed for boat
manufacturer workers in both the stratified analysis, as well as the linear regression
analysis. This may indicate the presence of the ‘healthy worker effect’ in the
occupational population related to more time spent in active labor compared to the
NHANES III population which may contain unemployed persons or those engaged in
more sedentary labor.
Logistic regression was performed for the outcome of the FEV1/FVC ratio to
evaluate the potential for obstructive disorders among the target occupational population
compared to the NHANES III population. A cutoff point of less than 0.80 FEV1/FVC
was used to classify persons with abnormal FEV1/FVC values that could potentially be
an indicator of pre-clinical pulmonary obstruction. In this analysis, status as a boat
manufacturer worker was not significantly associated with an FEV1/FVC value of less
than 0.80. However, the analysis clearly demonstrated that the older half of the
population was twice as likely to produce a lower FEV1/FVC ratio, and non-smokers

74##
were half as likely to produce a lower FEV1/FVC ratio compared to the smokers in the
population.
Through the use of OSHA mandated pulmonary function testing and the available
NHANES III spirometry data set, this study was able to efficiently evaluate the
pulmonary health of a substantive cross section of a specific industry: boat manufacturer
workers. The data collected in both the OSHA mandated testing and the NHANES III
spirometry data allows for the control of confounding factors that impact measures of
pulmonary function so that statistical comparisons can identify deficits in pulmonary
function and indicate whether or not those deficits are associated with an occupational
sector. This research did not identify any pulmonary function deficits in the target
occupational population and it demonstrated that in all cases boat manufacturer workers
had equivalent or modestly superior pulmonary function compared to a baseline
population.

75##
Chapter 7
Pulmonary Function Testing in Utility Workers
7.1 Data Source
A record review was conducted on 227 pulmonary function tests from a
population currently employed as utility workers in the state of Florida based upon the
inclusion criteria provided in Chapter 5.1. Restriction of the NHANES III data and
removal of unacceptable spirometry tests resulted in a final control population of 4,958
subjects. There were only two females in the worker population; therefore females were
removed from both the worker and NHANES III population for analysis.
7.2 Results
7.2.1 Univariate Analysis
The population demographics for both the study population (utility workers) and
the NHANES III segment used for analysis are reported in Table 9. Approximately
forty-one percent of the study population had a history of tobacco smoking and was
slightly older overall, compared to the NHANES III mean age.
Figure 15 provides the results of means testing for FEV1 and FVC comparing the
total study population to the NHANES III segment. The study population demonstrated
modestly higher (statistically significant) mean values for FEV1 and FVC when

76##
compared to the NHANES III control population. The difference in age represented in
the study population necessitated the use of stratified analysis to determine the effect of
the population difference on evaluating the effect of utility worker status on pulmonary
function.
No significant differences were found between mean pulmonary function test
values of utility workers and NHANES III study subjects when stratified by age, height,
and smoking status except among older utility workers, who demonstrated modestly
better pulmonary function values compared to their NHANES III counterparts. The
results of the analysis are reported in Figures 15 through 21.
Table 9: Summary of Study Population and NHANES III Control Population
Study Population NHANES III
Total population n = 225 4958
Males n = 225 4958
Females n = 0 0
Smoking History (YES) 93 3144
Smoking History (NO) 132 1814
Mean Height (Inches) 70 69
Mean Age (Years) 45 41

77""
Figure 15: Pulmonary Function Mean for the Total Population. Bolded values are statistically significant.
3.81
4.85
3.71
4.70
0"
1"
2"
3"
4"
5"
6"
FEV1"(Liters)" FVC"(Liters)"
Study"Popula?on"
NHANES"III"
95%
CI =
3.7
1 - 3
.91
95%
CI =
3.6
9 - 3
.73
p-va
lue
= 0.
0359
95%
CI =
4.7
3 - 4
.96
95%
CI =
4.6
8 - 4
.73
p-va
lue
= 0.
0189

78""
Figure 16: Pulmonary Function Mean for Smoking History (YES)
3.65
4.73
3.61
4.65
0"
0.5"
1"
1.5"
2"
2.5"
3"
3.5"
4"
4.5"
5"
FEV1"(Liters)" FVC"(Liters)"
Study"Popula?on"
NHANES"III"
95%
CI =
3.4
9 - 3
.81
95%
CI =
3.5
8 - 3
.63
p-va
lue
= 0.
5815
95%
CI =
4.5
4 - 4
.92
95%
CI =
4.6
2 - 4
.68
p-va
lue
= 0.
3965

79""
Figure 17: Pulmonary Function Mean for Smoking History (NO)
3.93
4.93
3.88
4.80
0"
1"
2"
3"
4"
5"
6"
FEV1"(Liters)" FVC"(Liters)"
Study"Popula?on"
NHANES"III"
95%
CI =
3.8
1 - 4
.04
95%
CI =
3.8
5 - 3
.92
p-va
lue
= 0.
5304
95%
CI =
4.7
8 - 5
.07
95%
CI =
4.7
6 - 4
.84
p-va
lue
= 0.
0963

80""
Figure 18: Pulmonary Function Mean for Height At or Above Median (70 inches)
3.99
5.08
3.94
5.04
0"
1"
2"
3"
4"
5"
6"
FEV1"(Liters)" FVC"(Liters)"
Study"Popula?on"
NHANES"III"
95%
CI =
3.8
8 - 4
.10
95%
CI =
3.9
1 - 3
.97
p-va
lue
= 0.
4511
95%
CI =
4.9
5 - 5
.21
95%
CI =
5.0
0 - 5
.07
p-va
lue
= 0.
5358

81""
Figure 19: Pulmonary Function Mean for Height Below Median (70 inches)
3.43
4.33
3.51
4.42
0"
0.5"
1"
1.5"
2"
2.5"
3"
3.5"
4"
4.5"
5"
FEV1"(Liters)" FVC"(Liters)"
Study"Popula?on"
NHANES"III"
95%
CI =
3.2
8 - 3
.58
95%
CI =
3.4
9 - 3
.54
p-va
lue
= 0.
3402
95%
CI =
4.1
5 - 4
.52
95%
CI =
4.3
9 - 4
.45
p-va
lue
= 0.
3426

82""
Figure 20: Pulmonary Function Mean for Age At or Above Median (46 years). Bolded values are statistically significant.
3.63
4.65
3.18
4.28
0"
0.5"
1"
1.5"
2"
2.5"
3"
3.5"
4"
4.5"
5"
FEV1"(Liters)" FVC"(Liters)"
Study"Popula?on"
NHANES"III"
95%
CI =
3.5
0 - 3
.76
95%
CI =
3.1
5 - 3
.22
p-va
lue
= <0
.000
1
95%
CI =
4.5
0 - 4
.80
95%
CI =
4.2
4 - 4
.32
p-va
lue
= <0
.000
1

83""
Figure 21: Pulmonary Function Mean for Age Below Median (46 years)
4.01
5.06
3.98
4.92
0"
1"
2"
3"
4"
5"
6"
FEV1"(Liters)" FVC"(Liters)"
Study"Popula?on"
NHANES"III"
95%
CI =
3.8
8 - 4
.15
95%
CI =
3.9
6 - 4
.00
p-va
lue
= 0.
5961
95%
CI =
4.8
8 - 5
.24
95%
CI =
4.9
0 - 4
.95
p-va
lue
= 0.
0848

84##
7.2.2 Multivariate Analysis
Multivariate analysis was conducted by constructing linear regression models
including all data elements known to impact pulmonary function including age, height,
and smoking history. The parameter estimates identify the magnitude of effect each
predictor has on either increasing or decreasing pulmonary function in the total
population. Statistically significant predictors were identified as having a p-value less
than 0.05. The results of the linear regression analysis for FEV1 are reported in Table 10.
The analysis identified age, height, pack-years of smoking, and utility worker status as
statistically significant predictors of FEV1.
The results of the linear regression analysis for FVC are reported in Table 11.
The analysis identified age and height, but not smoke pack-years as statistically
significant predictors of FVC. The adjusted outcome for status as a utility worker was
also a significant predictor of FVC in this analysis. With a parameter estimate of 0.2460,
status as a utility worker conferred a modest increase to FVC compared to the control
population.
Logistic regression analysis was used to determine the effect of pulmonary
function predictors on generating an FEV1/FVC ratio less than 0.80 (Table 12). From
this analysis, three statistically significant factors impacted the FEV1/FVC ratio: age,
height, and smoking history. Status as a utility worker was not associated with the
production of a FEV1/FVC ratio less than 0.80. Those in the population over the median
age for utility workers (forty-six) were approximately four times as likely to produce an
FEV1/FVC ratio less than 0.80. Those in the population over the median height for

85##
utility workers (seventy-one) were approximately one and a half times as likely to
produce an FEV1/FVC ratio less than 0.80. Similarly, those with no smoking history
were nearly half as likely to produce an FEV1/FVC ratio less than 0.80.
Table 10: Predictors of FEV1 from Linear Regression Analysis
FEV1 Predictor Parameter Estimate Standard Error p-value Age at test -0.03842 0.00141 <0.0001 Height at test (in) 0.08397 0.00486 <0.0001 Smoking History (pk-yrs) -0.00314 0.00107 0.0034 Utility Worker Status 0.30053 0.04526 <0.0001 Bolded values are statistically significant.
Table 11: Predictors of FVC from Linear Regression Analysis FVC Predictor Parameter Estimate Standard Error p-value Age at test -0.03168 0.00169 <0.0001 Height at test (in) 0.11685 0.00583 <0.0001 Smoking History (pk-yrs) 0.00199 0.00128 0.1221 Utility Worker Status 0.24602 0.05425 0.0006 Bolded values are statistically significant.
Table 12: Logistic Regression Analysis of FEV1/FVC to Examine the Effect of Predictors on Producing an Abnormal Ratio (<0.80 FEV1/FVC) FEV1/FVC <0.80
Predictor Odds Ratio 95% Confidence Limit Age above median >29 years 3.86 3.39 – 4.40 Height above median >67 inches 1.48 1.30 – 1.70 Smoking History (effect on non-smoking) 0.57 0.51 – 0.65 Utility Worker Status 1.30 0.97 – 1.74 Bolded values are statistically significant.

86##
7.3 Discussion
This research examined the feasibility of conducting a cross sectional surveillance
evaluation of workers in the utility industry from seven utility facilities in the state of
Florida, which had maintained records of pulmonary function testing for workers
required to use respiratory protection. Statistical comparisons between the occupational
population and the NHANES III population segment, limited by age and height to reflect
the occupational population’s demographics, demonstrated the putative factors that
altered pulmonary function in the population of interest.
The results of this research indicated that the utility workers experienced a
modest, but statistically significant, increase in FEV1 and FVC compared to the
NHANES III population for the total analysis. No significant differences were found
between mean pulmonary function test values of utility workers and NHANES III study
subjects when stratified by age, height, and smoking status except among older utility
workers, who demonstrated modestly better FEV1 and FVC values compared to the study
population.
In the linear regression analysis performed to examine the effect of salient
cofactors on pulmonary function, FEV1 analysis demonstrated that age, height, smoking
history, and utility worker status significantly affected pulmonary function. As expected,
increased age and increased pack-years of smoking decreased FEV1, while increased
height increased FEV1. The results of this analysis also revealed that status as a utility
worker was associated with a significant increase in FEV1.

87##
Similar results were reported for the analysis of FVC, with the exception of
smoking history, which did not demonstrate statistical significance in this analysis. As
with FEV1, status as a utility worker conferred a modest, significant increase in FVC.
The results of the linear regression analysis for FEV1 and FVC outcomes indicate that the
predominate factors that affect pulmonary function values are those traditionally known
to impact lung volume and clearance, e.g. age, height, and smoking history. A modest
positive effect on FEV1 and FVC was observed for utility workers in both the stratified
analysis, as well as the linear regression analysis. This may indicate the presence of the
‘healthy worker effect’ in the occupational population related to more time spent in active
labor compared to the NHANES III population which may contain unemployed persons
or those in more sedentary labor.
Logistic regression was performed for the outcome of the FEV1/FVC ratio to
evaluate the potential for obstructive disorders among the target occupational population
compared to the NHANES III population. A cutoff point of less than 0.80 FEV1/FVC
was used to classify persons with abnormal FEV1/FEV values that could potentially be
an indicator of pre-clinical pulmonary obstruction. In this analysis, status as a utility
worker was not significantly associated with an FEV1/FVC value of less than 0.80.
However, the analysis clearly demonstrated that the older half of the population and those
above the median height were more likely (odds ratio of 3.86 and 1.48 respectively) to
produce a lower FEV1/FVC ratio, and non-smokers were approximately half as likely to
produce a lower FEV1/FVC ratio compared to the smokers in the population.

88##
Through the use of OSHA mandated pulmonary function testing and the available
NHANES III spirometry data set, this study was able to efficiently evaluate the
pulmonary health of a substantive cross section of a specific industry: utility workers.
The data collected in both the OSHA mandated testing and the NHANES III spirometry
data allows for the control of confounding factors that impact measures of pulmonary
function so that statistical comparisons can identify deficits in pulmonary function and
indicate whether or not those deficits are associated with an occupational sector. This
research did not identify any pulmonary function deficits in the target occupational
population and it demonstrated that in all cases, electric utility workers had equivalent or
modestly superior pulmonary function compared to a baseline population.

89##
Chapter 8
Pulmonary Function Testing in Emergency Responders
8.1 Data Source
A record review was conducted on 127 pulmonary function tests from emergency
responders in the state of Florida based upon the inclusion criteria provided in Chapter
5.1. Restriction of the NHANES III data and removal of unacceptable spirometry tests,
resulted in a final control population of 9,792 subjects.
8.2 Results
8.2.1 Univariate Analysis
The population demographics for both the study population (emergency
responders) and the NHANES III segment used for analysis are reported in Table 13.
The study population was largely male and approximately 16 percent had a history of
tobacco smoking. The study population was slightly younger and taller overall,
compared to the NHANES III mean age and height.
Figure 22 provides the results of means testing for FEV1 and FVC comparing the
total study population to the NHANES III segment. The study population demonstrated
modestly higher mean FEV1 and FVC values when comparing the populations as a
whole. The differences in age and disproportionate gender represented in the study

90##
population necessitated the use of stratified analysis to determine the effect of these
population differences on evaluating the effect of emergency worker status on pulmonary
function.
Stratification by age, gender, height and smoking history yielded statistically
significant larger mean values for FEV1 and FVC measurements for the study
population. The results of the analysis are reported in Figures 23 through 30.
Table 13: Summary of Study Population and NHANES III Control Population
Study Population NHANES III
Total population n = 127 9792
Males n = 105 4659
Females n = 22 5133
Smoking History (YES) 20 5176
Smoking History (NO) 107 4616
Mean Height (Inches) 69 66
Mean Age (Years) 38 40

91##
Figure 22: Pulmonary Function Mean for the Total Population. Bolded values are statistically significant.
4.06
5.11
3.21
4.01
0#
1#
2#
3#
4#
5#
6#
FEV1#(Liters)# FVC#(Liters)#
Study#Popula?on#
NHANES#III#
95%
CI =
3.9
2 - 4
.19
95%
CI =
3.1
9 - 3
.23
p-va
lue
= <0
.000
1
95%
CI =
4.9
5 - 5
.26
95%
CI =
3.9
9 - 4
.03
p-va
lue
= <0
.000
1

92##
Figure 23: Pulmonary Function Mean for Males. Bolded values are statistically significant.
4.24
5.31
3.72
4.72
0#
1#
2#
3#
4#
5#
6#
FEV1#(Liters)# FVC#(Liters)#
Study#Popula?on#
NHANES#III#
95%
CI =
4.1
1 - 4
.37
95%
CI =
3.7
0 - 3
.74
p-va
lue
= <0
.000
1
95%
CI =
5.1
6 - 5
.47
95%
CI =
4.6
9 - 4
.74
p-va
lue
= <0
.000
1

93##
Figure 24: Pulmonary Function Mean for Females. Bolded values are statistically significant.
3.18
4.11
2.74
3.38
0#
0.5#
1#
1.5#
2#
2.5#
3#
3.5#
4#
4.5#
FEV1#(Liters)# FVC#(Liters)#
Study#Popula?on#
NHANES#III#
95%
CI =
2.9
7 - 3
.38
95%
CI =
2.7
3 - 2
.76
p-va
lue
= 0.
0005
95%
CI =
3.8
3 - 4
.39
95%
CI =
3.3
6 - 3
.40
p-va
lue
= <0
.000
1
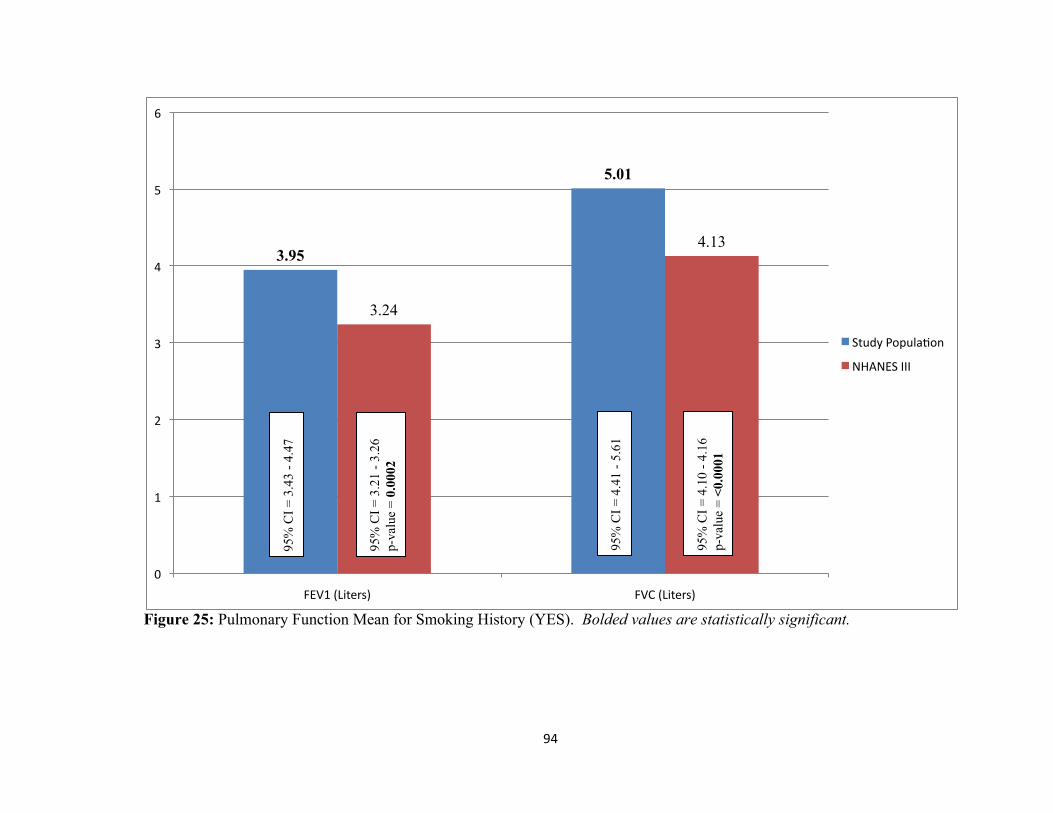
94##
Figure 25: Pulmonary Function Mean for Smoking History (YES). Bolded values are statistically significant.
3.95
5.01
3.24
4.13
0#
1#
2#
3#
4#
5#
6#
FEV1#(Liters)# FVC#(Liters)#
Study#Popula?on#
NHANES#III#
95%
CI =
3.4
3 - 4
.47
95%
CI =
3.2
1 - 3
.26
p-va
lue
= 0.
0002
95%
CI =
4.4
1 - 5
.61
95%
CI =
4.1
0 - 4
.16
p-va
lue
= <0
.000
1

95##
Figure 26: Pulmonary Function Mean for Smoking History (NO). Bolded values are statistically significant.
4.07
5.12
3.18
3.89
0#
1#
2#
3#
4#
5#
6#
FEV1#(Liters)# FVC#(Liters)#
Study#Popula?on#
NHANES#III#
95%
CI =
3.9
5 - 4
.21
95%
CI =
3.1
5 - 3
.20
p-va
lue
= <0
.000
1
95%
CI =
4.9
7 - 5
.28
95%
CI =
3.8
6 - 3
.91
p-va
lue
= <0
.000
1

96##
Figure 27: Pulmonary Function Mean for Height At or Above Median (70 inches). Bolded values are statistically significant.
4.43
5.60
3.92
5.00
0#
1#
2#
3#
4#
5#
6#
FEV1#(Liters)# FVC#(Liters)#
Study#Popula?on#
NHANES#III#
95%
CI =
4.2
7 - 4
.59
95%
CI =
3.8
9 - 3
.95
p-va
lue
= <0
.000
1
95%
CI =
5.4
2 - 5
.78
95%
CI =
4.9
7 - 5
.04
p-va
lue
= <0
.000
1

97##
Figure 28: Pulmonary Function Mean for Height Below Median (70 inches). Bolded values are statistically significant.
3.64
4.56
3.00
3.73
0#
0.5#
1#
1.5#
2#
2.5#
3#
3.5#
4#
4.5#
5#
FEV1#(Liters)# FVC#(Liters)#
Study#Popula?on#
NHANES#III#
95%
CI =
3.4
7 - 3
.80
95%
CI =
2.9
9 - 3
.02
p-va
lue
= <0
.000
1
95%
CI =
4.3
6 - 4
.75
95%
CI =
3.7
1 - 3
.75
p-va
lue
= <0
.000
1

98##
Figure 29: Pulmonary Function Mean for Age At or Above Median (38 years). Bolded values are statistically significant.
3.91
4.98
2.95
3.81
0#
1#
2#
3#
4#
5#
6#
FEV1#(Liters)# FVC#(Liters)#
Study#Popula?on#
NHANES#III#
95%
CI =
3.7
4 - 4
.09
95%
CI =
2.9
3 - 2
.97
p-va
lue
= <0
.000
1
95%
CI =
4.7
6 - 5
.20
95%
CI =
3.7
9 - 3
.84
p-va
lue
= <0
.000
1

99##
Figure 30: Pulmonary Function Mean for Age Below Median (38 years). Bolded values are statistically significant.
4.22
5.25
3.50
4.24
0#
1#
2#
3#
4#
5#
6#
FEV1#(Liters)# FVC#(Liters)#
Study#Popula?on#
NHANES#III#
95%
CI =
4.0
2 - 4
.42
95%
CI =
3.4
8 - 3
.53
p-va
lue
= <0
.000
1
95%
CI =
5.0
2 - 5
.48
95%
CI =
4.2
1 - 4
.27
p-va
lue
= <0
.000
1

100##
8.2.2 Multivariate Analysis
Multivariate analysis was conducted by constructing linear regression models
including all data elements known to impact pulmonary function including age, height,
gender, and smoking history. The parameter estimates identify the magnitude of effect
each predictor has on either increasing or decreasing pulmonary function in the total
population. Statistically significant predictors were identified as having a p-value less
than 0.05. The results of the linear regression analysis for FEV1 are reported in Table 14.
The analysis identified age, height, gender and smoking history as statistically significant
predictors of FEV1. The adjusted outcome for status as an emergency responder was
also a significant predictor of FEV1 in this analysis. With a parameter estimate of
0.44757, status as an emergency responder conferred a modest increase to FEV1
compared to the control population.
The results of the linear regression analysis for FVC are reported in Table 15.
The analysis identified age, height, gender, but not smoking history as statistically
significant predictors of FVC. The adjusted outcome for status as an emergency
responder was also a significant predictor of FVC in this analysis. With a parameter
estimate of 0.53683, status as an emergency responder conferred a modest increase to
FVC compared to the control population.
Logistic regression analysis was used to determine the effect of pulmonary
function predictors on generating an FEV1/FVC ratio less than 0.80 (Table 16). From
this analysis, four statistically significant factors impacted the FEV1/FVC ratio: age,
height, smoking history, and gender. Status as an emergency responder was not

101##
associated with the production of a FEV1/FVC ratio less than 0.80. Those in the
population over the median age (thirty-eight years) and height (seventy inches) were
more likely to produce an FEV1/FVC ratio less than 0.80. Similarly, those with no
smoking history and gender is female were less likely to produce an FEV1/FVC ratio less
than 0.80.
Table 14: Predictors of FEV1 from Linear Regression Analysis
FEV1
Predictor Parameter Estimate Standard Error p-value Age at test -0.03571 0.00105 <0.0001 Height at test (in) 0.07459 0.00357 <0.0001 Gender -0.62706 0.02694 <0.0001 Smoking History (pk-yrs) -0.00391 0.00083 <0.0001 Emergency Responder Status 0.44757 0.05049 <0.0001 Bolded values are statistically significant.
Table 15: Predictors of FVC from Linear Regression Analysis
FVC
Predictor Parameter Estimate Standard Error p-value Age at test -0.02927 0.00124 <0.0001 Height at test (in) 0.10485 0.00423 <0.0001 Gender -0.81338 0.03188 <0.0001 Smoking History (pk-yrs) -0.00102 0.00098 0.2987 Emergency Responder Status 0.53683 0.05974 <0.0001 Bolded values are statistically significant.

102##
Table 16: Logistic Regression Analysis of FEV1/FVC to Examine the Effect of Predictors on Producing an Abnormal Ratio (<0.80 FEV1/FVC)
FEV1/FVC <0.80
Predictor Odds Ratio 95% Confidence Limit Age above median >38 years 3.5 3.20 – 3.80 Height above median >70 inches 1.4 1.24 – 1.59 Gender (females vs. males) 0.55 0.50 – 0.60 Smoking History (effect on non-smoking) 0.76 0.69 – 0.84 Emergency Responder Status 0.93 0.66 – 1.35 Bolded values are statistically significant.
8.3 Discussion
This research examined the feasibility of conducting a cross sectional surveillance
evaluation of workers in the emergency response industry in the state of Florida, which
had maintained records of pulmonary function testing for workers required to use
respiratory protection. Statistical comparisons between the occupational population and
the NHANES III population segment, limited by age and height to reflect the
occupational population’s demographics, demonstrated the putative factors that altered
pulmonary function in the population of interest.
The results of this research indicated that the emergency responders experienced a
modest, but statistically significant, increase in FEV1 and FVC mean values over the
NHANES III population in both total and stratified analyses, including stratification by
age, gender, height, and smoking history. No analysis that examined mean values
demonstrated better pulmonary function in the control group versus the target worker
population.

103##
In the linear regression analysis performed to examine the effect of salient
cofactors on pulmonary function, FEV1 analysis demonstrated that age, gender, height
and smoking history all significantly affected pulmonary function of the population in the
expected direction. That is to say, increased age, female gender, and increased pack-years
of smoking decreased FEV1, while increased height increased FEV1. As well, status as
an emergency responder conferred a modest, significant increase in FEV1.
Similar results were reported for the analysis of FVC, with the exception of
smoking history, which did not demonstrate statistical significance in this analysis. The
results of the linear regression analysis for FEV1 and FVC outcomes indicate that the
predominate factors that affect pulmonary function values are those traditionally known
to impact lung volume and clearance, e.g. age, gender, height, and smoking history. A
modest positive effect on FEV1 and FVC was observed for emergency responders in both
the stratified analysis, as well as the linear regression analysis. This may indicate the
presence of the ‘healthy worker effect’ in the occupational population related to more
time spent in active labor compared to the NHANES III population which may contain
unemployed persons or those engaged in more sedentary labor.
Logistic regression was performed for the outcome of the FEV1/FVC ratio to
evaluate the potential for obstructive disorders among the target occupational population
compared to the NHANES III population. A cutoff point of less than 0.80 FEV1/FVC
was used to classify persons with abnormal FEV1/FVC values that could potentially be
an indicator of pre-clinical pulmonary obstruction. In this analysis, status as an
emergency responder was not significantly associated with an FEV value of less than

104##
0.80. However, the analysis clearly demonstrated that the older and taller half of the
population was more likely to produce a lower FEV1/FVC ratio, and non-smokers and
the female gender were less likely to produce a lower FEV1/FVC ratio compared to the
smokers and males in the population.
Through the use of OSHA mandated pulmonary function testing and the available
NHANES III spirometry data set, this study was able to efficiently evaluate the
pulmonary health of a substantive cross section of a specific industry: emergency
responders. The data collected in both the OSHA mandated testing and the NHANES III
spirometry data allows for the control of confounding factors that impact measures of
pulmonary function so that statistical comparison can identify deficits in pulmonary
function and indicate whether or not those deficits are associated with an occupational
sector. This research did not identify any pulmonary function deficits in the target
occupational population and it demonstrated that in all cases, emergency responders had
modestly superior pulmonary function compared to a baseline population.

105##
Chapter 9
Conclusion
Occupational health surveillance in the United States is a rising priority and a new
focus has been established on the health and welfare of the workforce. Health
surveillance in the past has typically been associated with communicable diseases such as
polio and influenza. However, as Baker et al. (1988) states:
Although certain aspects of the communicable disease surveillance model
are applicable for surveillance of occupational conditions, there are basic
differences between communicable diseases and occupational disorders which
impact on the strategy for surveillance:
• Strong disincentives exist for reporting occupational conditions by
employers, physicians, and most importantly affected individuals. Such
disincentives do not characterize communicable disease surveillance.
• Health professionals lack knowledge regarding the nature of health risks in
the workplace. Generally, they are more familiar with communicable
disease surveillance.
• Many common occupational conditions are also caused or aggravated by
non-occupational factors unrelated to work.

106##
• The latency period between exposure onset and disease occurrence is
frequently great for occupational disorders.
While the history of occupational diseases may go back for centuries, numerous
diseases and ailments go unrecognized in modern times. Currently, the nation’s
workforce is exposed to more potential hazards than ever before. In the past, the points
listed above have hindered the identification of the occupational origin of numerous
diseases. Fortunately, a new emphasis on worker health has been established at the
corporate level, employee level, and in academic institutions. Corporations recognize the
economic impact and loss of productivity that can occur when an employee has to miss
work or becomes disabled. Employees now more than ever realize the negative impact
associated with being out of work and how it affects not only them, but also other
household members dependent on both their physical and monetary support.
Increased awareness of the importance of a healthy workforce has created a need
for public health practitioners specialized in occupational health. Companies are now
seeking individuals that have knowledge of the health risks associated with the workplace
and the ability to monitor their workforce and implement controls when needed. This has
led to the development of occupational health courses and degrees being offered to a
variety of disciplines including physicians, toxicologists, industrial hygienists, and
epidemiologists. Better understanding of occupational settings, occupational diseases,
and surveillance strategy has led to the advancement of occupational health surveillance.
The stated objectives of this study were to:

107##
• Identify industries in the State of Florida that have the potential for increased
pulmonary impairment amongst workers.
• Evaluate the feasibility of using pulmonary function data collected for purposes of
compliance and/or best practices for workers who use respiratory protection
because they are potentially exposed to pulmonary toxicants in the workplace.
OSHA mandated pulmonary function testing as well as testing included as a best
practice or standard operating procedure represents a potentially powerful surveillance
tool to evaluate at-risk populations who have known inhalation exposures that require
respiratory personal protective equipment and regular spirometry evaluations. Evaluation
of this type of occupational health data can lead to the advancement of occupational
exposure controls as well as regulatory and policy changes that can lead to safer
workplace environments. In addition, this type of research can be expanded and or
tailored to include additional indicators of occupational disease, which allows for greater
utility and the potential to identify various adverse health effects associated with
occupational exposure to toxicants.
The methodology presented in this study provided an opportunity to determine the
feasibility of using pulmonary function data collected for purposes of compliance and/or
best practices for workers who use respiratory protection. The various methods used for
data collection and data analysis in this study indicated the feasibility of using
occupational health data to quickly and efficiently conduct a population level analysis
and draw conclusions. Limitations of the interpretation of surveillance data can include
under-reporting, reporting bias, and inconsistent case definitions. While procedures were

108##
established to address such limitations, further methods could be included to enhance the
results. For example, additional analyses for consideration could include time
comparative studies that track health outcomes through out a work history. Inclusion of
this additional analysis may help address biases associated with a one time study. This
study not only demonstrates the feasibility of using occupational health data for
population level analysis but also illustrates the flexibility provided by the methodology
presented.
Two main limitations to conducting this line of research include data collection
and data warehousing. The first principal limitation to conducting this line of research is
access to occupational health data. While all states require disease reporting, state and
federal laws do not mandate that all occupational health data is reported and pooled for
analysis. Convincing industry to share this type of data is necessary to perform wide
scale analyses and draw strong conclusions. Ethical issues and legal issues related to
occupational health surveillance include right of access, public trust, confidentiality,
informed consent, etc. Such concerns by industry need to be addressed and safeguards
need to be established to ensure that dissemination of such data is only provided to those
who need it for surveillance purposes. Cooperation and education between governmental
and private sectors to create acceptable data collection procedures that ensure ethical and
legal concerns must be addressed and are key in the promotion of occupational health
surveillance.
The second principal limitation to conducting this line of research is the current
lack of infrastructure to aggregate both required and voluntary pulmonary function
109##
testing data. OSHA required pulmonary function testing is conducted under standard
pulmonary function testing guidelines and the resulting data is maintained with
employers for compliance purposes. If this data were also transmitted to a local, state, or
federal database to be used in population level analysis, the availability and efficacy of
this method of surveillance would be greatly enhanced. Data sharing has many
limitations, which include coding, formatting, definitions, etc. Standardization of
occupational health data for the purpose of data sharing and data processing need to be
addressed and guidance created to eliminate the many different inconsistencies that exist
in the equipment used and the data produced. Advancement in technology and the
increased awareness of the importance of data sharing should drive the needed
advancements and collaboration to ensure that occupational health surveillance can be
used to monitor health, which is in everyone’s best interest.
There is a need to develop and utilize surveillance methodologies that are capable
of efficiently evaluating occupational populations for health status, identifying changes in
health status over time, and comparing the health status of occupational populations o
baseline populations. As shown by the methodology described in this study, the use of
spirometry data to quickly evaluate the pulmonary health status of selected occupational
populations is both a feasible and efficient way to conduct occupational health
surveillance.

110##
References
Abalkhail, B. & Shawky, S. (2002). Comparison Between Body Mass Index, Triceps Skin Fold Thickness and Mid-Arm Muscle Circumference in Saudi Adolescents. Annals of Saudi Medicine, Volume 22, 324-328.
Alexopoulos, E. C. (2010). Introduction to Multivariate Regression Analysis.
Hippokratia, Volume 14, Supplement 1, 23-28. Alli, B. O. (Ed.). 2008. Fundamental Principles of Occupational Health and Safety (65).
Geneva, Switzerland: International Labour Organization. American College of Occupational and Environmental Medicine. (2000). Spirometry in
the Occupational Setting. Journal of Occupational and Environmental Medicine, Volume 42, 228-245.
Baker, E. L., Melius, J. M., & Millar, J. D. (1988). Surveillance of Occupational Illness
and Injury in the United States: Current Perspectives and Future Directions. Journal of Public Health Policy, Volume 9, Number 2, 197-221.
Banauch, G. I., Hall, C., Weiden, M., Cohen, H. W., Aldrich, T. A., Christodoulou, V.,
Arcentales, N., Kelly, K. J., & Prezant, D. J. (2006). Pulmonary Function after Exposure to the World Trade Center Collapse in the New York City Fire Department. American Journal of Respiratory and Critical Care Medicine, Volume 174, Number 3, 312-319.
Baselt, R. C. (Ed.). (2002). Disposition of Toxic Drugs and Chemicals in Man (974-976).
Foster City, California: Biomedical Publications. Berstein, I. L., Chan-Yeung, M., Malo, J. L., Bernstein, D. I. (Eds.). (1993). Definition
and Classification of Asthma (1-4). New York, New York: Marcel Dekker Inc. Brar, I., Shuter, J. Thomas, A., Daniels, E., & Absalon, J. (2007). A Comparison of
Factors Associated With Prevalent Diabetes Mellitus Among HIV-Infected Antiretroviral-Naïve Individuals Versus Individuals in the National Health and Nutritional Examination Survey Cohort. Journal of Aquired Immune Deficiency Syndromes, Volume 45, Issue 1, 66-71.

111##
Bridbord, K., Costello, J., Gamble, J., Groce, D., Hutchinson, M., Jones, W., Merchant,
J., Ortmeyer, C., Reger, R., & Wagner, W. L. (1979). Occupational Safety and Health Implications of Increased Coal Utilization. Environmental Health Perspectives, Volume 33, 285-302.
Burger, C. D., Foreman, A. J., Miller, D. P., Stafford, R. E., McGoon, M. D., & Badesch,
D. B. (2011). Comparison of Body Habitus in Patients With Pulmonary Arterial Hypertension Enrolled in the Registry to Evaluate Early and Long-term PAH Disease Management With Normative Values From the National Health and Nutrition Examination Survey. Mayo Clinic Proceedings, Volume 86, Issue 2, 105-112.
Burgess, J. L., Nanson, C. J., Bolstad-Johnson, D. M., Gerkin, R., Hysong, T. A., Lantz,
R. C., Sherrill, D. L., Crutchfield, C. D., Quan, S. F., Bernard, A. M., &Witten, M. L. (2001). Adverse Respiratory Effects Following Overhaul in Firefighters. Journal of Occupational and Environmental Medicine, Volume 43, Number 5, 467-473.
Carpenter, C. P., Shaffer, C. B., Weil, C. S., & Smyth, H. F. (1944). Studies on the
Inhalation of 1,3-Butadiene, with a Comparison of its Narcotic Effect with Benzol, Toluol, and Styrene, and a Note on the Elimination of Styrene by the Human. The Journal of Industrial Hygiene and Toxicology, Volume 26, 69-78.
Castorina, R., Bradman, A., Fenster, L., Barr, D. B., Bravo, R., Vedar, M. G., Harnly, M.
E., McKone, T. E., Eisen, E. A., & Eskenazi, B. (2010). Comparison of Current-Use Pesticide and Other Toxicant Urinary Metabolite Levels among Pregnant Women in the CHAMACOS Cohort and NHANES. Environmental Health Perspectives, Volume 118, Issue 6, 856-863.
Center for Disease Control and Prevention. (2012). About the National Health and
Nutrition Examination Survey . Retrieved from www.cdc.gov/nchs/nhanes/about_nhanes.htm
Chattopadhyay, B. P., Gangopadhyay, P. K., Alam, J., & Roychowdhury, A. (2004).
Effect of Respiratory Function Status of Firefighters in an Accident Fire in a Chemical Warehouse. Indian Journal of Occupational and Environmental Medicine, Volume 8, Issue 2, 19-25.
Chmielewski, J. & Renke, W. (1975). Clinical and Experimental Studies on the
Pathogenesis of Toxic Effects of Styrene. II. The Effect of Styrene on the Respiratory System. Bulletin of the Institute of Maritime and Tropical Medicine in Gdynia, Volume 26, 299-302.

112##
Collen, J., Greenburg, D., Holley, A., King, C. S., & Hnatiuk, O. (2008). Discordance in
Spirometric Interpretations Using Three Commonly Used Reference Equations vs National Health and Nutrition Examination Study III. Chest, Volume 134, Number 5, 1009-1016.
Colton, C. E. & Nelson, T. J. (2003). Respiratory Protection. In S. R. DiNardi (Ed.), The
Occupational Environment: Its Evaluation, Control, and Management (931-953). Fairfax, Virginia: AIHA Press.
Department of Health and Environmental Control. (1999). Report on the Impact of
Obesity on Health in South Carolina. Retrieved from http://www.statelibrary.sc.gov/scedocs/H3496/001842.pdf
Dickerson, F. B., Brown, C. H., Kreyenbuhl, J. A., Fang, L., Goldberg, R. W.,
Wohlheiter, K., Dixon, L. B. (2006). Obesity Among Individuals with Serious Mental Illness. Acta Psychiatrica Scandinavica, Volume 113, Issue 4, 306-313.
Dickerson, F. B., Brown, C. H., Kreyenbuhl, J., Goldberg, R. W., Fang, L. J., & Dixon,
L. B. (2004). Sexual and Reproductive Behaviors Among Persons With Mental Illness. Psychiatric Services, Volume 55, Number 11, 1299-1301.
eFLorida. (2012). Florida Manufacturing, Statistical profile for companies, employment,
and wages, 2011. Retrived from www.eflorida.com/IntelligenceCenter/download/MF/FF_Industry_Employment_Wage.pdf
Garay, S. M. (2007). Pulmonary Function Testing. In W. N. Rom & S. B. Markowitz
(Eds.), Environmental and Occupational Medicine (200-236). Philadelphia, Pennsylvania: Lippincott, Williams, & Wilkins.
Goff, D. C., Sullivan, L. M., McEvoy, J. P., Meyer, J. M., Nasrallah, H. A., Daumit, G.
L., Lamberti, S., D’Agostino, R. B., Stroup, T. S., Davis, S., & Lieberman, J. A. (2005). A Comparison of Ten-Year Cardiac Risk Estimates in Schzophrenia Patients from the CATIE Study and Matched Controls. Schizophrenia Research, Volume 80, 45-53.
Hankinson, J. L., Odencrantz, J. R., & Fedan, K. B. (1999). Spirometric Reference
Values from a Sample of the General U.S. Population. American Journal of Respiratory and Critical Care Medicine, Volume 159, Number 1, 179-187.
Hauser, R., Eisen, E. A., Pothier, L., & Christiani, D. C. (2001). A Prospective Study of
Lung Function Among Boilmaker Construction Workers Exposed to Combustion Particulates. American Journal of Industrial Medicine, Volume 39, Issue 5, 454-462.

113##
Herrington, D. M., Fong, J., Sempos, C. T., Black, D. M., Schrott, H. G., Rautaharju, P., Bachorik, P. S., Blumenthal, R., Khan, S., & Wenger, N. K. (1998). Comparison of the Heart and Estrogen/Progestin Replacement Study (HERS) Cohort with Women with Coronary Disease from the National Health and Nutrition Examination Survey III (NHANES III). American Heart Journal, Volume 136, Issue 1, 115-124.
Huang, W., Grainger, J., Patterson, D. G., Turner, W. E., Caudill, S. P., Needham, L. L.,
Pirkle, J. L., & Sampson, E. J. (2004). Comparison of 1-Hydroxypyrene Exposure in the US Population with that in Occupational Exposure Studies. International Archives of Occupational and Environmental Health, Volume 77, Issue 7, 491-498.
Jackson, A. W. (1998). Fossil Fuel Power Generation. In J. M. Stellman (Ed.),
Encyclopedia of Occupational Health and Safety (76.6-76.7). Geneva, Switzerland: International Labour Organization.
Jedrychowski, W. (1982). Styrene and Methyl Methacrylate in the Industrial
Environment as a Risk Factor of Chronic Obstructive Lung Disease. International Archives of Occupational and Environmental Health, Volume 51, 151-157.
John Hopkins School of Medicine. (2012). Restrictive Ventilatory Defect. Retrieved from
oac.med.jhmi.edu/res_phys/Encyclopedia/RestrictVentDefect/RestrictVentDefect.HTML
Lamberti, J. S., Olson, D., Crilly, J. F., Olivares, T., Williams, G. C., Tu, X., Tang, W.,
Wiener, K., Dvorin, S., & Dietz, M. B. (2006). Prevalence of the Metabolic Syndrome Among Patients Receiving Clozapine. The American Journal of Psychiatry, Volume 163, 1273-1276.
Large, A. A., Owens, G. R., & Hoffman, L. A. (1990). The Short-Term Effects of Smoke
Exposure on the Pulmonary Function of Firefighters. Chest, Volume 97, 806-809. Lozewicz, S., Davison, A. G., Hopkirk, A., Burge, P. S., Dar Boldy, Riordan, J. F.,
McGivern, D. V., Platts, B. W., Davies, D., Newman, A. J., & Newman Taylor, A. J. (1985). Thorax, Volume 40, 836-839.
Marez, T., Edme, J. L., Boulenguez, C., Shirali, P., & Haguenoer, J. M. (1993). Bronchial
Symptoms and Respiratory Function in Workers Exposed to Methylmethacrylate. British Journal of Industrial Medicine, Volume 50, 894-897.
Markowitz, S. B. (2007). The Role of Surveillance in Occupational Health. In W. N.
Rom & S. B. Markowitz (Eds.), Environmental and Occupational Medicine (9-21). Philadelphia, Pennsylvania: Lippincott, Williams, & Wilkins.
114##
McEvoy, J. P., Meyer, J. M., Goff, D. C., Nasrallah, H. A., Davis, S. M., Sullivan, L., Meltzer, H. Y., Hsiao, J., Stroup, T. S., & Lieberman, J. A. (2005). Prevalence of the Metabolic Syndrome in Patients with Schizophrenia: Baseline Results from the Clinical Antipsychotic Trials of Intervention Effectiveness (CATIE) Schizophrenia Trial and Comparison with National Estimates from NHANES III. Schizophrenia Research, Volume 80, Issue 1, 19-32.
Menzel, D. B & McClellan, R. O. (1980). Toxic Responses of the Respiratory System. In
J. Doull, C. D. Klaassen, & M. O. Amdur (Eds.), Casarett and Doull’s Toxicology (246-274). New York, New York: Macmillan Publishing Co.
Miguel, A. F. (2012). Lungs as a Natural Porous Media: Architecture, Airflow
Characteristics and Transport of Suspended Particles. In J. M. P. Q. Delgado (Ed.), Heat and Mass Transfer in Porous Media (115-137). Verlag Berlin Heidelberg: Springer.
Millar, J. D. (1986). Screening and Monitoring: Tools for Prevention. Journal of
Occupational and Environmental Medicine, Volume 28, Issue 8, 544-546. Mohamed, H., Hoesein, F. A., Zanen, P., & Lammers, J. W. (2011). Lower Limit of
Normal of FEV1/FVC < 0.70 in Diagnosing COPD: An Evidence-Based Review. Respiratory Medicine, Volume 105, Number 6, 907-915.
National Heart, Lung, and Blood Institute. (2012a). The Respiratory System. Retrieved
from www.nhlbi.nih.gov/health/health-topics/topics/hlw/system.html National Heart, Lung, and Blood Institute. (2012b). What is COPD. Retrieved from
www.nhlbi.nih.gov/health/health-topics/topics/copd/ NIOSH. (2012a). National Institute for Occupational Safety and Health Program
Portfolio, Surveillance, Program Description. Retrieved from www.cdc.gov/niosh/programs/surv/
NIOSH. (2012b). National Institute for Occupational Safety and Health Program
Portfolio, Surveillance, Activities: NIOSH-Funded Research Grants. Retrieved from www.cdc.gov/niosh/programs/surv/grants.html#flo
NIOSH. (2012c). National Institute for Occupational Safety and Health Program
Portfolio, Surveillance, Inputs: NIOSH Strategic Goals. Retrieved from www.cdc.gov/niosh/programs/surv/goals.html
NIOSH. (2012d). Workplace Safety & Health Topics, Occupational Respiratory Disease
Surveillance. Retrieved from www.cdc.gov/niosh/topics/surveillance/ords/CoalMiningRelatedRespiratoryDiseases.html

115##
NIOSH. (2012e) Workplace Safety & Health Topics, Occupational Respiratory Disease Surveillance. Retrieved from www.cdc.gov/niosh/topics/surveillance/ords/ecwhsp.html
NIOSH. (2003). NIOSH Spirometry Training Guide (DHHS (NIOSH) Publication
Number 2004-154c) Washington, D.C.: U.S. Government Printing Office. NIOSH. (1983). Criteria for a Recommended Standard: Occupational Exposure to
Styrene (PB-84148295). Washington, D.C.: U.S. Government Printing Office. NIOSH. (1978). Occupational Health Guideline for Sulfur Dioxide (DHHS (NIOSH)
Publication Number 81-123/0575). Washington, D.C.: U.S. Government Printing Office.
NIOSH. (1977). Occupational Diseases: A Guide to Their Recognition (DHEW (NIOSH)
Publication No. 77-181). Washington, D.C.: U.S. Government Printing Office. NMMA. (2012). Florida Boat Industry Statistics for the American Boating Congress
2011. . Retrieved from www.nmma.org/assets/cabinets/Cabinet222/Florida%20Boat%20%20Stats%20ABC%202011.doc
Oner, F., Mungan, D., Numanoglu, N., & Demirel, Y. (2004). Occupational Asthma in
the Furniture Industry: Is it Due to Styrene? Respiration, Volume 71, Issue 4, 336-341.
OSHA. (2012a). Occupational Safety and Health Administration. Respiratory Protection,
1910.134. Retrieved from www.oshs.gov/pls/oshaweb/owadisp.show_document?p_table=STANDARDS&p_id=12716
OSHA. (2012b). Occupational Safety and Health Administration, Pulmonary Function
Standards for Cotton Dust Standard, 1910.1043. Retrieved from www.osha.gov/pls/oshaweb/owadisp.show_document?p_table=STANDARD&p_id=10059
OSHA. (2012c). Occupational Safety and Health Administration, Benzene, 1910.1028.
Retrieved from www.osha.gov/pls/oshaweb/owadisp.show_document?p_table=STANDARD&p_id=10042
Pastides, H. & Mundt, K. A. (2003). Epidemiological Surveillance. In S. R. DiNardi, The
Occupational Environment: Its Evaluation, Control, and Management (91-99). Fairfax, Virginia: AIHA Press.

116##
Pellegrino, R., Viegi, G., Brusasco, R. O., Crapo, F., Burgos, R., Casaburi, R., Coates, A., van der Grinten, C. P. M., Gustafsson, P., Hankinson, J., Jensen, R., Johnson, D. C., MacIntyre, N., McKay, R., Miller, M. R., Navajas, D., Pedersen, O. F., & Wanger, J. (2005). Interpretative Strategies for Lung Function Tests. European Respiratory Journal, Volume 26, Number 5, 948-968.
Petty, T. L. (2005) Benefits of and Barriers to the Widespread Use of Spirometry. Current
Opinions in Pulmonary Medicine, Volume 11, 115-120. Pickering, C. A. C., Bainbridge, D., Birtwistle, I. H., & Griffiths, D. L. (1986).
Occupational Asthma Due to Methyl Methacrylate in an Orthopaedic Theatre Sister. British Medical Journal, Volume 292, Issue 6532, 1362-1363.
Piirila, P., Pietinalho, A., Loponen, M., Naumanen, H., Nurminen, M., Siukola, A.,
Korhonen, O., Koskela, K., & Sovijarvi, A. (2002). The Quality of Spirometric Examinations in Finland: Results from a National Questionnaire Survey. Clinical Physiology and Functional Imaging, Volume 22, 233-239.
Piirila, P., Kanerva, L., Keskinen, H., Estlander, T., Hytonen, M., Tuppurainen, M., &
Nordman, H. (1998). Occupational Respiratory Hypersensitivity Caused by Preparations Containing Acrylates in Dental Personnel. Clinical and Experimental Allergy, Volume 28, 1404-1411.
Sarma, A. V., Kanaya, A. M., Nyberg, L. M., Kusek, J. W., Vittinghoff, E., Rutledge, B.,
Cleary P. A., Gatcomb, P., & Brown, J. S. (2009). Urinary Incontinence Among Women With Type 1 Diabetes – How Common is it? The Journal of Urology, Volume 181, Issue 3, 1224-1230.
Sati, P. C., Khaliq, F., Vaney, N., Ahmed, T., Tripathi, A. K., & Banerjee, B. D. (2011).
Pulmonary Function and Oxidative Stress in Workers Exposed to Styrene in Plastic Factory. Human & Experimental Toxicology, Volume 30, Number 11, 1743-1750.
Schlegelmilch, R. M. & Kramme, R. (2011). Pulmonary Function Testing. In R.
Kramme, KP. Hoffman, & R. S. Pozos (Eds.), Spring Handbook of Medical Technology (95-118). New York, New York: Springer.
Scientific Committee on Occupational Exposure Limits. (2008). Recommendations from
the Scientific Committee on Occupational Exposure Limits for Sulfur Dioxide (SCOEL/SUM/27). European Commission.
Sood, A., Dawson, K. D., Henkle, J. Q., Hopkins-Prince, P., & Qualls, C. (2007). Effect
of Change of Reference Standard to NHANES III on Interpretation of Spirometric ‘Abnormality’. International Journal of Chronic Obstructive Pulmonary Disease, Volume 2, Number 3, 361-367.

117##
Spriggs, E. A. (1978). The History of Spirometry. British Journal of Diseases of the Chest, Volume 72, 165-180.
Stewart, R. D., Dodd, H. C., Baretta, E. D., & Schaffer, A. W. (1968). Human Exposure
to Styrene Vapor. Archives of Environmental Health, Volume 16, 656-662. Streeten, E. A., Mcbride, D. J., Lodge, A. L., Pollin, T. I., Stinchcomb, D. G., Agarwala,
R., Schaffer, A. A., Shapiro, J. R., Shuldiner, A. R., & Mitchell, B. D. (2004). Reduced Incidence of Hip Fracture in the Old Order Amish. Journal of Bone and Mineral Research, Volume 19, Issue 2, 308-313.
Townsend, M. C. (2011). Spirometry in the Occupational Health Setting – 2011 Update.
Journal of Occupational and Environmental Medicine, Volume 53, Number 5, 569-584.
Ungers, L. J., Vendrely, T. G., & Barnes, C. L. (2007). Control of Methyl Methacrylate
During the Preparation of Orthopedic Bone Cements. Journal of Occupational and Environmental Hygiene, Volume 4, 272-280.
USEPA. (2008). Control Techniques Guidelines for Fiberglass Boat Manufacturing
Materials (EPA-453/R-08-004). Washington, D.C.: U.S. Government Printing Office.
USEPA. (2001). Economic Impact Analysis of the Boat Manufacturing NESHAP (EPA-
452/R-01-011). Washington D.C.: U.S. Government Printing Office. Vathesatogkit, P., Harkin, T. J., Addrizzo-Harris, D. J., Bodkin, M., Crane, M., & Rom,
W. N. (2004). Clinical Correlation of Asbestos Bodies in BAL Fluid. Chest, Volume 126, Issue 3, 966-971.
Warshaw, R., Fischbein, A., Thorton, J., Miller, A., & Selikoff, I. J. (1979). Decrease in
Vital Capacity in PCB-exposed Workers in a Capacitor Manufacturing Facility. Annals of the New York Academy of Sciences, Volume 320, 277-283.
Xu, R. Zhang, L, Zhang, P, Wang, F., Zou, L., & Wang, H. (2009). Comparison of the
Prevalence of Chronic Kidney Disease Among Different Ethnicities: Beijing CKD Survey and American NHANES. Nephrology Dialysis Transplantation, Volume 24, Issue 4, 1220-1226.

118##
APPENDIX I:
IRB APPROVAL LETTER

August 24, 2010 Giffe Johnson, MPH, PhD Environmental and Occupational Health 13201 Bruce B. Downs Blvd., MDC 56 Tampa, FL 33612 RE: Expedited Approval for Initial Review IRB#: Pro00001348 Title: Occupational Health Monitoring Database Development Dear Dr. Johnson: On 8/24/2010, the Institutional Review Board (IRB) reviewed and APPROVED the above referenced protocol. Please note that your approval for this study will expire on 08/24/2011. Approved Items: Protocol Document(s):
Study Protocol.doc 6/9/2010 3:50 PM 0.01
It was the determination of the IRB that your study qualified for expedited review which includes activities that (1) present no more than minimal risk to human subjects, and (2) involve only procedures listed in one or more of the categories outlined below. The IRB may review research through the expedited review procedure authorized by 45CFR46.110 and 21 CFR 56.110. The research proposed in this study is categorized under the following expedited review category: (5) Research involving materials (data, documents, records, or specimens) that have been collected, or will be collected solely for nonresearch purposes (such as medical treatment or diagnosis).

Your study qualifies for a waiver of the requirements for the documentation of informed consent as outlined in the federal regulations at 45CFR46.116 (d) which states that an IRB may approve a consent procedure which does not include, or which alters, some or all of the elements of informed consent, or waive the requirements to obtain informed consent provided the IRB finds and documents that (1) the research involves no more than minimal risk to the subjects; (2) the waiver or alteration will not adversely affect the rights and welfare of the subjects; (3) the research could not practicably be carried out without the waiver or alteration; and (4) whenever appropriate, the subjects will be provided with additional pertinent information after participation. Your study qualifies for a waiver of the requirement for signed authorization as outlined in the HIPAA Privacy Rule regulations at 45 CFR 164.512(i) which states that an IRB may approve a waiver or alteration of the authorization requirement provided that the following criteria are met (1) the PHI use or disclosure involves no more than a minimal risk to the privacy of individuals; (2) the research could not practicably be conducted without the requested waiver or alteration; and (3) the research could not practicably be conducted without access to and use of the PHI. As the principal investigator of this study, it is your responsibility to conduct this study in accordance with IRB policies and procedures and as approved by the IRB. Any changes to the approved research must be submitted to the IRB for review and approval by an amendment. We appreciate your dedication to the ethical conduct of human subject research at the University of South Florida and your continued commitment to human research protections. If you have any questions regarding this matter, please call 813-974-9343. Sincerely,
USF Institutional Review Board Cc: Sarah Croker USF IRB Professional Staff
Related Documents