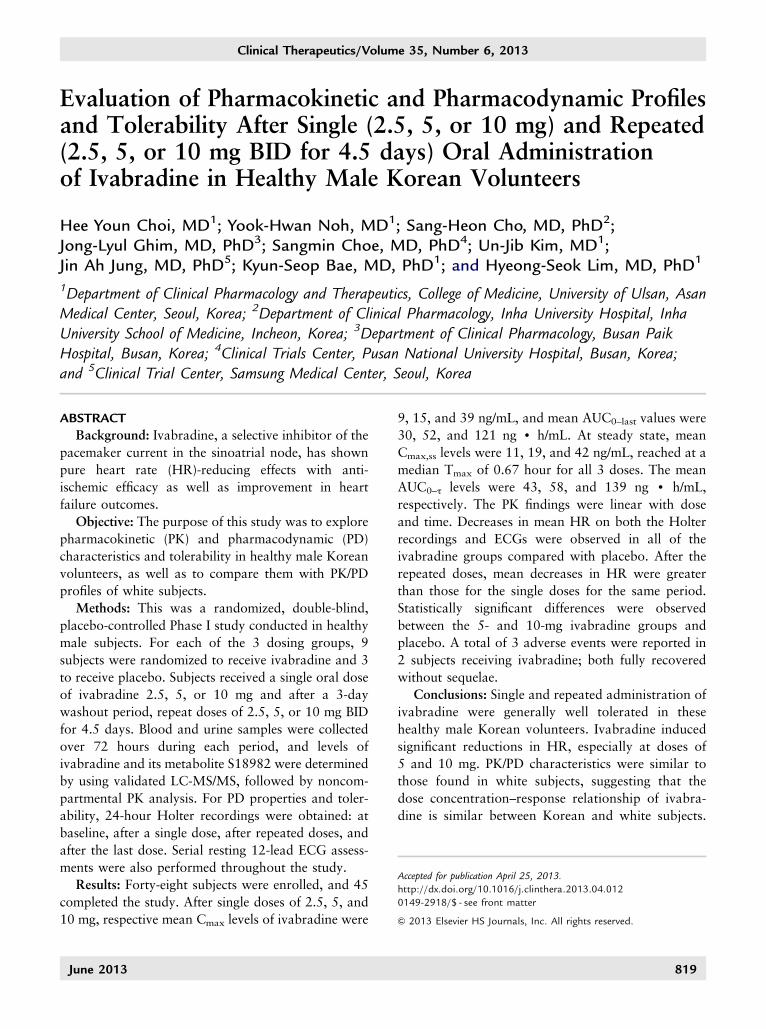
Clinical Therapeutics/Volume 35, Number 6, 2013 Evaluation of Pharmacokinetic and Pharmacodynamic Profiles and Tolerability After Single (2.5, 5, or 10 mg) and Repeated (2.5, 5, or 10 mg BID for 4.5 days) Oral Administration of Ivabradine in Healthy Male Korean Volunteers Hee Youn Choi, MD 1 ; Yook-Hwan Noh, MD 1 ; Sang-Heon Cho, MD, PhD 2 ; Jong-Lyul Ghim, MD, PhD 3 ; Sangmin Choe, MD, PhD 4 ; Un-Jib Kim, MD 1 ; Jin Ah Jung, MD, PhD 5 ; Kyun-Seop Bae, MD, PhD 1 ; and Hyeong-Seok Lim, MD, PhD 1 1 Department of Clinical Pharmacology and Therapeutics, College of Medicine, University of Ulsan, Asan Medical Center, Seoul, Korea; 2 Department of Clinical Pharmacology, Inha University Hospital, Inha University School of Medicine, Incheon, Korea; 3 Department of Clinical Pharmacology, Busan Paik Hospital, Busan, Korea; 4 Clinical Trials Center, Pusan National University Hospital, Busan, Korea; and 5 Clinical Trial Center, Samsung Medical Center, Seoul, Korea ABSTRACT Background: Ivabradine, a selective inhibitor of the pacemaker current in the sinoatrial node, has shown pure heart rate (HR)-reducing effects with anti- ischemic efficacy as well as improvement in heart failure outcomes. Objective: The purpose of this study was to explore pharmacokinetic (PK) and pharmacodynamic (PD) characteristics and tolerability in healthy male Korean volunteers, as well as to compare them with PK/PD profiles of white subjects. Methods: This was a randomized, double-blind, placebo-controlled Phase I study conducted in healthy male subjects. For each of the 3 dosing groups, 9 subjects were randomized to receive ivabradine and 3 to receive placebo. Subjects received a single oral dose of ivabradine 2.5, 5, or 10 mg and after a 3-day washout period, repeat doses of 2.5, 5, or 10 mg BID for 4.5 days. Blood and urine samples were collected over 72 hours during each period, and levels of ivabradine and its metabolite S18982 were determined by using validated LC-MS/MS, followed by noncom- partmental PK analysis. For PD properties and toler- ability, 24-hour Holter recordings were obtained: at baseline, after a single dose, after repeated doses, and after the last dose. Serial resting 12-lead ECG assess- ments were also performed throughout the study. Results: Forty-eight subjects were enrolled, and 45 completed the study. After single doses of 2.5, 5, and 10 mg, respective mean C max levels of ivabradine were 9, 15, and 39 ng/mL, and mean AUC 0–last values were 30, 52, and 121 ng d h/mL. At steady state, mean C max,ss levels were 11, 19, and 42 ng/mL, reached at a median T max of 0.67 hour for all 3 doses. The mean AUC 0–τ levels were 43, 58, and 139 ng d h/mL, respectively. The PK findings were linear with dose and time. Decreases in mean HR on both the Holter recordings and ECGs were observed in all of the ivabradine groups compared with placebo. After the repeated doses, mean decreases in HR were greater than those for the single doses for the same period. Statistically significant differences were observed between the 5- and 10-mg ivabradine groups and placebo. A total of 3 adverse events were reported in 2 subjects receiving ivabradine; both fully recovered without sequelae. Conclusions: Single and repeated administration of ivabradine were generally well tolerated in these healthy male Korean volunteers. Ivabradine induced significant reductions in HR, especially at doses of 5 and 10 mg. PK/PD characteristics were similar to those found in white subjects, suggesting that the dose concentration–response relationship of ivabra- dine is similar between Korean and white subjects. Accepted for publication April 25, 2013. http://dx.doi.org/10.1016/j.clinthera.2013.04.012 0149-2918/$ - see front matter & 2013 Elsevier HS Journals, Inc. All rights reserved. June 2013 819

Welcome message from author
This document is posted to help you gain knowledge. Please leave a comment to let me know what you think about it! Share it to your friends and learn new things together.
Transcript
Clinical Therapeutics/Volume 35, Number 6, 2013
Evaluation of Pharmacokinetic and Pharmacodynamic Profilesand Tolerability After Single (2.5, 5, or 10 mg) and Repeated(2.5, 5, or 10 mg BID for 4.5 days) Oral Administrationof Ivabradine in Healthy Male Korean Volunteers
Hee Youn Choi, MD1; Yook-Hwan Noh, MD1; Sang-Heon Cho, MD, PhD2;Jong-Lyul Ghim, MD, PhD3; Sangmin Choe, MD, PhD4; Un-Jib Kim, MD1;Jin Ah Jung, MD, PhD5; Kyun-Seop Bae, MD, PhD1; and Hyeong-Seok Lim, MD, PhD1
1Department of Clinical Pharmacology and Therapeutics, College of Medicine, University of Ulsan, AsanMedical Center, Seoul, Korea; 2Department of Clinical Pharmacology, Inha University Hospital, InhaUniversity School of Medicine, Incheon, Korea; 3Department of Clinical Pharmacology, Busan PaikHospital, Busan, Korea; 4Clinical Trials Center, Pusan National University Hospital, Busan, Korea;and 5Clinical Trial Center, Samsung Medical Center, Seoul, Korea
Accepted for publication April 25, 2013.http://dx.doi.org/10.1016/j.clinthera.2013.04.0120149-2918/$ - see front matter
& 2013 Elsevier HS Journals, Inc. All rights reserved.
ABSTRACT
Background: Ivabradine, a selective inhibitor of thepacemaker current in the sinoatrial node, has shownpure heart rate (HR)-reducing effects with anti-ischemic efficacy as well as improvement in heartfailure outcomes.
Objective: The purpose of this study was to explorepharmacokinetic (PK) and pharmacodynamic (PD)characteristics and tolerability in healthy male Koreanvolunteers, as well as to compare them with PK/PDprofiles of white subjects.
Methods: This was a randomized, double-blind,placebo-controlled Phase I study conducted in healthymale subjects. For each of the 3 dosing groups, 9subjects were randomized to receive ivabradine and 3to receive placebo. Subjects received a single oral doseof ivabradine 2.5, 5, or 10 mg and after a 3-daywashout period, repeat doses of 2.5, 5, or 10 mg BIDfor 4.5 days. Blood and urine samples were collectedover 72 hours during each period, and levels ofivabradine and its metabolite S18982 were determinedby using validated LC-MS/MS, followed by noncom-partmental PK analysis. For PD properties and toler-ability, 24-hour Holter recordings were obtained: atbaseline, after a single dose, after repeated doses, andafter the last dose. Serial resting 12-lead ECG assess-ments were also performed throughout the study.
Results: Forty-eight subjects were enrolled, and 45completed the study. After single doses of 2.5, 5, and10 mg, respective mean Cmax levels of ivabradine were
June 2013
9, 15, and 39 ng/mL, and mean AUC0–last values were30, 52, and 121 ng d h/mL. At steady state, meanCmax,ss levels were 11, 19, and 42 ng/mL, reached at amedian Tmax of 0.67 hour for all 3 doses. The meanAUC0–τ levels were 43, 58, and 139 ng d h/mL,respectively. The PK findings were linear with doseand time. Decreases in mean HR on both the Holterrecordings and ECGs were observed in all of theivabradine groups compared with placebo. After therepeated doses, mean decreases in HR were greaterthan those for the single doses for the same period.Statistically significant differences were observedbetween the 5- and 10-mg ivabradine groups andplacebo. A total of 3 adverse events were reported in2 subjects receiving ivabradine; both fully recoveredwithout sequelae.
Conclusions: Single and repeated administration ofivabradine were generally well tolerated in thesehealthy male Korean volunteers. Ivabradine inducedsignificant reductions in HR, especially at doses of5 and 10 mg. PK/PD characteristics were similar tothose found in white subjects, suggesting that thedose concentration–response relationship of ivabra-dine is similar between Korean and white subjects.
819
Clinical Therapeutics
(Clin Ther. 2013;35:819–835) & 2013 Elsevier HSJournals, Inc. All rights reserved.
Key words: healthy individual, ivabradine, pharma-codynamics, pharmacokinetics.
INTRODUCTIONThere have been several studies on the associationbetween elevated resting heart rate (HR) and cardio-vascular mortality.1–7 On the basis of these studies,elevated HR is considered an independent risk factorfor cardiovascular events.4,8,9 Because HR enhance-ment can increase oxygen demand and decreaseperfusion, it may result in an imbalance betweenmyocardial oxygen supply and demand, thus leadingto myocardial ischemia. Therefore, HR control hasbeen 1 of the important therapeutic targets in patientswith ischemic heart disease.10 Moreover, with regardto heart failure, elevated HR may be an early instantcompensatory mechanism before it finally contributesto heart failure progression itself. A rapid HR canshorten diastolic filling time, worsen ventricular fillingand stroke volume, and finally lead to inefficientmyocardial performance.11 In view of the above,drugs that lower HR would therefore be beneficialfor various cardiovascular diseases.12 Some calciumchannel antagonists and β-blockers have been used forHR reduction in several types of heart disease forthese reasons, but other unwanted effects, such asdecreased cardiac contractility, modified cardiac con-duction, and noncardiac effects, have also beenseen.13,14 In comparison, ivabradine, a specific, dose-dependent If inhibitor, selectively reduces HR byinhibiting the pacemaker current in the sinoatrialnode, with no direct effects on myocardial contrac-tility or ventricular repolarization.15–19 Several studieshave demonstrated the anti-ischemic efficacy of ivab-radine compared with placebo in patients with chronicstable angina pectoris, as well as its noninferiority toatenolol or amlodipine.20–22 Some previous studieshave also shown that ivabradine can improve heartfailure outcomes in patients with symptomatic heartfailure and elevated HR.23 Moreover, ivabradine isexpected to prevent or even reverse left ventricularremodeling due to its effects on optimizing cardiacworkload and myocardial oxygen consumption.24–27
Previously, some characteristics of ivabradine hasbeen known by other studies. Based on previouspreclinical studies, ivabradine is a highly water-
820
soluble molecule that is rapidly absorbed and hashigh first-pass metabolism. Cmax was reached after 20minutes in rats and 1 hour in dogs, and ivabradinewas extensively metabolized in animal species bycytochrome P450 3A4. Renal clearance (CLR) con-tributed to �5% of the total clearance. In addition,Cmax after chronic administration at the recommendeddose of 5 mg BID was �22 ng/mL. In addition, in aprevious in vivo study, the kinetic profile for HRreduction was similar in rats and pigs after oraladministration, with the peak effect generally reachedwithin 3 to 4 hours and lasting 8 to 12 hours. Inanother study,32 S18982 (N-desmethyl ivabradine)was determined to be the main active, primarymetabolite of ivabradine in human plasma. Thereare previous studies on the pharmacokinetics (PK)and pharmacodynamics (PD) of ivabradine, althoughthese were mainly conducted in Caucasians.29–32
Therefore, our study were 3-fold: (1) to assess thePK profile of ivabradine and its main active metaboliteS18982 in healthy male Korean volunteers after singleand repeated oral administration of ivabradine versusplacebo; (2) to use the study results to bridge the datafrom white subjects; and (3) to make ivabradinemarketing approval in Korea. We also evaluated thePD of ivabradine by measuring its effects on HR andthe tolerability of oral ivabradine administration.
SUBJECTS AND METHODSSubjects
Male Korean volunteers between the ages of 18 and40 years were enrolled in the study. They were all ingood health, as determined by their medical history,physical examination, vital signs, ECG, and routineclinical laboratory test results. All laboratory testswere performed in the Department of LaboratoryMedicine of the Asan Medical Center (Seoul, Republicof Korea), which is accredited by the Korean Associ-ation of Quality Assurance for Clinical Laboratoriesand certified by the College of American Pathologists.Study subjects had a body mass index between 18 and25 kg/m2 and were negative for HIV1, HIV2, andhepatitis B and C virus. They had no history ofalcoholism, smoking, or hypersensitivity to at least 1drug. Volunteers who had donated blood within thepast 3 months, or were recipients of a transfusionwithin the past year, or who had taken any medica-tion (modern medicine, medicinal herbs, or traditionalmedicine) within 2 weeks before starting the study
Volume 35 Number 6
H.Y. Choi et al.
were excluded. In addition, grapefruit juice andquinine-containing beverages were not permitted dur-ing their hospitalization. On the basis of a restingECG recorded at the screening visit, nonsinus rhythmand resting HR o60 beats/min or 490 beats/minwere also criteria for exclusion.
All study subjects provided written informed con-sent before participation, and the trial was conductedin accordance with the International Conference onHarmonisation Guideline for Good Clinical Practiceand the Declaration of Helsinki.33,34 The institutionalreview board at the Asan Medical Center had ap-proved the protocol before the start of the study. Thisstudy was managed locally by the InternationalCentre for Therapeutic Research in the Republicof Korea.
Study DesignThis randomized, double-blind, placebo-controlled,
Phase I study was conducted at Asan Medical Center.Single and repeated oral administration of 3 doses ofivabradine (2.5, 5, and 10 mg, manufactured andpackaged by Les Laboratoires Servier Industrie [Gidy,France]) were tested. For each of the 3 dosing groups,9 subjects were randomized to receive ivabradine and3 to receive placebo. The randomization process wasfirst stratified, with complete permutation blocks on the3 dose groups, after which the treatments were allo-cated on day 1 (D1) as unbalanced, nonstratified,nonadaptative, and noncentralized. In each group,treatment units were allocated to the study subjects innumerical order according to the chronological order oftheir inclusion. The randomization list was designed bythe Biometrics Department of the Institut de RecherchesInternationales Servier (I.R.I.S.) (Courbevoie, France)and generated by Les Laboratoires Servier Industrie.
All study subjects were given a single administra-tion of ivabradine during period 1, according to theirdosing group. After a 3-day washout period, theywere then given repeated administrations BID for 4.5days during period 2. Each study subject was includedin only 1 dosing group. Study drugs were adminis-tered concomitantly with a standard breakfast (orstandard dinner for evening repeated doses), whichwas served regularly. Subjects were hospitalized for 11consecutive days, with administration on day 0 (D0)to obtain baseline values, and were discharged on themorning of day 11, at 72 hours after the last repeatedadministration.
June 2013
To maintain the blind, 1 of 3 sets of sealedenvelopes was given to the investigator, with thesecond kept by I.R.I.S. and the third by the Interna-tional Centre for Therapeutic Research to enablebreaking the code for the study subjects, if requiredduring the study. The investigator’s set was stored in asafe place accessible only to personnel authorized tocarry out unblinding. The code was to be broken onlyif absolutely necessary to ascertain the type of treat-ment received to choose crucial therapeutic options.The active and placebo tablets used were identical inappearance, and the 24-hour Holter recordings wereread by staff at the Clinical Experimental ResearchLaboratory at Sahlgrenska University Hospital(Gothenburg, Sweden), who were blinded in termsof treatment allocation.
Blood and Urine Sample CollectionFor PK measurements of ivabradine and its metab-
olite S18982, 2.5 mL of blood was collected at each ofthe following times: predose, 20 minutes, 40 minutes,and 1, 1.5, 2, 3, 4, 5, 6, 8, 10, 12, 16, 24, 36, 48, 60,and 72 hours after the D1 single administration(period 1) and the day 8 (D8) last repeated dose(period 2), respectively. Urine samples to assay ivab-radine and S18982 were collected during the follow-ing time intervals: predose (–12 hours to 0 hour), then0 to 12, 12 to 24, 24 to 48, and 48 to 72 hours afterthe D1 single dose (period 1) and the D8 last repeateddose (period 2).
Blood samples were drawn into a lithium hepari-nized tube and immediately centrifuged at 3500(�500) rpm for 5 minutes at 41C, after which theplasma was transferred into 2 polypropylene tubes(�0.6 mL/tube) and stored at –201C until shipped foranalysis on dry ice.
Urine samples were collected in labeled polypropy-lene containers. The exact volume of urine collected,as well as the starting and ending collection times,were checked. For each time interval, two 20-mLaliquots were transferred into 2 polypropylene tubesand stored at –201C until shipped for analysis ondry ice.
Analytical MethodPlasma concentrations of ivabradine and its metab-
olite S18982 were determined at Applied AnalyticalIndustries (AAI Pharma Inc, Neu-Ulm, Germany) byusing a validated method based on liquid–solid phase
821
Clinical Therapeutics
extraction of plasma samples with a sample volume of250 μL and liquid-chromatographic separation (Shi-madzu Corporation, Kyoto, Japan) coupled with tan-dem mass spectrometry detection (API 365 massspectrometer, PerkinElmer-Sciex Instruments, Waltham,Massachusetts).35 S16070-2 was used as the internalstandard (IS). All chemical entities were provided by thesponsor. The lower limit of quantitation (LLoQ) was0.25 ng/mL.
Urine sample measurement was performed at AAI-Pharma according to a validated method involvingliquid–liquid extraction by using a sample volume of500 μL, HPLC, and fluorescence detection. The LLoQwas 1 ng/mL.
Briefly, frozen plasma samples were thawed at roomtemperature, vortexed for 15 seconds, and centrifuged at5 (�3)1C for 15 minutes, after which each aliquot ofplasma (250 μL) was mixed with IS (50 μL of a 50-ng/mL solution) and 200 μL of 0.1 N HCl and applied tothe extraction column (Oasis MCX cartridges [1 cc,30 mg, Waters Corporation, Milford, Massachusetts])previously solvated with 0.5 mL of methanol andconditioned with 0.4 mL of 0.01 N HCl. After washing,the analytes were eluted with 3 � 0.4 mL of methanol/ammonium hydroxide (25%) 25/1.3 (vol/vol), evapo-rated, and then injected into the LC-MS/MS system.Chromatographic separation was achieved on a Kroma-sil 100 C18 column (150 � 2 mm, 5 μm [AkzoNobel,Bohus, Sweden]) at 501C with a flow rate of 0.2 mL/min.
Frozen urine samples were thawed in a water bathat room temperature, after which each aliquot of urine(500 μL) was added to 50 μL of IS solution, 150 μL ofsodium hydroxide (1 mol/L), and 4 mL of diethylether. After centrifugation at 4000 rpm for 15 minutes,the organic layer was transferred into a new glass tubewith 150 μL of hydrochloric acid (0.1 mol/L). Afterrepeated centrifugation, the organic layer was aspi-rated, the residual solvent was evaporated, and theremaining extract was injected into the HPLC system.
For plasma, the validation scheme covered theanalysis of calibration curves and quality controlsamples in the range of 0.25 to 250 ng/mL. For urine,the analysis of calibration curves ranged from 1 to500 ng/mL. The calibration curves were linear overthe entire calibrated range for ivabradine and S18982in plasma and urine, and with typical coefficients ofdetermination 40.99. The quality control sampleswere within the acceptance limits (�15%) at the low,medium, and high levels.
822
PD MeasurementsFor PD measurements, 24-hour Holter recordings
(DigiTrakPlus Holter Recorders, Philips Healthcare,Andover, Massachusetts) were performed on D0, D1,D8, and day 10. The subjects were each given a diaryand asked to record sleeping times and any symptomsfor each Holter recording period. In addition, a resting12-lead ECG (MAC 5000 ECG system, GE MedicalSystems Information Technologies, Inc, Milwaukee,Wisconsin) was performed at each of the followingtimes: pre-“theoretical dose” on D0, then 1, 2, 3, 4, 5,6, and 12 hours later; before the single administrationon D1, then 1, 2, 3, 4, 5, 6, 12, 24, and 48 hours afterthe single administration; before the day 4 morningdose, then 1, 2, 3, 4, 5, 6, and 12 hours after themorning dose; 3 and 12 hours after the morning doseon days 5, 6, and 7; and before the last repeatedadministration on D8, then 1, 2, 3, 4, 5, 6, 12, 24, 48,and 72 hours after the last administration.
Tolerability MeasurementsFor tolerability measurements, adverse events were
checked throughout the study. Physical examinationsand vital signs (Vital Signs Monitor 300 series, WelchAllyn Inc, Skaneateles Falls, New York), includingsystolic blood pressure and diastolic blood pressure,were performed at D1 and on each day from D0 untilday 11. Laboratory tests, including hematologic anal-ysis (red blood cell count, hemoglobin, hematocrit,platelet count, and white blood cell count), chemistry(electrolytes, hepatic enzymes, total bilirubin, alkalinephosphatase, creatinine, fasting blood glucose, totalproteins, albumin, cholesterol, triglycerides, phospho-rus, creatinine phosphokinase, calcium, urea, and uricacid), and urine analysis were checked. Twenty-four–hour Holter recordings were used to evaluate toler-ability, with parameters as follows: mean HR, lowestHR, and highest HR over the respective 24-hour,diurnal, and nocturnal periods; frequency and dura-tion of prolonged RR intervals (42 seconds duringawake time, 43 seconds during sleep); and thenumber and duration of bradycardia episodes (HRo30 beats/min during sleep, o40 beats/min duringawake time). Resting 12-lead ECG data were alsoused to evaluate tolerability; HR, PR interval, QRSduration, QT interval, QT intervals corrected for HRby using Bazett's and Fridericia's formulas, andabnormalities were assessed.36,37 If a subject presentedat any time with poorly tolerated bradycardia or with
Volume 35 Number 6
H.Y. Choi et al.
HR o50 beats/min on the 12-lead ECG after admin-istration, the investigators considered whether toprematurely discontinue the subject’s treatment.
Statistical AnalysisTo evaluate the impact of an absence of global
randomization, the stability of the experimental designwas studied. The 3 groups (A, B, and C) werecompared in terms of age, blood pressure (BP) (atbaseline), and mean HR over the 24-hour, diurnal,nocturnal, awake, and asleep periods (baseline Holtermeasurements) by using descriptive statistics bygroup. The demographic characteristics were alsosummarized by using descriptive statistics.
All statistical analyses were performed by usingSAS version 9.2 (SAS Institute, Inc, Cary, NorthCarolina) and R version 2.15.0 (R Foundation forStatistical Computing, Vienna, Austria).
PK and PD AnalysisPK analysis was conducted in subjects who com-
pleted the total number of planned blood samplings.Noncompartmental PK analysis was performed on theindividual plasma concentration–time profiles of ivab-radine and S18982 by using WinNonlin softwareversion 6.1 (Pharsight Corporation, Sunnyvale,California).38 For this noncompartmental analysis,plasma concentrations below the LLoQ weresubstituted with zero. The following individual PKparameters were calculated or obtained directly fromthe plasma concentration–time profile for each subjectafter a single dose (D1) and at steady state (D8) forivabradine and S18982, respectively: Cmax, Tmax,Cmin,ss (steady state only), t½β, AUC0–last, AUC0–t,and AUC0–∞ for plasma, amount excreted in urine(Ae), excreted fraction (fe), and CLR for urine.
Cmax and Tmax were determined from the observeddata. AUC0–last was estimated by linear trapezoidalsummation in the ascending period and by log/lineartrapezoidal summation in the descending period.AUC0–t was calculated from time 0 to 12 hours.AUC0–∞ was calculated as the sum of AUC0–last andC0–last/λz, in which C0–last corresponds to the lastmeasured concentration and λz is the rate constantof the plasma terminal phase calculated by linear reg-ression of the slope of the terminal portion of thelog-transformed plasma concentration–time curve.Values for t½β were also calculated by λz (ie, ln2/λz).Considering these parameters, the molar metabolic
June 2013
ratio, linearity factor (LF), and accumulation ratio(Rac[AUCτ]) were calculated as follows:
MR¼ AUCτmetaboliteAUCτ parent drug
�Molecular weightparent drugMolecular weightmetabolite
� 100
LF¼ AUCτ steady state
AUCsingle dose
RacðAUCτÞ¼AUCτ steady state
AUC12 single dose
Ae was the cumulative amount of drug excreted in theurine during the entire sampling period, andfe (%) was the fraction of drug that was excreted inurine, calculated as Ae divided by dose. For metabolites,the dose must be corrected as molecular weights.
CLR was the cumulative amount of drug excreted inurine in time t (Ae[t0,t]) divided by the AUC calculatedfrom time zero to the latest time point at which theurine concentration is quantifiable (AUC[t0,t]).
PD analysis was conducted in subjects from theper-protocol set, which was defined as subjects havingcompleted the study with evaluations of PD criteriaafter study drug administration and with no relevantdeviations interfering with the PD evaluations. For PDanalysis, the changes in HR between baseline and aftera single administration, and between baseline andafter repeated administration, were studied accordingto Holter monitoring over the 24-hour, diurnal,nocturnal, awake, and asleep periods. At 3 and 12hours after drug administration, 12-lead ECG resultswith any HR change were evaluated and comparedbetween each of the ivabradine dose groups andplacebo. Descriptive statistics and CIs of the HRdifferences between each dose of ivabradine andplacebo were obtained by using a nonparametricmethod based on the Hodges-Lehmann estimate forindependent samples.39
Tolerability AnalysisTo assess ivabradine tolerability, several collected
parameters, including vital signs, laboratory test re-sults, ECG, and Holter recording results, were as-sessed by using descriptive statistics according to doseand overall. Adverse events, abnormal biologicalvalues, and physical examinations were also
823
Clinical Therapeutics
described. Tolerability analysis was performed onsubjects from the randomized set, which was definedas subjects randomized to treatment and havingreceived at least 1 dose of study drug.
RESULTSSubjects
Of the 48 healthy male Korean subjects enrolled inthis study, 23 were included in group A (ivabradine2.5 mg vs placebo), 13 in group B (ivabradine 5 mg vsplacebo), and 12 in group C (ivabradine 10 mg vsplacebo). Twelve subjects were substituted: 11 fromgroup A (2 due to withdrawals and 9 due to HR or BPvalues at inclusion out of the ranges specified in theprotocol) and 1 from group B (withdrawal). Thirty-sixsubjects were treated with ivabradine: 17 from groupA, 10 from group B, and 9 from group C. A total of45 subjects completed the study, and 3 were with-drawn: 2 from group A due to adverse events and1 from group B for a nonmedical reason. Although ahigh number of subjects were substituted in group A,the planned distribution was achieved.
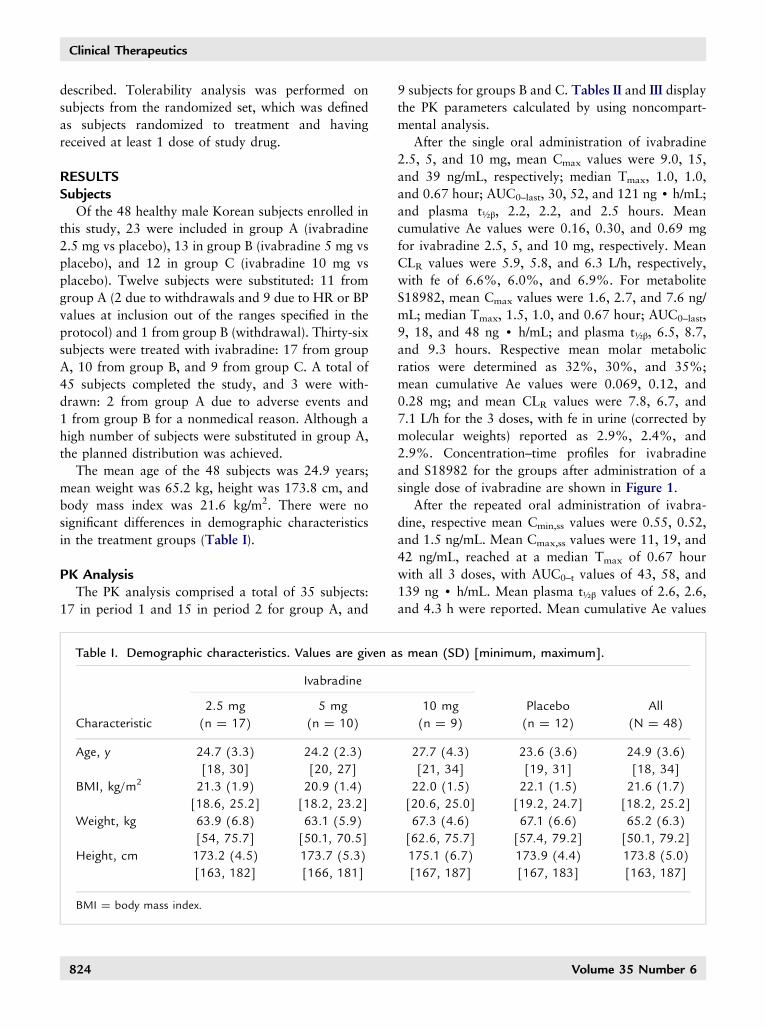
The mean age of the 48 subjects was 24.9 years;mean weight was 65.2 kg, height was 173.8 cm, andbody mass index was 21.6 kg/m2. There were nosignificant differences in demographic characteristicsin the treatment groups (Table I).
PK AnalysisThe PK analysis comprised a total of 35 subjects:
17 in period 1 and 15 in period 2 for group A, and
Table I. Demographic characteristics. Values are given a
Ivabradine
2.5 mg 5 mg
Characteristic (n ¼ 17) (n ¼ 10)
Age, y 24.7 (3.3) 24.2 (2.3)
[18, 30] [20, 27]
BMI, kg/m2 21.3 (1.9) 20.9 (1.4)
[18.6, 25.2] [18.2, 23.2]
Weight, kg 63.9 (6.8) 63.1 (5.9)
[54, 75.7] [50.1, 70.5]
Height, cm 173.2 (4.5) 173.7 (5.3)
[163, 182] [166, 181]
BMI ¼ body mass index.
824
9 subjects for groups B and C. Tables II and III displaythe PK parameters calculated by using noncompart-mental analysis.
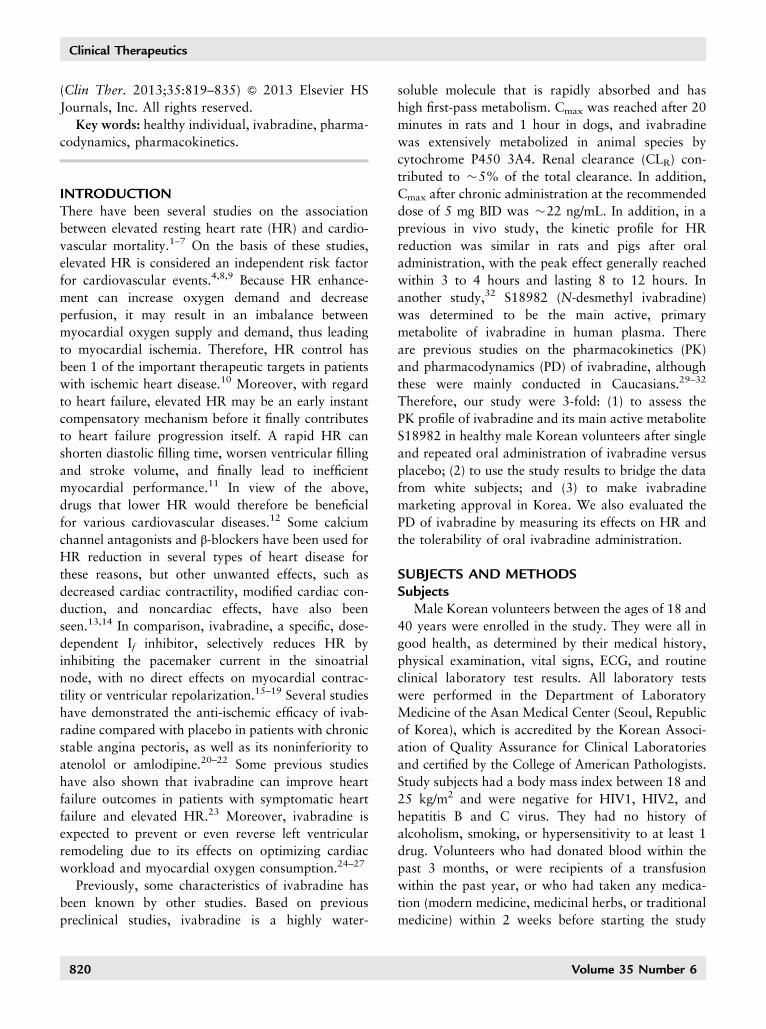
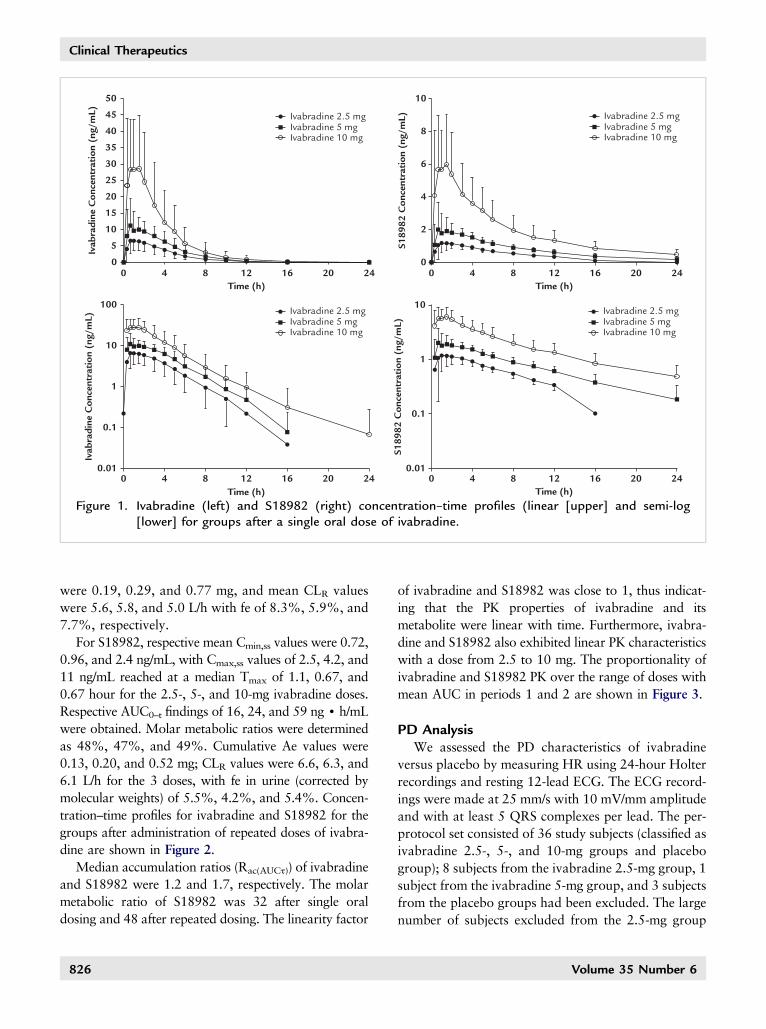
After the single oral administration of ivabradine2.5, 5, and 10 mg, mean Cmax values were 9.0, 15,and 39 ng/mL, respectively; median Tmax, 1.0, 1.0,and 0.67 hour; AUC0–last, 30, 52, and 121 ng d h/mL;and plasma t½β, 2.2, 2.2, and 2.5 hours. Meancumulative Ae values were 0.16, 0.30, and 0.69 mgfor ivabradine 2.5, 5, and 10 mg, respectively. MeanCLR values were 5.9, 5.8, and 6.3 L/h, respectively,with fe of 6.6%, 6.0%, and 6.9%. For metaboliteS18982, mean Cmax values were 1.6, 2.7, and 7.6 ng/mL; median Tmax, 1.5, 1.0, and 0.67 hour; AUC0–last,9, 18, and 48 ng d h/mL; and plasma t½β, 6.5, 8.7,and 9.3 hours. Respective mean molar metabolicratios were determined as 32%, 30%, and 35%;mean cumulative Ae values were 0.069, 0.12, and0.28 mg; and mean CLR values were 7.8, 6.7, and7.1 L/h for the 3 doses, with fe in urine (corrected bymolecular weights) reported as 2.9%, 2.4%, and2.9%. Concentration–time profiles for ivabradineand S18982 for the groups after administration of asingle dose of ivabradine are shown in Figure 1.
After the repeated oral administration of ivabra-dine, respective mean Cmin,ss values were 0.55, 0.52,and 1.5 ng/mL. Mean Cmax,ss values were 11, 19, and42 ng/mL, reached at a median Tmax of 0.67 hourwith all 3 doses, with AUC0–t values of 43, 58, and139 ng d h/mL. Mean plasma t½β values of 2.6, 2.6,and 4.3 h were reported. Mean cumulative Ae values
s mean (SD) [minimum, maximum].
10 mg Placebo All
(n ¼ 9) (n ¼ 12) (N ¼ 48)
27.7 (4.3) 23.6 (3.6) 24.9 (3.6)
[21, 34] [19, 31] [18, 34]
22.0 (1.5) 22.1 (1.5) 21.6 (1.7)
[20.6, 25.0] [19.2, 24.7] [18.2, 25.2]
67.3 (4.6) 67.1 (6.6) 65.2 (6.3)
[62.6, 75.7] [57.4, 79.2] [50.1, 79.2]
175.1 (6.7) 173.9 (4.4) 173.8 (5.0)
[167, 187] [167, 183] [163, 187]
Volume 35 Number 6
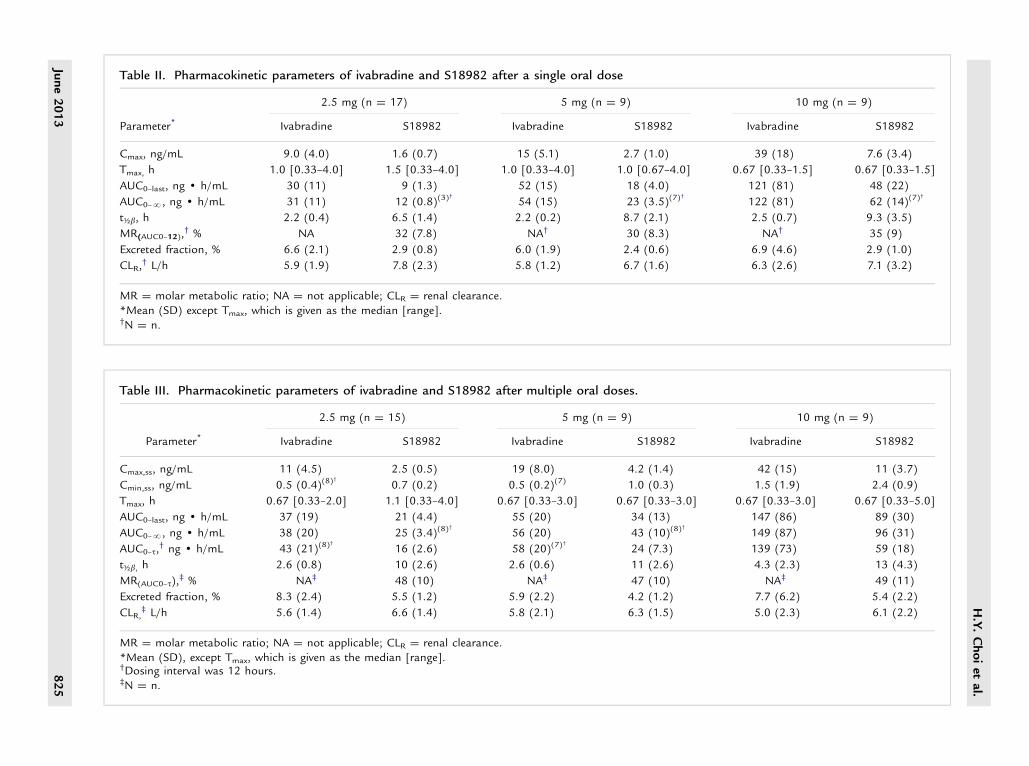
Table II. Pharmacokinetic parameters of ivabradine and S18982 after a single oral dose
2.5 mg (n ¼ 17) 5 mg (n ¼ 9) 10 mg (n ¼ 9)
Parameter* Ivabradine S18982 Ivabradine S18982 Ivabradine S18982
Cmax, ng/mL 9.0 (4.0) 1.6 (0.7) 15 (5.1) 2.7 (1.0) 39 (18) 7.6 (3.4)
Tmax, h 1.0 [0.33–4.0] 1.5 [0.33–4.0] 1.0 [0.33–4.0] 1.0 [0.67–4.0] 0.67 [0.33–1.5] 0.67 [0.33–1.5]
AUC0–last, ng d h/mL 30 (11) 9 (1.3) 52 (15) 18 (4.0) 121 (81) 48 (22)
AUC0–N, ng d h/mL 31 (11) 12 (0.8)(3)†
54 (15) 23 (3.5)(7)†
122 (81) 62 (14)(7)†
t½b, h 2.2 (0.4) 6.5 (1.4) 2.2 (0.2) 8.7 (2.1) 2.5 (0.7) 9.3 (3.5)
MR(AUC0–12),† % NA 32 (7.8) NA† 30 (8.3) NA† 35 (9)
Excreted fraction, % 6.6 (2.1) 2.9 (0.8) 6.0 (1.9) 2.4 (0.6) 6.9 (4.6) 2.9 (1.0)
CLR,† L/h 5.9 (1.9) 7.8 (2.3) 5.8 (1.2) 6.7 (1.6) 6.3 (2.6) 7.1 (3.2)
MR ¼ molar metabolic ratio; NA ¼ not applicable; CLR ¼ renal clearance.*Mean (SD) except Tmax, which is given as the median [range].†N ¼ n.
Table III. Pharmacokinetic parameters of ivabradine and S18982 after multiple oral doses.
2.5 mg (n ¼ 15) 5 mg (n ¼ 9) 10 mg (n ¼ 9)
Parameter* Ivabradine S18982 Ivabradine S18982 Ivabradine S18982
Cmax,ss, ng/mL 11 (4.5) 2.5 (0.5) 19 (8.0) 4.2 (1.4) 42 (15) 11 (3.7)
Cmin,ss, ng/mL 0.5 (0.4)(8)†
0.7 (0.2) 0.5 (0.2)(7) 1.0 (0.3) 1.5 (1.9) 2.4 (0.9)
Tmax, h 0.67 [0.33–2.0] 1.1 [0.33–4.0] 0.67 [0.33–3.0] 0.67 [0.33–3.0] 0.67 [0.33–3.0] 0.67 [0.33–5.0]
AUC0–last, ng d h/mL 37 (19) 21 (4.4) 55 (20) 34 (13) 147 (86) 89 (30)
AUC0–N, ng d h/mL 38 (20) 25 (3.4)(8)†
56 (20) 43 (10)(8)†
149 (87) 96 (31)
AUC0–t,† ng d h/mL 43 (21)(8)
†
16 (2.6) 58 (20)(7)†
24 (7.3) 139 (73) 59 (18)
t½b, h 2.6 (0.8) 10 (2.6) 2.6 (0.6) 11 (2.6) 4.3 (2.3) 13 (4.3)
MR(AUC0–t),‡ % NA‡ 48 (10) NA‡ 47 (10) NA‡ 49 (11)
Excreted fraction, % 8.3 (2.4) 5.5 (1.2) 5.9 (2.2) 4.2 (1.2) 7.7 (6.2) 5.4 (2.2)
CLR,‡ L/h 5.6 (1.4) 6.6 (1.4) 5.8 (2.1) 6.3 (1.5) 5.0 (2.3) 6.1 (2.2)
MR ¼ molar metabolic ratio; NA ¼ not applicable; CLR ¼ renal clearance.*Mean (SD), except Tmax, which is given as the median [range].†Dosing interval was 12 hours.‡N ¼ n.
H.Y.Choiet
al.
June2013
825
50 10
8
6
4
2
0
45
40
35
30
25
20
15
10
100
10
1
0.1
0.01
10
1
0.1
0.01
Ivab
radi
ne C
once
ntra
tion
(ng
/mL)
S189
82 C
once
ntra
tion
(ng
/mL)
S189
82 C
once
ntra
tion
(ng
/mL)
Ivab
radi
ne C
once
ntra
tion
(ng
/mL)
5
00 4 8 12
Time (h)16 20 24 0 4 8 12
Time (h)16 20 24
0 4 8 12Time (h)
16 20 240 4 8 12Time (h)
16 20 24
Ivabradine 2.5 mgIvabradine 5 mgIvabradine 10 mg
Ivabradine 2.5 mgIvabradine 5 mgIvabradine 10 mg
Ivabradine 2.5 mgIvabradine 5 mgIvabradine 10 mg
Ivabradine 2.5 mgIvabradine 5 mgIvabradine 10 mg
Figure 1. Ivabradine (left) and S18982 (right) concentration–time profiles (linear [upper] and semi-log[lower] for groups after a single oral dose of ivabradine.
Clinical Therapeutics
were 0.19, 0.29, and 0.77 mg, and mean CLR valueswere 5.6, 5.8, and 5.0 L/h with fe of 8.3%, 5.9%, and7.7%, respectively.
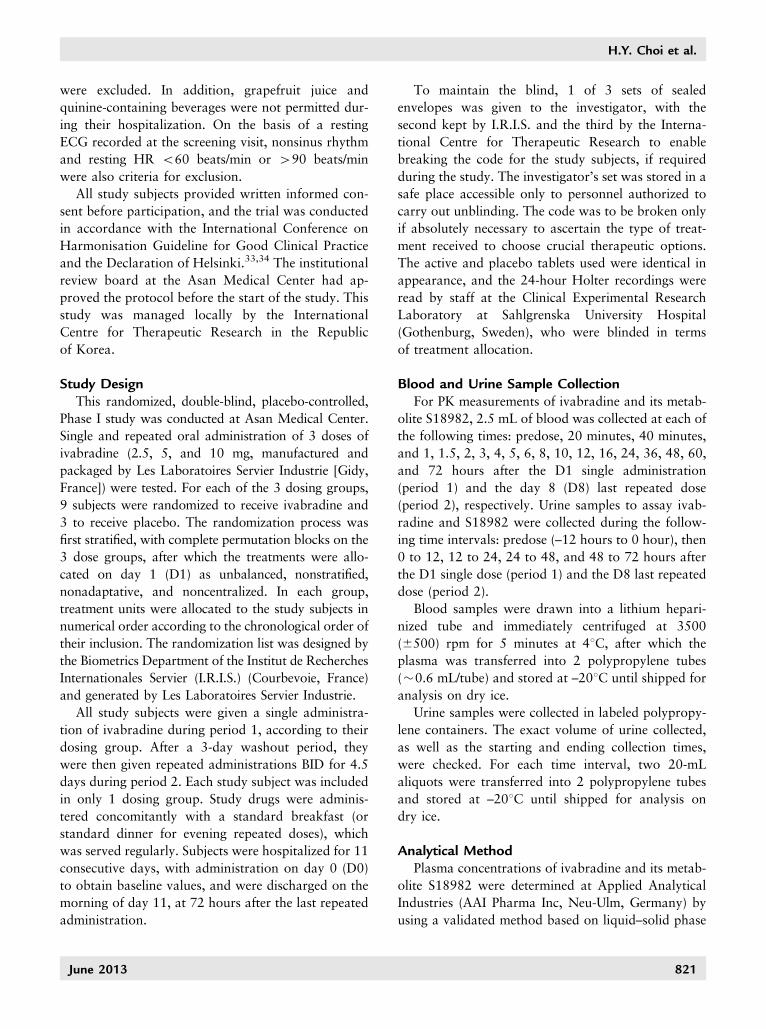
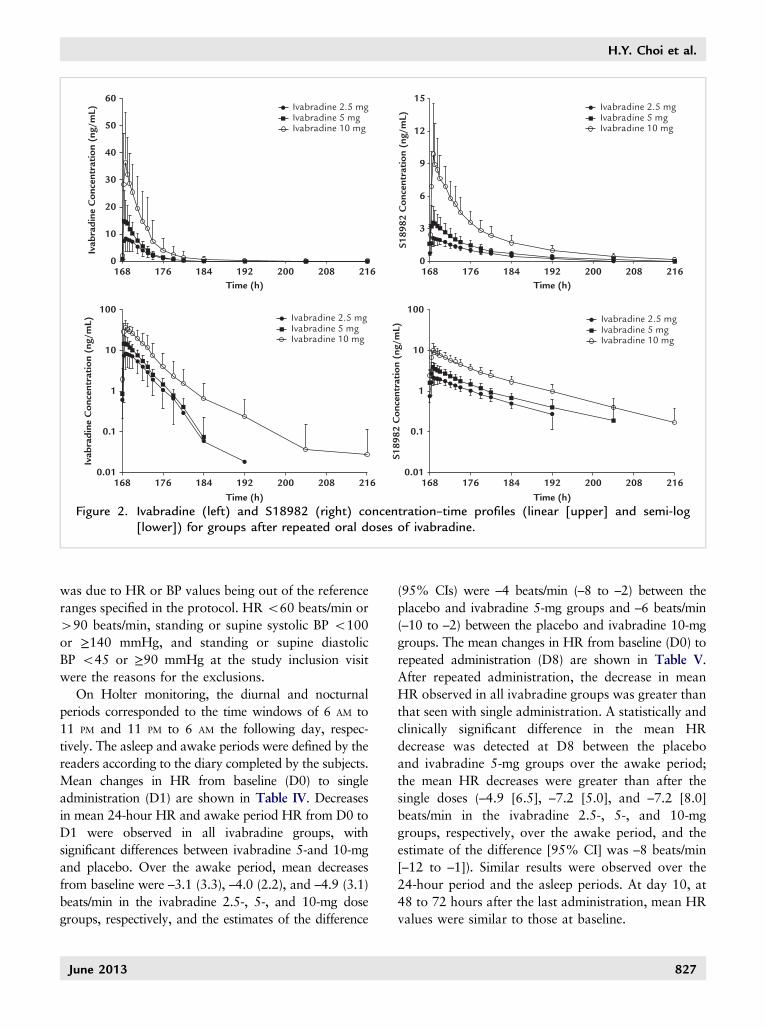
For S18982, respective mean Cmin,ss values were 0.72,0.96, and 2.4 ng/mL, with Cmax,ss values of 2.5, 4.2, and11 ng/mL reached at a median Tmax of 1.1, 0.67, and0.67 hour for the 2.5-, 5-, and 10-mg ivabradine doses.Respective AUC0–t findings of 16, 24, and 59 ng d h/mLwere obtained. Molar metabolic ratios were determinedas 48%, 47%, and 49%. Cumulative Ae values were0.13, 0.20, and 0.52 mg; CLR values were 6.6, 6.3, and6.1 L/h for the 3 doses, with fe in urine (corrected bymolecular weights) of 5.5%, 4.2%, and 5.4%. Concen-tration–time profiles for ivabradine and S18982 for thegroups after administration of repeated doses of ivabra-dine are shown in Figure 2.
Median accumulation ratios (Rac(AUCτ)) of ivabradineand S18982 were 1.2 and 1.7, respectively. The molarmetabolic ratio of S18982 was 32 after single oraldosing and 48 after repeated dosing. The linearity factor
826
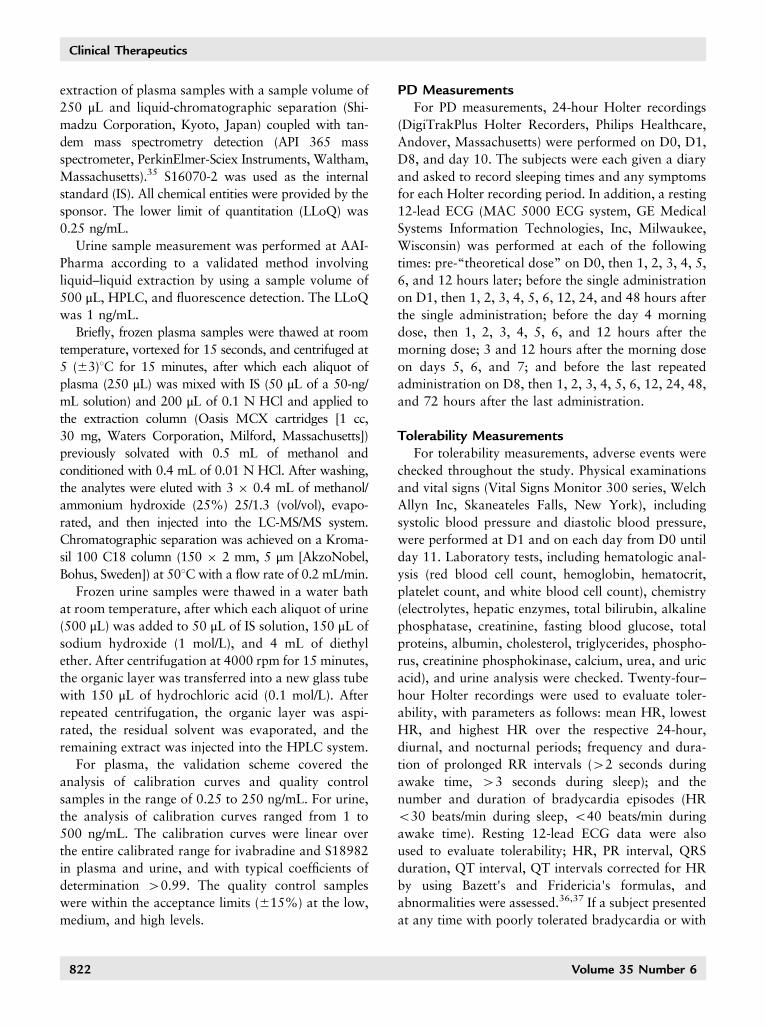
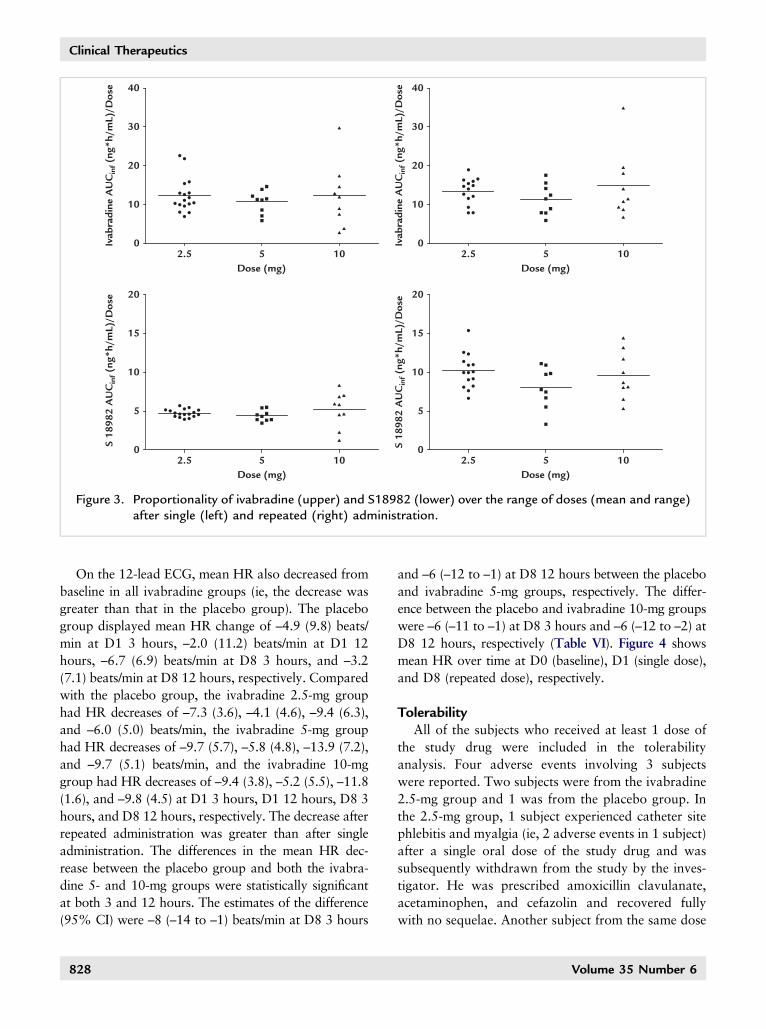
of ivabradine and S18982 was close to 1, thus indicat-ing that the PK properties of ivabradine and itsmetabolite were linear with time. Furthermore, ivabra-dine and S18982 also exhibited linear PK characteristicswith a dose from 2.5 to 10 mg. The proportionality ofivabradine and S18982 PK over the range of doses withmean AUC in periods 1 and 2 are shown in Figure 3.
PD AnalysisWe assessed the PD characteristics of ivabradine
versus placebo by measuring HR using 24-hour Holterrecordings and resting 12-lead ECG. The ECG record-ings were made at 25 mm/s with 10 mV/mm amplitudeand with at least 5 QRS complexes per lead. The per-protocol set consisted of 36 study subjects (classified asivabradine 2.5-, 5-, and 10-mg groups and placebogroup); 8 subjects from the ivabradine 2.5-mg group, 1subject from the ivabradine 5-mg group, and 3 subjectsfrom the placebo groups had been excluded. The largenumber of subjects excluded from the 2.5-mg group
Volume 35 Number 6
Ivabradine 2.5 mgIvabradine 5 mgIvabradine 10 mg
Ivabradine 2.5 mgIvabradine 5 mgIvabradine 10 mg
Ivabradine 2.5 mgIvabradine 5 mgIvabradine 10 mg
Ivabradine 2.5 mgIvabradine 5 mgIvabradine 10 mg
Ivab
radi
ne C
once
ntra
tion
(ng
/mL)
Ivab
radi
ne C
once
ntra
tion
(ng
/mL)
S189
82 C
once
ntra
tion
(ng
/mL)
S189
82 C
once
ntra
tion
(ng
/mL)
60 15
12
9
6
3
0
50
40
30
20
10
0
100
10
1
0.1
0.01
100
10
1
0.1
0.01
168 176 184 192Time (h)
200 208 216 168 176 184 192Time (h)
200 208 216
168 176 184 192Time (h)
200 208 216 168 176 184 192Time (h)
200 208 216
Figure 2. Ivabradine (left) and S18982 (right) concentration–time profiles (linear [upper] and semi-log[lower]) for groups after repeated oral doses of ivabradine.
H.Y. Choi et al.
was due to HR or BP values being out of the referenceranges specified in the protocol. HR o60 beats/min or490 beats/min, standing or supine systolic BP o100or ≥140 mmHg, and standing or supine diastolicBP o45 or ≥90 mmHg at the study inclusion visitwere the reasons for the exclusions.
On Holter monitoring, the diurnal and nocturnalperiods corresponded to the time windows of 6 AM to11 PM and 11 PM to 6 AM the following day, respec-tively. The asleep and awake periods were defined by thereaders according to the diary completed by the subjects.Mean changes in HR from baseline (D0) to singleadministration (D1) are shown in Table IV. Decreasesin mean 24-hour HR and awake period HR from D0 toD1 were observed in all ivabradine groups, withsignificant differences between ivabradine 5-and 10-mgand placebo. Over the awake period, mean decreasesfrom baseline were –3.1 (3.3), –4.0 (2.2), and –4.9 (3.1)beats/min in the ivabradine 2.5-, 5-, and 10-mg dosegroups, respectively, and the estimates of the difference
June 2013
(95% CIs) were –4 beats/min (–8 to –2) between theplacebo and ivabradine 5-mg groups and –6 beats/min(–10 to –2) between the placebo and ivabradine 10-mggroups. The mean changes in HR from baseline (D0) torepeated administration (D8) are shown in Table V.After repeated administration, the decrease in meanHR observed in all ivabradine groups was greater thanthat seen with single administration. A statistically andclinically significant difference in the mean HRdecrease was detected at D8 between the placeboand ivabradine 5-mg groups over the awake period;the mean HR decreases were greater than after thesingle doses (–4.9 [6.5], –7.2 [5.0], and –7.2 [8.0]beats/min in the ivabradine 2.5-, 5-, and 10-mggroups, respectively, over the awake period, and theestimate of the difference [95% CI] was –8 beats/min[–12 to –1]). Similar results were observed over the24-hour period and the asleep periods. At day 10, at48 to 72 hours after the last administration, mean HRvalues were similar to those at baseline.
827
40
30
20
10
02.5
20
15
10
5
02.5
Dose (mg)5 10
Ivab
radi
ne A
UC
inf (
ng*h
/mL)
/Dos
eS
1898
2 A
UC
inf (
ng*h
/mL)
/Dos
e 20
15
10
5
02.5
Dose (mg)5 10
S 18
982
AU
Cin
f (ng
*h/m
L)/D
ose
5Dose (mg)
10
40
30
20
10
02.5
Ivab
radi
ne A
UC
inf (
ng*h
/mL)
/Dos
e
5Dose (mg)
10
Figure 3. Proportionality of ivabradine (upper) and S18982 (lower) over the range of doses (mean and range)after single (left) and repeated (right) administration.
Clinical Therapeutics
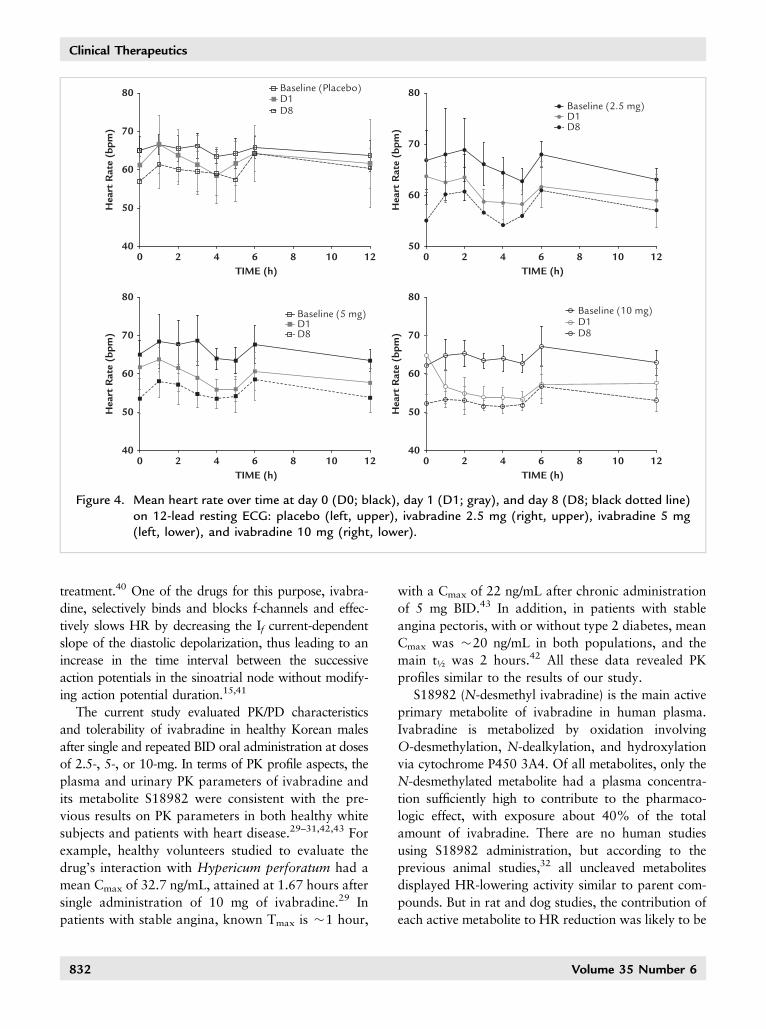
On the 12-lead ECG, mean HR also decreased frombaseline in all ivabradine groups (ie, the decrease wasgreater than that in the placebo group). The placebogroup displayed mean HR change of –4.9 (9.8) beats/min at D1 3 hours, –2.0 (11.2) beats/min at D1 12hours, –6.7 (6.9) beats/min at D8 3 hours, and –3.2(7.1) beats/min at D8 12 hours, respectively. Comparedwith the placebo group, the ivabradine 2.5-mg grouphad HR decreases of –7.3 (3.6), –4.1 (4.6), –9.4 (6.3),and –6.0 (5.0) beats/min, the ivabradine 5-mg grouphad HR decreases of –9.7 (5.7), –5.8 (4.8), –13.9 (7.2),and –9.7 (5.1) beats/min, and the ivabradine 10-mggroup had HR decreases of –9.4 (3.8), –5.2 (5.5), –11.8(1.6), and –9.8 (4.5) at D1 3 hours, D1 12 hours, D8 3hours, and D8 12 hours, respectively. The decrease afterrepeated administration was greater than after singleadministration. The differences in the mean HR dec-rease between the placebo group and both the ivabra-dine 5- and 10-mg groups were statistically significantat both 3 and 12 hours. The estimates of the difference(95% CI) were –8 (–14 to –1) beats/min at D8 3 hours
828
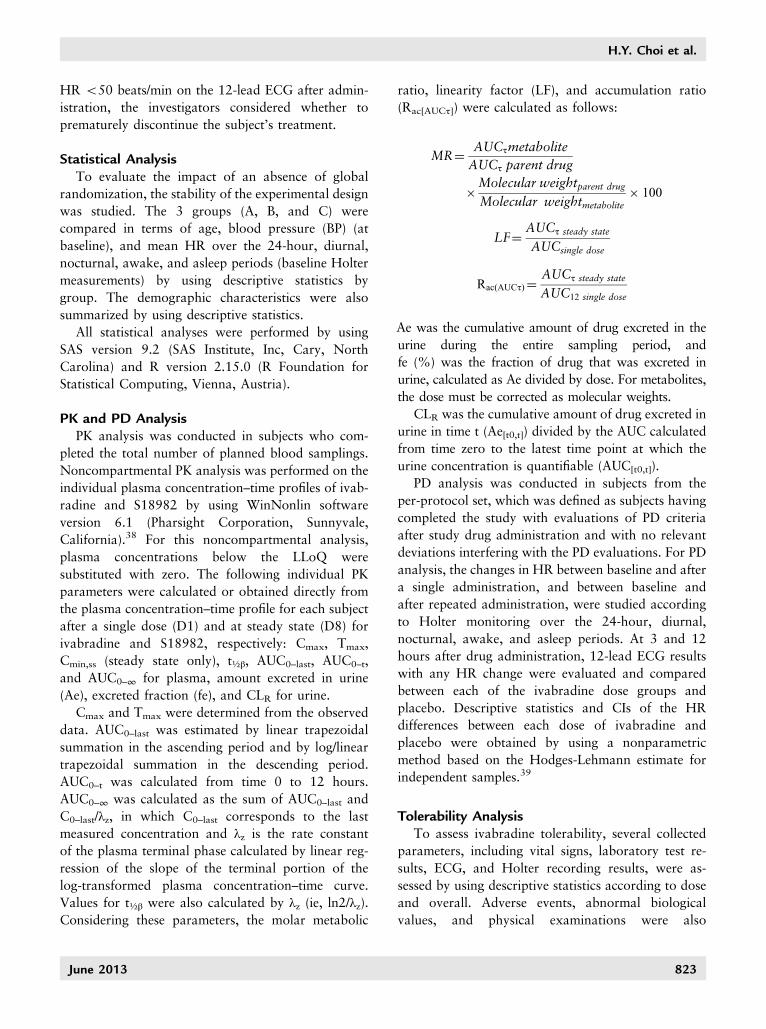
and –6 (–12 to –1) at D8 12 hours between the placeboand ivabradine 5-mg groups, respectively. The differ-ence between the placebo and ivabradine 10-mg groupswere –6 (–11 to –1) at D8 3 hours and –6 (–12 to –2) atD8 12 hours, respectively (Table VI). Figure 4 showsmean HR over time at D0 (baseline), D1 (single dose),and D8 (repeated dose), respectively.
TolerabilityAll of the subjects who received at least 1 dose of
the study drug were included in the tolerabilityanalysis. Four adverse events involving 3 subjectswere reported. Two subjects were from the ivabradine2.5-mg group and 1 was from the placebo group. Inthe 2.5-mg group, 1 subject experienced catheter sitephlebitis and myalgia (ie, 2 adverse events in 1 subject)after a single oral dose of the study drug and wassubsequently withdrawn from the study by the inves-tigator. He was prescribed amoxicillin clavulanate,acetaminophen, and cefazolin and recovered fullywith no sequelae. Another subject from the same dose
Volume 35 Number 6
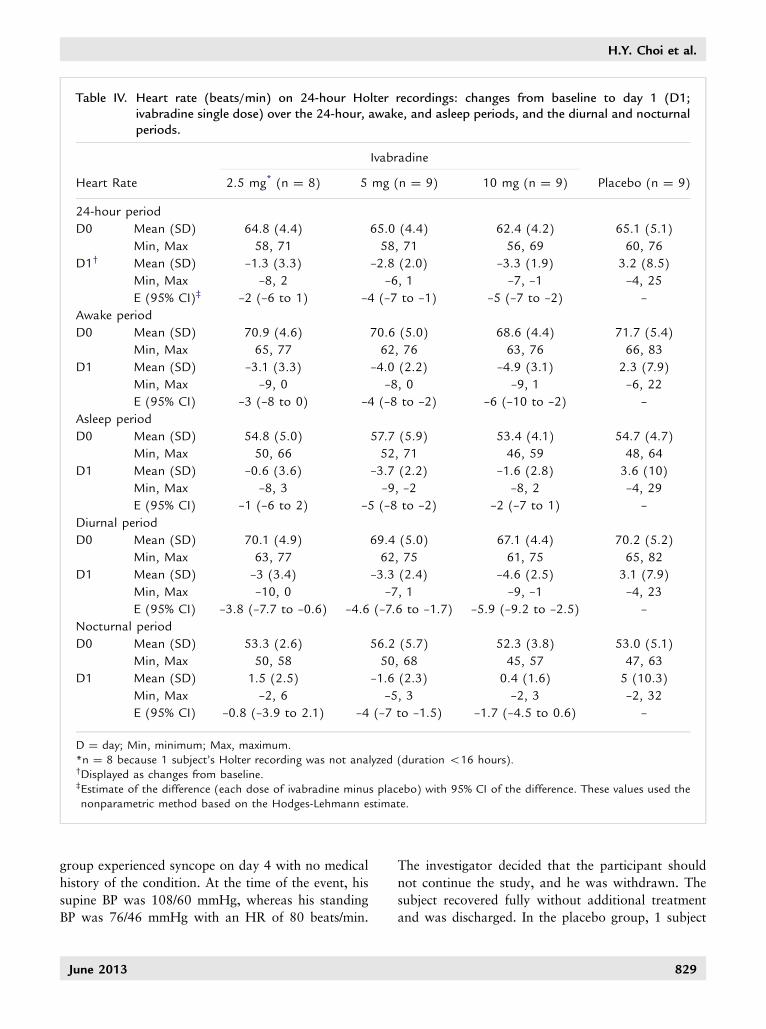
Table IV. Heart rate (beats/min) on 24-hour Holter recordings: changes from baseline to day 1 (D1;ivabradine single dose) over the 24-hour, awake, and asleep periods, and the diurnal and nocturnalperiods.
Ivabradine
Heart Rate 2.5 mg* (n ¼ 8) 5 mg (n ¼ 9) 10 mg (n ¼ 9) Placebo (n ¼ 9)
24-hour period
D0 Mean (SD)
Min, Max
64.8 (4.4)
58, 71
65.0 (4.4)
58, 71
62.4 (4.2)
56, 69
65.1 (5.1)
60, 76
D1† Mean (SD)
Min, Max
–1.3 (3.3)
–8, 2
–2.8 (2.0)
–6, 1
–3.3 (1.9)
–7, –1
3.2 (8.5)
–4, 25
E (95% CI)‡ –2 (–6 to 1) –4 (–7 to –1) –5 (–7 to –2) –
Awake period
D0 Mean (SD)
Min, Max
70.9 (4.6)
65, 77
70.6 (5.0)
62, 76
68.6 (4.4)
63, 76
71.7 (5.4)
66, 83
D1 Mean (SD)
Min, Max
–3.1 (3.3)
–9, 0
–4.0 (2.2)
–8, 0
–4.9 (3.1)
–9, 1
2.3 (7.9)
–6, 22
E (95% CI) –3 (–8 to 0) –4 (–8 to –2) –6 (–10 to –2) –
Asleep period
D0 Mean (SD)
Min, Max
54.8 (5.0)
50, 66
57.7 (5.9)
52, 71
53.4 (4.1)
46, 59
54.7 (4.7)
48, 64
D1 Mean (SD)
Min, Max
–0.6 (3.6)
–8, 3
–3.7 (2.2)
–9, –2
–1.6 (2.8)
–8, 2
3.6 (10)
–4, 29
E (95% CI) –1 (–6 to 2) –5 (–8 to –2) –2 (–7 to 1) –
Diurnal period
D0 Mean (SD)
Min, Max
70.1 (4.9)
63, 77
69.4 (5.0)
62, 75
67.1 (4.4)
61, 75
70.2 (5.2)
65, 82
D1 Mean (SD)
Min, Max
–3 (3.4)
–10, 0
–3.3 (2.4)
–7, 1
–4.6 (2.5)
–9, –1
3.1 (7.9)
–4, 23
E (95% CI) –3.8 (–7.7 to –0.6) –4.6 (–7.6 to –1.7) –5.9 (–9.2 to –2.5) –
Nocturnal period
D0 Mean (SD)
Min, Max
53.3 (2.6)
50, 58
56.2 (5.7)
50, 68
52.3 (3.8)
45, 57
53.0 (5.1)
47, 63
D1 Mean (SD)
Min, Max
1.5 (2.5)
–2, 6
–1.6 (2.3)
–5, 3
0.4 (1.6)
–2, 3
5 (10.3)
–2, 32
E (95% CI) –0.8 (–3.9 to 2.1) –4 (–7 to –1.5) –1.7 (–4.5 to 0.6) –
D ¼ day; Min, minimum; Max, maximum.*n ¼ 8 because 1 subject’s Holter recording was not analyzed (duration o16 hours).†Displayed as changes from baseline.‡Estimate of the difference (each dose of ivabradine minus placebo) with 95% CI of the difference. These values used thenonparametric method based on the Hodges-Lehmann estimate.
H.Y. Choi et al.
group experienced syncope on day 4 with no medicalhistory of the condition. At the time of the event, hissupine BP was 108/60 mmHg, whereas his standingBP was 76/46 mmHg with an HR of 80 beats/min.
June 2013
The investigator decided that the participant shouldnot continue the study, and he was withdrawn. Thesubject recovered fully without additional treatmentand was discharged. In the placebo group, 1 subject
829
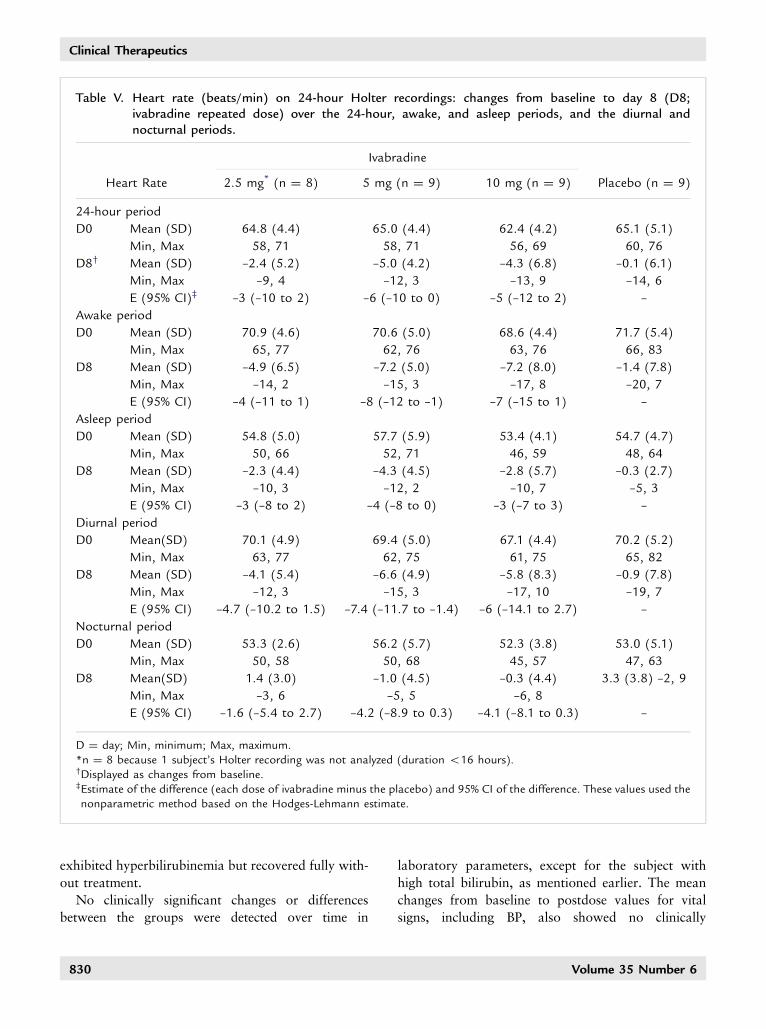
Table V. Heart rate (beats/min) on 24-hour Holter recordings: changes from baseline to day 8 (D8;ivabradine repeated dose) over the 24-hour, awake, and asleep periods, and the diurnal andnocturnal periods.
Ivabradine
Heart Rate 2.5 mg* (n ¼ 8) 5 mg (n ¼ 9) 10 mg (n ¼ 9) Placebo (n ¼ 9)
24-hour period
D0 Mean (SD)
Min, Max
64.8 (4.4)
58, 71
65.0 (4.4)
58, 71
62.4 (4.2)
56, 69
65.1 (5.1)
60, 76
D8† Mean (SD)
Min, Max
–2.4 (5.2)
–9, 4
–5.0 (4.2)
–12, 3
–4.3 (6.8)
–13, 9
–0.1 (6.1)
–14, 6
E (95% CI)‡ –3 (–10 to 2) –6 (–10 to 0) –5 (–12 to 2) –
Awake period
D0 Mean (SD)
Min, Max
70.9 (4.6)
65, 77
70.6 (5.0)
62, 76
68.6 (4.4)
63, 76
71.7 (5.4)
66, 83
D8 Mean (SD)
Min, Max
–4.9 (6.5)
–14, 2
–7.2 (5.0)
–15, 3
–7.2 (8.0)
–17, 8
–1.4 (7.8)
–20, 7
E (95% CI) –4 (–11 to 1) –8 (–12 to –1) –7 (–15 to 1) –
Asleep period
D0 Mean (SD)
Min, Max
54.8 (5.0)
50, 66
57.7 (5.9)
52, 71
53.4 (4.1)
46, 59
54.7 (4.7)
48, 64
D8 Mean (SD)
Min, Max
–2.3 (4.4)
–10, 3
–4.3 (4.5)
–12, 2
–2.8 (5.7)
–10, 7
–0.3 (2.7)
–5, 3
E (95% CI) –3 (–8 to 2) –4 (–8 to 0) –3 (–7 to 3) –
Diurnal period
D0 Mean(SD)
Min, Max
70.1 (4.9)
63, 77
69.4 (5.0)
62, 75
67.1 (4.4)
61, 75
70.2 (5.2)
65, 82
D8 Mean (SD)
Min, Max
–4.1 (5.4)
–12, 3
–6.6 (4.9)
–15, 3
–5.8 (8.3)
–17, 10
–0.9 (7.8)
–19, 7
E (95% CI) –4.7 (–10.2 to 1.5) –7.4 (–11.7 to –1.4) –6 (–14.1 to 2.7) –
Nocturnal period
D0 Mean (SD)
Min, Max
53.3 (2.6)
50, 58
56.2 (5.7)
50, 68
52.3 (3.8)
45, 57
53.0 (5.1)
47, 63
D8 Mean(SD)
Min, Max
1.4 (3.0)
–3, 6
–1.0 (4.5)
–5, 5
–0.3 (4.4)
–6, 8
3.3 (3.8) –2, 9
E (95% CI) –1.6 (–5.4 to 2.7) –4.2 (–8.9 to 0.3) –4.1 (–8.1 to 0.3) –
D ¼ day; Min, minimum; Max, maximum.*n ¼ 8 because 1 subject’s Holter recording was not analyzed (duration o16 hours).†Displayed as changes from baseline.‡Estimate of the difference (each dose of ivabradine minus the placebo) and 95% CI of the difference. These values used thenonparametric method based on the Hodges-Lehmann estimate.
Clinical Therapeutics
exhibited hyperbilirubinemia but recovered fully with-out treatment.
No clinically significant changes or differencesbetween the groups were detected over time in
830
laboratory parameters, except for the subject withhigh total bilirubin, as mentioned earlier. The meanchanges from baseline to postdose values for vitalsigns, including BP, also showed no clinically
Volume 35 Number 6
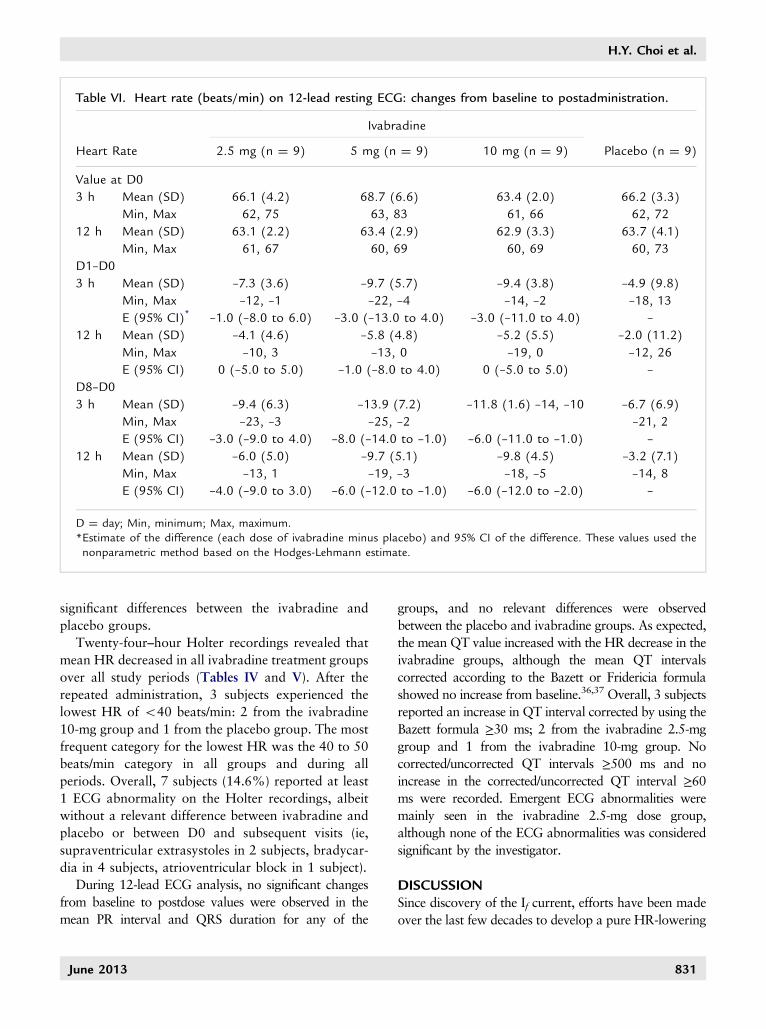
Table VI. Heart rate (beats/min) on 12-lead resting ECG: changes from baseline to postadministration.
Ivabradine
Heart Rate 2.5 mg (n ¼ 9) 5 mg (n ¼ 9) 10 mg (n ¼ 9) Placebo (n ¼ 9)
Value at D0
3 h Mean (SD)
Min, Max
66.1 (4.2)
62, 75
68.7 (6.6)
63, 83
63.4 (2.0)
61, 66
66.2 (3.3)
62, 72
12 h Mean (SD)
Min, Max
63.1 (2.2)
61, 67
63.4 (2.9)
60, 69
62.9 (3.3)
60, 69
63.7 (4.1)
60, 73
D1–D0
3 h Mean (SD)
Min, Max
–7.3 (3.6)
–12, –1
–9.7 (5.7)
–22, –4
–9.4 (3.8)
–14, –2
–4.9 (9.8)
–18, 13
E (95% CI)* –1.0 (–8.0 to 6.0) –3.0 (–13.0 to 4.0) –3.0 (–11.0 to 4.0) –
12 h Mean (SD)
Min, Max
–4.1 (4.6)
–10, 3
–5.8 (4.8)
–13, 0
–5.2 (5.5)
–19, 0
–2.0 (11.2)
–12, 26
E (95% CI) 0 (–5.0 to 5.0) –1.0 (–8.0 to 4.0) 0 (–5.0 to 5.0) –
D8–D0
3 h Mean (SD)
Min, Max
–9.4 (6.3)
–23, –3
–13.9 (7.2)
–25, –2
–11.8 (1.6) –14, –10 –6.7 (6.9)
–21, 2
E (95% CI) –3.0 (–9.0 to 4.0) –8.0 (–14.0 to –1.0) –6.0 (–11.0 to –1.0) –
12 h Mean (SD)
Min, Max
–6.0 (5.0)
–13, 1
–9.7 (5.1)
–19, –3
–9.8 (4.5)
–18, –5
–3.2 (7.1)
–14, 8
E (95% CI) –4.0 (–9.0 to 3.0) –6.0 (–12.0 to –1.0) –6.0 (–12.0 to –2.0) –
D ¼ day; Min, minimum; Max, maximum.*Estimate of the difference (each dose of ivabradine minus placebo) and 95% CI of the difference. These values used thenonparametric method based on the Hodges-Lehmann estimate.
H.Y. Choi et al.
significant differences between the ivabradine andplacebo groups.
Twenty-four–hour Holter recordings revealed thatmean HR decreased in all ivabradine treatment groupsover all study periods (Tables IV and V). After therepeated administration, 3 subjects experienced thelowest HR of o40 beats/min: 2 from the ivabradine10-mg group and 1 from the placebo group. The mostfrequent category for the lowest HR was the 40 to 50beats/min category in all groups and during allperiods. Overall, 7 subjects (14.6%) reported at least1 ECG abnormality on the Holter recordings, albeitwithout a relevant difference between ivabradine andplacebo or between D0 and subsequent visits (ie,supraventricular extrasystoles in 2 subjects, bradycar-dia in 4 subjects, atrioventricular block in 1 subject).
During 12-lead ECG analysis, no significant changesfrom baseline to postdose values were observed in themean PR interval and QRS duration for any of the
June 2013
groups, and no relevant differences were observedbetween the placebo and ivabradine groups. As expected,the mean QT value increased with the HR decrease in theivabradine groups, although the mean QT intervalscorrected according to the Bazett or Fridericia formulashowed no increase from baseline.36,37 Overall, 3 subjectsreported an increase in QT interval corrected by using theBazett formula ≥30 ms; 2 from the ivabradine 2.5-mggroup and 1 from the ivabradine 10-mg group. Nocorrected/uncorrected QT intervals ≥500 ms and noincrease in the corrected/uncorrected QT interval ≥60ms were recorded. Emergent ECG abnormalities weremainly seen in the ivabradine 2.5-mg dose group,although none of the ECG abnormalities was consideredsignificant by the investigator.
DISCUSSIONSince discovery of the If current, efforts have been madeover the last few decades to develop a pure HR-lowering
831
80
70
60
Hea
rt R
ate
(bpm
)
50
400 2 4 6 8 10
TIME (h)12
80
70
60
Hea
rt R
ate
(bpm
)
50
400 2 4 6 8 10
TIME (h)12
80
70
60
Hea
rt R
ate
(bpm
)
50
400 2 4 6 8 10
TIME (h)12
80Baseline (Placebo)D1D8
Baseline (5 mg)D1D8
Baseline (10 mg)D1D8
Baseline (2.5 mg)D1D8
70
60
Hea
rt R
ate
(bpm
)
500 2 4 6 8 10
TIME (h)12
Figure 4. Mean heart rate over time at day 0 (D0; black), day 1 (D1; gray), and day 8 (D8; black dotted line)on 12-lead resting ECG: placebo (left, upper), ivabradine 2.5 mg (right, upper), ivabradine 5 mg(left, lower), and ivabradine 10 mg (right, lower).
Clinical Therapeutics
treatment.40 One of the drugs for this purpose, ivabra-dine, selectively binds and blocks f-channels and effec-tively slows HR by decreasing the If current-dependentslope of the diastolic depolarization, thus leading to anincrease in the time interval between the successiveaction potentials in the sinoatrial node without modify-ing action potential duration.15,41
The current study evaluated PK/PD characteristicsand tolerability of ivabradine in healthy Korean malesafter single and repeated BID oral administration at dosesof 2.5-, 5-, or 10-mg. In terms of PK profile aspects, theplasma and urinary PK parameters of ivabradine andits metabolite S18982 were consistent with the pre-vious results on PK parameters in both healthy whitesubjects and patients with heart disease.29–31,42,43 Forexample, healthy volunteers studied to evaluate thedrug’s interaction with Hypericum perforatum had amean Cmax of 32.7 ng/mL, attained at 1.67 hours aftersingle administration of 10 mg of ivabradine.29 Inpatients with stable angina, known Tmax is �1 hour,
832
with a Cmax of 22 ng/mL after chronic administrationof 5 mg BID.43 In addition, in patients with stableangina pectoris, with or without type 2 diabetes, meanCmax was �20 ng/mL in both populations, and themain t½ was 2 hours.42 All these data revealed PKprofiles similar to the results of our study.
S18982 (N-desmethyl ivabradine) is the main activeprimary metabolite of ivabradine in human plasma.Ivabradine is metabolized by oxidation involvingO-desmethylation, N-dealkylation, and hydroxylationvia cytochrome P450 3A4. Of all metabolites, only theN-desmethylated metabolite had a plasma concentra-tion sufficiently high to contribute to the pharmaco-logic effect, with exposure about 40% of the totalamount of ivabradine. There are no human studiesusing S18982 administration, but according to theprevious animal studies,32 all uncleaved metabolitesdisplayed HR-lowering activity similar to parent com-pounds. But in rat and dog studies, the contribution ofeach active metabolite to HR reduction was likely to be
Volume 35 Number 6
H.Y. Choi et al.
limited, considering their low plasma levels relative tothe parent compound.32 In the current study, molarmetabolic ratios were determined to be 30% to 49% insingle and repeated ivabradine dosing, which is similarto previous studies.32 Thus, S18982 may also help theHR-lowering effect, relative to the exposure. Ivabra-dine and S18982 were assessed for other toxicity effectsin animal studies. Regarding the potential to prolongQT, an in vitro study (guinea pig papillary muscle)found a drug concentration causing 50% inhibition ofthe desired activity of 4.85 μM and 15.8 μM forivabradine and S18982, respectively, and these were�70- and 900-fold the mean plasma Cmax for ivabra-dine and S18982, respectively, when treated withivabradine 7.5 mg BID. Furthermore, when accountingfor unbound plasma fraction (�30%), these ratios roseto �244- and �3000-fold, respectively. Also, refer tothe previous in vivo study with beagle dogs, nosignificant effect on QTc up to the highest doseassociated with the mean plasma Cmax 134-fold greaterthan human with ivabradine 7.5 mg BID.
Ivabradine and S18982 were rapidly distributed inthe body with similar patterns, and neither compoundaccumulated in cardiac tissue or liver. Feces were themajor route of excretion of unchanged ivabradine andits metabolites in rats and dogs, whereas a previoushuman study showed elimination of metabolites inboth feces and urine (52% and 45%, respectively). Inhumans, only �4% of the oral dose was excretedunchanged in urine.32 Considering all these earlierstudies, S18982 may contribute to the HR controleffect safely in the therapeutic concentration ranges,but the effect may be lesser than ivabradine becausethe exposure was lesser than in the parent drug.
Regarding the PD results obtained from 24-hourHolter recordings after single ivabradine administra-tion, clinically significant differences between the pla-cebo and both the 5-mg and 10-mg ivabradine dosegroups were observed in terms of mean HR decrease.After repeated ivabradine administration, decreasesfrom baseline in mean HR were also observed in allivabradine groups compared with those in the placebogroup, and the decreases after repeated administrationwere greater than after a single administration. In termsof the 12-lead ECG recordings, the decreases in meanHR were more pronounced at 3 hours than at 12 hoursin all the treatment groups and were significant in bothdose groups compared with placebo. The differences inthe mean HR decrease between the placebo group and
June 2013
the ivabradine 5- and 10-mg dose groups were alsostatistically significant at both 3 and 12 hours.
In terms of general tolerability, the incidence ofadverse events did not increase according to dose. Onthe 24-hour Holter recordings, no serious HR decreaseswith clinically important symptoms were observed. Inaddition, according to the 12-lead ECG, no relevantchanges from baseline were observed in the PR, QTinterval, or QRS durations. Taking into account theresults of previous studies, the degree of If channelblockade by ivabradine depends on the frequency of thechannel’s opening and closing.20,44 Therefore, If inhib-ition effects at a rapid HR are greater than at a slowerHR, thus leading to a low risk of severe bradycar-dia.20,44 Moreover, it is known that the conductivityand refractoriness of the atrium, atrioventricular node,His-Purkinje system, and ventricles are not modified byivabradine.17 The results of our study seem to be anextension of previous research regarding the activity ofivabradine. Common adverse events of ivabradine (ie,dose-related visual disturbances and phosphene-likesymptoms)45 were not observed in the current study.
Overall, this study found that the PK and PDcharacteristics of ivabradine for healthy Korean malevolunteers are similar to the existing data regardingwhite subjects. The PK and PD profiles all generallyshowed a dose-dependent tendency.
CONCLUSIONSBased on the findings of this study, single and repeatedBID oral administration of ivabradine 2.5, 5, and 10mg was well tolerated by these healthy male Koreanvolunteers. PK properties were linear with both timeand dose. PD data were also shown to be significant interms of HR reduction, especially at the 5- and 10-mgdoses. These PK and PD characteristics were similar tothose seen in previous studies in white subjects, thussuggesting that ivabradine may have a similar dose–response relationship in Korean subjects.
ACKNOWLEDGMENTSThis study was sponsored by I.R.I.S.
All authors agree with the content of the article, andthe corresponding author made the final decision re-garding its submission. The sponsor monitored thestudies during the whole clinical trial period and hadno role in conducting of the study procedures, dataanalyses, or interpretation. Dr. Bae was the principalinvestigator of the clinical trial. Drs. Bae, Lim, Cho,
833
Clinical Therapeutics
Ghim, Choe, Kim, and Jung equally contributed to thestudy design, data collection, and analysis. Dr. Choicontributed to the review of the data analyses, literaturesearch, figure/table creation, and manuscript writing.Dr. Lim and Dr. Noh reviewed the manuscript.
CONFLICTS OF INTERESTThe authors have indicated that they have no conflictsof interest regarding the content of this article.
REFERENCES1. Dyer AR, Persky V, Stamler J, et al. Heart rate as a
prognostic factor for coronary heart disease and mortal-
ity: findings in three Chicago epidemiologic studies. Am J
Epidemiol. 1980;112:736–749.
2. Kannel WB, Kannel C, Paffenbarger Jr RS, et al. Heart
rate and cardiovascular mortality: the Framingham
Study. Am Heart J. 1987;113:1489–1494.
3. Mensink GB, Hoffmeister H.The relationship between
resting heart rate and all-cause, cardiovascular and
cancer mortality. Eur Heart J. 1997;18:1404–1410.
4. Kristal-Boneh E, Silber H, Harari G, et al. The association of
resting heart rate with cardiovascular, cancer and all-cause
mortality. Eight year follow-up of 3527 male Israeli employ-
ees (the CORDIS Study). Eur Heart J. 2000;21:116–124.
5. Hjalmarson A, Gilpin EA, Kjekshus J, et al. Influence of
heart rate on mortality after acute myocardial infarction.
Am J Cardiol. 1990;65:547–553.
6. Castagno D, Skali H, Takeuchi M, et al. Association of
heart rate and outcomes in a broad spectrum of patients
with chronic heart failure: results from the CHARM
(Candesartan in Heart Failure: Assessment of Reduction
in Mortality and morbidity) program. J Am Coll Cardiol.
2012;59:1785–1795.
7. Fosbol EL, Seibaek M, Brendorp B, et al. Long-term
prognostic importance of resting heart rate in patients
with left ventricular dysfunction in connection with either
heart failure or myocardial infarction: the DIAMOND
study. Int J Cardiol. 2010;140:279–286.
8. Heusch G. Heart rate in the pathophysiology of coronary
blood flow and myocardial ischaemia: benefit from
selective bradycardic agents. Br J Pharmacol. 2008;153:
1589–1601.
9. Custodis F, Schirmer SH, Baumhakel M, et al. Vascular
pathophysiology in response to increased heart rate. J Am
Coll Cardiol. 2010;56:1973–1983.
10. Androulakis E, Tousoulis D, Papageorgiou N, et al. Heart
rate as a therapeutic target in angina pectoris. Curr Pharm
Des. 2013;19:1562–1568.
11. Hasenfuss G, Holubarsch C, Hermann HP, et al. Influ-
ence of the force-frequency relationship on haemody-
namics and left ventricular function in patients with non-
834
failing hearts and in patients with dilated cardiomyop-
athy. Eur Heart J. 1994;15:164–170.
12. Hori M, Okamoto H. Heart rate as a target of treatment
of chronic heart failure. J Cardiol. 2012;60:86–90.
13. Gheorghiade M, Colucci WS, Swedberg K.Beta-blockers
in chronic heart failure. Circulation. 2003;107:1570–1575.
14. Eisenberg MJ, Brox A, Bestawros AN.Calcium channel
blockers: an update. Am J Med. 2004;116:35–43.
15. Baruscotti M, Bucchi A, Difrancesco D. Physiology and
pharmacology of the cardiac pacemaker ("funny") cur-
rent. Pharmacol Ther. 2005;107:59–79.
16. Thollon C, Bidouard JP, Cambarrat C, et al. Stereo-
specific in vitro and in vivo effects of the new sinus node
inhibitor (þ)-S 16257. Eur J Pharmacol. 1997;339:
43–51.
17. Camm AJ, Lau CP. Electrophysiological effects of a single
intravenous administration of ivabradine (S 16257) in
adult patients with normal baseline electrophysiology.
Drugs R D. 2003;4:83–89.
18. Thollon C, Cambarrat C, Vian J, et al. Electrophysiological
effects of S 16257, a novel sino-atrial node modulator, on
rabbit and guinea-pig cardiac preparations: comparison
with UL-FS 49. Br J Pharmacol. 1994;112:37–42.
19. DiFrancesco D, Camm JA. Heart rate lowering by specific
and selective I(f) current inhibition with ivabradine: a
new therapeutic perspective in cardiovascular disease.
Drugs. 2004;64:1757–1765.
20. Borer JS, Fox K, Jaillon P, et al. Antianginal and
antiischemic effects of ivabradine, an I(f) inhibitor, in
stable angina: a randomized, double-blind, multicen-
tered, placebo-controlled trial. Circulation. 2003;107:
817–823.
21. Tardif JC, Ford I, Tendera M, et al. Efficacy of ivabradine,
a new selective I(f) inhibitor, compared with atenolol in
patients with chronic stable angina. Eur Heart J. 2005;26:
2529–2536.
22. Ruzyllo W, Tendera M, Ford I, et al. Antianginal efficacy
and safety of ivabradine compared with amlodipine in
patients with stable effort angina pectoris: a 3-month
randomised, double-blind, multicentre, noninferiority
trial. Drugs. 2007;67:393–405.
23. Swedberg K, Komajda M, Bohm M, et al. Ivabradine and
outcomes in chronic heart failure (SHIFT): a randomised
placebo-controlled study. Lancet. 2010;376:875–885.
24. Ceconi C, Freedman SB, Tardif JC, et al. Effect of heart
rate reduction by ivabradine on left ventricular remodeling
in the echocardiographic substudy of BEAUTIFUL. Int J
Cardiol. 2011;146:408–414.
25. Heusch G, Skyschally A, Schulz R.Cardioprotection by
ivabradine through heart rate reduction and beyond. J
Cardiovasc Pharmacol Ther. 2011;16:281–284.
26. Tardif JC, O’Meara E, Komajda M, et al. Effects of
selective heart rate reduction with ivabradine on left
Volume 35 Number 6
H.Y. Choi et al.
ventricular remodelling and func-
tion: results from the SHIFT echo-
cardiography substudy. Eur Heart J.
2011;32:2507–2515.
27. Mulder P, Barbier S, Chagraoui A,
et al. Long-term heart rate reduc-
tion induced by the selective I(f)
current inhibitor ivabradine im-
proves left ventricular function
and intrinsic myocardial structure
in congestive heart failure. Circula-
tion. 2004;109:1674–1679.
28. Procoralan: EPAR – Scientific Dis-
cussion. Servier Laboratories Ltd.
http://www.ema.europa.eu/ema/
index.jsp?curl=pages/medicines/
human/medicines/000597/human_
med_000995.jsp&mid=WC0b01
ac058001d124. Accessed March
25, 2013.
29. Duffull SB, Chabaud S, Nony P,
et al. A pharmacokinetic simula-
tion model for ivabradine in
healthy volunteers. Eur J Pharm
Sci. 2000;10:285–294.
30. Portoles A, Terleira A, Calvo A,
et al. Effects of Hypericum perfo-
ratum on ivabradine pharmacoki-
netics in healthy volunteers: an
open-label, pharmacokinetic inter-
action clinical trial. J Clin Pharma-
col. 2006;46:1188–1194.
31. Vlase L, Neag M, Popa A, et al.
Pharmacokinetic interaction be-
tween ivabradine and carbamaze-
pine in healthy volunteers. J Clin
Pharm Ther. 2011;36:225–229.
32. Vlase L, Popa A, Neag M, et al.
Pharmacokinetic interaction be-
tween ivabradine and phenytoin
in healthy subjects. Clin Drug Inves-
tig. 2012;32:533–538.
33. ICH harmonized tripartite guideline:
Guideline for Good Clinical Practice.
J Postgrad Med. 2001;47:45–50.
34. The Helsinki Declaration. Assist
Inferm Ric. 2010;29:41–44.
35. Francois-Bouchard M, Simonin G,
Bossant, Boursier-Neyret C.Simul-
taneous determination of ivabra-
dine and its metabolites in human
plasma by liquid chromatography
June 2013
—tandem mass spectrometry. J
Chromatogr B Biomed Sci Appl.
2000;745:261–269.
36. Funck-Brentano C, Jaillon P, Rate-
corrected QT.interval: techniques
and limitations. Am J Cardiol.
1993;72:17B–22B.
37. Luo S, Michler K, Johnston P, et al.
A comparison of commonly used
QT correction formulae: the effect
of heart rate on the QTc of normal
ECGs. J Electrocardiol. 2004;37
(Suppl):81–90.
38. Rowland M, Tozer T. Clinical Phar-
macokinetics and Pharmacodynamics:
Concepts and Applications. 4th ed.
Philadalphia, Pa: Lippincott
Williams & Wilkins; 2011.
39. Shein-Chung C, Jen-Pei L. Design
and Analysis of Bioavailability and
Bioequivalence Studies. 3rd ed. Boca
Raton, Fla: CRC Press; 2009.
40. Borer JS.Clinical effect of ’pure’
heart rate slowing with a proto-
type If current inhibitor:
placebo-controlled experience
with ivabradine. Adv Cardiol.
2006;43:54–64.
41. DiFrancesco D. Cardiac pace-
maker I(f) current and its inhibi-
tion by heart rate-reducing agents.
Curr Med Res Opin. 2005;
21:1115–1122.
42. Borer JS, Tardif JC. Efficacy of ivab-
radine, a selective I(f) inhibitor, in
patients with chronic stable angina
pectoris and diabetes mellitus. Am J
Cardiol. 2010;105:29–35.
43. Parakh N, Bhargava B. Rate con-
trol with ivabradine: angina pec-
toris and beyond. Am J Cardiovasc
Drugs. 2011;11:1–12.
44. Bucchi A, Baruscotti M,
DiFrancesco D. Current-depen-
dent block of rabbit sino-atrial
node I(f) channels by ivabradine.
J Gen Physiol. 2002;120:1–13.
45. Cervetto L, Demontis GC, Gargini
C. Cellular mechanisms under-
lying the pharmacological induc-
tion of phosphenes. Br J
Pharmacol. 2007;150:383–390.
Address correspondence to: Kyun-Seop Bae, MD, PhD, Department ofClinical Pharmacology and Therapeutics, Asan Medical Center, 88,Olympic-ro 43-gil, Songpa-gu, Seoul, 138-736, Korea. E-mail:[email protected]
835
Related Documents