Evaluation of persulfate for the treatment of manufactured gas plant residuals by Angela McIsaac A thesis presented to the University of Waterloo in fulfillment of the thesis requirement for the degree of Master of Applied Science in Civil Engineering Waterloo, Ontario, Canada, 2013 © Angela McIsaac 2013

Welcome message from author
This document is posted to help you gain knowledge. Please leave a comment to let me know what you think about it! Share it to your friends and learn new things together.
Transcript
Evaluation of persulfate for the treatment of
manufactured gas plant residuals
by
Angela McIsaac
A thesis
presented to the University of Waterloo
in fulfillment of the
thesis requirement for the degree of
Master of Applied Science
in
Civil Engineering
Waterloo, Ontario, Canada, 2013
© Angela McIsaac 2013

ii
I hereby declare that I am the sole author of this thesis. This is a true copy of the thesis,
including any required final revisions, as accepted by my examiners.
I understand that my thesis may be made electronically available to the public.
iii
Abstract
The presence of coal tars in the subsurface associated with former manufactured gas plants
(MGPs) offers a remediation challenge due to their complex chemical composition,
dissolution behaviour and recalcitrant characteristics. A former MGP site in Clearwater
Beach, Florida was characterized and bench-scale analyses were conducted to assess the
potential for in situ chemical oxidation (ISCO) using persulfate to treat MGP residuals.
Completion of a conceptual site model identified a homogeneous, silty sand aquifer, with an
average hydraulic conductivity of approximately 2.3x10⁻³
cm/s and a groundwater flow rate
of 2 cm/day in the direction of S20°E. Six source zones, three near the water table and three
in the deep aquifer were estimated to have a total volume of 108 m3. A multi-level well
transect was installed to monitor concentrations of dissolved compounds and to estimate
mass discharge downgradient of the source zones over time. On average, the morphology
of the aqueous concentrations remained consistent with time. A total mass discharge across
the transect of 94 mg/day was estimated for site-specific compounds.
Bench-scale tests were conducted on aquifer sediments and groundwater samples. The
aquifer was determined to have a low buffering capacity, low chemical oxygen demand, and
low natural oxidant interaction (NOI) with persulfate. Aqueous batch experiments
identified the potential for iron (II) activated persulfate to reduce concentrations of BTEX
and PAHs below method detection limits (MDLs). Unactivated persulfate was able to
reduce BTEX concentrations to below MDLs after 14 days; however, the concentration of
PAH compounds remained above MDLs after 14 days. Higher iron doses within the system
were shown to be more effective in reducing BTEX and PAH compounds.
Column experiments designed to mimic site conditions were used to evaluate the feasibility
of persulfate treatment on impacted sediments from the Clearwater site. Two sets of column
experiments were conducted: one using unactivated persulfate followed by alkaline
activated persulfate; and one using iron (II) activated persulfate. On average, unactivated
persulfate was able to reduce BTEX and PAH aqueous effluent concentrations by > 75%
and 40%, respectively, after a total dose of 60 g/g soil. Two additional doses of alkaline
activated persulfate (total persulfate dose of ~80g/g soil) in these columns were able to
further reduce effluent BTEX and PAH concentrations by > 90% and > 75%, respectively.
Iron (II) activated persulfate reduced effluent BTEX concentrations by > 70% and PAHs by
> 65% after a total dose of 35 g/g soil. Average reductions in mass for BTEX and PAH
compounds were approximately of 48% and 26% respectively in the iron (II) activated
persulfate columns, and 24% and 10%, respectively in the alkaline activated persulfate
columns.
The potential for the ability to use in situ chemical oxidation using persulfate for the
remediation of MGP residuals in the subsurface is evaluated using field measurements and
bench-scale experimentation. The reductions observed in aqueous phase compounds in
MGP groundwater as observed in the laboratory indicate the potential for reductions in
groundwater concentrations at this and other contaminated former MGP sites. However,
column experiments, indicating the inability for activated persulfate to reduce all identified
compounds in the MGP NAPL suggest source treatment with activated persulfate would not
reduce concentrations to below Florida Department of Environmental Protection natural
attenuation concentrations.
iv
Acknowledgements
Firstly, I would like to thank my thesis supervisor, Neil Thomson for his guidance and
assistance with my research over the past two years. Also, I would like to thank Andrew
Brey, ARCADIS®, Brian Langinlle, Clearwater Gas Systems, and William Pence and
Lyndie James, Baker and Hostetter.
Finally, I would like to thank all those who helped me in the laboratory: Mark Sobon,
Shirley Chatten, Marianne VanderGriendt, Laurel Thomas-Arrigo, and Wayne Noble, those
who helped in the field: Michelle Cho, Nick Doucette, and Bob Ingleton and those who
helped me de-stress and enjoy the process: Simon Haslam, Richard Simms, Joanna Hamely,
Andrea Atkinson, Elleana Hoekstra, and Michael McIsaac.
Funding was provided by Arcadis Canada Inc. (N. Thomson, Pl).

v
Dedication
I would like to dedicate this thesis to my parents who have provided me with unconditional
love and support in all areas of my life making all of my achievements, including making
this graduate degree possible.

vi
Table of Contents
List of Tables ................................................................................................................................ viii
List of Figures ................................................................................................................................ ix
Chapter 1 ......................................................................................................................................... 1
Introduction ..................................................................................................................................... 1
1.1 Remediation of MGP Residuals ............................................................................................ 3
1.1.1 In Situ Chemical Oxidation (ISCO)......................................................................... 4
1.2 Thesis Objectives .................................................................................................................. 5
1.3 Site History ............................................................................................................................ 5
1.4 Existing Site Conceptual Model ............................................................................................ 6
1.5 Thesis Organization ............................................................................................................... 7
Chapter 2 ....................................................................................................................................... 18
2.1 Field Activities .................................................................................................................... 18
2.2 General Stratigraphy ............................................................................................................ 18
2.3 Grain Size Distribution ........................................................................................................ 18
2.4 Hydrogeology ...................................................................................................................... 19
2.4.1 Permeability .................................................................................................................. 19
2.4.3 Slug Tests ..................................................................................................................... 20
2.4.4 Groundwater Flow and Travel Time ............................................................................ 21
2.5 MGP Source Material .......................................................................................................... 22
2.6 Source Material Concentrations .......................................................................................... 24
2.7 Dissolved Phase Concentrations .......................................................................................... 25
2.7.1 Cation/Anion Scan ........................................................................................................ 25
2.7.2 BTEX and PAH Concentrations ................................................................................... 26
2.8 Mass Discharge ................................................................................................................... 28
2.9 Current Conceptual Site Model ........................................................................................... 29
Chapter 3 ....................................................................................................................................... 57
3.1 Buffering Capacity .............................................................................................................. 57
3.2 Chemical Oxygen Demand (COD) Tests ............................................................................ 58
3.3 NOI Tests ............................................................................................................................ 59
3.4 Aqueous Treatability Studies .............................................................................................. 59
3.4.1 Unactivated Persulfate .................................................................................................. 59
3.4.2 Iron (II) Activated Persulfate ........................................................................................ 61
3.5 Column Experiments ........................................................................................................... 62

vii
3.5.1 Materials and Methods ..................................................................................................... 63
3.5.2 Unactivated Column Results ........................................................................................ 65
3.6 Summary ............................................................................................................................. 70
Chapter 4 ....................................................................................................................................... 87
References ..................................................................................................................................... 91
Appendices .................................................................................................................................... 95
Appendix A ................................................................................................................................... 96
Appendix B.................................................................................................................................. 102
Appendix C.................................................................................................................................. 112
Appendix D ................................................................................................................................. 122
Appendix E .................................................................................................................................. 133
Appendix F .................................................................................................................................. 149
Appendix G ................................................................................................................................. 169
viii
List of Tables
Table 1.1. MGP residuals and sources. ............................................................................... 8
Table 1.2. Summary of ISCO studies. ................................................................................ 9
Table 1.3. Summary of previous site investigations. ........................................................ 16
Table 1.4. Florida groundwater clean-up standards for site specific compounds. ............ 17
Table 2.1. Summary of field activities .............................................................................. 30
Table 2.2. Concentrations of coal tar compounds in site soil ........................................... 36
Table 2.3. Slug test results. ............................................................................................... 37
Table 2.4. Observed MGP impacts from borings. ............................................................ 38
Table 2.5. Volume of NAPL source zones. ...................................................................... 39
Table 2.6. NAPL composition .......................................................................................... 42
Table 2.7. Coal tar chemical compositions. ...................................................................... 43
Table 2.8. Groundwater geochemical parameters. ............................................................ 44
Table 2.9. Mass discharge across transect. ....................................................................... 56
Table 3.1. COD test results. .............................................................................................. 73
Table 3.2. Reaction rate coefficients from aqueous treatability studies. .......................... 75
Table 3.3. Minimum Detectable Levels for site-specific compounds. ............................. 76
Table 3.4. NAPL concentrations in unactivated/base activated persulfate columns. ....... 82
Table 3.5. Initial and Final NAPL saturation in treatment and control columns. ............. 83
Table 3.6. NAPL concentrations in iron activated treatment columns. ............................ 86

ix
List of Figures
Figure 1.1 Layout of former Clearwater MGP (circa 1957). ............................................ 14
Figure 1.2 Previous installations conducted at the former Clearwater MGP site. ............ 15
Figure 2.1. Particle size distribution for samples .............................................................. 32
Figure 2.2. Hydraulic conductivity profiles. ..................................................................... 33
Figure 2.3. Pressure transducer response during a slug tests ............................................ 34
Figure 2.4. Transducer measurements .............................................................................. 35
Figure 2.5: NAPL saturated pores in DPT 23. .................................................................. 37
Figure 2.6. Estimated extent of observed source zones < 4.5 m bgs (shallow) ................ 40
Figure 2.7. Estimated extent of observed source zones > 4.5 m (15 ft) bgs (deep). ......... 41
Figure 2.8. Schematic of multilevel (ML) monitoring well construction. ........................ 45
Figure 2.9. Benzene transect iso-concentration profiles ................................................... 46
Figure 2.10. Naphthalene transect iso-concentration profiles .......................................... 47
Figure 2.11. Ethylbenzene transect iso-concentration profiles ......................................... 48
Figure 2.12. 1-Methylnapthalene transect iso-concentration profiles .............................. 49
Figure 2.13. 2-Methylnapthalene transect iso-concentration profiles .............................. 50
Figure 2.14. Acenapthalene transect iso-concentration profiles ....................................... 51
Figure 2.15. Concentration profiles from ML-11. ............................................................ 52
Figure 2.16. Concentration profiles from ML-12. ............................................................ 52
Figure 2.17. Concentration profiles from ML-13. ............................................................ 53
Figure 2.18. Concentration profiles from ML-14. ............................................................ 53
Figure 2.19. Concentration profiles from ML-3. .............................................................. 54
Figure 2.20. Concentration profiles from ML-5. .............................................................. 54
Figure 2.21. Concentration profiles from ML-8. .............................................................. 55
Figure 3.1. Buffering capacity for randomly selected sediment ....................................... 73
Figure 3.2. Persulfate decomposition due to natural oxidant demand .............................. 74
Figure 3.3. Unactivated persulfate treatability results for the COC ................................. 74
Figure 3.4. Iron(II) activated persulfate treatability results .............................................. 77
Figure 3.5. Column schematic. ......................................................................................... 78
Figure 3.6. Unactivated persulfate effluent concentration ................................................ 78
Figure 3.7. Unactivated/base activated persulfate dose-response curves. ........................ 79
Figure 3.8. Persulfate breakthrough curves ...................................................................... 80
Figure 3.9. Relationships between SCAP and BTEX compounds .................................. 81
Figure 3.10. Iron activated persulfate effluent concentration. .......................................... 84
Figure 3.11. Iron activated persulfate dose-response curves ............................................ 84
Figure 3.12. SCAP concentrations from iron activated columns. ..................................... 85
1
Chapter 1
Introduction
Manufactured gas was the dominant fuel source in the United States, Europe, and Canada from
the early 1800s through to the mid-1900s (Hatheway, 2006). Manufactured gas plants (MGPs)
generated fuel through the purification and processing of an organic feedstock. The most
common feedstocks used were liquid oils and solid carbon based fuels, which included anthracite,
bituminous coal, and coke (Harkins et al., 1988). The processes used to manufacture gas
produced various by-products and wastes. Leaks, spills, and improper disposal methods were
common and led to environmental contamination (Harkins et al., 1988).
During peak periods of gas production, there were an estimated 10,000 plants operating in
North America and Europe (Fischer et al., 1999). Following World War II, advances in
technology lead to the exploitation of natural gas, a more economical and environmentally
friendly fuel option (EPA, 1999). As a result, MGPs ceased manufacturing and were abandoned
or upgraded to distribute natural gas. It is estimated that in the United States and Europe there are
approximately 30,000-65,000 abandoned MGP sites (4000 in Canada) where many persistent by-
products and wastes are still present (Hatheway, 2006). The volume, characteristics, and toxicity
of the wastes generated depend on a variety of factors including the type of feedstock and gas
manufacturing processes that were used.
In general, MGPs consisted of a generator where the feedstock (commonly coal or oil) was
heated in an anoxic environment to generate gas. The off-gas contained energy rich compounds
such as hydrogen, methane and carbon dioxide, and was stored for lighting, heating, or as an
industrial fuel source. The off-gas also contained impurities and tar extractors were commonly
utilized for their removal. Additionally, naphthalene scrubbers were used to remove naphthalene
in the off-gas that could cause problems in the distribution system. Finally, liquid purification
systems were used to remove hydrogen sulfide from the gas. Following purification, the gas was
metered and stored in holders for distribution (Hatheway, 2006).
There were three dominant processes used for manufacturing coal gas: coal carbonization,
carbureted water gas (CWG), and oil gas (Hatheway, 2006). Coal carbonization was utilized
between 1816 and 1875. In 1873, the CWG method was developed and used a type of oil known
as blue gas, which increased the energy value of the produced gas making the process more
efficient. This increased efficiency, coupled with a coal shortage from 1930 to 1960, facilitated
2
the rise of the oil gas manufacturing process and a growth in the MGP industry (Hatheway,
2006).
The types of waste residuals and their constituents vary between production processes (Table
1.1). Residuals were commonly discarded or stockpiled on site in the first couple of decades of
gas manufacturing, and was the main source of contamination. However, as the industry
progressed, residual recycling grew to be common practice and contamination from leaks and
spills became more frequent (Hatheway, 2006). Additionally, when MGP sites were demolished,
the residuals on site were typically buried with other debris (McGowan et al., 1996).
The most common by-product at MGP sites is coal tar. It is estimated that over 42 billion litres
of coal tar was generated in the United States over the time period MGPs were operational (Eng
and Menzies, 1985). Coal tar is of environmental concern since many of its constituents have
been shown to be carcinogenic (Guerin, 1978; Warshawsky, 1999; USEPA 2006).
Coal tar is predominately composed of polycyclic aromatic hydrocarbons (PAHs) and benzene,
toluene, ethylbenzene, and xylene (BTEX) compounds (Harkins et al., 1988). Up to 3000
separate PAHs (Hatheway, 2006) have been identified in coal tar; however, it is difficult to
quantify all the constituents since identification of many of the compounds is not possible by
chromatographic methods (Peters and Luthy, 1993). The exact chemical composition of coal tar
is highly variable between sites as it is dependent on the feed material and the specific production
process used (Hatheway, 2006). Analyses on the chemical composition of coal tar from former
MGP sites have shown order of magnitude variations in compound concentrations (EPRI, 1993;
Brown et al., 2005). Other properties such as phase stability (Peters et al. 2000), equilibrium
aqueous phase concentrations (Lane and Loehr, 1992), mass transfer rates (Moo-Young and
Brown, 2004), and bulk properties (EPRI, 1993; Peters and Luthy, 1993; Brown et al., 2006) of
coal tar samples have been investigated and compared, also showing order of magnitude
variations between sites.
Coal tar exists in the subsurface as a non-aqueous phase liquid (NAPL) acting as a continuous
source of contamination. Coal tar can range in density from lighter than water (LNAPL) to
denser than water (DNAPL) (Moo-Young et al., 2009) resulting in sources near the water table
and in pools above impermeable boundaries (Murphy, 2005). Over time, lighter mass fractions
in the coal tar will decrease due to weathering (i.e., volatilization, and degradation) (Moo-Young
et al., 2009). Therefore, the concentrations of BTEX compounds and PAHs with low molecular
weights diminish over time (Yeom et al., 1995). In contrast, heavier, less soluble compounds
3
(PAHs with 3 or more rings) will remain in the NAPL and amalgamate into a mass, reducing the
potential for weathering, making them more persistent (Hatheway, 2006).
Coal tar migration in the subsurface is controlled by gravity, viscous and capillary forces. The
dissolution mechanism is responsible for the presence of the associated aqueous phase
compounds. Studies conducted to estimate groundwater concentrations of coal tar compounds at
contaminated sites based on aqueous solubilites (Lane, et al., 1992; Lee, et al., 1992; Mackay, et
al. 1991) and it has been determined that predicting aqueous solubilities of coal tar compounds
using a modified version of Raoult’s law agrees with experimental estimates (Lee et al., 1992;
King and Barker, 1999). Therefore, the compounds in coal tar will dissolve into the groundwater
phase depending on their mole fraction in the NAPL and their effective solubility (Moo-Young et
al. 1999). BTEX compounds and low molecular weight PAHs have relatively high aqueous
solubilities compared to high molecular weight PAHs, and are often seen in higher concentrations
in groundwater plumes at former MGP sites (Pinto, 1993).
1.1 Remediation of MGP Residuals
The complex chemical composition of coal tar makes remediation a challenge. Remediation
involves management of both groundwater and soil for LNAPL and DNAPL residuals. To date,
there have been many investigations conducted on the remediation of MGP residuals including
substantial laboratory and pilot-scale research, and some full-scale remediation activities.
Investigations of ex situ remediation techniques such as soil extraction (Luthy et al., 1994;
Yeom et al. 1995), and thermal desorption (O’Shaughnessy and Nardini, 1997) have been
conducted. However, due to increase costs related to hazardous waste disposal, ex situ treatment
is commonly deemed infeasible (McGowan, et al., 1996).
In situ remediation addresses many of the shortcomings associated with ex situ methods and
within the last decade have been developed and applied more frequently (Kavanaugh et al., 2003;
ITRC, 2005; McGuire et al., 2006). In-situ full-scale treatment methods have been applied at
BTEX and PAH contaminated sites using natural attenuation (Bockelmann et al., 2001),
bioremediation (Schmitt et al., 1996), in situ solidification (Underhill et al., 2011), in situ air
sparging with ozone (Nelson, 1997), and permeable reactive barriers (McGovern et al., 2002).
The efficiency of in situ technologies relies on contaminant characteristics and site
hydrogeology. For MGP residuals, methods that rely on high dissolution rates, such as pump-
and-treat, do not provide effective solutions for projects with time constraints due to the low
solubility of many of the coal tar compounds (Luthy et al., 1992; Lane & Loehr, 1992). Similarly,
4
bioremediation and natural attenuation have time frames of decades to obtain remediation goals
(EPA, 1999). In situ chemical oxidation has shown success in heterogeneous sediments and for a
wide range of recalcitrant compounds in short time frames when used alone or coupled with other
remediation technologies (Tsitonaki et al., 2006; Tsai and Kao, 2009; Krembs et al., 2010).
1.1.1 In Situ Chemical Oxidation (ISCO)
In situ chemical oxidation involves the delivery of an oxidant into an aquifer to oxidize organic
contaminants. The benefit of this treatment technology compared to other in situ methods is that
it enhances the dissolution and destruction of contaminants (Major, 2009). Typical oxidants
include peroxide, catalyzed hydrogen peroxide (CHP), permanganate and persulfate. In the peer-
reviewed literature the ability of these reagents to degrade BTEX and PAHs in both aqueous and
slurry systems has been well-documented (Table 1.2). From these studies it is important to note
that permanganate is unable to oxidize benzene, one of the main compounds in coal tar (Crimi
and Taylor, 2007). Peroxide persistence in aquifer solids is dependent on aquifer type and is
short-lived, with a typical half-life of several hours to several days, resulting in its decomposition
before depletion of organic contaminants, increasing remediation costs and clean-up times
(Ferrarese et al, 2008). Finally, treatment of coal tar compounds with CHP have shown its
limited ability to degrade high molecular weight PAHs (4-20% removal) (Bogan and Trbovic,
2003; Lundstedt et al., 2006).
Persulfate is the most recent oxidant used for ISCO treatment and has advantages over other
oxidants. Based on bench-scale tests conducted with persulfate (Table 1.2), it is known to
degrade a wide variety of organic contaminants (Siegrist et al., 2011), have a low natural oxidant
interaction (NOI) (Sra, 2010), and have a higher standard reduction potential (Latimer, 1952)
compared to other oxidants (Yen et al., 2011). Additionally, once activated, persulfate generates
free radicals, further increasing its oxidation potential. Aqueous studies using simulated
groundwater have been conducted to show degradation of BTEX and PAH compounds using
persulfate (>70%) (Block, 2004; Sra, 2010) and further reductions (>80%) were seen with
activated persulfate. Positive results have also been observed with persulfate treatment of MGP
contaminated soil (Killian et al., 2007; Ferrasse et al., 2008; Gryzenia et al., 2009), yielding
>85% removal of compounds.
Although the results from aqueous and slurry batch tests have shown the ability of persulfate to
treat MGP residuals (Nam et al. 2001; Sra et al. 2010), they are not representative of in situ
conditions. The oxidant to solids mass ratio in a batch experiment is larger than what is
encountered in situ and in column experiments, increasing effective interaction of persulfate and
5
the contaminants. As a result, reaction rates are often overestimated leading to unrealistic
expectations of in situ treatment. To date there have been no peer-reviewed studies of column
experiments, pilot-scale experiments, or full-scale trials on the ability of persulfate to treat MGP
residuals. Such investigations are necessary to adequately evaluate the potential for ISCO using
persulfate at former MGP sites.
1.2 Thesis Objectives
The content of this thesis fulfills the initial phases of a larger research project that aims to
demonstrate the efficiency and effectiveness of in situ chemical oxidation using persulfate to treat
MGP residuals beneath a former MGP. The project is a multi-year, pilot-scale evaluation at a
former MGP site in Clearwater Beach, Florida. To achieve the project goal seven subtasks were
defined: source area characterization, bench-scale experiments, push-pull tests, diffusion
modeling, pilot-scale remediation, treatment and short-term monitoring, and long-term
monitoring. The first two subtasks form the objectives of this thesis which are to:
Develop a conceptual site model (CSM) by collecting sufficient background temporal
information to establish a solid understanding of baseline conditions
Design and conduct batch aqueous, batch slurry, and column treatability experiments to
determine kinetic relationships between MGP residuals and persulfate, compare
persulfate activation methods, determine dosing amounts, and quantify oxidant-solids
interaction.
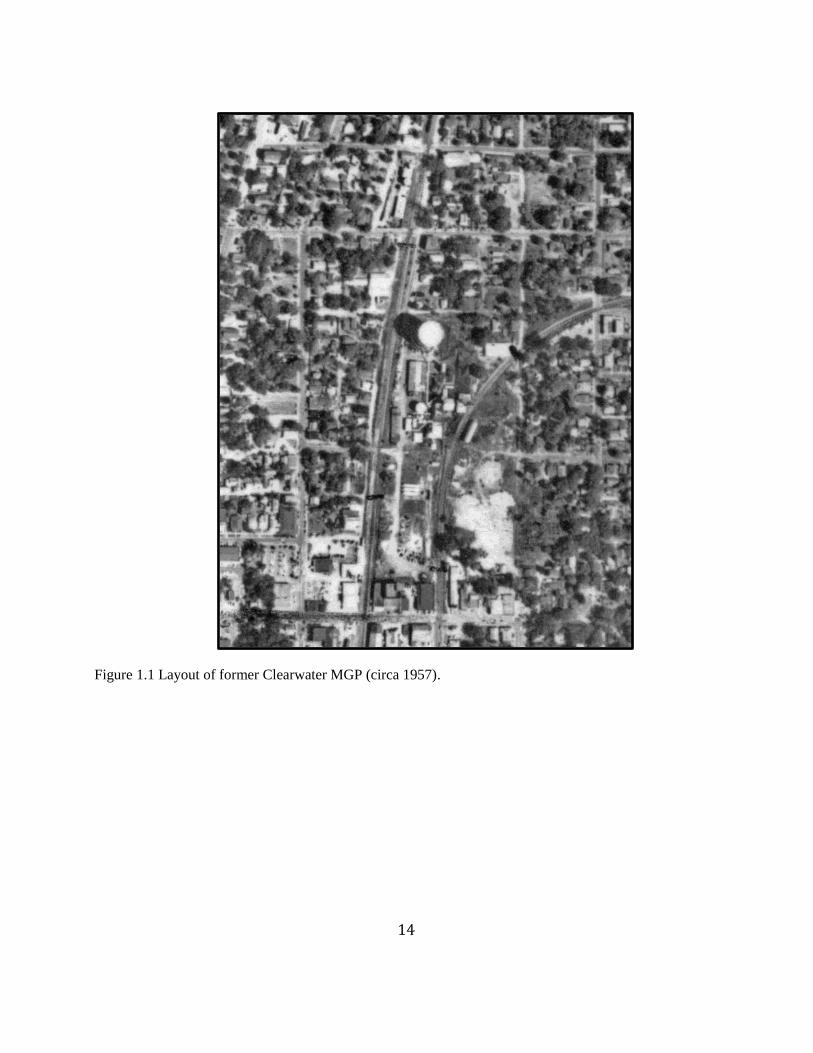
1.3 Site History
The Clearwater MGP operated between approximately 1924 and 1959 at 310 North Myrtle
Avenue, Clearwater, Florida. As identified in Brown's Directory, the plant utilized the Tenny
water gas process from 1924 to 1946, and then switched to the carbureted water gas (CWG)
process. The plant was decommissioned in 1959. The former plant consisted primarily of
buildings hosting retorts, a coke house, a compressor, scrubbers and purifiers, and above and
below ground storage tanks (Figure 1.1).
The CWG process used steam to react with carbon to produce a fuel gas (known as blue gas)
composed of carbon monoxide and hydrogen. Blue gas has a low fuel value and is lacking in
illuminants. To overcome this drawback, the blue gas was thermally cracked with liquid
6
hydrocarbons to produce CWG, a gas with increased heating and illuminating power (Harkins et
al., 1988).
The major by-product of the CWG process was tar from the uncracked portion of the liquid
hydrocarbons. The amount of tar and its chemical composition depends on the original
hydrocarbon feed material and the MGP production process. These tars predominately contain
PAH and BTEX compounds (Harkins et al., 1988). However, unlike tars generated from the
other MGP production processes, they contain trace amounts of nitrogen-based organics,
cyanides, ammonia, and phenols. Additionally, tars and oils produced from the CWG process
were usually less viscous, causing them to be more mobile (Harkins et al., 1988).
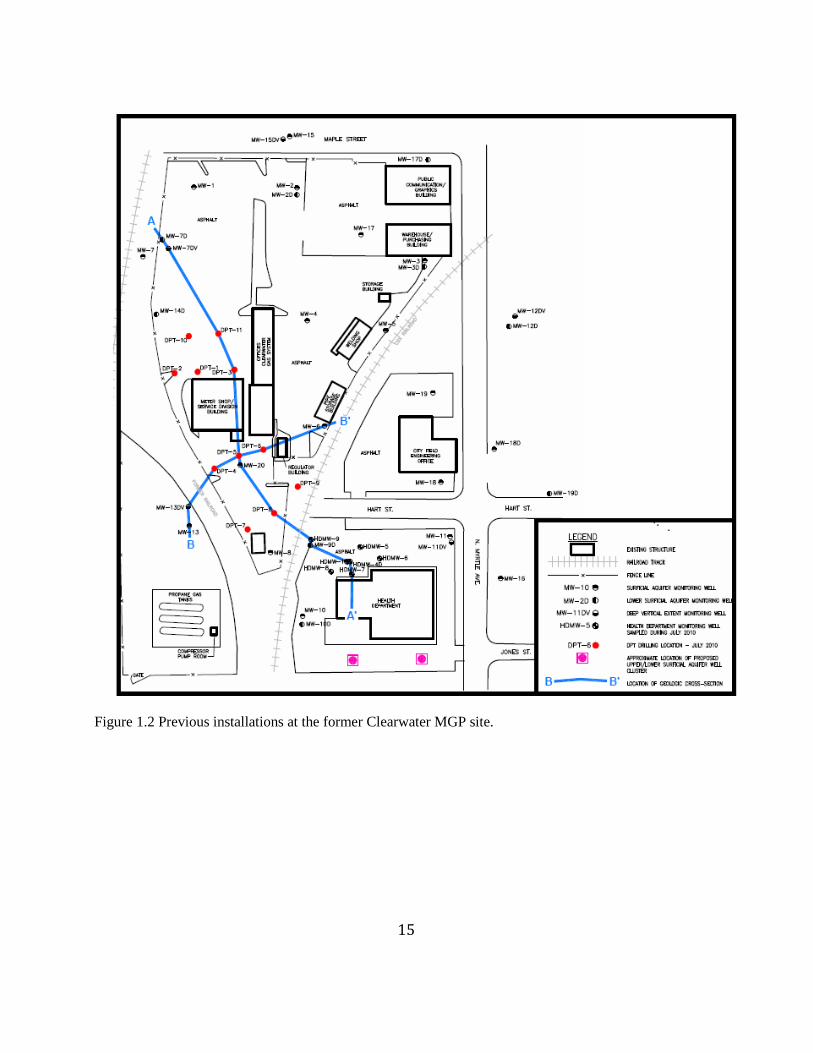
After the plant ceased operations in 1959, the structures were dismantled. Clearwater Gas
System (CGS) now owns the property. The present surface conditions at the Site comprise a
large paved parking area and operation buildings (meter shop, offices, and storage facilities)
(Figure 1.2). The site is surrounded by residential properties to the north and west, and
commercial properties south and east. A railway track is located on the southeast of the site and a
public trail exists to the west just outside the limits of the site.
1.4 Existing Site Conceptual Model
Prior to the commencement of this thesis there were numerous subsurface investigations
performed on site or downgradient on the Pinellas County Health Department property as detailed
in Table 1.3. Additionally, some site characterization was conducted and instrumentation
installed (Figure 1.2). Eleven boreholes, installed using direct-push technology (DPT), had been
installed (denoted DPT-# in the order of their installation) and twenty monitoring wells (denoted
MW-#), were installed. Wells IDs with a suffix of “D”, indicate a lower surficial monitoring
well, while a “DV” suffix indicates a vertical extent monitoring well, and no suffix indicates an
upper surficial monitoring well. Six off-site wells also exist which are named HDMW-1 through
to -6, the “HD” prefix used to differentiate between wells located on the Pinellas County Health
Department property and those installed for the former MGP site investigation.
The existing conceptual site model provided a general stratigraphic profile of the site which
consists of 17 to 30 feet of surficial sands and silts (surficial aquifer), underlain by a competent,
confining clay unit; underlying the clay unit is a buff-colored limestone. A depression in the clay
layer was found at DPT-10. MGP residuals in the surficial sands and silts were observed and a
source area was identified in the surficial aquifer south-east of the meter shop.

7
The groundwater flow direction was determined to be to the south-east in the surficial aquifer
(shallow) and to the south-west in the aquifer underlying the clay unit (deep). Wells were
sampled and analyzed for BTEX and PAH concentrations, and high concentrations of compounds
were observed at MW-20 and MW-9D. Borehole installations confirmed a source zone in the
area upgradient of MW-20. It was estimated that this source zone was contributing to the high
groundwater concentrations observed at these well locations and most likely at downgradient
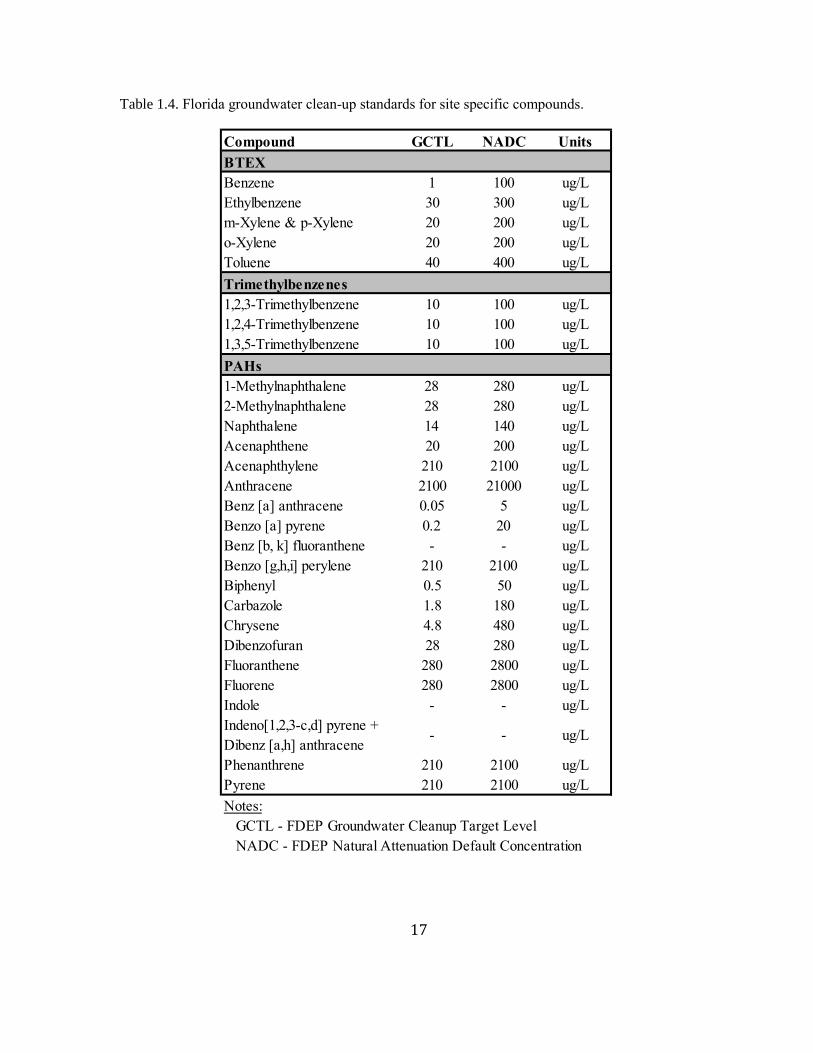
wells HDMW-9, MW-9D, and HDMW-4D. Compounds of concern (COC) for the site were
determined as: benzene, ethylbenzene, naphthalene, 1-methylnapthalene, 2-methylnapthalene,
and acenaphthene based on groundwater concentrations that exceed groundwater clean-up target
levels (GCTLs). State clean-up targets for the COC and other site-specific compounds are given
in Table 1.4.
The existing conceptual site model provided some indication of the hydrogeology and extent of
contamination at the site; however, many uncertainties still exist. For instance, the depth to the
clay unit at DPT-10 was not measured, leaving uncertainty in the lithology and impacts in this
area. The magnitude, direction and seasonal fluctuations in groundwater flow were not estimated.
These hydrogeological conditions are important for predicting the movement and location of
dissolved compounds. Finally, locations, extents and volumes of source zones were minimally
characterized. Further site characterization is essential for designing an effective remediation
strategy.
1.5 Thesis Organization
Chapter 2 focuses on development of the conceptual site model. In this chapter site
geology, hydrogeology, source zones and the groundwater plume are discussed. Chapter 3
addresses the bench-scale studies completed including sediment buffering capacity,
chemical oxygen demand and natural oxidant interaction tests, and treatability studies.
Chapter 4 summarizes the conclusions and recommendations of this research.

8
Table 1.1. MGP residuals and sources.
Residual Compounds Production Method Pathways
Spent purifier and
scrubber wastes
Nitrogen, sulfur,
inorganic
compounds
(mostly cyanide)
Coal Carbonization, Carbureted
Water GasLeaks
Lampblack PAHs and BTEX Oil-gas Dumps
Spills, leaks,
dumps
PAHs, BTEX, and
phenolsCarbureted Water Gas
Spills, leaks,
dumps
Spills, leaks,
dumps
Ammonia CyanidesDischarge to
sewer or ground
Wastewater treatment
sludge
Coal Tar
Tar Sludge
Coke
Coal Tar
Oil Tar
Tar/Oil/Water
Emulsion
Coal Carbonization,
Carbureted Water Gas,
Oil-gas
PAHs, BTEX,
phenols, nitrogen,
sulfur, and metals
Coal Carbonization, Carbureted
Water Gas
PAHs, BTEX, and
phenolsCoal Carbonization

9
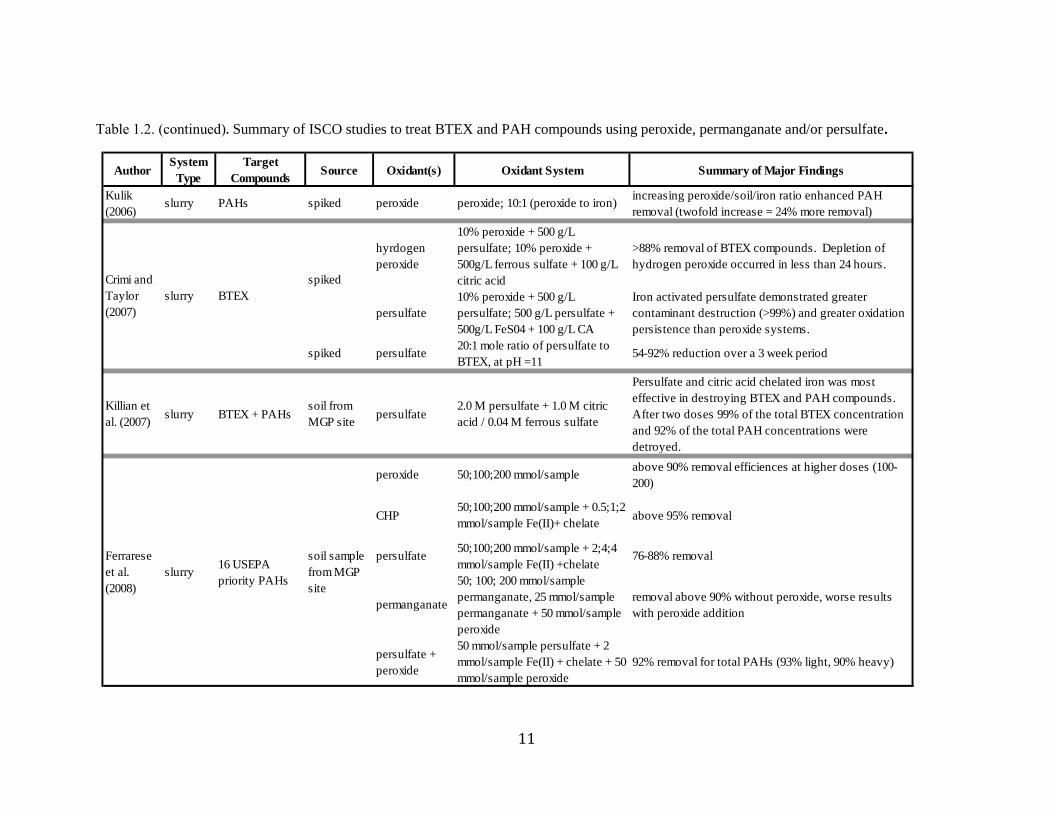
Table 1.2. Summary of ISCO studies to treat BTEX and PAH compounds using peroxide, permanganate and/or persulfate.
AuthorSystem
Type
Target
CompoundsSource Oxidant(s) Oxidant System Summary of Major Findings
Lou and
Lee (1995)aqueous BTEX spiked peroxide
120 mg/L + 0, 100, 200, 400, 600
mg/L Fe(II)
Optimal pH value of 4 was found for degradation.
Complete degradation of BTX in 10 minutes with 120
mg/L peroxide + 600 mg/L Fe(II)
Beltran et
al. (1997)aqueous
fluorene,
phenanthrene,
acenaphthene
spiked CHP
10-5
, 10-4
, 10-3
, 10-2
, 10-1
M
hydrogen peroxide + 7x10⁻⁵
M
Fe(II)
Optimal hydrogen peroxide dose was 10-3
M. Optimal
system yielded complete oxidation of PAHs within
minutes
Kong
(1998)slurry TPH spiked peroxide 0,1,7,15 and 35% by weight
Up to 70% degradation of petroleum compounds with
15% peroxide and 5% iron in 72 hours, no further
degradation observed after 8 days
peroxide4.5; 25 g/kg soil; 4.5;25g/kg soil +
5mM iron
efficiency was dependent on soil type, iron addition
yielded >95% degradation
permanganate 1.5; 15 g permanganate/kg soil99% degradation, quicker degradation at higher
oxidant dose
Nam et al.
(2001)slurry BTEX + PAHs MGP soil peroxide
80% of 2- and 3-ring hydrocarbons and 20-40% of 4-
and 5-ring compounds were destroyed. 84.5% and
96.7% destruction of pyrene and benzo(a)pyrene
reported.
Bogan et
al. (2003)slurry PAHs MGP soil peroxide 10 mM peroxide
Low removal (5%) of high molecular weight PAHs (5
and 6 rings).
Brown et
al (2003)
6 PAHs
(anthracene,
benzo(a)pyrene,
chrysene,
fluoranthene,
phenanthrene,
and pyrene
spiked permanganate 160 mM permanganate
Reactivity order of benzo(a)pyrene (72.1%)>pyrene
(64.2%) > phenanthrene (56.2%) > anthracene (53.8%)
> fluoranthene (13.4%) and chyrsene (7.8%) was
observed in 30 minutes with 160 mM of permanganate
Block et
al. (2004)aqueous BTEX + PAHs spiked persulfate
10% persulfate, 10 % persulfate +
550mg/L Fe(II); 10% persulfate +
550 mg/L Fe(III); 10% persulfate
+ Fe(III)-EDTA
Fe(II) was the most effective activator, complete BTEX
oxidation occurred in all systems.
Gates-
Anderson
et al.
(2001)
slurry
naphthalene,
phenathrene,
and pyrene
spiked
10
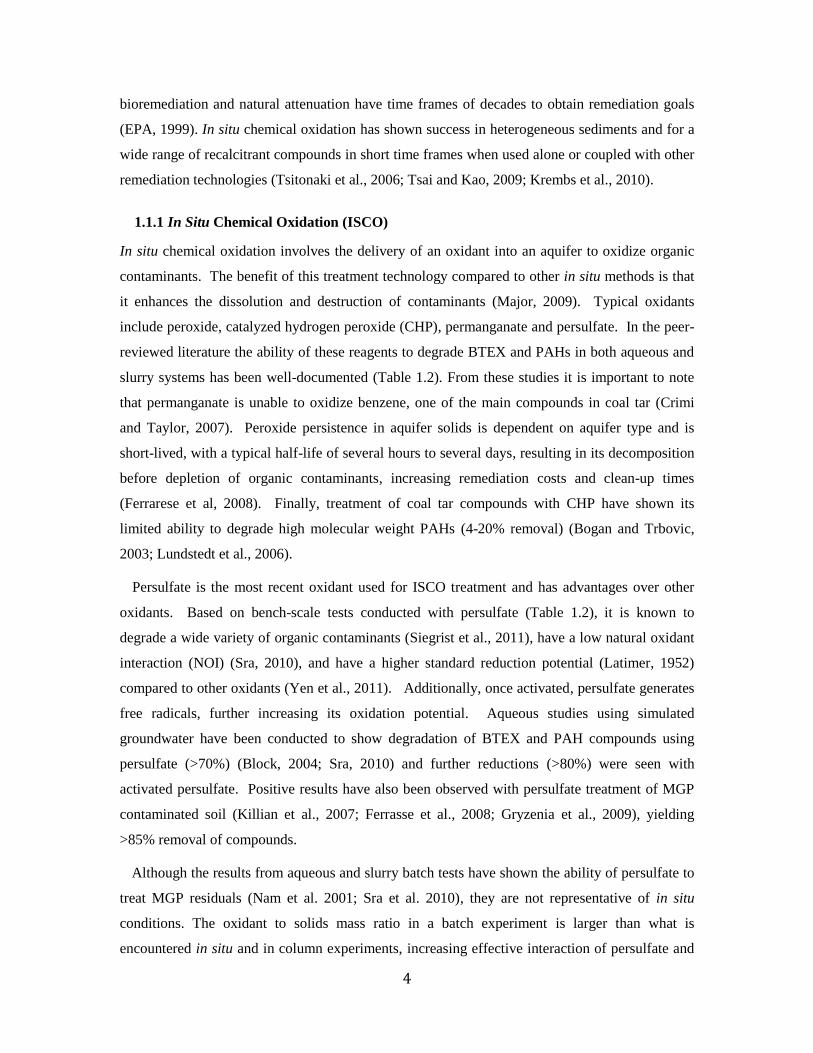
Table 1.2 (continued). Summary of ISCO studies to treat BTEX and PAH compounds using peroxide, permanganate and/or persulfate.
AuthorSystem
Type
Target
CompoundsSource Oxidant(s) Oxidant System Summary of Major Findings
CHP 0.014 M peroxide + 0.0037 M Fe
>92% oxidation of PAHs except for fluoroantene (71%)
and 1-methylnaphthalene (80%). Pyrene did not
decompose under CHP oxidation
permanganate 0.0046 M permanganate>90% oxidation of PAHs except for luoroantene (75%)
and dibenzofuran (74%).
persulfate0.0042 M persulfate + 0.0034 M
Fe
>88% oxidation of PAHs except for 1-
methylnaphthalene (72%). Pyrene did not decompose
under persulfate oxidation
column PAHs + BTEX spiked permanganate 8 g/L permanganate
After 172 days and 3.61 L of permanganate injection,
36.2% PAH removal was measured in treatment
columns, compared to 2.44% in the control column.
Goi (2004) slurry PAHs spiked peroxide
0.001:1:0.0002; 0.004/1/0;
0.004:1:0.0008 peroxide/sand/Fe
(w/w/w)
increasing ratio did not enhance PAH removal. 60%
degradation occurred after 24 hours. Stepwise
addition of peroxide was more effective (80% vs 60%
removal)
Kanel
(2004)slurry
phenanthrene,
anthracene, and
pyrene
spiked peroxide 5 MAfter 3 hours, 73% phenanthrene removal, 60%
anthracene removal, and 55% pyrene removal
Huang et
al. (2005)aqueous BTEX spiked persulfate 1g/L; 5g/L, 20;30;40°C
Higher temperature yielded quicker degradation rates.
At 40°C and 1g/L persulfate, > 95% degradation of
naphthalene, xylene and toluene, 1,2,3TMB, 1,2,4
TMB, and 94.3% degradation of benzene
Kang
(2005)slurry BTEX spiked peroxide
30, 150, 300 mM + Fe(II) or
Fe(III); 2,5 and 10 mM
97% destruction after 3 hours with 300 mM peroxide +
10 mM Fe(III).
aqueous16 USEPA
priority PAHs5 g/L + Fe(II)-EDTA all PAHs < MDL (1 µg/L)
slurry 7 PAHs5 g/L; 5 g/L + 0.124 g/L Fe(II)-
EDTA75-100% degradation of all PAHs in Fe(II) system
persulfate
Forsey
(2004)
slurry PAHs + BTEX spiked
Nadim et
al. (2005)spiked
11
Table 1.2. (continued). Summary of ISCO studies to treat BTEX and PAH compounds using peroxide, permanganate and/or persulfate.
AuthorSystem
Type
Target
CompoundsSource Oxidant(s) Oxidant System Summary of Major Findings
Kulik
(2006)slurry PAHs spiked peroxide peroxide; 10:1 (peroxide to iron)
increasing peroxide/soil/iron ratio enhanced PAH
removal (twofold increase = 24% more removal)
hyrdogen
peroxide
10% peroxide + 500 g/L
persulfate; 10% peroxide +
500g/L ferrous sulfate + 100 g/L
citric acid
>88% removal of BTEX compounds. Depletion of
hydrogen peroxide occurred in less than 24 hours.
persulfate
10% peroxide + 500 g/L
persulfate; 500 g/L persulfate +
500g/L FeS04 + 100 g/L CA
Iron activated persulfate demonstrated greater
contaminant destruction (>99%) and greater oxidation
persistence than peroxide systems.
spiked persulfate20:1 mole ratio of persulfate to
BTEX, at pH =1154-92% reduction over a 3 week period
Killian et
al. (2007)slurry BTEX + PAHs
soil from
MGP sitepersulfate
2.0 M persulfate + 1.0 M citric
acid / 0.04 M ferrous sulfate
Persulfate and citric acid chelated iron was most
effective in destroying BTEX and PAH compounds.
After two doses 99% of the total BTEX concentration
and 92% of the total PAH concentrations were
detroyed.
peroxide 50;100;200 mmol/sampleabove 90% removal efficiences at higher doses (100-
200)
CHP50;100;200 mmol/sample + 0.5;1;2
mmol/sample Fe(II)+ chelateabove 95% removal
persulfate50;100;200 mmol/sample + 2;4;4
mmol/sample Fe(II) +chelate76-88% removal
permanganate
50; 100; 200 mmol/sample
permanganate, 25 mmol/sample
permanganate + 50 mmol/sample
peroxide
removal above 90% without peroxide, worse results
with peroxide addition
persulfate +
peroxide
50 mmol/sample persulfate + 2
mmol/sample Fe(II) + chelate + 50
mmol/sample peroxide
92% removal for total PAHs (93% light, 90% heavy)
Crimi and
Taylor
(2007)
slurry BTEX
spiked
Ferrarese
et al.
(2008)
slurry16 USEPA
priority PAHs
soil sample
from MGP
site
12
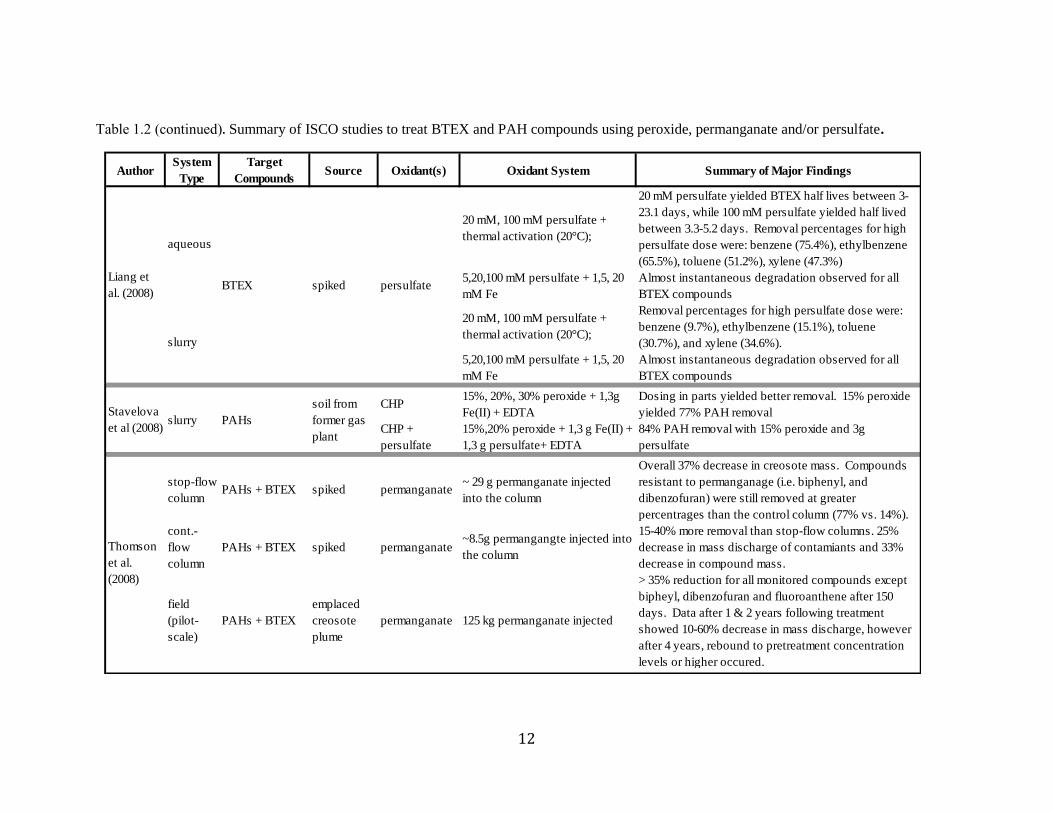
Table 1.2 (continued). Summary of ISCO studies to treat BTEX and PAH compounds using peroxide, permanganate and/or persulfate.
AuthorSystem
Type
Target
CompoundsSource Oxidant(s) Oxidant System Summary of Major Findings
20 mM, 100 mM persulfate +
thermal activation (20°C);
20 mM persulfate yielded BTEX half lives between 3-
23.1 days, while 100 mM persulfate yielded half lived
between 3.3-5.2 days. Removal percentages for high
persulfate dose were: benzene (75.4%), ethylbenzene
(65.5%), toluene (51.2%), xylene (47.3%)
5,20,100 mM persulfate + 1,5, 20
mM Fe
Almost instantaneous degradation observed for all
BTEX compounds
20 mM, 100 mM persulfate +
thermal activation (20°C);
Removal percentages for high persulfate dose were:
benzene (9.7%), ethylbenzene (15.1%), toluene
(30.7%), and xylene (34.6%).
5,20,100 mM persulfate + 1,5, 20
mM Fe
Almost instantaneous degradation observed for all
BTEX compounds
CHP15%, 20%, 30% peroxide + 1,3g
Fe(II) + EDTA
Dosing in parts yielded better removal. 15% peroxide
yielded 77% PAH removal
CHP +
persulfate
15%,20% peroxide + 1,3 g Fe(II) +
1,3 g persulfate+ EDTA
84% PAH removal with 15% peroxide and 3g
persulfate
stop-flow
columnPAHs + BTEX spiked permanganate
~ 29 g permanganate injected
into the column
Overall 37% decrease in creosote mass. Compounds
resistant to permanganage (i.e. biphenyl, and
dibenzofuran) were still removed at greater
percentrages than the control column (77% vs. 14%).
cont.-
flow
column
PAHs + BTEX spiked permanganate~8.5g permangangte injected into
the column
15-40% more removal than stop-flow columns. 25%
decrease in mass discharge of contamiants and 33%
decrease in compound mass.
field
(pilot-
scale)
PAHs + BTEX
emplaced
creosote
plume
permanganate 125 kg permanganate injected
> 35% reduction for all monitored compounds except
bipheyl, dibenzofuran and fluoroanthene after 150
days. Data after 1 & 2 years following treatment
showed 10-60% decrease in mass discharge, however
after 4 years, rebound to pretreatment concentration
levels or higher occured.
Stavelova
et al (2008)slurry PAHs
soil from
former gas
plant
Thomson
et al.
(2008)
Liang et
al. (2008)
aqueous
BTEX spiked persulfate
slurry
13
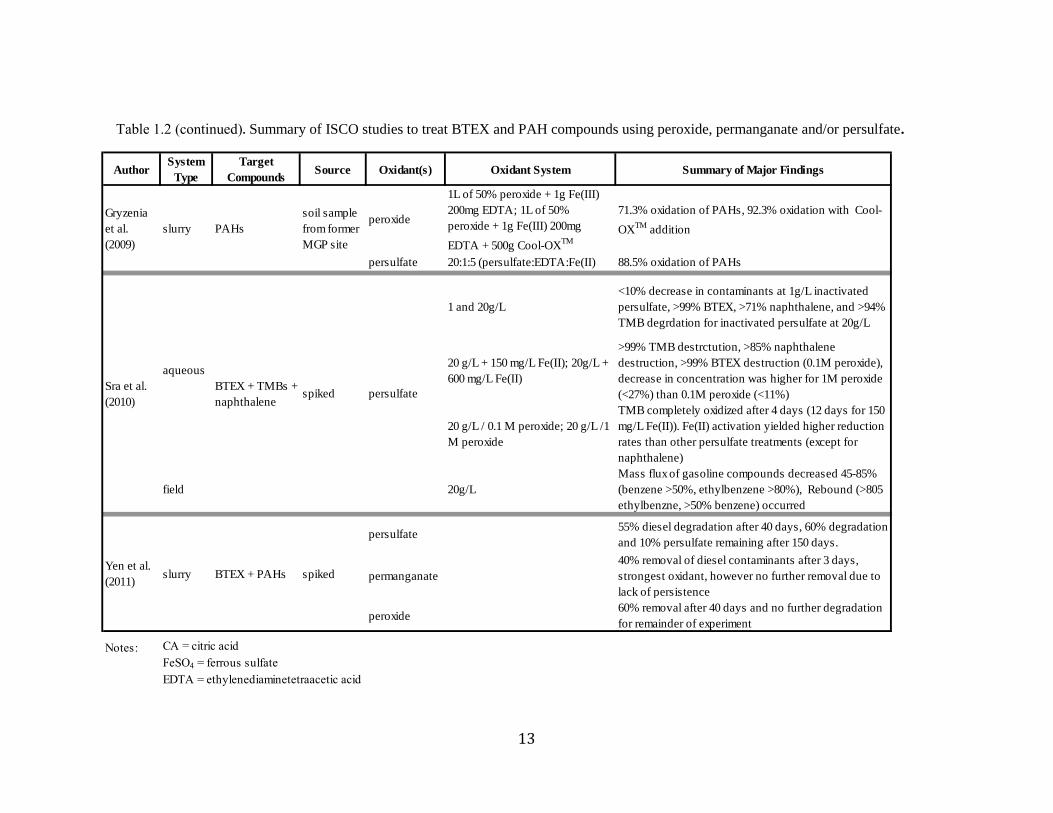
Table 1.2 (continued). Summary of ISCO studies to treat BTEX and PAH compounds using peroxide, permanganate and/or persulfate.
AuthorSystem
Type
Target
CompoundsSource Oxidant(s) Oxidant System Summary of Major Findings
peroxide
1L of 50% peroxide + 1g Fe(III)
200mg EDTA; 1L of 50%
peroxide + 1g Fe(III) 200mg
EDTA + 500g Cool-OXTM
71.3% oxidation of PAHs, 92.3% oxidation with Cool-
OXTM
addition
persulfate 20:1:5 (persulfate:EDTA:Fe(II) 88.5% oxidation of PAHs
1 and 20g/L
<10% decrease in contaminants at 1g/L inactivated
persulfate, >99% BTEX, >71% naphthalene, and >94%
TMB degrdation for inactivated persulfate at 20g/L
20 g/L + 150 mg/L Fe(II); 20g/L +
600 mg/L Fe(II)
>99% TMB destrctution, >85% naphthalene
destruction, >99% BTEX destruction (0.1M peroxide),
decrease in concentration was higher for 1M peroxide
(<27%) than 0.1M peroxide (<11%)
20 g/L / 0.1 M peroxide; 20 g/L /1
M peroxide
TMB completely oxidized after 4 days (12 days for 150
mg/L Fe(II)). Fe(II) activation yielded higher reduction
rates than other persulfate treatments (except for
naphthalene)
field 20g/L
Mass flux of gasoline compounds decreased 45-85%
(benzene >50%, ethylbenzene >80%), Rebound (>805
ethylbenzne, >50% benzene) occurred
persulfate55% diesel degradation after 40 days, 60% degradation
and 10% persulfate remaining after 150 days.
permanganate
40% removal of diesel contaminants after 3 days,
strongest oxidant, however no further removal due to
lack of persistence
peroxide60% removal after 40 days and no further degradation
for remainder of experiment
Notes: CA = citric acid
FeSO4 = ferrous sulfate
EDTA = ethylenediaminetetraacetic acid
Sra et al.
(2010)
aqueous
BTEX + TMBs +
naphthalenespiked persulfate
Yen et al.
(2011)slurry BTEX + PAHs spiked
Gryzenia
et al.
(2009)
slurry PAHs
soil sample
from former
MGP site
14
Figure 1.1 Layout of former Clearwater MGP (circa 1957).
15
Figure 1.2 Previous installations at the former Clearwater MGP site.

16
Table 1.3. Summary of previous site investigations.
Year Work Completed Purpose Report
1996Installation of Test
Trenches (#1-31)Determine site lithology ECT 1996
Installation of Boreholes
(GP-1 through to 35)Determine site lithology ECT 1999
Installation of monitoring
wells (MW-7DV, MW-
12DV, and MW-13DV)
Determine groundwater
properties (pH, DO, etc.),
and analyze for BTEX and
PAH compounds
ECT 1999
Installation of 3 deep
monitoring wells (MW-
7DV and MW-13DV)
Determine site lithology,
estimate groundwater flow
direction, determine
groundwater properties
(pH, DO, etc.), and analyze
for BTEX and PAH
compounds
ECT 2003
Collection of smear zone
and vadose zone soil
samples
Analyze for VOAs and
cyanideECT 2003
Groundwater elevation Groundwater direction
Groundwater sampling Develop current data set
Groundwater sampling
from HDMW-1, HDMW-
5, HDMW-6, HDMW-7,
and HDMW-8
Analyze for BTEX and
PAH compounds to
determine dissolved phase
concentrations
ARCADIS
2010b
Drilling at temporary well
locations (DPT-1 to DPT-
11)
Characterize lithology and
source of dissolved impacts
downgradient
ARCADIS
2010b
Sampling at select DPT
locations
Analyze for BTEX and
PAH compounds to
determine dissolved phase
concentrations
ARCADIS
2010b
1999
2003
ARCADIS
2010a
2010
17
Table 1.4. Florida groundwater clean-up standards for site specific compounds.
Compound GCTL NADC Units
BTEX
Benzene 1 100 ug/L
Ethylbenzene 30 300 ug/L
m-Xylene & p-Xylene 20 200 ug/L
o-Xylene 20 200 ug/L
Toluene 40 400 ug/L
Trimethylbenzenes
1,2,3-Trimethylbenzene 10 100 ug/L
1,2,4-Trimethylbenzene 10 100 ug/L
1,3,5-Trimethylbenzene 10 100 ug/L
PAHs
1-Methylnaphthalene 28 280 ug/L
2-Methylnaphthalene 28 280 ug/L
Naphthalene 14 140 ug/L
Acenaphthene 20 200 ug/L
Acenaphthylene 210 2100 ug/L
Anthracene 2100 21000 ug/L
Benz [a] anthracene 0.05 5 ug/L
Benzo [a] pyrene 0.2 20 ug/L
Benz [b, k] fluoranthene - - ug/L
Benzo [g,h,i] perylene 210 2100 ug/L
Biphenyl 0.5 50 ug/L
Carbazole 1.8 180 ug/L
Chrysene 4.8 480 ug/L
Dibenzofuran 28 280 ug/L
Fluoranthene 280 2800 ug/L
Fluorene 280 2800 ug/L
Indole - - ug/L
Indeno[1,2,3-c,d] pyrene +
Dibenz [a,h] anthracene- - ug/L
Phenanthrene 210 2100 ug/L
Pyrene 210 2100 ug/L
Notes:
GCTL - FDEP Groundwater Cleanup Target Level
NADC - FDEP Natural Attenuation Default Concentration

18
Chapter 2
Enhancement of the Conceptual Site Model
2.1 Field Activities
Additional characterization of the site was required to enhance the existing conceptual site model (CSM)
described in Chapter 1. Four site visits were conducted starting in March 2011 to complete focused site
characterization tasks. This work included delineating the spatial extents and architecture of the MGP
residuals, confirming groundwater flow direction and magnitude, and collecting soil cores to support the
bench-scale efforts. A summary of the fieldwork completed and objectives are provided in Table 2.1.
The site-wide monitoring well and borehole locations are shown on Figure 2.6. Full descriptions of site
work completed are located in Appendix A.
2.2 General Stratigraphy
The site lithology was characterized by the installation of 24 additional boreholes. The installations were
completed using direct-push technology (DPT) and boreholes were named DPT-# in the order of their
installation, starting at DPT-12. In general the site lithology is comprised of a surficial sand and silt unit
which sits on an olive green colored confining clay unit underlain by weathered limestone. The clay unit
is encountered at a depth of between 6 and 12 m (20 and 40 ft) bgs, slopes west to south-west, and is ~3 m
(10 ft) thick. The buff-coloured limestone unit extends to at least 15 m (50 ft) bgs. At borehole 27A,
(DPT-27A) (Figure 3.1), a depression in the clay unit extends to 24 m (81 ft) bgs. The surficial aquifer is
characterized as a fairly uniform fine to very fine grained sand. Horizontal laminations on the millimetre
scale, organic silt nodules, organic muck, and tree rootlets are occasionally present (ARCADIS, 2010a).
2.3 Grain Size Distribution
Particle size distributions were determined by conducting grain size analyses on selected sediment
samples. The purpose of these analyses was to provide an estimate of hydraulic conductivity. Sediment
samples were chosen based on differences in color, composition, and texture as reported in the borehole
logs.
A total of 32 samples were analyzed (Appendix B, Table B.2) using standard methods (ASTM D 422:
Standard Test Method for Particle-Size Analysis of Soils; and ASTM D 6913: Particle Size Distribution
of Soils Using Sieve Analysis). Samples were sieved using standard ASTM sieve sizes 10, 20 40, 60,
100, 140, and 200. Grain size distribution curves were developed on a semi-log plot of the cumulative
19
percent passing each sieve versus the sieve mesh size. Figure 2.1 shows the grain size distributions for
three samples, DTP-6 at 2.7 m (9 ft) bgs, DPT-18 at 7.6 m (25 ft) bgs and DPT-2 at 7 m (23 ft) bgs. The
grain size distribution for DPT-18 and DPT-2 represent the envelope for all the other distributions
determined while the distribution for DTP-6 represents the average distribution observed. In general,
these distributions indicate that the sediments are very well-sorted or poorly graded, and are composed
mostly of fine to medium sand, with some silt. There is little variability in the sediment grain size
distribution across the site.
Using the grains size distributions, the hydraulic conductivity was estimated used the Hazen equation
(Hazen, 1893)
(2.1)
where K is hydraulic conductivity in cm/s, d10, the value where 10% of the sediment sample is finer, and
C is a dimensionless coefficient that factors in the sorting characteristics of the sediment and was obtained
from the grain size distributions. Hazen’s equation was chosen since it is ideal for sand-sized sediment
and is widely accepted (Eggleston and Rojstaczer, 2001). Since the grain size distributions have little
variability, a C value of 50 indicating a well-sorted, mostly fine sand, was deemed to be appropriate for all
samples.
Hazen’s equation yielded hydraulic conductivity estimates ranging from 5.0x10⁻³
to 1.1x10⁻²
cm/s, with
a harmonic mean (n = 32) of 8.0x10⁻³
cm/s. Vertical hydraulic conductivity profiles are shown in Figure
2.2 for DPT-13, DPT-17, and DPT-27. These data indicate the relative homogeneity in hydraulic
conductivity with respect to depth.
2.4 Hydrogeology
2.4.1 Permeability
Falling-head permeameter tests were conducted at the University of Waterloo on the 32 sediment samples
(Appendix B, Table B.2) using standard methods (ASTM D5084-10 Standard Test Methods for
Measurement of Hydraulic Conductivity of Saturated Porous Materials Using a Flexible Wall
Permeameter). The hydraulic conductivity estimated range from 4.0x10⁻³
to 1.1x10⁻²
cm/s with a
harmonic mean of 8.0x10⁻³
cm/s. The results are consistent with the hydraulic conductivity values
estimated from the grain size distributions (Figure 3.2). Full results for all sediment samples are given in
Appendix B (Table B.2).
20
2.4.2 Porosity
Sediment porosity was estimated by standard methods (ASTM D5084-10 Standard Test Methods for
Measurement of Hydraulic Conductivity of Saturated Porous Materials Using a Flexible Wall
Permeameter). The estimated porosity varied from 0.30 to 0.39 with an average of 0.34 ± 0.03 (SD).
Complete results are given in Appendix B (Table B.2).
2.4.3 Slug Tests
On November 2, 2011 rising and falling-head slug tests were performed on monitoring wells (MW) 7D,
23D, 24D and 25, where the D denotes lower surficial monitoring well (MW-7D, MW-23D, MW-24D,
and MW-25). Tests were conducted using a slug constructed from 1inch inner diameter PVC pipe (2.0 ft
long, 1.315 inch outer diameter, volume of 0.22 ft3) filled with sand and capped at both ends. A static
water level reading was taken prior to commencement of each test. Following this initial measurement, a
pressure transducer (HOBOTM
; U20; 69 to 207 kPa (±0.3% FS, 0.62 kPa); 0° to 40°C (+/- 0.03)) U2)
programmed to record pressure readings every second was deployed. The slug was then inserted into
each well and left until a static water level was re-achieved and then removed until water levels returned
to static conditions again. Slug tests were performed in triplicate in each well.
Figure 2.3 shows pressure profiles, for one slug test, in each well as captured by the pressure transducer
during the slug tests. The profiles illustrate a quick hydraulic response for tests performed at MW-23D,
MW-24, and MW-25. However, the test performed at MW-7D was significantly slower in response
indicating that the screened interval for this well is in material with a lower hydraulic conductivity,
possibly the underlying clay unit.
To interpret the collected slug test data, Hvorslev’s method (1951) was chosen since it can be used in
both confined and unconfined aquifers under a variety of well geometric and aquifer conditions.
Additionally, site characterizations conducted in predominately sand environments have shown reliable
and consistent estimates (Mes-Pla et al., 1997). The method makes use of some simplifying assumptions
including homogeneous isotropic soil characteristics, “infinite” aquifer thickness, a horizontal
potentiometric surface, negligible specific storage, and a finite effective radius (Bair and Lahm, 2006).
However, since the slug test effective radius and hydraulic head differential is small the assumptions
made with this method is not likely to produce erroneous results (Chirlin, 1989). The estimate of
21
hydraulic conductivity using Hvorslev’s method is determined from
(2.2)
where K is hydraulic conductivity in cm/s, r is the radius of the well casing in cm, R is the radius of the
well screen in cm, L is the length of the well screen in cm, and T is the time it takes for the water level to
rise or fall 37% of initial perturbation in seconds. Well construction details (Appendix B, Table B.3) and
other information were taken from previous site assessment reports.
The Hvorslev method uses only rising-head data in the computation. Therefore, for the rising head
results, pressure differences were plotted versus time on a semi-logarithmic scale. The straight-line
portions of these plots were used to determine the time at which a 37% change from the initial hydraulic
head occurred and used in Eq (1.2). Results from the Hvorslev analysis are given in Table 2.3. The results
of the Hvorslev’s analysis yielded a pooled harmonic mean of hydraulic conductivity of 2.3x10⁻³
cm/s
with a standard deviation of 6.0x10⁻⁴
cm/s.
The average K estimate for MW-7D was 1.0x10⁻⁴
cm/s. This value is an order of magnitude lower than
the other estimates. Upon review of the well construction log it was determined that a portion of the MW-
7D well screen is in the clay unit and that during well development the “flow was very slow”. Since MW-
7D is not fully located in the sand and the response times are significantly different than the response
times from the other three wells, it was decided that the results from the slug test performed on this well
do not reflect the hydraulic conductivity of the surficial sand unit.
Note that this slug test hydraulic conductivity estimate (2.3x10⁻³
cm/s) is lower that the hydraulic
conductivity estimated from the grain size distribution (8.0x10⁻³
cm/s) and permeameter tests (8.0x10⁻³
cm/s) (Figure 2.2). The use of grain size results often overestimate hydraulic conductivity since
homogeneity is assumed, whereas in the field preferential flow paths may exist and in situ compaction can
occur reducing hydraulic conductivity (Eggleston and Rojstaczer, 2001).
2.4.4 Groundwater Flow and Travel Time
Pressure transducers (HOBOTM
; U20; 69 to 207 kPa (±0.3% FS, 0.62 kPa); 0° to 40°C (+/- 0.03)) were
deployed in MW 7D, MW 23D, MW 24D, and MW 25 to collect data to estimate groundwater flow
direction and magnitude. The pressure transducers recorded water pressure (kPa) and groundwater
temperature (oC) hourly from March 2011 to February 2012.
K r2 lnL
R
2LT

22
Hourly atmospheric pressure data were obtained from National Oceanic and Atmospheric
Administration sources (NOAA, 2012) for Clearwater, Florida (latitude of 27.98 N and longitude of 82.83
W). The transducer pressure observations were subtracted from the atmospheric pressure measurements
and converted into height of water in meters. The top of well casing elevations from a Site survey
performed in 2011 and the adjusted transducer data were used to determine the water elevation (ft amsl) at
each well location. Fluctuations in water elevation and temperature were similar for all the wells. Figure
2.4(a) illustrates the fluctuations in water elevation and temperature observed in MW-7D. Results for all
wells are located in Appendix B (Figure B.1).
A triangular discretization approach was used to calculate two hydraulic gradients (Pinder et al., 1981).
Straight lines were used to connect transducer locations to form two triangles, and two plane surfaces
were fit through the observed hydraulic head values. The slope of the resulting planes is taken to be the
hydraulic gradient.
Monitoring wells MW-23D, 24D and 7D formed the upper triangle and MW-24D, 23D and 25 formed
the lower triangle. Over the year, the calculated hydraulic gradients varied 0.0028 to 0.0036 m/m with a
bearing that varied between 153° and 168°. The average hydraulic gradient was estimated to be 3.3 ±
0.27 x 10⁻³
(SD) for the lower triangle, and 2.9 ± 0.14 x 10⁻³
(SD) for the upper triangle, both in a
direction of S23°E ± 0.2°. Figure 2.4(b) illustrates the temporal variation in gradient and bearing.
Groundwater velocity was estimated from
(2.3)
where v is the groundwater velocity (m/day). Using the average of the two interpolated hydraulic
gradients (i = 0.03), and a hydraulic conductivity (K) of 2.3x10⁻³
cm/s, and a porosity of 0.34, the average
groundwater velocity was determined to be 1.93±0.51 (SD) cm/day (~2 cm/day). Considering this
velocity and the area of the site, travel time estimates from MW-20, where groundwater impacts have
been seen (Section 1.4), to the Health Department property (HDMW-9), a distance of approximately 60 m
(~200 ft), would be 3000 days. Given that the former MGP was operating in 1924, calculations estimate
migration distances of roughly 640 m at the time of publication.
2.5 MGP Source Material
The previously installed boreholes (DPT-1 through to 11) indicated a limited aerial extent of source
material within the surficial aquifer that is suspected to be contributing to the groundwater plume. To
further characterize this source and determine the existence of other sources, borings DPT-11 through to
23
35 were installed. MGP residuals in the form of sheens, blebs (isolated pore spaces containing NAPL),
stringers (a small channel of NAPL, independent or occurring as a branch), and pockets of tar (Figure 2.5)
were observed throughout much of the surficial aquifer. In total, visual impacts were observed in 15 of
the 35 DPT borings completed (Table 2.4).
The following observations are noted:
• a sandy zone above the clay contact (7.3 m (24 ft) bgs) at boring DPT-1 contained an
approximate 7.6 cm (3 inch) thick lense of non-aqueous phase liquid (NAPL)-saturated
material, which was observed at the top of the clay contact.
• Boring DPT-12, north of the Meter Shop contained a NAPL lens at 6.5 m (21.2 ft) bgs and
NAPL pooling was noted on a lense at 6.7 m (22 ft) bgs at the sand/clay contact.
• Boring DPT-13, located north of the Meter Shop contained discrete lenses of NAPL-saturated
material in sands within a few feet above the clay unit; but no NAPL was present at the
sand/clay interface.
• At boring DPT-14 NAPL stringer and residual tar in pores was observed between 4.5-6 m (15-
20 ft) bgs and NAPL was observed to fully saturate pores between 7.5 to 9.0 m (25 to 30 ft)
bgs.
• Inclined boring DPT-18 encountered a tar saturated lens at 9.5 linear meters (31 ft); ~0.6 m (2
ft) above the sand/clay contact.
• At DPT-30 NAPL blebs were observed from 9.4 to 9.8 m (30.8 to 32 ft) bgs, and NAPL
lenses were present at 10.7 m (35.1 ft) bgs.
• Residual NAPL blebs were observed in sandy zones at 5.2-6 m (17-20 ft) bgs at DPT-5, ~0.5
m (1.5 ft) above the clay contact (6.5 m (21.5 ft) bls)
• At DPT-29 NAPL lenses were observed between 5.7 to 5.8 m (18.6 to 19.1 ft) bgs.
Other observed impacts, such as staining and sheens, were noted near the water table in DPT borings:
DPT-7, DPT-11, DPT-20, DPT-24, and DPT-31.
The spatial extents of the residual MGP source material were estimated from the borehole logs,
however, the complete geometry of these zones are not fully defined. Since the cross-sectional areas
perpendicular to flow were approximately ellipses (Appendix B, Figures B.2 and B.3) and the depth of
each source zone varied longitudinally, the equation for the volume of an ellipsoid was used for
estimation of source zone volumes (Table 2.5). Major and minor axes of the ellipse were estimated from
borehole logs and the vertical axis was taken to be the maximum depth of observed impact. Above 4.5 m
bgs (< 15 ft) (shallow) there appear to be three source areas, with a major zone south of the Meter Shop
(Figure 2.6). The volume of this source zone was estimated to be 85 m3 and a cross-sectional area of 42
m2 parallel to groundwater flow. Below 4.5 m bgs (>15 ft) (deep) (Figure 2.7) there appear to be three
impacted areas with the major source zone immediately northwest of the Meter Shop. The largest source
24
area encompasses DPT-1, -12, -13, -14, -29, and -30 is estimated to have a volume of 36 m3 and a cross-
sectional area parallel to groundwater flow of 22 m2. In total there is estimated to be 193 m
3 of source
zone on site.
2.6 Source Material Concentrations
During the borehole installation at DPT-23, two sediment samples were taken, one at a depth of 3-3.5 m
(10-11.5 ft) and one at a depth 6 m (20 ft). Samples were placed in jars, put on ice, and shipped to the
University of Waterloo for BTEX and PAHs analyses (EPA methods 8260 and 8270, respectively). This
borehole was chosen since it had visual impacts in both shallow (<4.5 m) and high zones (>4.5 m ) in the
aquifer. Triplicate samples were taken at each sample depth and results (Appendix B, Table B.5) from the
analyses were averaged (Table 2.2). There were no significant differences between the average
compositions of the two samples at the 5% significance level (Appendix B, Tables B.5 and B.6).
Results from the composition analyses showed that of the detectable compounds, naphthalene was the
most prevalent (27%), followed by 2-methylnaphtalene (18%), and 1-methlynapthalene (10%). It is
difficult to compare the concentrations of the contaminants in the soil phase with other studies since these
measurements can differ up to an order of magnitude due to geological and hydrogeological conditions,
the amount of weathering, MGP operations, and feedstock.
In order to determine the individual constituents in the NAPL, samples of free phase source material
from DPT-23 at 3.04 m (10 ft) were sent to an external lab (ALPHA Analytical, Westborough, MA).
Analyses for alkylated PAHs (EPA 8270C-SIM) and saturated hydrocarbons (EPA8015D) were
completed (Table 2.6). Approximately 30% of the constituents in the coal tar were identified. Of these
constituents naphthalene was the most prevalent (7%), followed by 2-methylnaphthalene (5%) and 1-
methylnaphthalene (3%).
The composition of coal tars has been shown to be highly variable (on orders of magnitude) between
sites (Brown et al., 2006). Data obtained from coal tars from 11 different MGP sites (Brown et al., 2006)
and from four water-gas sites (Birak and Miller, 2008) were compiled (Table 2.7). The Clearwater site
NAPL concentrations fall in the ranges observed by Brown et al. for all compounds except for
naphthalene and benzo[g,h,i]perylene where results were above the observed range. Birak and Miller’s
results do not fit as well with the Clearwater NAPL data; Indeno[1,2,3-c,d] Pyrene + Dibenz [a,h]
Anthracene, chrysene and benz[a]anthracene all fall below their observed ranges. Additionally,
naphthalene again falls above the observed range. Across all data sets naphthalene was the most prevalent

25
constituent followed by 2-methylnapthalene and 1-methylnapthalene. The wide range of concentrations
in coal tar, and the difficulty and variation associated with determining its individual compounds illustrate
the importance of site specific characterization, remediation efforts, and clean-up targets.
2.7 Dissolved Phase Concentrations
Ten multilevel wells were installed evenly spaced in 2.7 m (9 ft) intervals to form a 27.7 m (91 ft) transect
that spans the width of the dissolved phase plume (Figure 2.7 for location). The transect was oriented at
approximately N65°E which, based on previous water level measurements taken at the site, represents a
line that is approximately perpendicular to the mean groundwater flow (Section 2.4.4). Multilevel wells
were selected since they are capable of providing discrete groundwater samples from various depths
within a single borehole installation. Ports were evenly spaced every 0.67 m (2.2 ft) beginning at the
groundwater table and extending to the clay unit (Figure 2.8). The multilevel wells were denoted ML 1-#
to ML10-#, where the # indicates the sampling port as numbered from 1 to 10, starting at the groundwater
table. Additional information on the design and location of the multilevel wells installed are given in
Appendix A. This installation allows for the determination of baseline conditions in concentration and
morphology of the dissolved phase plume, estimation of the mass loading of COC from the source area to
the groundwater plume, and measurements of geochemical parameters.
Four additional multilevel wells were installed inside the meter shop building (Figure 2.7). Sampling
ports were spaced every 1.5 m (5 ft) and the wells were denoted ML 11-# through to ML 14-#, where the
# was 5,10,15, or 20 to indicate the depth of the port. These multilevel wells were required to determine
the dissolved phase concentrations underneath the meter shop due to the source zone discovered
upgradient.
2.7.1 Cation/Anion Scan
Samples were taken from ML1-1, ML5-5, and ML 5-7 and sent to an external laboratory (ALS, Waterloo,
ON) to be analyzed for dissolved ions. Total alkalinity (EPA method 310.2) measurements, an anion scan
(EPA method 300.0), and a total metal scan (EPA method 200.8) were completed. Relevant results from
the general ion scan are given in Table 2.8. The observed sodium concentrations were high due to the
addition of the biocide sodium azide that was added to all samples in the field. Dissolved total iron
concentrations varied from 1.5 to 4.2 mg/L which may be naturally occurring or associated with iron-
cyanide complexes (cyanide has been observed in samples from MW-5, MW-8, MW-20, and HDMW-9).
Also, sulfate was the most abundant anion. This abundance is most likely associated with the gas and

26
liquor purification process at MGP sites where sulfur was released (Hatheway, 2010). Low dissolved
oxygen levels (Appendix B, Tabe B.7), coupled with high iron and sulfate concentrations and low
nitrogen are indicative of anaerobic conditions (Christensen et al., 2000). PAHs have shown to be
persistent under these conditions (Mihelcic and Luthy, 1988), however benzene degradation is common
(Edwards and Grbic-Galic, 1992).
2.7.2 BTEX and PAH Concentrations
In order to characterize the morphology and concentrations of the dissolved phase plume across this
transect, three sampling episodes were conducted. Duplicate samples were taken from each multilevel
port using a sampling glass vial (40 mL) placed between the multilevel port and a peristaltic pump. For
sample collection, the glass vial was fitted to an in-line, stainless steel screw cap sample head. Several (2-
3) groundwater volumes of the vial were passed through before the vial was detached from the sample
head in order to prevent losses due to volatilization. Samples were preserved with sodium azide (0.4 mL
of 10% solution), sealed with PTFE lined screw caps, and preserved in coolers with ice. All collected
samples were shipped on ice to the University of Waterloo where they were were stored at 4 °C and held
for less than 14 days prior to analysis. Analyses of BTEX and PAHs were performed using gas
chromatography techniques and methods in the Organics Laboratory at the University of Waterloo (see
Freitas and Barker (2008) for details).
Results from the BTEX and PAH analyses for three sampling episodes are provided in Appendix C.
Duplicate samples analyzed were checked to ensure variation of < 50%, which is indicative of sufficient
error control during sampling (Barcelona et al., 1985). The first sampling episode was the only episode to
yield values not meeting this criterion (Appendix F, Tables F.1 to F.3). Two sets of duplicate samples
were calculated to be outside this range. These sample measurements were compared with measurements
from sampling episodes 2 and 3. From this comparison, the measurements that fell outside the 50% range
observed in episodes 2 and 3 was assumed to be erroneous and discarded. Using the resulting data, iso-
concentration profiles (Figures 2.9 to 2.14) were created (above the natural attenuation default criteria
(NADC) levels) along the ML transect. Iso-concentration contours for all monitored compounds are
given in Appendix C (Figures C.1 to C.6).
In general, plume morphologies remain relatively constant over across the sampling periods. The
highest concentrations were generally centered laterally around ML-5 for most quantified compounds.
BTEX compounds were observed close to the water table, while trimethylbenzenes were predominately in
the center of the aquifer, and PAHs were concentrated near the clay unit.
27
The following observations are evident from the iso-concentration figures:
The core of the benzene plume is consistently near the water table, with a maximum observed
concentration of 17000 ug/L, during the first sampling episode. The location of the maximum
concentration does not change with time (remains at ML5-2) however, decreases in concentration
are observed (15000 ug/L and 13000 ug/L) in sampling episodes 2 and 3 respectfully.
Ethylbenzene exhibits peak concentrations during sampling round 1 at ML-10 near the water
table. It should be noted that during sampling round three no data was reported at this location
since the port was dry from lowering of the water table.
The morphologies of the BTEX plumes are all relatively similar. The center of mass of these
plumes at the water table, between ML-4 to ML-6, except for ethlylbenzene, which has a center of
mass at ML-10.
The naphthalene plume is more widespread across the monitoring transect relative to the benzene
plume with multiple locations of elevated concentrations. The lateral extent and average
concentration remained relatively constant.
The trimethylbenzene plumes all have similar morphologies with a center of mass at ML-10 and
few changes occur over the sampling periods for these compounds.
Both the 1-methylnapthalene and 2-methylnapthalene plumes at the monitoring transect have
increased in concentration over time. However, the lateral extents have not changed significantly.
Concentrations of the BTEX plumes at the monitoring transect have not changed significantly
over time. The lateral extents have not changed significantly except for toluene, P,M-xylene and
O-xylene where these plume have appeared at ML-3 and no longer observed at ML-10.
Observed acenapthalene concentrations above the NADC at the monitoring transect have been
minimal and only slight temporal variations have been observed.
The concentrations of the remaining monitored compounds were all reported below NADC levels,
except for benz(a)anthracene. Measurements in sampling episodes 1 and 2 each had one
measurement (ML5-1) where benz(a)anthracene concentration exceeded NADC levels.
Figures 2.15 to 2.21 show COC concentration profiles for selected the MLs in the Meter Shop. COC
profiles remain consistent along ML-3, ML-5, and ML-8 with the exception of benzene. Surprisingly,
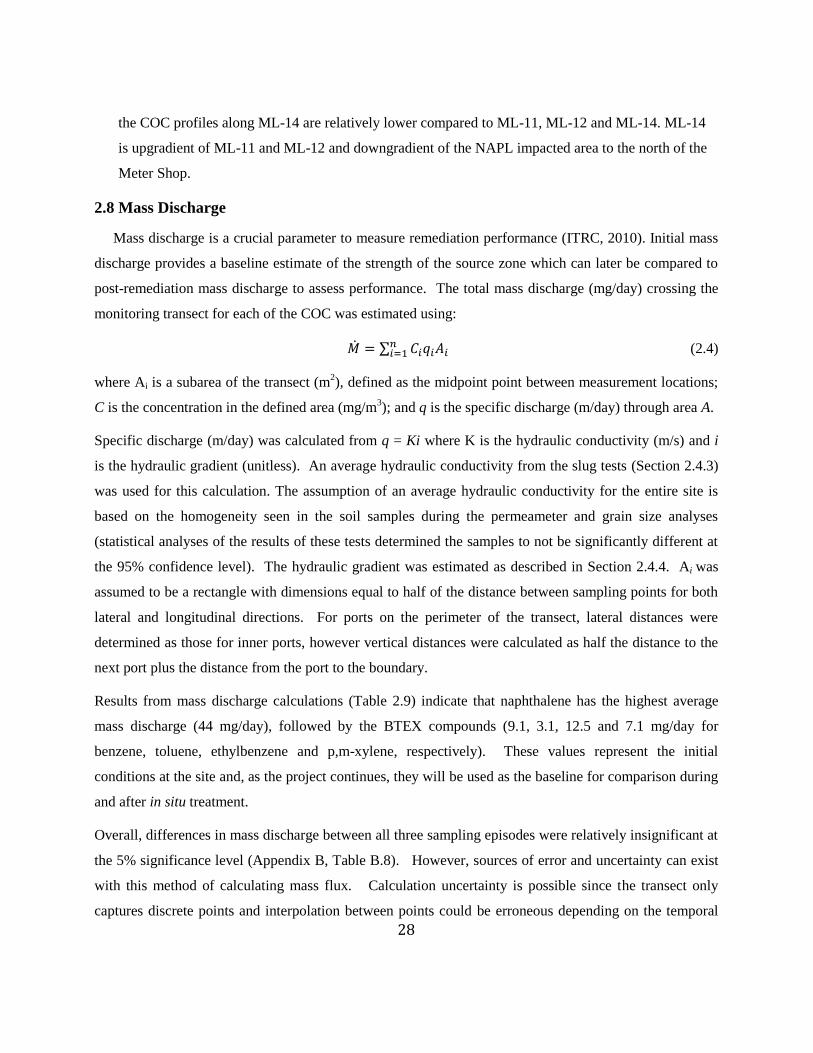
28
the COC profiles along ML-14 are relatively lower compared to ML-11, ML-12 and ML-14. ML-14
is upgradient of ML-11 and ML-12 and downgradient of the NAPL impacted area to the north of the
Meter Shop.
2.8 Mass Discharge
Mass discharge is a crucial parameter to measure remediation performance (ITRC, 2010). Initial mass
discharge provides a baseline estimate of the strength of the source zone which can later be compared to
post-remediation mass discharge to assess performance. The total mass discharge (mg/day) crossing the
monitoring transect for each of the COC was estimated using:
∑ (2.4)
where Ai is a subarea of the transect (m2), defined as the midpoint point between measurement locations;
C is the concentration in the defined area (mg/m3); and q is the specific discharge (m/day) through area A.
Specific discharge (m/day) was calculated from q = Ki where K is the hydraulic conductivity (m/s) and i
is the hydraulic gradient (unitless). An average hydraulic conductivity from the slug tests (Section 2.4.3)
was used for this calculation. The assumption of an average hydraulic conductivity for the entire site is
based on the homogeneity seen in the soil samples during the permeameter and grain size analyses
(statistical analyses of the results of these tests determined the samples to not be significantly different at
the 95% confidence level). The hydraulic gradient was estimated as described in Section 2.4.4. Ai was
assumed to be a rectangle with dimensions equal to half of the distance between sampling points for both
lateral and longitudinal directions. For ports on the perimeter of the transect, lateral distances were
determined as those for inner ports, however vertical distances were calculated as half the distance to the
next port plus the distance from the port to the boundary.
Results from mass discharge calculations (Table 2.9) indicate that naphthalene has the highest average
mass discharge (44 mg/day), followed by the BTEX compounds (9.1, 3.1, 12.5 and 7.1 mg/day for
benzene, toluene, ethylbenzene and p,m-xylene, respectively). These values represent the initial
conditions at the site and, as the project continues, they will be used as the baseline for comparison during
and after in situ treatment.
Overall, differences in mass discharge between all three sampling episodes were relatively insignificant at
the 5% significance level (Appendix B, Table B.8). However, sources of error and uncertainty can exist
with this method of calculating mass flux. Calculation uncertainty is possible since the transect only
captures discrete points and interpolation between points could be erroneous depending on the temporal

29
variability within the aquifer. However, it has been estimated that by sampling 6-7% of the groundwater,
an appropriate estimate of mass discharge is obtained (Li et al. 2007), which was achieved in each
sampling episode (~7%). Additionally, for relatively homogeneous aquifers, concentration variations can
create uncertainty. It was found that sample ports spaced 30 cm apart in an aquifer with an aged
(decades) DNAPL source zone had samples vary by more than three orders of magnitude in concentration
(Guilbeault et al., 2005).
2.9 Current Conceptual Site Model
The site conceptual model resulting from the field investigations and laboratory experiments is
described in the following paragraphs. This model provides information for the design and
implementation of bench-scale testing (Chapter 3) and full-scale remediation (future work).
The site lithology is spatially consistent and is composed of a fine to very fine sand (K = 2.3x10⁻³
±
6.0x10⁻⁴
cm/s (SD) and a porosity of 0.34 ±0.03 (SD)). The water table exists at approximately 1.5 m bgs
and a clay layer underlying the aquifer exists at 7.5 m bgs, with the exception of a depression at DPT-
27A, where the clay unit is encountered at 25 m bgs.
Dissolved iron concentrations above NADC levels (3 mg/L) were observed in groundwater samples and
assumed to be naturogenic or associated with iron-cyanide complexes since low levels (below NADC) of
cyanide have been observed. Additionally, low measurements of dissolved oxygen indicate anaerobic
conditions within the aquifer.
Three shallow (< 4.5 m bgs) source zones exist in the aquifer: upgradient of MW-20, southeast of the
meter shop; upgradient of the metershop encompassing DPT-1, -14, and -29; and surrounding DPT-11.
These three sources are estimated to have a cumulative volume of 153 m3. Three deep source zones were
identified: surrounding DPT-1, -12,-13,-29, and -30; northwest of the meter shop, at MW-26; and
underneath the southwest corner of the meter shop. It is estimated that a total source volume of 39 m3
exists in the deep portion of the aquifer. Uncertainty exists in all estimates of source zone spatial extents
since areas of contamination were interpolated between boreholes. Additionally, the spatial extents of the
north-west corner of the shallow and deep source zones upgradient of the meter shop were approximated
since the depth of the depression in the clay layer made comprehensive drilling infeasible due to time and
cost constraints. Further, the extents of the south east corner of the shallow source zone were
approximated because borehole installation was infeasible through the foundation of the metershop.
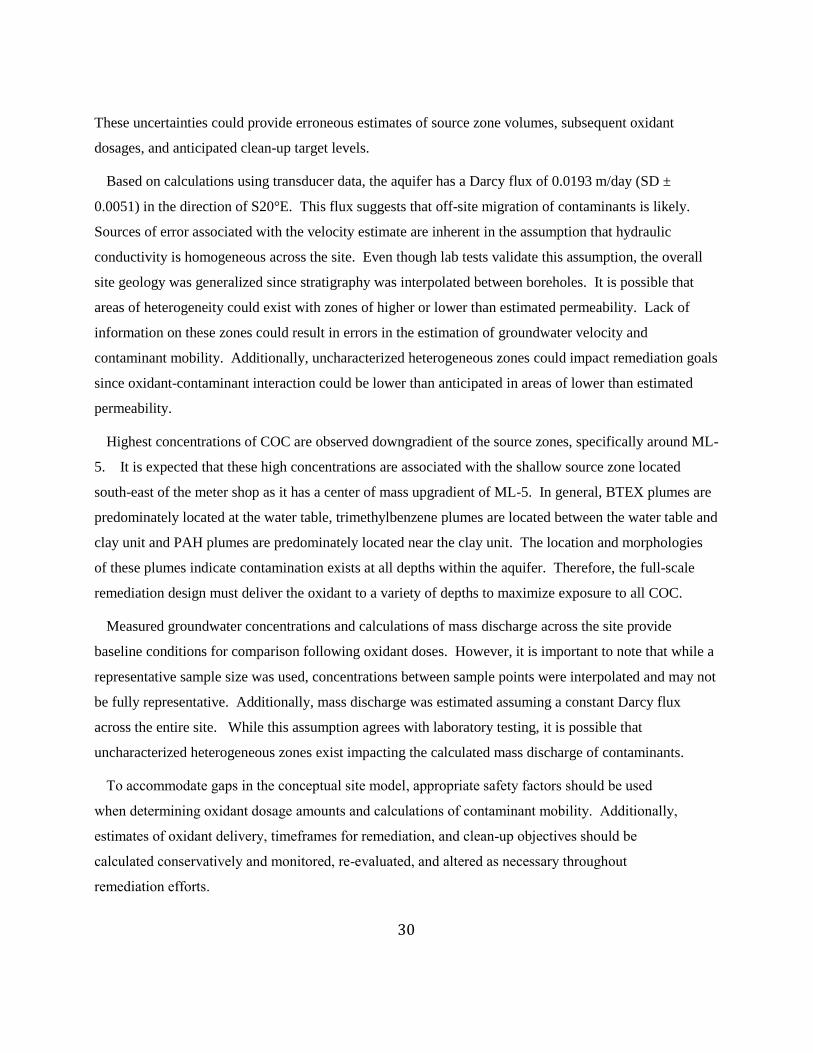
30
These uncertainties could provide erroneous estimates of source zone volumes, subsequent oxidant
dosages, and anticipated clean-up target levels.
Based on calculations using transducer data, the aquifer has a Darcy flux of 0.0193 m/day (SD ±
0.0051) in the direction of S20°E. This flux suggests that off-site migration of contaminants is likely.
Sources of error associated with the velocity estimate are inherent in the assumption that hydraulic
conductivity is homogeneous across the site. Even though lab tests validate this assumption, the overall
site geology was generalized since stratigraphy was interpolated between boreholes. It is possible that
areas of heterogeneity could exist with zones of higher or lower than estimated permeability. Lack of
information on these zones could result in errors in the estimation of groundwater velocity and
contaminant mobility. Additionally, uncharacterized heterogeneous zones could impact remediation goals
since oxidant-contaminant interaction could be lower than anticipated in areas of lower than estimated
permeability.
Highest concentrations of COC are observed downgradient of the source zones, specifically around ML-
5. It is expected that these high concentrations are associated with the shallow source zone located
south-east of the meter shop as it has a center of mass upgradient of ML-5. In general, BTEX plumes are
predominately located at the water table, trimethylbenzene plumes are located between the water table and
clay unit and PAH plumes are predominately located near the clay unit. The location and morphologies
of these plumes indicate contamination exists at all depths within the aquifer. Therefore, the full-scale
remediation design must deliver the oxidant to a variety of depths to maximize exposure to all COC.
Measured groundwater concentrations and calculations of mass discharge across the site provide
baseline conditions for comparison following oxidant doses. However, it is important to note that while a
representative sample size was used, concentrations between sample points were interpolated and may not
be fully representative. Additionally, mass discharge was estimated assuming a constant Darcy flux
across the entire site. While this assumption agrees with laboratory testing, it is possible that
uncharacterized heterogeneous zones exist impacting the calculated mass discharge of contaminants.
To accommodate gaps in the conceptual site model, appropriate safety factors should be used
when determining oxidant dosage amounts and calculations of contaminant mobility. Additionally,
estimates of oxidant delivery, timeframes for remediation, and clean-up objectives should be
calculated conservatively and monitored, re-evaluated, and altered as necessary throughout
remediation efforts.

31
Table 2.1. Summary of field activities
Date Work Completed Purpose
Installation of additional boreholes (DPT-12
through to DPT-27)
Determine lithology and
location and extent of MGP
source material
Collection of soil samples Provide material for bench
scale testing
Collection of undisturbed core samplesProvide material for bench
scale testing
Collection of free NAPL Determine NAPL composition
Installation of additional monitoring wells (MW-
23D, MW-24D, MW-25, MW-25D and MW-26)
Groundwater sampling and
transducer deployment
Deployment of Pressure TransducersEstimate groundwater flow
direction and magnitude
Construction and installation of multi-level
transect (ML-1 to ML-10)
Estimate aqueous mass
discharge
Construction and installation of multi-level wells
in Meter Shop (ML-11, ML 12, ML-13, ML-14)
Determine dissolved phase
concentration below Meter
Shop
Groundwater sampling of transect and Meter
Shop multi-level wells
Determine dissolved plume
concentrations for mass
discharge estimate
Download transducer dataEstimate groundwater flow
direction and magnitude
Groundwater sampling of transect and Meter
Shop multi-level wells
Determine dissolved plume
concentrations for mass
discharge estimate
Download transducer dataEstimate groundwater flow
direction and magnitude
Completion of slug testsEstimate in situ hydraulic
conductivity
Groundwater sampling of transect and Meter
Shop multi-level wells
Determine dissolved plume
concentrations for mass
discharge estimate
Download transducer dataEstimate groundwater flow
direction and magnitude
Mar 7-11, 2011
Jul 17- 22, 2011
Oct 31 - Nov 3, 2011
Feb 13 - 17, 2012

32
Figure 2.1. Particle size distribution for samples DTP 6 at 2.7 m (9ft) bgs, DPT 18 at 7.6 m (25 ft) bgs and DPT-20 at 7 m (23 ft) bgs.
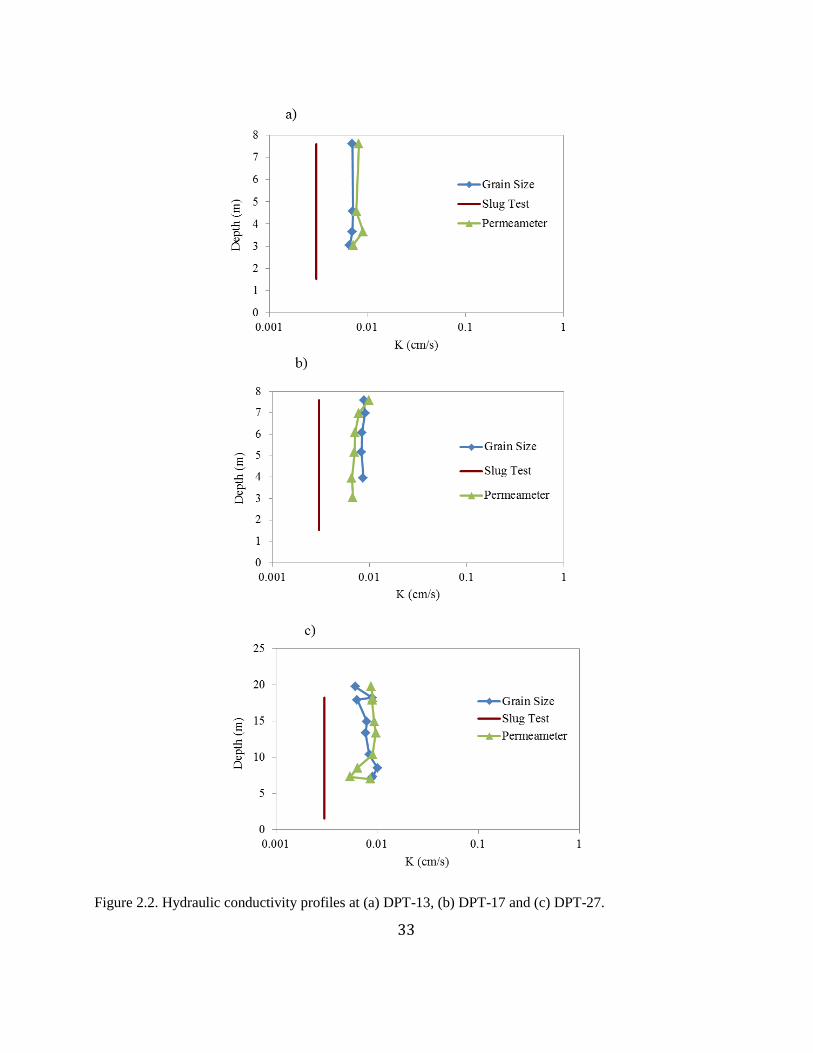
33
Figure 2.2. Hydraulic conductivity profiles at (a) DPT-13, (b) DPT-17 and (c) DPT-27.
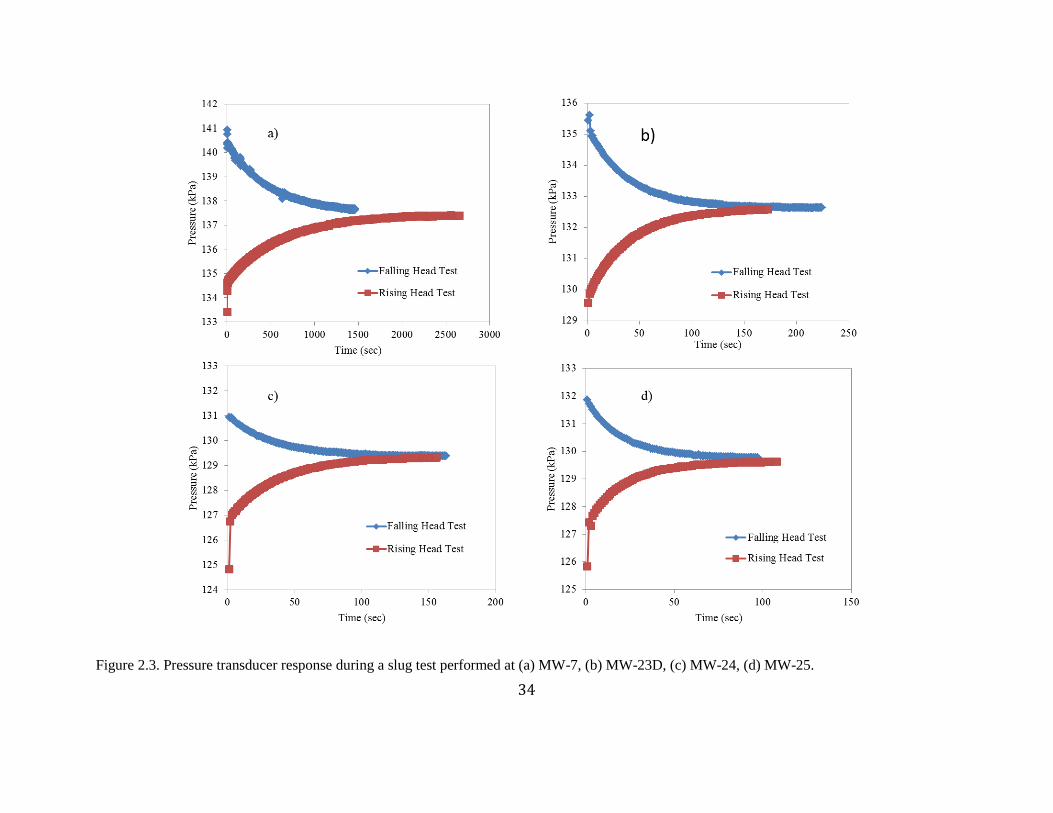
34
Figure 2.3. Pressure transducer response during a slug test performed at (a) MW-7, (b) MW-23D, (c) MW-24, (d) MW-25.

35
Figure 2.4. (a) Water elevation and temperature profile at MW-7D and (b) average hydraulic gradient and
bearing for the site.
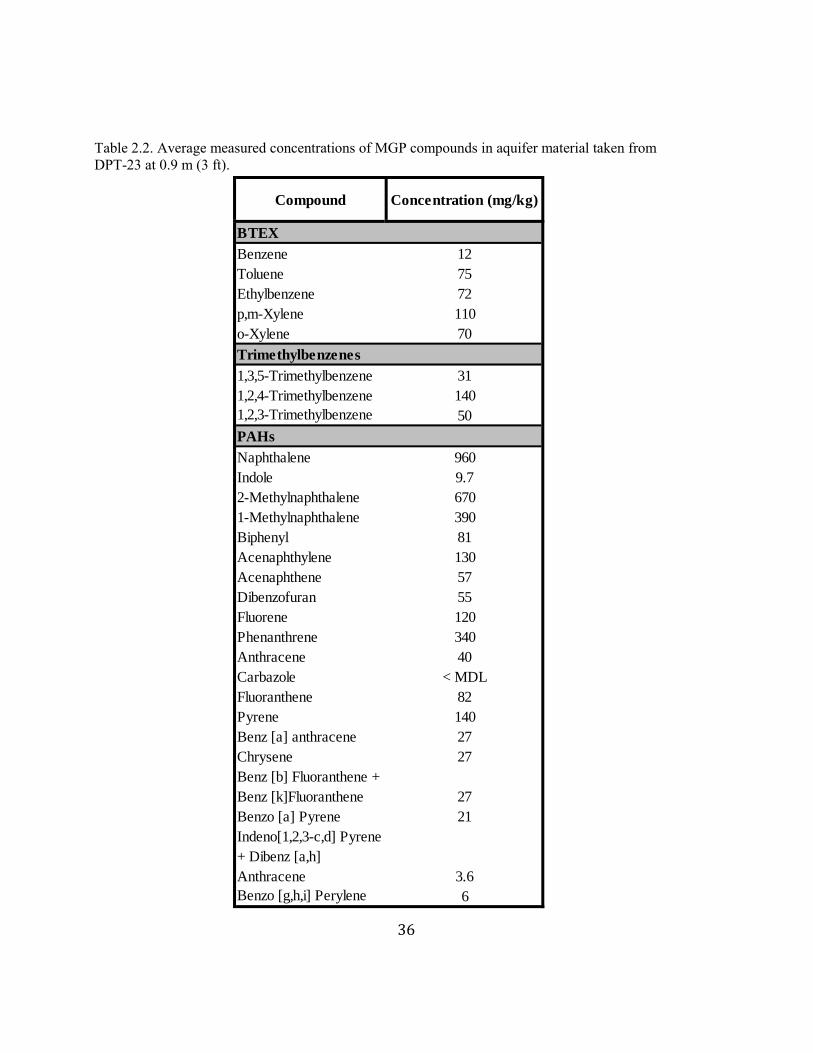
36
Table 2.2. Average measured concentrations of MGP compounds in aquifer material taken from
DPT-23 at 0.9 m (3 ft).
Compound Concentration (mg/kg)
BTEX
Benzene 12
Toluene 75
Ethylbenzene 72
p,m-Xylene 110
o-Xylene 70
Trimethylbenzenes
1,3,5-Trimethylbenzene 31
1,2,4-Trimethylbenzene 140
1,2,3-Trimethylbenzene 50
PAHs
Naphthalene 960
Indole 9.7
2-Methylnaphthalene 670
1-Methylnaphthalene 390
Biphenyl 81
Acenaphthylene 130
Acenaphthene 57
Dibenzofuran 55
Fluorene 120
Phenanthrene 340
Anthracene 40
Carbazole < MDL
Fluoranthene 82
Pyrene 140
Benz [a] anthracene 27
Chrysene 27
Benz [b] Fluoranthene +
Benz [k]Fluoranthene 27
Benzo [a] Pyrene 21
Indeno[1,2,3-c,d] Pyrene
+ Dibenz [a,h]
Anthracene 3.6
Benzo [g,h,i] Perylene 6
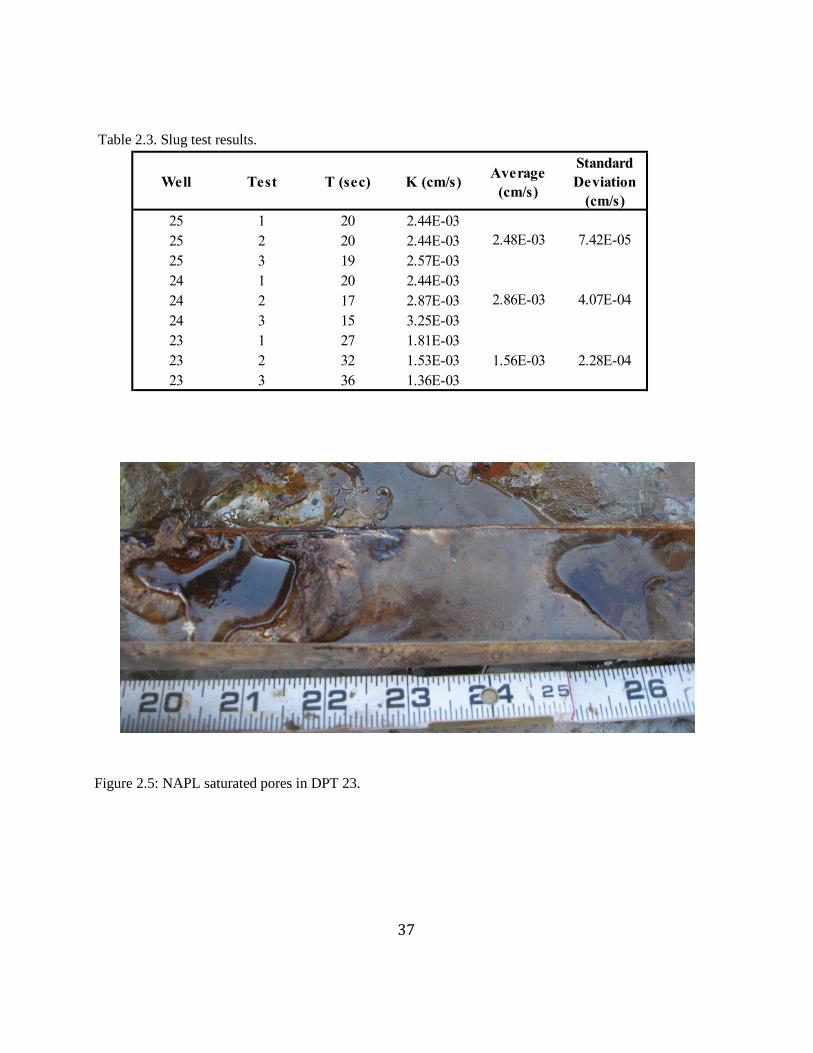
37
Table 2.3. Slug test results.
Figure 2.5: NAPL saturated pores in DPT 23.
Well Test T (sec) K (cm/s)Average
(cm/s)
Standard
Deviation
(cm/s)
25 1 20 2.44E-03
25 2 20 2.44E-03
25 3 19 2.57E-03
24 1 20 2.44E-03
24 2 17 2.87E-03
24 3 15 3.25E-03
23 1 27 1.81E-03
23 2 32 1.53E-03
23 3 36 1.36E-03
2.48E-03 7.42E-05
2.86E-03 4.07E-04
1.56E-03 2.28E-04
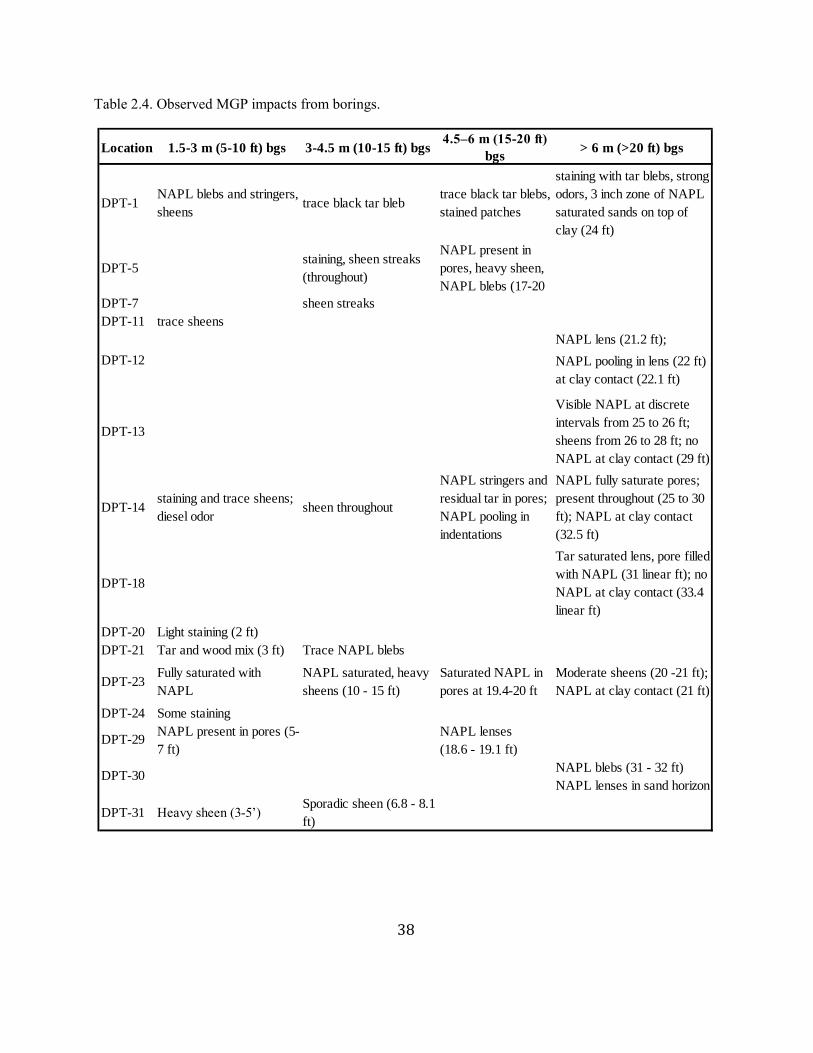
38
Table 2.4. Observed MGP impacts from borings.
Location 1.5-3 m (5-10 ft) bgs 3-4.5 m (10-15 ft) bgs4.5–6 m (15-20 ft)
bgs> 6 m (>20 ft) bgs
DPT-1NAPL blebs and stringers,
sheenstrace black tar bleb
trace black tar blebs,
stained patches
staining with tar blebs, strong
odors, 3 inch zone of NAPL
saturated sands on top of
clay (24 ft)
DPT-5staining, sheen streaks
(throughout)
NAPL present in
pores, heavy sheen,
NAPL blebs (17-20
DPT-7 sheen streaks
DPT-11 trace sheens
NAPL lens (21.2 ft);
NAPL pooling in lens (22 ft)
at clay contact (22.1 ft)
DPT-13
Visible NAPL at discrete
intervals from 25 to 26 ft;
sheens from 26 to 28 ft; no
NAPL at clay contact (29 ft)
DPT-14staining and trace sheens;
diesel odorsheen throughout
NAPL stringers and
residual tar in pores;
NAPL pooling in
indentations
NAPL fully saturate pores;
present throughout (25 to 30
ft); NAPL at clay contact
(32.5 ft)
DPT-18
Tar saturated lens, pore filled
with NAPL (31 linear ft); no
NAPL at clay contact (33.4
linear ft)
DPT-20 Light staining (2 ft)
DPT-21 Tar and wood mix (3 ft) Trace NAPL blebs
DPT-23Fully saturated with
NAPL
NAPL saturated, heavy
sheens (10 - 15 ft)
Saturated NAPL in
pores at 19.4-20 ft
Moderate sheens (20 -21 ft);
NAPL at clay contact (21 ft)
DPT-24 Some staining
NAPL lenses
(18.6 - 19.1 ft)
NAPL blebs (31 - 32 ft)
NAPL lenses in sand horizon
DPT-31 Heavy sheen (3-5’) Sporadic sheen (6.8 - 8.1
ft)
DPT-12
DPT-29NAPL present in pores (5-
7 ft)
DPT-30
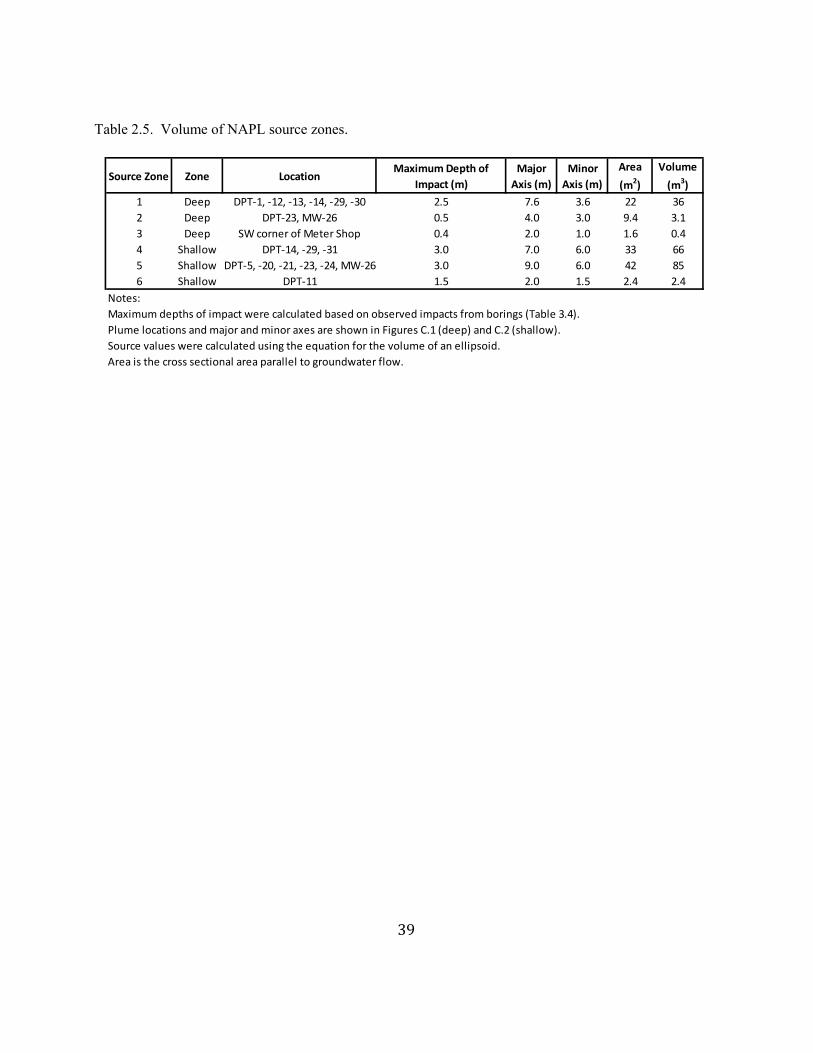
39
Table 2.5. Volume of NAPL source zones.
Source Zone Zone LocationMaximum Depth of
Impact (m)
Major
Axis (m)
Minor
Axis (m)
Area
(m2)
Volume
(m3)
1 Deep DPT-1, -12, -13, -14, -29, -30 2.5 7.6 3.6 22 36
2 Deep DPT-23, MW-26 0.5 4.0 3.0 9.4 3.1
3 Deep SW corner of Meter Shop 0.4 2.0 1.0 1.6 0.4
4 Shallow DPT-14, -29, -31 3.0 7.0 6.0 33 66
5 Shallow DPT-5, -20, -21, -23, -24, MW-26 3.0 9.0 6.0 42 85
6 Shallow DPT-11 1.5 2.0 1.5 2.4 2.4
Notes:
Maximum depths of impact were calculated based on observed impacts from borings (Table 3.4).
Plume locations and major and minor axes are shown in Figures C.1 (deep) and C.2 (shallow).
Source values were calculated using the equation for the volume of an ellipsoid.
Area is the cross sectional area parallel to groundwater flow.

40
Figure 2.6. Estimated extent of observed source zones < 4.5 m (15 ft) bgs (shallow).
??
??
??
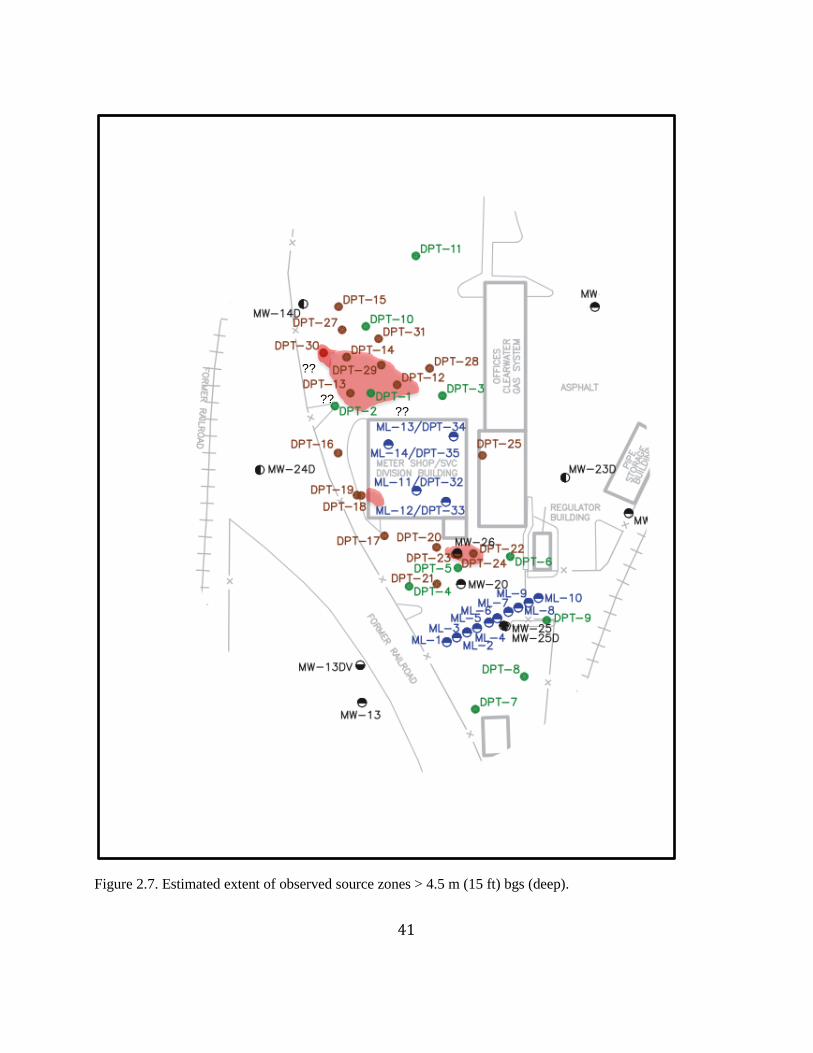
41
Figure 2.7. Estimated extent of observed source zones > 4.5 m (15 ft) bgs (deep).
??
????
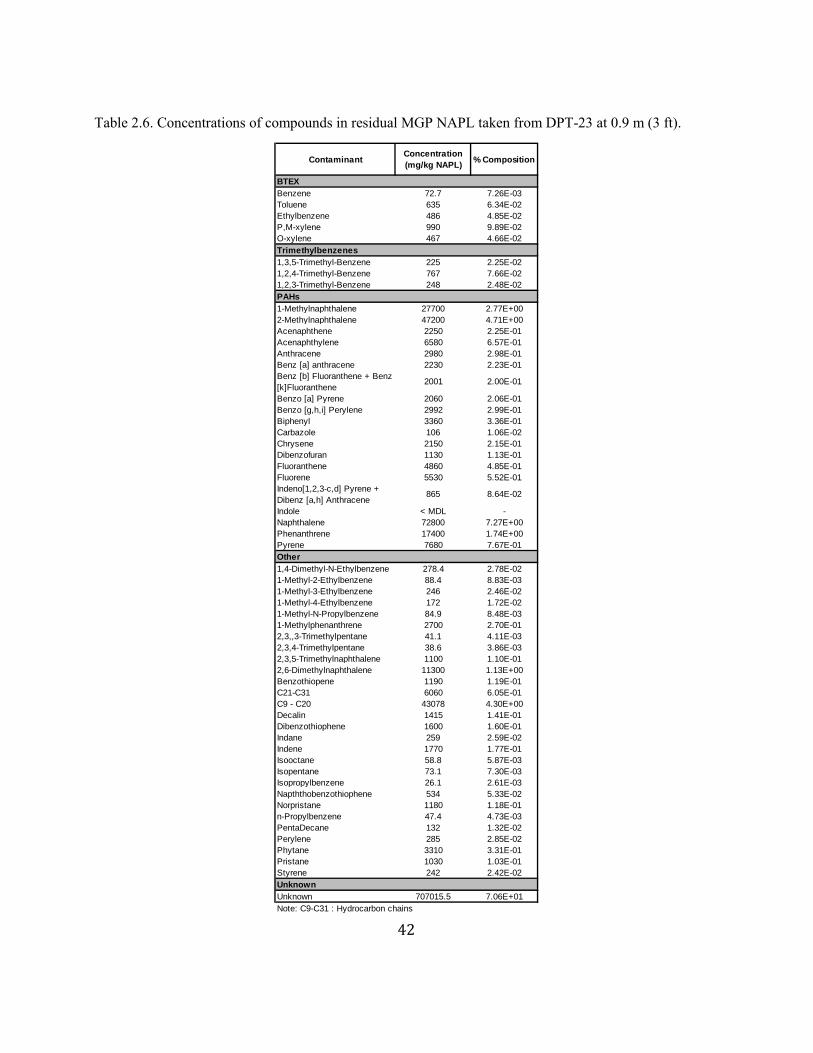
42
Table 2.6. Concentrations of compounds in residual MGP NAPL taken from DPT-23 at 0.9 m (3 ft).
BTEX
Benzene 72.7 7.26E-03
Toluene 635 6.34E-02
Ethylbenzene 486 4.85E-02
P,M-xylene 990 9.89E-02
O-xylene 467 4.66E-02
Trimethylbenzenes
1,3,5-Trimethyl-Benzene 225 2.25E-02
1,2,4-Trimethyl-Benzene 767 7.66E-02
1,2,3-Trimethyl-Benzene 248 2.48E-02
PAHs
1-Methylnaphthalene 27700 2.77E+00
2-Methylnaphthalene 47200 4.71E+00
Acenaphthene 2250 2.25E-01
Acenaphthylene 6580 6.57E-01
Anthracene 2980 2.98E-01
Benz [a] anthracene 2230 2.23E-01
Benz [b] Fluoranthene + Benz
[k]Fluoranthene2001 2.00E-01
Benzo [a] Pyrene 2060 2.06E-01
Benzo [g,h,i] Perylene 2992 2.99E-01
Biphenyl 3360 3.36E-01
Carbazole 106 1.06E-02
Chrysene 2150 2.15E-01
Dibenzofuran 1130 1.13E-01
Fluoranthene 4860 4.85E-01
Fluorene 5530 5.52E-01
Indeno[1,2,3-c,d] Pyrene +
Dibenz [a,h] Anthracene865 8.64E-02
Indole < MDL -
Naphthalene 72800 7.27E+00
Phenanthrene 17400 1.74E+00
Pyrene 7680 7.67E-01
Other
1,4-Dimethyl-N-Ethylbenzene 278.4 2.78E-02
1-Methyl-2-Ethylbenzene 88.4 8.83E-03
1-Methyl-3-Ethylbenzene 246 2.46E-02
1-Methyl-4-Ethylbenzene 172 1.72E-02
1-Methyl-N-Propylbenzene 84.9 8.48E-03
1-Methylphenanthrene 2700 2.70E-01
2,3,,3-Trimethylpentane 41.1 4.11E-03
2,3,4-Trimethylpentane 38.6 3.86E-03
2,3,5-Trimethylnaphthalene 1100 1.10E-01
2,6-Dimethylnaphthalene 11300 1.13E+00
Benzothiopene 1190 1.19E-01
C21-C31 6060 6.05E-01
C9 - C20 43078 4.30E+00
Decalin 1415 1.41E-01
Dibenzothiophene 1600 1.60E-01
Indane 259 2.59E-02
Indene 1770 1.77E-01
Isooctane 58.8 5.87E-03
Isopentane 73.1 7.30E-03
Isopropylbenzene 26.1 2.61E-03
Napththobenzothiophene 534 5.33E-02
Norpristane 1180 1.18E-01
n-Propylbenzene 47.4 4.73E-03
PentaDecane 132 1.32E-02
Perylene 285 2.85E-02
Phytane 3310 3.31E-01
Pristane 1030 1.03E-01
Styrene 242 2.42E-02
Unknown
Unknown 707015.5 7.06E+01
Note: C9-C31 : Hydrocarbon chains
ContaminantConcentration
(mg/kg NAPL)% Composition
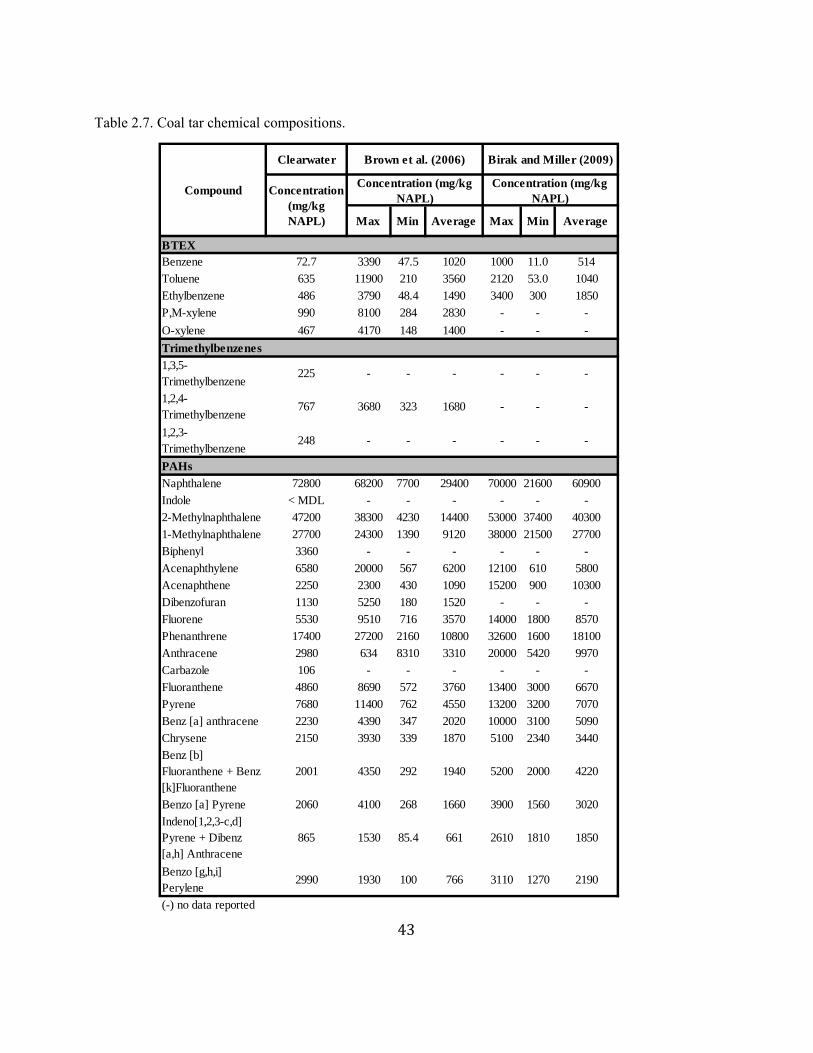
43
Table 2.7. Coal tar chemical compositions.
Clearwater
Max Min Average Max Min Average
BTEX
Benzene 72.7 3390 47.5 1020 1000 11.0 514
Toluene 635 11900 210 3560 2120 53.0 1040
Ethylbenzene 486 3790 48.4 1490 3400 300 1850
P,M-xylene 990 8100 284 2830 - - -
O-xylene 467 4170 148 1400 - - -
Trimethylbenzenes
1,3,5-
Trimethylbenzene225 - - - - - -
1,2,4-
Trimethylbenzene767 3680 323 1680 - - -
1,2,3-
Trimethylbenzene248 - - - - - -
PAHs
Naphthalene 72800 68200 7700 29400 70000 21600 60900
Indole < MDL - - - - - -
2-Methylnaphthalene 47200 38300 4230 14400 53000 37400 40300
1-Methylnaphthalene 27700 24300 1390 9120 38000 21500 27700
Biphenyl 3360 - - - - - -
Acenaphthylene 6580 20000 567 6200 12100 610 5800
Acenaphthene 2250 2300 430 1090 15200 900 10300
Dibenzofuran 1130 5250 180 1520 - - -
Fluorene 5530 9510 716 3570 14000 1800 8570
Phenanthrene 17400 27200 2160 10800 32600 1600 18100
Anthracene 2980 634 8310 3310 20000 5420 9970
Carbazole 106 - - - - - -
Fluoranthene 4860 8690 572 3760 13400 3000 6670
Pyrene 7680 11400 762 4550 13200 3200 7070
Benz [a] anthracene 2230 4390 347 2020 10000 3100 5090
Chrysene 2150 3930 339 1870 5100 2340 3440
Benz [b]
Fluoranthene + Benz
[k]Fluoranthene
2001 4350 292 1940 5200 2000 4220
Benzo [a] Pyrene 2060 4100 268 1660 3900 1560 3020
Indeno[1,2,3-c,d]
Pyrene + Dibenz
[a,h] Anthracene
865 1530 85.4 661 2610 1810 1850
Benzo [g,h,i]
Perylene2990 1930 100 766 3110 1270 2190
(-) no data reported
Compound
Brown et al. (2006) Birak and Miller (2009)
Concentration
(mg/kg
NAPL)
Concentration (mg/kg
NAPL)
Concentration (mg/kg
NAPL)
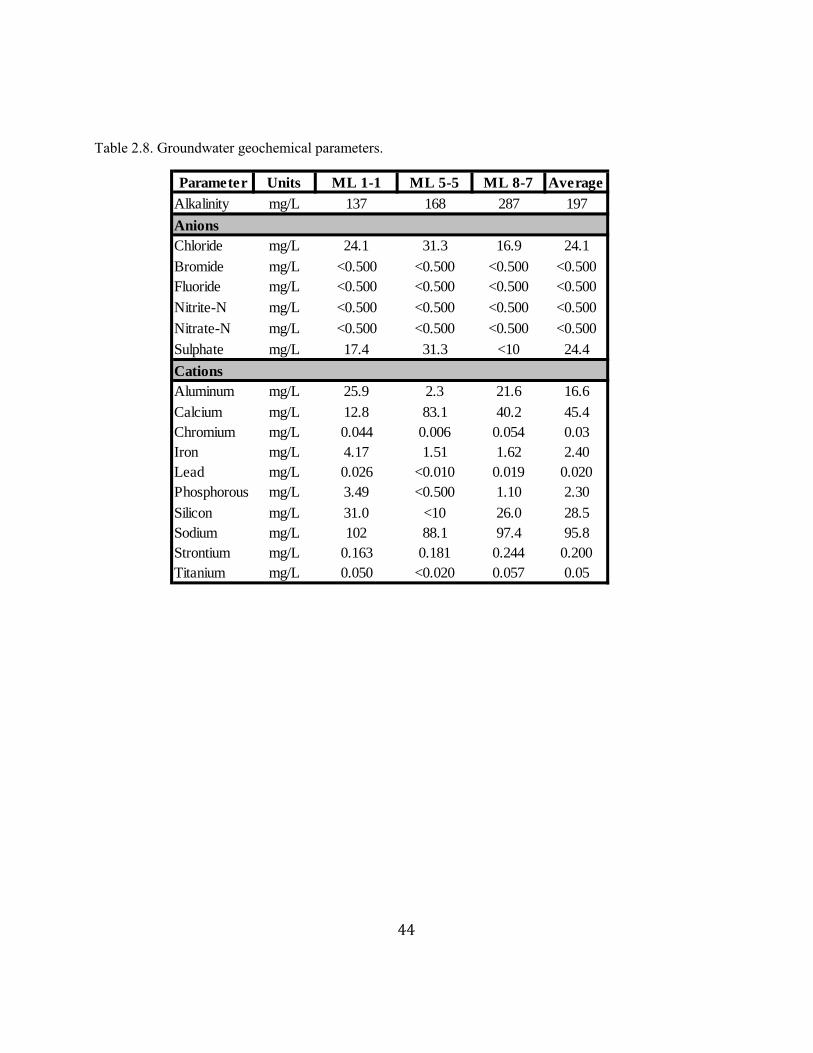
44
Table 2.8. Groundwater geochemical parameters.
Parameter Units ML 1-1 ML 5-5 ML 8-7 Average
Alkalinity mg/L 137 168 287 197
Anions
Chloride mg/L 24.1 31.3 16.9 24.1
Bromide mg/L <0.500 <0.500 <0.500 <0.500
Fluoride mg/L <0.500 <0.500 <0.500 <0.500
Nitrite-N mg/L <0.500 <0.500 <0.500 <0.500
Nitrate-N mg/L <0.500 <0.500 <0.500 <0.500
Sulphate mg/L 17.4 31.3 <10 24.4
Cations
Aluminum mg/L 25.9 2.3 21.6 16.6
Calcium mg/L 12.8 83.1 40.2 45.4
Chromium mg/L 0.044 0.006 0.054 0.03
Iron mg/L 4.17 1.51 1.62 2.40
Lead mg/L 0.026 <0.010 0.019 0.020
Phosphorous mg/L 3.49 <0.500 1.10 2.30
Silicon mg/L 31.0 <10 26.0 28.5
Sodium mg/L 102 88.1 97.4 95.8
Strontium mg/L 0.163 0.181 0.244 0.200
Titanium mg/L 0.050 <0.020 0.057 0.05

45
b
Figure 2.8. Schematic of multilevel (ML) monitoring well construction.
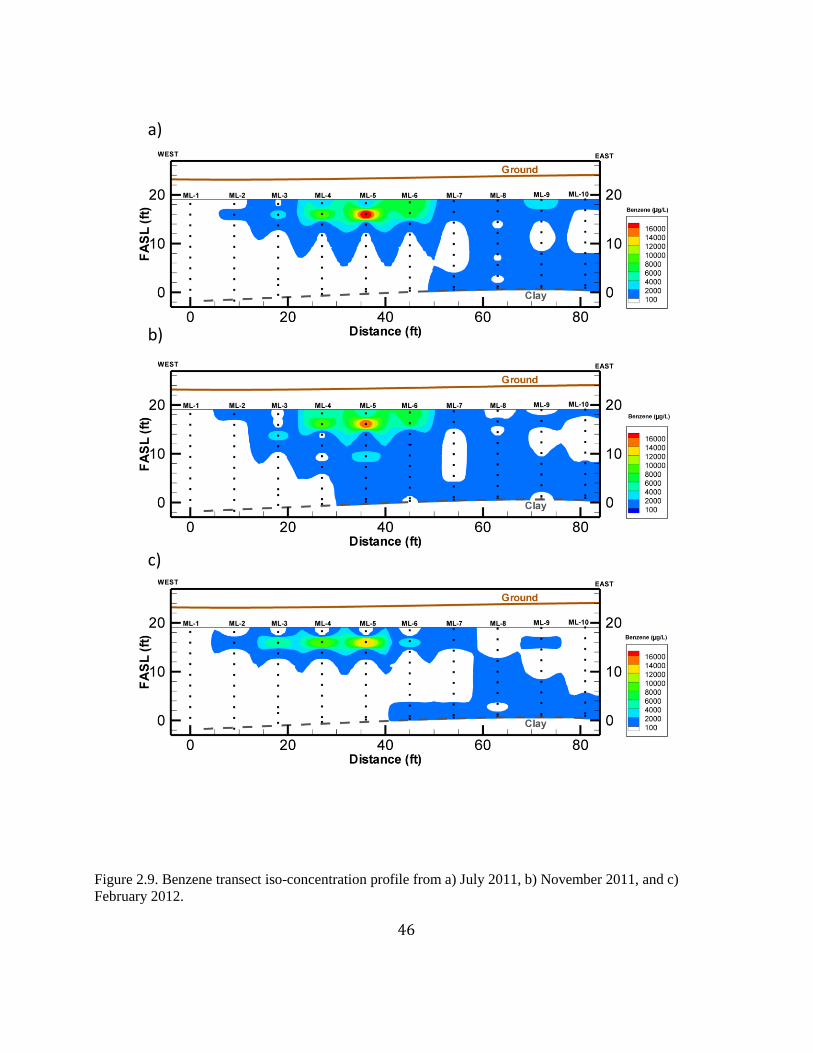
46
Figure 2.9. Benzene transect iso-concentration profile from a) July 2011, b) November 2011, and c)
February 2012.
a)
b)
c)
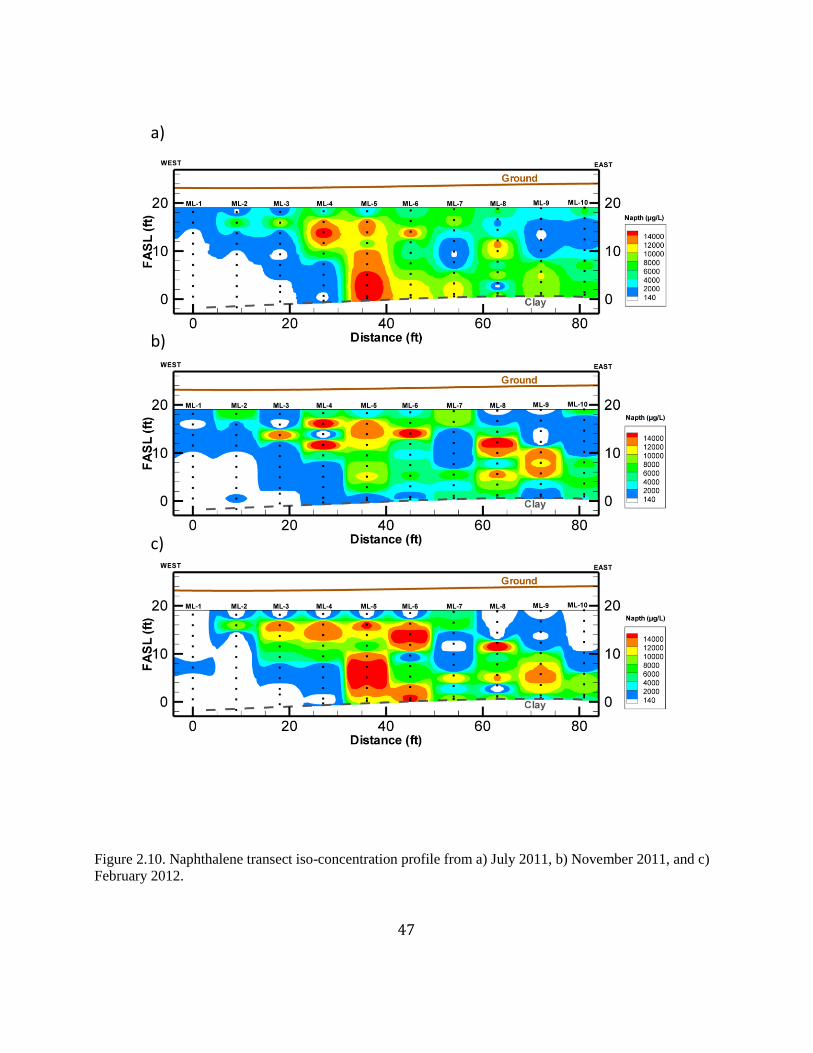
47
Figure 2.10. Naphthalene transect iso-concentration profile from a) July 2011, b) November 2011, and c)
February 2012.
a)
b)
c)

48
Figure 2.11. Ethylbenzene transect iso-concentration profile from a) July 2011, b) November 2011, and c)
February 2012.
a)
b)
c)
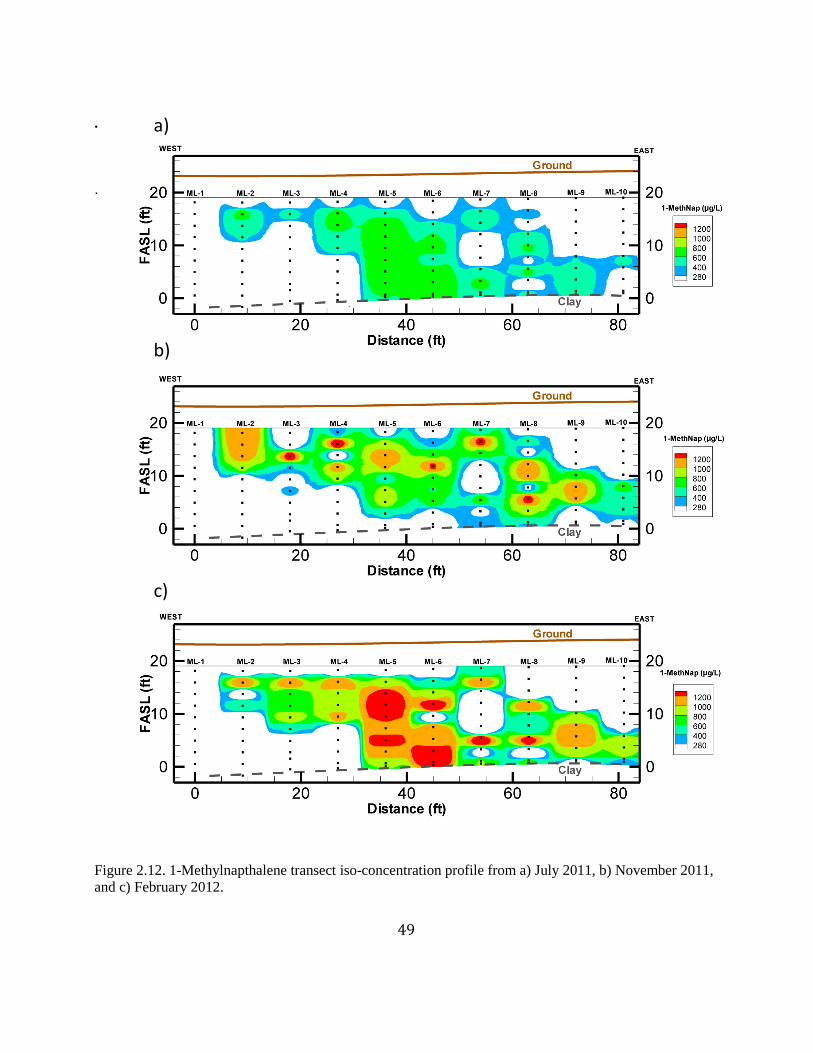
49
a)
b)
c)
.
.
Figure 2.12. 1-Methylnapthalene transect iso-concentration profile from a) July 2011, b) November 2011,
and c) February 2012.
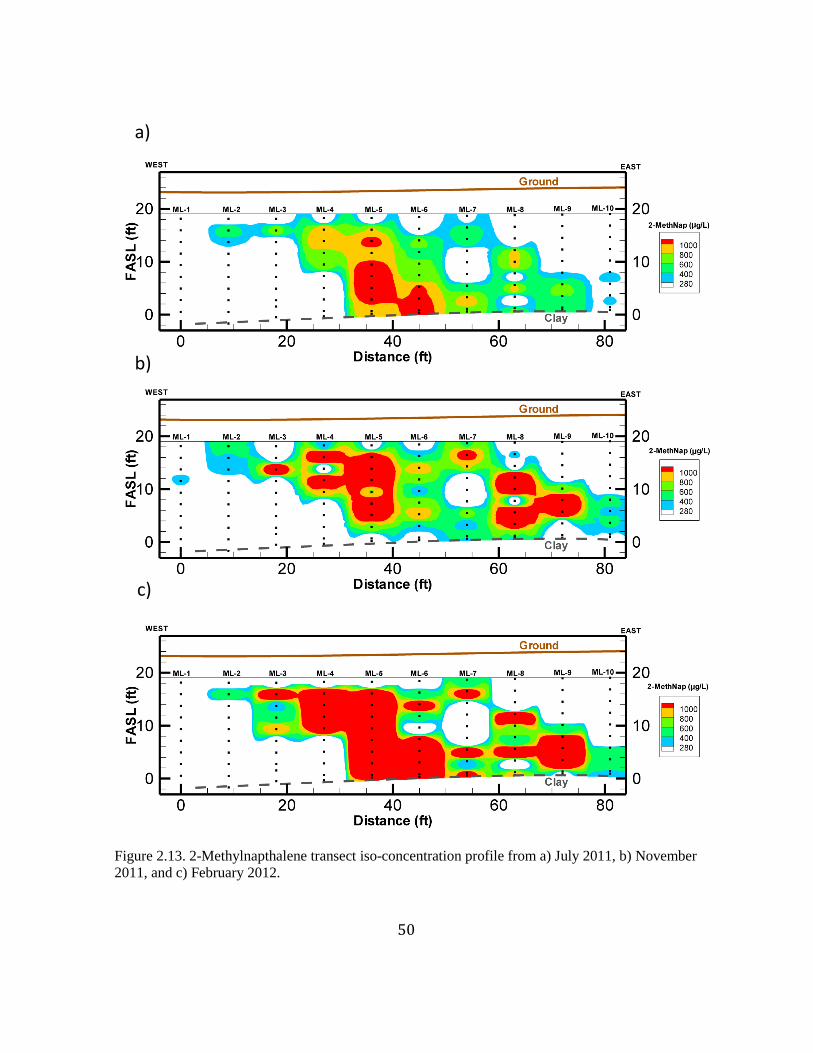
50
a)
b)
c)
Figure 1.
Figure 2.13. 2-Methylnapthalene transect iso-concentration profile from a) July 2011, b) November
2011, and c) February 2012.

51
Figure 2.14. Acenapthalene transect iso-concentration profile from a) July 2011, b) November 2011, and
c) February 2012.
a)
b)
c)
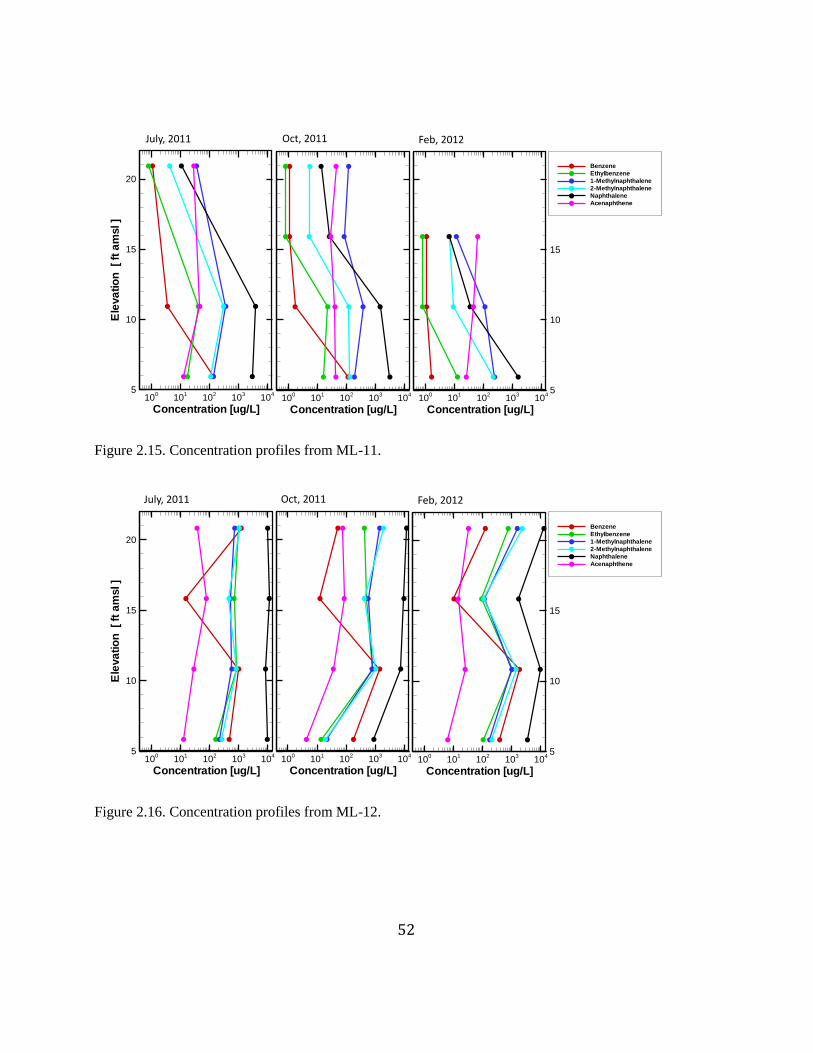
52
Figure 2.15. Concentration profiles from ML-11.
Figure 2.16. Concentration profiles from ML-12.
Concentration [ug/L]10
010
110
210
310
4
Concentration [ug/L]10
010
110
210
310
45
10
15
20
Benzene
Ethylbenzene
1-Methylnaphthalene
2-Methylnaphthalene
Naphthalene
Acenaphthene
Concentration [ug/L]
Ele
va
tio
n[ft
am
sl]
100
101
102
103
104
5
10
15
20
July, 2011 Oct, 2011 Feb, 2012
Concentration [ug/L]10
010
110
210
310
45
10
15
20
Benzene
Ethylbenzene
1-Methylnaphthalene
2-Methylnaphthalene
Naphthalene
Acenaphthene
Concentration [ug/L]10
010
110
210
310
4
Concentration [ug/L]
Ele
va
tio
n[ft
am
sl]
100
101
102
103
104
5
10
15
20
July, 2011 Oct, 2011 Feb, 2012
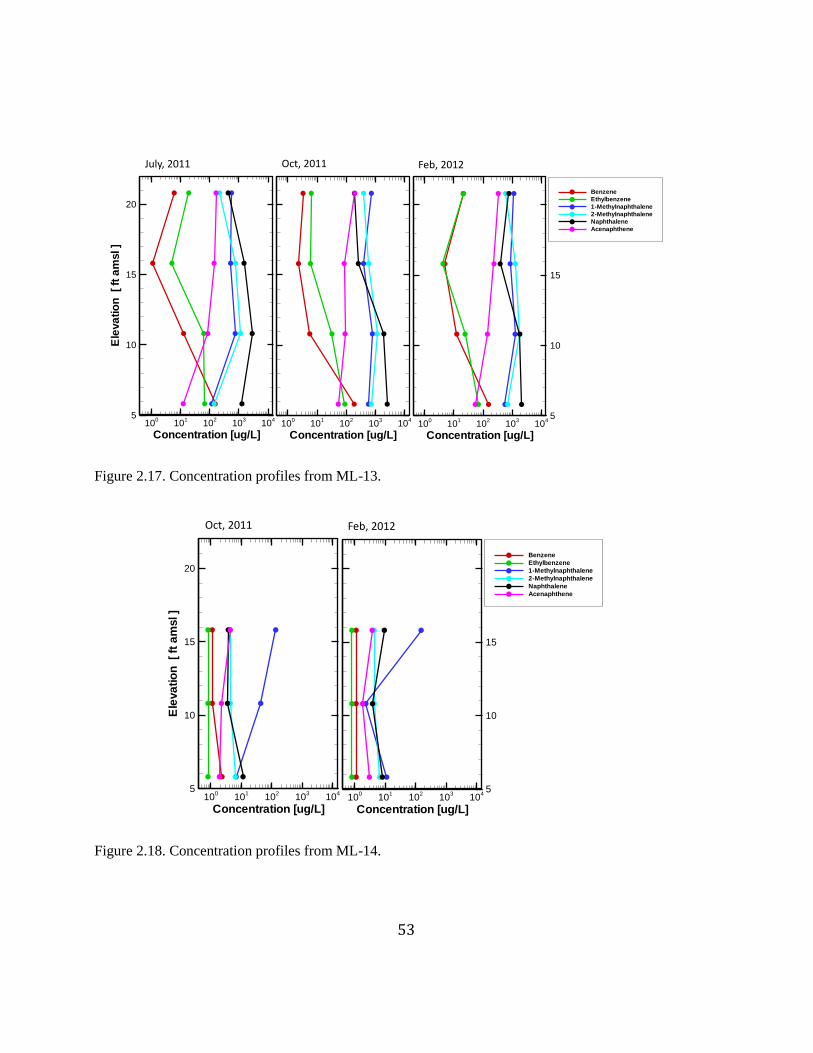
53
Figure 2.17. Concentration profiles from ML-13.
Figure 2.18. Concentration profiles from ML-14.
Concentration [ug/L]10
010
110
210
310
45
10
15
20
Benzene
Ethylbenzene
1-Methylnaphthalene
2-Methylnaphthalene
Naphthalene
Acenaphthene
Concentration [ug/L]
Ele
va
tio
n[ft
am
sl]
100
101
102
103
104
5
10
15
20
Concentration [ug/L]10
010
110
210
310
4
July, 2011 Oct, 2011 Feb, 2012
Oct, 2011 Feb, 2012
Concentration [ug/L]10
010
110
210
310
45
10
15
20
Benzene
Ethylbenzene
1-Methylnaphthalene
2-Methylnaphthalene
Naphthalene
Acenaphthene
Concentration [ug/L]
Ele
va
tio
n[ft
am
sl]
100
101
102
103
104
5
10
15
20

54
Figure 2.19. Concentration profiles from ML-3.
Figure 2.20. Concentration profiles from ML-5.
Concentration [ug/L]
Ele
va
tio
n[ft
am
sl]
100
101
102
103
104
0
5
10
15
20
Concentration [ug/L]10
010
110
210
310
4
0
5
10
15
20Benzene
Ethylbenzene
1-Methylnaphthalene
2-Methylnaphthalene
Naphthalene
Acenaphthene
Concentration [ug/L]10
010
110
210
310
4
July, 2011 Oct, 2011 Feb, 2012
Concentration [ug/L]
Ele
va
tio
n[ft
am
sl]
100
101
102
103
104
0
5
10
15
20
Concentration [ug/L]10
010
110
210
310
4
Concentration [ug/L]10
010
110
210
310
4
0
5
10
15
20Benzene
Ethylbenzene
1-Methylnaphthalene
2-Methylnaphthalene
Naphthalene
Acenaphthene
July, 2011 Oct, 2011 Feb, 2012

55
Figure 2.21. Concentration profiles from ML-8.
Concentration [ug/L]
Ele
va
tio
n[ft
am
sl]
100
101
102
103
104
0
5
10
15
20
Concentration [ug/L]10
010
110
210
310
4
0
5
10
15
20Benzene
Ethylbenzene
1-Methylnaphthalene
2-Methylnaphthalene
Naphthalene
Acenaphthene
Concentration [ug/L]10
010
110
210
310
4
July, 2011 Oct, 2011 Feb, 2012
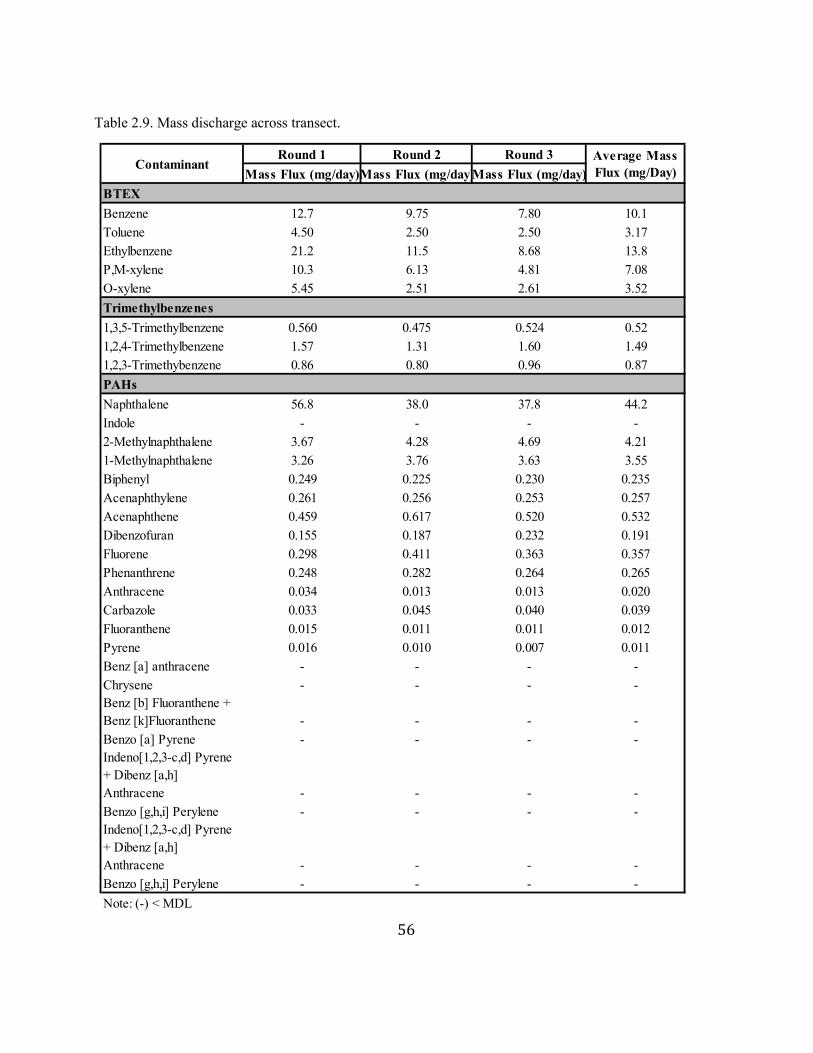
56
Table 2.9. Mass discharge across transect.
Round 1 Round 2 Round 3
Mass Flux (mg/day)Mass Flux (mg/day)Mass Flux (mg/day)
BTEX
Benzene 12.7 9.75 7.80 10.1
Toluene 4.50 2.50 2.50 3.17
Ethylbenzene 21.2 11.5 8.68 13.8
P,M-xylene 10.3 6.13 4.81 7.08
O-xylene 5.45 2.51 2.61 3.52
Trimethylbenzenes
1,3,5-Trimethylbenzene 0.560 0.475 0.524 0.52
1,2,4-Trimethylbenzene 1.57 1.31 1.60 1.49
1,2,3-Trimethybenzene 0.86 0.80 0.96 0.87
PAHs
Naphthalene 56.8 38.0 37.8 44.2
Indole - - - -
2-Methylnaphthalene 3.67 4.28 4.69 4.21
1-Methylnaphthalene 3.26 3.76 3.63 3.55
Biphenyl 0.249 0.225 0.230 0.235
Acenaphthylene 0.261 0.256 0.253 0.257
Acenaphthene 0.459 0.617 0.520 0.532
Dibenzofuran 0.155 0.187 0.232 0.191
Fluorene 0.298 0.411 0.363 0.357
Phenanthrene 0.248 0.282 0.264 0.265
Anthracene 0.034 0.013 0.013 0.020
Carbazole 0.033 0.045 0.040 0.039
Fluoranthene 0.015 0.011 0.011 0.012
Pyrene 0.016 0.010 0.007 0.011
Benz [a] anthracene - - - -
Chrysene - - - -
Benz [b] Fluoranthene +
Benz [k]Fluoranthene - - - -
Benzo [a] Pyrene - - - -
Indeno[1,2,3-c,d] Pyrene
+ Dibenz [a,h]
Anthracene - - - -
Benzo [g,h,i] Perylene - - - -
Indeno[1,2,3-c,d] Pyrene
+ Dibenz [a,h]
Anthracene - - - -
Benzo [g,h,i] Perylene - - - -
Note: (-) < MDL
ContaminantAverage Mass
Flux (mg/Day)
57
Chapter 3
Bench Scale Experiments
This chapter discusses the design and results of bench-scale experiments that were performed to gain
insight into the behaviour of persulfate with uncontaminated site sediments, impacted groundwater and
MGP impacted sediments. The buffering capacity of the soil was analyzed to determine the extent of the
pH shift that occurs with the addition of persulfate. The reductive capacity of the aquifer was estimated
through chemical oxygen demand tests. Persulfate degradation due to oxidant-solid interaction was
quantified for aquifer sediments using NOI tests. Aqueous treatability experiments were conducted to
determine reaction kinetics for unactivated and iron activated persulfate schemes. Finally, column
experiments were used to determine potential treatability end-points and dosing requirements for push-
pull tests and pilot-scale designs.
3.1 Buffering Capacity
The decomposition of persulfate generates protons that will potentially raise or lower the pH of the
groundwater. The amount the pH decreases or increases are dependent on the buffering capacity, or the
ability of the aquifer to resist changes in pH, and the oxidant dose (Siegrist et al., 2011). Mathematically,
buffering capacity is defined as
(3.1)
where dC is concentration of acid or base added to the sediment (eq/L), and dpH is the change in pH after
the addition. The higher the buffering capacity, the less sensitive the material is to additions of acid or
base. The impacts of potential pH shifts are important to consider because they determine persulfate
activation pathways and hence oxidation effectiveness (Siegrist et al., 2011). Acid and base titrations
were conducted to determine the natural alkaline and acidic buffering capacities of the site sediments and
anticipate the in situ pH response to persulfate addition.
Based on the sediment types determined through grain size analyses (Appendix B, Table B.2), random
samples were chosen in order to yield an unbiased characterization of the buffering capacity of the
aquifer. A titration approach, modified from Zoltan (2010) was used to assess the ability for each
sediment type to resist a shift in pH. For each strata, batch reactors containing 10 g of soil were
submersed in 100 mL of distilled water. Following a 24-hour reaction period, the initial pH of the system
was measured and NaOH or H2SO4 was added to the reactor to yield a concentration of 0.01 eq/L.
58
Additional additions of NaOH or H2SO4 were added to achieve concentrations of 0.05, 0.1, 0.5, 1, 5 and
10 meq/L. Controls were prepared without aquifer sediments. Measurements were taken with a pH probe
(Orion, 209A) 24 hours following each addition of acid or base to allow sufficient time for a stable pH to
be reached.
Theoretical pH values were calculated for the control reactors based on the amount of acid or base
added and this estimate is consistent with the pH observations (Appendix D, Figure D.1). In general, the
sediment samples showed buffering capacity for an acid or base concentration below 1 meq/L equivalent
in both alkaline and acidic solutions (Figure 3.1). This is illustrated by the slope of the titration profile
being less steep than the control. However, the sediment was ineffective at buffering conditions higher
than 1 meq/L, indicated by a greater than or equal to the control. An addition of 20 g/L of persulfate will
generate a theoretical hydrogen ion concentration of 0.175 meq/L (Sra et al., 2010). At this concentration,
an in situ pH of around 4 is expected for sediments types of very fine silty sand, and sand with silt; and an
in situ pH of around 6 is expected for fine sand and fine silty sand.
Alkaline activated persulfate has been shown to be the most aggressive persulfate activation scheme.
This scheme generates three free radicals; the hydroxyl, super oxide, and sulfate free radicals (Siegrist et
al., 2011). For this scheme to be effective a system pH >11 is ideal (Siegrist et al., 2011). Since the
buffering capacity of this soil is depleted quickly (Figure 3.1), altering the system with an injection of a
base in situ could be a feasible option.
3.2 Chemical Oxygen Demand (COD) Tests
To quantify the natural reductive capacity of the aquifer solids, chemical oxygen demand (COD) tests
were performed. The tests were performed in triplicate for each of the lithotypes identified in the grain
size analyses (Appendix B, Table B.5) following the method described Xu and Thomson (2008). This
method measured the absorbance of a potassium dichromate solution added to a reactor filled with dried
aquifer material. A standard curve was then utilized to quantify the COD.
The COD results (Table 3.1) are expressed in terms of mg O2/g. This value was converted to an
equivalent mass of permanganate (KMnO4) for comparison with the results in Xu and Thomson (2008).
The results indicate that the site sediments are at low end of the aquifer materials studied by Xu and
Thomson (2008), and hence have a low total reductive capacity (between 0.09 and 0.17 meq/g).
The results for the COD tests performed within a given sample set (sediment type) were compared to
the other sample sets to determine if it was possible that the sample sets were from the same statistical
59
population (i.e., if there was a significant difference in the COD results between soil types). Based on a
one-way ANOVA (Appendix D, Table D.1), it was concluded at a 95% confidence interval that the 16
samples were not statistically distinguishable. Therefore, a single COD value could be considered
representative of all the samples analyzed. An average value of 0.138 meq/g of aquifer material was
estimated with a standard deviation of 0.025 meq/g.
3.3 NOI Tests
Natural oxidant interaction (NOI) tests were conducted to quantify the reduction in persulfate
concentration due to the natural interaction with aquifer materials. NOI decreases oxidant mobility,
reaction rates with the COC, and the mass of oxidant available. Therefore, NOI is an important site-
specific measurement that should be quantified in order to design a cost-efficient treatment system.
Samples were randomly selected for analysis to provide an unbiased estimate of the NOI of aquifer
sediments. Tests were performed in triplicate following the method outlined by Xu and Thomson (2009)
and modified as outlined by Sra (2010). The experiment was completed after 50 days. Persulfate
measurements were taken daily for the first 4 days and less frequently for the remainder of the experiment
(Figure 3.2). Sand with silt and clay samples had the highest NOI, yielding persulfate reductions of 22.7
and 23.4%. Reactors with very fine sand, and very fine sand with silt had persulfate degradations of
14.4% and 15.1%, respectively. The control sample, which contained persulfate and Milli-Q water, saw a
0.04% overall decrease in persulfate concentration over the experimental period. The decomposition of
persulfate appeared to follow a first-order mass action law for all aquifer materials (r2 > 0.89) (Appendix
D, Figure D.2). The average reaction rate coefficient for the sediments was 1.4x10⁻⁵
hr-1
with a range of
2x10⁻⁵
to 7x 10⁻⁶
hr-1
.
3.4 Aqueous Treatability Studies
3.4.1 Unactivated Persulfate
Batch experiments were conducted to determine the potential for unactivated persulfate to oxidize the
contaminants of concern (COC) as defined in Section 1.4. Groundwater from MW-20, preserved with
sodium azide, was used. MW-20 was chosen since it is directly downgradient from a known MGP
residual source and has exhibited high COC concentrations.
Glass reactors (40 mL) were labeled and weighed prior to the commencement of the experiment. A
groundwater sample volume of 36 mL was added to each reactor, followed by 2 mL of a 20 g/L stock
persulfate (Na2S2O8, ACS; Aldrich, Milwaukee) solution. The reactors were then capped with a Teflon
60
lined cap and re-weighed. A dose of 20 g/L was chosen based on successful BTEX and PAH
decomposition shown by Sra et al. (2012).
Experimental and persulfate control samples were prepared for each temporal sample interval and initial
concentration measurements were taken at time zero. The samples were placed in the dark at room
temperature (~20 °C) to prevent persulfate photo-degradation. Upon analysis, samples were removed and
reweighed to ensure no loss in the reactor. Persulfate concentrations were measured following Huang et
al. (2002). Measurements of BTEX and PAH compounds were performed by solvent extraction with
methylene chloride followed by gas chromatography. A detailed description of the method can be found
in Freitas and Barker (2008). Measurements were taken daily for the first three days, and at longer
intervals for the remainder of the experiment (total of 14 days). Reactors were prepared and analyzed in
triplicate.
Results from the control reactors indicate that the concentration of BTEX and PAH compounds
remained constant over the 14-day experimental period (Appendix D, Figure D.5). Results from the
treatment reactors show concentration reductions of all the COC (Figure 3.3) (See Appendix D, Figure
D.4 for all compounds). Benzene, ethylbenzene, and acenapthalene were quickly oxidized to below
method detection limit (MDL) (MDL values located in Table 3.3) by Day 7. Naphthalene (and other
PAHs), 1-methylnapthalene and 2-methylnapthalene however had concentrations above MDL at Day 14.
After 14 days all the COC had reached a concentration below 10% of their initial concentration. Persulfate
concentration varied little over the 14-day experimental period (Appendix D, Figure D.3).
Oxidation kinetics remained fairly constant for all COC except for acenapthalene which appeared faster
at earlier times (t < 3 days) and more slowly. Reaction rate coefficients (kobs) were calculated using the
pseudo first-order rate law. A pseudo first-order rate law was used since persulfate concentration
remained relatively constant over the experimental period. A full description of the method is given in
Sra (2010).
The first-order rate law represented the data well for all compounds (r2 > 0.9) (Table 3.2), except for
1,2,3 trimethylbenzene (0.863) and 2-methylnaphthalene (0.875). For the COC, kobs was largest for
ethylbenzene, followed by benzene, 1-methylnapthalene, 2-methylnapthalene, acenaphtalene, and
naphthalene.

61
3.4.2 Iron (II) Activated Persulfate
Site water from MW-20 was also used to determine the potential for iron-activated persulfate to oxidize
the COC. It was expected that the addition of iron in the reactor would significantly increase degradation
rates of the COC as observed in Crimi and Taylor, 2007 and Sra et al., 2010. Two series of batch
experiments were performed, one with a high (600 mg-Fe(II)/L) iron concentration, and one with a low
iron concentration (150 mg-Fe(II)/L). These concentrations were chosen since they correspond with the
lower and upper bounds of iron dosages typically used (Block, 2008).
Glass reactors (40 mL) were prepared as described for the unactivated persulfate experiment (Section
3.4.1); however, a 1:1 mole ratio of iron (FeSO4·7H2O) (ACS; J.T.Baker, Phillipsbourg, NJ) and citric
acid (C6H8O7) (Fischer; Fair Lawns, NJ) were added to the reactors. Citric acid (CA) was added as a
chelating agent. Samples were collected and analyzed in duplicate every 3 hours for the first 9 hours and
then daily for a total of 14 days.
The presence of iron accelerated the rate of reaction for both low and high iron concentrations explored
(Table 3.4). This increase is a result of the generation of the sulfate free radical (SO4-) through a one
electron transfer process. This process increases the activation potential of persulfate from 2.1 V to 2.6 V
(Siegrist et al. 2011). Except for naphthalene, all COC reached MDL by 96 hours. Degradation rates of
COCs in the high iron system (Figure 3.4(b)) were faster than in the low iron system (Figure 3.4(a)) (see
Appendix D, Figures D.6 (low) and D.8 (high) for other compounds). Persulfate decomposition occurred
in the reactors for the low iron series (Appendix D, Figure D.10). An average concentration reduction of
17% was observed.
For the low iron case, kobs was calculated using a pseudo first-order rate law outlined in Sra (2010). The
persulfate degradation observed was minimal enough to assume that persulfate was still in excess within
the system, making the pseudo first-order assumption valid. The first-order rate law represented the data
well for all compounds (r2 > 0.9) (Table 4.5). For the COC, the kobs was largest for 2-methylnapthalene
followed by 1-methylnapthalene, ethylbenzene , acenaphthene, benzene, and naphthalene.
For the high iron series, persulfate was not in excess for the duration of the experiment (Appendix D,
Figure D.10). By the end of the 14-day experiment, persulfate consumption reached 78%. As a result, the
assumptions undertaken to utilize a pseudo first-order rate equation are not valid. In order to calculate a
reaction rate coefficient, the differential method of analysis was used (Levenspiel, 1998). This method
62
evaluates all terms in the differential rate equation (Equation 3.2) and tests the goodness of fit of the
equation with the experimental data (Appendix D, Table D.2 and Figure D.11).
(3.2)
Where dCA/dt is the change in concentration (mol/L-s), k is the reaction rate coefficient (Ln/mol
n-sec), and
CA is the concentration of compound A at time t (mol/L). The generated rate equations represented the
data sufficiently for all compounds (r2 > 0.901) (Table 3.5).
Compound reductions were faster in the Fe(II)-600 experiment compared to the Fe(II)-150 experiment.
However, the Fe(II)-600 experiment showed limited persulfate persistence and resulted in ~60% less
persulfate in the system at the end of the experiment compared to the low iron experiment (Appendix D,
Figure D.10). Complete oxidation of 600 mg/L of Fe (II) requires 1.28 g/L of persulfate (Sra, 2010). At
the end of both series of experiments, the final concentration was greater than 1.28 g/L meaning a 600
mg-Fe(II)/L activation scheme would be more effective in reducing aqueous COC concentrations than a
low iron scheme.
Results from this experiment agree with other aqueous treatability studies that have been conducted
with iron activated persulfate schemes. Almost instantaneous degradation of BTEX compounds has been
observed (Liang, 2008; Sra, 2010) PAH removal below MDL levels has been shown (Nadim, 2005;
Ferrasse, 2008).
3.5 Column Experiments
Two series of column experiments were performed to investigate the ability of persulfate to treat MGP
impacted sediments. The goal of these experiments was to help to design full-scale treatment approaches
and develop realistic treatment goals. To achieve this, the experiments were designed (Appendix E, Table
E.4) to mimic in situ conditions such as velocity and porosity as well as aspects of potential pilot-scale
treatment variables such as persulfate injection rates, frequency, doses, and reaction times. The columns
were packed with MGP impacted sediment taken and the pumping rate into the columns was equivalent to
the estimated groundwater flow rate determined from transducer measurements.
For the first series of column experiments, multiple doses of unactivated persulfate were administered,
followed by two doses of alkaline activated persulfate. Unactivated persulfate was initially used to
determine its potential for remediation of impacted sediments as an unactivated scheme would be easier to
63
design and is more cost effective. Further doses using alkaline-activated persulfate were conducted for
contrast since it is known to be the most effective persulfate activation method (Siegrist et al., 2011).
For the second series of column experiments, doses of 600 mg-Fe(II)/L activated persulfate with a
citric acid chelate (600 mg/L) were used. The results from the aqueous treatability experiments indicated
that 600 mg-Fe(II)/L was more effective in reducing COC than unactivated persulfate and persulfate
activated with 150 mg-Fe(II)/L. Effluent concentrations of BTEX and PAHs were measured following a
4-day reaction period to determine reduction in dissolved effluent concentrations. Initial and final
concentrations of the column sediments were also compared to assess mass removal.
3.5.1 Materials and Methods
MGP impacted sediments collected from DPT-23 (10-12 and 20 ft bgs) were homogenized and packed
into two series of four short PVC columns (diameter 3.81 cm, length 10 cm). This sample was selected
since it contained MGP residual in shallow and deep zones and was the impacts of contamination were
previously quantified (Chapter 2). Three columns in each series were treatment columns and one column
was a control. The bottom of each column was filled with glass beads (Potter Industries Ltd.) of 0.59 to
0.84 mm in diameter, followed by a thin layer of glass wool (Pyrex, VWR) and a wire mesh of 0.178 mm
aperture size. The next 10 cm of the column was packed with impacted sediments, followed by another
layer of wire, glass beads, and wool (photos in Appendix G, Figures G.6 to G.11). Packing was conducted
in 1 cm lifts and 5 mg samples from the bottom, middle and top lifts were taken for baseline BTEX and
PAH analyses (Appendix G, Figure G.7).
The experimental set-up (Figure 3.5) consisted of an open system where a reservoir was connected with
1.42 mm I.D. tubing (Masterflex) to a peristaltic pump (Cole-Parmer Instrument Co.) that forced the
flushing solution upwards through the column. Solution leaving the column entered a closed sample vial
and then discharged to an effluent tank.
To commence the experiment, the reservoir was filled with Milli-Q water. At a rate of 0.025 mL/min,
the Milli-Q water was flushed through all four columns. Once two pore had passed through the columns
samples were taken from the vials attached to each column to determine the baseline concentrations of
BTEX and PAHs. It was assumed that two pore volumes would provide sufficient time for equilibrium
conditions to be attained (Forsey, 2010). Following the Milli-Q flush, the reservoir was filled with a
prescribed sodium persulfate solution. This persulfate solution was flushed through the three treatment
64
columns, at a flow rate of 0.18 ml/min, and Milli-Q was flushed through the control column at the same
rate. The flow rate was increased during persulfate injections to mimic an injection episode.
An electrical conductivity (EC) (Orion, 5* Plus) meter was installed in-line with one treatment column
and recorded measurements at 30-minute intervals to monitor persulfate solution breakthrough. Once
breakthrough occurred, the pump was turned off. Following a four-day reaction period, which was to
allow for sufficient time for kinetic processes to occur, the reservoir was refilled with Milli-Q water and
the columns were flushed until EC readings indicated that the persulfate solution had exited the system
(approximately two pore volumes).
From the sampling vial attached to each column, duplicate 40-mL samples were taken and analyzed for
selected organic compounds following the method from Thomson et al. (2008). Persulfate concentrations
were also measured following the method by Huang et al. (2002). Additionally, duplicate 10 mL samples
were taken for short-chained alkylphenol (SCAP) analysis. Standard water quality measurements of
temperature, pH, Eh, dissolved oxygen (DO), and EC were also taken at sampling times that occurred
following Milli-Q and persulfate flushes (Appendix E, Tables E.1 and E.2). This sequence was repeated
for the entire experiment.
As stated, when packing the columns, three 5 mg soil samples were taken from the bottom, top and
middle of each column to determine the baseline concentrations for the COC (Table 3.4). The samples
were analyzed for BTEX and PAH concentrations (EPA Methods 8260 and 8270). Following the
experiment, the columns were split open and three 5 mg soil samples were taken from the same locations
for comparison. Sediment samples collected and analyzed prior to packing the columns indicated a
homogenous mixture across and between columns.
Short chained alkylphenols (SCAP) analysis was completed (method from Huling et al. 2011) following
Milli-Q flushes after doses of unactivated persulfate and iron activated persulfate. No samples were
collected or analyses performed on the alkaline activated persulfate flushes, therefore results from these
columns only represent unactivated persulfate treatment. The analyses completed included measurements
of phenol, cresols, dimethyl, ethylphenols, trimethyl, ethyl-methyl and propylphenols concentrations. The
purpose of this work was to determine if BTEX oxidation yielded SCAP by-products.
Series one of the column experiments were treated with unactivated persulfate (Na2S2O8) (ACS;
Aldrich, Milwaukee). On Day 58, these treatments were no longer causing a significant reduction in the
effluent organic compound concentrations. In order to determine if further degradation was possible, two

65
doses of base activated persulfate were administered. A S2O82-
+ NaOH solution was prepared to achieve
a desired pH of 11. The pH of the injection solution was monitored hourly to ensure pH remained
constant. Series two of the treatment columns were flushed with 600 mg-Fe(II)/L (FeSO4·7H2O) (ACS,
J.T.Baker, Phillipsbourg, NJ) activated persulfate. A persulfate stock solution was prepared using 600
mg/L iron concentration and 600 mg/L citric acid chelate (C6H8O7, Fischer, Fair Lawns, NJ).
3.5.2 Unactivated Column Results
For the unactivated column experiment, a total of nine treatment episodes (7 unactivated persulfate, 2 base
activated persulfate) were conducted over 75 days. During this time period approximately 20 g of
persulfate was injected into each treatment column. The timeline for the experiment, injection
concentrations, and water quality measurements taken are given in Appendix E (Table E.1). Photos
showing set-up, materials, and packing of the columns are given in Appendix G (Figures G.6 to G.11).
Effluent PAH and BTEX concentrations from the control column showed a decrease between 10 and
40% (Appendix E, Figure E.8). Effluent concentrations of the control column were always higher than
the treatment columns. Additionally, the initial anticipated effluent concentrations based on aqueous
solubility values were always higher than the measured values (Appendix E, Table E.5). This over-
estimation is likely a result of not being able to identify all the compounds in the impacted sediments
(~70% bulk). Of the COCs, benzene was reduced 17% followed by ethylbenzene (21%), naphthalene
(23%), 1-methylnapthalene (33%), and 2-methylnapthalene (45%). Overall, the control column had a
22% loss of MGP soil concentration after flushing with ~1.5 L of water.
Persulfate doses into the column increased over time to promote degradation and to ensure there was
always an excess of persulfate in the system (Figure 3.6). Persulfate concentrations in the effluent never
decreased below 50% of the injection concentrations suggesting that dosage amounts were sufficient to
maintain persulfate presence. Between injection episodes persulfate measurements were less than the
MDL indicating that all the persulfate had been flushed from the system.
Duplicate samples taken from each column were averaged and normalized to the baseline
measurements for all measured compounds. These values were then adjusted for the losses seen in the
control column to estimate losses solely due to persulfate degradation. Persulfate dose, Dose (g
persulfate/g of soil), was calculated using:
∑
(3.3)
66
where PV is the pore volume (L) in the column, Ci (g/L) is the oxidant injection concentrations, and m is
the mass of sediment in the column (g). Dose-response curves were generated for each column, and for
the average of the three treatment columns by plotting the normalized concentration versus dose
(Appendix E, Figures E.6 to E.9). Additionally, a plot of the average over the three columns was plotted
for the COC before the base activated injection and after the base activated injection (Figure 3.7).
After the first injection, the concentrations of all the COC decreased. Each subsequent injection yielded
further reductions in all the compounds until a dose of ~ 50 g/g of soil, at which point no additional
changes in the effluent concentrations of the COC were observed. At this point, no COC were reduced to
below MDL levels; acenaphthalene was the most persistent (68% of initial concentration remaining),
followed by naphthalene, 1-Methylnaphthalene and 2-Methylnaphthalene, ethylbenzene, and benzene
(88% reduction). These results indicate the potential for unactivated persulfate to treat dissolved COC in
situ, and allow for the prediction of full-scale treatability endpoints. However, based on the average
groundwater concentrations measured on site, reductions of this magnitude would not satisfy NADC
guidelines (Table 1.4).
To determine if further reduction in effluent COC concentrations were possible, two base activated
persulfate treatments were administered. Following these injections, effluent concentrations of
acenaphthalene and benzene were reduced to below detection limits. Ethylbenzene was reduced another
15% (98% reduction), followed by 2-methylnaphthalene, 1- Methylnaphthalene and naphthalene (75%).
These results indicate that base-activated persulfate is a more aggressive and effective remediation option
compared with unactivated persulfate in the treatment reducing effluent concentrations of the COC.
Additionally, NADC guidelines were achieved for all compounds except for naphthalene.
Measurements of EC were taken from treatment column 1 during persulfate flushing. Resulting EC
measurements were plotted versus time to generate breakthrough curves (Figure 3.8). The gradual slope
of the curve shows that mixing processes are present and plug-flow through the column is not occurring.
Comparing the initial and final breakthrough curves (Appendix E, Figure E.10) show that dispersion
within the column increases over time since breakthrough occurs at later times. The longitudinal diffusion
coefficient was calculated from the average results. It was estimated to be 1.03 x10⁻⁷
m2/sec (±1.2x10
-7
m2/sec) using the method outlined in Levenspiel (1998). This value is comparable to typical values of a
fine sand aquifer (Batu, 2006). Persulfate breakthrough was estimated based on the time for 50% change
in EC reading to occur. Therefore, the time at which the normalized EC measurement of 0.50 occurred
67
was used to back calculate a value for the column porosity (Appendix E, Table E.3). A porosity of 0.33
was calculated, which is similar to the porosity estimated from permeameter analyses (0.34).
Phenol measurements taken after Milli-Q flushes indicated indirect relationships between SCAP and
BTEX compounds. Decreasing benzene concentration in the effluent was correlated with an increase in
effluent phenol concentrations. Once benzene concentrations reached < MDL, phenol concentrations
decreased (Figure 3.9(a)). Concentrations measured from the effluent in the control columns remained at
or below baseline concentrations. Similar relationships were shown for ethylbenzene and ethylphenol
(Figure 3.9(b)), toluene and creosol (Figure 3.9(c)), and xylene and dimethylphenol (Figure 3.9(d))
(Thomas-Arrigo, 2012). SCAP concentrations were shown to increase at the 20g/kg dose and after
additional doses concentrations subsided. All these by-products have been shown to be harmful and some
of these by-products are more toxic than the parent phenol compound (e.g. o-creosol and p-creosol)
(HSBD, 1985). Therefore, sufficient dosing of unactivated persulfate is required to eliminate the threat of
phenol compounds.
Soil samples from the bottom, middle and top of the treatment and control columns were compared to
the initial soil samples that were taken when the columns were packed (Table 3.4). Raw data are given in
Appendix F (Table F.11). Results from the control column were also compared to the results from the
treatment columns. Initial soil concentrations showed little variation with depth (less than 3% difference
between top and bottom of column). Therefore, the column experiment was constructed such that,
initially, the column had a homogenous soil concentration. Final soil concentration measurements
indicate that more of the NAPL had degraded near the at the top of the column (10% difference between
top and bottom).
Results show that approximately 400 mg of mass was removed from the control column. On average,
reductions in the control column were higher for BTEX compounds than PAH compounds. This outcome
was expected since BTEX compounds are more soluble. Even in the control, benzene, Indeno[1,2,3-c,d]
Pyrene + Dibenz [a,h] Anthracene, and Benzo [g,h,i] Perylene, were reduced 100%, indicating that
flushing alone is sufficient to remove these contaminants. Similar reductions (less than 2% difference)
were seen in the control and treatment columns for naphthalene, dibenzofuran, biphenyl, phenanthrene,
fluoranthene, and pyrene, indicating that persulfate was not assisting in the removal of these compounds.
Results from the treatment columns showed a reduction in soil concentration of 526 mg (23% more
removal than observed in the control column). Therefore, it can be concluded that persulfate assisted with

68
the removal of NAPL from the soil. Also, indole, acenapthalene and anthracene were shown to be
oxidized by persulfate in all treatment columns (18%, 18%, and 19% more reduction in treatment columns
compared to control columns, respectively). However, results indicate that persulfate did not significantly
assist in the removal of BTEX compounds (42% removal in treatment columns compared with 40%
removal in the control column). All other compounds showed reductions of less than 5% compared to the
control column.
NAPL soil saturation was estimated before and after treatment using
(3.4)
where Cs the average measured concentration for compound k (Table 2.2), ρb is the soil density, Cn is the
measured concentration of contaminant k in the NAPL (Table 2.7), ϕ is the porosity in the column
calculated from persulfate breakthrough curves (Appendix E, Table E.3), and ρn is the density of the
NAPL (assumed to be 1083 kg/m3). This value was taken from the low-end of the range of coal tar
densities examined by Lee et al. (1992). The low-end value was taken since LNAPL and DNAPL exist at
the Clearwater site. Soil saturation was calculated to be approximately 4.0% before treatment, and 3.7%
after treatment (Table 3.5). The saturation level in the control column was 3.8% at the end of the
experiment. The ~0.2% change in saturation levels is attributed to reductions in the PAH compounds.
Reductions in higher soluble compounds (BTEX and trimethylbenzenes) were similar in treatment and
control columns.
3.5.3 Iron Activated Persulfate Results
For the iron activated persulfate column series, a total of seven treatment episodes were conducted over
60 days. During this time period approximately 15 g of iron activated persulfate solution was flushed
through each treatment column. The timeline for the experiment, injection concentrations, and water
quality measurements taken can be found in Appendix E (Table E.2).
Persulfate doses were increased over time to promote degradation of the contaminants and to ensure
there was always an excess of persulfate in the system (Figure 3.6). Effluent persulfate concentrations
never decreased below 10% of the injection concentrations. It is believed that the effluent concentrations
were lower than the unactivated persulfate experiment due to scavenging of sulfate radicals by the iron.
Sn
Csk b
k1
n
Cnk
k1
n
n
69
Between injection episodes persulfate measurements were below detection limits indicating that all the
persulfate had been removed from the system.
Duplicate samples taken from each column were averaged and to the baseline measurements for all
measured compounds. These values were then adjusted for the losses seen in the control column to
determine losses solely due to persulfate degradation. An average dose-response curve was created for
the effluent COC across the three columns (Figure 3.9). Plots for each column including the control are
located in Appendix E (Figures E.1 to E.5).
After the first injection, the concentrations of all the COCs decreased. Each subsequent injection
yielded further reductions in all the compounds. Upon completion of the experiment, no concentration
was reduced 100%. Acenaphthalene was most persistent with approximately 50% of initial concentration
remaining, followed by naphthalene, 1-Methylnaphthalene and 2-Methylnaphthalene, ethylbenzene,
benzene, which was least persistent with approximately 98% reduction inside the column. Similar to the
unactivated columns, benzene and acenaphtalene were the only two COC reduced to below MDL levels.
Samples were taken following Milli-Q flushes and analyzed for SCAP concentrations. Unlike the
unactivated persulfate treatment columns, SCAP effluent concentrations decreased after each persulfate
dose (Figure 3.12). It was argued that iron-activated persulfate is more efficient in the destruction of coal
tar and no phenol by-products are produced (Thomas-Arrigo, 2012). This conclusion agrees with the
results from the effluent organic concentrations. On average, following a total dose of 20 g/g, BTEX
concentrations were less than 20% of their original concentrations in the effluent of the iron activated
treatment columns. However, after this dose, average BTEX effluent concentrations in the unactivated
persulfate treatment columns were less than 40% of original concentrations. For these reasons, iron
activated persulfate would be more beneficial for a full-scale treatment than unactivated persulfate.
Following all dosing episodes, soil samples were taken from the bottom, middle and top of the control
and treatment columns and analyzed for BTEX and PAH concentrations (Table 3.6). Raw data are located
in Appendix F (Table F.11). Approximately 400g of NAPL was removed in the control column. Similarly
to the unactivated column experiment, reductions in the control column were highest for BTEX
compounds (>25%) and 100% reduction was seen in benzene, indeno[1,2,3-c,d] pyrene + dibenz [a,h]
anthracene, and benzo [g,h,i] perylene. Reductions with less than 2% difference were seen between
control and treatment columns for 1-methylnaphthalene, biphenyl, acenaphthylene and chrysene
indicating that iron-activated persulfate did not assisting in the removal of these compounds in the NAPL.
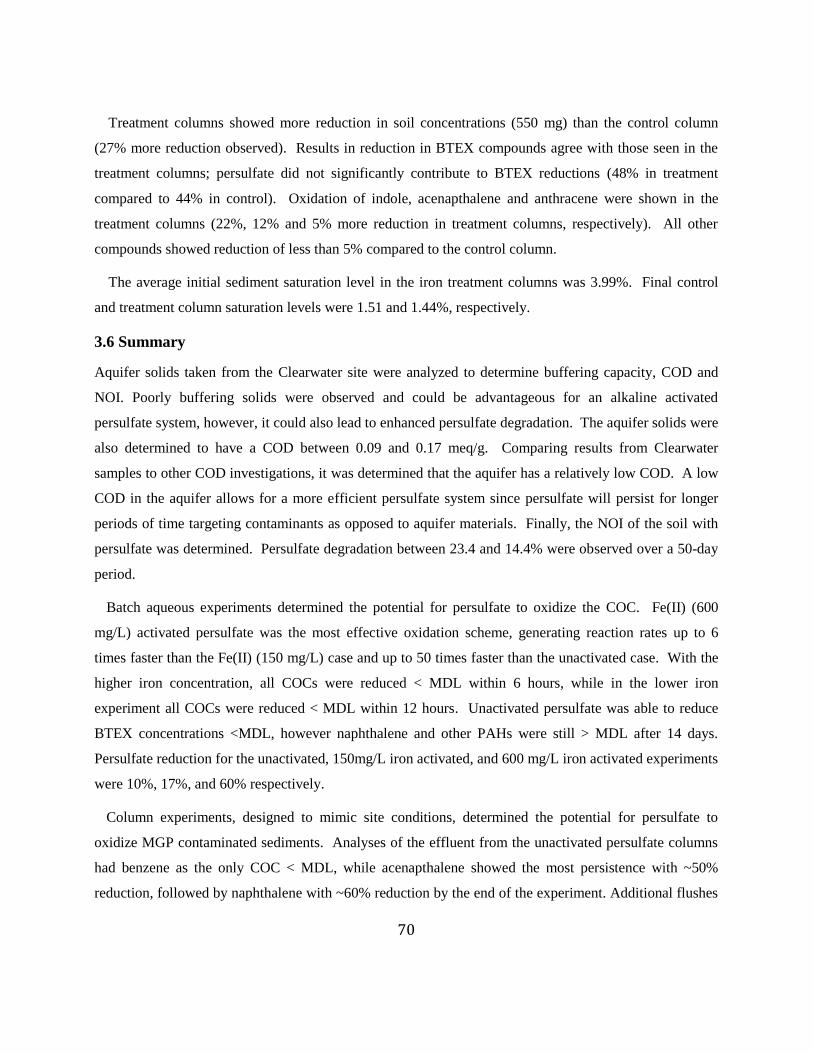
70
Treatment columns showed more reduction in soil concentrations (550 mg) than the control column
(27% more reduction observed). Results in reduction in BTEX compounds agree with those seen in the
treatment columns; persulfate did not significantly contribute to BTEX reductions (48% in treatment
compared to 44% in control). Oxidation of indole, acenapthalene and anthracene were shown in the
treatment columns (22%, 12% and 5% more reduction in treatment columns, respectively). All other
compounds showed reduction of less than 5% compared to the control column.
The average initial sediment saturation level in the iron treatment columns was 3.99%. Final control
and treatment column saturation levels were 1.51 and 1.44%, respectively.
3.6 Summary
Aquifer solids taken from the Clearwater site were analyzed to determine buffering capacity, COD and
NOI. Poorly buffering solids were observed and could be advantageous for an alkaline activated
persulfate system, however, it could also lead to enhanced persulfate degradation. The aquifer solids were
also determined to have a COD between 0.09 and 0.17 meq/g. Comparing results from Clearwater
samples to other COD investigations, it was determined that the aquifer has a relatively low COD. A low
COD in the aquifer allows for a more efficient persulfate system since persulfate will persist for longer
periods of time targeting contaminants as opposed to aquifer materials. Finally, the NOI of the soil with
persulfate was determined. Persulfate degradation between 23.4 and 14.4% were observed over a 50-day
period.
Batch aqueous experiments determined the potential for persulfate to oxidize the COC. Fe(II) (600
mg/L) activated persulfate was the most effective oxidation scheme, generating reaction rates up to 6
times faster than the Fe(II) (150 mg/L) case and up to 50 times faster than the unactivated case. With the
higher iron concentration, all COCs were reduced < MDL within 6 hours, while in the lower iron
experiment all COCs were reduced < MDL within 12 hours. Unactivated persulfate was able to reduce
BTEX concentrations <MDL, however naphthalene and other PAHs were still > MDL after 14 days.
Persulfate reduction for the unactivated, 150mg/L iron activated, and 600 mg/L iron activated experiments
were 10%, 17%, and 60% respectively.
Column experiments, designed to mimic site conditions, determined the potential for persulfate to
oxidize MGP contaminated sediments. Analyses of the effluent from the unactivated persulfate columns
had benzene as the only COC < MDL, while acenapthalene showed the most persistence with ~50%
reduction, followed by naphthalene with ~60% reduction by the end of the experiment. Additional flushes

71
with alkaline activated persulfate reduced ethylbenzene and acenapthalene concentrations to < MDL, and
naphthalene concentrations by an additional 20%. Soil samples taken after the experiment showed 23%
more removal in compounds than in the control column. Analyses of the effluent from the iron activated
persulfate columns measured benzene and ethylbenzene < MDL, while naphthalene was the most
persistent with 65% degradation. Soil samples from these columns taken at the conclusion of the
experiment showed 27% more reduction in compounds then the control column. Results from the
sediment analyses indicate the inability for persulfate to enhance the removal of source zone
concentrations of: biphenyl in both explored persulfate systems; naphthalene, dibenzofuran, phenanthrene,
fluoranthene, and pyrene in alkaline activated persulfate systems; and 1-methylnaphthalene,
acenaphthylene and chrysene in iron activated persulfate systems. Finally, the results from the column
experiments indicate that persulfate was not essential for removal of benzene compounds from the
sediment.

72
a)
a)
b)
b)
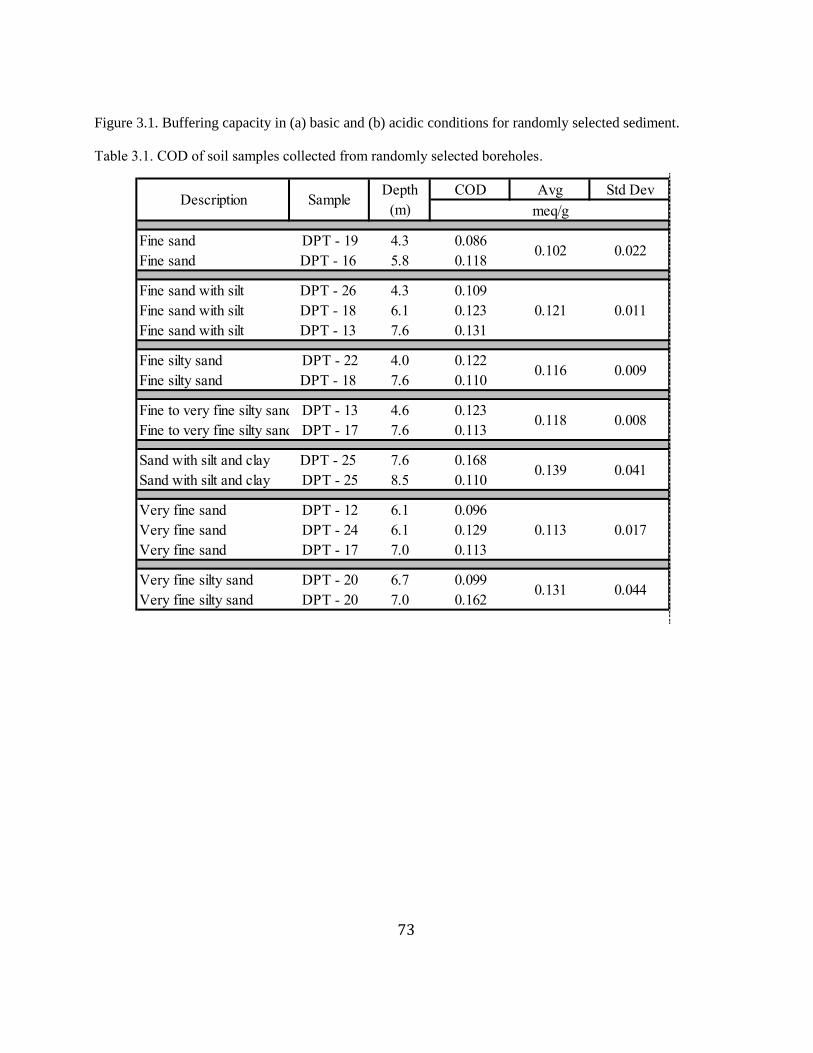
73
Figure 3.1. Buffering capacity in (a) basic and (b) acidic conditions for randomly selected sediment.
Table 3.1. COD of soil samples collected from randomly selected boreholes.
COD Avg Std Dev
Fine sand DPT - 19 4.3 0.086
Fine sand DPT - 16 5.8 0.118
Fine sand with silt DPT - 26 4.3 0.109
Fine sand with silt DPT - 18 6.1 0.123
Fine sand with silt DPT - 13 7.6 0.131
Fine silty sand DPT - 22 4.0 0.122
Fine silty sand DPT - 18 7.6 0.110
Fine to very fine silty sand DPT - 13 4.6 0.123
Fine to very fine silty sand DPT - 17 7.6 0.113
Sand with silt and clay DPT - 25 7.6 0.168
Sand with silt and clay DPT - 25 8.5 0.110
Very fine sand DPT - 12 6.1 0.096
Very fine sand DPT - 24 6.1 0.129
Very fine sand DPT - 17 7.0 0.113
Very fine silty sand DPT - 20 6.7 0.099
Very fine silty sand DPT - 20 7.0 0.162
Description SampleDepth
(m) meq/g
0.017
0.131 0.044
0.118
0.139
0.008
0.041
0.113
0.102 0.022
0.121 0.011
0.116 0.009
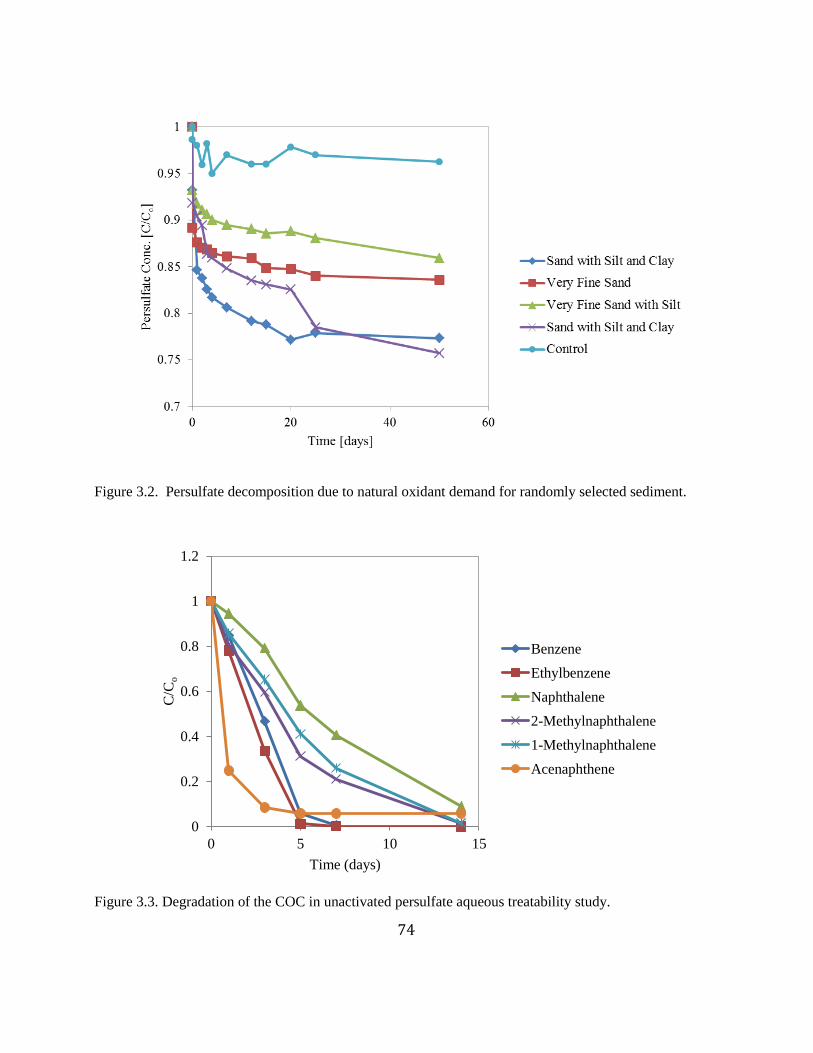
74
Figure 3.2. Persulfate decomposition due to natural oxidant demand for randomly selected sediment.
Figure 3.3. Degradation of the COC in unactivated persulfate aqueous treatability study.
0
0.2
0.4
0.6
0.8
1
1.2
0 5 10 15
C/C
o
Time (days)
Benzene
Ethylbenzene
Naphthalene
2-Methylnaphthalene
1-Methylnaphthalene
Acenaphthene
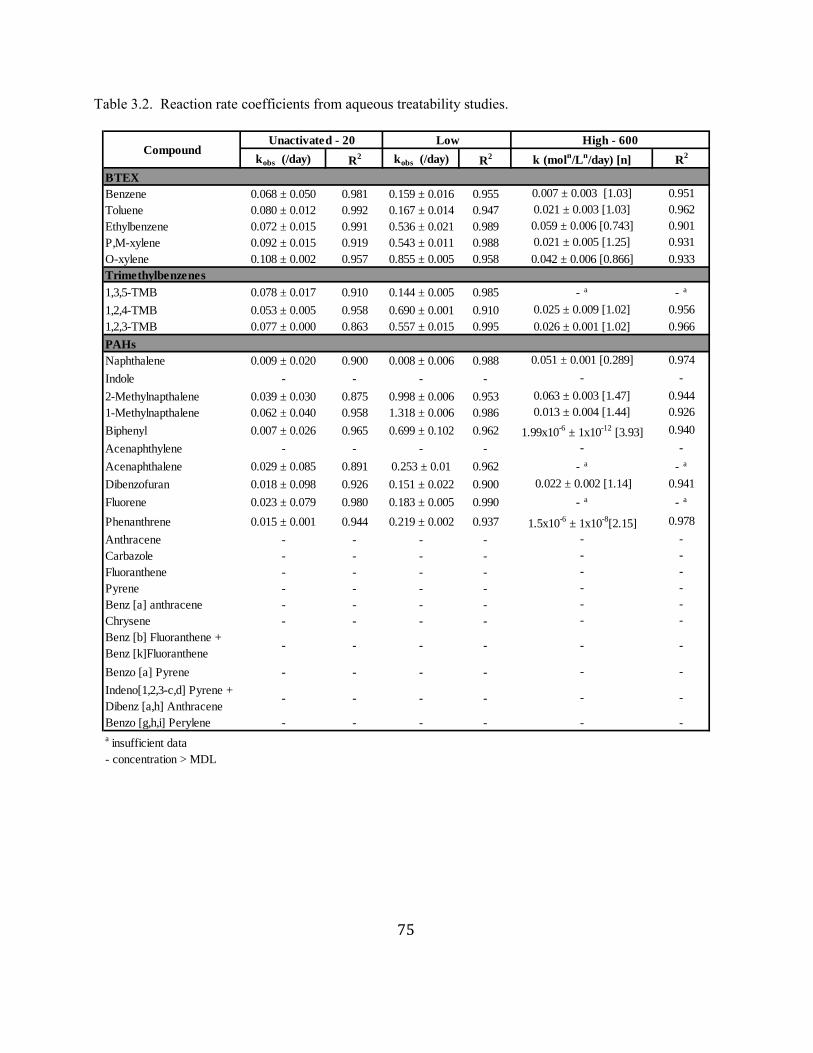
75
Table 3.2. Reaction rate coefficients from aqueous treatability studies.
kobs (/day) R2 kobs (/day) R
2
BTEX
Benzene 0.068 ± 0.050 0.981 0.159 ± 0.016 0.955
Toluene 0.080 ± 0.012 0.992 0.167 ± 0.014 0.947
Ethylbenzene 0.072 ± 0.015 0.991 0.536 ± 0.021 0.989
P,M-xylene 0.092 ± 0.015 0.919 0.543 ± 0.011 0.988
O-xylene 0.108 ± 0.002 0.957 0.855 ± 0.005 0.958
Trimethylbenzenes
1,3,5-TMB 0.078 ± 0.017 0.910 0.144 ± 0.005 0.985 - a - a
1,2,4-TMB 0.053 ± 0.005 0.958 0.690 ± 0.001 0.910
1,2,3-TMB 0.077 ± 0.000 0.863 0.557 ± 0.015 0.995
PAHs
Naphthalene 0.009 ± 0.020 0.900 0.008 ± 0.006 0.988
Indole - - - -
2-Methylnapthalene 0.039 ± 0.030 0.875 0.998 ± 0.006 0.953
1-Methylnapthalene 0.062 ± 0.040 0.958 1.318 ± 0.006 0.986
Biphenyl 0.007 ± 0.026 0.965 0.699 ± 0.102 0.962
Acenaphthylene - - - -
Acenaphthalene 0.029 ± 0.085 0.891 0.253 ± 0.01 0.962 - a - a
Dibenzofuran 0.018 ± 0.098 0.926 0.151 ± 0.022 0.900
Fluorene 0.023 ± 0.079 0.980 0.183 ± 0.005 0.990 - a - a
Phenanthrene 0.015 ± 0.001 0.944 0.219 ± 0.002 0.937
Anthracene - - - -
Carbazole - - - -
Fluoranthene - - - -
Pyrene - - - -
Benz [a] anthracene - - - -
Chrysene - - - -
Benz [b] Fluoranthene +
Benz [k]Fluoranthene- - - -
Benzo [a] Pyrene - - - -
Indeno[1,2,3-c,d] Pyrene +
Dibenz [a,h] Anthracene- - - -
Benzo [g,h,i] Perylene - - - -
a insufficient data
- concentration > MDL
CompoundUnactivated - 20 Low High - 600
k (moln/L
n/day) [n] R
2
0.007 ± 0.003 [1.03] 0.951
0.021 ± 0.003 [1.03] 0.962
0.059 ± 0.006 [0.743] 0.901
0.021 ± 0.005 [1.25] 0.931
0.042 ± 0.006 [0.866] 0.933
0.025 ± 0.009 [1.02] 0.956
0.026 ± 0.001 [1.02] 0.966
0.051 ± 0.001 [0.289] 0.974
- -
0.063 ± 0.003 [1.47] 0.944
0.013 ± 0.004 [1.44] 0.926
1.99x10⁻⁶
± 1x10-12
[3.93] 0.940
- -
0.022 ± 0.002 [1.14] 0.941
1.5x10⁻⁶
± 1x10⁻⁸
[2.15] 0.978
- -
- -
- -
- -
- -
- -
- -
- -
- -
- -
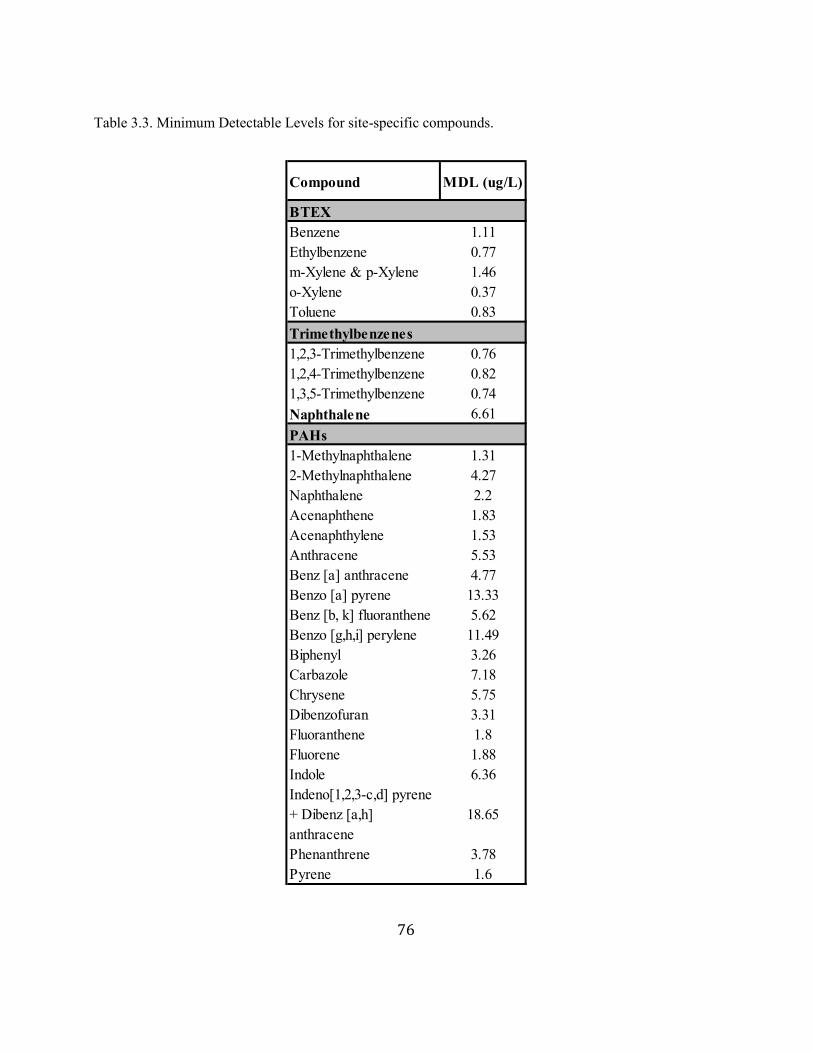
76
Table 3.3. Minimum Detectable Levels for site-specific compounds.
Compound MDL (ug/L)
BTEX
Benzene 1.11
Ethylbenzene 0.77
m-Xylene & p-Xylene 1.46
o-Xylene 0.37
Toluene 0.83
Trimethylbenzenes
1,2,3-Trimethylbenzene 0.76
1,2,4-Trimethylbenzene 0.82
1,3,5-Trimethylbenzene 0.74
Naphthalene 6.61
PAHs
1-Methylnaphthalene 1.31
2-Methylnaphthalene 4.27
Naphthalene 2.2
Acenaphthene 1.83
Acenaphthylene 1.53
Anthracene 5.53
Benz [a] anthracene 4.77
Benzo [a] pyrene 13.33
Benz [b, k] fluoranthene 5.62
Benzo [g,h,i] perylene 11.49
Biphenyl 3.26
Carbazole 7.18
Chrysene 5.75
Dibenzofuran 3.31
Fluoranthene 1.8
Fluorene 1.88
Indole 6.36
Indeno[1,2,3-c,d] pyrene
+ Dibenz [a,h]
anthracene
18.65
Phenanthrene 3.78
Pyrene 1.6
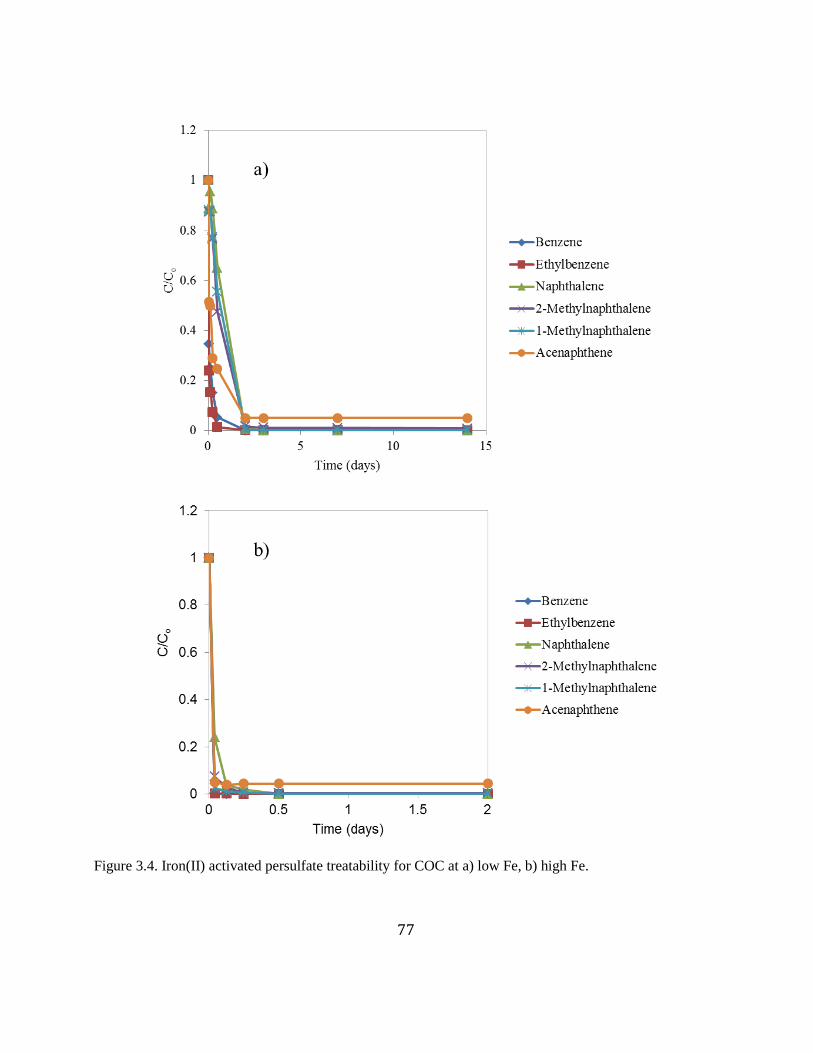
77
Figure 3.4. Iron(II) activated persulfate treatability for COC at a) low Fe, b) high Fe.
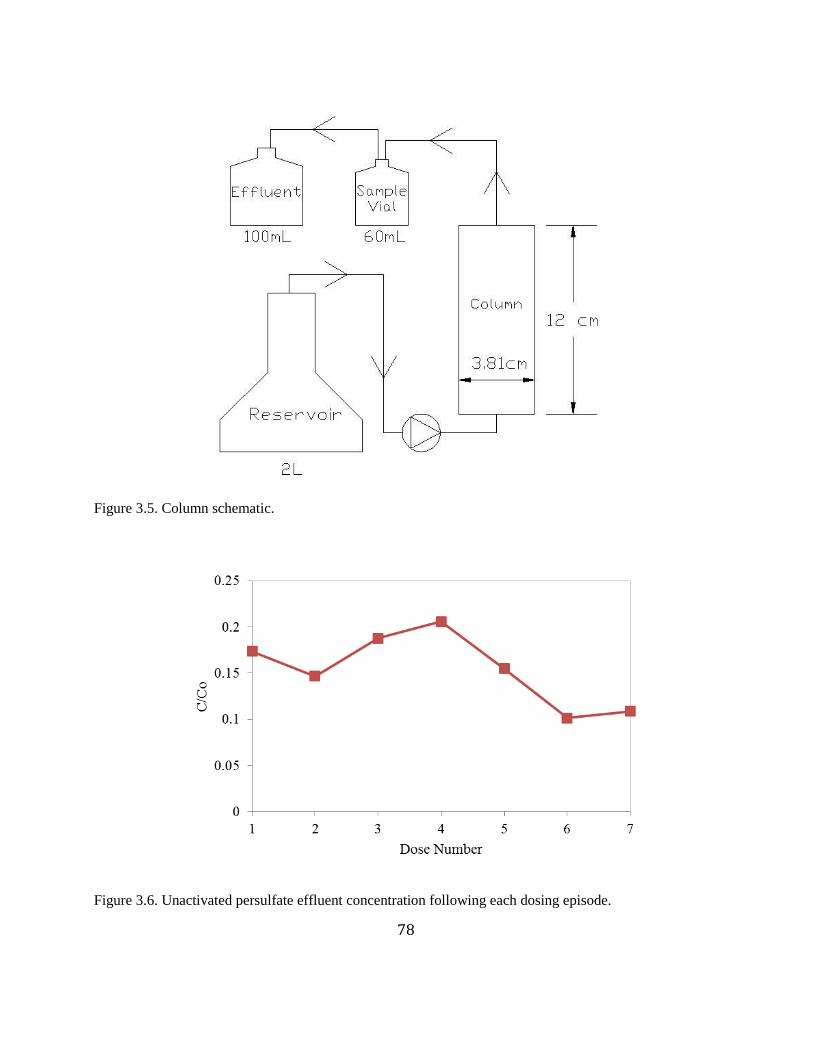
78
Figure 3.5. Column schematic.
Figure 3.6. Unactivated persulfate effluent concentration following each dosing episode.
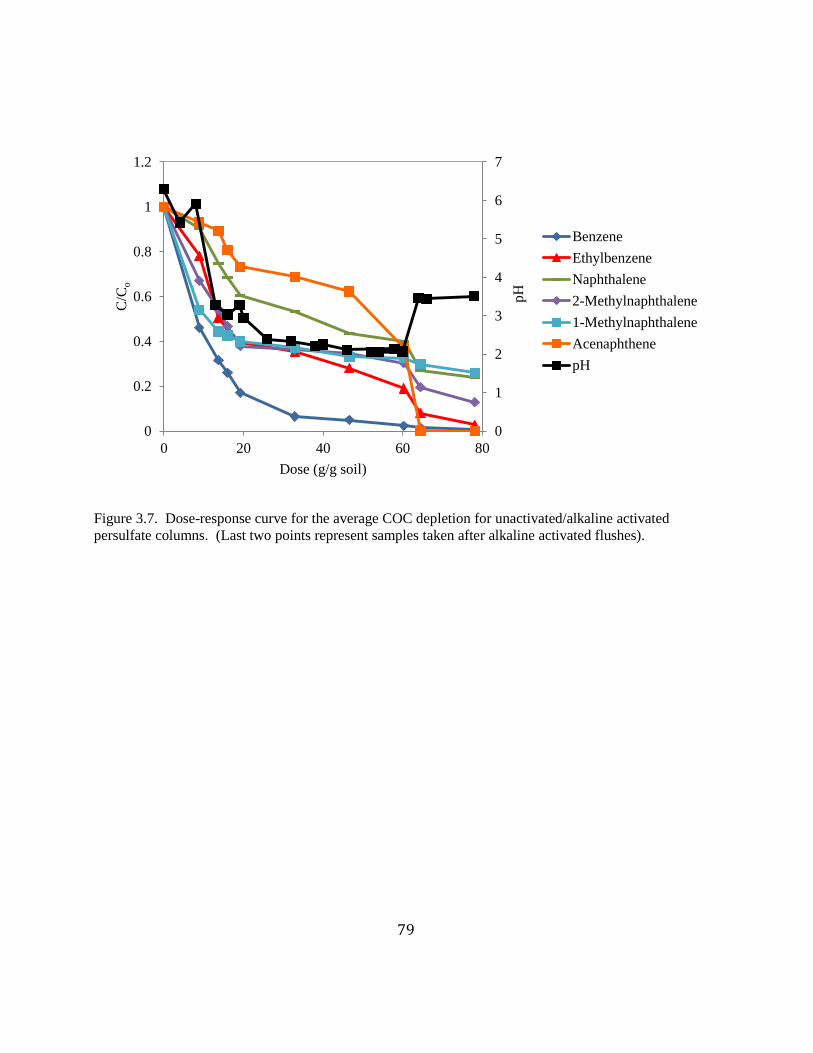
79
Figure 3.7. Dose-response curve for the average COC depletion for unactivated/alkaline activated
persulfate columns. (Last two points represent samples taken after alkaline activated flushes).
0
1
2
3
4
5
6
7
0
0.2
0.4
0.6
0.8
1
1.2
0 20 40 60 80
pH
C/C
o
Dose (g/g soil)
Benzene
Ethylbenzene
Naphthalene
2-Methylnaphthalene
1-Methylnaphthalene
Acenaphthene
pH

80
Figure 3.8. Persulfate breakthrough curves in column #1 for both series of column experiments.
0
0.2
0.4
0.6
0.8
1
1.2
0 0.5 1 1.5 2 2.5 3 3.5 4
Ele
ctri
cal C
on
du
ctiv
ity (
C/C
o)
Pore Volumes
Unactivated/Base Activated
Iron Activated Persulfate
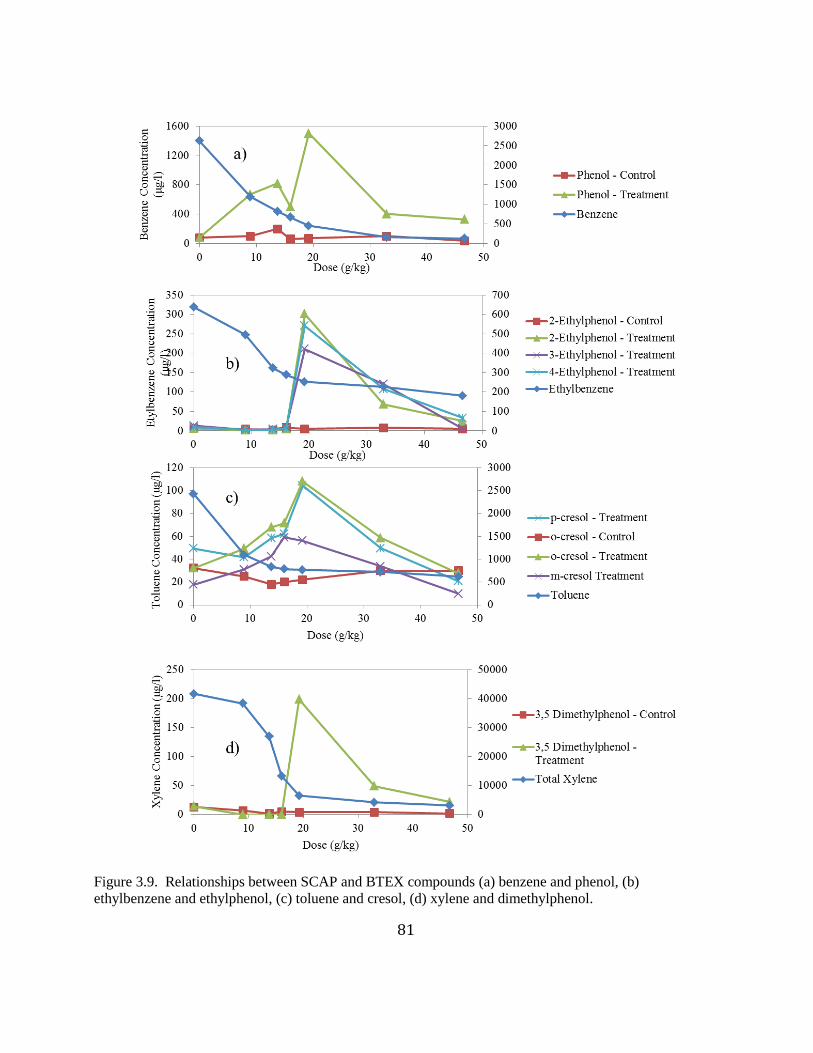
81
Figure 3.9. Relationships between SCAP and BTEX compounds (a) benzene and phenol, (b)
ethylbenzene and ethylphenol, (c) toluene and cresol, (d) xylene and dimethylphenol.
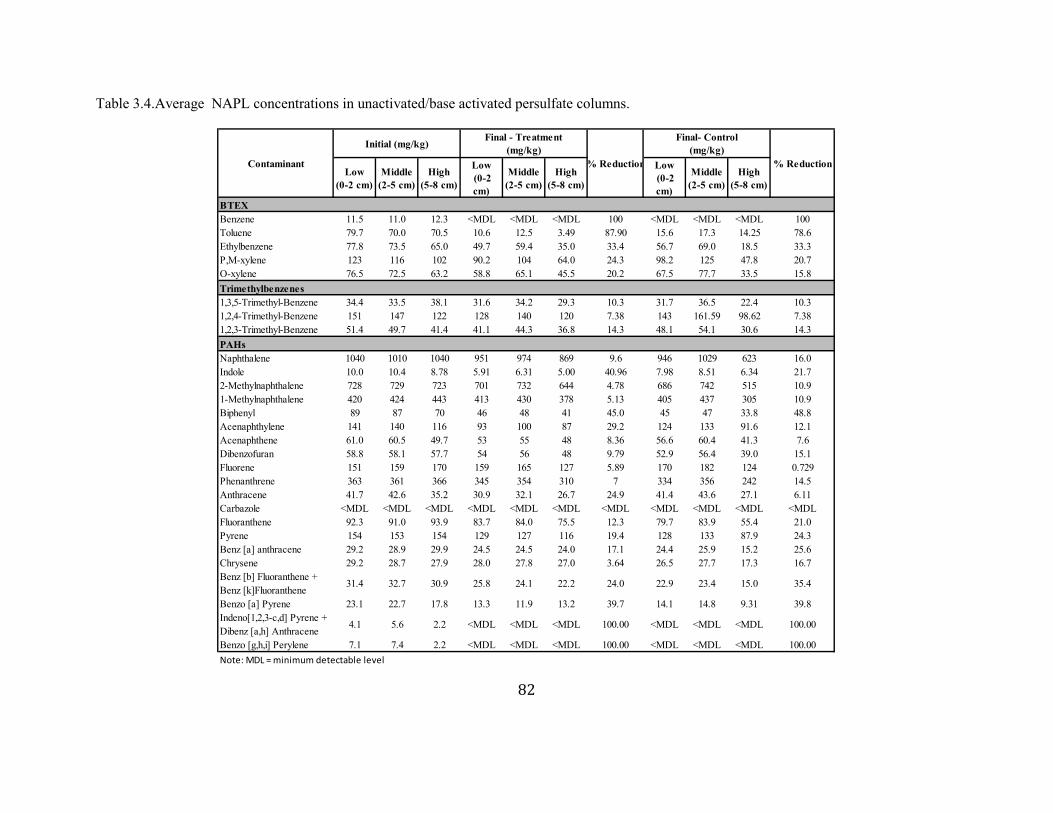
82
Table 3.4.Average NAPL concentrations in unactivated/base activated persulfate columns.
Low
(0-2 cm)
Middle
(2-5 cm)
High
(5-8 cm)
Low
(0-2
cm)
Middle
(2-5 cm)
High
(5-8 cm)
Low
(0-2
cm)
Middle
(2-5 cm)
High
(5-8 cm)
BTEX
Benzene 11.5 11.0 12.3 <MDL <MDL <MDL 100 <MDL <MDL <MDL 100
Toluene 79.7 70.0 70.5 10.6 12.5 3.49 87.90 15.6 17.3 14.25 78.6
Ethylbenzene 77.8 73.5 65.0 49.7 59.4 35.0 33.4 56.7 69.0 18.5 33.3
P,M-xylene 123 116 102 90.2 104 64.0 24.3 98.2 125 47.8 20.7
O-xylene 76.5 72.5 63.2 58.8 65.1 45.5 20.2 67.5 77.7 33.5 15.8
Trimethylbenzenes
1,3,5-Trimethyl-Benzene 34.4 33.5 38.1 31.6 34.2 29.3 10.3 31.7 36.5 22.4 10.3
1,2,4-Trimethyl-Benzene 151 147 122 128 140 120 7.38 143 161.59 98.62 7.38
1,2,3-Trimethyl-Benzene 51.4 49.7 41.4 41.1 44.3 36.8 14.3 48.1 54.1 30.6 14.3
PAHs
Naphthalene 1040 1010 1040 951 974 869 9.6 946 1029 623 16.0
Indole 10.0 10.4 8.78 5.91 6.31 5.00 40.96 7.98 8.51 6.34 21.7
2-Methylnaphthalene 728 729 723 701 732 644 4.78 686 742 515 10.9
1-Methylnaphthalene 420 424 443 413 430 378 5.13 405 437 305 10.9
Biphenyl 89 87 70 46 48 41 45.0 45 47 33.8 48.8
Acenaphthylene 141 140 116 93 100 87 29.2 124 133 91.6 12.1
Acenaphthene 61.0 60.5 49.7 53 55 48 8.36 56.6 60.4 41.3 7.6
Dibenzofuran 58.8 58.1 57.7 54 56 48 9.79 52.9 56.4 39.0 15.1
Fluorene 151 159 170 159 165 127 5.89 170 182 124 0.729
Phenanthrene 363 361 366 345 354 310 7 334 356 242 14.5
Anthracene 41.7 42.6 35.2 30.9 32.1 26.7 24.9 41.4 43.6 27.1 6.11
Carbazole <MDL <MDL <MDL <MDL <MDL <MDL <MDL <MDL <MDL <MDL <MDL
Fluoranthene 92.3 91.0 93.9 83.7 84.0 75.5 12.3 79.7 83.9 55.4 21.0
Pyrene 154 153 154 129 127 116 19.4 128 133 87.9 24.3
Benz [a] anthracene 29.2 28.9 29.9 24.5 24.5 24.0 17.1 24.4 25.9 15.2 25.6
Chrysene 29.2 28.7 27.9 28.0 27.8 27.0 3.64 26.5 27.7 17.3 16.7
Benz [b] Fluoranthene +
Benz [k]Fluoranthene31.4 32.7 30.9 25.8 24.1 22.2 24.0 22.9 23.4 15.0 35.4
Benzo [a] Pyrene 23.1 22.7 17.8 13.3 11.9 13.2 39.7 14.1 14.8 9.31 39.8
Indeno[1,2,3-c,d] Pyrene +
Dibenz [a,h] Anthracene4.1 5.6 2.2 <MDL <MDL <MDL 100.00 <MDL <MDL <MDL 100.00
Benzo [g,h,i] Perylene 7.1 7.4 2.2 <MDL <MDL <MDL 100.00 <MDL <MDL <MDL 100.00
Note: MDL = minimum detectable level
Contaminant
Initial (mg/kg)Final - Treatment
(mg/kg)
% Reduction
Final- Control
(mg/kg)
% Reduction
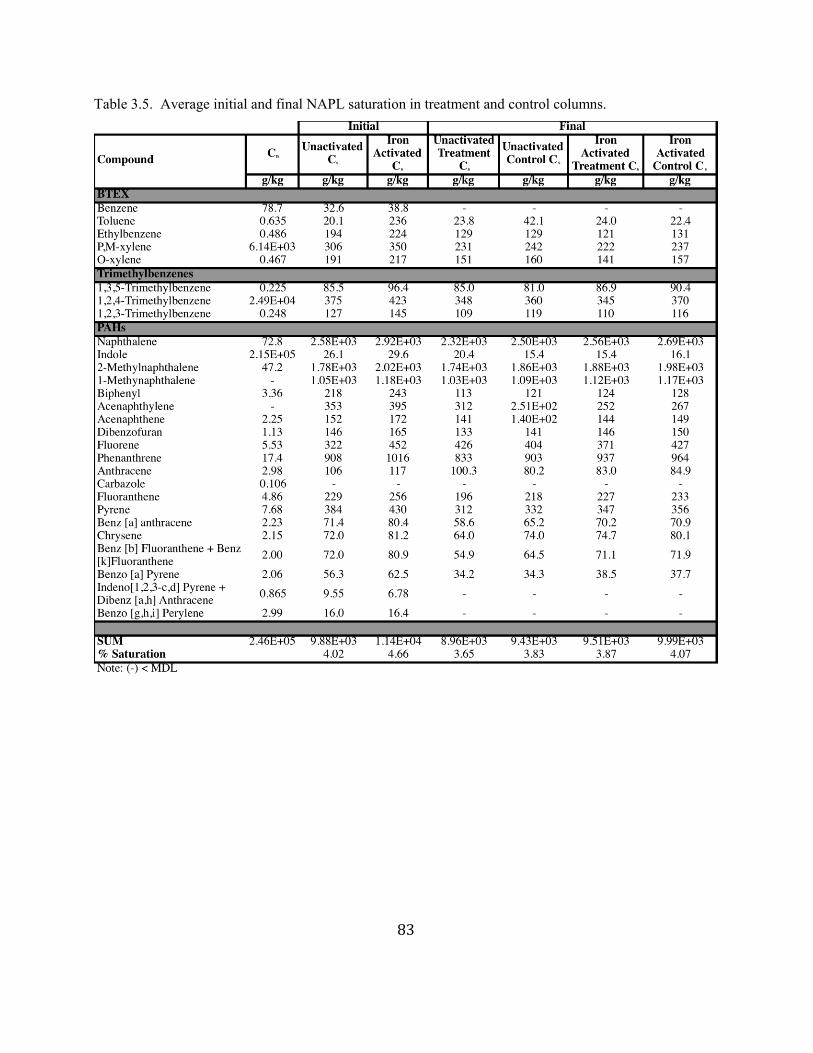
83
Table 3.5. Average initial and final NAPL saturation in treatment and control columns.

84
Figure 3.10. Iron activated persulfate effluent concentration.
Figure 3.11. Average dose-response curves for the average COC depletion in the iron activated persulfate
columns.
0
0.05
0.1
0.15
0.2
0.25
0 10 20 30 40
C/C
o
Dose (g/g)
0
1
2
3
4
5
6
7
8
0
0.2
0.4
0.6
0.8
1
0 10 20 30
pH
C/C
o
Dose (g/g)
Benzene
Ethylbenzene
Naphthalene
2-Methylnaphthalene
1-Methylnaphthalene
Acenaphthene
pH

85
Figure 3.12. SCAP concentrations from iron activated columns.
0
0.2
0.4
0.6
0.8
1
1.2
0 10 20 30
C/C
o
Time (days)
Phenol
Ethylphenol
O-cresol
m-cresol
p-cresol
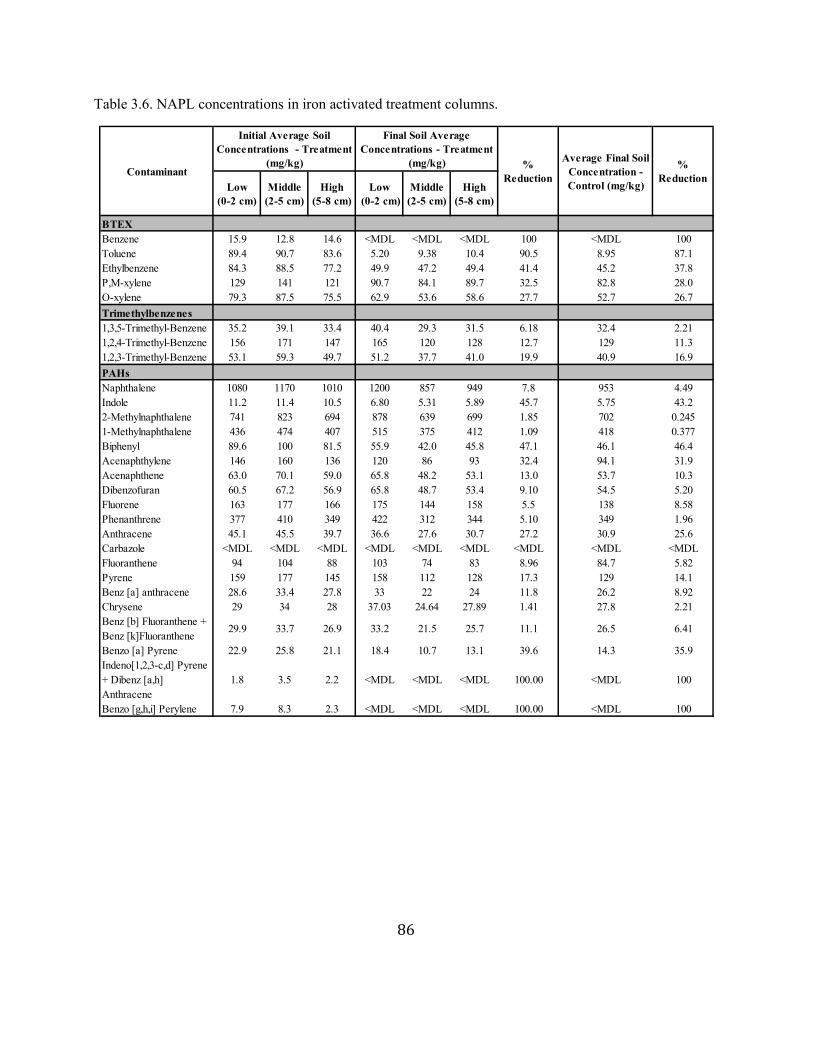
86
Table 3.6. NAPL concentrations in iron activated treatment columns.
Low
(0-2 cm)
Middle
(2-5 cm)
High
(5-8 cm)
Low
(0-2 cm)
Middle
(2-5 cm)
High
(5-8 cm)
BTEX
Benzene 15.9 12.8 14.6 <MDL <MDL <MDL 100 <MDL 100
Toluene 89.4 90.7 83.6 5.20 9.38 10.4 90.5 8.95 87.1
Ethylbenzene 84.3 88.5 77.2 49.9 47.2 49.4 41.4 45.2 37.8
P,M-xylene 129 141 121 90.7 84.1 89.7 32.5 82.8 28.0
O-xylene 79.3 87.5 75.5 62.9 53.6 58.6 27.7 52.7 26.7
Trimethylbenzenes
1,3,5-Trimethyl-Benzene 35.2 39.1 33.4 40.4 29.3 31.5 6.18 32.4 2.21
1,2,4-Trimethyl-Benzene 156 171 147 165 120 128 12.7 129 11.3
1,2,3-Trimethyl-Benzene 53.1 59.3 49.7 51.2 37.7 41.0 19.9 40.9 16.9
PAHs
Naphthalene 1080 1170 1010 1200 857 949 7.8 953 4.49
Indole 11.2 11.4 10.5 6.80 5.31 5.89 45.7 5.75 43.2
2-Methylnaphthalene 741 823 694 878 639 699 1.85 702 0.245
1-Methylnaphthalene 436 474 407 515 375 412 1.09 418 0.377
Biphenyl 89.6 100 81.5 55.9 42.0 45.8 47.1 46.1 46.4
Acenaphthylene 146 160 136 120 86 93 32.4 94.1 31.9
Acenaphthene 63.0 70.1 59.0 65.8 48.2 53.1 13.0 53.7 10.3
Dibenzofuran 60.5 67.2 56.9 65.8 48.7 53.4 9.10 54.5 5.20
Fluorene 163 177 166 175 144 158 5.5 138 8.58
Phenanthrene 377 410 349 422 312 344 5.10 349 1.96
Anthracene 45.1 45.5 39.7 36.6 27.6 30.7 27.2 30.9 25.6
Carbazole <MDL <MDL <MDL <MDL <MDL <MDL <MDL <MDL <MDL
Fluoranthene 94 104 88 103 74 83 8.96 84.7 5.82
Pyrene 159 177 145 158 112 128 17.3 129 14.1
Benz [a] anthracene 28.6 33.4 27.8 33 22 24 11.8 26.2 8.92
Chrysene 29 34 28 37.03 24.64 27.89 1.41 27.8 2.21
Benz [b] Fluoranthene +
Benz [k]Fluoranthene29.9 33.7 26.9 33.2 21.5 25.7 11.1 26.5 6.41
Benzo [a] Pyrene 22.9 25.8 21.1 18.4 10.7 13.1 39.6 14.3 35.9
Indeno[1,2,3-c,d] Pyrene
+ Dibenz [a,h]
Anthracene
1.8 3.5 2.2 <MDL <MDL <MDL 100.00 <MDL 100
Benzo [g,h,i] Perylene 7.9 8.3 2.3 <MDL <MDL <MDL 100.00 <MDL 100
Average Final Soil
Concentration -
Control (mg/kg)
%
ReductionContaminant
Initial Average Soil
Concentrations - Treatment
(mg/kg)
Final Soil Average
Concentrations - Treatment
(mg/kg) %
Reduction
87
Chapter 4
Conclusions and Recommendations
The research conducted for this thesis enhanced the site conceptual model and evaluated the
potential for persulfate to treat residuals at a former MGP site. This evaluation was achieved
through bench-scale, batch aqueous and column treatability studies.
An extensive site characterization was conducted at the former Clearwater Beach MGP site in
Florida. The lithology of the site is spatially consistent with a homogeneous sand aquifer (water
table at 1.5 m (5 ft) bgs) overlying a clay unit (~7.5 m, (25 ft) bgs). The aquifer was estimated to
have a porosity of 0.34 and an average hydraulic conductivity, determined from slug tests, of
2.3x10⁻³
cm/s. Using pressure transducer measurements the groundwater flow was characterized
to have a Darcy flux of 0.0193 m/day in the direction of S20°E.
Extents of source areas in both deep (>4.5 m) and shallow (<4.5 m) zones of the aquifer were
estimated based on borehole logs and soil and water sample analyses. A total source volume of
approximately 84.8 m3 exists in the shallow zone of the aquifer and a total source volume of
approximately 42.4 m3
exists in the deep zone of the aquifer. Downgradient of these source
zones, a transect of ten multilevel wells was installed perpendicular to groundwater flow to
determine dissolved BTEX and PAH concentrations and mass discharge across the site. BTEX
plumes were determined to be predominately located at the water table, trimethylbenzene plumes
in the middle of the aquifer, and PAH plumes near the clay unit. On average, the groundwater
plumes were relatively constant in concentration and morphology over the 12 month sampling
period. Total mass discharge of contaminants across the site was estimated to be 94 mg/day. Of
the compounds measured, the mass discharge of naphthalene was greatest (44 mg/day).
Samples of MGP residual were analyzed to characterize the source material. Approximately
30% of the constituents were identified. Of this 30%, naphthalene was the predominant
compound (27%), followed by 2-methylnaphtalene (18%), and 1-methlynapthalene (10%).
Bench-scale tests were conducted to determine buffering capacity, COD and NOI of the
Clearwater aquifer sediments. Poor buffering capacity was observed, indicating the probability of
88
pH shifts during persulfate injections. These shifts could be advantageous for an alkaline
activated persulfate system. COD tests indicate that the aquifer has a low reductive capacity,
between 0.09 and 0.17 meq/g. Finally, NOI results indicated minimal degradation of persulfate
due to aquifer interactions (~14-23%). Knowledge of this range will be applied when
determining the optimal full-scale injection dose to ensure persulfate persistence within the
aquifer.
Batch aqueous experiments were conducted and showed the ability for persulfate and iron
activated persulfate to oxidize PAHs and BTEX in site groundwater. Persulfate (20g/L) activated
with 600 mg/L-Fe(II) was the most effective oxidation system tested. Degradation of all COCs
was observed within 6 hours after the commencement of this experiment. Reaction rates were
calculated to be up to 6 times faster than using 20g/L persulfate activated with 150mg/L-Fe(II)
and 50 times faster than using 20g/L of unactivated persulfate. However, persulfate
decomposition was greater with the increased iron dosage (60% consumed, compared to 17%).
Unactivated persulfate was unable to reduce some PAHs below MDL by the end of the 14-day
experiment.
Two series of column experiments were conducted to determine the potential for persulfate to
oxidize MGP impacted sediments. The first experiment, conducted with unactivated persulfate,
yielded final reductions in effluent concentrations of BTEX and PAHs between 78-98% and 45-
87%, respectively. Additional flushes were conducted with alkaline activated persulfate and
yielded further reductions in effluent concentrations (94-99% and 75-99%). Soil samples taken
from the columns indicated that persulfate removed 23% more mass than the control column but
did not assist in the removal of BTEX compounds and had no impact on naphthalene,
dibenzofuran, phenanthrene, fluoranthene, biphenyl and pyrene concentrations. The second
experiment, conducted with iron activated persulfate, yielded final reductions in effluent
concentrations of BTEX and PAHs between 70-99% and 65-97%, respectively. Soil samples
taken at the conclusion of the experiment showed iron activated persulfate increased reduction in
compounds by 27% relative to water flushing but, similar to the first experiment, removal of
BTEX compounds were independent of iron activated persulfate addition and it was unable to
oxidize 1-methylnaphthalene, acenaphthylene and chrysene.
89
4.1 Recommendations
The conceptual site model could be enhanced through additional borehole installations
surrounding source zones to further characterize their spatial extents. Specifically, the large
shallow and deep sources located upgradient of the metershop. Additionally, further
groundwater sampling of the transect would provide a better understanding of long-term changes
in the movement of the plumes and mass discharge across the site. Currently, the degree of
contamination in the clay unit is unknown. Samples from this unit should be collected and
analyzed in order to provide an estimate of the degree of contamination.
Additional bench-scale tests would be beneficial in the determination of treatability endpoints.
In the high (600 mg-Fe(II)/L) iron-activated persulfate treatability study, reactions occurred very
quickly. Measurements taken in shorter sampling intervals would provide a better estimation of
reaction kinetics for the COC. The column experiments provided insight on the treatability of
impacted sediments with unactivated, Fe(II)-activated, and alkaline activated persulfate.
Completion of another series of column experiments, increasing the reaction period (from 4 days
to 8 days), may be beneficial. Originally, a four day reaction period was selected to allow for
kinetic processes to occur within the columns after a persulfate dose. However, there is a
possibility that this timeframe may be too short. Measurements of effluent persulfate
concentration taken after doses indicate an excess of persulfate within the system, meaning the
potential for further oxidation. Therefore increasing the reaction period could be beneficial in
promoting degradation of COC.
The next step in the project is to conduct push-pull tests (PPTs) to further and more accurately
assess the ability for persulfate to treat MGP residuals in situ. Based on the site characterization,
proposed locations for the PPTs are: between DPT-5 and DPT-23 (18’ – 19.5’ bgs) and between
DPT-22 and DPT-23 (11’-12.5’ bgs). These locations were chosen to assess treatability potential
in the shallow and deep zones of the aquifer. Additionally, borehole installations indicated these
areas are heavily saturated with NAPL.
90
Based on the completed bench-scale tests, iron activated persulfate (600 mg/L iron) or alkaline
activated persulfate are recommended for the PPTs. Treatability studies showed that these
schemes are more aggressive and effective than unactivated persulfate for the oxidation of MGP
residuals, especially with higher molecular weight PAHs. Injections of activated persulfate are
anticipated to reduce aqueous concentrations of both BTEX and PAHs to below NADC levels.
Based on the mass removal observed in the column analyses conducted, it is expected that
complete oxidation is not realistic using either unactivated, iron (II) activated, or alkaline
activated persulfate. Activated persulfate showed the most potential for mass reduction, however,
final concentrations measured in column sediments indicate that, for the majority of compounds,
alkaline-activated persulfate doses were not more effective than water flushing in the reduction
of BTEX and PAH compounds. Therefore, further investigation into other treatment options for
source depletion is recommended.
91
References
Batu, V. 2006. Applied flow and solute transport modeling in aquifers: fundamental principles and
analytical and numerical methods. CRC Press. Boca Raton, FL, USA.
Beltran, F.J., Gonzalez, M., Rivas, F., Alvarez, P., 1997. Fenton reagent advanced oxidation of
polynuclear aromatic hydrocarbons in water. Departamento de Ingenieria Quimica y Energetica,
Universidad de Extremadura, Badajoz, Spain.
Block, P.A., Brown, R.A., Robinson, D. 2004. Novel Activation Technologies for Sodium Persulfate In
Situ Chemical Oxidation, Proceedings of the Fourth International Conference on the Remediation
of Chlorinated and Recalcitrant Compounds. Monterey, CA.
Bockelmann, A., Ptak, T., Teutsch, G. 2001. An analytical quantification of mass fluxes and natural
attenuation rate constants at a former gasworks site. J. Contam. Hydrol. 53, 429-453.
Bogan B.W., Trbovic V. 2003. Effect of sequestration on PAH degradability with Fenton’s reagent: Roles
of total organic carbon, humin, and soil porosity. J. Hazard Materials. 100, 285–300.
Bogan, B, Trbovic V., Paterek, R.J. 2003. Inclusion of vegetable oils in Fenton’s chemistry for
remediation of PAH-contaminated soils. Chem. 50 (1), 15-21.
Brown, D.G., Knightes C.D., Peters, C.A. 1999. Risk assessment for polycyclic aromatic hydrocarbon
NAPLs using component fractions. Environ. Sci. Technol. 33, 4357–4363.
Brown, G.S., Barton, L.L., Thomson, B.M. 2003. Permanganate oxidation of sorbed polycyclic aromatic
hydrocarbons. Waste Management 23, 737-740.
Chapman M.J., Gallaher B.M., Early D.A. 1990 A preliminary investigation of the hydrogeology and
contamination in the area of an abandoned manufactured gas plant in Albany, Georgia. US
Geological Survey Water-Resources Investigations Report 90–4141.
Crimi M., Taylor J. 2007. Experimental Evaluation of Catalyzed Hydrogen Peroxide and Sodium
Persulfate for Destruction of BTEX Contaminants. Soil and Sed. Contam. 16(1), 29-45.
Eberhardt, C., Grathwohl, P. 2002. Time scales of organic contaminant dissolution from complex source
zones: coal tar pools vs. blobs. J. Contam,. Hydrol. 59(1-2), 45-66.
Eng R. 1985. Survey of Town Gas and By-product Production and Location in the United States (1880-
1950). U.S. Environmental Protection Agency. Washington, D.C.
EPA (Environmental Protection Agency). 1999. A rational approach to the remediation of soil and ground
water and MGP sites: A resource for MGP site characterization and remediation. U.S.
Environmental Protection Agency, Washington D.C.
EPA (Environmental Protection Agency). 1999. A resource for MGP site
characterization and remediation expedited site characterization and source remediation at former
manufactured gas plant sites, U.S. Environmental Protection Agency, Washington, D.C.
Fischer, C., Schmitter, R., Lane, E. 1999. Manufactured gas plants: the environmental legacy. Georgia
Institute of Technology, Atlanta, Georgia, USA.
Ferrarese, E., Andreottola, G., Oprea, I.A. 2008. Remediation of PAH-contaminated sediments by
chemical oxidation, J. Hazard. Mater. 152;1,128-139.
Forsey, S.P. 2004. In situ chemical oxidation of creosote/coal tar residuals: experimental and numerical
investigation. Ph.D. Thesis, University of Waterloo, Waterloo, ON.
Freitas, J.G., Barker, J.F. 2008. Sampling VOCs with porous suction samplers in the presence of ethanol:
How much are we losing? Ground Water Monit. Rem. 28(3),83-92.
Gates-Anderson, D.D., Siegrist, R.L., Cline, S.R. 2001. Comparison of potassium permanganate and
hydrogen peroxide as chemical oxidants for organically contaminated soils. J. Environ. Eng.
127:337-347.
92
Goi, A., Trapido, M. 2004. Degradation of polycyclic aromatic hydrocarbons in soil: the Fenton reagent
versus ozonation. Environ. Tech. 25:2, 155-164.
Goltz, M.N., Kim, S., Hyouk, Y., Park, J., 2007. Review of groundwater contaminant mass flux
measurement. Korean Society of Environ. Eng. 12(4):176-193.
Gryzenia, J., Cassidy, D., Hampton, D. 2009. Production and accumulation of surfactants during the
chemical oxidation of PAH in soil. Chem. 77, 540-545.
Guilbeault, M.A., Parker B.L. and Cherry, J.A.. 2005. Mass and flux distributions from DNAPL zones in
sandy aquifers. Ground Water. 43(1), 70-86.
Haley, J.L., Hanson, B., Enfield, C. and Glass, J., 1991. Evaluating the effectiveness of groundwater
extraction systems. Ground Water Monit. 11(1): 119-124.
Hsu I-Y, Masten SJ. 2001. Modeling transport of gaseous ozone in unsaturated soils. J. Env. Eng.
127:546–554.
Huang, K., Zhao, Z., Hoag, G.E., Dahmani, A., Block, P. 2005. Degradation of volatile organic
compounds with thermally activated persulfate oxidation. Chem. 61, 551-560.
ITRC (Interstate Technology and Research Council). 2005. Technical and regulatory guidance for in situ
chemical oxidation of contaminated soil and groundwater, ISCO-2. Washington, D.C., Interstate
technology & Regulatory Council, In Situ Chemical Oxidation Team, 2nd
ed.
ITRC (Interstate Technology and Research Council). 2010. Use and Measurement of Mass Flux and Mass
Discharge. Washington, D.C., Interstate technology & Regulatory Council, Integrated DNAPL
Site Strategy Team.
Kanel, S.R., Neppolian, B., Jung, H., Choi, H. 2004. Comparative removal of polycyclic aromatic
hydrocarbons using iron oxide and hydrogen peroxide in soil slurries. Environ. Eng. Sci. 21 (6),
741-751.
Kang, N., Hua, I. 2005. Enhanced chemical oxidation of aromatic hydrocarbons in soil systems. Chem.
61,909-922.
Kavanaugh, M.C., S.C. Rao, L. Abriola, J. Cherry, G. Destouni, R. Falta, D. Major, J. Mercer, C. Newell,
T. Sale, S. Shoemaker, R. Siegrist, G. Teutsch, K. Udell. 2003. The DNAPL remediation
challenge: Is there a case for source depletion? U.S. EPA: National Risk Management Research
Laboratory, Ada, Ok.
Kong, S., Watts, R.J., Choi, J. 1998. Treatment of petroleum contaminated soils using iron mineral
catalyzed hydrogen peroxide. Chem. 37 (8), 1473-1482.
Killian, P.F., Bruell, C.J. Liang, C., Marley, M.C. 2007. Iron (II) activated persulfate oxidation of MGP
contaminated soil. Soil and Sed. Contam. 16, 523-537.
King, M.W.G., Barker, J.F. 1999. Migration and natural fate of a coal tar creosote plume 1. Overview and
plume development. J. of Cont. Hydrol. 39, 249-279.
Krembs, F., Siegrist, R., Crimi, M., Furrer, R., and Petri, B. 2010. ISCO for Groundwater Remediation:
Analysis of Field Applications and Performance. Ground Water Monit. Remediat., 30(4),42-53.
Lane W.F., Loehr, R.C. 1992. Predicting aqueous concentrations of polynuclear aromatic hydrocarbons in
complex mixtures. Environ. Sci. Technol. 26, 983-990.
Lee, L.S., Rao, P.S., Okuda, I. 1992. Equilibrium partitioning of polycyclic aromatic hydrocarbons from
coal tar into water. Environ. Sci. Technol. 26 (11), 2110-2115.
Levenspielu, O. 1998.Chemical reaction engineering – 3rd
Edition. Wiley. Hoboken, NJ, USA.
Lou, J.C., Lee, S.S. 1993. Chemical oxidation of BTX using Fenton’s reagent. Hazard. Waste and Hazard.
Mater., 12 (2),186-193.
Lehr, J., Hyman, M., Gass, T., and Seevers, W. 2001. Handbook of Complex Environmental Remediation
Problems. McGraw-Hill, New York, NY.
93
Liang, C., Hyang, C., Chen, Y. 2008. Potential for activated persulfate degradation of BTEX
contamination. Water Res., 42(15),4091-4100.
Lundstedt S, Persson Y, Oberg L. 2006. Transformation of PAHs during ethanol-Fenton treatment of an
aged gasworks’ soil. Chem. 65:1288–1294.
Luthy, R.G., Dzombak, D.A., Peters C.A., Roy, S.B., Ramaswami, A., Nakles, D.V., Nott, B.R. 1994.
Remediating tar-contaminated soils at manufactured gas plant sites. Environ. Sci. Tech. 28,266A-
276A.
Major, D. 2009. Remediation of DNAPL through sequential in situ chemical oxidation and
bioaugmentation. Prepared for ESTCP (Project ER-200116), Arlington, Virginia. Final
Report.
MacKay, A.A., Gschwend P.M. 2001. Enhanced concentrations of PAHs in groundwater at a coal tar site.
Environ. Sci. Tech. 35 (7), 1320–1328.
Marvin, B. K., Nelson, C. H., Clayton, W., Sullivan, K. M., Skladany, G. 1998. In-situ chemical oxidation
of Pentachlorophenol and polycylic aromatic hydrocarbons: From laboratory tests to field
demonstration. The First International Conference on Remediation of Chlorinated and
Recalcitrant Compounds, Vol. C1-5: Physical, Chemical, Thermal Technologies, Monterey, CA,
pp. 383-388.
McGowan, T., Greer, B., Lawless, M. 1996. Thermal treatment and non-thermal treatment technologies
for remediation of manufactured gas plant sites. Waste Management 16(8)691-698.
McGovern, T.; Guerin, T. F.; Horner, S.; Davey, B. 2002. Design, construction and operation of a funnel
and gate in-situ permeable reactive barrier for remediation of petroleum hydrocarbons in
groundwater. Water, Air, Soil Pollution. 136, 11-31.
McGuire, T. M., J. M. McDade, C.J. Newell. 2006. Performance of DNAPL source depletion
technologies at 59 chlorinated -solvent-impacted sites. Ground Water Monit. Remediat. 26,1; 73–
84.
Moo-Young, H., Brown, D. 2004. Laboratory assessment of leaching potential of coal tar at MGP sites.
EPRI, Palo Alto, CA.
Moo-Young, H., Mo, X., Waterman, R., Coleman, A., Saroff, S. 2009. Investigation of coal tar mobility
at a former MGP site. J. Hydrol. Eng. 14,11;1221-1234.
Nam, K., Rodriguez, W., Kukor, J.J. 2001. Enhanced degradation of polycyclic aromatic hydrocarbons
by biodegradation combined with a modified Fenton reaction. Chem. 45, 11-20.
Nadim, F., Huang, K. C., Dahmani, A.M. 2005. Remediation of soil and ground water contaminated with
PAH using heat and Fe(II)-EDTA catalyzed persulfate oxidation. Water Air Soil Pollution Focus.
6,227–232.
Nelson, C.H. 1997. Ozone sparging for the remediation of MGP contaminants. Proceedings of the Fourth
Symposium on In Situ and On Site Bioremediation, New Orleans, LA, U.S.A.
O'Shaughnessy, J.C. and C. Nardini. 1997. Heating the tar out. Soil and Groundwater Cleanup, June: 7-
13.
Peters, C., Luthy, R. 1993. Coal Tar dissolution in water-miscible solvents: experimental evaluation.
Environ. Sci. Tech. 27, 2831-2843.
Schmitt, R.; Langguth, H. R., Puttmann, W., Rohns, H. P., Eckert, P., Schubert, J. 1996. Biodegradation
of aromatic hydrocarbons under anoxic conditions in a shallow sand and gravel aquifer of the
Lower Rhine Valley, Germany. Org. Geochem. 25, 41-50.
Shin W-T, Garanzuay X, Yiacoumi S, Tsouris C, Gu B, Mahinthakumar G. 2004. Kinetics of soil
ozonation: An experimental and numerical investigation. J. Cont. Hydrol. 72:227–243.
94
Sra, K., Thomson, N.R., Barker, J.F. 2008. In situ chemical oxidation of gasoline compounds
using persulfate. Proceedings of the Petroleum Hydrocarbons and Organic Chemicals in Ground
Water Conference, Houston, TX, November 3–5.,76.
Sra, K., Thomson, N.R., Barker, J.F. 2010. Persistence of persulfate in uncontaminated aquifer materials.
J. Env. Sci. Tech., 44(8), 3098–3104
Siegrist, R.L. 2011. In Situ Chemical Oxidation for Groundwater Remediation. Springer Science, New
York, NY Ch. 2, 6.
Stravelova, M., Pokorny, A. 2008. Chemical oxidation of PAHs using modified Fenton’s reagent and
Persulfate. Earth Tech CZ, Ltd., Trojska 92, 171 00 Prague, Czech Republic.
Thomson, N., Fraser, M.J., Lamarche, C., Barker, J.F., Forsey, S.P. 2008. Rebound of a coal tar creosote
plume following partial source zone treatment with permanganate. J. Contam. Hydrol. 102, 154-
171.
Pinto, P. 1993. Treatability of groundwater from a plume contaminated with PAHs and gasoline
hydrocarbons. Master of Science Thesis, University of Cincinnati, Ci, OH.
Warshawsky, D. 1999. Polycyclic aromatic hydrocarbons in carcinogenesis. Environ. Health Persp.
107(4),317-319.
Wick, A., Haus, N., Sukkariyah, B., Haering, K.., Daniels,W. 2011. Remediation of PAH-Contaminated
Soils and Sediments: A Literature Review. Virginia Polytecnic Institute, Blacksburg, VA.
Yen, C., Chen, K., Kao, C., Liang, S., Chen, T. 2011. Application of persulfate to remediate petroleum
hydrocarbon-contaminated soil: Feasibility and comparison with common oxidants. J. Hazard.
Mater. 186(2-3), 2097-2102.
Yeom, I., Ghosh, M., Cox, C., Robinson, K. 1993. Micellular solubilization of polynuclear aromatic
hydrocarbons in coal tar-contaminated soils. Environ. Sci. Tech., 29, 3015-3021.

95
Appendices
96
Appendix A:
Site Work Completed
March 2011
During the week of March 7, 2011 ARCADIS and personnel from UW mobilized to the site to conduct
additional soil borings (DPT-12 to DPT-27) and monitoring well installations (MW-23D, MW-24D, MW-
25, MW-25D and MW-26) in the area surrounding the Meter Shop building and to deploy pressure
transducers at select monitoring well locations. The field-work performed in March 2011 was primarily
focused on the collection of additional information on the architecture of surficial aquifer source material,
including soil cores for laboratory and bench-scale testing.
Pressure transducers were deployed at monitoring well locations MW-7D, MW-23D, MW-24D and MW-
25D for the purpose of refining surficial aquifer groundwater flow direction and magnitude in the area
surrounding the “meter shop”.
Temporary groundwater screening/sampling was not performed at any of the locations drilled in March
2011. Total boring depths, depending on the depth of the clay contact, ranged from 20 to 88 feet below
ground surface (ft bgs). GeoProbe™ macro-core sampling with piston assembly was used to advance the
borings and to collect soil core samples. The borings were abandoned via tremie-grout methods.
During the installations of boreholes DPT-12 to DPT-27, core was logged on Site. At changes in
lithology, grab samples were collected transferred to plastic bags and preserved in coolers with ice. At
DPT locations where MGP residuals were observed near the sand/clay interface in a core sample, a
secondary borehole installation was conducted approximately 1 foot away. At this secondary location, an
intact core sample was collected by driving the maco-core sampling system to the required depth. The
intact core samples were stored on Site in coolers with ice. All collected samples were shipped to the
University of Waterloo for laboratory analyses. Upon arrival at the university, the samples were logged
and then stored at 4 oC. Tables 3 and 4 list the sediment and intact core samples collected, respectively.
The borehole logs were re-examined and the sediments were assigned a lithotype and weighed. Sediment
samples were denoted by the DPT location and depth bgs; for example sample DTP-6 9 is obtained from
location DPT-6 at 9 feet bgs.
July 2011
During the week of July 18, 2011 ARCADIS and personnel from UW mobilized to the site to conduct
additional soil borings (DPT-28 to DPT-35) and multilevel (ML) monitoring well installations in the area
surrounding the Meter Shop building and within the Meter Shop building. The purpose of these borings
and well installation work was to provide additional information on the architecture of surficial aquifer
source material contributing to the groundwater plume in the vicinity and downgradient of MW-20, and to
complete installation of additional long-term groundwater monitoring points within the surficial aquifer.
Fourteen (14) multilevel wells were installed between July 18 and 22, 2011 using direct push Geoprobe™
equipment (ML well locations are shown as blue symbols on Figure 2). The multilevel design was
selected because of its capability to obtain discrete groundwater samples from various depths within a
single borehole installation. Ten (10) multilevel wells denoted as ML-1 to ML-10 were evenly spaced at
9 foot intervals along an 81 foot wide transect located north of the MW-25/MW-25D well cluster, south of

97
the Meter Shop building. This transect was oriented at approximately 65o east of north which, based on
previous water level measurements taken at the site, represents a line that is approximately perpendicular
to the mean groundwater flow direction, south of the Meter Shop building. These ML monitoring wells
were installed using a track-mounted Geoprobe™ 6610DT drilling rig. Four (4) multilevel wells denoted
as ML-11 to ML-14 were installed inside the Meter Shop at strategic locations. These four locations were
installed utilizing a dolly-mounted, low clearance Geoprobe™ GP420M mobile rig due to the access
constraints (i.e., low ceiling and walls) inside the Meter Shop.
Based on designs utilized by UW on other remediation monitoring projects in the State of Florida, the
following methodology was used to construct ML monitoring wells at the site during July 2011. The core
(center stock) of each multilevel well was a length of nominal 0.50 inch CPVC pipe (0.625 inch outside
diameter) with lengths of polytetrafluoroethylene (PTFE) tubing (0.25 inch outside diameter and 0.03 inch
wall thickness) fastened to the center stock with electrical tape. The bottom approximately 5 inches of
each PTFE tube was slotted (sampling port) and covered with a 200 micrometer (μm) mesh Nitex screen
(45% open area) to prevent fine particles from entering the sample tubing. The Nitex screen was attached
to the PTFE tube using stainless steel wire.
For ML-1 to ML-10, 10 sampling ports were spaced at nominal 2.2 foot intervals, and for ML-11 to ML-
14, 4 sampling ports were spaced at nominal 5 foot intervals. Each ML well was constructed on Site and
inserted into the center of the probe rods driven to the target depth using an expendable knock-out tip. As
the probe rods were withdrawn the formation was allowed to collapse around the multilevel well. Filter
sand with a grout collar was used to fill the ML well annular space above the water table (~ 5 feet below
ground surface [ft bgs]) to 12 inches below ground surface. A cement well pad with 8-inch diameter
flush-mounted well cover was installed as surface protection at each ML well location. Each sampling
port was developed using a peristaltic pump until the extracted groundwater was visually free of fine
sediment.
Soil boring locations included borings DPT-28 to DPT-35 (Figure 2). Borings DPT-32 to DPT-35,
located within the Meter Shop were converted to ML monitoring well points (ML-11 through
ML-14, respectively) as described above after reaching total drilling depth. Temporary groundwater
screening/sampling was not performed at any of the locations drilled in July 2011. Total boring depths,
depending on the depth of the clay contact, ranged from 20 to 40 ft bgs. GeoProbe™ macro-core sampling
with piston assembly was used to advance the borings and to collect soil core samples. The soil borings
were abandoned via tremie-grout methods, unless converted to a ML monitoring well.
During the installations of boreholes DPT-28 to DPT-35, core was logged on Site. At changes in
lithology, grab samples were collected transferred to plastic bags and preserved in coolers with ice. All
collected samples were shipped to the University of Waterloo for laboratory analyses. Upon arrival at the
university, the samples were logged (Table 3) and then stored at 4 oC.
Following development of each ML sampling port, duplicate samples were collected from each multilevel
port using a sampling glass vial (40 mL) placed between the multilevel port and a peristaltic pump. For
sample collection, the glass vial was fitted to an in-line, stainless steel screw cap sample head. Several (2-
3) groundwater volumes of the vial were passed through before the vial was detached from the sample
head. Samples were preserved with sodium azide (0.4 milliliters [mL] of 10% solution), sealed with
PTFE lined screw caps, and preserved in coolers with ice. All collected samples were shipped to the

98
University of Waterloo for laboratory analyses. All samples were stored at 4 °C and held for less than 14
days prior to analysis at the Organics Laboratory at the University of Waterloo.
October 2011
During the week of October 31, 2011 personnel from UW mobilized to the site to sample the transect and
Meter Shop ML wells, perform slug tests on MW-7D, MW-23D, MW-24, and MW-25, and download the
pressure transducer data. Groundwater samples were collected and handled as described in Section 2.1.2.
February 2012
During the week of February 14, 2012 personnel from UW mobilized to the site to sample the transect and
Meter Shop ML wells, and download the pressure transducer data. Groundwater samples were collected
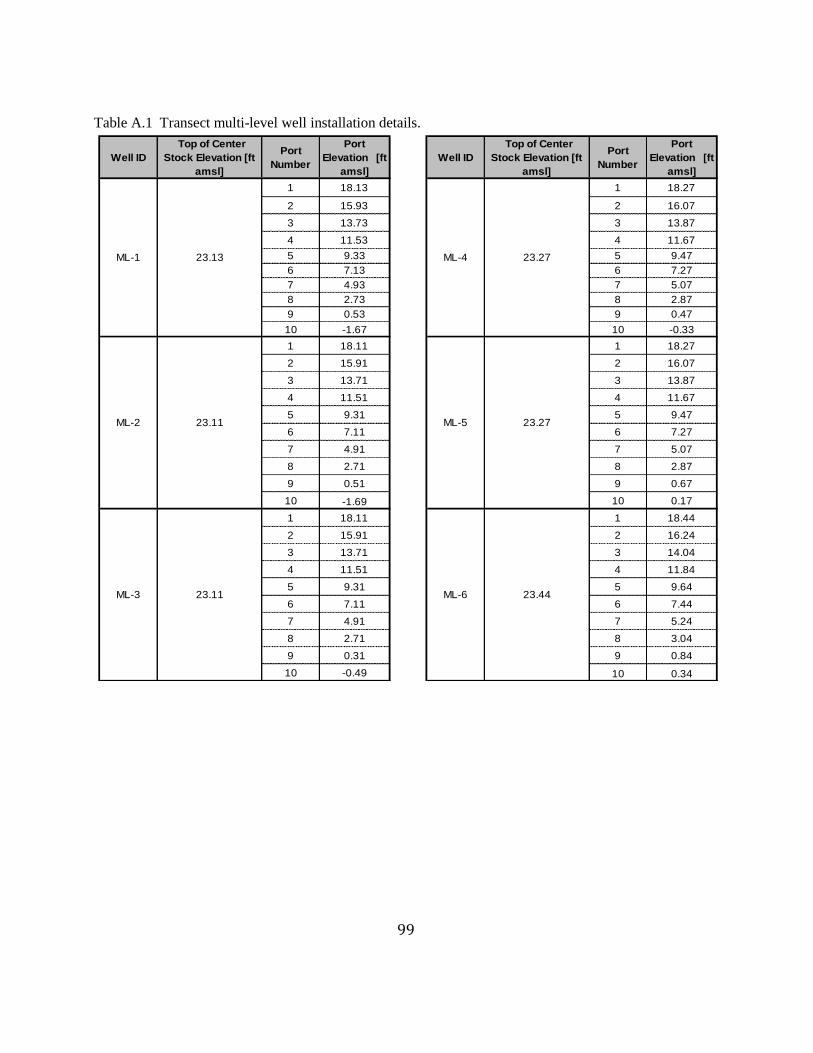
99
Table A.1 Transect multi-level well installation details.
Well ID
Top of Center
Stock Elevation [ft
amsl]
Port
Number
Port
Elevation [ft
amsl]
Well ID
Top of Center
Stock Elevation [ft
amsl]
Port
Number
Port
Elevation [ft
amsl]
1 18.13 1 18.27
2 15.93 2 16.07
3 13.73 3 13.87
4 11.53 4 11.67
5 9.33 5 9.47
6 7.13 6 7.27
7 4.93 7 5.07
8 2.73 8 2.87
9 0.53 9 0.47
10 -1.67 10 -0.33
1 18.11 1 18.27
2 15.91 2 16.07
3 13.71 3 13.87
4 11.51 4 11.67
5 9.31 5 9.47
6 7.11 6 7.27
7 4.91 7 5.07
8 2.71 8 2.87
9 0.51 9 0.67
10 -1.69 10 0.17
1 18.11 1 18.44
2 15.91 2 16.24
3 13.71 3 14.04
4 11.51 4 11.84
5 9.31 5 9.64
6 7.11 6 7.44
7 4.91 7 5.24
8 2.71 8 3.04
9 0.31 9 0.84
10 -0.49 10 0.34
ML-5 23.27
ML-6 23.44
ML-4 23.27
ML-3 23.11
ML-2 23.11
ML-1 23.13
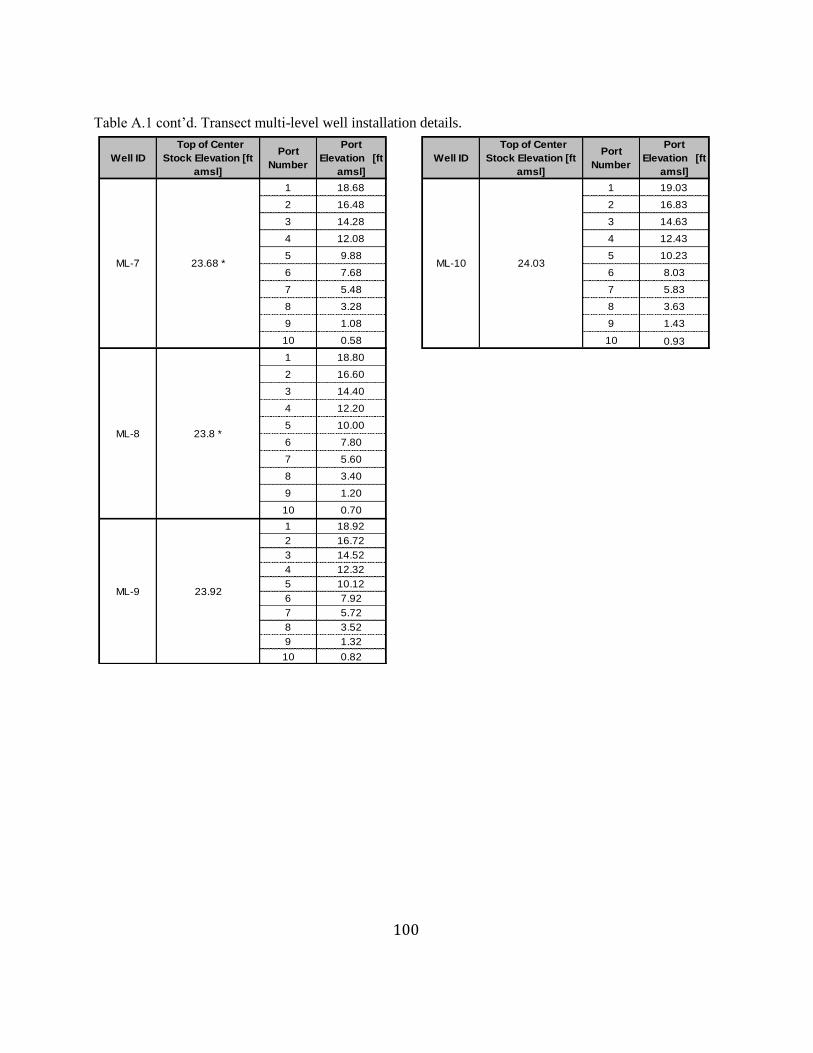
100
Table A.1 cont’d. Transect multi-level well installation details.
Well ID
Top of Center
Stock Elevation [ft
amsl]
Port
Number
Port
Elevation [ft
amsl]
Well ID
Top of Center
Stock Elevation [ft
amsl]
Port
Number
Port
Elevation [ft
amsl]
1 18.68 1 19.03
2 16.48 2 16.83
3 14.28 3 14.63
4 12.08 4 12.43
5 9.88 5 10.23
6 7.68 6 8.03
7 5.48 7 5.83
8 3.28 8 3.63
9 1.08 9 1.43
10 0.58 10 0.93
1 18.80
2 16.60
3 14.40
4 12.20
5 10.00
6 7.80
7 5.60
8 3.40
9 1.20
10 0.70
1 18.92
2 16.72
3 14.52
4 12.32
5 10.12
6 7.92
7 5.72
8 3.52
9 1.32
10 0.82
ML-10 24.03ML-7 23.68 *
ML-8 23.8 *
ML-9 23.92
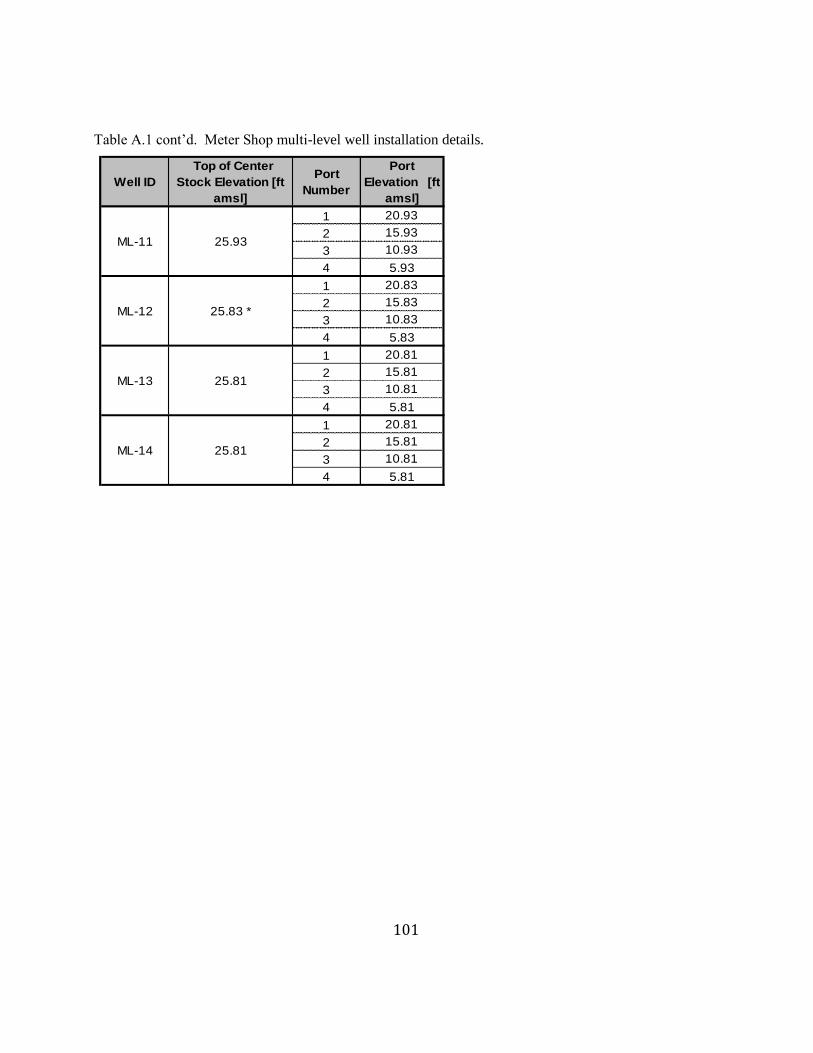
101
Table A.1 cont’d. Meter Shop multi-level well installation details.
Well ID
Top of Center
Stock Elevation [ft
amsl]
Port
Number
Port
Elevation [ft
amsl]
1 20.93
2 15.93
3 10.93
4 5.93
1 20.83
2 15.83
3 10.83
4 5.83
1 20.81
2 15.81
3 10.81
4 5.81
1 20.81
2 15.81
3 10.81
4 5.81
25.93
ML-14 25.81
ML-12 25.83 *
ML-13 25.81
ML-11

102
Appendix B:
Site Characterization Data
Table B.1 Sediment grad samples collected.
Location Depth Mass (g) Lithotype
DPT-12 9' 586.79 Fine SAND
14' 482.1 Fine SAND
15' 457.05 Fine SAND
18' 485.27 Very Fine SAND
DPT-13 9' 552.67 Fine SAND
25' 488.28 Fine SAND with Silt
DPT-14 3' 230.9 Peaty SAND
5' 427.26 Peaty SAND
10' 529.36 Fine SAND
DPT-16 32' 425.48 Clay
DPT-17 10-13' 506.93 Fine SAND with Silt
15' 497.44 Fine to Very Fine Silty SAND
17-19' 450.11 Very Fine SAND
23-25' 513.38 Fine to Very Fine Silty SAND
30' 396.65 Fine to Very Fine Silty SAND
DPT-24 20 LF 420.42 Very Fine SAND
25 LF 501.14 Fine to Very Fine SAND
DPT-25 15' 451.51 Fine SAND
19' 447.95 Fine SAND
25' 595.17 SAND with Silt
28' 587.42 SAND with Silt
DPT-26 7' 442.37 Fine SAND
9' 423.22 Fine SAND
14' 410.91 Fine SAND with Silt
16' 447.25 Fine SAND with Silt
DPT-27 23'-24' 564.72 Fine to Very Fine Silty SAND
24' #2 478.86 Fine to Very Fine Silty SAND
28' 581.33 Medium SAND
34' 571.67 Fine to Very Fine Silty SAND
39' 518.93 Fine to Very Fine Silty SAND
44' 540.02 SAND and SILT
49' 516.95 SAND and SILT
54' 413.89 SILT
59' 433.05 SAND and SILT
60'-65' 615.42 Fine Silty SAND
65'-70' 488.91 Fine to Very Fine SAND
70'-75' 616.92 Fine to Very Fine SAND
80' 534.68 Fine to Very Fine SAND
83' 369.49 Medium SAND
86' 370.3 Fine Silty SAND
88' 169.16 Fine Silty SAND
DPT-28 7’ 150.43 Fine Silty SAND
12’ 232.15 Fine SAND
19’ 211.11 Fine Silty SAND
DPT-29 8’ 321.14 Fine to Very Fine SAND
20’ 122.4 Fine SAND
DPT-30 14’ 245.23 Fine SAND
20’ 217.65 Very Fine SAND
DPT-31 8’ 287.3 Fine SAND
15’ 243.3 Fine SAND
28’ 231.12 Fine Silty SAND
DPT-32 12’ 200.14 Fine to Very Fine SAND
16’ 288.43 Very Fine SAND
DPT-33 9’ 216.54 Very Fine SAND
15’ 233.51 Very Fine SAND
26’ 244.32 Very Fine SAND
DPT-34 14’ 209.22 Very Fine SAND
24’ 254.44 SAND and SILT
DPT-35 15’ 232.4 Fine SAND
20’ 344.29 SAND and SILT
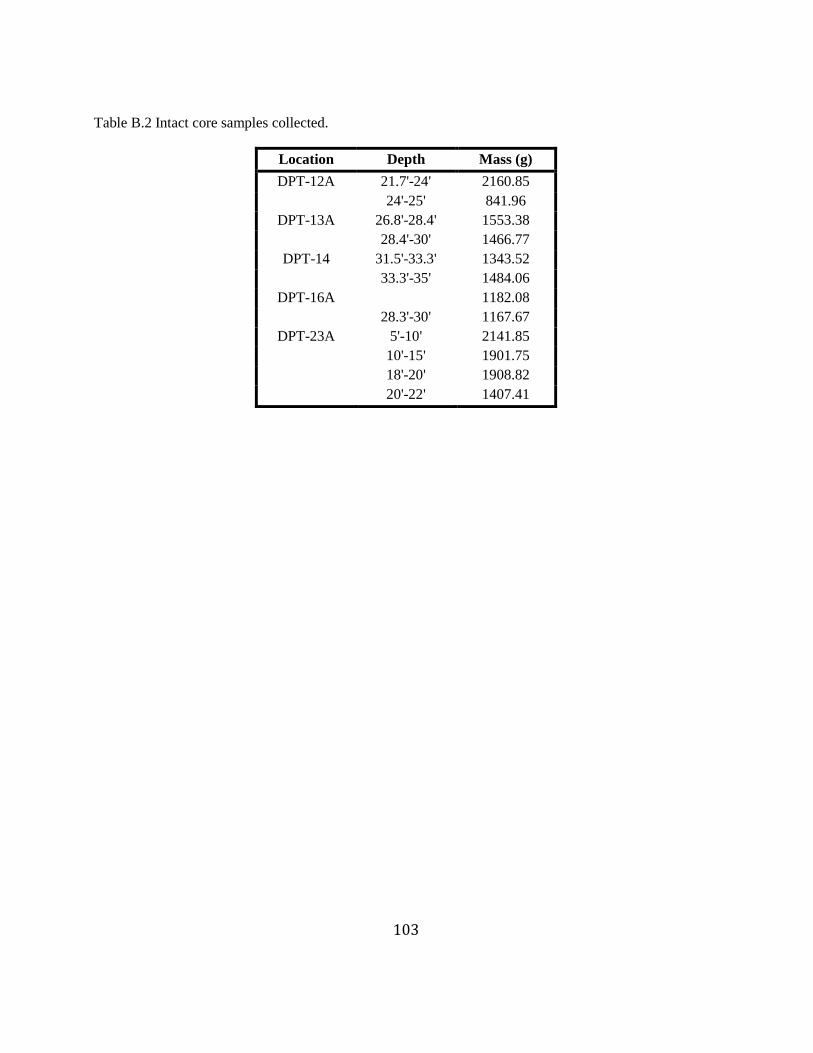
103
Table B.2 Intact core samples collected.
Location Depth Mass (g)
DPT-12A 21.7'-24' 2160.85
24'-25' 841.96
DPT-13A 26.8'-28.4' 1553.38
28.4'-30' 1466.77
DPT-14 31.5'-33.3' 1343.52
33.3'-35' 1484.06
DPT-16A 1182.08
28.3'-30' 1167.67
DPT-23A 5'-10' 2141.85
10'-15' 1901.75
18'-20' 1908.82
20'-22' 1407.41
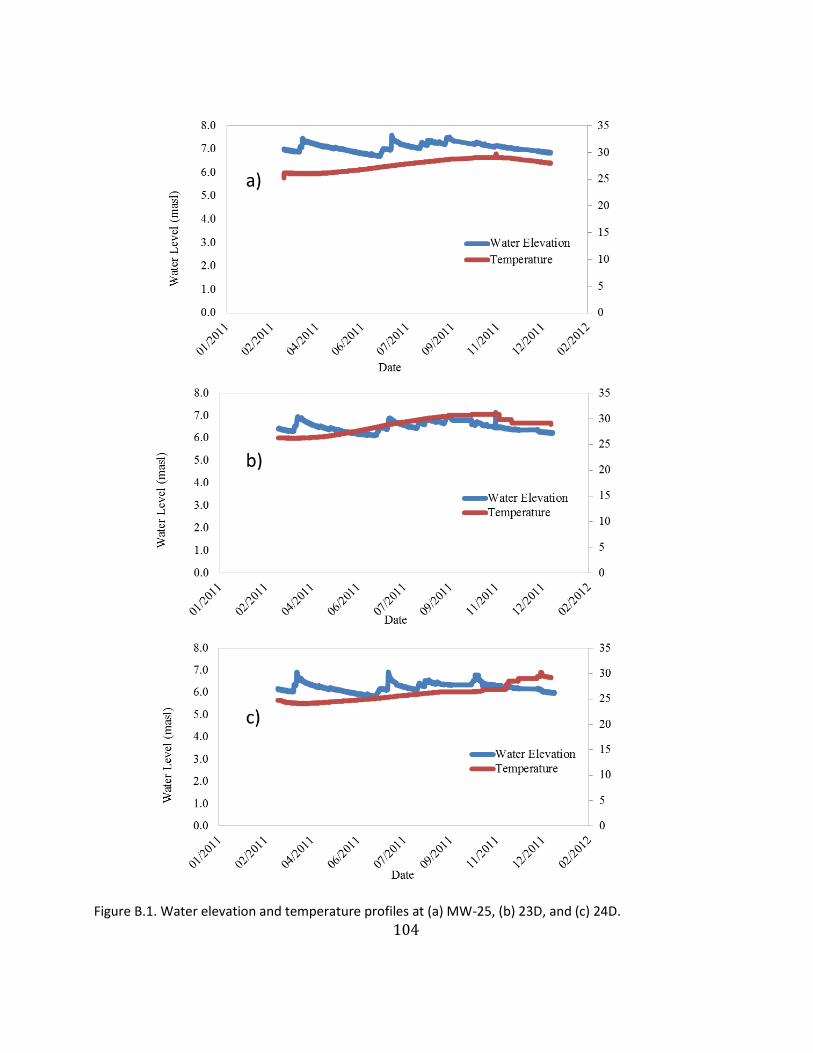
104
Figure B.1. Water elevation and temperature profiles at (a) MW-25, (b) 23D, and (c) 24D.
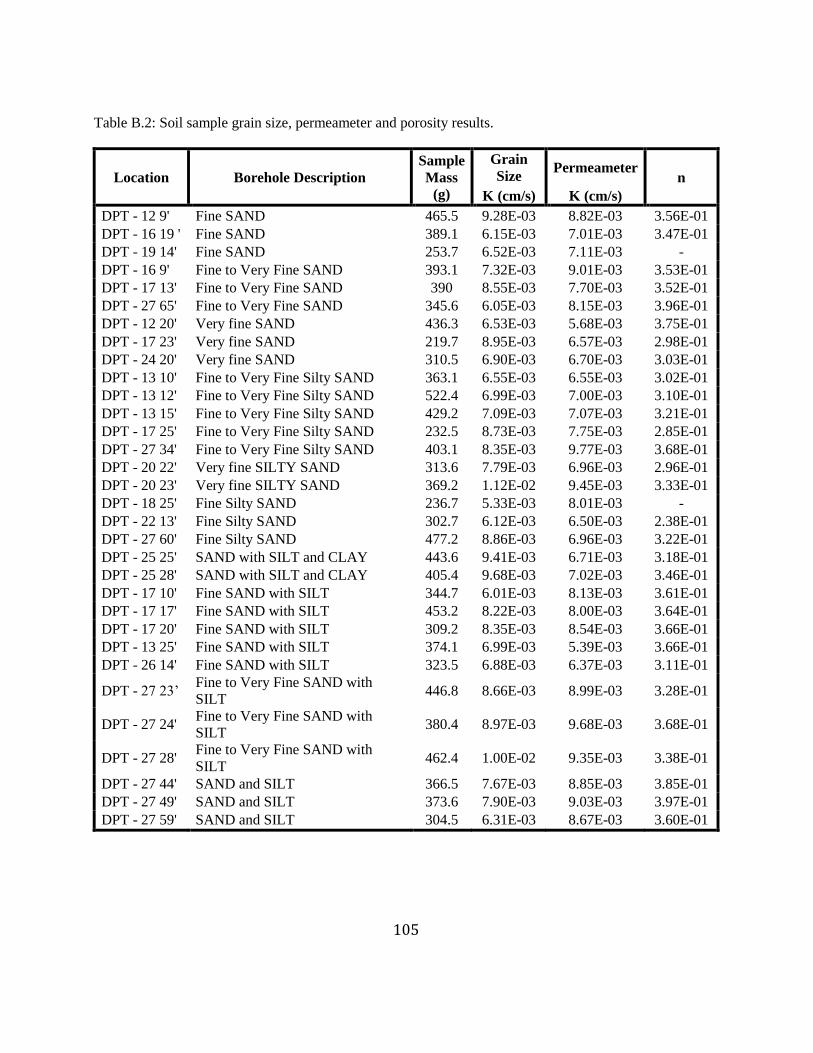
105
Table B.2: Soil sample grain size, permeameter and porosity results.
Location Borehole Description
Sample
Mass
(g)
Grain
Size Permeameter
n
K (cm/s) K (cm/s)
DPT - 12 9' Fine SAND 465.5 9.28E-03 8.82E-03 3.56E-01
DPT - 16 19 ' Fine SAND 389.1 6.15E-03 7.01E-03 3.47E-01
DPT - 19 14' Fine SAND 253.7 6.52E-03 7.11E-03 -
DPT - 16 9' Fine to Very Fine SAND 393.1 7.32E-03 9.01E-03 3.53E-01
DPT - 17 13' Fine to Very Fine SAND 390 8.55E-03 7.70E-03 3.52E-01
DPT - 27 65' Fine to Very Fine SAND 345.6 6.05E-03 8.15E-03 3.96E-01
DPT - 12 20' Very fine SAND 436.3 6.53E-03 5.68E-03 3.75E-01
DPT - 17 23' Very fine SAND 219.7 8.95E-03 6.57E-03 2.98E-01
DPT - 24 20' Very fine SAND 310.5 6.90E-03 6.70E-03 3.03E-01
DPT - 13 10' Fine to Very Fine Silty SAND 363.1 6.55E-03 6.55E-03 3.02E-01
DPT - 13 12' Fine to Very Fine Silty SAND 522.4 6.99E-03 7.00E-03 3.10E-01
DPT - 13 15' Fine to Very Fine Silty SAND 429.2 7.09E-03 7.07E-03 3.21E-01
DPT - 17 25' Fine to Very Fine Silty SAND 232.5 8.73E-03 7.75E-03 2.85E-01
DPT - 27 34' Fine to Very Fine Silty SAND 403.1 8.35E-03 9.77E-03 3.68E-01
DPT - 20 22' Very fine SILTY SAND 313.6 7.79E-03 6.96E-03 2.96E-01
DPT - 20 23' Very fine SILTY SAND 369.2 1.12E-02 9.45E-03 3.33E-01
DPT - 18 25' Fine Silty SAND 236.7 5.33E-03 8.01E-03 -
DPT - 22 13' Fine Silty SAND 302.7 6.12E-03 6.50E-03 2.38E-01
DPT - 27 60' Fine Silty SAND 477.2 8.86E-03 6.96E-03 3.22E-01
DPT - 25 25' SAND with SILT and CLAY 443.6 9.41E-03 6.71E-03 3.18E-01
DPT - 25 28' SAND with SILT and CLAY 405.4 9.68E-03 7.02E-03 3.46E-01
DPT - 17 10' Fine SAND with SILT 344.7 6.01E-03 8.13E-03 3.61E-01
DPT - 17 17' Fine SAND with SILT 453.2 8.22E-03 8.00E-03 3.64E-01
DPT - 17 20' Fine SAND with SILT 309.2 8.35E-03 8.54E-03 3.66E-01
DPT - 13 25' Fine SAND with SILT 374.1 6.99E-03 5.39E-03 3.66E-01
DPT - 26 14' Fine SAND with SILT 323.5 6.88E-03 6.37E-03 3.11E-01
DPT - 27 23’ Fine to Very Fine SAND with
SILT 446.8 8.66E-03 8.99E-03 3.28E-01
DPT - 27 24' Fine to Very Fine SAND with
SILT 380.4 8.97E-03 9.68E-03 3.68E-01
DPT - 27 28' Fine to Very Fine SAND with
SILT 462.4 1.00E-02 9.35E-03 3.38E-01
DPT - 27 44' SAND and SILT 366.5 7.67E-03 8.85E-03 3.85E-01
DPT - 27 49' SAND and SILT 373.6 7.90E-03 9.03E-03 3.97E-01
DPT - 27 59' SAND and SILT 304.5 6.31E-03 8.67E-03 3.60E-01
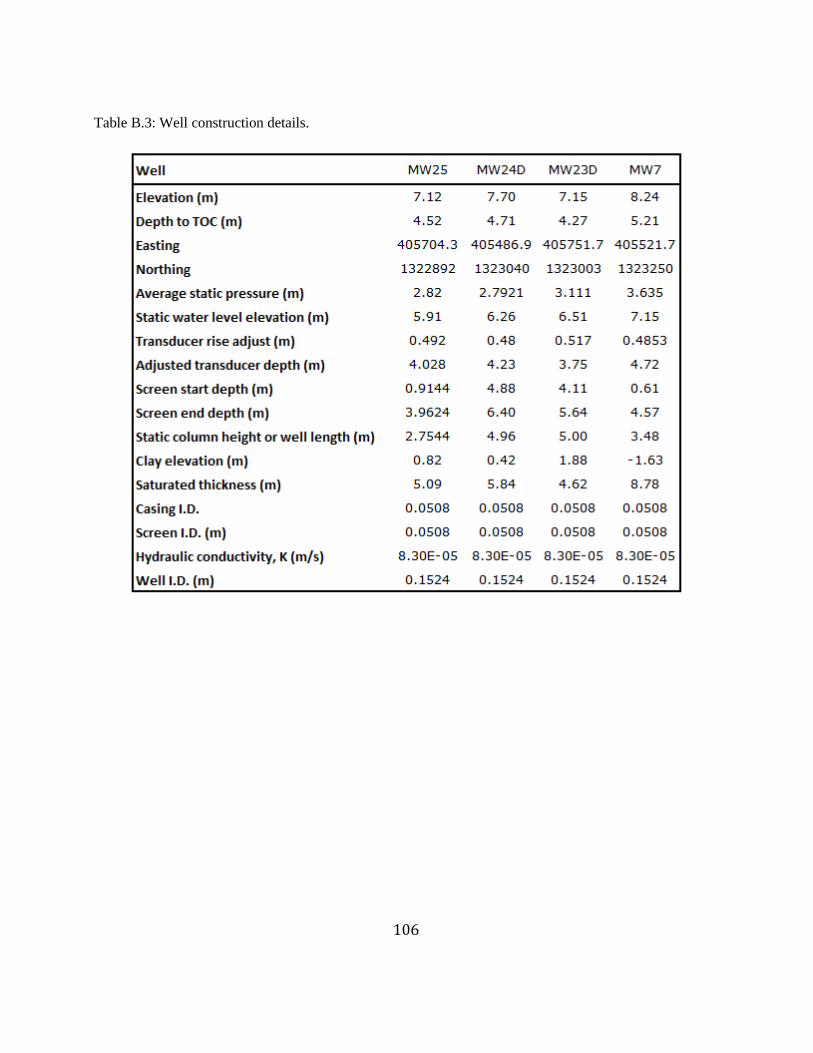
106
Table B.3: Well construction details.
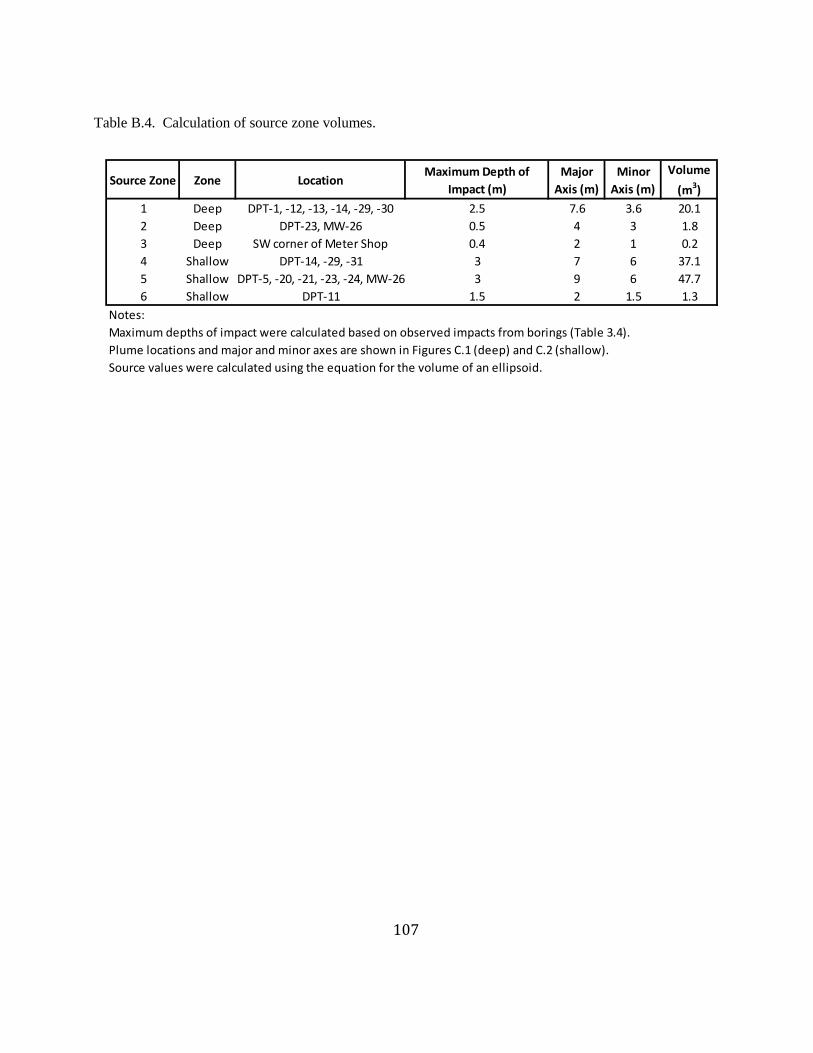
107
Table B.4. Calculation of source zone volumes.
Source Zone Zone LocationMaximum Depth of
Impact (m)
Major
Axis (m)
Minor
Axis (m)
Volume
(m3)
1 Deep DPT-1, -12, -13, -14, -29, -30 2.5 7.6 3.6 20.1
2 Deep DPT-23, MW-26 0.5 4 3 1.8
3 Deep SW corner of Meter Shop 0.4 2 1 0.2
4 Shallow DPT-14, -29, -31 3 7 6 37.1
5 Shallow DPT-5, -20, -21, -23, -24, MW-26 3 9 6 47.7
6 Shallow DPT-11 1.5 2 1.5 1.3
Notes:
Maximum depths of impact were calculated based on observed impacts from borings (Table 3.4).
Plume locations and major and minor axes are shown in Figures C.1 (deep) and C.2 (shallow).
Source values were calculated using the equation for the volume of an ellipsoid.
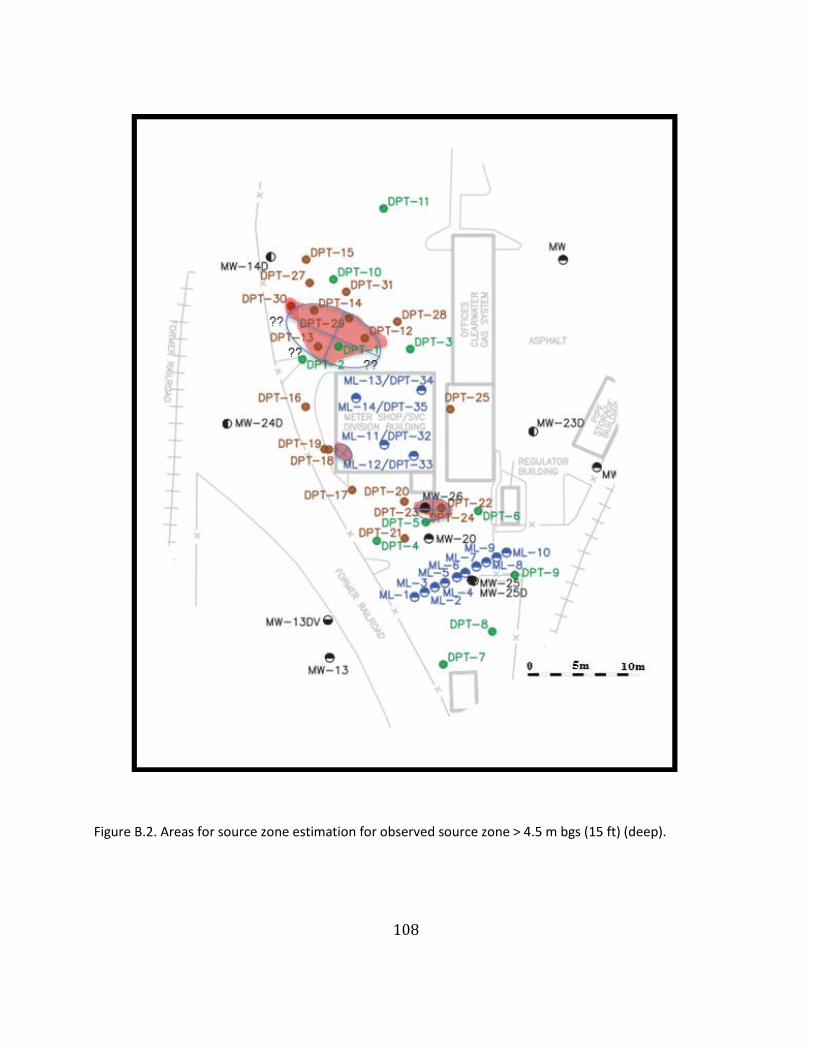
108
Figure B.2. Areas for source zone estimation for observed source zone > 4.5 m bgs (15 ft) (deep).

109
Figure B.3. Areas for source zone estimation for observed source zone >4.5 m bgs (15 ft) (shallow).
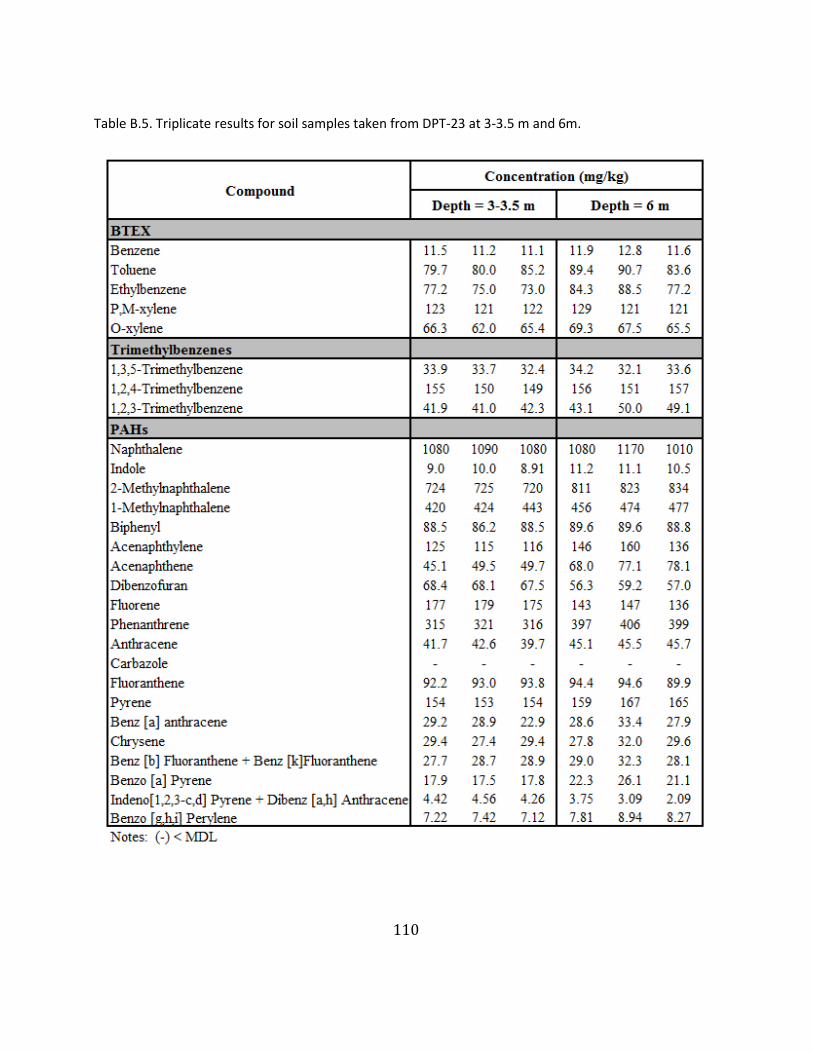
110
Table B.5. Triplicate results for soil samples taken from DPT-23 at 3-3.5 m and 6m.

111
Table B.6. ANOVA analysis for soil samples taken from DPT-23 at depths of 3.5 and 6 m.
Table B.7. Field parameters for monitoring wells on-site.
Table B.8. ANOVA for mass discharge calculations across sampling events.
Source of Variation SS df MS F P-value F crit
Between Groups 1583.766 1 1583.766 0.025476 0.873804 4.026631
Within Groups 3232645 52 62166.25
Total 3234229 53
Sampling Episode Source of Variation SS df MS F P-value F crit
Between Groups 26.09606 1 26.09606 0.299902 0.586045 4.006873
Within Groups 5046.891 58 87.01536
Total 5072.987 59
Between Groups 33.86982 1 33.86982 0.395925 0.531672 4.006873
Within Groups 4961.67 58 85.54604
Total 4995.54 59
Between Groups 0.506017 1 0.506017 0.009885 0.921146 4.006873
Within Groups 2969.141 58 51.19208
Total 2969.647 59
2 & 3
1 & 2
1 & 3
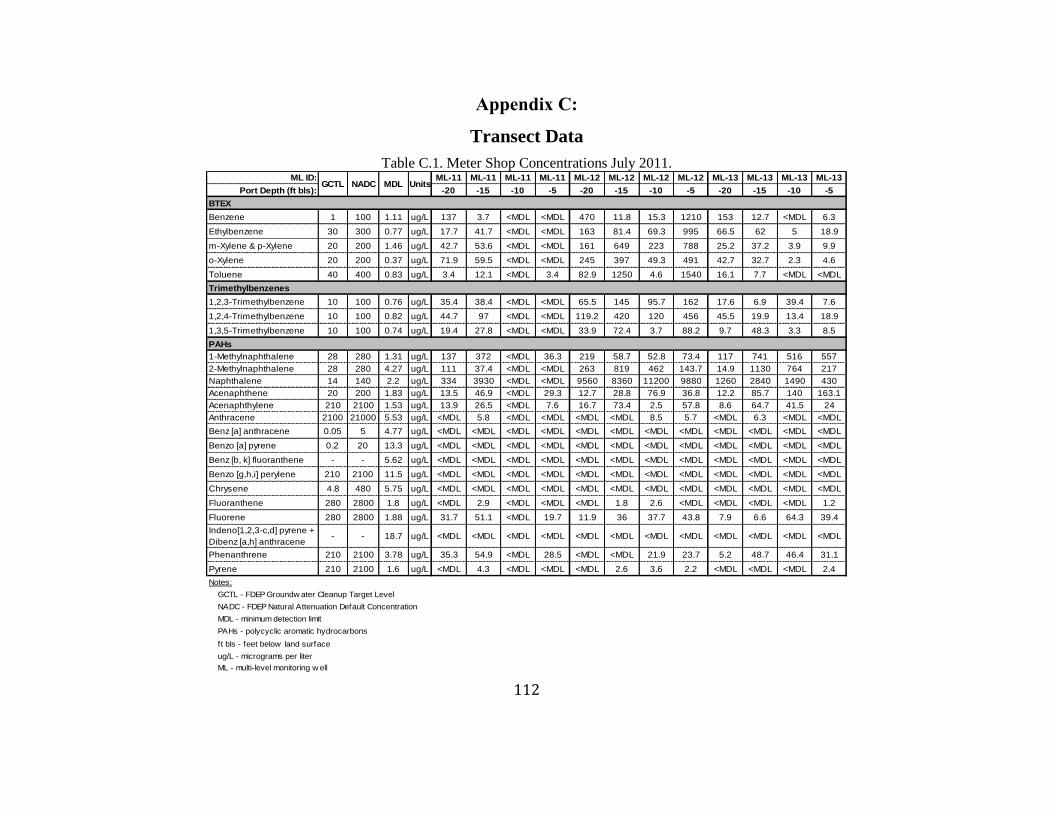
112
Appendix C:
Transect Data
Table C.1. Meter Shop Concentrations July 2011.ML ID: ML-11 ML-11 ML-11 ML-11 ML-12 ML-12 ML-12 ML-12 ML-13 ML-13 ML-13 ML-13
Port Depth (ft bls): -20 -15 -10 -5 -20 -15 -10 -5 -20 -15 -10 -5
BTEX
Benzene 1 100 1.11 ug/L 137 3.7 <MDL <MDL 470 11.8 15.3 1210 153 12.7 <MDL 6.3
Ethylbenzene 30 300 0.77 ug/L 17.7 41.7 <MDL <MDL 163 81.4 69.3 995 66.5 62 5 18.9
m-Xylene & p-Xylene 20 200 1.46 ug/L 42.7 53.6 <MDL <MDL 161 649 223 788 25.2 37.2 3.9 9.9
o-Xylene 20 200 0.37 ug/L 71.9 59.5 <MDL <MDL 245 397 49.3 491 42.7 32.7 2.3 4.6
Toluene 40 400 0.83 ug/L 3.4 12.1 <MDL 3.4 82.9 1250 4.6 1540 16.1 7.7 <MDL <MDL
Trimethylbenzenes
1,2,3-Trimethylbenzene 10 100 0.76 ug/L 35.4 38.4 <MDL <MDL 65.5 145 95.7 162 17.6 6.9 39.4 7.6
1,2,4-Trimethylbenzene 10 100 0.82 ug/L 44.7 97 <MDL <MDL 119.2 420 120 456 45.5 19.9 13.4 18.9
1,3,5-Trimethylbenzene 10 100 0.74 ug/L 19.4 27.8 <MDL <MDL 33.9 72.4 3.7 88.2 9.7 48.3 3.3 8.5
PAHs
1-Methylnaphthalene 28 280 1.31 ug/L 137 372 <MDL 36.3 219 58.7 52.8 73.4 117 741 516 557
2-Methylnaphthalene 28 280 4.27 ug/L 111 37.4 <MDL <MDL 263 819 462 143.7 14.9 1130 764 217
Naphthalene 14 140 2.2 ug/L 334 3930 <MDL <MDL 9560 8360 11200 9880 1260 2840 1490 430
Acenaphthene 20 200 1.83 ug/L 13.5 46.9 <MDL 29.3 12.7 28.8 76.9 36.8 12.2 85.7 140 163.1
Acenaphthylene 210 2100 1.53 ug/L 13.9 26.5 <MDL 7.6 16.7 73.4 2.5 57.8 8.6 64.7 41.5 24
Anthracene 2100 21000 5.53 ug/L <MDL 5.8 <MDL <MDL <MDL <MDL 8.5 5.7 <MDL 6.3 <MDL <MDL
Benz [a] anthracene 0.05 5 4.77 ug/L <MDL <MDL <MDL <MDL <MDL <MDL <MDL <MDL <MDL <MDL <MDL <MDL
Benzo [a] pyrene 0.2 20 13.3 ug/L <MDL <MDL <MDL <MDL <MDL <MDL <MDL <MDL <MDL <MDL <MDL <MDL
Benz [b, k] fluoranthene - - 5.62 ug/L <MDL <MDL <MDL <MDL <MDL <MDL <MDL <MDL <MDL <MDL <MDL <MDL
Benzo [g,h,i] perylene 210 2100 11.5 ug/L <MDL <MDL <MDL <MDL <MDL <MDL <MDL <MDL <MDL <MDL <MDL <MDL
Chrysene 4.8 480 5.75 ug/L <MDL <MDL <MDL <MDL <MDL <MDL <MDL <MDL <MDL <MDL <MDL <MDL
Fluoranthene 280 2800 1.8 ug/L <MDL 2.9 <MDL <MDL <MDL 1.8 2.6 <MDL <MDL <MDL <MDL 1.2
Fluorene 280 2800 1.88 ug/L 31.7 51.1 <MDL 19.7 11.9 36 37.7 43.8 7.9 6.6 64.3 39.4
Indeno[1,2,3-c,d] pyrene +
Dibenz [a,h] anthracene- - 18.7 ug/L <MDL <MDL <MDL <MDL <MDL <MDL <MDL <MDL <MDL <MDL <MDL <MDL
Phenanthrene 210 2100 3.78 ug/L 35.3 54.9 <MDL 28.5 <MDL <MDL 21.9 23.7 5.2 48.7 46.4 31.1
Pyrene 210 2100 1.6 ug/L <MDL 4.3 <MDL <MDL <MDL 2.6 3.6 2.2 <MDL <MDL <MDL 2.4
Notes:
GCTL - FDEP Groundw ater Cleanup Target Level
NADC - FDEP Natural Attenuation Default Concentration
MDL - minimum detection limit
PAHs - polycyclic aromatic hydrocarbons
ft bls - feet below land surface
ug/L - micrograms per liter
ML - multi-level monitoring w ell
GCTL NADC MDL Units

113
Table C.2. Meter shop concentrations November 2011.
ML ID: GCTL NADC MDL Units ML-11 ML-11 ML-11 ML-11 ML-12 ML-12 ML-12 ML-12 ML-13 ML-13 ML-13 ML-13 ML-14 ML-14 ML-14 ML-14
Port Depth (ft bls): -20 -15 -10 -5 -20 -15 -10 -5 -20 -15 -10 -5 -20 -15 -10 -5
BTEX
Benzene 1 100 1.11 ug/L 114 1.7 <MDL <MDL 180 1420 - 52 188 5.7 2.3 3.3 <MDL 2.3 <MDL <MDL
Ethylbenzene 30 300 0.77 ug/L 16.6 22.7 <MDL <MDL 13.7 772 52 422 89.8 32.4 5.9 6.3 1.3 <MDL <MDL <MDL
m-Xylene & p-Xylene 20 200 1.46 ug/L 38.6 27.9 <MDL <MDL 16.2 618 175 331 36.1 2.3 3.5 2.7 <MDL <MDL <MDL <MDL
o-Xylene 20 200 0.37 ug/L 67.4 35.9 1.5 <MDL 18.5 383 38.2 221 52.2 17.3 2.3 <MDL <MDL <MDL <MDL <MDL
Toluene 40 400 0.83 ug/L 3.4 8.7 <MDL <MDL 17.5 1570 9.6 164 13.3 4.2 0.9 <MDL <MDL <MDL <MDL <MDL
Trimethylbenzenes
1,2,3-Trimethylbenzene 10 100 0.76 ug/L 29.6 34.3 1.8 1.7 2.6 916 78.5 152 29.2 33.4 4.1 9.6 <MDL <MDL <MDL <MDL
1,2,4-Trimethylbenzene 10 100 0.82 ug/L 39.8 49.6 2.2 2.4 3.4 261 89.7 445 85.1 110 13.3 19.9 <MDL <MDL <MDL <MDL
1,3,5-Trimethylbenzene 10 100 0.74 ug/L 14.2 14.1 <MDL <MDL <MDL 51.7 2.6 74.9 18.2 26.6 4.3 5.8 <MDL <MDL <MDL <MDL
PAHs
1-Methylnaphthalene 28 280 1.31 ug/L 188 374 83.7 120 21.9 789 566 142 577 79.4 392 728 3.9 6.7 43.4 134
2-Methylnaphthalene 28 280 4.27 ug/L 131 122 5.2 5.5 19.4 155 419 1940 726 1150 583 393 <MDL 6.3 <MDL <MDL
Naphthalene 14 140 2.2 ug/L 3160 145.1 25.8 13.4 897 7490 9680 12000 2550 1960 260 191 6.9 11.3 3.5 3.7
Acenaphthene 20 200 1.83 ug/L 43.4 4.3 29.2 44 4.3 36.6 85.3 75.8 53.3 9.9 84.8 197 17.2 1.9 2.2 4.3
Acenaphthylene 210 2100 1.53 ug/L 14.5 27.9 13.9 21.8 2.8 83 29.4 141 39.6 54.2 38.3 23.7 <MDL <MDL <MDL <MDL
Anthracene 2100 21000 5.53 ug/L <MDL <MDL <MDL <MDL <MDL <MDL <MDL <MDL <MDL <MDL <MDL <MDL <MDL <MDL <MDL <MDL
Benz [a] anthracene 0.05 5 4.77 ug/L <MDL <MDL <MDL <MDL <MDL <MDL <MDL <MDL <MDL <MDL <MDL <MDL <MDL <MDL <MDL <MDL
Benzo [a] pyrene 0.2 20 13.33 ug/L <MDL <MDL <MDL <MDL <MDL <MDL <MDL <MDL <MDL <MDL <MDL <MDL <MDL <MDL <MDL <MDL
Benz [b, k] fluoranthene - - 5.62 ug/L <MDL <MDL <MDL <MDL <MDL <MDL <MDL <MDL <MDL <MDL <MDL <MDL <MDL <MDL <MDL <MDL
Benzo [g,h,i] perylene 210 2100 11.49 ug/L <MDL <MDL <MDL <MDL <MDL <MDL <MDL <MDL <MDL <MDL <MDL <MDL <MDL <MDL <MDL <MDL
Chrysene 4.8 480 5.75 ug/L <MDL <MDL <MDL <MDL <MDL <MDL <MDL <MDL <MDL <MDL <MDL <MDL <MDL <MDL <MDL <MDL
Fluoranthene 280 2800 1.8 ug/L <MDL 2.5 <MDL <MDL <MDL 2.4 1.8 2.5 <MDL <MDL <MDL <MDL <MDL <MDL <MDL <MDL
Fluorene 280 2800 1.88 ug/L 3.4 51.3 37.7 59.5 <MDL 4.9 38.8 75.3 36.7 54.8 61 41.9 <MDL <MDL <MDL <MDL
Indeno[1,2,3-c,d] pyrene +
Dibenz [a,h] anthracene- - 18.65 ug/L <MDL <MDL <MDL <MDL <MDL <MDL <MDL <MDL <MDL <MDL <MDL <MDL <MDL <MDL <MDL <MDL
Phenanthrene 210 2100 3.78 ug/L 19.2 50.1 26.2 42.4 <MDL 19.9 15.3 29.6 14.7 35.4 32.2 27 <MDL <MDL <MDL <MDL
Pyrene 210 2100 1.6 ug/L <MDL 3.5 1.7 2.7 <MDL 2.7 1.8 1.8 <MDL <MDL <MDL 3 <MDL <MDL <MDL <MDL
Notes:
GCTL - FDEP Groundw ater Cleanup Target Level
NADC - FDEP Natural Attenuation Default Concentration
MDL - minimum detection limit
PAHs - polycyclic aromatic hydrocarbons
ft bls - feet below land surface
ug/L - micrograms per liter
ML - multi-level monitoring w ell

114
Table C.3 Meter shop groundwater concentrations Feb 2012.
ML ID: GCTL NADC MDL Units ML-11 ML-11 ML-11 ML-11 ML-12 ML-12 ML-12 ML-12 ML-13 ML-13 ML-13 ML-13 ML-14 ML-14 ML-14 ML-14
Port Depth (ft bls): -20 -15 -10 -5 -20 -15 -10 -5 -20 -15 -10 -5 -20 -15 -10 -5
BTEX
Benzene 1 100 1.11 ug/L 1.6 < MDL < MDL <MDL 382 184 1.3 123 154 12.5 4.9 2.7 <MDL <MDL <MDL <MDL
Ethylbenzene 30 300 0.77 ug/L 12.9 <MDL <MDL <MDL 13.7 130 92.3 752 69.2 24.1 4.2 21.3 <MDL <MDL <MDL <MDL
m-Xylene & p-Xylene 20 200 1.46 ug/L 12.1 1.7 <MDL <MDL 66.6 819 39.4 612 28.5 14.8 3.2 4.6 1.8 <MDL <MDL <MDL
o-Xylene 20 200 0.37 ug/L 31.2 <MDL <MDL <MDL 86 495 1.7 368 41.2 13.4 2.8 4.5 1.4 <MDL 7.8 <MDL
Toluene 40 400 0.83 ug/L 5.6 <MDL <MDL <MDL 2.8 265 4.1 549 11.5 4.9 2.8 2.2 <MDL 7.8 <MDL <MDL
Trimethylbenzenes
1,2,3-Trimethylbenzene 10 100 0.76 ug/L 12.5 4.7 <MDL <MDL 22.3 119 12.9 17.9 21.3 27.5 4.2 11.5 <MDL <MDL <MDL <MDL
1,2,4-Trimethylbenzene 10 100 0.82 ug/L 39.5 7 <MDL <MDL 44.9 363 2.7 500 62.8 95.9 15.7 33.1 1.4 <MDL <MDL <MDL
1,3,5-Trimethylbenzene 10 100 0.74 ug/L 2 2.6 <MDL <MDL 13 68.7 5.2 95.3 15 28.9 6.3 15 <MDL <MDL <MDL <MDL
PAHs
1-Methylnaphthalene 28 280 1.31 ug/L 246 114 12 <MDL 174 12.6 115 1550 564 1250 848 115 11.9 2.3 81.2 <MDL
2-Methylnaphthalene 28 280 4.27 ug/L 218 9.2 6.8 <MDL 27.3 147.1 18.4 229.3 698 1830 1280 595 6.6 <MDL <MDL <MDL
Naphthalene 14 140 2.2 ug/L 1590 34.9 6.7 <MDL 3450 9500 1720 12700 295 1810 385 77.6 8 3.8 5.8 <MDL
Acenaphthene 20 200 1.83 ug/L 25.9 45.6 63.8 <MDL 6.3 24.8 14.3 32.5 53.9 142 238 332 3.4 <MDL 1.9 <MDL
Acenaphthylene 210 2100 1.53 ug/L 18.4 23.1 13.3 <MDL 9.2 129.3 21.9 124.1 29.7 76.5 63.3 45.9 <MDL <MDL <MDL <MDL
Anthracene 2100 21000 5.53 ug/L <MDL < MDL <MDL <MDL <MDL 2.3 1.8 <MDL 4.9 3.2 <MDL <MDL <MDL <MDL <MDL <MDL
Benz [a] anthracene 0.05 5 4.77 ug/L <MDL <MDL <MDL <MDL <MDL <MDL <MDL <MDL <MDL <MDL <MDL <MDL <MDL <MDL <MDL <MDL
Benzo [a] pyrene 0.2 20 13.3 ug/L <MDL <MDL <MDL <MDL <MDL <MDL <MDL <MDL <MDL <MDL <MDL <MDL <MDL <MDL <MDL <MDL
Benz [b, k] fluoranthene - - 5.62 ug/L <MDL <MDL <MDL <MDL <MDL <MDL <MDL <MDL <MDL <MDL <MDL <MDL <MDL <MDL <MDL <MDL
Benzo [g,h,i] perylene 210 2100 11.5 ug/L <MDL <MDL <MDL <MDL <MDL <MDL <MDL <MDL <MDL <MDL <MDL <MDL <MDL <MDL <MDL <MDL
Chrysene 4.8 480 5.75 ug/L <MDL <MDL <MDL <MDL <MDL <MDL <MDL <MDL <MDL <MDL <MDL <MDL <MDL <MDL <MDL <MDL
Fluoranthene 280 2800 1.8 ug/L 2.3 3.3 <MDL <MDL <MDL 1.8 <MDL 2.6 <MDL <MDL 2.4 3.2 <MDL <MDL <MDL <MDL
Fluorene 280 2800 1.88 ug/L 30 7.9 35.6 <MDL <MDL 54.4 8.7 87.1 36.5 9.7 113 73.9 <MDL <MDL <MDL <MDL
Indeno[1,2,3-c,d] pyrene +
Dibenz [a,h] anthracene- - 18.7 ug/L <MDL <MDL <MDL <MDL <MDL <MDL <MDL <MDL <MDL <MDL <MDL <MDL <MDL <MDL <MDL <MDL
Phenanthrene 210 2100 3.78 ug/L 27.9 58.3 38.5 <MDL <MDL 26.6 <MDL 38.5 <MDL 65.1 7.5 45 <MDL <MDL <MDL <MDL
Pyrene 210 2100 1.6 ug/L 2.8 3.8 <MDL <MDL <MDL 1.6 <MDL 2.5 <MDL 1.6 <MDL 5.3 <MDL <MDL <MDL <MDL
Notes:
GCTL - FDEP Groundw ater Cleanup Target Level
NADC - FDEP Natural Attenuation Default Concentration
MDL - minimum detection limit
PAHs - polycyclic aromatic hydrocarbons
ft bls - feet below land surface
ug/L - micrograms per liter
ML - multi-level monitoring w ell
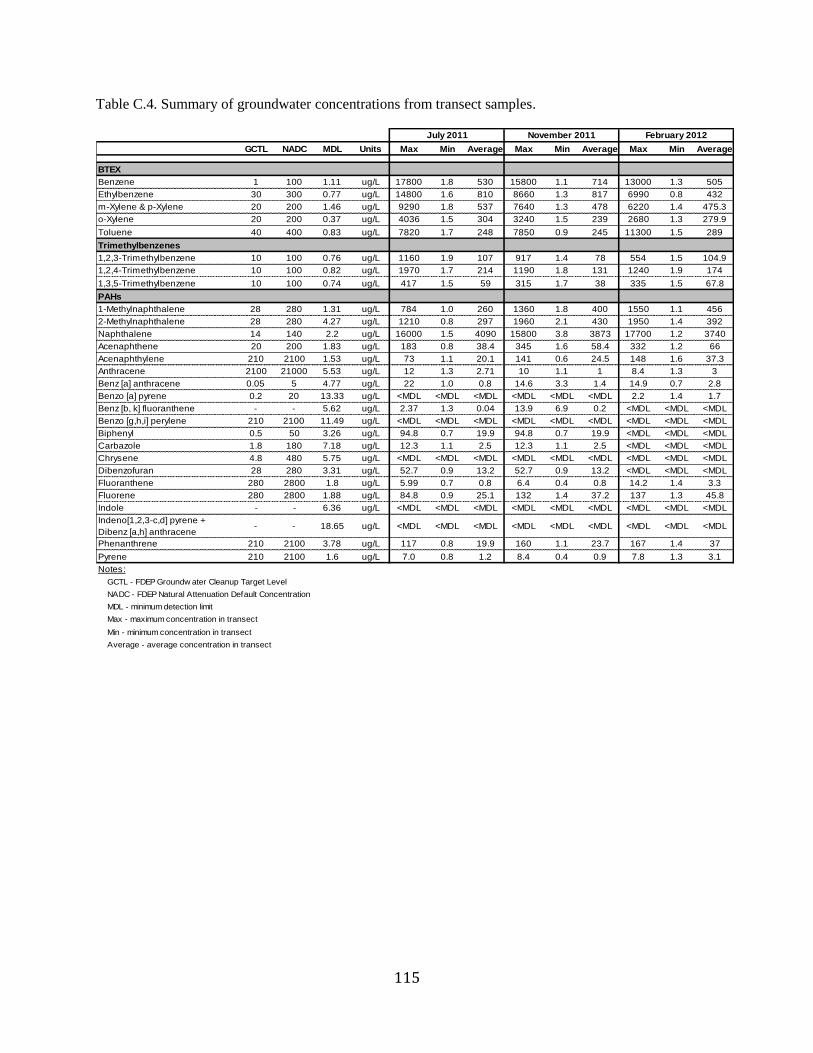
115
Table C.4. Summary of groundwater concentrations from transect samples.
GCTL NADC MDL Units Max Min Average Max Min Average Max Min Average
BTEX
Benzene 1 100 1.11 ug/L 17800 1.8 530 15800 1.1 714 13000 1.3 505
Ethylbenzene 30 300 0.77 ug/L 14800 1.6 810 8660 1.3 817 6990 0.8 432
m-Xylene & p-Xylene 20 200 1.46 ug/L 9290 1.8 537 7640 1.3 478 6220 1.4 475.3
o-Xylene 20 200 0.37 ug/L 4036 1.5 304 3240 1.5 239 2680 1.3 279.9
Toluene 40 400 0.83 ug/L 7820 1.7 248 7850 0.9 245 11300 1.5 289
Trimethylbenzenes
1,2,3-Trimethylbenzene 10 100 0.76 ug/L 1160 1.9 107 917 1.4 78 554 1.5 104.9
1,2,4-Trimethylbenzene 10 100 0.82 ug/L 1970 1.7 214 1190 1.8 131 1240 1.9 174
1,3,5-Trimethylbenzene 10 100 0.74 ug/L 417 1.5 59 315 1.7 38 335 1.5 67.8
PAHs
1-Methylnaphthalene 28 280 1.31 ug/L 784 1.0 260 1360 1.8 400 1550 1.1 456
2-Methylnaphthalene 28 280 4.27 ug/L 1210 0.8 297 1960 2.1 430 1950 1.4 392
Naphthalene 14 140 2.2 ug/L 16000 1.5 4090 15800 3.8 3873 17700 1.2 3740
Acenaphthene 20 200 1.83 ug/L 183 0.8 38.4 345 1.6 58.4 332 1.2 66
Acenaphthylene 210 2100 1.53 ug/L 73 1.1 20.1 141 0.6 24.5 148 1.6 37.3
Anthracene 2100 21000 5.53 ug/L 12 1.3 2.71 10 1.1 1 8.4 1.3 3
Benz [a] anthracene 0.05 5 4.77 ug/L 22 1.0 0.8 14.6 3.3 1.4 14.9 0.7 2.8
Benzo [a] pyrene 0.2 20 13.33 ug/L <MDL <MDL <MDL <MDL <MDL <MDL 2.2 1.4 1.7
Benz [b, k] fluoranthene - - 5.62 ug/L 2.37 1.3 0.04 13.9 6.9 0.2 <MDL <MDL <MDL
Benzo [g,h,i] perylene 210 2100 11.49 ug/L <MDL <MDL <MDL <MDL <MDL <MDL <MDL <MDL <MDL
Biphenyl 0.5 50 3.26 ug/L 94.8 0.7 19.9 94.8 0.7 19.9 <MDL <MDL <MDL
Carbazole 1.8 180 7.18 ug/L 12.3 1.1 2.5 12.3 1.1 2.5 <MDL <MDL <MDL
Chrysene 4.8 480 5.75 ug/L <MDL <MDL <MDL <MDL <MDL <MDL <MDL <MDL <MDL
Dibenzofuran 28 280 3.31 ug/L 52.7 0.9 13.2 52.7 0.9 13.2 <MDL <MDL <MDL
Fluoranthene 280 2800 1.8 ug/L 5.99 0.7 0.8 6.4 0.4 0.8 14.2 1.4 3.3
Fluorene 280 2800 1.88 ug/L 84.8 0.9 25.1 132 1.4 37.2 137 1.3 45.8
Indole - - 6.36 ug/L <MDL <MDL <MDL <MDL <MDL <MDL <MDL <MDL <MDL
Indeno[1,2,3-c,d] pyrene +
Dibenz [a,h] anthracene- - 18.65 ug/L <MDL <MDL <MDL <MDL <MDL <MDL <MDL <MDL <MDL
Phenanthrene 210 2100 3.78 ug/L 117 0.8 19.9 160 1.1 23.7 167 1.4 37
Pyrene 210 2100 1.6 ug/L 7.0 0.8 1.2 8.4 0.4 0.9 7.8 1.3 3.1
Notes:
GCTL - FDEP Groundw ater Cleanup Target Level
NADC - FDEP Natural Attenuation Default Concentration
MDL - minimum detection limit
Max - maximum concentration in transect
Min - minimum concentration in transect
Average - average concentration in transect
July 2011 November 2011 February 2012
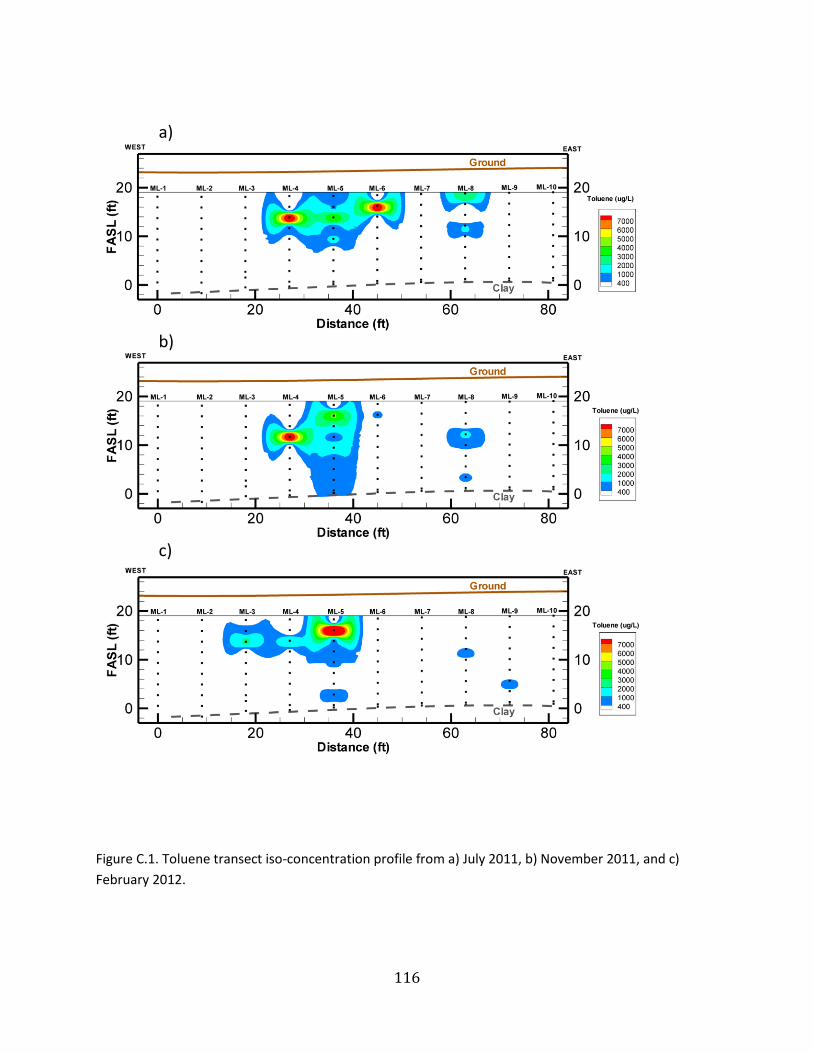
116
Figure C.1. Toluene transect iso-concentration profile from a) July 2011, b) November 2011, and c)
February 2012.
a)
b)
c)
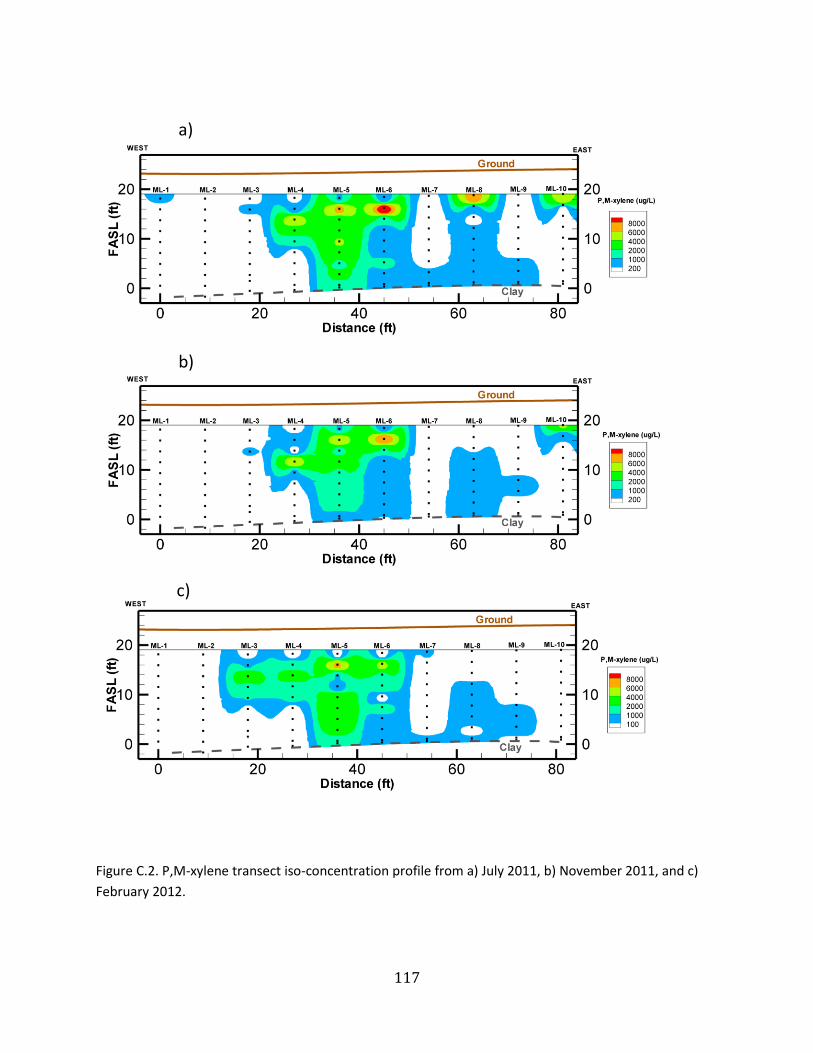
117
Figure C.2. P,M-xylene transect iso-concentration profile from a) July 2011, b) November 2011, and c)
February 2012.
a)
b)
c)

118
Figure C.3. o-xylene transect iso-concentration profile from a) July 2011, b) November 2011, and c)
February 2012.
a)
b)
c)
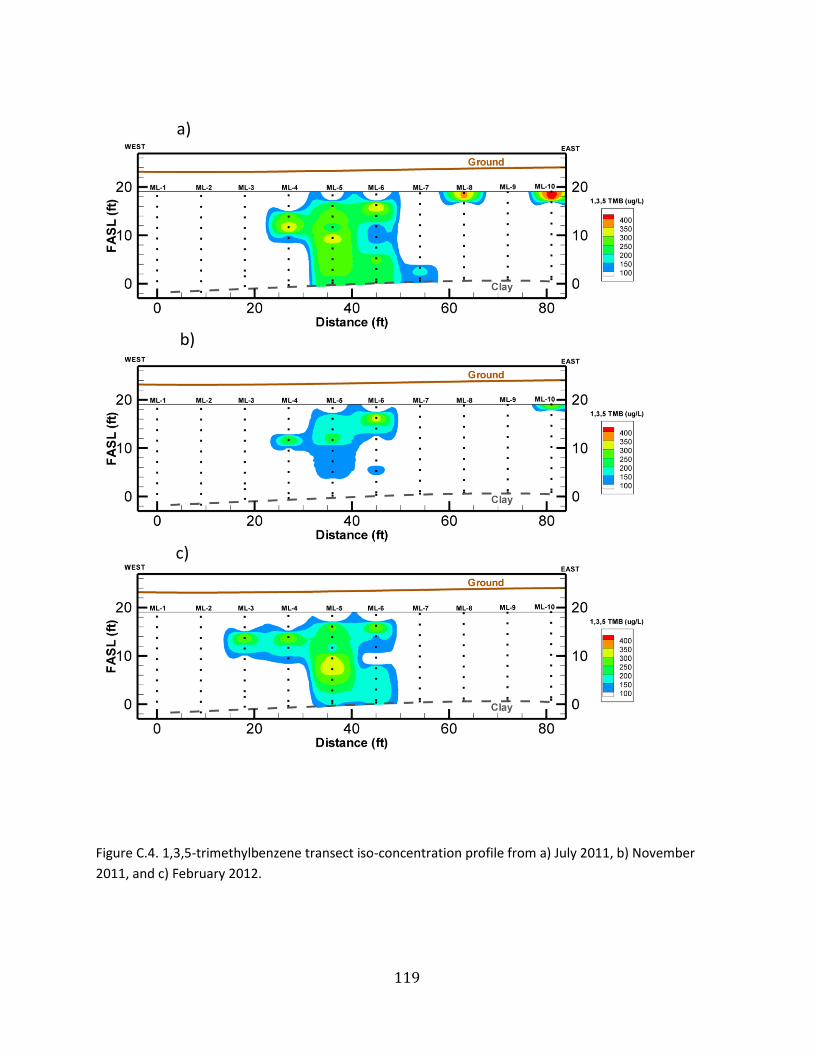
119
Figure C.4. 1,3,5-trimethylbenzene transect iso-concentration profile from a) July 2011, b) November
2011, and c) February 2012.
a)
b)
c)
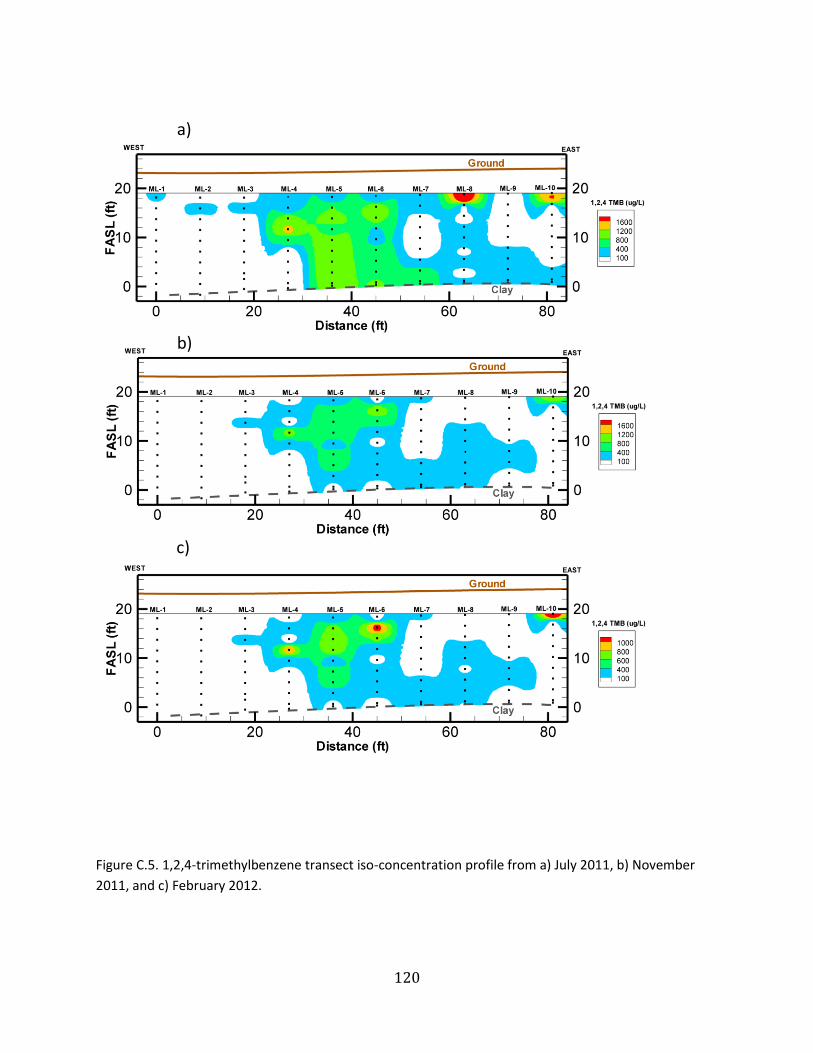
120
Figure C.5. 1,2,4-trimethylbenzene transect iso-concentration profile from a) July 2011, b) November
2011, and c) February 2012.
a)
b)
c)
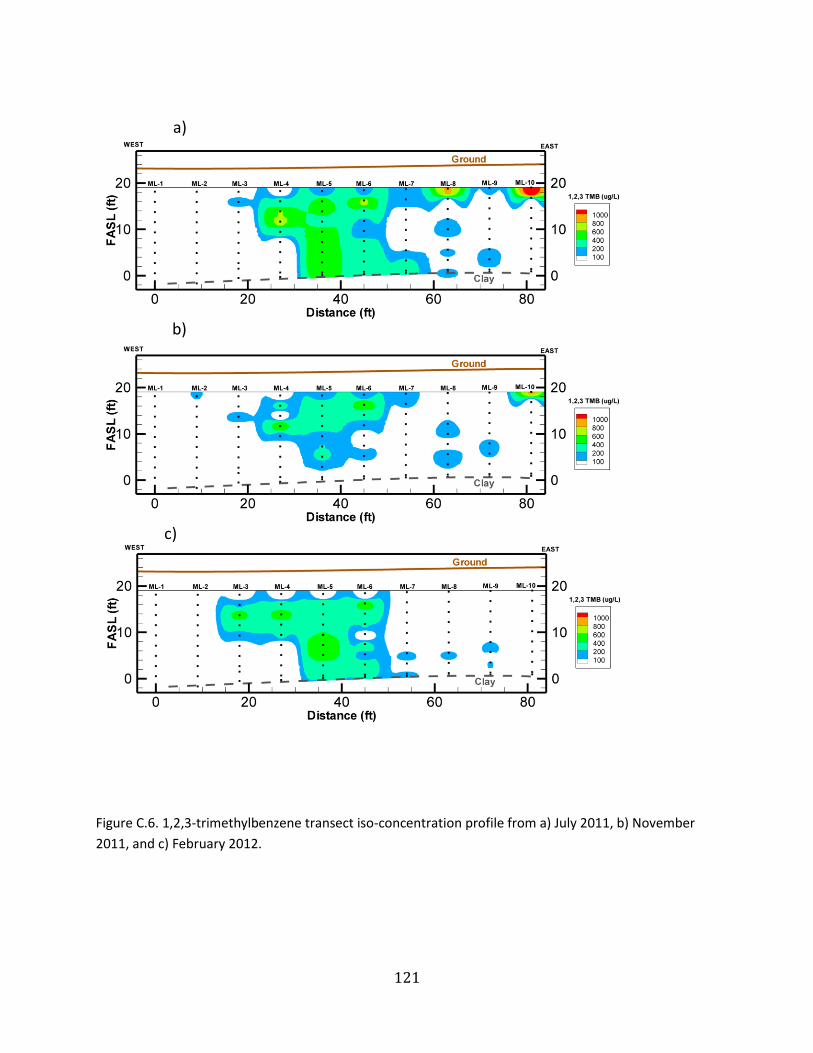
121
Figure C.6. 1,2,3-trimethylbenzene transect iso-concentration profile from a) July 2011, b) November
2011, and c) February 2012.
a)
b)
c)
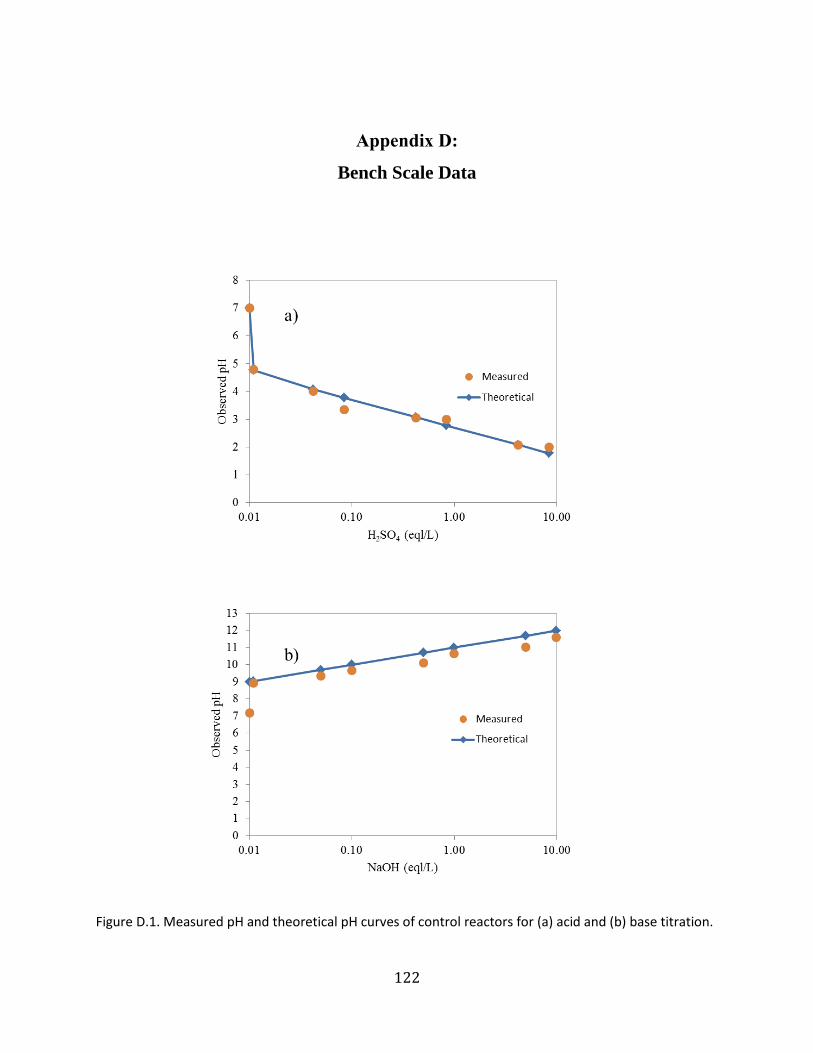
122
Appendix D:
Bench Scale Data
Figure D.1. Measured pH and theoretical pH curves of control reactors for (a) acid and (b) base titration.
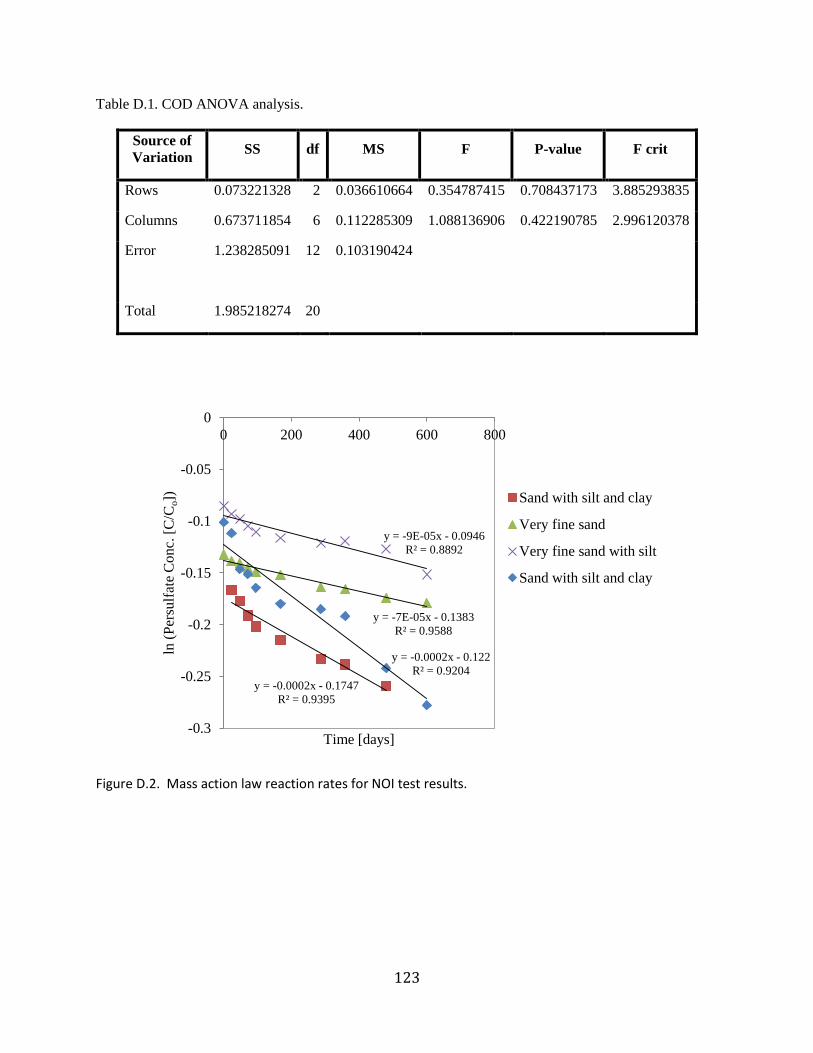
123
Table D.1. COD ANOVA analysis.
Source of
Variation SS df MS F P-value F crit
Rows 0.073221328 2 0.036610664 0.354787415 0.708437173 3.885293835
Columns 0.673711854 6 0.112285309 1.088136906 0.422190785 2.996120378
Error 1.238285091 12 0.103190424
Total 1.985218274 20
Figure D.2. Mass action law reaction rates for NOI test results.
y = -0.0002x - 0.1747
R² = 0.9395
y = -7E-05x - 0.1383
R² = 0.9588
y = -9E-05x - 0.0946
R² = 0.8892
y = -0.0002x - 0.122
R² = 0.9204
-0.3
-0.25
-0.2
-0.15
-0.1
-0.05
0
0 200 400 600 800
ln (
Per
sulf
ate
Conc.
[C
/Co])
Time [days]
Sand with silt and clay
Very fine sand
Very fine sand with silt
Sand with silt and clay
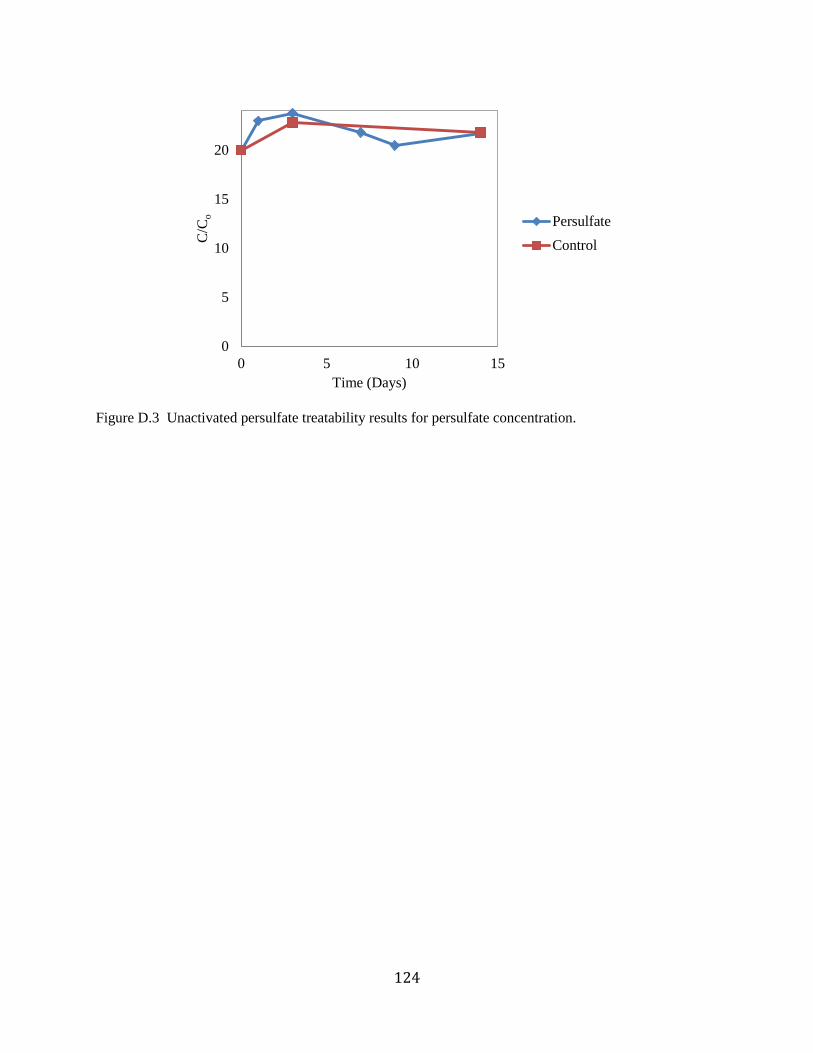
124
Figure D.3 Unactivated persulfate treatability results for persulfate concentration.
0
5
10
15
20
0 5 10 15
C/C
o
Time (Days)
Persulfate
Control
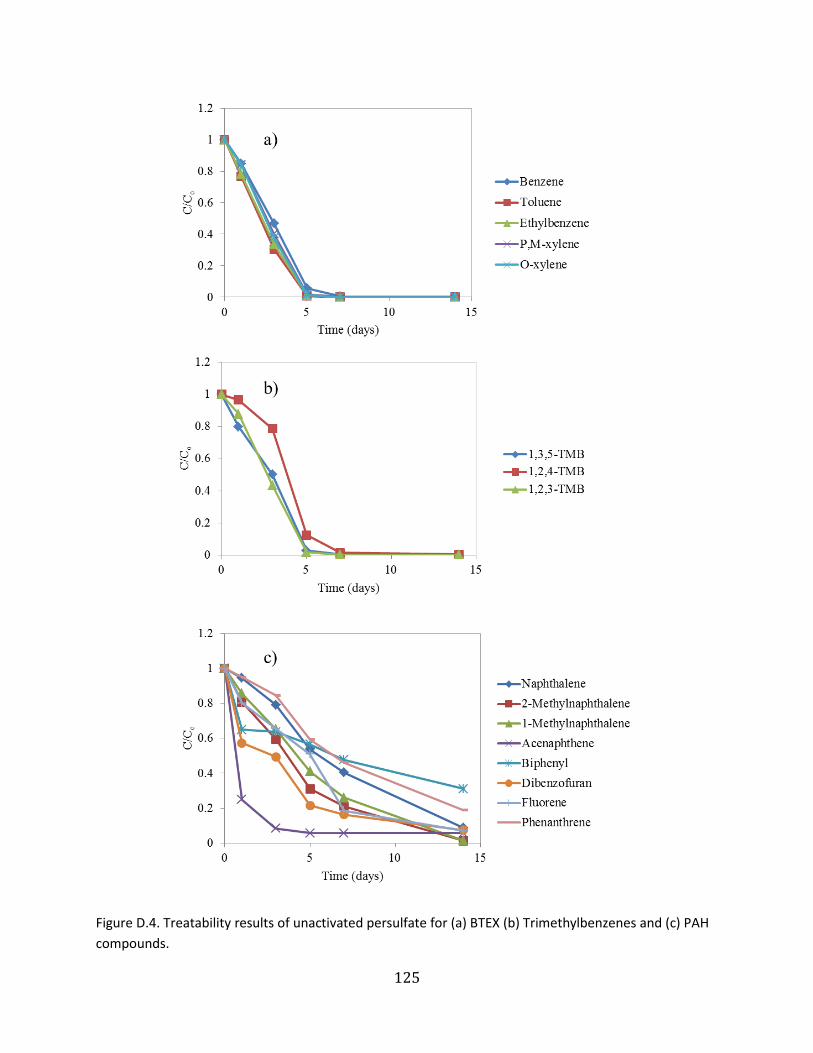
125
Figure D.4. Treatability results of unactivated persulfate for (a) BTEX (b) Trimethylbenzenes and (c) PAH
compounds.
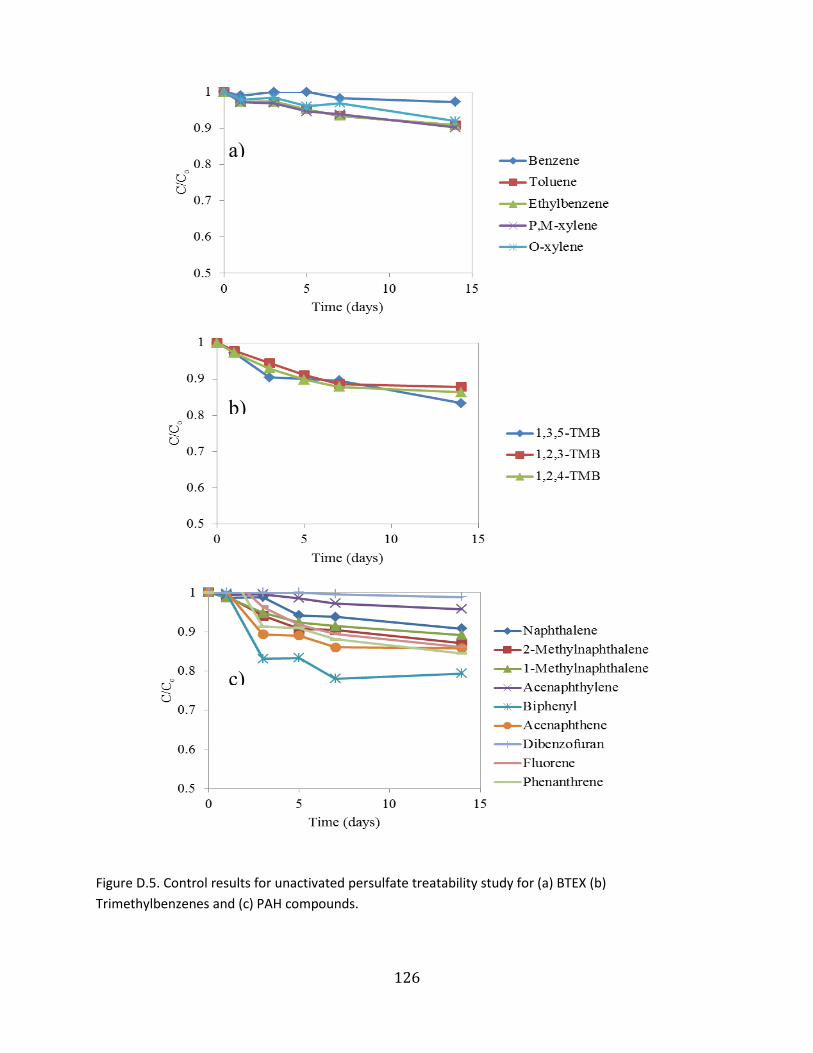
126
Figure D.5. Control results for unactivated persulfate treatability study for (a) BTEX (b)
Trimethylbenzenes and (c) PAH compounds.
c)
b)
a)
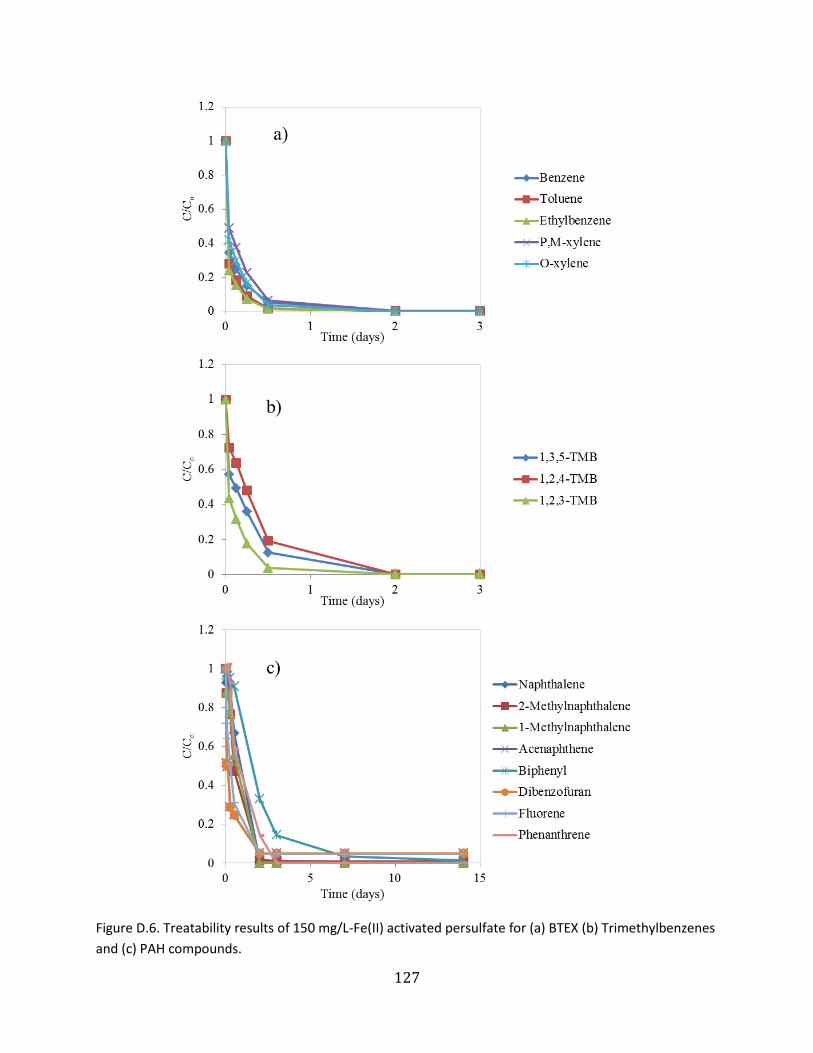
127
Figure D.6. Treatability results of 150 mg/L-Fe(II) activated persulfate for (a) BTEX (b) Trimethylbenzenes
and (c) PAH compounds.
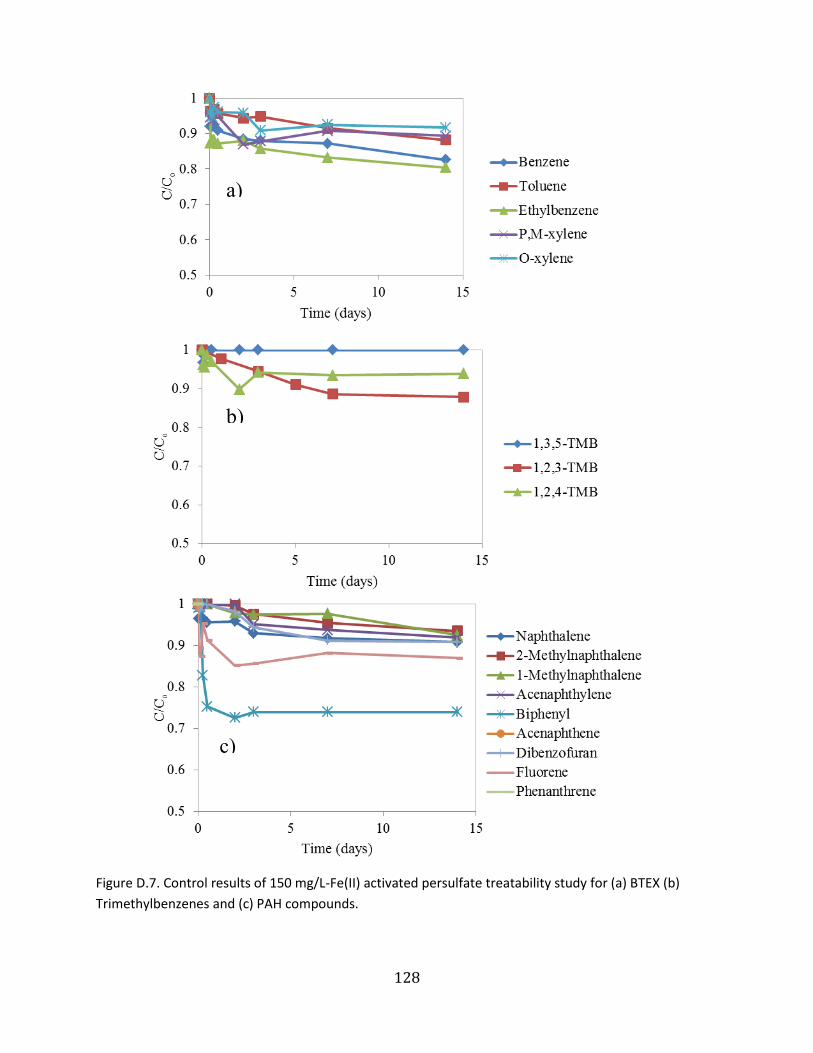
128
Figure D.7. Control results of 150 mg/L-Fe(II) activated persulfate treatability study for (a) BTEX (b)
Trimethylbenzenes and (c) PAH compounds.
b)
a)
c)

129
Figure D.8. Treatability results of 600 mg/L-Fe(II) activated persulfate for (a) BTEX (b) Trimethylbenzenes
and (c) PAH compounds.
0
0.2
0.4
0.6
0.8
1
0 1 2
C/C
o
Time (days)
BenzeneTolueneEthylbenzeneP,M-xyleneO-xyleneAcenaphthene
0
0.2
0.4
0.6
0.8
1
0 5 10 15
C/C
o
Time (days)
Naphthalene
2-Methylnaphthalene
1-Methylnaphthalene
Acenaphthene
Biphenyl
Dibenzofuran
Phenanthrene
0
0.2
0.4
0.6
0.8
1
0 1 2
C/C
o
Time (days)
1,3,5-TMB1,2,4-TMB1,2,3-TMB
a)
b)
c)
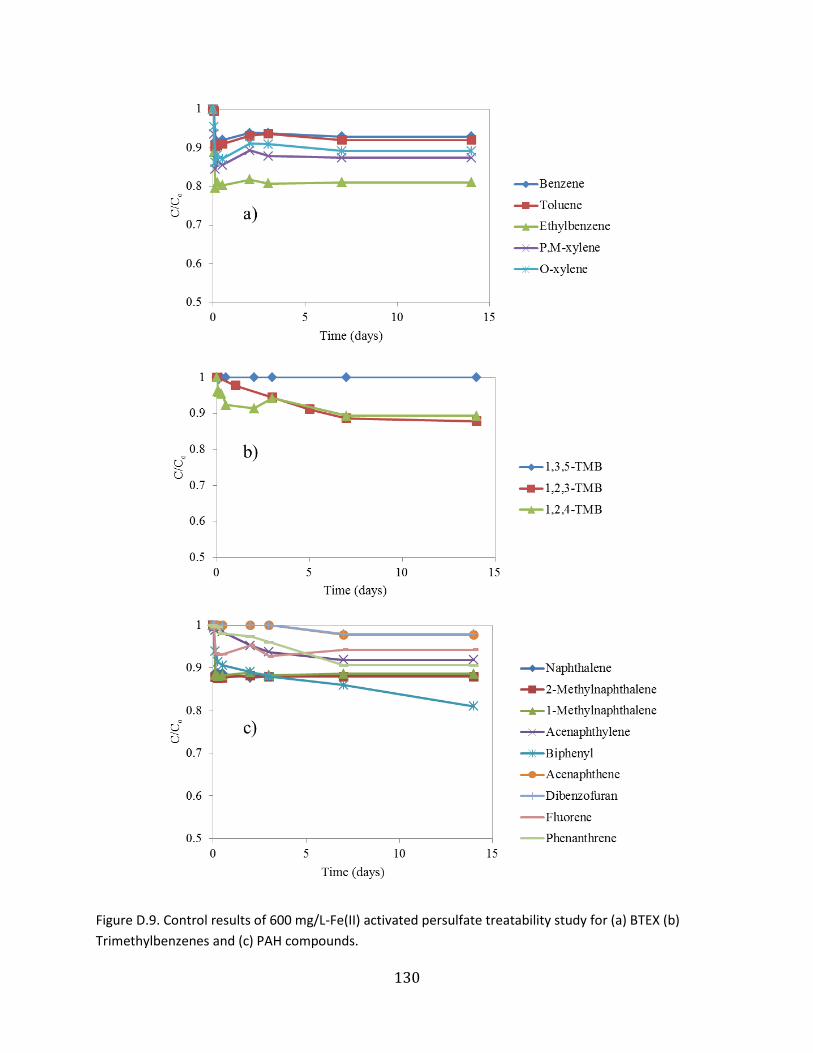
130
Figure D.9. Control results of 600 mg/L-Fe(II) activated persulfate treatability study for (a) BTEX (b)
Trimethylbenzenes and (c) PAH compounds.
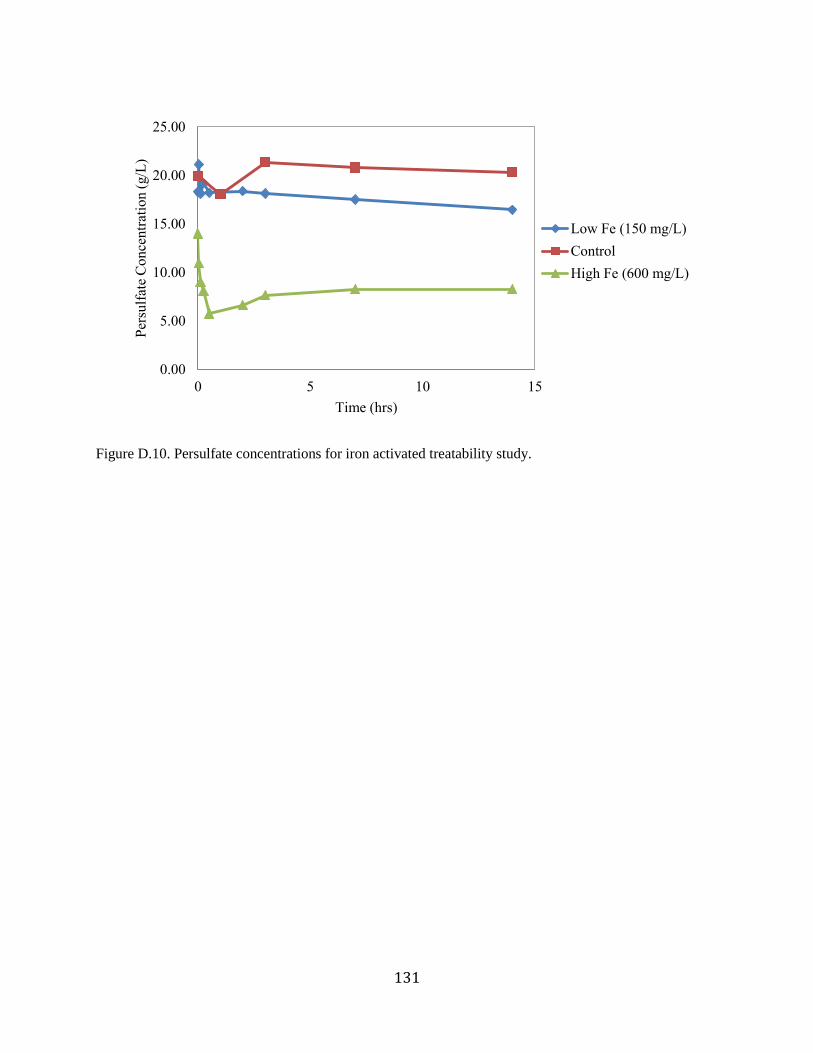
131
Figure D.10. Persulfate concentrations for iron activated treatability study.
0.00
5.00
10.00
15.00
20.00
25.00
0 5 10 15
Per
sulf
ate
Co
nce
ntr
atio
n (
g/L
)
Time (hrs)
Low Fe (150 mg/L)
Control
High Fe (600 mg/L)

132
Table D.2. Differential method to calculation reaction rate coefficient for benzene in high iron treatability
study.
Figure D.11. Best fit line to determine the reaction rate coefficient using the differential method for
benzene in high iron treatability study.
Time
(s)C (mg/L) dC/dt log(-dC/dt) log(C)
0.000 9.17E-02 -10.2 1.01 -1.04
0.042 2.00E-04 -0.0100 -2.00 -3.70
0.125 1.35E-04 -0.0070 -2.15 -3.87
0.250 4.10E-05 -0.0060 -2.22 -4.39
0.500 1.41E-05 -0.0010 -3.00 -4.85
k = 103.2761406
n = 0.7408
r = 2.27Ca0.741
y = 1.0333x + 2.0139 R² = 0.9834
-3.5
-2.5
-1.5
-0.5
0.5
1.5
2.5
3.5
-6 -5 -4 -3 -2 -1 0
log
(dC
/d
t)
log(C)
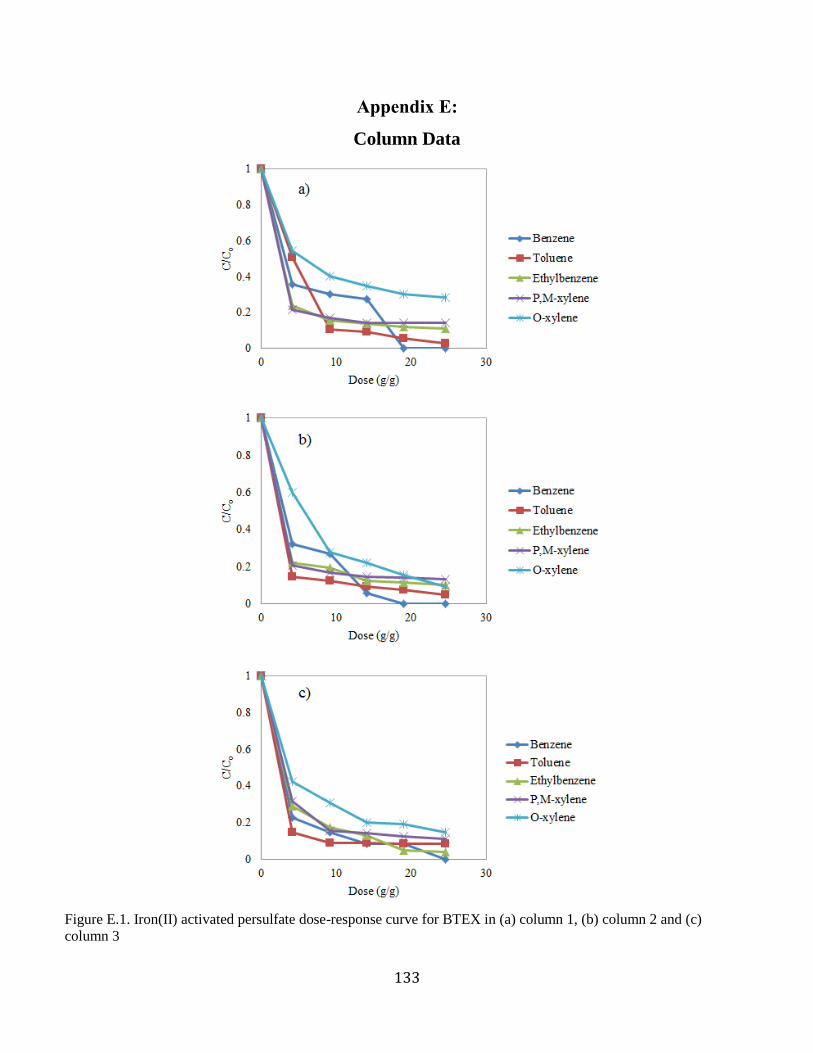
133
Appendix E:
Column Data
Figure E.1. Iron(II) activated persulfate dose-response curve for BTEX in (a) column 1, (b) column 2 and (c)
column 3
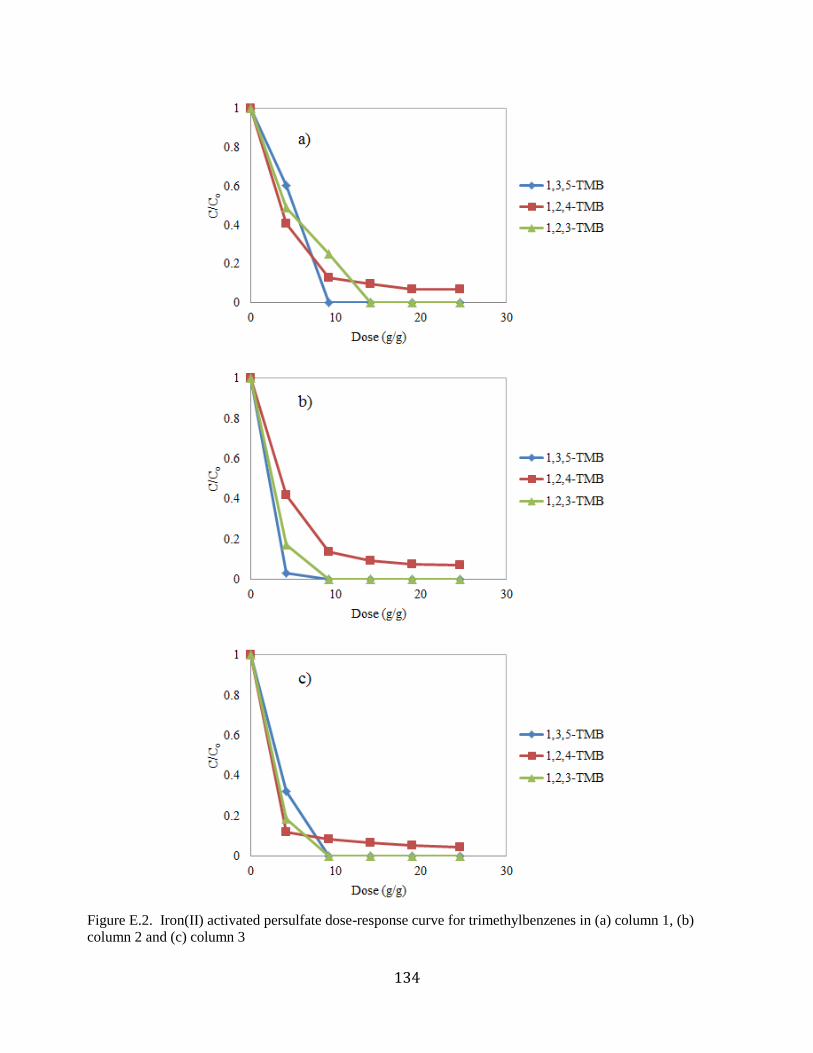
134
Figure E.2. Iron(II) activated persulfate dose-response curve for trimethylbenzenes in (a) column 1, (b)
column 2 and (c) column 3

135
Figure E.3. Iron(II) activated persulfate dose-response curve for PAHs in (a) column 1, (b) column 2 and (c)
column 3
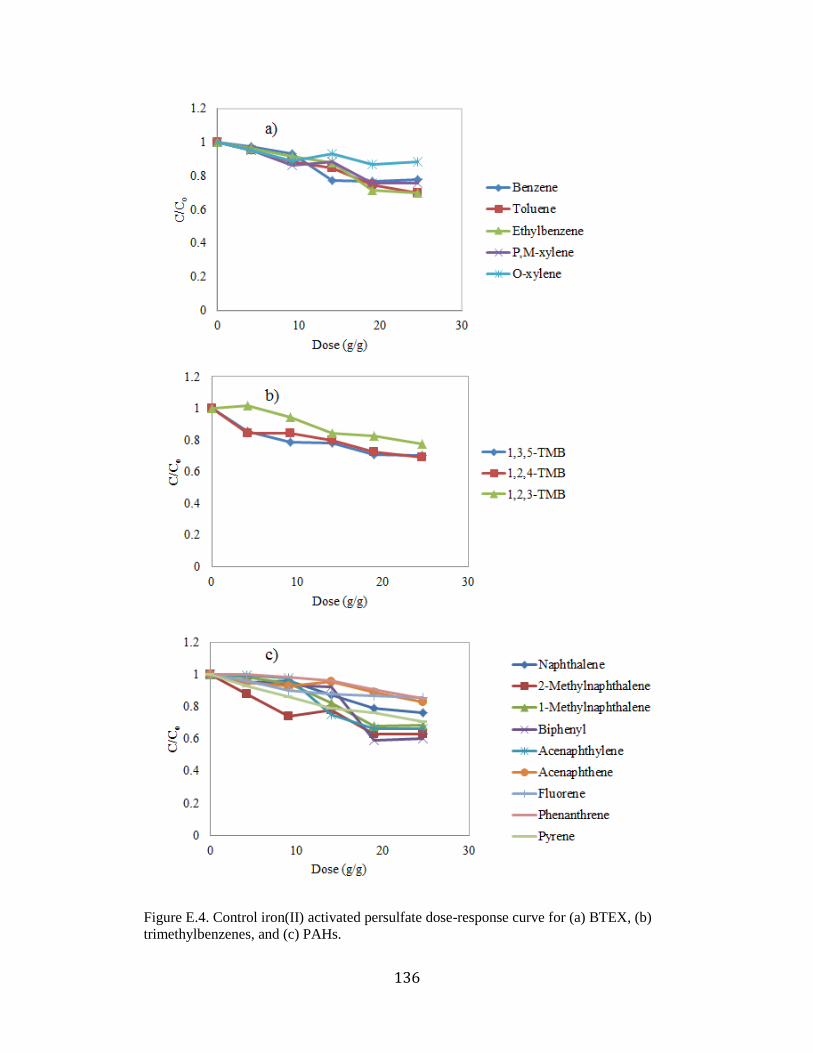
136
Figure E.4. Control iron(II) activated persulfate dose-response curve for (a) BTEX, (b)
trimethylbenzenes, and (c) PAHs.

137
Figure E.5. Average iron(II) activated dose-response curves for (a) control adjusted (b) measured
COCs..
0.00
1.00
2.00
3.00
4.00
5.00
6.00
7.00
0
0.2
0.4
0.6
0.8
1
0 10 20 30
pH
C/C
o
Dose (g/g)
Benzene
Ethylbenzene
Naphthalene
2-Methylnaphthalene
1-Methylnaphthalene
Acenaphthene
pH
0.00
1.00
2.00
3.00
4.00
5.00
6.00
7.00
0
0.2
0.4
0.6
0.8
1
0 10 20 30
pH
C/C
o
Dose (g/g)
Benzene
Ethylbenzene
Naphthalene
2-Methylnaphthalene
1-Methylnaphthalene
Acenaphthene
pH
b)
a)
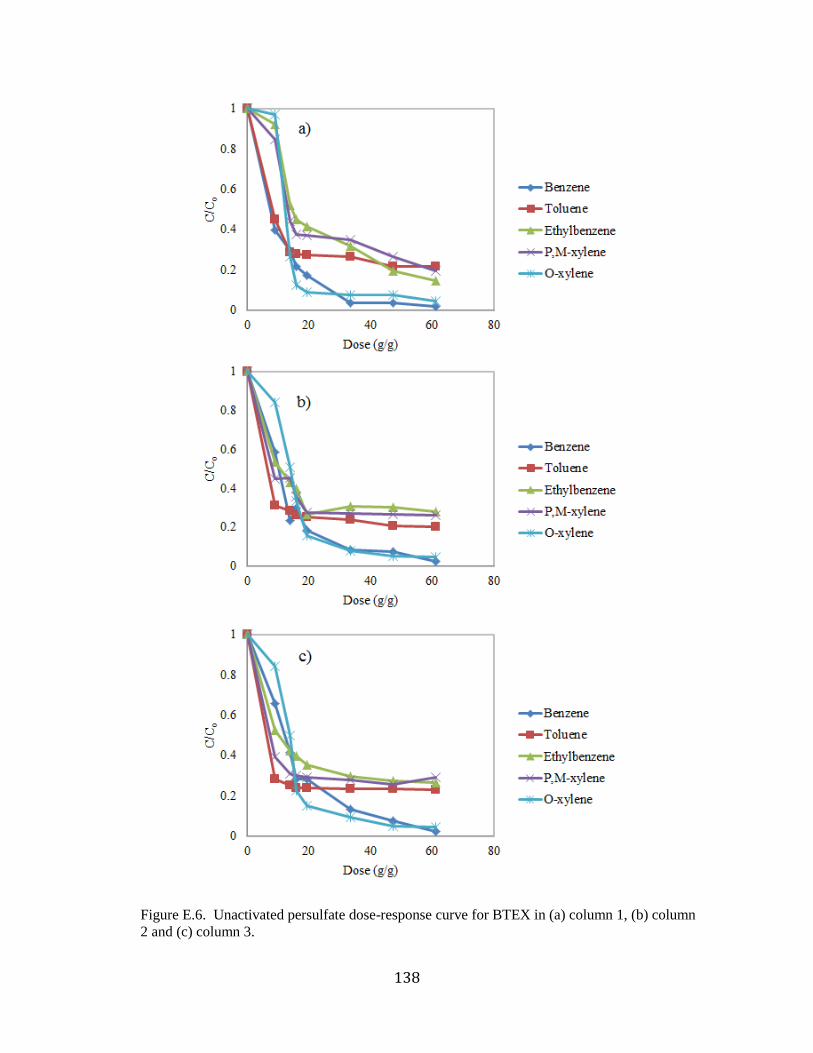
138
Figure E.6. Unactivated persulfate dose-response curve for BTEX in (a) column 1, (b) column
2 and (c) column 3.

139
Figure E.7. Unactivated persulfate dose-response curve for TMBs in (a) column 1, (b)
column 2 and (c) column 3.

140
Figure E.8. Unactivated persulfate dose-response curve for PAHs in (a) column 1, (b) column 2
and (c) column 3.

141
Figure E.9. Average unactivated dose-response curves for (a) control adjusted (b) measured
COCs.
0
1
2
3
4
5
6
7
0
0.2
0.4
0.6
0.8
1
1.2
0 20 40 60 80
pH
C/C
o
Dose (g/g)
Benzene
Ethylbenzene
Naphthalene
2-Methylnaphthalene
1-Methylnaphthalene
Acenaphthene
pH
0
1
2
3
4
5
6
7
0
0.2
0.4
0.6
0.8
1
1.2
0 20 40 60 80
pH
C/C
o
Dose (g/g)
Benzene
Ethylbenzene
Naphthalene
2-Methylnaphthalene
1-Methylnaphthalene
Acenaphthene
pH
a)
b)
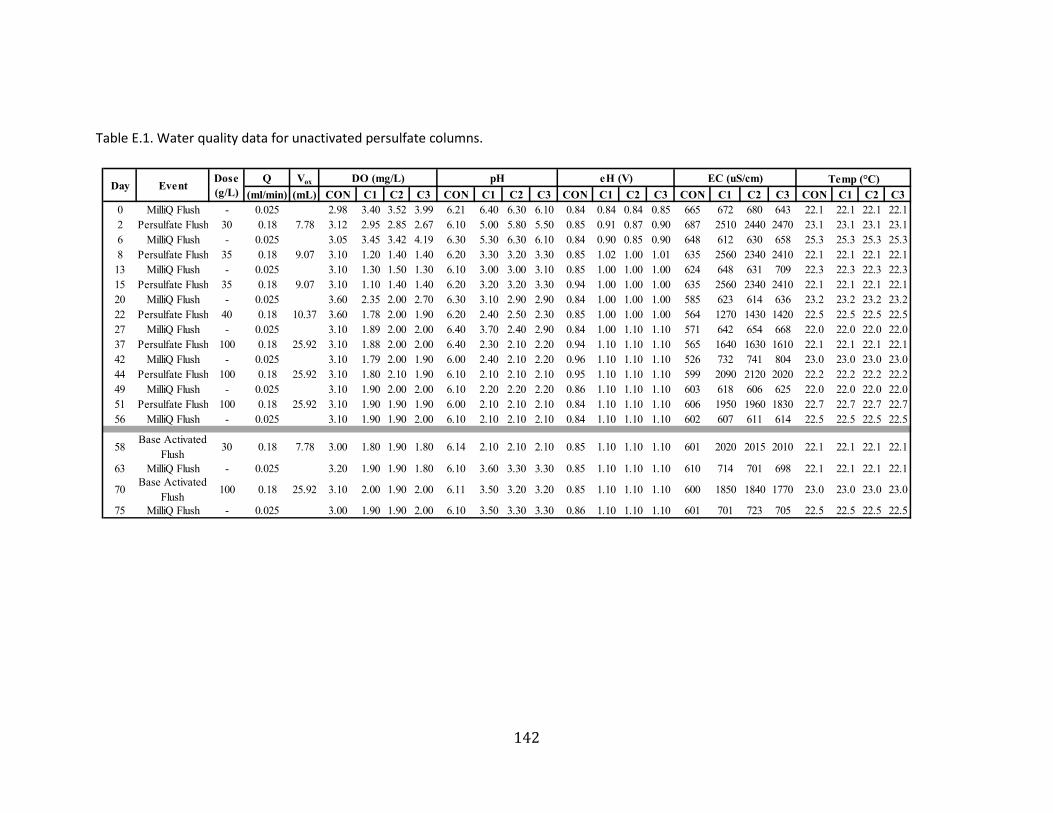
142
Table E.1. Water quality data for unactivated persulfate columns.
Q Vox
(ml/min) (mL) CON C1 C2 C3 CON C1 C2 C3 CON C1 C2 C3 CON C1 C2 C3 CON C1 C2 C3
0 MilliQ Flush - 0.025 2.98 3.40 3.52 3.99 6.21 6.40 6.30 6.10 0.84 0.84 0.84 0.85 665 672 680 643 22.1 22.1 22.1 22.1
2 Persulfate Flush 30 0.18 7.78 3.12 2.95 2.85 2.67 6.10 5.00 5.80 5.50 0.85 0.91 0.87 0.90 687 2510 2440 2470 23.1 23.1 23.1 23.1
6 MilliQ Flush - 0.025 3.05 3.45 3.42 4.19 6.30 5.30 6.30 6.10 0.84 0.90 0.85 0.90 648 612 630 658 25.3 25.3 25.3 25.3
8 Persulfate Flush 35 0.18 9.07 3.10 1.20 1.40 1.40 6.20 3.30 3.20 3.30 0.85 1.02 1.00 1.01 635 2560 2340 2410 22.1 22.1 22.1 22.1
13 MilliQ Flush - 0.025 3.10 1.30 1.50 1.30 6.10 3.00 3.00 3.10 0.85 1.00 1.00 1.00 624 648 631 709 22.3 22.3 22.3 22.3
15 Persulfate Flush 35 0.18 9.07 3.10 1.10 1.40 1.40 6.20 3.20 3.20 3.30 0.94 1.00 1.00 1.00 635 2560 2340 2410 22.1 22.1 22.1 22.1
20 MilliQ Flush - 0.025 3.60 2.35 2.00 2.70 6.30 3.10 2.90 2.90 0.84 1.00 1.00 1.00 585 623 614 636 23.2 23.2 23.2 23.2
22 Persulfate Flush 40 0.18 10.37 3.60 1.78 2.00 1.90 6.20 2.40 2.50 2.30 0.85 1.00 1.00 1.00 564 1270 1430 1420 22.5 22.5 22.5 22.5
27 MilliQ Flush - 0.025 3.10 1.89 2.00 2.00 6.40 3.70 2.40 2.90 0.84 1.00 1.10 1.10 571 642 654 668 22.0 22.0 22.0 22.0
37 Persulfate Flush 100 0.18 25.92 3.10 1.88 2.00 2.00 6.40 2.30 2.10 2.20 0.94 1.10 1.10 1.10 565 1640 1630 1610 22.1 22.1 22.1 22.1
42 MilliQ Flush - 0.025 3.10 1.79 2.00 1.90 6.00 2.40 2.10 2.20 0.96 1.10 1.10 1.10 526 732 741 804 23.0 23.0 23.0 23.0
44 Persulfate Flush 100 0.18 25.92 3.10 1.80 2.10 1.90 6.10 2.10 2.10 2.10 0.95 1.10 1.10 1.10 599 2090 2120 2020 22.2 22.2 22.2 22.2
49 MilliQ Flush - 0.025 3.10 1.90 2.00 2.00 6.10 2.20 2.20 2.20 0.86 1.10 1.10 1.10 603 618 606 625 22.0 22.0 22.0 22.0
51 Persulfate Flush 100 0.18 25.92 3.10 1.90 1.90 1.90 6.00 2.10 2.10 2.10 0.84 1.10 1.10 1.10 606 1950 1960 1830 22.7 22.7 22.7 22.7
56 MilliQ Flush - 0.025 3.10 1.90 1.90 2.00 6.10 2.10 2.10 2.10 0.84 1.10 1.10 1.10 602 607 611 614 22.5 22.5 22.5 22.5
58Base Activated
Flush30 0.18 7.78 3.00 1.80 1.90 1.80 6.14 2.10 2.10 2.10 0.85 1.10 1.10 1.10 601 2020 2015 2010 22.1 22.1 22.1 22.1
63 MilliQ Flush - 0.025 3.20 1.90 1.90 1.80 6.10 3.60 3.30 3.30 0.85 1.10 1.10 1.10 610 714 701 698 22.1 22.1 22.1 22.1
70Base Activated
Flush100 0.18 25.92 3.10 2.00 1.90 2.00 6.11 3.50 3.20 3.20 0.85 1.10 1.10 1.10 600 1850 1840 1770 23.0 23.0 23.0 23.0
75 MilliQ Flush - 0.025 3.00 1.90 1.90 2.00 6.10 3.50 3.30 3.30 0.86 1.10 1.10 1.10 601 701 723 705 22.5 22.5 22.5 22.5
EventDaypH eH (V) EC (uS/cm) Temp (°C)DO (mg/L)Dose
(g/L)

143
Table E.2. Water quality data for iron activated persulfate columns.
Q Vox
(ml/min) (mL) CON C1 C2 C3 CON C1 C2 C3 CON C1 C2 C3 CON C1 C2 C3 CON C1 C2 C3
0 MilliQ Flush - 0.025 2.98 3.40 3.52 3.99 6.70 6.50 6.70 6.60 0.85 0.84 0.84 0.85 660 677 670 659 22.1 22.1 22.1 22.1
2 Persulfate Flush 30 0.18 7.78 3.12 2.95 2.85 2.67 6.60 3.00 3.10 3.00 0.85 1.30 1.40 1.30 680 2460 2480 2450 22.3 22.3 22.3 22.3
9 MilliQ Flush - 0.025 3.05 3.45 3.42 4.19 6.60 5.40 5.50 5.50 0.83 0.90 0.85 0.90 672 660 690 685 22.1 22.1 22.1 22.1
11 Persulfate Flush 30 0.18 7.78 3.10 1.20 1.40 1.40 6.70 2.68 2.60 2.75 0.85 1.40 1.30 1.30 630 2200 2280 2250 23.2 23.2 23.2 23.2
16 MilliQ Flush - 0.025 3.10 1.30 1.50 1.30 6.50 5.10 5.00 5.10 0.87 1.00 1.00 1.00 628 670 630 710 22.5 22.5 22.5 22.5
18 Persulfate Flush 30 0.18 7.78 3.10 1.10 1.40 1.40 6.20 2.54 2.50 2.60 0.89 1.20 1.20 1.20 640 2010 2010 2040 22.0 22.0 22.0 22.0
24 MilliQ Flush - 0.025 3.60 2.35 2.00 2.70 6.40 4.20 4.10 4.00 0.88 1.00 1.00 1.00 610 623 614 636 22.1 22.1 22.1 22.1
26 Persulfate Flush 35 0.18 9.07 3.60 1.78 2.00 1.90 6.40 2.20 2.20 2.20 0.87 1.30 1.20 1.20 590 1350 1320 1400 22.1 22.1 22.1 22.1
32 MilliQ Flush - 0.025 3.10 1.89 2.00 2.00 6.30 3.40 3.50 3.30 0.87 1.10 1.00 1.00 587 642 654 668 23.0 23.0 23.0 23.0
34 Persulfate Flush 35 0.18 9.07 3.10 1.88 2.00 2.00 6.30 2.10 2.00 2.10 0.89 1.20 1.00 1.00 579 1700 1610 1650 22.2 22.2 22.2 22.2
40 MilliQ Flush - 0.025 3.10 1.79 2.00 1.90 6.20 2.10 2.10 2.20 0.9 1.10 1.00 1.10 580 730 750 800 22.0 22.0 22.0 22.0
42 Persulfate Flush 100 0.18 25.92 3.10 1.80 2.10 1.90 6.10 2.10 2.10 2.10 0.9 1.30 1.30 1.20 564 2100 2140 2150 22.7 22.7 22.7 22.7
47 MilliQ Flush - 0.025 3.10 1.90 2.00 2.00 6.10 2.30 2.30 2.20 0.87 1.10 1.10 1.10 560 618 610 599 22.5 22.5 22.5 22.5
50 Persulfate Flush 100 0.18 25.92 3.10 1.90 1.90 1.90 6.10 2.00 2.00 2.10 0.85 1.30 1.30 1.30 560 2010 2030 2030 22.1 22.1 22.1 22.1
Day EventDose
(g/L)
DO (mg/L) pH eH (V) EC (uS/cm) Temp (°C)
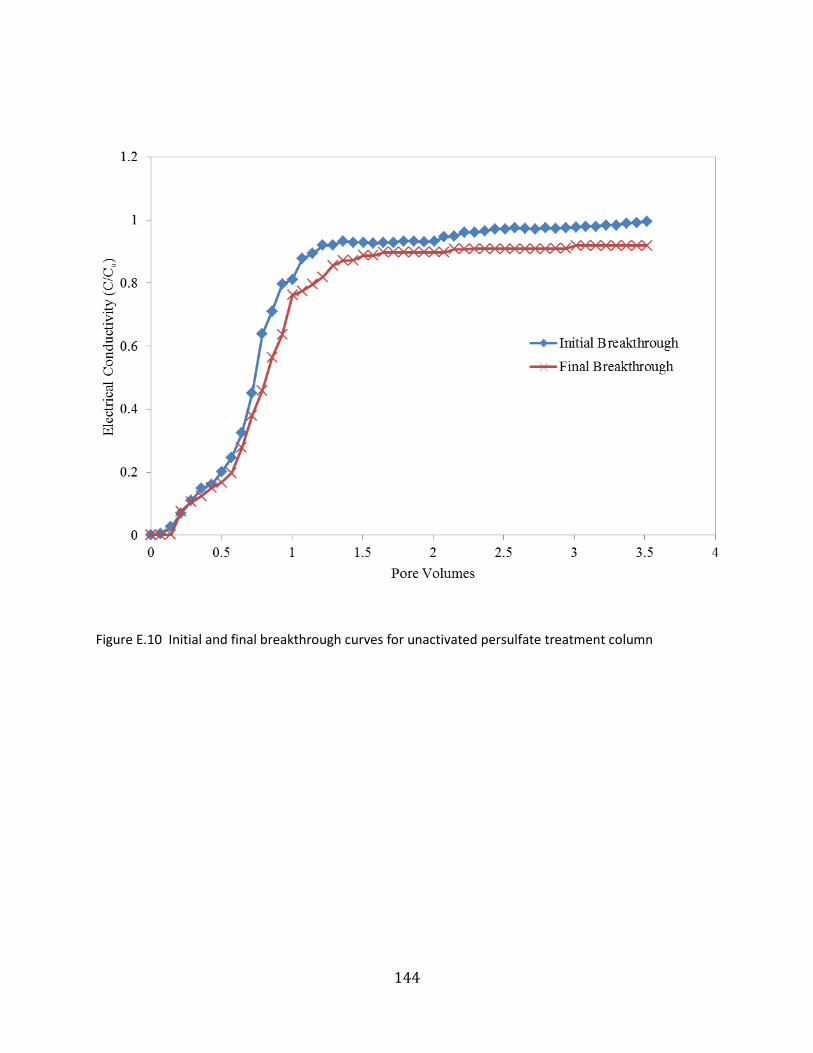
144
Figure E.10 Initial and final breakthrough curves for unactivated persulfate treatment column
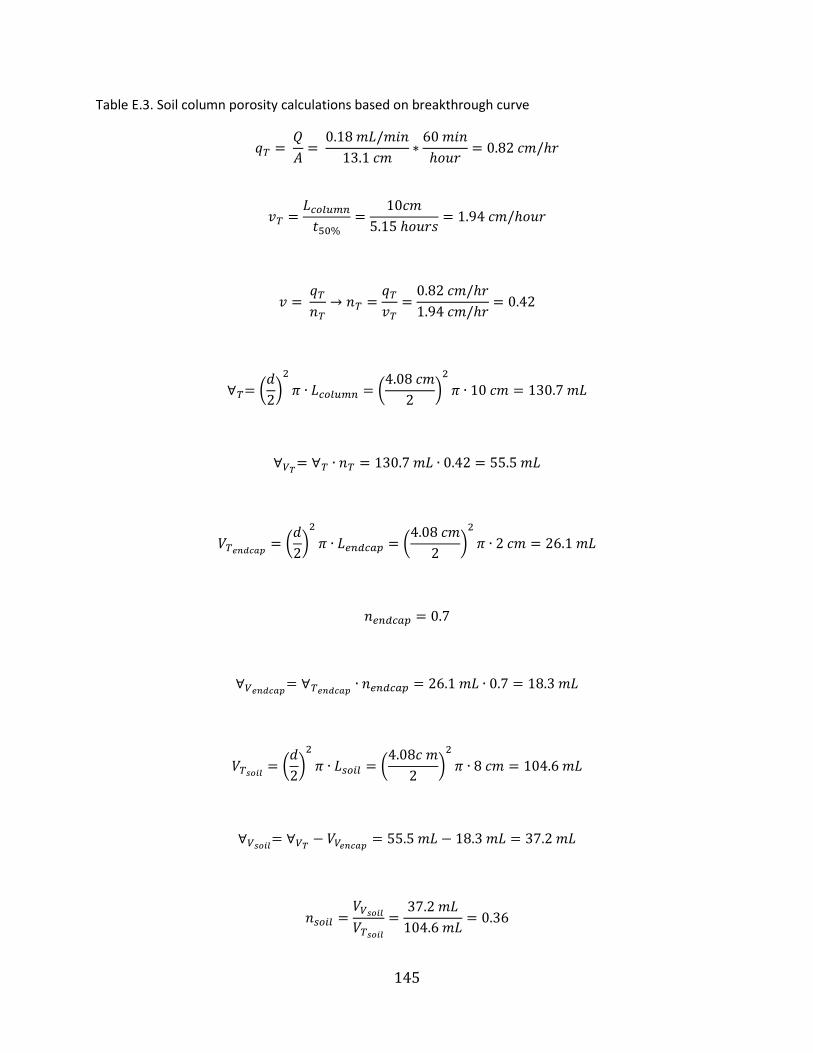
145
Table E.3. Soil column porosity calculations based on breakthrough curve
(
)
(
)
(
)
(
)
(
)
(
)

146
Where is the total Darcy flux through the column [mL/min]; is the volumetric flow rate
through the column [mL/min]; is the cross sectional area perpendicular to flow inside the
column [cm]; is the fluid flow velocity in the column [cm/hour]; is the total length of
the column [cm]; is the time taken for
[hours]; is the bulk porosity of the
total column [-]; is the total column volume [mL]; is the inner diameter of the column [cm];
is the volume of the voids for the total column [mL]; is the total volume of the
column end caps [mL]; is the length of the end caps [cm]; is the known porosity
of the end caps [-]; is the volume of voids in the end caps [mL]; is the total
volume of the soil in the column [mL]; is the length of the soil in the column [cm]; is
the volume of voids in the soil [mL]; and is the porosity of the soil [-].
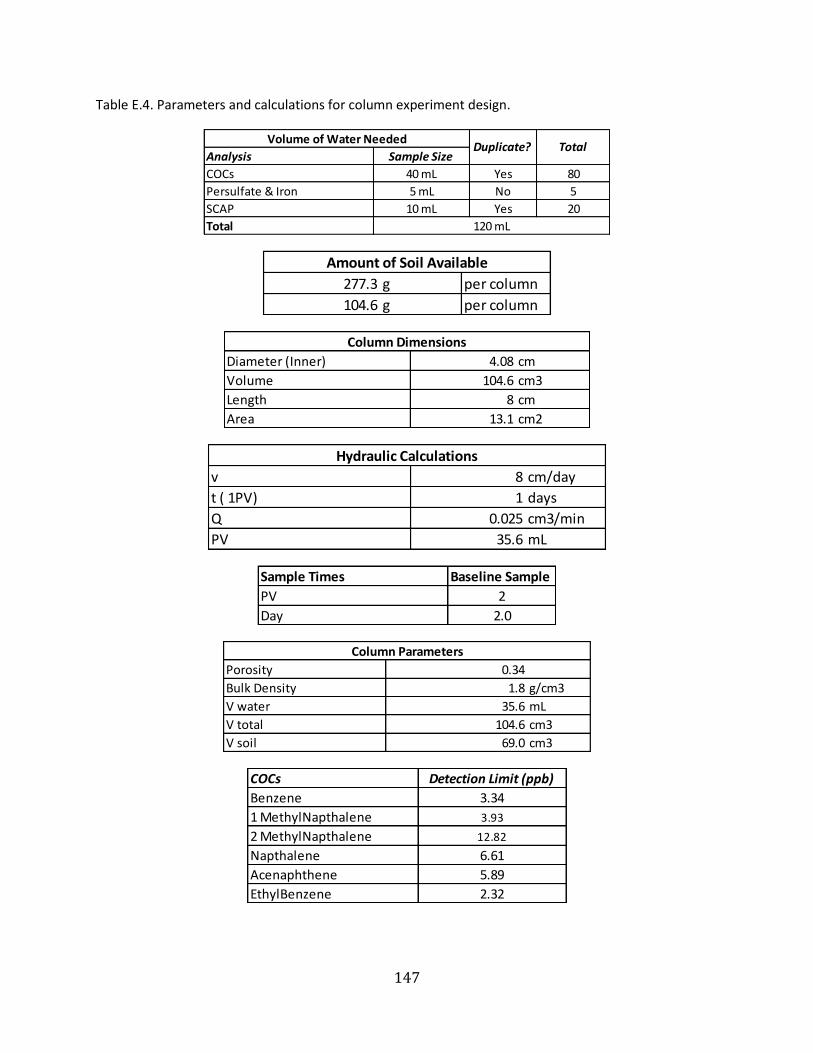
147
Table E.4. Parameters and calculations for column experiment design.
Analysis Sample Size
COCs 40 mL Yes 80
Persulfate & Iron 5 mL No 5
SCAP 10 mL Yes 20
Total
Volume of Water NeededDuplicate? Total
120 mL
277.3 g per column
104.6 g per column
Amount of Soil Available
Diameter (Inner) 4.08 cm
Volume 104.6 cm3
Length 8 cm
Area 13.1 cm2
Column Dimensions
v 8 cm/day
t ( 1PV) 1 days
Q 0.025 cm3/min
PV 35.6 mL
Hydraulic Calculations
Sample Times Baseline Sample
PV 2
Day 2.0
Porosity 0.34
Bulk Density 1.8 g/cm3
V water 35.6 mL
V total 104.6 cm3
V soil 69.0 cm3
Column Parameters
COCs Detection Limit (ppb)
Benzene 3.34
1 MethylNapthalene 3.93
2 MethylNapthalene 12.82
Napthalene 6.61
Acenaphthene 5.89
EthylBenzene 2.32
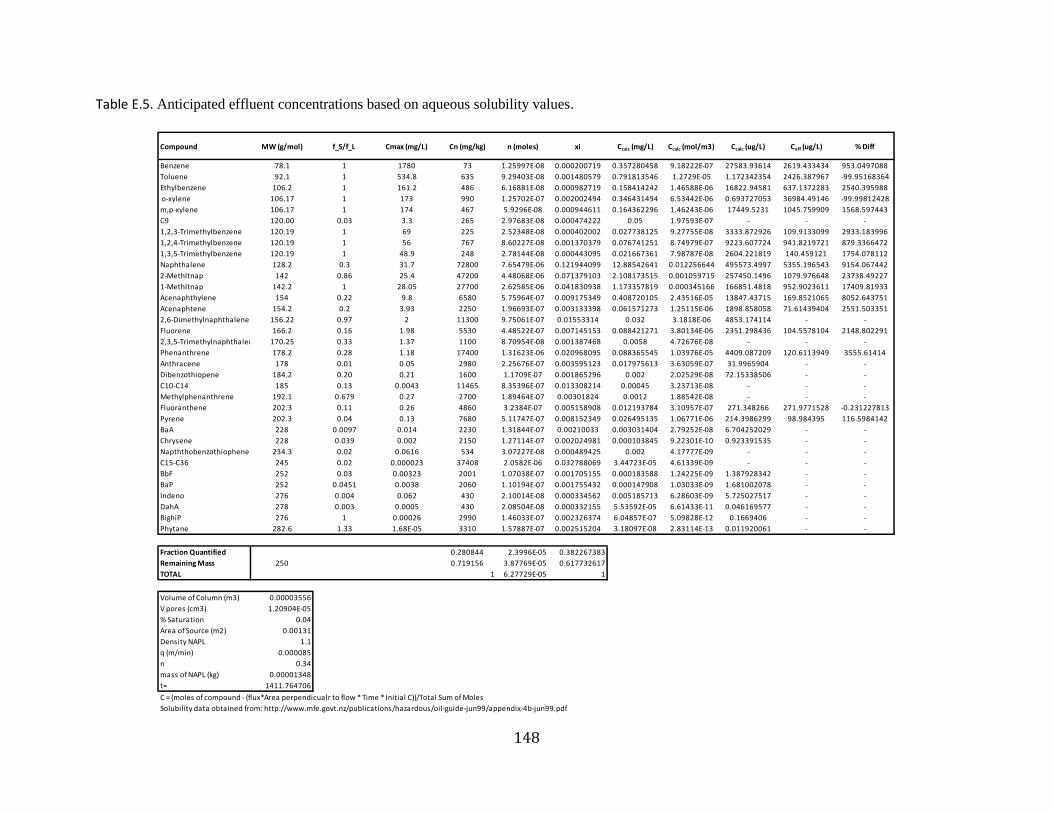
148
Table E.5. Anticipated effluent concentrations based on aqueous solubility values.
Compound MW (g/mol) f_S/f_L Cmax (mg/L) Cn (mg/kg) n (moles) xi Ccalc (mg/L) Ccalc (mol/m3) Ccalc (ug/L) Ceff (ug/L) % Diff
Benzene 78.1 1 1780 73 1.25997E-08 0.000200719 0.357280458 9.18222E-07 27583.93614 2619.433434 953.0497088
Toluene 92.1 1 534.8 635 9.29403E-08 0.001480579 0.791813546 1.2729E-05 1.172342354 2426.387967 -99.95168364
Ethylbenzene 106.2 1 161.2 486 6.16881E-08 0.000982719 0.158414242 1.46588E-06 16822.94581 637.1372283 2540.395988
o-xylene 106.17 1 173 990 1.25702E-07 0.002002494 0.346431494 6.53442E-06 0.693727053 36984.49146 -99.99812428
m,p-xylene 106.17 1 174 467 5.9296E-08 0.000944611 0.164362296 1.46243E-06 17449.5231 1045.759909 1568.597443
C9 120.00 0.03 3.3 265 2.97683E-08 0.000474222 0.05 1.97593E-07 - - -
1,2,3-Trimethylbenzene 120.19 1 69 225 2.52348E-08 0.000402002 0.027738125 9.27755E-08 3333.872926 109.9133099 2933.183996
1,2,4-Trimethylbenzene 120.19 1 56 767 8.60227E-08 0.001370379 0.076741251 8.74979E-07 9223.607724 941.8219721 879.3366472
1,3,5-Trimethylbenzene 120.19 1 48.9 248 2.78144E-08 0.000443095 0.021667361 7.98787E-08 2604.221819 140.459121 1754.078112
Naphthalene 128.2 0.3 31.7 72800 7.65479E-06 0.121944099 12.88542641 0.012256644 495573.4997 5355.196543 9154.067442
2-Methltnap 142 0.86 25.4 47200 4.48068E-06 0.071379103 2.108173515 0.001059715 257450.1496 1079.976648 23738.49227
1-Methltnap 142.2 1 28.05 27700 2.62585E-06 0.041830938 1.173357819 0.000345166 166851.4818 952.9023611 17409.81933
Acenaphthylene 154 0.22 9.8 6580 5.75964E-07 0.009175349 0.408720105 2.43516E-05 13847.43715 169.8521065 8052.643751
Acenaphtene 154.2 0.2 3.93 2250 1.96693E-07 0.003133398 0.061571273 1.25115E-06 1898.858058 71.61439404 2551.503351
2,6-Dimethylnaphthalene 156.22 0.97 2 11300 9.75061E-07 0.01553314 0.032 3.1818E-06 4853.174114 - -
Fluorene 166.2 0.16 1.98 5530 4.48522E-07 0.007145153 0.088421271 3.80134E-06 2351.298436 104.5578104 2148.802291
2,3,5-Trimethylnaphthalene 170.25 0.33 1.37 1100 8.70954E-08 0.001387468 0.0058 4.72676E-08 - - -
Phenanthrene 178.2 0.28 1.18 17400 1.31623E-06 0.020968095 0.088365545 1.03976E-05 4409.087209 120.6113949 3555.61414
Anthracene 178 0.01 0.05 2980 2.25676E-07 0.003595123 0.017975613 3.63059E-07 31.9965904 - -
Dibenzothiopene 184.2 0.20 0.21 1600 1.1709E-07 0.001865296 0.002 2.02529E-08 72.15338506 - -
C10-C14 185 0.13 0.0043 11465 8.35396E-07 0.013308214 0.00045 3.23713E-08 - - -
Methylphenanthrene 192.1 0.679 0.27 2700 1.89464E-07 0.00301824 0.0012 1.88542E-08 - - -
Fluoranthene 202.3 0.11 0.26 4860 3.2384E-07 0.005158908 0.012193784 3.10957E-07 271.348266 271.9771528 -0.231227813
Pyrene 202.3 0.04 0.13 7680 5.11747E-07 0.008152349 0.026495135 1.06771E-06 214.3986299 98.984395 116.5984142
BaA 228 0.0097 0.014 2230 1.31844E-07 0.00210033 0.003031404 2.79252E-08 6.704252029 - -
Chrysene 228 0.039 0.002 2150 1.27114E-07 0.002024981 0.000103845 9.22301E-10 0.923391535 - -
Napththobenzothiophene 234.3 0.02 0.0616 534 3.07227E-08 0.000489425 0.002 4.17777E-09 - - -
C15-C36 245 0.02 0.000023 37408 2.0582E-06 0.032788069 3.44723E-05 4.61339E-09 - - -
BbF 252 0.03 0.00323 2001 1.07038E-07 0.001705155 0.000183588 1.24225E-09 1.387928342 - -
BaP 252 0.0451 0.0038 2060 1.10194E-07 0.001755432 0.000147908 1.03033E-09 1.681002078 - -
Indeno 276 0.004 0.062 430 2.10014E-08 0.000334562 0.005185713 6.28603E-09 5.725027517 - -
DahA 278 0.003 0.0005 430 2.08504E-08 0.000332155 5.53592E-05 6.61433E-11 0.046169577 - -
BighiP 276 1 0.00026 2990 1.46033E-07 0.002326374 6.04857E-07 5.09828E-12 0.1669406 - -
Phytane 282.6 1.33 1.68E-05 3310 1.57887E-07 0.002515204 3.18097E-08 2.83114E-13 0.011920061 - -
Fraction Quantified 0.280844 2.3996E-05 0.382267383
Remaining Mass 250 0.719156 3.87769E-05 0.617732617
TOTAL 1 6.27729E-05 1
Volume of Column (m3) 0.00003556
V pores (cm3) 1.20904E-05
% Saturation 0.04
Area of Source (m2) 0.00131
Density NAPL 1.1
q (m/min) 0.000085
n 0.34
mass of NAPL (kg) 0.00001348
t= 1411.764706
C = (moles of compound - (flux*Area perpendicualr to flow * Time * Initial C))/Total Sum of Moles
Solubility data obtained from: http://www.mfe.govt.nz/publications/hazardous/oil-guide-jun99/appendix-4b-jun99.pdf

149
Appendix F:
Raw Data
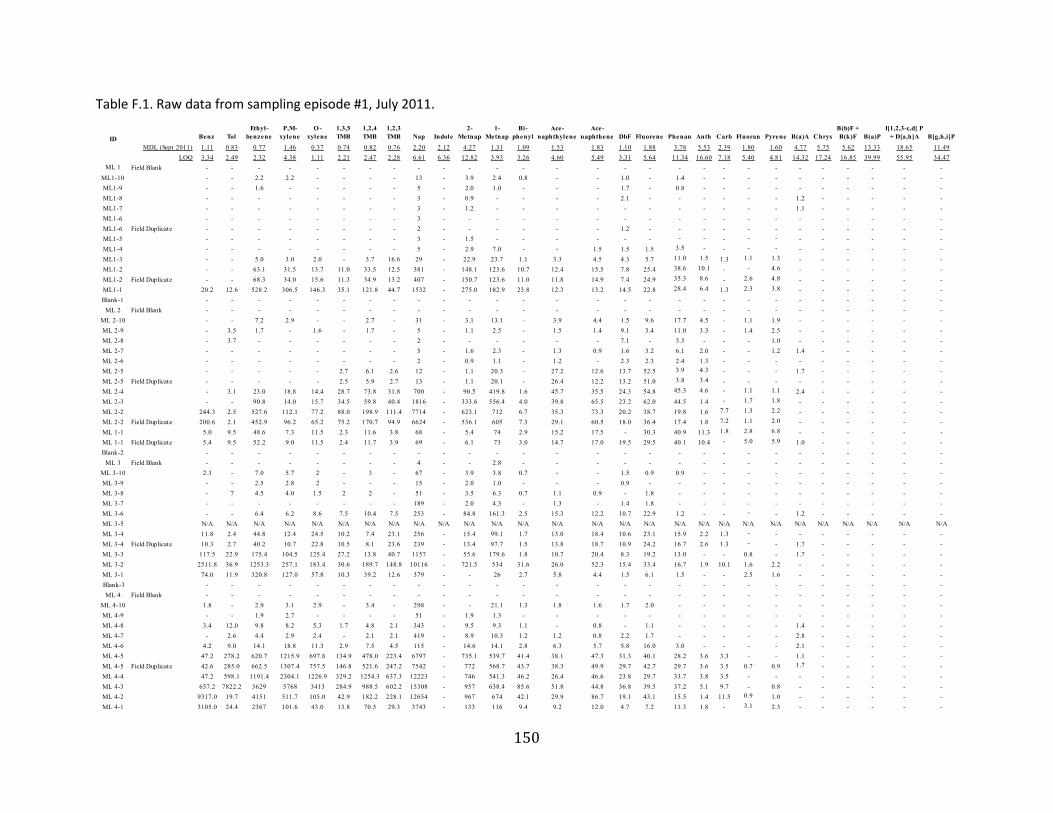
150
Table F.1. Raw data from sampling episode #1, July 2011.
Benz Tol
Ethyl-
benzene
P,M-
xylene
O -
xylene
1,3,5
TMB
1,2,4
TMB
1,2,3
TMB Nap Indole
2-
Metnap
1-
Metnap
Bi-
phenyl
Ace-
naphthylene
Ace-
naphthene DbF Fluorene Phenan Anth Carb Fluoran Pyrene B(a)A Chrys
B(b)F +
B(k)F B(a)P
I[1,2,3-c,d] P
+ D[a,h]A B[g,h,i]P
MDL (Sept 2011) 1.11 0.83 0.77 1.46 0.37 0.74 0.82 0.76 2.20 2.12 4.27 1.31 1.09 1.53 1.83 1.10 1.88 3.78 5.53 2.39 1.80 1.60 4.77 5.75 5.62 13.33 18.65 11.49
LOQ 3.34 2.49 2.32 4.38 1.11 2.21 2.47 2.28 6.61 6.36 12.82 3.93 3.26 4.60 5.49 3.31 5.64 11.34 16.60 7.18 5.40 4.81 14.32 17.24 16.85 39.99 55.95 34.47
ML 1 Field Blank - - - - - - - - - - - - - - - - - - - - - - - - - - - -
ML1-10 - - 2.2 2.2 - - - - 13 - 3.9 2.4 0.8 - - 1.0 - 1.4 - - - - - - - - - -
ML1-9 - - 1.6 - - - - - 5 - 2.0 1.0 - - - 1.7 - 0.8 - - - - - - - - - -
ML1-8 - - - - - - - - 3 - 0.9 - - - - 2.1 - - - - - - 1.2 - - - - -
ML1-7 - - - - - - - - 3 - 1.2 - - - - - - - - - - - 1.1 - - - - -
ML1-6 - - - - - - - - 3 - - - - - - - - - - - - - - - - - - -
ML1-6 Field Duplicate - - - - - - - - 2 - - - - - - 1.2 - - - - - - - - - - - -
ML1-5 - - - - - - - - 3 - 1.5 - - - - - - - - - - - - - - - - -
ML1-4 - - - - - - - - 5 - 2.9 7.0 - - 1.5 1.5 1.5 3.5 - - - - - - - - - -
ML1-3 - - 5.0 3.0 2.0 - 3.7 16.6 29 - 22.9 23.7 1.1 3.3 4.5 4.3 5.7 11.0 1.5 1.3 1.1 1.3 - - - - - -
ML1-2 - - 63.1 31.5 13.7 11.0 33.5 12.5 381 - 148.1 123.6 10.7 12.4 15.5 7.8 25.4 38.6 10.1 - - 4.6 - - - - - -
ML1-2 Field Duplicate - - 68.3 34.0 15.6 11.3 34.9 13.2 407 - 150.7 123.6 11.0 11.8 14.9 7.4 24.9 35.3 8.6 - 2.6 4.8 - - - - - -
ML1-1 20.2 12.6 528.2 306.5 146.3 35.1 121.8 44.7 1532 - 275.0 182.9 23.8 12.3 13.2 14.5 22.8 28.4 6.4 1.3 2.3 3.8 - - - - - -
Blank-1 - - - - - - - - - - - - - - - - - - - - - - - - - - - -
ML 2 Field Blank - - - - - - - - - - - - - - - - - - - - - - - - - - - -
ML 2-10 - - 7.2 2.9 - - 2.7 - 31 - 3.1 13.1 - 3.9 4.4 1.5 9.6 17.7 4.5 - 1.1 1.9 - - - - - -
ML 2-9 - 3.5 1.7 - 1.6 - 1.7 - 5 - 1.1 2.5 - 1.5 1.4 9.1 3.4 11.0 3.3 - 1.4 2.5 - - - - - -
ML 2-8 - 3.7 - - - - - - 2 - - - - - - 7.1 - 3.3 - - - 1.0 - - - - - -
ML 2-7 - - - - - - - - 5 - 1.6 2.3 - 1.3 0.9 1.6 3.2 6.1 2.0 - - 1.2 1.4 - - - - -
ML 2-6 - - - - - - - - 2 - 0.9 1.1 - 1.2 - 2.3 2.3 2.4 1.3 - - - - - - - - -
ML 2-5 - - - - - 2.7 6.1 2.6 12 - 1.1 20.3 - 27.2 12.6 13.7 52.5 3.9 4.3 - - - 1.7 - - - - -
ML 2-5 Field Duplicate - - - - - 2.5 5.9 2.7 13 - 1.1 20.1 - 26.4 12.2 13.2 51.0 3.8 3.4 - - - - - - - - -
ML 2-4 - 3.1 23.0 18.8 14.4 28.7 73.8 31.8 700 - 90.5 419.8 1.6 45.7 35.5 24.3 54.8 45.3 4.6 - 1.1 1.1 2.4 - - - - -
ML 2-3 - - 90.8 14.0 15.7 34.5 59.8 40.4 1816 - 333.6 556.4 4.0 39.8 65.5 23.2 62.0 44.5 1.4 - 1.7 1.8 - - - - - -
ML 2-2 244.3 2.5 527.6 112.1 77.2 88.0 198.9 111.4 7714 - 623.1 712 6.7 35.3 73.3 20.2 38.7 19.8 1.6 7.7 1.3 2.2 - - - - - -
ML 2-2 Field Duplicate 200.6 2.1 452.9 96.2 65.2 75.2 170.7 94.9 6624 - 536.1 605 7.3 29.1 60.5 18.0 36.4 17.4 1.8 7.2 1.1 2.0 - - - - - -
ML 1-1 5.0 9.5 48.6 7.3 11.5 2.3 11.6 3.8 68 - 5.4 74 2.9 15.2 17.5 - 30.3 40.9 11.3 1.8 2.8 6.8 - - - - - -
ML 1-1 Field Duplicate 5.4 9.5 52.2 9.0 11.5 2.4 11.7 3.9 69 - 6.1 73 3.0 14.7 17.0 19.5 29.5 40.1 10.4 - 5.0 5.9 1.0 - - - - -
Blank-2 - - - - - - - - - - - - - - - - - - - - - - - - - - - -
ML 3 Field Blank - - - - - - - - 4 - - 2.8 - - - - - - - - - - - - - - - -
ML 3-10 2.3 - 7.0 5.7 2 - 3 - 67 - 3.9 3.8 0.7 - - 1.5 0.9 0.9 - - - - - - - - - -
ML 3-9 - - 2.5 2.8 2 - - - 15 - 2.0 1.0 - - - 0.9 - - - - - - - - - - - -
ML 3-8 - 7 4.5 4.0 1.5 2 2 - 51 - 3.5 6.3 0.7 1.1 0.9 - 1.8 - - - - - - - - - - -
ML 3-7 - - - - - - - - 189 - 2.0 4.3 - 1.3 - 1.4 1.8 - - - - - - - - - - -
ML 3-6 - - 6.4 6.2 8.6 7.5 10.4 7.5 253 - 84.8 161.3 2.5 15.3 12.2 10.7 22.9 1.2 - - - - 1.2 - - - - -
ML 3-5 N/A N/A N/A N/A N/A N/A N/A N/A N/A N/A N/A N/A N/A N/A N/A N/A N/A N/A N/A N/A N/A N/A N/A N/A N/A N/A N/A N/A
ML 3-4 11.8 2.4 44.8 12.4 24.5 10.2 7.4 23.1 256 - 15.4 99.1 1.7 13.0 18.4 10.6 23.1 15.9 2.2 1.3 - - - - - - - -
ML 3-4 Field Duplicate 10.3 2.7 40.2 10.7 22.8 10.5 8.1 23.6 239 - 13.4 97.7 1.5 13.8 18.7 10.9 24.2 16.7 2.6 1.3 - - 1.7 - - - - -
ML 3-3 117.5 22.9 175.4 104.5 125.4 27.2 13.8 40.7 1157 - 55.6 179.6 1.8 10.7 20.4 8.3 19.2 13.0 - - 0.8 - 1.7 - - - - -
ML 3-2 2511.8 36.9 1253.3 257.1 183.4 30.6 189.7 148.8 10116 - 721.5 534 31.6 26.0 52.3 15.4 33.4 16.7 1.9 10.1 1.6 2.2 - - - - - -
ML 3-1 74.0 11.9 320.8 127.0 57.8 10.3 39.2 12.6 379 - - 26 2.7 5.8 4.4 1.5 6.1 1.5 - - 2.5 1.6 - - - - - -
Blank-3 - - - - - - - - - - - - - - - - - - - - - - - - - - - -
ML 4 Field Blank - - - - - - - - - - - - - - - - - - - - - - - - - - - -
ML 4-10 1.8 - 2.9 3.1 2.9 - 3.4 - 298 - - 21.1 1.3 1.8 1.6 1.7 2.0 - - - - - - - - - - -
ML 4-9 - - 1.9 2.7 - - - - 51 - 1.9 1.3 - - - - - - - - - - - - - - - -
ML 4-8 3.4 12.0 9.8 8.2 5.3 1.7 4.8 2.1 343 - 9.5 9.3 1.1 - 0.8 - 1.1 - - - - - 1.4 - - - - -
ML 4-7 - 2.6 4.4 2.9 2.4 - 2.1 2.1 419 - 8.9 10.3 1.2 1.2 0.8 2.2 1.7 - - - - - 2.8 - - - - -
ML 4-6 4.2 9.0 14.1 18.8 11.3 2.9 7.5 4.5 115 - 14.6 14.1 2.8 6.3 5.7 5.8 16.0 3.0 - - - - 2.1 - - - - -
ML 4-5 47.2 278.2 620.7 1215.9 697.8 134.9 478.0 223.4 6797 - 735.1 539.7 41.4 38.1 47.3 31.3 40.1 28.2 3.6 3.3 - - 1.1 - - - - -
ML 4-5 Field Duplicate 42.6 285.0 662.5 1307.4 757.5 146.8 521.6 247.2 7542 - 772 568.7 43.7 38.3 49.9 29.7 42.7 29.7 3.6 3.5 0.7 0.9 1.7 - - - - -
ML 4-4 47.2 598.1 1191.4 2304.1 1226.9 329.2 1254.3 637.3 12223 - 746 541.3 46.2 26.4 46.6 23.8 29.7 33.7 3.8 3.5 - - - - - - - -
ML 4-3 657.2 7822.2 3629 5768 3413 284.9 988.5 602.2 15308 - 957 638.4 85.6 51.8 44.8 36.8 39.5 37.2 5.1 9.7 - 0.8 - - - - - -
ML 4-2 9317.0 19.7 4151 511.7 105.0 42.9 182.2 228.1 12654 - 967 674 42.1 29.9 86.7 19.1 43.1 15.5 1.4 11.5 0.9 1.0 - - - - - -
ML 4-1 3105.0 24.4 2367 101.6 43.0 13.8 70.5 29.3 3743 - 133 116 9.4 9.2 12.0 4.7 7.2 11.3 1.8 - 3.1 2.3 - - - - - -
ID

151
Table F.1. (continued) Raw data from sampling episode #1, July 2011.
Benz Tol
Ethyl-
benzene
P,M-
xylene
O -
xylene
1,3,5
TMB
1,2,4
TMB
1,2,3
TMB Nap Indole
2-
Metnap
1-
Metnap
Bi-
phenyl
Ace-
naphthylene
Ace-
naphthene DbF Fluorene Phenan Anth Carb Fluoran Pyrene B(a)A Chrys
B(b)F +
B(k)F B(a)P
I[1,2,3-c,d] P
+ D[a,h]A B[g,h,i]P
MDL (Sept 2011) 1.11 0.83 0.77 1.46 0.37 0.74 0.82 0.76 2.20 2.12 4.27 1.31 1.09 1.53 1.83 1.10 1.88 3.78 5.53 2.39 1.80 1.60 4.77 5.75 5.62 13.33 18.65 11.49
LOQ 3.34 2.49 2.32 4.38 1.11 2.21 2.47 2.28 6.61 6.36 12.82 3.93 3.26 4.60 5.49 3.31 5.64 11.34 16.60 7.18 5.40 4.81 14.32 17.24 16.85 39.99 55.95 34.47
Blank-4 - - - - - - - - - - - - - - - - - - - - - - - - - - - -
ML 5 Field Blank - - - - - - - - - - - - - - - - - - - - - - - - - - - -
ML 5-10 32.1 313.5 592.1 1690.9 1165.7 201.8 777.6 388.2 12884 - 728.2 507.8 49.5 60.4 28.0 31.4 40.9 26.8 - - - - - - - - - -
ML 5-9 30.0 318.3 647.3 1903.8 1275.4 235.7 885.2 425.5 14622 - 888.9 602.4 69.0 60.1 32.5 31.7 52.5 40.7 5.5 - - - - - - - - -
ML 5-8 26.2 324.7 695.5 2095.5 1360.3 270.6 998.8 538.6 16012 - 1024.0 673.8 80.5 67.5 34.4 32.9 59.4 58.8 7.2 5.8 1.1 1.2 2.1 - - - - -
ML 5-7 12.2 226.0 711.0 1938.9 1304.0 277.9 987.8 449.3 14632 - 1219.1 784.6 90.3 64.4 49.4 50 56.4 57.4 3.5 4.1 2.0 2.8 1.6 - - - - -
ML 5-6 3.8 268.9 923.0 2439.8 1577.1 264.0 937.9 439.5 12038 - 1144.5 763.5 80.4 63.6 57.1 50 56.9 54.7 3.7 3.1 1.8 2.2 3.8 - - - - -
ML 5-5 7.8 1077.6 1991.0 4150.8 2258.1 320.5 1110.1 510.3 13931 - 1060.3 705.9 76.3 51.0 54.6 51 53.7 54.9 3.7 6.2 1.4 1.9 - - - - - -
ML 5-4 9.0 400.7 1730.6 2447.9 1475.9 238.2 618.1 307.7 9029 - 817.0 677.6 41.0 31.8 83.0 28.7 54.2 38.4 2.6 4.8 - - - - - - - -
ML 5-3 1082.2 3627.0 2602.0 3008.5 1758.7 274.0 927.4 419.0 12307 - 1100.2 755.0 79.0 31.9 81.8 25.3 64.0 31.6 1.7 6.8 - - - - 1.5 - - -
ML 5-2 17802 982.3 6348.6 6353.2 2530.8 251.0 806.1 478.7 13437 - 819.2 589.6 61.5 27.3 85.7 23.8 28.7 17.5 - 9.9 - - 1.1 - - - - -
ML 5-1 2681 475 2079.2 911.2 254.7 60.3 184.3 98.8 2445 - 60.7 96.8 4.5 13.0 15.5 4.1 2.0 7.9 1.5 - - - - - - - - -
ML 5-1 Field Duplicate 2944 510.4 2268.7 971.4 270.9 65.4 199.3 105.4 2708 - 67.4 107.0 5.0 14.2 17.5 4.7 2.0 8.8 1.7 1.1 - - 21.8 - - - - -
Blank-5 - - - - - - - - - - - - - - - - - - - - - - - - - - - -
ML 6 Field Blank - - - - - - - - - - - - - - - - - - - - - - - - - - - -
ML 6-10 44.8 162.1 501.2 761.1 799.7 212.0 776.2 340.5 11511 - 984.9 674.0 71.9 70.8 34.4 36.2 45.9 41.5 5.2 4.5 0.7 1.0 1.2 - - - - -
ML 6-9 47.3 152.0 528.6 773.4 819.6 235.3 818.1 336.2 11911 - 1071.1 728.6 85.3 64.6 38.3 44.1 57.9 58.5 6.2 4.7 0.7 1.0 1.4 - - - - -
ML 6-8 43.1 71.4 452.0 592.2 599.6 211.2 716.1 284.8 10775 - 1012.7 680.1 94.8 48.6 36.1 36.6 68.8 84.2 7.7 6.5 2.2 3.4 3.9 - 1.3 - - -
ML 6-7 14.2 22.5 626.8 1198.7 748.2 258.5 746.6 312.7 9694 - 1024.9 747.4 92.6 47.6 64.3 46.1 76.9 106.0 7.6 7.6 4.8 6.8 1.4 - - - - -
ML 6-6 20.3 55.1 720.8 893.3 531.7 155.4 506.5 221.3 6744 - 635.0 506.7 54.4 39.0 57.7 39.3 54.9 65.1 7.3 5.7 1.7 2.5 4.8 - - - - -
ML 6-5 16.2 13.2 960.7 479.0 361.6 145.2 368.5 151.9 5162 - 627.6 664.2 47.9 29.4 91.4 26.0 56.7 65.1 3.3 3.7 2.4 3.4 - - - - - -
ML 6-4 52.4 15.3 925.2 323.9 314.8 132.4 366.4 163.3 5151 - 562.0 601.4 39.9 25.8 86.0 23.0 49.0 44.3 2.5 3.9 1.7 2.7 - - - - - -
ML 6-4 Field Duplicate 56.5 16.6 974.1 343.6 332.0 139.3 370.3 169.2 5407 - 583.4 621.4 41.0 25.0 89.0 22.7 49.5 45.8 2.7 4.0 1.8 2.8 1.4 - - - - -
ML 6-3 227.1 94.1 2870.5 1208.2 1570.2 245.9 853.0 354.7 13768 - 648.7 472.5 56.0 17.0 87.3 15.9 45.1 35.3 4.0 12.2 2.3 4.9 1.5 - 2.4 - - -
ML 6-2 6772.4 7701.4 9872.0 9291.2 4036.7 342.9 1110.9 628.1 6530 - 183.1 204.6 28.6 21.3 21.3 19.0 16.7 13.1 2.6 8.7 1.9 2.2 1.0 - - - - -
ML 6-1 7982.3 27.2 6977.8 329.7 67.2 21.0 41.3 145.3 4226 - 82.4 135.7 11.7 32.5 16.7 7.8 - 11.6 2.4 - 6.0 3.4 1.3 - - - - -
Blank -6 - - - - - - - - - - - - - - - - - - - - - - - - - - - -
ML 7 Field Blank - - - - - - - - - - - - - - - - - - - - - - - - - - - -
ML 7-10 289.7 195.0 326.2 281.5 311.7 80.1 401.7 145.3 7856.6 - 476.1 390.2 44.7 39.3 52.7 44.7 24.5 21.6 3.9 6.7 - 1.6 - - - - - -
ML 7-9 339.5 274.9 513.4 470.9 427.2 137.6 655.3 237.8 10372 - 758.1 558.2 55.5 55.8 67.9 34.3 35.3 38.2 6.0 6.4 0.9 2.3 - - - - - -
ML 7-8 371.2 309.4 583.3 541.4 465.4 161.9 676.0 239.5 10843 - 887.6 626.5 68.9 40.7 76.5 46.6 41.3 42.4 6.5 7.6 1.1 2.4 2.2 - - - - -
ML 7-7 24.4 32.3 284.7 83.4 125.0 56.4 108.6 101.5 8423 - 563.3 567.4 29.0 25.0 126.6 23.6 53.8 46.6 3.5 3.9 1.5 1.8 1.4 - - - - -
ML 7-6 24.8 33.2 298.4 87.5 129.9 60.0 116.9 108.6 8770.0 - 595.1 592.6 29.4 27.1 131.3 24.2 57.1 53.6 4.7 4.2 2.0 2.6 1.2 - - - - -
ML 7-6 3.2 1.9 7.4 3.0 3.2 - 3.9 3.0 117.4 - 8.2 28.8 1.0 9.1 50.1 6.1 20.1 4.4 2.8 - 3.0 3.8 - - - - - -
ML 7-5 - 10.4 6.1 2.8 - 2.4 4.9 3.5 114.5 - 13.7 32.6 - 9.8 43.2 10.4 22.2 27.5 5.0 - 2.4 3.0 - - - - - -
ML 7-4 - 3.1 7.3 1.8 - 1.5 3.3 3.5 167.9 - 35.1 108.9 0.7 8.6 47.6 6.6 20.4 40.6 7.1 - 3.4 4.3 1.3 - - - - -
ML 7-3 2.3 - 64.5 4.6 2.2 18.3 50.1 36.5 2738.5 - 484.4 504.7 - 27.9 179.7 15.4 84.8 116.8 12.0 2.5 5.1 5.4 1.8 - - - - -
ML 7-2 396.2 2.6 2002.0 59.0 38.8 58.1 149.2 168.2 9002.2 - 491.0 543.2 11.3 25.3 138.9 17.8 49.9 38.1 4.5 8.7 1.1 1.1 1.4 - - - - -
ML 7-1 1505.2 12.7 6543.4 156.1 49.5 78.5 272.0 174.1 7765.7 - 254.9 192.7 21.6 21.1 26.8 2.2 16.7 11.9 1.5 1.6 3.4 - - - - - - -
Blank-7 - - - - - - - - - - - - - - - - - - - - - - - - - - - -
ML 8 Field Blank - - - - - - - - - - - - - - - - - - - - - - - - - - - -
ML 8-9 714.3 385.2 688.2 565.6 363.9 70.7 269.1 151.5 9314 - 633.4 513.0 37.0 39.1 94.2 18.3 31.6 12.2 3.9 4.7 - - - - - - - -
ML 8-7 837.1 160.9 829.1 643.4 167.7 69.4 264.2 121.1 9855 - 842.4 642.0 54.4 31.1 155.4 19.5 48.9 20.9 6.0 4.2 - 0.9 3.6 - - - - -
ML 8-6 56.5 13.4 237.5 76.8 27.4 16.1 66.1 27.8 4443 - 146.9 246.2 5.2 16.8 68.8 13.3 34.9 6.7 1.8 2.0 - - 1.5 - - - - -
ML 8-5 922.1 325.4 818.1 625.8 327.0 78.7 294.2 137.5 11239 - 822.7 621.4 55.8 32.9 143.2 20.0 50.1 37.9 7.2 8.6 1.3 1.7 1.5 - - - - -
ML 8-4 1012.1 1057.0 745.8 551.3 350.0 63.4 240.0 116.9 12487 - 833.1 572.4 76.7 40.6 93.9 30.0 60.7 37.3 9.2 12.9 2.4 2.6 1.1 - - - - -
ML 8-3 44.4 4.6 96.7 30.3 9.8 2.5 32.5 9.9 2164 - 93.6 169.9 1.8 9.6 71.3 5.0 19.0 2.9 4.2 - 5.0 7.1 4.8 - - - - -
ML 8-2 157.3 58.4 334.6 205.5 88.4 18.5 75.5 38.6 1824 - 254.9 323 1.7 28.8 183.6 13.2 72.0 52.7 4.5 2.7 - - 1.7 - - - - -
ML 8-2 Field Duplicate 156.9 59.8 351.2 216.2 92.9 20.5 82.7 43.9 1800 - 250.4 318.7 - 27.8 178.9 12.4 69.0 47.1 4.0 2.7 - - - - - - - -
ML 8-1 1343.5 2621.2 12785.4 6794.2 3358.4 356.4 1969.8 820.8 6088 - 125.5 207.3 2.1 21.4 18.6 1.5 - 3.2 - 2.7 1.6 0.9 - - - - - -
Blank-8 - - - - - - - - - - - - - - - - - - - 3.1 - - - - - - - -
ID
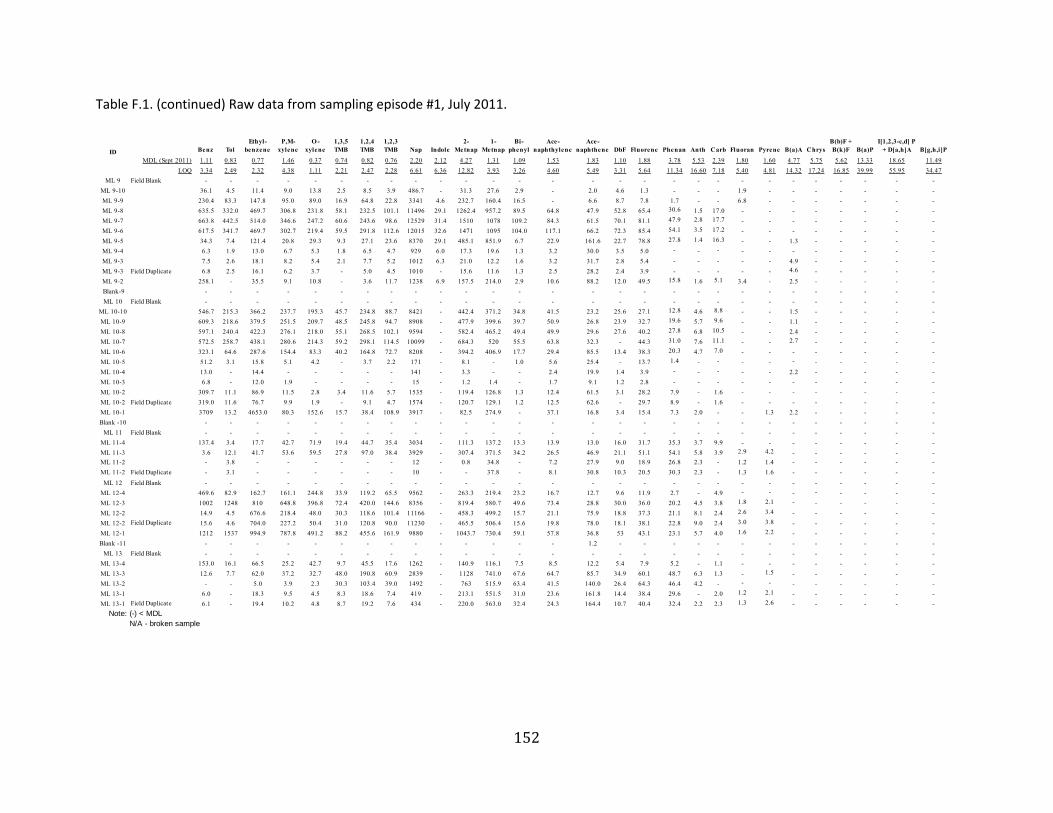
152
Table F.1. (continued) Raw data from sampling episode #1, July 2011.
Benz Tol
Ethyl-
benzene
P,M-
xylene
O -
xylene
1,3,5
TMB
1,2,4
TMB
1,2,3
TMB Nap Indole
2-
Metnap
1-
Metnap
Bi-
phenyl
Ace-
naphthylene
Ace-
naphthene DbF Fluorene Phenan Anth Carb Fluoran Pyrene B(a)A Chrys
B(b)F +
B(k)F B(a)P
I[1,2,3-c,d] P
+ D[a,h]A B[g,h,i]P
MDL (Sept 2011) 1.11 0.83 0.77 1.46 0.37 0.74 0.82 0.76 2.20 2.12 4.27 1.31 1.09 1.53 1.83 1.10 1.88 3.78 5.53 2.39 1.80 1.60 4.77 5.75 5.62 13.33 18.65 11.49
LOQ 3.34 2.49 2.32 4.38 1.11 2.21 2.47 2.28 6.61 6.36 12.82 3.93 3.26 4.60 5.49 3.31 5.64 11.34 16.60 7.18 5.40 4.81 14.32 17.24 16.85 39.99 55.95 34.47
ML 9 Field Blank - - - - - - - - - - - - - - - - - - - - - - - - - - - -
ML 9-10 36.1 4.5 11.4 9.0 13.8 2.5 8.5 3.9 486.7 - 31.3 27.6 2.9 - 2.0 4.6 1.3 - - - 1.9 - - - - - - -
ML 9-9 230.4 83.3 147.8 95.0 89.0 16.9 64.8 22.8 3341 4.6 232.7 160.4 16.5 - 6.6 8.7 7.8 1.7 - - 6.8 - - - - - - -
ML 9-8 635.5 332.0 469.7 306.8 231.8 58.1 232.5 101.1 11496 29.1 1262.4 957.2 89.5 64.8 47.9 52.8 65.4 30.6 1.5 17.0 - - - - - - - -
ML 9-7 663.8 442.5 514.0 346.6 247.2 60.6 243.6 98.6 12529 31.4 1510 1078 109.2 84.3 61.5 70.1 81.1 47.9 2.8 17.7 - - - - - - - -
ML 9-6 617.5 341.7 469.7 302.7 219.4 59.5 291.8 112.6 12015 32.6 1471 1095 104.0 117.1 66.2 72.3 85.4 54.1 3.5 17.2 - - - - - - - -
ML 9-5 34.3 7.4 121.4 20.8 29.3 9.3 27.1 23.6 8370 29.1 485.1 851.9 6.7 22.9 161.6 22.7 78.8 27.8 1.4 16.3 - - 1.3 - - - - -
ML 9-4 6.3 1.9 13.0 6.7 5.3 1.8 6.5 4.7 929 6.0 17.3 19.6 1.3 3.2 30.0 3.5 5.0 - - - - - - - - - - -
ML 9-3 7.5 2.6 18.1 8.2 5.4 2.1 7.7 5.2 1012 6.3 21.0 12.2 1.6 3.2 31.7 2.8 5.4 - - - - - 4.9 - - - - -
ML 9-3 Field Duplicate 6.8 2.5 16.1 6.2 3.7 - 5.0 4.5 1010 - 15.6 11.6 1.3 2.5 28.2 2.4 3.9 - - - - - 4.6 - - - - -
ML 9-2 258.1 - 35.5 9.1 10.8 - 3.6 11.7 1238 6.9 157.5 214.0 2.9 10.6 88.2 12.0 49.5 15.8 1.6 5.1 3.4 - 2.5 - - - - -
Blank-9 - - - - - - - - - - - - - - - - - - - - - - - - - - - -
ML 10 Field Blank - - - - - - - - - - - - - - - - - - - - - - - - - - - -
ML 10-10 546.7 215.3 366.2 237.7 195.3 45.7 234.8 88.7 8421 - 442.4 371.2 34.8 41.5 23.2 25.6 27.1 12.8 4.6 8.8 - - 1.5 - - - - -
ML 10-9 609.3 218.6 379.5 251.5 209.7 48.5 245.8 94.7 8908 - 477.9 399.6 39.7 50.9 26.8 23.9 32.7 19.6 5.7 9.6 - - 1.1 - - - - -
ML 10-8 597.1 240.4 422.3 276.1 218.0 55.1 268.5 102.1 9594 - 582.4 465.2 49.4 49.9 29.6 27.6 40.2 27.8 6.8 10.5 - - 2.4 - - - - -
ML 10-7 572.5 258.7 438.1 280.6 214.3 59.2 298.1 114.5 10099 - 684.3 520 55.5 63.8 32.3 - 44.3 31.0 7.6 11.1 - - 2.7 - - - - -
ML 10-6 323.1 64.6 287.6 154.4 83.3 40.2 164.8 72.7 8208 - 394.2 406.9 17.7 29.4 85.5 13.4 38.3 20.3 4.7 7.0 - - - - - - - -
ML 10-5 51.2 3.1 15.8 5.1 4.2 - 3.7 2.2 171 - 8.1 - 1.0 5.6 25.4 - 13.7 1.4 - - - - - - - - - -
ML 10-4 13.0 - 14.4 - - - - - 141 - 3.3 - - 2.4 19.9 1.4 3.9 - - - - - 2.2 - - - - -
ML 10-3 6.8 - 12.0 1.9 - - - - 15 - 1.2 1.4 - 1.7 9.1 1.2 2.8 - - - - - - - - - - -
ML 10-2 309.7 11.1 86.9 11.5 2.8 3.4 11.6 5.7 1535 - 119.4 126.8 1.3 12.4 61.5 3.1 28.2 7.9 - 1.6 - - - - - - - -
ML 10-2 Field Duplicate 319.0 11.6 76.7 9.9 1.9 - 9.1 4.7 1574 - 120.7 129.1 1.2 12.5 62.6 - 29.7 8.9 - 1.6 - - - - - - - -
ML 10-1 3709 13.2 4653.0 80.3 152.6 15.7 38.4 108.9 3917 - 82.5 274.9 - 37.1 16.8 3.4 15.4 7.3 2.0 - - 1.3 2.2 - - - - -
Blank -10 - - - - - - - - - - - - - - - - - - - - - - - - - - - -
ML 11 Field Blank - - - - - - - - - - - - - - - - - - - - - - - - - - - -
ML 11-4 137.4 3.4 17.7 42.7 71.9 19.4 44.7 35.4 3034 - 111.3 137.2 13.3 13.9 13.0 16.0 31.7 35.3 3.7 9.9 - - - - - - - -
ML 11-3 3.6 12.1 41.7 53.6 59.5 27.8 97.0 38.4 3929 - 307.4 371.5 34.2 26.5 46.9 21.1 51.1 54.1 5.8 3.9 2.9 4.2 - - - - - -
ML 11-2 - 3.8 - - - - - - 12 - 0.8 34.8 - 7.2 27.9 9.0 18.9 26.8 2.3 - 1.2 1.4 - - - - - -
ML 11-2 Field Duplicate - 3.1 - - - - - - 10 - - 37.8 - 8.1 30.8 10.3 20.5 30.3 2.3 - 1.3 1.6 - - - - - -
ML 12 Field Blank - - - - - - - - - - - - - - - - - - - - - - - - - - - -
ML 12-4 469.6 82.9 162.7 161.1 244.8 33.9 119.2 65.5 9562 - 263.3 219.4 23.2 16.7 12.7 9.6 11.9 2.7 - 4.9 - - - - - - - -
ML 12-3 1002 1248 810 648.8 396.8 72.4 420.0 144.6 8356 - 819.4 580.7 49.6 73.4 28.8 30.0 36.0 20.2 4.5 3.8 1.8 2.1 - - - - - -
ML 12-2 14.9 4.5 676.6 218.4 48.0 30.3 118.6 101.4 11166 - 458.3 499.2 15.7 21.1 75.9 18.8 37.3 21.1 8.1 2.4 2.6 3.4 - - - - - -
ML 12-2 Field Duplicate 15.6 4.6 704.0 227.2 50.4 31.0 120.8 90.0 11230 - 465.5 506.4 15.6 19.8 78.0 18.1 38.1 22.8 9.0 2.4 3.0 3.8 - - - - - -
ML 12-1 1212 1537 994.9 787.8 491.2 88.2 455.6 161.9 9880 - 1043.7 730.4 59.1 57.8 36.8 53 43.1 23.1 5.7 4.0 1.6 2.2 - - - - - -
Blank -11 - - - - - - - - - - - - - - 1.2 - - - - - - - - - - - - -
ML 13 Field Blank - - - - - - - - - - - - - - - - - - - - - - - - - - - -
ML 13-4 153.0 16.1 66.5 25.2 42.7 9.7 45.5 17.6 1262 - 140.9 116.1 7.5 8.5 12.2 5.4 7.9 5.2 - 1.1 - - - - - - - -
ML 13-3 12.6 7.7 62.0 37.2 32.7 48.0 190.8 60.9 2839 - 1128 741.0 67.6 64.7 85.7 34.9 60.1 48.7 6.3 1.3 - 1.5 - - - - - -
ML 13-2 - - 5.0 3.9 2.3 30.3 103.4 39.0 1492 - 763 515.9 63.4 41.5 140.0 26.4 64.3 46.4 4.2 - - - - - - - - -
ML 13-1 6.0 - 18.3 9.5 4.5 8.3 18.6 7.4 419 - 213.1 551.5 31.0 23.6 161.8 14.4 38.4 29.6 - 2.0 1.2 2.1 - - - - - -
ML 13-1 Field Duplicate 6.1 - 19.4 10.2 4.8 8.7 19.2 7.6 434 - 220.0 563.0 32.4 24.3 164.4 10.7 40.4 32.4 2.2 2.3 1.3 2.6 - - - - - -
ID
Note: (-) < MDL
N/A - broken sample

153
Table F.2. Raw data from sampling episode #2, November 2011.
Benz Tol
Ethyl-
benzene
P,M-
xylene
O -
xylene
1,3,5
TMB
1,2,4
TMB
1,2,3
TMB Nap Indole
2-
Metnap
1-
Metnap
Bi-
phenyl
Ace-
naphthylene
Ace-
naphthene DbF Fluorene Phenan Anth Carb Fluoran Pyrene B(a)A Chrys
B(b)F +
B(k)F B(a)P
I[1,2,3-c,d] P
+ D[a,h]A B[g,h,i]P
MDL (Sept 2011) 1.11 0.83 0.77 1.46 0.37 0.74 0.82 0.76 2.20 2.12 4.27 1.31 1.09 1.53 1.83 1.10 1.88 3.78 5.53 2.39 1.80 1.60 4.77 5.75 5.62 13.33 18.65 11.49
LOQ 3.34 2.49 2.32 4.38 1.11 2.21 2.47 2.28 6.61 6.36 12.82 3.93 3.26 4.60 5.49 3.31 5.64 11.34 16.60 7.18 5.40 4.81 14.32 17.24 16.85 39.99 55.95 34.47
ML 1 Field Blank - - - - - - - - - - - - - - - - - - - - - - - - - - - -
ML 1-10 - - 3.5 - - - - - 6 - 3.4 1.8 - - - - - - - - - - - - - - - -
ML 1-9 - - 19.9 3.2 - - 1.8 - 36 - 11.6 7.8 1.6 - - - - - - - - - - - - - - -
ML 1-8 - - 8.1 2.5 - - - - 12 - 4.0 - - - - - - - - - - - - - - - - -
ML 1-7 - - 7.2 2.7 - - - - 10 - 4.0 - - - - - - - - - - - - - - - - -
ML 1-6 - - 3.6 - - - - - 4 - - 7.5 - - 1.6 - - - - - - - - - - - - -
ML 1-5 - - 9.8 4.5 4.5 - - 12.2 11 - 3.9 19.4 - - 3.7 - - - - - - - - - - - - -
ML 1-4 30.7 - 567.4 49.6 25.9 15.5 38.1 35.6 1409 - 322.6 252.0 23.3 13.7 14.6 3.8 28.9 34.2 5.3 - 2.0 5.2 - - - - - -
ML 1-3 31.3 - 519.6 31.4 16.1 11.0 27.1 30.5 1227 - 264.5 218.5 19.5 12.1 13.3 3.0 26.0 30.6 4.2 - 1.9 4.9 - - - - - -
ML 1-1 24.0 - 556.4 24.7 8.6 5.9 18.9 27.7 1260 - 217.6 166.2 22.5 27.7 32.9 4.5 63.0 43.5 8.7 - 4.4 9.2 - - - - - -
ML 1-1 Field Duplicate 32.7 - 527.3 25.4 12.9 9.5 24.7 29.5 1196 - 247.9 207.9 18.6 22.4 13.2 3.2 49.1 43.9 6.9 - 2.3 5.1 - - - - - -
Blank-1 - - - - - - - - - - - - - - - - - - - - - - - - - - - -
ML 2 Field Blank - - - - - - - - - - - - - - - - - - - - - - - - - - - -
ML 2-10 - - - - - - - - - - - - - - - - - - - - - - - - - - - -
ML 2-9 12.7 - 18.6 3.4 - - - - 150 - 8.5 5.6 - - - - - - - - - - - - - - - -
ML 2-8 - - 3.3 1.6 - - - - 16 - 2.5 - - - - - - - - - - - - - - - - -
ML 2-7 - - 2.5 - - - - - 7 - - - - - - - - - - - - - - - - - - -
ML 2-6 - - 4.5 - - - - - 22 - 2.6 - - - - - - - - - - - - - - - - -
ML 2-5 - - 4.8 2.0 - - - - 56 - 3.7 32.5 - 44.9 17.2 29.2 89.3 16.7 2.8 - - - - - - - - -
ML 2-4 6.8 - 26.8 8.8 7.7 21.5 62.8 24.8 574 - 141.1 841.2 1.7 62.2 55.0 34.0 94.8 77.3 4.5 - - - - - - - - -
ML 2-3 - - 79.5 7.6 12.7 35.8 33.6 39.8 1952 - 380.7 1093.4 4.9 72.6 109.2 44.0 109.1 88.5 - 3.0 5.1 5.1 - - - - - -
ML 2-2 Field Duplicate - - 78.0 7.4 12.0 35.8 33.7 39.8 1974 - 377.0 1088.1 5.1 72.2 109.4 43.4 122.3 89.6 - 2.3 5.2 5.4 - - - - - -
ML 2-1 266.5 2.1 561.0 32.5 77.0 72.0 30.6 103.8 7590 - 532.4 1168.6 4.7 42.2 98.1 26.3 68.4 52.6 3.4 16.1 2.7 3.9 - - - - - -
Blank-2 - - - - - - - - - - - - - - - - - - - - - - - - - - - -
ML 3 Field Blank - - - - - - - - - - - - - - - - - - - - - - - - - - - -
ML 3-10 3.3 - 4.5 1.9 - - - - 30 - 8.4 4.6 - - - - - - - - - - - - - - - -
ML 3-9 6.0 - 8.9 2.8 - - - - 31 - 2.9 - - - - - - - - - - - - - - - - -
ML 3-8 15.2 - 14.7 3.7 2.9 - - - 253 - 5.4 4.8 - - - - - - - - - - - - - - - -
ML 3-7 36.7 2.2 24.8 8.8 9.8 5.7 7.3 6.3 351 - 11.1 82.2 1.5 4.3 4.5 3.3 2.1 - - - - - - - - - - -
ML 3-6 15.7 2.6 20.9 13.5 17.7 10.9 15.3 13.4 281 - 127.7 326.1 5.8 33.0 29.1 3.5 54.6 36.3 1.6 - - - - - - - - -
ML 3-5 40.5 13.8 66.2 28.8 54.8 9.8 - 20.0 389 - 4.0 125.0 - 25.2 32.2 13.3 49.9 27.5 - - - - - - - - - -
ML 3-4 137.0 17.9 84.5 6.2 69.3 24.4 4.5 56.3 1180 - 24.6 388.7 2.1 18.4 33.7 14.8 39.0 24.0 - - 2.0 - - - - - - -
ML 3-3 3027.4 63.9 1318.7 248.9 224.9 36.9 201.5 161.8 13437 - 1751.6 1325.8 60.7 42.4 111.4 23.9 59.5 24.1 - 18.2 1.6 - - - - - - -
ML 3-3 Field Duplicate 2944.4 63.0 1284.9 240.7 226.6 37.8 194.5 159.0 12981 - 1687.7 1289.6 59.0 41.5 106.4 25.2 58.8 23.4 - 17.1 - - - - - - - -
ML 3-1 77.5 1.8 36.6 7.6 7.0 - 5.7 4.2 362 - 49.2 38.3 2.5 - 3.0 - 1.8 - - - - - - - - - - -
Blank-3 - - - - - - - - - - - - - - - - - - - - - - - - - - - -
ML 4 Field Blank - - - - - - - - - - - - - - - - - - - - - - - - - - - -
ML 4-10 3.3 - 3.2 2.2 2.5 - 2.7 1.5 309 - 15.1 17.6 2.5 - 1.7 - - - - - - - - - - - - -
ML 4-9 87.8 70.1 101.8 103.7 28.5 1.7 11.4 4.5 295 - 29.4 8.4 2.1 - - - - - - - - - - - - - - -
ML 4-8 24.1 23.3 52.4 44.6 9.8 - 5.7 3.1 479 - 20.1 16.4 1.8 - - - - - - - - - - - - - - -
ML 4-7 80.8 91.6 95.6 99.8 31.5 - 9.7 4.5 826 - 34.0 22.9 2.2 - - - - - - - - - - - - - - -
ML 4-6 222.5 164.1 144.9 156.4 51.7 2.0 13.5 4.0 564 - 38.7 17.3 3.4 3.8 4.0 6.4 13.7 - - - - - - - - - - -
ML 4-5 24.8 119.6 500.0 886.5 476.4 96.8 298.3 143.8 5214 - 964.9 836.0 45.1 47.3 71.0 46.5 73.4 45.2 2.2 2.1 - - - - - - - -
ML 4-4 882.6 7846.0 3469.2 5565.5 3237.8 247.8 882.8 526.6 15760 - 1618.8 1106.6 71.6 54.6 57.0 68.0 62.4 48.4 2.6 14.0 - - 1.7 - - 2.0 - -
ML 4-2 9415.3 50.8 4340.1 782.3 144.1 65.0 247.0 234.8 14733 - 1944.3 1344.7 73.4 55.2 173.4 44.0 78.6 34.3 - 17.6 - - - - - - - -
ML 4-2 Field Duplicate 9522.6 46.6 4348.2 778.1 150.7 62.4 243.6 237.5 14698 - 1980.7 1371.4 73.9 58.9 177.9 42.4 80.7 34.1 - 17.3 - - - - - - - -
ML 4-1 4110.8 19.8 3857.8 66.2 49.3 10.9 34.6 45.8 5247 - 296.4 326.8 20.4 14.6 22.8 15.0 12.1 21.4 2.8 - 2.2 - - - - - - -
ID

154
Table F.2 (continued). Raw data from sampling episode #2, November 2011.
Benz Tol
Ethyl-
benzene
P,M-
xylene
O -
xylene
1,3,5
TMB
1,2,4
TMB
1,2,3
TMB Nap Indole
2-
Metnap
1-
Metnap
Bi-
phenyl
Ace-
naphthylene
Ace-
naphthene DbF Fluorene Phenan Anth Carb Fluoran Pyrene B(a)A Chrys
B(b)F +
B(k)F B(a)P
I[1,2,3-c,d] P
+ D[a,h]A
MDL (Sept 2011) 1.11 0.83 0.77 1.46 0.37 0.74 0.82 0.76 2.20 2.12 4.27 1.31 1.09 1.53 1.83 1.10 1.88 3.78 5.53 2.39 1.80 1.60 4.77 5.75 5.62 13.33 18.65
LOQ 3.34 2.49 2.32 4.38 1.11 2.21 2.47 2.28 6.61 6.36 12.82 3.93 3.26 4.60 5.49 3.31 5.64 11.34 16.60 7.18 5.40 4.81 14.32 17.24 16.85 39.99 55.95
Blank-4 - - - - - - - - - - - - - - - - - - - - - - - - - - -
ML 5 Field Blank - - - - - - - - - - - - - - - - - - - - - - - - - - -
ML 5-10 327.6 436.1 612.2 788.7 164.2 15.1 84.7 43.8 603 - 91.4 20.5 4.7 - - - - - - - - - - - - - -
ML 5-9 337.1 335.7 407.6 608.9 176.8 16.1 79.0 21.6 1251 - 113.8 45.9 6.0 - 3.3 - 2.9 1.5 - - - - - - - - -
ML 5-9 Field Duplicate 328.0 335.4 410.0 612.9 178.8 16.1 79.6 19.4 1270 - 117.2 45.8 5.9 1.3 3.7 5.1 3.0 1.3 - - - - 4.9 - - - -
ML 5-8 1210.0 850.2 909.1 1619.3 816.7 90.9 340.5 118.2 7730 - 756.9 462.0 48.0 16.1 21.3 26.5 31.5 11.0 - 2.2 - - - - - - -
ML 5-7 1262.9 891.0 1038.7 1861.6 976.2 143.0 506.2 219.4 10145 - 1428.2 896.1 76.6 48.4 49.0 65.1 54.9 39.6 - 4.6 - - 1.8 - - - -
ML 5-6 1304.1 833.0 958.5 1712.3 900.3 130.6 462.0 200.8 9104 - 1341.4 840.3 73.3 49.7 47.4 62.5 52.4 38.1 - 4.7 - - 2.3 - - - -
ML 5-5 2959.0 1664.2 1365.2 1911.7 859.6 77.4 289.1 113.2 6126 - 793.2 480.1 45.2 22.1 29.1 30.0 29.9 23.4 - - - - - - - - -
ML 5-4 314.1 952.0 1624.2 3064.5 1684.7 207.1 728.2 328.3 11519 - 1420.6 994.7 73.1 52.1 68.8 71.3 66.2 53.7 - 9.1 - - - - - - -
ML 5-4 Field Duplicate 659.5 845.8 1699.3 2725.5 1332.8 220.6 695.4 282.2 10390 - 1333.0 1039.9 54.3 41.1 115.2 45.0 79.8 56.4 2.0 10.1 1.7 1.5 - - - - -
ML 5-3 1083.3 1980.2 2006.5 1681.7 1251.3 197.4 634.1 280.2 12354 - 1661.5 1188.2 98.5 39.1 124.7 50.0 97.4 45.6 - 10.8 - - - - - - -
ML 5-2 15796 4049.8 5679.9 5473.7 2351.9 193.3 637.6 360.0 12469 - 1184.2 887.9 75.3 35.6 122.1 48.8 43.4 22.3 - 18.9 - - - - - - -
ML 5-1 4444.7 145.0 2786.7 958.5 358.4 52.5 201.2 125.8 3176 - 130.6 150.0 9.7 28.7 31.9 9.5 3.9 12.9 4.4 1.7 1.6 - 14.6 - - - -
Blank-5 - - - - - - - - - - - - - - - - - - - - - - - - - - -
ML 6 Field Blank - - - - - - - - - - - - - - - - - - - - - - - - - - -
ML 6-10 26.3 54.2 110.3 133.5 199.5 26.7 93.3 51.9 3103 - 246.5 201.3 13.6 12.9 9.7 18.4 11.5 7.3 - 3.2 - - - - - - -
ML 6-9 90.4 22.5 393.5 294.7 63.5 11.5 61.1 24.3 669 - 128.9 47.9 7.6 2.5 1.7 - 3.7 2.6 - - - - - - - - -
ML 6-8 1056.0 94.0 1029.3 660.7 262.7 35.5 137.8 46.3 3667 - 392.5 221.5 29.8 8.0 8.0 10.1 20.8 22.1 - - - - - - - - -
ML 6-7 778.2 57.4 819.3 708.4 360.0 113.8 313.8 133.8 6079 - 983.4 715.7 66.5 31.3 56.0 31.5 69.8 78.1 1.5 7.0 2.5 2.9 - - - - -
ML 6-6 798.1 90.5 1091.5 856.1 398.9 88.9 267.3 95.9 5004 - 740.5 598.0 51.7 23.4 58.0 27.9 52.4 49.2 - - - - - - - - -
ML 6-5 1632.3 116.4 1328.1 521.5 257.0 48.0 62.6 50.3 3257 - 266.5 530.1 15.0 17.9 122.7 16.1 47.2 48.5 - 3.9 1.4 1.5 - - - - -
ML 6-5 Field Duplicate 1317.4 136.0 917.0 404.5 257.2 63.2 62.4 84.9 3633 - 349.3 977.9 18.8 36.4 135.6 27.7 82.7 75.4 - 4.3 2.0 2.1 - - - - -
ML 6-4 99.1 29.8 771.3 163.2 270.0 93.4 141.2 115.8 4610 - 650.9 1212.7 56.3 44.2 167.2 36.1 96.1 94.2 2.1 4.1 2.3 2.5 - - - - -
ML 6-4 Field Duplicate 93.7 30.0 781.3 165.6 274.7 95.1 143.7 118.3 4748 - 661.1 1212.7 55.7 39.8 166.9 36.1 97.7 97.2 2.3 4.3 2.3 - - - - - -
ML 6-3 400.5 149.6 3164.4 1946.4 1799.0 187.7 625.0 282.4 14766 - 998.8 772.3 65.7 27.8 138.4 30.1 60.4 43.0 - 15.9 1.7 1.6 - - - - -
ML 6-2 6450.7 430.4 8661.9 7639.7 2708.8 314.5 1041.2 546.2 6938 - 397.9 332.3 28.4 28.3 51.1 32.8 34.6 20.3 1.8 15.5 1.5 2.0 - - - - -
ML 6-1 6659.6 1.7 5989.0 326.8 86.2 19.3 40.5 100.0 3858 - 121.6 88.3 18.3 33.6 15.4 8.9 24.1 14.1 2.9 2.9 3.4 3.0 - - - - -
Blank -6 - - - - - - - - - - - - - - - - - - - - - - - - - - -
ML 7 Field Blank - - - - - - - - - - - - - - - - - - - - - - - - - - -
ML 7-10 201.2 103.6 169.7 137.4 145.7 29.4 137.8 55.7 3960 - 312.6 272.4 16.7 17.0 23.4 30.4 13.7 6.5 - 3.2 - - - - - - -
ML 7-9 231.4 131.0 328.6 203.1 194.0 49.4 238.1 85.1 5169 - 542.8 416.2 29.7 46.6 37.6 40.0 26.0 19.8 - 3.2 - - - - 6.9 - -
ML 7-8 125.9 44.4 442.6 86.7 74.7 22.5 107.2 38.4 2647 - 316.4 209.1 16.2 17.7 20.8 13.5 13.7 12.3 - 1.6 - - - - 13.9 - -
ML 7-7 46.3 36.2 366.1 112.3 152.4 53.8 153.1 84.5 7189 - 686.0 704.5 30.1 34.8 150.0 42.8 67.5 63.3 2.7 3.9 - - - - - - -
ML 7-6 48.4 3.7 122.5 10.3 4.9 - 6.5 5.0 558 - 30.2 28.0 2.2 10.3 53.7 - 23.7 2.9 - - 2.9 3.1 - - - - -
ML 7-5 53.9 2.3 137.0 11.9 8.8 1.9 13.2 11.4 1372 - 28.8 120.0 3.2 19.9 89.9 11.6 48.9 6.6 - - 2.8 2.8 - - - - -
ML 7-5 Field Duplicate 44.8 1.7 128.5 10.5 9.2 2.0 13.1 12.5 1461 - 20.1 136.4 3.3 23.3 103.9 14.0 56.9 7.2 - - 2.9 2.6 - - - - -
ML 7-4 19.9 - 81.7 6.5 2.2 - 5.3 4.6 228 - 22.1 165.6 2.0 20.5 127.7 9.3 48.4 21.4 2.9 - 2.9 3.9 - - - - -
ML 7-3 6.0 - 56.1 5.3 1.9 5.5 14.0 10.9 1400 - 819.9 776.2 2.7 41.1 258.0 22.9 131.8 159.8 9.1 - 5.9 6.0 - - - - -
ML 7-2 437.7 1.6 1717.9 24.5 26.0 28.8 73.3 122.6 9160 - 1138.8 1248.7 8.4 43.1 345.2 34.1 122.1 113.8 6.8 12.8 2.3 2.3 - - - - -
ML 7-1 1282.5 4.9 6133.3 76.2 52.1 27.0 114.7 115.0 8433 - 569.1 399.5 34.4 28.4 88.7 5.9 41.7 37.3 - - 2.5 2.1 - - - - -
Blank-7 - - - - - - - - - - - - - - - - - - - - - - - - - - -
ML 8 Field Blank - - - - - - - - - - - - - - - - - - - - - - - - - - -
ML 8-10 271.6 77.9 155.6 123.6 112.2 19.0 68.2 38.3 3239 - 270.3 245.8 14.8 8.0 29.2 13.4 10.9 3.2 - 3.1 - - - - - - -
ML 8-9 694.8 404.8 738.6 592.8 305.1 45.0 170.4 79.6 7083 - 676.2 517.0 38.7 16.3 75.4 19.3 28.3 11.7 - 5.8 - - - - - - -
ML 8-8 790.3 391.9 814.5 670.5 351.3 61.3 231.9 109.4 9370 - 1171.6 881.1 66.7 33.1 154.6 29.0 49.1 30.6 2.3 8.8 1.6 - 2.2 - - - -
ML 8-8 Field Duplicate 810.8 483.0 985.0 786.0 392.3 65.5 248.1 116.2 9602 - 1226.2 919.2 69.3 37.2 190.0 32.9 50.9 32.1 2.0 8.0 - - - - - - -
ML 8-7 1066.1 327.2 1011.9 824.8 287.5 78.5 299.6 134.7 12190 - 1707.0 1252.6 101.9 57.6 250.1 46.5 87.4 37.3 2.1 7.8 1.5 - - - - - -
ML 8-6 99.2 45.7 548.4 228.9 66.3 12.5 69.8 38.3 2561 - 125.4 254.9 5.8 19.0 91.5 17.6 49.9 9.8 - 1.9 - - - - - - -
ML 8-5 1084.2 482.0 962.0 769.0 405.0 76.1 283.1 124.8 12373 - 1540.7 1155 91.5 42.5 238.8 38.6 77.3 54.2 2.7 12.0 - - - - - - -
ML 8-4 1094.8 1090.7 896.9 660.1 353.6 57.6 228.0 109.6 15824 - 1643.6 1131.5 143.6 72.2 171.4 52.3 107.0 70.9 3.9 27.0 2.1 - - - - - -
ML 8-3 35.2 32.8 131.6 117.6 56.2 8.3 38.8 29.7 5311 - 119.2 193.4 4.7 18.5 92.3 14.2 44.5 6.9 - - 6.4 8.4 - - - - -
ML 8-2 117.4 31.2 127.5 82.8 22.2 3.2 18.8 7.6 1419 - 294.6 509.1 2.9 40.8 287.7 11.5 128.6 87.5 5.4 2.4 - - - - - - -
Blank-8 - - - - - - - - - - - - - - - - - - - 3.1 - - - - - - -
ID
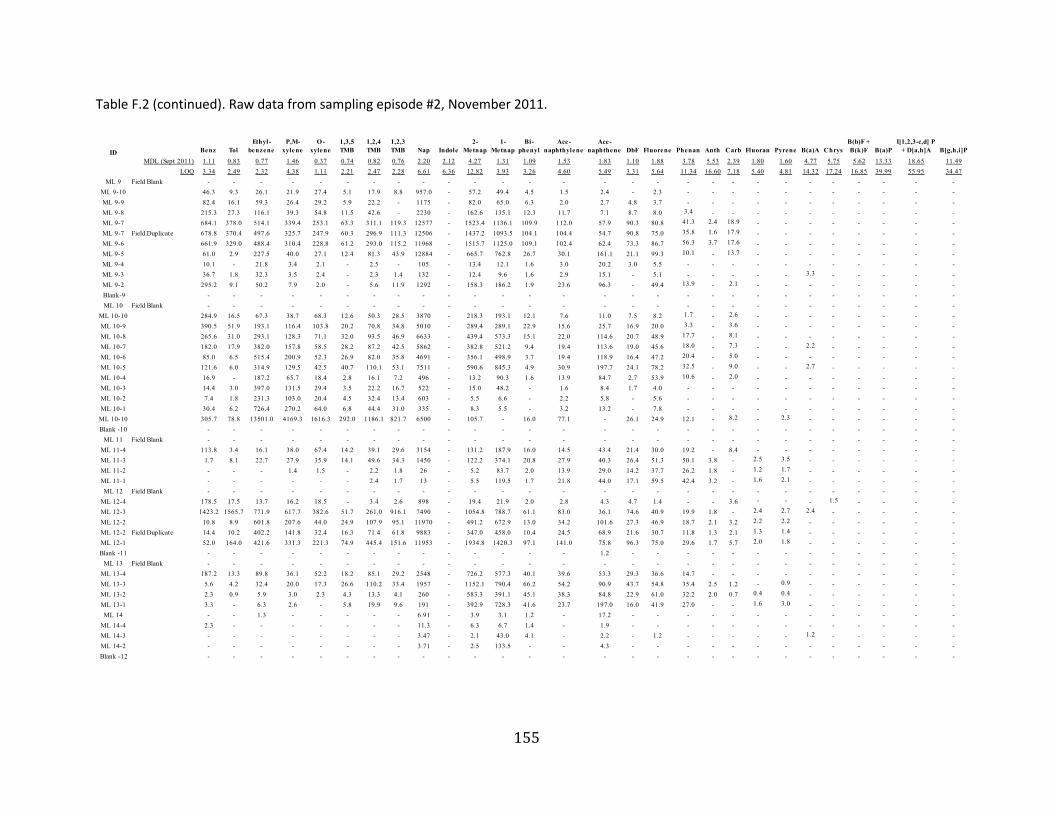
155
Table F.2 (continued). Raw data from sampling episode #2, November 2011.
Benz Tol
Ethyl-
benzene
P,M-
xylene
O -
xylene
1,3,5
TMB
1,2,4
TMB
1,2,3
TMB Nap Indole
2-
Metnap
1-
Metnap
Bi-
phenyl
Ace-
naphthylene
Ace-
naphthene DbF Fluorene Phenan Anth Carb Fluoran Pyrene B(a)A Chrys
B(b)F +
B(k)F B(a)P
I[1,2,3-c,d] P
+ D[a,h]A B[g,h,i]P
MDL (Sept 2011) 1.11 0.83 0.77 1.46 0.37 0.74 0.82 0.76 2.20 2.12 4.27 1.31 1.09 1.53 1.83 1.10 1.88 3.78 5.53 2.39 1.80 1.60 4.77 5.75 5.62 13.33 18.65 11.49
LOQ 3.34 2.49 2.32 4.38 1.11 2.21 2.47 2.28 6.61 6.36 12.82 3.93 3.26 4.60 5.49 3.31 5.64 11.34 16.60 7.18 5.40 4.81 14.32 17.24 16.85 39.99 55.95 34.47
ML 9 Field Blank - - - - - - - - - - - - - - - - - - - - - - - - - - - -
ML 9-10 46.3 9.3 26.1 21.9 27.4 5.1 17.9 8.8 957.0 - 57.2 49.4 4.5 1.5 2.4 - 2.3 - - - - - - - - - - -
ML 9-9 82.4 16.1 59.3 26.4 29.2 5.9 22.2 - 1175 - 82.0 65.0 6.3 2.0 2.7 4.8 3.7 - - - - - - - - - - -
ML 9-8 215.3 27.3 116.1 39.3 54.8 11.5 42.6 - 2230 - 162.6 135.1 12.3 11.7 7.1 8.7 8.0 3.4 - - - - - - - - - -
ML 9-7 684.1 378.0 514.1 339.4 253.1 63.3 311.1 119.3 12577 - 1523.4 1136.1 109.9 112.0 57.9 90.3 80.8 41.3 2.4 18.9 - - - - - - - -
ML 9-7 Field Duplicate 678.8 370.4 497.6 325.7 247.9 60.3 296.9 111.3 12506 - 1437.2 1093.5 104.1 104.4 54.7 90.8 75.0 35.8 1.6 17.9 - - - - - - - -
ML 9-6 661.9 329.0 488.4 310.4 228.8 61.2 293.0 115.2 11968 - 1515.7 1125.0 109.1 102.4 62.4 73.3 86.7 56.3 3.7 17.6 - - - - - - - -
ML 9-5 61.0 2.9 227.5 40.0 27.1 12.4 81.3 43.9 12884 - 665.7 762.8 26.7 30.1 161.1 21.1 99.3 10.1 - 13.7 - - - - - - - -
ML 9-4 10.1 - 21.8 3.4 2.1 - 2.5 - 105 - 13.4 12.1 1.6 3.0 20.2 3.0 5.5 - - - - - - - - - - -
ML 9-3 36.7 1.8 32.3 3.5 2.4 - 2.3 1.4 132 - 12.4 9.6 1.6 2.9 15.1 - 5.1 - - - - - 3.3 - - - - -
ML 9-2 295.2 9.1 50.2 7.9 2.0 - 5.6 11.9 1292 - 158.3 186.2 1.9 23.6 96.3 - 49.4 13.9 - 2.1 - - - - - - - -
Blank-9 - - - - - - - - - - - - - - - - - - - - - - - - - - - -
ML 10 Field Blank - - - - - - - - - - - - - - - - - - - - - - - - - - - -
ML 10-10 284.9 16.5 67.3 38.7 68.3 12.6 50.3 28.5 3870 - 218.3 193.1 12.1 7.6 11.0 7.5 8.2 1.7 - 2.6 - - - - - - - -
ML 10-9 390.5 51.9 193.1 116.4 103.8 20.2 70.8 34.8 5010 - 289.4 289.1 22.9 15.6 25.7 16.9 20.0 3.3 - 3.6 - - - - - - - -
ML 10-8 265.6 31.0 293.1 128.3 71.1 32.0 93.5 46.9 6633 - 439.4 573.3 15.1 22.0 114.6 20.7 48.9 17.7 - 8.1 - - - - - - - -
ML 10-7 182.0 17.9 382.0 157.8 58.5 28.2 87.2 42.5 5862 - 382.8 521.2 9.4 19.4 113.6 19.0 45.6 18.0 - 7.3 - - 2.2 - - - - -
ML 10-6 85.0 6.5 515.4 200.9 52.3 26.9 82.0 35.8 4691 - 356.1 498.9 3.7 19.4 118.9 16.4 47.2 20.4 - 5.0 - - - - - - - -
ML 10-5 121.6 6.0 314.9 129.5 42.5 40.7 110.1 53.1 7511 - 590.6 845.3 4.9 30.9 197.7 24.1 78.2 32.5 - 9.0 - - 2.7 - - - - -
ML 10-4 16.9 - 187.2 65.7 18.4 2.8 16.1 7.2 496 - 13.2 90.3 1.6 13.9 84.7 2.7 53.9 10.6 - 2.0 - - - - - - - -
ML 10-3 14.4 3.0 397.0 131.5 29.4 3.5 22.2 16.7 522 - 15.0 48.2 - 1.6 8.4 1.7 4.0 - - - - - - - - - - -
ML 10-2 7.4 1.8 231.3 103.0 20.4 4.5 32.4 13.4 603 - 5.5 6.6 - 2.2 5.8 - 5.6 - - - - - - - - - - -
ML 10-1 30.4 6.2 726.4 270.2 64.0 6.8 44.4 31.0 335 - 8.3 5.5 - 3.2 13.2 - 7.8 - - - - - - - - - - -
ML 10-10 305.7 78.8 13501.0 4169.3 1616.3 292.0 1186.1 821.7 6500 - 105.7 - 16.0 77.1 - 26.1 24.9 12.1 - 8.2 - 2.3 - - - - - -
Blank -10 - - - - - - - - - - - - - - - - - - - - - - - - - - - -
ML 11 Field Blank - - - - - - - - - - - - - - - - - - - - - - - - - - - -
ML 11-4 113.8 3.4 16.1 38.0 67.4 14.2 39.1 29.6 3154 - 131.2 187.9 16.0 14.5 43.4 21.4 30.0 19.2 - 8.4 - - - - - - - -
ML 11-3 1.7 8.1 22.7 27.9 35.9 14.1 49.6 34.3 1450 - 122.2 374.1 20.8 27.9 40.3 26.4 51.3 50.1 3.8 - 2.5 3.5 - - - - - -
ML 11-2 - - - 1.4 1.5 - 2.2 1.8 26 - 5.2 83.7 2.0 13.9 29.0 14.2 37.7 26.2 1.8 - 1.2 1.7 - - - - - -
ML 11-1 - - - - - - 2.4 1.7 13 - 5.5 119.5 1.7 21.8 44.0 17.1 59.5 42.4 3.2 - 1.6 2.1 - - - - - -
ML 12 Field Blank - - - - - - - - - - - - - - - - - - - - - - - - - - - -
ML 12-4 178.5 17.5 13.7 16.2 18.5 - 3.4 2.6 898 - 19.4 21.9 2.0 2.8 4.3 4.7 1.4 - - 3.6 - - - 1.5 - - - -
ML 12-3 1423.2 1565.7 771.9 617.7 382.6 51.7 261.0 916.1 7490 - 1054.8 788.7 61.1 83.0 36.1 74.6 40.9 19.9 1.8 - 2.4 2.7 2.4 - - - - -
ML 12-2 10.8 8.9 601.8 207.6 44.0 24.9 107.9 95.1 11970 - 491.2 672.9 13.0 34.2 101.6 27.3 46.9 18.7 2.1 3.2 2.2 2.2 - - - - - -
ML 12-2 Field Duplicate 14.4 10.2 402.2 141.8 32.4 16.3 71.4 61.8 9883 - 347.0 458.0 10.4 24.5 68.9 21.6 30.7 11.8 1.3 2.1 1.3 1.4 - - - - - -
ML 12-1 52.0 164.0 421.6 331.3 221.3 74.9 445.4 151.6 11953 - 1934.8 1420.3 97.1 141.0 75.8 96.3 75.0 29.6 1.7 5.7 2.0 1.8 - - - - - -
Blank -11 - - - - - - - - - - - - - - 1.2 - - - - - - - - - - - - -
ML 13 Field Blank - - - - - - - - - - - - - - - - - - - - - - - - - - - -
ML 13-4 187.2 13.3 89.8 36.1 52.2 18.2 85.1 29.2 2548 - 726.2 577.3 40.1 39.6 53.3 29.3 36.6 14.7 - - - - - - - - - -
ML 13-3 5.6 4.2 32.4 20.0 17.3 26.6 110.2 33.4 1957 - 1152.1 790.4 66.2 54.2 90.9 43.7 54.8 35.4 2.5 1.2 - 0.9 - - - - - -
ML 13-2 2.3 0.9 5.9 3.0 2.3 4.3 13.3 4.1 260 - 583.3 391.1 45.1 38.3 84.8 22.9 61.0 32.2 2.0 0.7 0.4 0.4 - - - - - -
ML 13-1 3.3 - 6.3 2.6 - 5.8 19.9 9.6 191 - 392.9 728.3 41.6 23.7 197.0 16.0 41.9 27.0 - - 1.6 3.0 - - - - - -
ML 14 - - 1.3 - - - - - 6.91 - 3.9 3.1 1.2 - 17.2 - - - - - - - - - - - - -
ML 14-4 2.3 - - - - - - - 11.3 - 6.3 6.7 1.4 - 1.9 - - - - - - - - - - - - -
ML 14-3 - - - - - - - - 3.47 - 2.1 43.0 4.1 - 2.2 - 1.2 - - - - - 1.2 - - - - -
ML 14-2 - - - - - - - - 3.71 - 2.5 133.5 - - 4.3 - - - - - - - - - - - - -
Blank -12 - - - - - - - - - - - - - - - - - - - - - - - - - - - -
ID
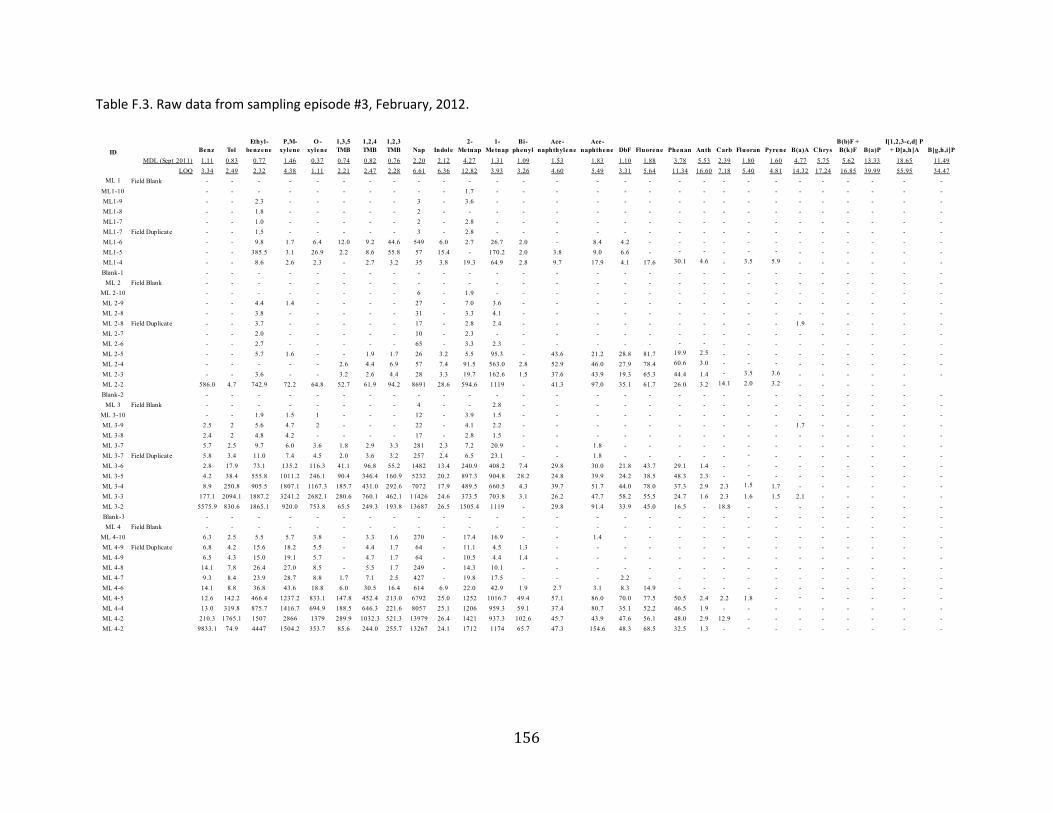
156
Table F.3. Raw data from sampling episode #3, February, 2012.
Benz Tol
Ethyl-
benzene
P,M-
xylene
O -
xylene
1,3,5
TMB
1,2,4
TMB
1,2,3
TMB Nap Indole
2-
Metnap
1-
Metnap
Bi-
phenyl
Ace-
naphthylene
Ace-
naphthene DbF Fluorene Phenan Anth Carb Fluoran Pyrene B(a)A Chrys
B(b)F +
B(k)F B(a)P
I[1,2,3-c,d] P
+ D[a,h]A B[g,h,i]P
MDL (Sept 2011) 1.11 0.83 0.77 1.46 0.37 0.74 0.82 0.76 2.20 2.12 4.27 1.31 1.09 1.53 1.83 1.10 1.88 3.78 5.53 2.39 1.80 1.60 4.77 5.75 5.62 13.33 18.65 11.49
LOQ 3.34 2.49 2.32 4.38 1.11 2.21 2.47 2.28 6.61 6.36 12.82 3.93 3.26 4.60 5.49 3.31 5.64 11.34 16.60 7.18 5.40 4.81 14.32 17.24 16.85 39.99 55.95 34.47
ML 1 Field Blank - - - - - - - - - - - - - - - - - - - - - - - - - - - -
ML1-10 - - - - - - - - - - 1.7 - - - - - - - - - - - - - - - - -
ML1-9 - - 2.3 - - - - - 3 - 3.6 - - - - - - - - - - - - - - - - -
ML1-8 - - 1.8 - - - - - 2 - - - - - - - - - - - - - - - - - - -
ML1-7 - - 1.0 - - - - - 2 - 2.8 - - - - - - - - - - - - - - - - -
ML1-7 Field Duplicate - - 1.5 - - - - - 3 - 2.8 - - - - - - - - - - - - - - - - -
ML1-6 - - 9.8 1.7 6.4 12.0 9.2 44.6 549 6.0 2.7 26.7 2.0 - 8.4 4.2 - - - - - - - - - - - -
ML1-5 - - 385.5 3.1 26.9 2.2 8.6 55.8 57 15.4 - 170.2 2.0 3.8 9.0 6.6 - - - - - - - - - - - -
ML1-4 - - 8.6 2.6 2.3 - 2.7 3.2 35 3.8 19.3 64.9 2.8 9.7 17.9 4.1 17.6 30.1 4.6 - 3.5 5.9 - - - - - -
Blank-1 - - - - - - - - - - - - - - - - - - - - - - - - - - - -
ML 2 Field Blank - - - - - - - - - - - - - - - - - - - - - - - - - - - -
ML 2-10 - - - - - - - - 6 - 1.9 - - - - - - - - - - - - - - - - -
ML 2-9 - - 4.4 1.4 - - - - 27 - 7.0 3.6 - - - - - - - - - - - - - - - -
ML 2-8 - - 3.8 - - - - - 31 - 3.3 4.1 - - - - - - - - - - - - - - - -
ML 2-8 Field Duplicate - - 3.7 - - - - - 17 - 2.8 2.4 - - - - - - - - - - 1.9 - - - - -
ML 2-7 - - 2.0 - - - - - 10 - 2.3 - - - - - - - - - - - - - - - - -
ML 2-6 - - 2.7 - - - - - 65 - 3.3 2.3 - - - - - - - - - - - - - - - -
ML 2-5 - - 5.7 1.6 - - 1.9 1.7 26 3.2 5.5 95.3 - 43.6 21.2 28.8 81.7 19.9 2.5 - - - - - - - - -
ML 2-4 - - - - - 2.6 4.4 6.9 57 7.4 91.5 563.0 2.8 52.9 46.0 27.9 78.4 60.6 3.0 - - - - - - - - -
ML 2-3 - - 3.6 - - 3.2 2.6 4.4 28 3.3 19.7 162.6 1.5 37.6 43.9 19.3 65.3 44.4 1.4 - 3.5 3.6 - - - - - -
ML 2-2 586.0 4.7 742.9 72.2 64.8 52.7 61.9 94.2 8691 28.6 594.6 1119 - 41.3 97.0 35.1 61.7 26.0 3.2 14.1 2.0 3.2 - - - - -
Blank-2 - - - - - - - - - - - - - - - - - - - - - - - - - - - -
ML 3 Field Blank - - - - - - - - 4 - - 2.8 - - - - - - - - - - - - - - - -
ML 3-10 - - 1.9 1.5 1 - - - 12 - 3.9 1.5 - - - - - - - - - - - - - - - -
ML 3-9 2.5 2 5.6 4.7 2 - - - 22 - 4.1 2.2 - - - - - - - - - - 1.7 - - - - -
ML 3-8 2.4 2 4.8 4.2 - - - - 17 - 2.8 1.5 - - - - - - - - - - - - - - - -
ML 3-7 5.7 2.5 9.7 6.0 3.6 1.8 2.9 3.3 281 2.3 7.2 20.9 - - 1.8 - - - - - - - - - - - - -
ML 3-7 Field Duplicate 5.8 3.4 11.0 7.4 4.5 2.0 3.6 3.2 257 2.4 6.5 23.1 - - 1.8 - - - - - - - - - - - - -
ML 3-6 2.8 17.9 73.1 135.2 116.3 41.1 96.8 55.2 1482 13.4 240.9 408.2 7.4 29.8 30.0 21.8 43.7 29.1 1.4 - - - - - - - - -
ML 3-5 4.2 38.4 555.8 1011.2 246.1 90.4 346.4 160.9 5232 20.2 897.3 904.8 28.2 24.8 39.9 24.2 38.5 48.3 2.3 - - - - - - - - -
ML 3-4 8.9 250.8 905.5 1807.1 1167.3 185.7 431.0 292.6 7072 17.9 489.5 660.5 4.3 39.7 51.7 44.0 78.0 37.3 2.9 2.3 1.5 1.7 - - - - - -
ML 3-3 177.1 2094.1 1887.2 3241.2 2682.1 280.6 760.1 462.1 11426 24.6 373.5 703.8 3.1 26.2 47.7 58.2 55.5 24.7 1.6 2.3 1.6 1.5 2.1 - - - - -
ML 3-2 5575.9 830.6 1865.1 920.0 753.8 65.5 249.3 193.8 13687 26.5 1505.4 1119 - 29.8 91.4 33.9 45.0 16.5 - 18.8 - - - - - - - -
Blank-3 - - - - - - - - - - - - - - - - - - - - - - - - - - - -
ML 4 Field Blank - - - - - - - - - - - - - - - - - - - - - - - - - - - -
ML 4-10 6.3 2.5 5.5 5.7 3.8 - 3.3 1.6 270 - 17.4 16.9 - - 1.4 - - - - - - - - - - - - -
ML 4-9 Field Duplicate 6.8 4.2 15.6 18.2 5.5 - 4.4 1.7 64 - 11.1 4.5 1.3 - - - - - - - - - - - - - - -
ML 4-9 6.5 4.3 15.0 19.1 5.7 - 4.7 1.7 64 - 10.5 4.4 1.4 - - - - - - - - - - - - - - -
ML 4-8 14.1 7.8 26.4 27.0 8.5 - 5.5 1.7 249 - 14.3 10.1 - - - - - - - - - - - - - - - -
ML 4-7 9.3 8.4 23.9 28.7 8.8 1.7 7.1 2.5 427 - 19.8 17.5 - - - 2.2 - - - - - - - - - - - -
ML 4-6 14.1 8.8 36.8 43.6 18.8 6.0 30.5 16.4 614 6.9 22.0 42.9 1.9 2.7 3.1 8.3 14.9 - - - - - - - - - - -
ML 4-5 12.6 142.2 466.4 1237.2 833.1 147.8 452.4 213.0 6792 25.0 1252 1016.7 49.4 57.1 86.0 70.0 77.5 50.5 2.4 2.2 1.8 - - - - - - -
ML 4-4 13.0 319.8 875.7 1416.7 694.9 188.5 646.3 221.6 8057 25.1 1206 959.3 59.1 37.4 80.7 35.1 52.2 46.5 1.9 - - - - - - - - -
ML 4-2 210.3 1765.1 1507 2866 1379 289.9 1032.3 521.3 13979 26.4 1421 937.3 102.6 45.7 43.9 47.6 56.1 48.0 2.9 12.9 - - - - - - - -
ML 4-2 9833.1 74.9 4447 1504.2 353.7 85.6 244.0 255.7 13267 24.1 1712 1174 65.7 47.3 154.6 48.3 68.5 32.5 1.3 - - - - - - - - -
ID
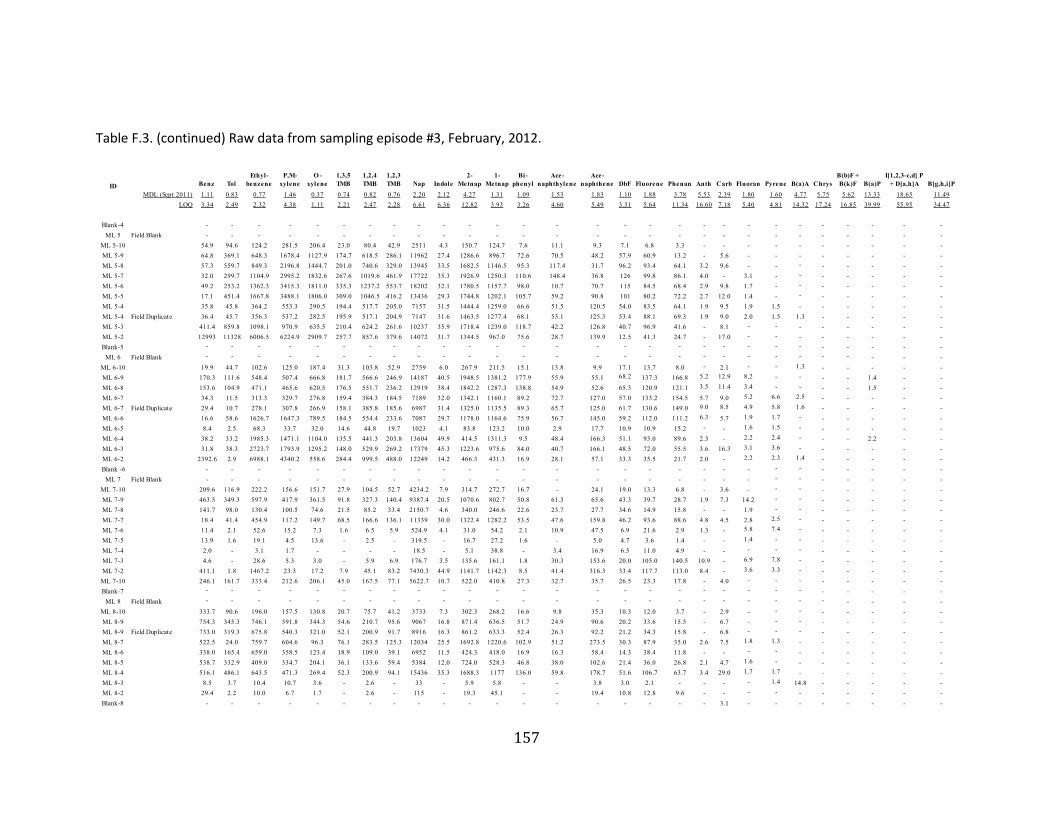
157
Table F.3. (continued) Raw data from sampling episode #3, February, 2012.
Benz Tol
Ethyl-
benzene
P,M-
xylene
O -
xylene
1,3,5
TMB
1,2,4
TMB
1,2,3
TMB Nap Indole
2-
Metnap
1-
Metnap
Bi-
phenyl
Ace-
naphthylene
Ace-
naphthene DbF Fluorene Phenan Anth Carb Fluoran Pyrene B(a)A Chrys
B(b)F +
B(k)F B(a)P
I[1,2,3-c,d] P
+ D[a,h]A B[g,h,i]P
MDL (Sept 2011) 1.11 0.83 0.77 1.46 0.37 0.74 0.82 0.76 2.20 2.12 4.27 1.31 1.09 1.53 1.83 1.10 1.88 3.78 5.53 2.39 1.80 1.60 4.77 5.75 5.62 13.33 18.65 11.49
LOQ 3.34 2.49 2.32 4.38 1.11 2.21 2.47 2.28 6.61 6.36 12.82 3.93 3.26 4.60 5.49 3.31 5.64 11.34 16.60 7.18 5.40 4.81 14.32 17.24 16.85 39.99 55.95 34.47
Blank-4 - - - - - - - - - - - - - - - - - - - - - - - - - - - -
ML 5 Field Blank - - - - - - - - - - - - - - - - - - - - - - - - - - - -
ML 5-10 54.9 94.6 124.2 281.5 206.4 23.0 80.4 42.9 2511 4.3 150.7 124.7 7.6 11.1 9.3 7.1 6.8 3.3 - - - - - - - - - -
ML 5-9 64.8 369.1 648.3 1678.4 1127.9 174.7 618.5 286.1 11962 27.4 1286.6 896.7 72.6 70.5 48.2 57.9 60.9 13.2 - 5.6 - - - - - - - -
ML 5-8 57.3 559.7 849.3 2196.8 1444.7 201.0 740.6 329.0 13945 33.5 1682.5 1146.5 95.3 117.4 31.7 96.2 93.4 64.1 3.2 9.6 - - - - - - - -
ML 5-7 32.0 299.7 1104.9 2995.2 1832.6 267.6 1019.6 461.9 17722 35.3 1926.9 1250.3 110.6 148.4 36.8 126 99.8 86.1 4.0 - 3.1 - - - - - - -
ML 5-6 49.2 253.2 1362.3 3415.3 1811.0 335.3 1237.2 553.7 18202 32.1 1780.5 1157.7 98.0 10.7 70.7 115 84.5 68.4 2.9 9.8 1.7 - - - - - - -
ML 5-5 17.1 451.4 1667.8 3488.1 1806.0 309.0 1046.5 416.2 13436 29.3 1744.8 1202.1 105.7 59.2 90.8 101 80.2 72.2 2.7 12.0 1.4 - - - - - - -
ML 5-4 35.8 45.8 364.2 553.3 290.5 194.4 517.7 205.0 7157 31.5 1444.4 1259.0 66.6 51.5 120.5 54.0 83.5 64.1 1.9 9.5 1.9 1.5 - - - - - -
ML 5-4 Field Duplicate 36.4 45.7 356.3 537.2 282.5 195.9 517.1 204.9 7147 31.6 1463.5 1277.4 68.1 53.1 125.3 53.4 88.1 69.3 1.9 9.0 2.0 1.5 1.3 - - - - -
ML 5-3 411.4 859.8 1098.1 970.9 635.5 210.4 624.2 261.6 10237 35.9 1718.4 1239.0 118.7 42.2 126.8 40.7 96.9 41.6 - 8.1 - - - - - - - -
ML 5-2 12993 11328 6006.5 6224.9 2909.7 257.7 857.6 379.6 14072 31.7 1344.5 967.0 75.6 28.7 139.9 12.5 41.3 24.7 - 17.0 - - - - - - - -
Blank-5 - - - - - - - - - - - - - - - - - - - - - - - - - - - -
ML 6 Field Blank - - - - - - - - - - - - - - - - - - - - - - - - - - - -
ML 6-10 19.9 44.7 102.6 125.0 187.4 31.3 103.8 52.9 2759 6.0 267.9 211.5 15.1 13.8 9.9 17.1 13.7 8.0 - 2.1 - - 1.3 - - - - -
ML 6-9 170.3 111.6 548.4 507.4 666.8 181.7 566.6 246.9 14187 40.5 1948.5 1381.2 177.9 55.9 55.1 68.2 137.3 166.8 5.2 12.9 8.2 - - - - 1.4 - -
ML 6-8 153.6 104.9 471.1 465.6 620.5 176.5 551.7 236.2 12919 38.4 1842.2 1287.3 138.8 54.9 52.6 65.3 120.9 121.1 3.5 11.4 3.4 - - - - 1.5 - -
ML 6-7 34.3 11.5 313.3 329.7 276.8 159.4 384.3 184.5 7189 32.0 1342.1 1160.1 89.2 72.7 127.0 57.0 133.2 154.5 5.7 9.0 5.2 6.6 2.5 - - - - -
ML 6-7 Field Duplicate 29.4 10.7 278.1 307.8 266.9 158.1 385.8 185.6 6987 31.4 1325.0 1135.5 89.3 65.7 125.0 61.7 130.6 149.0 9.0 8.5 4.9 5.8 1.6 - - - - -
ML 6-6 16.6 58.6 1626.7 1647.3 789.5 184.5 554.4 233.6 7087 29.7 1178.0 1164.6 75.9 56.7 145.0 59.2 112.0 111.2 6.3 5.7 1.9 1.7 - - - - - -
ML 6-5 8.4 2.5 68.3 33.7 32.0 14.6 44.8 19.7 1023 4.1 83.8 123.2 10.0 2.9 17.7 10.9 10.9 15.2 - - 1.6 1.5 - - - - - -
ML 6-4 38.2 33.2 1985.3 1471.1 1104.0 135.5 441.3 203.8 13604 49.9 414.5 1311.3 9.5 48.4 166.3 51.1 93.0 89.6 2.3 - 2.2 2.4 - - - 2.2 - -
ML 6-3 31.8 38.3 2723.7 1793.9 1295.2 148.0 529.9 269.2 17379 45.3 1223.6 975.6 84.0 40.7 166.1 48.5 72.0 55.5 3.6 16.3 3.1 3.6 - - - - - -
ML 6-2 2392.6 2.9 6988.1 4340.2 558.6 284.4 999.5 488.0 12249 14.2 466.3 431.3 16.9 28.1 57.1 33.3 35.5 21.7 2.0 - 2.2 2.3 1.4 - - - - -
Blank -6 - - - - - - - - - - - - - - - - - - - - - - - - - - - -
ML 7 Field Blank - - - - - - - - - - - - - - - - - - - - - - - - - - - -
ML 7-10 209.6 116.9 222.2 156.6 151.7 27.9 104.5 52.7 4234.2 7.9 314.7 272.7 16.7 - 24.1 19.0 13.3 6.8 - 3.6 - - - - - - - -
ML 7-9 463.5 349.3 597.9 417.9 361.5 91.8 327.3 140.4 9387.4 20.5 1070.6 802.7 50.8 61.3 65.6 43.3 39.7 28.7 1.9 7.3 14.2 - - - - - - -
ML 7-8 141.7 98.0 130.4 100.5 74.6 21.5 85.2 33.4 2150.7 4.6 340.0 246.6 22.6 23.7 27.7 34.6 14.9 15.8 - - 1.9 - - - - - - -
ML 7-7 18.4 41.4 454.9 117.2 149.7 68.5 166.6 136.1 11339 30.0 1322.4 1282.2 53.5 47.6 159.8 46.2 93.6 88.6 4.8 4.5 2.8 2.5 - - - - - -
ML 7-6 11.4 2.1 52.6 15.2 7.3 1.6 6.5 5.9 524.9 4.1 31.0 54.2 2.1 10.9 47.5 6.9 21.6 2.9 1.3 - 5.8 7.4 - - - - - -
ML 7-5 13.9 1.6 19.1 4.5 13.6 - 2.5 - 319.5 - 16.7 27.2 1.6 - 5.0 4.7 3.6 1.4 - - 1.4 - - - - - - -
ML 7-4 2.0 - 3.1 1.7 - - - - 18.5 - 5.1 38.8 - 3.4 16.9 6.5 11.0 4.9 - - - - - - - - - -
ML 7-3 4.6 - 28.6 5.3 3.0 - 5.9 6.9 176.7 3.5 135.6 161.1 1.8 30.3 153.6 20.0 105.0 140.5 10.9 - 6.9 7.8 - - - - - -
ML 7-2 411.1 1.8 1467.2 23.3 17.2 7.9 45.1 83.2 7430.3 44.9 1141.7 1142.3 8.5 41.4 316.3 33.4 117.7 113.0 8.4 - 3.6 3.3 - - - - - -
ML 7-10 246.1 161.7 333.4 212.6 206.1 45.0 167.5 77.1 5622.7 10.7 522.0 410.8 27.3 32.7 35.7 26.5 23.3 17.8 - 4.0 - - - - - - - -
Blank-7 - - - - - - - - - - - - - - - - - - - - - - - - - - - -
ML 8 Field Blank - - - - - - - - - - - - - - - - - - - - - - - - - - - -
ML 8-10 333.7 90.6 196.0 157.5 130.8 20.7 75.7 41.2 3733 7.3 302.3 268.2 16.6 9.8 35.3 10.3 12.0 3.7 - 2.9 - - - - - - - -
ML 8-9 754.3 345.3 746.1 591.8 344.3 54.6 210.7 95.6 9067 16.8 871.4 636.5 51.7 24.9 90.6 20.2 33.6 15.5 - 6.7 - - - - - - - -
ML 8-9 Field Duplicate 733.0 319.3 675.8 540.3 321.0 52.1 200.9 91.7 8916 16.3 861.2 633.3 52.4 26.3 92.2 21.2 34.3 15.8 - 6.8 - - - - - - - -
ML 8-7 522.5 24.0 759.7 604.6 96.3 76.1 283.5 125.3 12034 25.5 1692.8 1220.6 102.9 51.2 273.5 30.3 87.9 35.0 2.6 7.5 1.8 1.3 - - - - - -
ML 8-6 338.0 165.4 659.0 358.5 123.4 18.9 109.0 39.1 6952 11.5 424.3 418.0 16.9 16.3 58.4 14.3 38.4 11.8 - - - - - - - - - -
ML 8-5 538.7 332.9 409.0 334.7 204.1 36.1 133.6 59.4 5384 12.0 724.0 528.3 46.8 38.0 102.6 21.4 36.0 26.8 2.1 4.7 1.6 - - - - - - -
ML 8-4 516.1 486.1 643.5 471.3 269.4 52.3 200.9 94.1 15436 35.3 1688.3 1177 136.0 59.8 178.7 51.6 106.7 63.7 3.4 29.0 1.7 1.7 - - - - - -
ML 8-3 8.5 3.7 10.4 10.7 3.6 - 2.6 - 33 - 5.9 5.8 - - 3.8 3.0 2.1 - - - - 1.4 14.8 - - - - -
ML 8-2 29.4 2.2 10.0 6.7 1.7 - 2.6 - 115 - 19.3 45.1 - - 19.4 10.8 12.8 9.6 - - - - - - - - - -
Blank-8 - - - - - - - - - - - - - - - - - - - 3.1 - - - - - - - -
ID
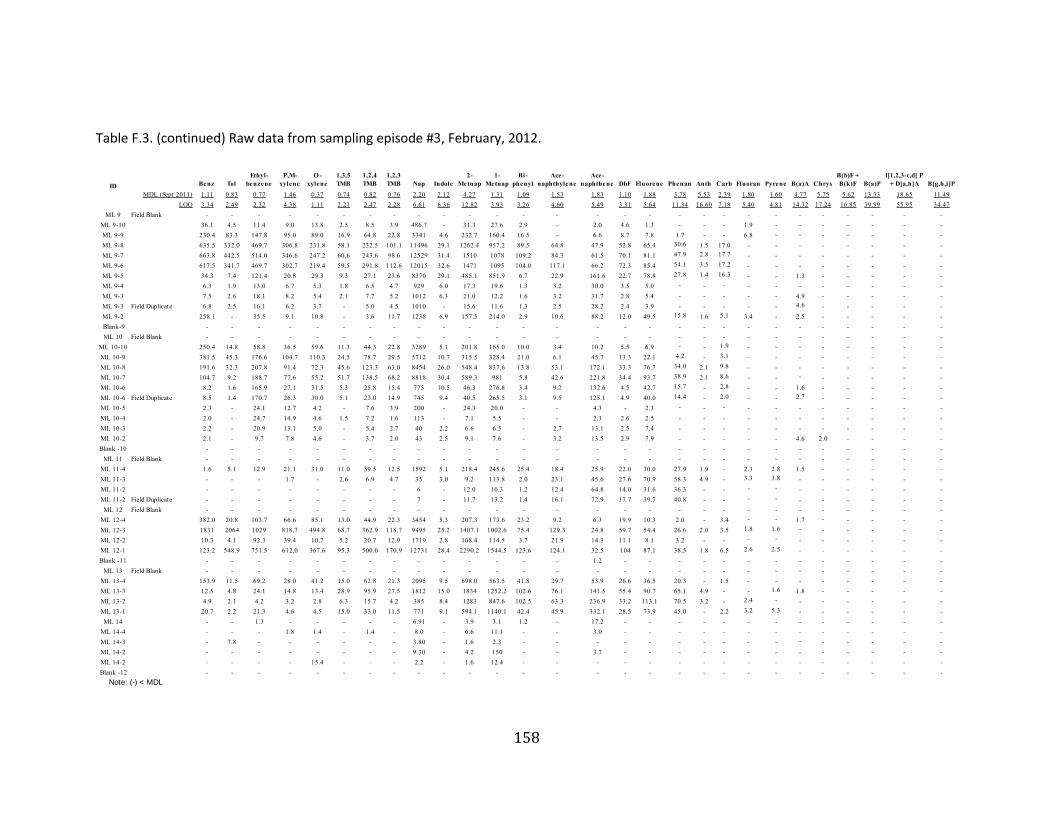
158
Table F.3. (continued) Raw data from sampling episode #3, February, 2012.
Benz Tol
Ethyl-
benzene
P,M-
xylene
O -
xylene
1,3,5
TMB
1,2,4
TMB
1,2,3
TMB Nap Indole
2-
Metnap
1-
Metnap
Bi-
phenyl
Ace-
naphthylene
Ace-
naphthene DbF Fluorene Phenan Anth Carb Fluoran Pyrene B(a)A Chrys
B(b)F +
B(k)F B(a)P
I[1,2,3-c,d] P
+ D[a,h]A B[g,h,i]P
MDL (Sept 2011) 1.11 0.83 0.77 1.46 0.37 0.74 0.82 0.76 2.20 2.12 4.27 1.31 1.09 1.53 1.83 1.10 1.88 3.78 5.53 2.39 1.80 1.60 4.77 5.75 5.62 13.33 18.65 11.49
LOQ 3.34 2.49 2.32 4.38 1.11 2.21 2.47 2.28 6.61 6.36 12.82 3.93 3.26 4.60 5.49 3.31 5.64 11.34 16.60 7.18 5.40 4.81 14.32 17.24 16.85 39.99 55.95 34.47
ML 9 Field Blank - - - - - - - - - - - - - - - - - - - - - - - - - - - -
ML 9-10 36.1 4.5 11.4 9.0 13.8 2.5 8.5 3.9 486.7 - 31.3 27.6 2.9 - 2.0 4.6 1.3 - - - 1.9 - - - - - - -
ML 9-9 230.4 83.3 147.8 95.0 89.0 16.9 64.8 22.8 3341 4.6 232.7 160.4 16.5 - 6.6 8.7 7.8 1.7 - - 6.8 - - - - - - -
ML 9-8 635.5 332.0 469.7 306.8 231.8 58.1 232.5 101.1 11496 29.1 1262.4 957.2 89.5 64.8 47.9 52.8 65.4 30.6 1.5 17.0 - - - - - - - -
ML 9-7 663.8 442.5 514.0 346.6 247.2 60.6 243.6 98.6 12529 31.4 1510 1078 109.2 84.3 61.5 70.1 81.1 47.9 2.8 17.7 - - - - - - - -
ML 9-6 617.5 341.7 469.7 302.7 219.4 59.5 291.8 112.6 12015 32.6 1471 1095 104.0 117.1 66.2 72.3 85.4 54.1 3.5 17.2 - - - - - - - -
ML 9-5 34.3 7.4 121.4 20.8 29.3 9.3 27.1 23.6 8370 29.1 485.1 851.9 6.7 22.9 161.6 22.7 78.8 27.8 1.4 16.3 - - 1.3 - - - - -
ML 9-4 6.3 1.9 13.0 6.7 5.3 1.8 6.5 4.7 929 6.0 17.3 19.6 1.3 3.2 30.0 3.5 5.0 - - - - - - - - - - -
ML 9-3 7.5 2.6 18.1 8.2 5.4 2.1 7.7 5.2 1012 6.3 21.0 12.2 1.6 3.2 31.7 2.8 5.4 - - - - - 4.9 - - - - -
ML 9-3 Field Duplicate 6.8 2.5 16.1 6.2 3.7 - 5.0 4.5 1010 - 15.6 11.6 1.3 2.5 28.2 2.4 3.9 - - - - - 4.6 - - - - -
ML 9-2 258.1 - 35.5 9.1 10.8 - 3.6 11.7 1238 6.9 157.5 214.0 2.9 10.6 88.2 12.0 49.5 15.8 1.6 5.1 3.4 - 2.5 - - - - -
Blank-9 - - - - - - - - - - - - - - - - - - - - - - - - - - - -
ML 10 Field Blank - - - - - - - - - - - - - - - - - - - - - - - - - - - -
ML 10-10 250.4 14.8 58.8 36.5 59.6 11.3 44.3 22.8 3289 5.1 201.8 165.0 10.0 3.4 10.2 5.5 6.9 - - 1.9 - - - - - - - -
ML 10-9 381.5 45.3 176.6 104.7 110.3 24.5 78.7 29.5 5712 10.7 315.5 328.4 21.0 6.1 45.7 13.3 22.1 4.2 - 3.1 - - - - - - - -
ML 10-8 191.6 32.3 207.8 91.4 72.3 45.6 123.3 63.0 8454 26.0 548.4 837.6 13.8 53.1 172.1 33.3 76.7 34.0 2.1 9.8 - - - - - - - -
ML 10-7 104.7 9.2 188.7 77.6 55.2 51.7 138.5 68.2 8818 30.4 589.3 981 5.8 42.6 221.8 34.4 93.7 38.9 2.1 8.6 - - - - - - - -
ML 10-6 8.2 1.6 165.9 27.1 31.5 5.3 25.8 15.4 775 10.5 46.3 276.8 3.4 9.2 132.6 4.5 42.7 15.7 - 2.8 - - 1.6 - - - - -
ML 10-6 Field Duplicate 8.5 1.4 170.7 26.3 30.0 5.1 23.0 14.9 745 9.4 40.5 265.5 3.1 9.5 125.1 4.9 40.0 14.4 - 2.0 - - 2.7 - - - - -
ML 10-5 2.3 - 24.1 12.7 4.2 - 7.6 3.9 200 - 24.3 20.0 - - 4.3 - 2.3 - - - - - - - - - - -
ML 10-4 2.0 - 24.7 14.9 4.6 1.5 7.2 1.6 113 - 7.1 5.5 - - 2.3 2.6 2.5 - - - - - - - - - - -
ML 10-3 2.2 - 20.9 13.1 5.0 - 5.4 2.7 40 2.2 6.6 6.5 - 2.7 13.1 2.5 7.4 - - - - - - - - - - -
ML 10-2 2.1 - 9.7 7.8 4.6 - 3.7 2.0 43 2.5 9.1 7.6 - 3.2 13.5 2.9 7.9 - - - - - 4.6 2.0 - - - -
Blank -10 - - - - - - - - - - - - - - - - - - - - - - - - - - - -
ML 11 Field Blank - - - - - - - - - - - - - - - - - - - - - - - - - - - -
ML 11-4 1.6 5.1 12.9 21.1 31.0 11.0 39.5 12.5 1592 5.1 218.4 245.6 25.4 18.4 25.9 22.0 30.0 27.9 1.9 - 2.3 2.8 1.5 - - - - -
ML 11-3 - - - 1.7 - 2.6 6.9 4.7 35 3.0 9.2 113.8 2.0 23.1 45.6 27.6 70.9 58.3 4.9 - 3.3 3.8 - - - - - -
ML 11-2 - - - - - - - - 6 - 12.0 10.3 1.2 12.4 64.8 14.0 31.6 36.3 - - - - - - - - - -
ML 11-2 Field Duplicate - - - - - - - - 7 - 11.7 13.2 1.4 16.1 72.9 17.7 39.7 40.8 - - - - - - - - - -
ML 12 Field Blank - - - - - - - - - - - - - - - - - - - - - - - - - - - -
ML 12-4 382.0 20.8 103.7 66.6 85.1 13.0 44.9 22.3 3454 5.3 207.3 173.6 23.2 9.2 6.3 19.9 10.3 2.0 - 3.4 - - 1.7 - - - - -
ML 12-3 1831 2064 1029 818.7 494.8 68.7 362.9 118.7 9495 25.2 1407.1 1002.6 75.4 129.3 24.8 59.7 54.4 26.6 2.0 3.5 1.8 1.6 - - - - - -
ML 12-2 10.3 4.1 92.3 39.4 10.7 5.2 20.7 12.9 1719 2.8 108.4 114.5 3.7 21.9 14.3 11.1 8.1 3.2 - - - - - - - - - -
ML 12-1 123.2 548.9 751.5 612.0 367.6 95.3 500.0 170.9 12731 28.4 2290.2 1544.5 123.6 124.1 32.5 104 87.1 38.5 1.8 6.5 2.6 2.5 - - - - - -
Blank -11 - - - - - - - - - - - - - - 1.2 - - - - - - - - - - - - -
ML 13 Field Blank - - - - - - - - - - - - - - - - - - - - - - - - - - - -
ML 13-4 153.9 11.5 69.2 28.0 41.2 15.0 62.8 21.3 2095 9.5 698.0 563.5 41.8 29.7 53.9 26.6 36.5 20.3 - 1.5 - - - - - - - -
ML 13-3 12.5 4.8 24.1 14.8 13.4 28.9 95.9 27.5 1812 15.0 1834 1252.2 102.6 76.1 141.5 55.4 90.7 65.1 4.9 - - 1.6 1.8 - - - - -
ML 13-2 4.9 2.1 4.2 3.2 2.8 6.3 15.7 4.2 385 8.4 1283 847.6 102.5 63.3 236.9 33.2 113.1 70.5 3.2 - 2.4 - - - - - - -
ML 13-1 20.7 2.2 21.3 4.6 4.5 15.0 33.0 11.5 771 9.1 594.1 1140.1 42.4 45.9 332.1 28.5 73.9 45.0 - 2.2 3.2 5.3 - - - - - -
ML 14 - - 1.3 - - - - - 6.91 - 3.9 3.1 1.2 - 17.2 - - - - - - - - - - - - -
ML 14-4 - - - 1.8 1.4 - 1.4 - 8.0 - 6.6 11.1 - - 3.0 - - - - - - - - - - - - -
ML 14-3 - 7.8 - - - - - - 3.80 - 1.6 2.3 - - - - - - - - - - - - - - - -
ML 14-2 - - - - - - - - 9.30 - 4.2 150 - - 3.7 - - - - - - - - - - - - -
ML 14-2 - - - - 15.4 - - - 2.2 - 1.6 12.4 - - - - - - - - - - - - - - - -
Blank -12 - - - - - - - - - - - - - - - - - - - - - - - - - - - -
ID
Note: (-) < MDL

159
Table F.4. Raw results from NOI Tests.
Table F.4(b). Raw pH results from NOI Tests.
Day 0 0.041667 1 2 3 4 7 12 15 20 25 50
Flask 1 0.461 0.440 0.441 0.434 0.413 0.435 0.405 0.398 0.205 0.211 0.191
0.418 0.434 0.414 0.439 0.411 0.432 0.381 0.388 0.203 0.201 0.198
0.529 0.404 0.410 0.450 0.410 0.457 0.440 0.388 0.203 0.208 0.191
1 0.9319799 0.8462362 0.8376618 0.8259167 0.8172153 0.8063784 0.7919387 0.7876413 0.7718357 0.7787923 0.7733333
Flask 2 0.436 0.450 0.438 0.445 0.417 0.407 0.406 0.435 0.211 0.238 0.211
0.472 0.404 0.430 0.443 0.419 0.457 0.454 0.439 0.209 0.227 0.219
0.439 0.454 0.477 0.398 0.432 0.431 0.439 0.438 0.218 0.239 0.212
1 0.8917463 0.8760232 0.8704272 0.8685127 0.8646405 0.8612449 0.8590871 0.8486615 0.8475311 0.8402415 0.836
Flask 3 0.464 0.468 0.450 0.456 0.452 0.450 0.457 0.448 0.233 0.248 0.212
0.445 0.463 0.457 0.457 0.453 0.452 0.450 0.442 0.231 0.241 0.210
0.499 0.471 0.451 0.454 0.455 0.456 0.458 0.448 0.243 0.243 0.215
1 0.9319799 0.9180225 0.9109002 0.9064938 0.9003207 0.8950015 0.8903619 0.8858102 0.8878197 0.8806406 0.8593333
Flask 4 0.436 0.455 0.448 0.419 0.450 0.412 0.438 0.438 0.214 0.220 0.189
0.45 0.392 0.439 0.427 0.407 0.429 0.431 0.431 0.213 0.215 0.188
0.471 0.412 0.494 0.413 0.411 0.425 0.438 0.432 0.202 0.215 0.191
1 0.918342 0.9037044 0.8941716 0.8637044 0.8596405 0.8483214 0.8353636 0.8310765 0.8254577 0.7850242 0.7573333
Control 0.499 0.477 0.478 0.500 0.477 0.501 0.501 0.493 0.243 0.291 0.244
0.482 0.479 0.489 0.497 0.458 0.511 0.486 0.501 0.254 0.263 0.234
0.51 0.489 0.482 0.487 0.483 0.485 0.478 0.482 0.282 0.266 0.244
1 0.9867239 0.98 0.9590221 0.9821069 0.95 0.97 0.96 0.96 0.9783445 0.970 0.963
Day 0 1 2 3 4 7 12 15 20 25 53
Flask 1 7.82 7.39 7.12 6.95 6.80 6.33 5.47 4.68 3.91 3.73 3.30
Flask 2 8.82 7.96 7.44 7.36 7.39 7.30 6.80 6.77 6.53 6.24 4.85
Flask 3 8.51 7.8 7.40 7.39 7.38 7.38 6.89 6.81 6.64 6.31 4.20
Flask 4 7.95 7.42 7.18 6.98 6.83 6.40 5.56 4.96 4.23 3.80 3.58
Control 3.65 3.71 3.69 3.68 3.7 3.62 3.55 3.45 3.55 3.53 3.54
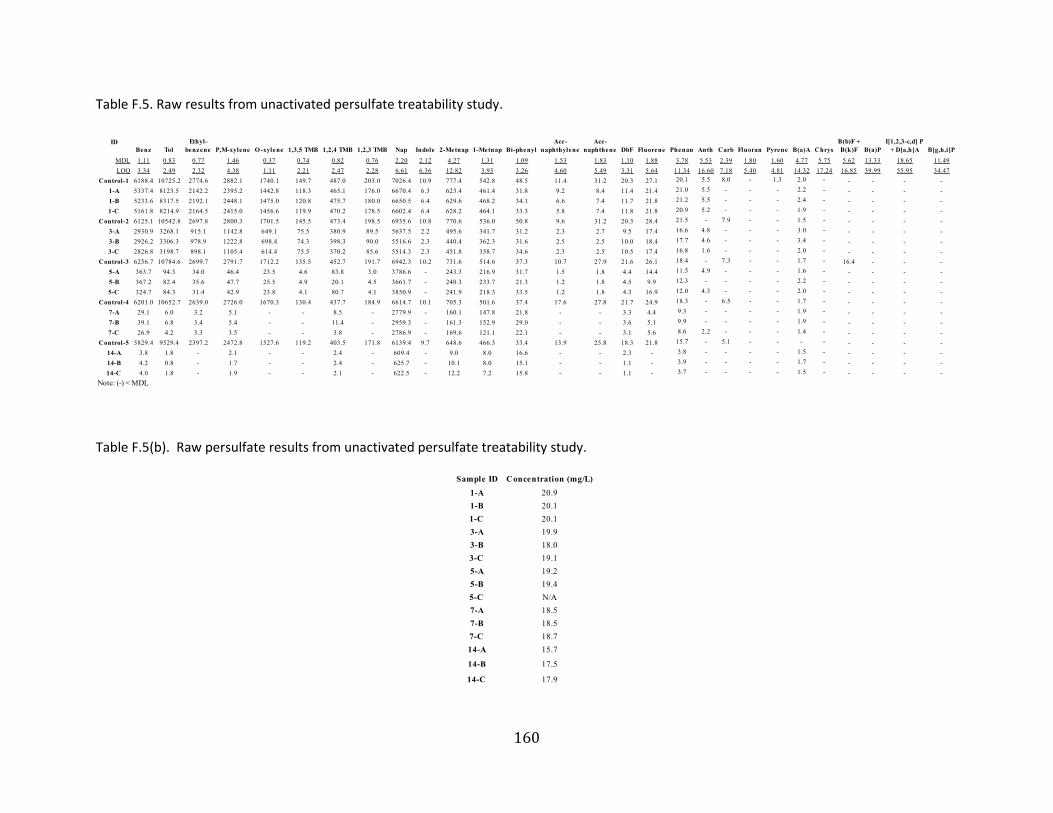
160
Table F.5. Raw results from unactivated persulfate treatability study.
Table F.5(b). Raw persulfate results from unactivated persulfate treatability study.
ID
Benz Tol
Ethyl-
benzene P,M-xylene O -xylene 1,3,5 TMB 1,2,4 TMB 1,2,3 TMB Nap Indole 2-Metnap 1-Metnap Bi-phenyl
Ace-
naphthylene
Ace-
naphthene DbF Fluorene Phenan Anth Carb Fluoran Pyrene B(a)A Chrys
B(b)F +
B(k)F B(a)P
I[1,2,3-c,d] P
+ D[a,h]A B[g,h,i]P
MDL 1.11 0.83 0.77 1.46 0.37 0.74 0.82 0.76 2.20 2.12 4.27 1.31 1.09 1.53 1.83 1.10 1.88 3.78 5.53 2.39 1.80 1.60 4.77 5.75 5.62 13.33 18.65 11.49
LOQ 3.34 2.49 2.32 4.38 1.11 2.21 2.47 2.28 6.61 6.36 12.82 3.93 3.26 4.60 5.49 3.31 5.64 11.34 16.60 7.18 5.40 4.81 14.32 17.24 16.85 39.99 55.95 34.47
Control-1 6188.4 10725.2 2774.6 2882.1 1740.1 149.7 487.0 203.0 7026.4 10.9 777.4 542.8 48.5 11.4 31.2 20.3 27.1 20.1 5.5 8.0 - 1.3 2.0 - - - - -
1-A 5337.4 8123.5 2142.2 2395.2 1442.8 118.3 465.1 176.0 6670.4 6.3 623.4 461.4 31.8 9.2 8.4 11.4 21.4 21.0 5.5 - - - 2.2 - - - - -
1-B 5233.6 8317.5 2192.1 2448.1 1475.0 120.8 475.7 180.0 6650.5 6.4 629.6 468.2 34.1 6.6 7.4 11.7 21.8 21.2 5.5 - - - 2.4 - - - - -
1-C 5161.8 8214.9 2164.5 2415.0 1456.6 119.9 470.2 178.5 6602.4 6.4 628.2 464.1 33.3 5.8 7.4 11.8 21.8 20.9 5.2 - - - 1.9 - - - - -
Control-2 6125.1 10542.8 2697.8 2800.3 1701.5 145.5 473.4 198.5 6935.6 10.8 770.6 536.0 50.8 9.6 31.2 20.3 28.4 21.5 - 7.9 - - 1.5 - - - - -
3-A 2930.9 3268.1 915.1 1142.8 649.1 75.5 380.9 89.5 5637.5 2.2 495.6 341.7 31.2 2.3 2.7 9.5 17.4 16.6 4.8 - - - 3.0 - - - - -
3-B 2926.2 3306.3 978.9 1222.8 698.4 74.3 398.3 90.0 5516.6 2.3 440.4 362.3 31.6 2.5 2.5 10.0 18.4 17.7 4.6 - - - 3.4 - - - - -
3-C 2826.8 3198.7 898.1 1105.4 614.4 75.5 370.2 85.6 5514.3 2.3 451.8 358.7 34.6 2.3 2.5 10.5 17.4 16.8 1.6 - - - 2.0 - - - - -
Control-3 6256.7 10784.6 2699.7 2791.7 1712.2 135.5 452.7 191.7 6942.3 10.2 731.6 514.6 37.3 10.7 27.9 21.6 26.1 18.4 - 7.3 - - 1.7 - 16.4 - - -
5-A 363.7 94.3 34.0 46.4 23.5 4.6 83.8 3.0 3786.6 - 243.3 216.9 31.7 1.5 1.8 4.4 14.4 11.5 4.9 - - - 1.6 - - - - -
5-B 367.2 82.4 35.6 47.7 25.5 4.9 20.1 4.5 3661.7 - 240.3 233.7 21.3 1.2 1.8 4.5 9.9 12.3 - - - - 2.2 - - - - -
5-C 324.7 84.3 31.4 42.9 23.8 4.1 80.7 4.1 3850.9 - 241.9 218.3 33.5 1.2 1.8 4.3 16.9 12.0 4.3 - - - 2.0 - - - - -
Control-4 6201.0 10652.7 2639.0 2726.0 1670.3 130.4 437.7 184.9 6614.7 10.1 705.3 501.6 37.4 17.6 27.8 21.7 24.9 18.3 - 6.5 - - 1.7 - - - - -
7-A 29.1 6.0 3.2 5.1 - - 8.5 - 2779.9 - 160.1 147.8 21.8 - - 3.3 4.4 9.3 - - - - 1.9 - - - - -
7-B 39.1 6.8 3.4 5.4 - - 11.4 - 2959.3 - 161.3 152.9 29.0 - - 3.6 5.1 9.9 - - - - 1.9 - - - - -
7-C 26.9 4.2 3.3 3.5 - - 3.8 - 2786.9 - 169.6 121.1 22.1 - - 3.1 5.6 8.6 2.2 - - - 1.4 - - - - -
Control-5 5829.4 9529.4 2397.2 2472.8 1527.6 119.2 403.5 171.8 6139.4 9.7 648.6 466.3 33.4 13.9 25.8 18.3 21.8 15.7 - 5.1 - - - - - - - -
14-A 3.8 1.8 - 2.1 - - 2.4 - 609.4 - 9.0 8.0 16.6 - - 2.3 - 3.8 - - - - 1.5 - - - - -
14-B 4.2 0.8 - 1.7 - - 2.4 - 625.7 - 10.1 8.0 15.1 - - 1.1 - 3.9 - - - - 1.7 - - - - -
14-C 4.0 1.8 - 1.9 - - 2.1 - 622.5 - 12.2 7.2 15.8 - - 1.1 - 3.7 - - - - 1.5 - - - - -
Note: (-) < MDL
Sample ID Concentration (mg/L)
1-A 20.9
1-B 20.1
1-C 20.1
3-A 19.9
3-B 18.0
3-C 19.1
5-A 19.2
5-B 19.4
5-C N/A
7-A 18.5
7-B 18.5
7-C 18.7
14-A 15.7
14-B 17.5
14-C 17.9
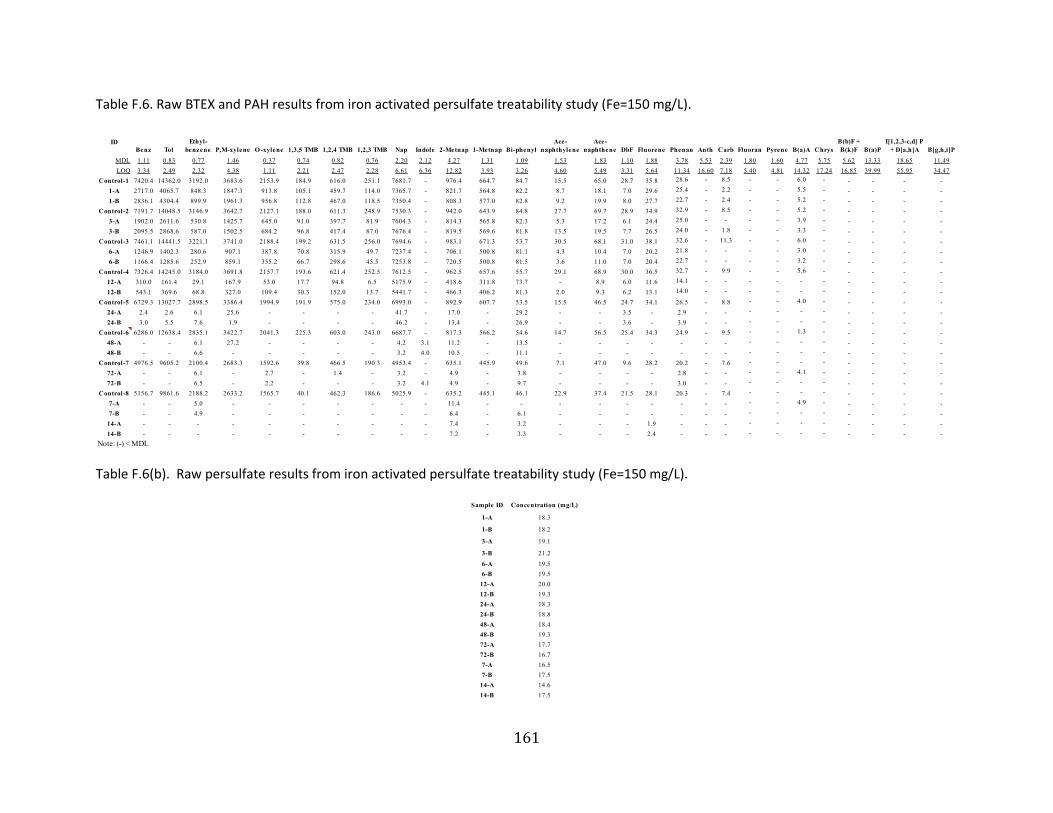
161
Table F.6. Raw BTEX and PAH results from iron activated persulfate treatability study (Fe=150 mg/L).
Table F.6(b). Raw persulfate results from iron activated persulfate treatability study (Fe=150 mg/L).
ID
Benz Tol
Ethyl-
benzene P,M-xylene O -xylene 1,3,5 TMB 1,2,4 TMB 1,2,3 TMB Nap Indole 2-Metnap 1-Metnap Bi-phenyl
Ace-
naphthylene
Ace-
naphthene DbF Fluorene Phenan Anth Carb Fluoran Pyrene B(a)A Chrys
B(b)F +
B(k)F B(a)P
I[1,2,3-c,d] P
+ D[a,h]A B[g,h,i]P
MDL 1.11 0.83 0.77 1.46 0.37 0.74 0.82 0.76 2.20 2.12 4.27 1.31 1.09 1.53 1.83 1.10 1.88 3.78 5.53 2.39 1.80 1.60 4.77 5.75 5.62 13.33 18.65 11.49
LOQ 3.34 2.49 2.32 4.38 1.11 2.21 2.47 2.28 6.61 6.36 12.82 3.93 3.26 4.60 5.49 3.31 5.64 11.34 16.60 7.18 5.40 4.81 14.32 17.24 16.85 39.99 55.95 34.47
Control-1 7420.4 14362.0 3192.0 3683.6 2153.9 184.9 616.0 251.1 7681.7 - 976.4 664.7 84.7 15.5 65.0 28.7 35.8 28.6 - 8.5 - - 6.0 - - - - -
1-A 2717.0 4065.7 848.3 1847.3 913.8 105.1 459.7 114.0 7365.7 - 821.7 564.8 82.2 8.7 18.1 7.0 29.6 25.4 - 2.2 - - 5.5 - - - - -
1-B 2836.1 4304.4 899.9 1961.3 956.8 112.8 467.0 118.5 7350.4 - 808.3 577.0 82.8 9.2 19.9 8.0 27.7 22.7 - 2.4 - - 5.2 - - - - -
Control-2 7191.7 14048.5 3146.9 3642.7 2127.1 188.0 611.3 248.9 7530.3 - 942.0 643.9 84.8 27.7 69.7 28.9 34.9 32.9 - 8.5 - - 5.2 - - - - -
3-A 1902.0 2611.6 530.8 1425.7 645.0 91.0 397.7 81.9 7604.3 - 814.3 565.8 82.3 5.3 17.2 6.1 24.4 25.0 - - - - 3.9 - - - - -
3-B 2095.5 2868.6 587.0 1502.5 684.2 96.8 417.4 87.0 7676.4 - 819.5 569.6 81.8 13.5 19.5 7.7 26.5 24.0 - 1.8 - - 3.3 - - - - -
Control-3 7461.1 14441.5 3221.1 3741.0 2188.4 199.2 631.5 256.0 7694.6 - 983.1 671.3 53.7 30.5 68.1 31.0 38.1 32.6 - 11.3 - - 6.0 - - - - -
6-A 1246.9 1402.3 280.6 907.1 387.8 70.8 315.9 49.7 7237.4 - 706.1 500.8 81.1 4.3 10.4 7.0 20.2 21.8 - - - - 3.0 - - - - -
6-B 1166.4 1285.6 252.9 859.1 355.2 66.7 298.6 45.5 7253.8 - 720.5 500.8 81.5 3.6 11.0 7.0 20.4 22.7 - - - - 3.2 - - - - -
Control-4 7326.4 14245.0 3184.0 3691.8 2157.7 193.6 621.4 252.5 7612.5 - 962.5 657.6 55.7 29.1 68.9 30.0 36.5 32.7 - 9.9 - - 5.6 - - - - -
12-A 310.0 161.4 29.1 167.9 53.0 17.7 94.8 6.5 5175.9 - 418.6 311.8 73.7 - 8.9 6.0 11.6 14.1 - - - - - - - - - -
12-B 543.1 369.6 68.8 327.0 109.4 30.3 152.0 13.7 5441.7 - 466.3 406.2 81.3 2.0 9.3 6.2 13.1 14.0 - - - - - - - - - -
Control-5 6729.3 13027.7 2898.5 3386.4 1994.9 191.9 575.0 234.0 6993.0 - 892.9 607.7 53.5 15.5 46.5 24.7 34.1 26.5 - 8.8 - - 4.0 - - - - -
24-A 2.4 2.6 6.1 25.6 - - - - 41.7 - 17.0 - 29.2 - - 3.5 - 2.9 - - - - - - - - - -
24-B 3.0 5.5 7.6 1.9 - - - - 46.2 - 13.4 - 26.9 - - 3.6 - 3.9 - - - - - - - - - -
Control-6 6286.0 12638.4 2835.1 3422.7 2041.3 225.3 603.0 243.0 6687.7 - 817.3 566.2 54.6 14.7 56.5 25.4 34.3 24.9 - 9.5 - - 1.3 - - - - -
48-A - - 6.1 27.2 - - - - 4.2 3.1 11.2 - 13.5 - - - - - - - - - - - - - - -
48-B - - 6.6 - - - - - 3.2 4.0 10.5 - 11.1 - - - - - - - - - - - - - - -
Control-7 4976.5 9605.2 2100.4 2683.3 1592.6 39.8 466.5 190.3 4953.4 - 635.1 445.9 49.6 7.1 47.0 9.6 28.2 20.2 - 7.6 - - - - - - - -
72-A - - 6.1 - 2.7 - 1.4 - 3.2 - 4.9 - 3.8 - - - - 2.8 - - - - 4.1 - - - - -
72-B - - 6.5 - 2.2 - - - 3.2 4.1 4.9 - 9.7 - - - - 3.0 - - - - - - - - - -
Control-8 5156.7 9861.6 2188.2 2633.2 1565.7 40.1 462.3 186.6 5025.9 - 635.2 445.1 46.1 22.9 37.4 21.5 28.1 20.3 - 7.4 - - - - - - - -
7-A - - 5.0 - - - - - - - 11.4 - - - - - - - - - - - 4.9 - - - - -
7-B - - 4.9 - - - - - - - 6.4 - 6.1 - - - - - - - - - - - - - - -
14-A - - - - - - - - - - 7.4 - 3.2 - - - 1.9 - - - - - - - - - - -
14-B - - - - - - - - - - 7.2 - 3.3 - - - 2.4 - - - - - - - - - - -
Note: (-) < MDL
Sample ID Concentration (mg/L)
1-A 18.3
1-B 18.2
3-A 19.1
3-B 21.2
6-A 19.5
6-B 19.5
12-A 20.0
12-B 19.3
24-A 18.3
24-B 18.8
48-A 18.4
48-B 19.3
72-A 17.7
72-B 16.7
7-A 16.5
7-B 17.5
14-A 14.6
14-B 17.5
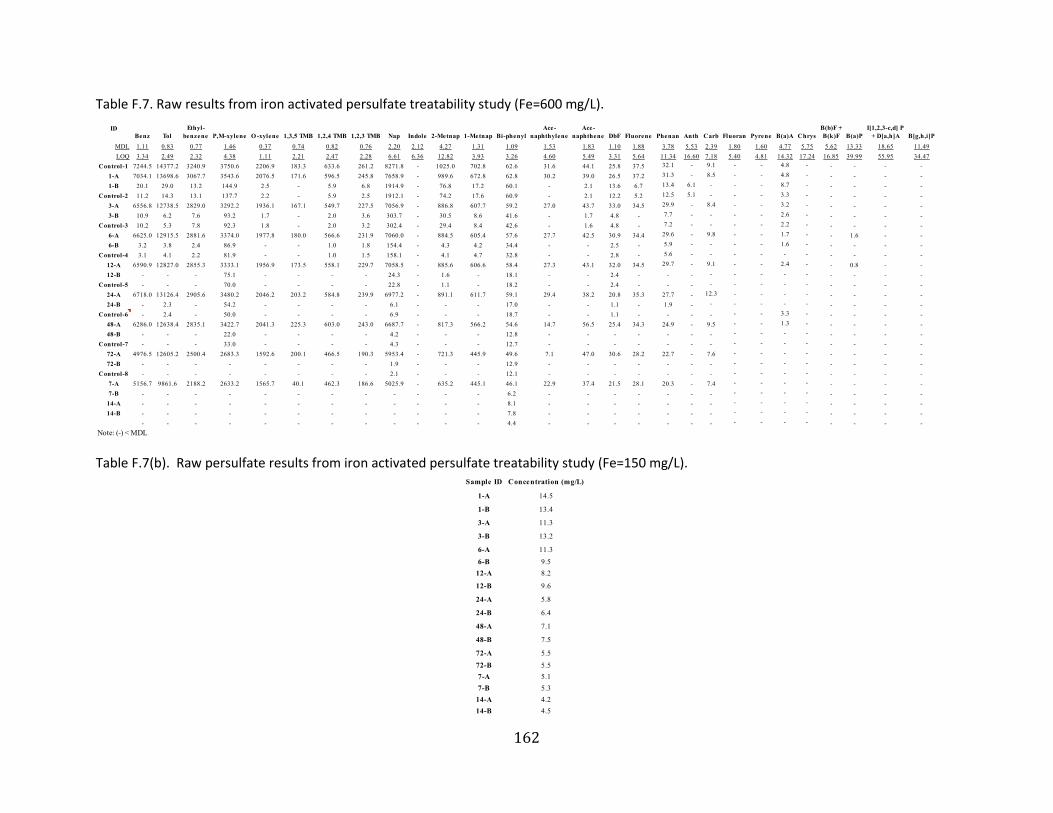
162
Table F.7. Raw results from iron activated persulfate treatability study (Fe=600 mg/L).
Table F.7(b). Raw persulfate results from iron activated persulfate treatability study (Fe=150 mg/L).
ID
Benz Tol
Ethyl-
benzene P,M-xylene O -xylene 1,3,5 TMB 1,2,4 TMB 1,2,3 TMB Nap Indole 2-Metnap 1-Metnap Bi-phenyl
Ace-
naphthylene
Ace-
naphthene DbF Fluorene Phenan Anth Carb Fluoran Pyrene B(a)A Chrys
B(b)F +
B(k)F B(a)P
I[1,2,3-c,d] P
+ D[a,h]A B[g,h,i]P
MDL 1.11 0.83 0.77 1.46 0.37 0.74 0.82 0.76 2.20 2.12 4.27 1.31 1.09 1.53 1.83 1.10 1.88 3.78 5.53 2.39 1.80 1.60 4.77 5.75 5.62 13.33 18.65 11.49
LOQ 3.34 2.49 2.32 4.38 1.11 2.21 2.47 2.28 6.61 6.36 12.82 3.93 3.26 4.60 5.49 3.31 5.64 11.34 16.60 7.18 5.40 4.81 14.32 17.24 16.85 39.99 55.95 34.47
Control-1 7244.5 14377.2 3240.9 3750.6 2206.9 183.3 633.6 261.2 8271.8 - 1025.0 702.8 62.6 31.6 44.1 25.8 37.5 32.1 - 9.1 - - 4.8 - - - - -
1-A 7034.1 13698.6 3067.7 3543.6 2076.5 171.6 596.5 245.8 7658.9 - 989.6 672.8 62.8 30.2 39.0 26.5 37.2 31.3 - 8.5 - - 4.8 - - - - -
1-B 20.1 29.0 13.2 144.9 2.5 - 5.9 6.8 1914.9 - 76.8 17.2 60.1 - 2.1 13.6 6.7 13.4 6.1 - - - 8.7 - - - - -
Control-2 11.2 14.3 13.1 137.7 2.2 - 5.9 2.5 1912.1 - 74.2 17.6 60.9 - 2.1 12.2 5.2 12.5 5.1 - - - 3.3 - - - - -
3-A 6556.8 12738.5 2829.0 3292.2 1936.1 167.1 549.7 227.5 7056.9 - 886.8 607.7 59.2 27.0 43.7 33.0 34.5 29.9 - 8.4 - - 3.2 - - - - -
3-B 10.9 6.2 7.6 93.2 1.7 - 2.0 3.6 303.7 - 30.5 8.6 41.6 - 1.7 4.8 - 7.7 - - - - 2.6 - - - - -
Control-3 10.2 5.3 7.8 92.3 1.8 - 2.0 3.2 302.4 - 29.4 8.4 42.6 - 1.6 4.8 - 7.2 - - - - 2.2 - - - - -
6-A 6625.0 12915.5 2881.6 3374.0 1977.8 180.0 566.6 231.9 7060.0 - 884.5 605.4 57.6 27.7 42.5 30.9 34.4 29.6 - 9.8 - - 1.7 - - 1.6 - -
6-B 3.2 3.8 2.4 86.9 - - 1.0 1.8 154.4 - 4.3 4.2 34.4 - - 2.5 - 5.9 - - - - 1.6 - - - - -
Control-4 3.1 4.1 2.2 81.9 - - 1.0 1.5 158.1 - 4.1 4.7 32.8 - - 2.8 - 5.6 - - - - - - - - - -
12-A 6590.9 12827.0 2855.3 3333.1 1956.9 173.5 558.1 229.7 7058.5 - 885.6 606.6 58.4 27.3 43.1 32.0 34.5 29.7 - 9.1 - - 2.4 - - 0.8 - -
12-B - - - 75.1 - - - - 24.3 - 1.6 - 18.1 - - 2.4 - - - - - - - - - - - -
Control-5 - - - 70.0 - - - - 22.8 - 1.1 - 18.2 - - 2.4 - - - - - - - - - - - -
24-A 6718.0 13126.4 2905.6 3480.2 2046.2 203.2 584.8 239.9 6977.2 - 891.1 611.7 59.1 29.4 38.2 20.8 35.3 27.7 - 12.3 - - - - - - - -
24-B - 2.3 - 54.2 - - - - 6.1 - - - 17.0 - - 1.1 - 1.9 - - - - - - - - - -
Control-6 - 2.4 - 50.0 - - - - 6.9 - - - 18.7 - - 1.1 - - - - - - 3.3 - - - - -
48-A 6286.0 12638.4 2835.1 3422.7 2041.3 225.3 603.0 243.0 6687.7 - 817.3 566.2 54.6 14.7 56.5 25.4 34.3 24.9 - 9.5 - - 1.3 - - - - -
48-B - - - 22.0 - - - - 4.2 - - - 12.8 - - - - - - - - - - - - - - -
Control-7 - - - 33.0 - - - - 4.3 - - - 12.7 - - - - - - - - - - - - - - -
72-A 4976.5 12605.2 2500.4 2683.3 1592.6 200.1 466.5 190.3 5953.4 - 721.3 445.9 49.6 7.1 47.0 30.6 28.2 22.7 - 7.6 - - - - - - - -
72-B - - - - - - - - 1.9 - - - 12.9 - - - - - - - - - - - - - - -
Control-8 - - - - - - - - 2.1 - - - 12.1 - - - - - - - - - - - - - - -
7-A 5156.7 9861.6 2188.2 2633.2 1565.7 40.1 462.3 186.6 5025.9 - 635.2 445.1 46.1 22.9 37.4 21.5 28.1 20.3 - 7.4 - - - - - - - -
7-B - - - - - - - - - - - - 6.2 - - - - - - - - - - - - - - -
14-A - - - - - - - - - - - - 8.1 - - - - - - - - - - - - - - -
14-B - - - - - - - - - - - - 7.8 - - - - - - - - - - - - - - -
- - - - - - - - - - - - 4.4 - - - - - - - - - - - - - - -
Note: (-) < MDL
Sample ID Concentration (mg/L)
1-A 14.5
1-B 13.4
3-A 11.3
3-B 13.2
6-A 11.3
6-B 9.5
12-A 8.2
12-B 9.6
24-A 5.8
24-B 6.4
48-A 7.1
48-B 7.5
72-A 5.5
72-B 5.5
7-A 5.1
7-B 5.3
14-A 4.2
14-B 4.5

163
Table F.8(a). Raw results from unactivated persulfate column experiment for treatment column 1.
Table F.8(b). Raw results from unactivated persulfate column experiment for treatment column 2.
ID
Benz Tol
Ethyl-
benzene P,M-xylene O -xylene 1,3,5 TMB 1,2,4 TMB 1,2,3 TMB Nap Indole 2-Metnap 1-Metnap Bi-phenyl
Ace-
naphthylene
Ace-
naphthene DbF Fluorene Phenan Anth Carb Fluoran Pyrene B(a)A Chrys
B(b)F +
B(k)F B(a)P
I[1,2,3-c,d] P
+ D[a,h]A B[g,h,i]P
MDL 1.11 0.83 0.77 1.46 0.37 0.74 0.82 0.76 2.20 2.12 4.27 1.31 1.09 1.53 1.83 1.10 1.88 3.78 5.53 2.39 1.80 1.60 4.77 5.75 5.62 13.33 18.65 11.49
LOQ 3.34 2.49 2.32 4.38 1.11 2.21 2.47 2.28 6.61 6.36 12.82 3.93 3.26 4.60 5.49 3.31 5.64 11.34 16.60 7.18 5.40 4.81 14.32 17.24 16.85 39.99 55.95 34.47
C1-1A 2918.4 2780.4 605.9 1054.0 57935.8 116.4 1079.4 141.2 5297.5 - 1183.6 869.1 91.0 184.9 59.2 - 118.6 121.5 - - 318.1 175.4 - - - - - -
C1-1B 2851.6 2958.0 619.4 1094.9 57005.5 104.6 1090.3 147.7 5375.9 - 1185.9 881.0 91.1 186.7 60.0 - 117.6 114.1 - - 355.5 185.9 - - - - - -
C1-2A 1109.6 1288.9 585.3 942.5 56719.7 74.4 396.0 95.1 5292.5 - 760.2 563.5 91.5 84.3 54.9 - 64.44 73.79 - - - - - - - - - -
C1-2B 1176.8 1304.7 546.6 880.2 54976.6 79.1 378.5 89.8 5281.1 - 731.9 543.1 90.9 86.5 56.3 - 66.83 76.59 - - - - - - - - - -
C1-3A 839.4 834.6 316.6 474.6 15336.2 67.8 287.3 79.7 4104.9 - 522.0 394.3 90.9 79.2 52.6 - 46.0 65.1 - - - - - - - - - -
C1-3B 857.8 807.0 319.0 477.6 15291.5 69.8 291.9 79.1 4124.1 - 512.8 385.9 90.8 73.4 53.0 - 46.4 65.4 - - - - - - - - - -
C1-4A 616.4 782.6 275.4 402.8 7121.7 56.8 221.8 78.8 3722.0 - 455.7 381.8 76.2 61.4 51.04 - 38.0 48.2 - - - - - - - - - -
C1-4B 637.1 800.6 277.7 406.3 7270.2 57.5 218.9 74.3 3728.7 - 436.1 378.5 78.4 64.5 51.48 - 36.0 48.4 - - - - - - - - - -
C1-5A 504.5 793.2 259.1 398.1 6188.6 47.7 209.7 65.0 3216.1 - 318.0 394.3 75.3 60.8 48.8 - 37.6 42.3 - - - - - - - - - -
C1-5B 488.5 789.1 251.1 396.3 4160.0 42.1 211.8 69.4 2921.0 - 320.3 385.9 73.2 60.1 47.4 - 37.7 44.8 - - - - - - - - - -
C1-6A 106.8 776.9 197.5 376.9 4321.2 39.6 142.8 55.0 2958.1 - 315.1 391.6 72.1 60.7 46.2 - 37.5 39.7 - - - - - - - - - -
C1-6B 106.8 743.1 190.2 376.1 4386.8 38.5 143.3 56.9 2822.5 - 313.7 376.4 73.1 59.2 45.7 - 37.7 38.8 - - - - - - - - - -
C1-7A 101.8 620.0 120.3 291.5 4366.5 32.1 135.2 35.0 2207.4 - 307.9 350.4 66.3 57.6 43.2 - 37.8 32.3 - - - - - - - - - -
C1-7B 100.3 623.0 119.5 280.5 4324.1 33.0 130.2 36.9 2223.5 - 307.1 351.0 66.8 58.7 44.1 - 26.9 33.8 - - - - - - - - - -
C1-8A 54.4 620.2 88.0 210.5 2451.6 30.2 125.0 32.8 2232.1 - 305.9 350.2 66.9 55.0 40.9 - 37.5 28.7 - - - - - - - - - -
C1-8B 55.2 618.5 90.9 208.3 2433.1 30.7 123.7 32.5 2199.6 - 321.1 354.5 66.1 55.1 40.2 - 37.7 29.1 - - - - - - - - - -
C1-9A 44.6 320.2 61.0 155.9 3483.0 20.4 105.3 21.5 1380.6 - 204.8 295.2 33.8 - - - 26.3 26.2 - - - - - - - - - -
C1-9B 42.1 318.5 65.6 96.1 3586.3 17.8 98.1 21.5 1044.6 - 209.0 290.4 35.1 - - - 24.6 25.1 - - - - - - - - - -
C1-10A 11.1 40.1 31.0 - 2303.5 - - - 1141.7 - 110.0 248.0 28.6 - - - 27.3 18.9 - - - - - - - - - -
C1-10B 10.2 44.2 35.6 - 2399.1 - - - 1162.2 - 113.5 245.8 29.2 - - - 23.4 19.6 - - - - - - - - - -
Note: (-) < MDL
IDBenz Tol
Ethyl-
benzene P,M-xylene O -xylene 1,3,5 TMB 1,2,4 TMB 1,2,3 TMB Nap Indole 2-Metnap 1-Metnap Bi-phenyl
Ace-
naphthylene
Ace-
naphthene DbF Fluorene Phenan Anth Carb Fluoran Pyrene B(a)A Chrys
B(b)F +
B(k)F B(a)P
I[1,2,3-c,d] P
+ D[a,h]A B[g,h,i]P
MDL 1.11 0.83 0.77 1.46 0.37 0.74 0.82 0.76 2.20 2.12 4.27 1.31 1.09 1.53 1.83 1.10 1.88 3.78 5.53 2.39 1.80 1.60 4.77 5.75 5.62 13.33 18.65 11.49
LOQ 3.34 2.49 2.32 4.38 1.11 2.21 2.47 2.28 6.61 6.36 12.82 3.93 3.26 4.60 5.49 3.31 5.64 11.34 16.60 7.18 5.40 4.81 14.32 17.24 16.85 39.99 55.95 34.47
C2-1A 2981.6 3093.8 852.6 1495.9 42832.5 175.7 1189.0 195.9 6086.8 - 1621.9 1038.7 117.4 243.6 82.2 - 164.4 214.4 - - 288.2 47.5 - - - - - -
C2-1B 2987.0 3006.7 859.1 1394.4 42577.9 135.1 1173.5 192.5 6003.6 - 1274.1 1030.7 118.7 242.3 86.5 - 129.1 157.6 - - 397.5 34.6 - - - - - -
C2-2A 1720.7 960.4 464.1 639.6 36361.0 83.6 424.1 80.4 4743.8 - 676.3 501.5 91.9 65.5 80.80 - 52.84 89.2 - - 16.9 - - - - - - -
C2-2B 1766.3 942.6 454.7 651.0 35646.1 86.5 438.3 87.4 4704.8 - 735.6 541.7 105.4 64.7 80.21 - 54.93 88.4 - - 18.1 - - - - - - -
C2-3A 696.0 834.6 392.0 663.6 21716.5 77.9 328.8 84.3 4035.0 - 649.0 464.1 83.4 51.5 75.3 - 51.7 82.55 - - - - - - - - - -
C2-3B 685.5 899.1 346.4 651.1 21754.9 75.3 334.6 89.7 4058.1 - 684.4 469.0 85.8 63.7 76.8 - 53.2 78.05 - - - - - - - - - -
C2-4A 896.0 792.6 308.3 510.0 14350.5 57.3 216.8 87.5 3714.4 - 574.5 441.0 78.6 54.6 73.7 - 41.3 77.7 - - - - - - - - - -
C2-4B 885.5 797.0 374.1 518.4 14264.2 57.5 212.1 85.9 3783.4 - 565.8 449.5 71.5 56.1 71.5 - 45.8 77.4 - - - - - - - - - -
C2-5A 540.1 762.8 224.7 388.1 6579.6 49.1 188.8 83.1 3449.9 - 522.6 410.0 74.4 47.4 54.2 - 38.0 63.0 - - - - - - - - - -
C2-5B 544.2 760.1 232.8 402.4 6607.4 47.9 198.8 84.7 3406.8 - 512.7 400.0 62.1 49.1 56.9 - 39.6 68.2 - - - - - - - - - -
C2-6A 248.7 711.9 264.7 394.5 3314.5 45.8 192.2 74.3 3371.1 - 440.2 328.4 63.6 45.4 53.1 - 33.2 62.55 - - - - - - - - - -
C2-6B 247.8 737.7 258.7 386.0 3318.0 46.5 193.5 79.4 3307.9 - 469.9 340.8 51.0 49.1 51.1 - 33.1 68.05 - - - - - - - - - -
C2-7A 183.5 619.0 260.1 385.6 2134.0 38.1 176.5 44.3 2375.5 - 426.3 284.4 51.5 47.5 49.90 - 32.0 59.20 - - - - - - - - - -
C2-7B 242.7 628.0 257.6 386.2 2072.1 37.9 178.6 44.4 2404.1 - 422.1 264.2 50.5 47.1 42.50 - 29.6 59.05 - - - - - - - - - -
C2-8A 65.8 610.2 222.9 379.5 1967.7 26.1 157.7 35.7 2475.5 - 426.3 273.2 51.6 46.5 43.2 - 28.2 33.8 - - - - - - - - - -
C2-8B 67.3 620.1 253.1 379.3 1939.0 27.9 155.8 35.9 2204.1 - 422.1 288.2 51.3 46.1 43.1 - 29.4 35.9 - - - - - - - - - -
C2-9A 56.1 195.7 103.7 238.9 2112.1 18.6 100.6 23.6 1932.3 - 240.2 222.5 49.4 - - - 22.6 25.4 - - - - - - - - - -
C2-9B 59.3 192.9 106.6 229.2 2194.1 17.6 107.8 22.4 1937.9 - 269.9 298.8 49.6 - - - 22.7 26.6 - - - - - - - - - -
C2-10A 56.9 181.6 99.4 161.1 2238.6 - 95.6 18.0 1985.9 - 228.0 244.2 32.7 - - - 21.4 17.5 - - - - - - - - - -
C2-10B 56.2 182.3 99.0 169.5 2298.2 - 93.5 12.0 1989.3 - 238.6 244.0 30.3 - - - 19.9 18.5 - - - - - - - - - -
Note: (-) < MDL
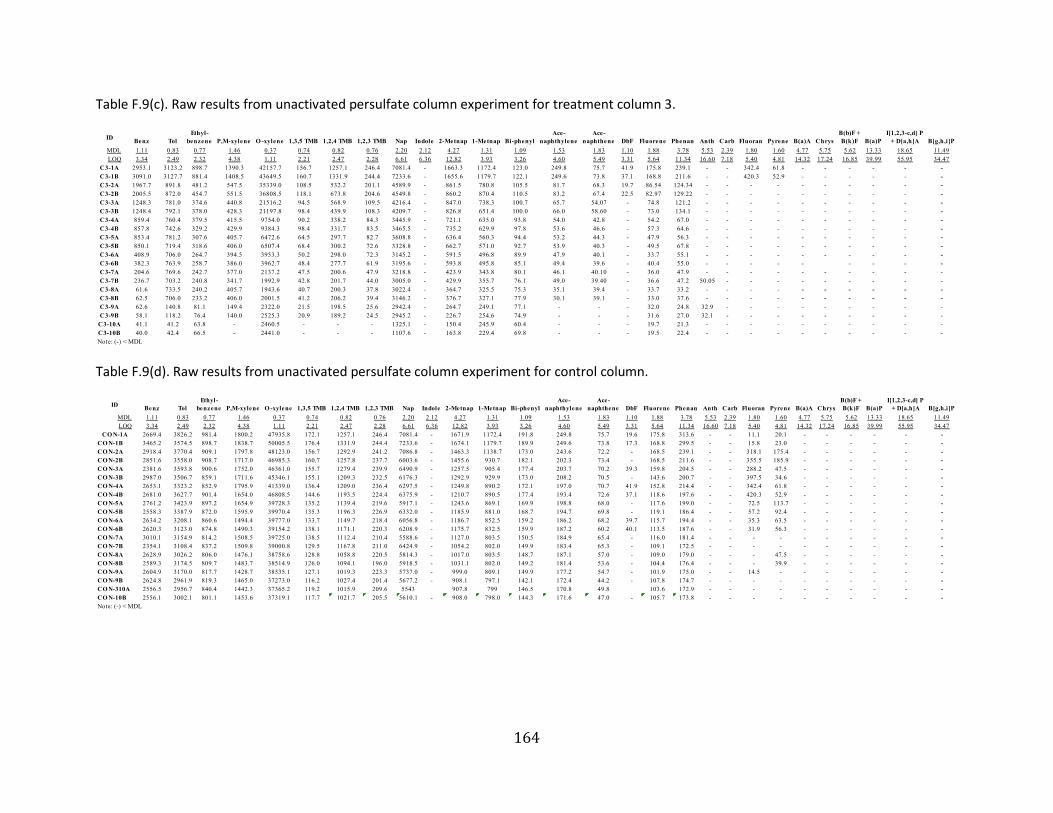
164
Table F.9(c). Raw results from unactivated persulfate column experiment for treatment column 3.
Table F.9(d). Raw results from unactivated persulfate column experiment for control column.
IDBenz Tol
Ethyl-
benzene P,M-xylene O -xylene 1,3,5 TMB 1,2,4 TMB 1,2,3 TMB Nap Indole 2-Metnap 1-Metnap Bi-phenyl
Ace-
naphthylene
Ace-
naphthene DbF Fluorene Phenan Anth Carb Fluoran Pyrene B(a)A Chrys
B(b)F +
B(k)F B(a)P
I[1,2,3-c,d] P
+ D[a,h]A B[g,h,i]P
MDL 1.11 0.83 0.77 1.46 0.37 0.74 0.82 0.76 2.20 2.12 4.27 1.31 1.09 1.53 1.83 1.10 1.88 3.78 5.53 2.39 1.80 1.60 4.77 5.75 5.62 13.33 18.65 11.49
LOQ 3.34 2.49 2.32 4.38 1.11 2.21 2.47 2.28 6.61 6.36 12.82 3.93 3.26 4.60 5.49 3.31 5.64 11.34 16.60 7.18 5.40 4.81 14.32 17.24 16.85 39.99 55.95 34.47
C3-1A 2953.1 3123.2 898.7 1390.3 42157.7 156.7 1257.1 246.4 7081.4 - 1663.3 1172.4 123.0 249.8 75.7 41.9 175.8 239.1 - - 342.4 61.8 - - - - - -
C3-1B 3091.0 3127.7 881.4 1408.5 43649.5 160.7 1331.9 244.4 7233.6 - 1655.6 1179.7 122.1 249.6 73.8 37.1 168.8 211.6 - - 420.3 52.9 - - - - - -
C3-2A 1967.7 891.8 481.2 547.5 35339.0 108.5 532.2 201.1 4589.9 - 861.5 780.8 105.5 81.7 68.3 19.7 86.54 124.34 - - - - - - - - - -
C3-2B 2005.5 872.0 454.7 551.5 36808.5 118.1 673.8 204.6 4549.8 - 860.2 870.4 110.5 83.2 67.4 22.5 82.97 129.22 - - - - - - - - - -
C3-3A 1248.3 781.0 374.6 440.8 21516.2 94.5 568.9 109.5 4216.4 - 847.0 738.3 100.7 65.7 54.07 - 74.8 121.2 - - - - - - - - - -
C3-3B 1248.4 792.1 378.0 428.3 21197.8 98.4 439.9 108.3 4209.7 - 826.8 651.4 100.0 66.0 58.60 - 73.0 134.1 - - - - - - - - - -
C3-4A 859.4 760.4 379.5 415.5 9754.0 90.2 338.2 84.3 3445.9 - 721.1 635.0 93.8 54.0 42.8 - 54.2 67.0 - - - - - - - - - -
C3-4B 857.8 742.6 329.2 429.9 9384.3 98.4 331.7 83.5 3465.5 - 735.2 629.9 97.8 53.6 46.6 - 57.3 64.6 - - - - - - - - - -
C3-5A 853.4 781.2 307.6 405.7 6472.6 64.5 297.7 82.7 3608.8 - 636.4 560.3 94.4 53.2 44.3 - 47.9 56.3 - - - - - - - - - -
C3-5B 850.1 719.4 318.6 406.0 6507.4 68.4 300.2 72.6 3328.8 - 662.7 571.0 92.7 53.9 40.3 - 49.5 67.8 - - - - - - - - - -
C3-6A 408.9 706.0 264.7 394.5 3953.3 50.2 298.0 72.3 3145.2 - 591.5 496.8 89.9 47.9 40.1 - 33.7 55.1 - - - - - - - - - -
C3-6B 382.3 763.9 258.7 386.0 3962.7 48.4 277.7 61.9 3195.6 - 593.8 495.8 85.1 49.4 39.6 - 40.4 55.0 - - - - - - - - -
C3-7A 204.6 769.6 242.7 377.0 2137.2 47.5 200.6 47.9 3218.8 - 423.9 343.8 80.1 46.1 40.10 - 36.0 47.9 - - - - - - - - - -
C3-7B 236.7 703.2 240.8 341.7 1992.9 42.8 201.7 44.0 3005.0 - 429.9 355.7 76.1 49.0 39.40 - 36.6 47.2 50.05 - - - - - - - - -
C3-8A 61.6 733.5 240.2 405.7 1943.6 40.7 200.3 37.8 3022.4 - 364.7 325.5 75.3 35.1 39.4 - 33.7 33.2 - - - - - - - - - -
C3-8B 62.5 706.0 233.2 406.0 2001.5 41.2 206.2 39.4 3146.2 - 376.7 327.1 77.9 30.1 39.1 - 33.0 37.6 - - - - - - - - - -
C3-9A 62.6 140.8 81.1 149.4 2322.0 21.5 198.5 25.6 2942.4 - 264.7 249.1 77.1 - - - 32.0 24.8 32.9 - - - - - - - - -
C3-9B 58.1 118.2 76.4 140.0 2525.3 20.9 189.2 24.5 2945.2 - 226.7 254.6 74.9 - - - 31.6 27.0 32.1 - - - - - - - - -
C3-10A 41.1 41.2 63.8 - 2460.5 - - - 1325.1 - 150.4 245.9 60.4 - - - 19.7 21.3 - - - - - - - - - -
C3-10B 40.0 42.4 66.5 - 2441.0 - - - 1107.6 - 163.8 229.4 69.8 - - - 19.5 22.4 - - - - - - - - - -
Note: (-) < MDL
IDBenz Tol
Ethyl-
benzene P,M-xylene O -xylene 1,3,5 TMB 1,2,4 TMB 1,2,3 TMB Nap Indole 2-Metnap 1-Metnap Bi-phenyl
Ace-
naphthylene
Ace-
naphthene DbF Fluorene Phenan Anth Carb Fluoran Pyrene B(a)A Chrys
B(b)F +
B(k)F B(a)P
I[1,2,3-c,d] P
+ D[a,h]A B[g,h,i]P
MDL 1.11 0.83 0.77 1.46 0.37 0.74 0.82 0.76 2.20 2.12 4.27 1.31 1.09 1.53 1.83 1.10 1.88 3.78 5.53 2.39 1.80 1.60 4.77 5.75 5.62 13.33 18.65 11.49
LOQ 3.34 2.49 2.32 4.38 1.11 2.21 2.47 2.28 6.61 6.36 12.82 3.93 3.26 4.60 5.49 3.31 5.64 11.34 16.60 7.18 5.40 4.81 14.32 17.24 16.85 39.99 55.95 34.47
CO N-1A 2669.4 3826.2 981.4 1800.2 47935.8 172.1 1257.1 246.4 7081.4 - 1671.9 1172.4 191.8 249.8 75.7 19.6 175.8 313.6 - - 11.1 20.1 - - - - - -
CO N-1B 3465.2 3574.5 898.7 1838.7 50005.5 176.4 1331.9 244.4 7233.6 - 1674.1 1179.7 189.9 249.6 73.8 17.3 168.8 299.5 - - 15.8 23.0 - - - - - -
CO N-2A 2918.4 3770.4 909.1 1797.8 48123.0 156.7 1292.9 241.2 7086.8 - 1463.3 1138.7 173.0 243.6 72.2 - 168.5 239.1 - - 318.1 175.4 - - - - - -
CO N-2B 2851.6 3558.0 908.7 1717.0 46985.3 160.7 1257.8 237.7 6003.6 - 1455.6 930.7 182.1 202.3 73.4 - 168.5 211.6 - - 355.5 185.9 - - - - - -
CO N-3A 2381.6 3593.8 900.6 1752.0 46361.0 155.7 1279.4 239.9 6490.9 - 1257.5 905.4 177.4 203.7 70.2 39.3 159.8 204.5 - - 288.2 47.5 - - - - - -
CO N-3B 2987.0 3506.7 859.1 1711.6 45346.1 155.1 1209.3 232.5 6176.3 - 1292.9 929.9 173.0 208.2 70.5 - 143.6 200.7 - - 397.5 34.6 - - - - - -
CO N-4A 2653.1 3323.2 852.9 1795.9 41339.0 136.4 1209.0 236.4 6297.5 - 1249.8 890.2 172.1 197.0 70.7 41.9 152.8 214.4 - - 342.4 61.8 - - - - - -
CO N-4B 2681.0 3627.7 901.4 1654.0 46808.5 144.6 1193.5 224.4 6375.9 - 1210.7 890.5 177.4 193.4 72.6 37.1 118.6 197.6 - - 420.3 52.9 - - - - - -
CO N-5A 2761.2 3423.9 897.2 1654.9 39728.3 135.2 1139.4 219.6 5917.1 - 1243.6 869.1 169.9 198.8 68.0 - 117.6 199.0 - - 72.5 113.7 - - - - - -
CO N-5B 2558.3 3387.9 872.0 1595.9 39970.4 135.3 1196.3 226.9 6332.0 - 1185.9 881.0 168.7 194.7 69.8 - 119.1 186.4 - - 57.2 92.4 - - - - - -
CO N-6A 2634.2 3208.1 860.6 1494.4 39777.0 133.7 1149.7 218.4 6056.8 - 1186.7 852.5 159.2 186.2 68.2 39.7 115.7 194.4 - - 35.3 63.5 - - - - - -
CO N-6B 2620.3 3123.0 874.8 1490.3 39154.2 138.1 1171.1 220.3 6208.9 - 1175.7 832.5 159.9 187.2 60.2 40.1 113.5 187.6 - - 31.9 56.3 - - - - - -
CO N-7A 3010.1 3154.9 814.2 1508.5 39725.0 138.5 1112.4 210.4 5588.6 - 1127.0 803.5 150.5 184.9 65.4 - 116.0 181.4 - - - - - - - - - -
CO N-7B 2354.1 3108.4 837.2 1509.8 39000.8 129.5 1167.8 211.0 6424.9 - 1054.2 802.0 149.9 183.4 65.3 - 109.1 172.5 - - - - - - - - - -
CO N-8A 2628.9 3026.2 806.0 1476.1 38758.6 128.8 1058.8 220.5 5814.3 - 1017.0 803.5 148.7 187.1 57.0 - 109.0 179.0 - - - 47.5 - - - - - -
CO N-8B 2589.3 3174.5 809.7 1483.7 38514.9 126.0 1094.1 196.0 5918.5 - 1031.1 802.0 149.2 181.4 53.6 - 104.4 176.4 - - - 39.9 - - - - - -
CO N-9A 2604.9 3170.0 817.7 1428.7 38535.1 127.1 1019.3 223.3 5737.0 - 999.0 809.1 149.9 177.2 54.7 - 101.9 175.0 - - 14.5 - - - - - - -
CO N-9B 2624.8 2961.9 819.3 1465.0 37273.0 116.2 1027.4 201.4 5677.2 - 908.1 797.1 142.1 172.4 44.2 - 107.8 174.7 - - - - - - - - - -
CO N-310A 2556.5 2956.7 840.4 1442.3 37365.2 119.2 1015.9 209.6 5543 907.8 799 146.5 170.8 49.8 103.6 172.9 - - - - - - - - - -
CO N-10B 2556.1 3002.1 801.1 1453.6 37319.1 117.7 1021.7 205.5 5610.1 - 908.0 798.0 144.3 171.6 47.0 - 105.7 173.8 - - - - - - - - - -
Note: (-) < MDL

165
Table F.10(a). Raw results from iron activated persulfate column experiment for treatment column 1.
Table F.10(b). Raw results from iron activated persulfate column experiment for treatment column 2.
IDBenz Tol
Ethyl-
benzene
P,M-
xylene
O -
xylene
1,3,5
TMB
1,2,4
TMB
1,2,3
TMB Nap Indole
2-
Metnap
1-
Metnap
Bi-
phenyl
Ace-
naphthylene
Ace-
naphthene DbF Fluorene Phenan Anth Carb Fluoran Pyrene B(a)A Chrys
B(b)F +
B(k)F B(a)P
I[1,2,3-c,d] P
+ D[a,h]A B[g,h,i]P
MDL 1.11 0.83 0.77 1.46 0.37 0.74 0.82 0.76 2.20 2.12 4.27 1.31 1.09 1.53 1.83 1.10 1.88 3.78 5.53 2.39 1.80 1.60 4.77 5.75 5.62 13.33 18.65 11.49
LOQ 3.34 2.49 2.32 4.38 1.11 2.21 2.47 2.28 6.61 6.36 12.82 3.93 3.26 4.60 5.49 3.31 5.64 11.34 16.60 7.18 5.40 4.81 14.32 17.24 16.85 39.99 55.95 34.47
C1-1A 487.7 1807.8 756.4 1206.6 15210.4 138.4 1312.9 295.8 8444.7 - 2014.2 \ 167.4 342.4 253.3 70.1 276.7 473.2 54.0 - 74.8 122.6 31.1 - - - - -
C1-1B 527.6 1948.8 821.4 1311.2 17568.5 152.4 1366.1 391.3 9148.5 44.2 2190.2 1548.6 183.5 370.6 304.4 73.1 295.0 482.9 55.5 - 66.4 107.2 - - - - - -
C1-2A 181.9 1075.7 188.2 284.2 8882.4 89.0 551.7 173.8 4327.7 - 937.7 698.3 85.5 267.2 105.1 - 225.1 69.85 - - - 36.7 - - - - - -
C1-2B 182.1 834.8 188.7 258.4 8897.2 86.5 537.3 161.9 4337.2 - 950.8 708.9 81.4 251.4 113.7 - 218.9 70.60 - - - 31.9 - - - - - -
C1-3A 151.5 199.9 123.2 211.2 6983.0 - 175.9 86.6 4190.1 - 586.0 467.0 80.5 145.4 101.69 - 102.07 61.9 66.2 - - 27.1 - - - - - -
C1-3B 154.3 204.0 121.8 210.1 6191.2 - 171.6 85.7 4160.9 - 564.1 445.9 81.8 150.8 102.55 - 99.63 77.8 73.3 - - 28.2 - - - - - -
C1-4A 143.8 181.0 107.8 179.1 5519.5 - 129.1 - 4159.1 - 449.7 416.8 78.4 118.4 80.3 - 79.2 71.9 - - - 17.2 - - - - - -
C1-4B 136.5 157.0 109.3 182.7 5937.6 - 130.6 - 4147.1 - 514.7 443.5 80.8 110.8 81.4 - 83.4 79.7 - - - 17.1 - - - - - -
C1-5A - 106.9 92.3 172.3 4882.7 - 91.8 - 3676.8 - 490.1 385.8 59.3 87.7 49.6 - 50.5 63.9 - - - - - - - - - -
C1-5B - 104.9 98.2 186.2 4958.3 - 96.3 - 3699.9 - 477.0 353.8 56.6 84.6 49.3 - 60.7 61.7 - - - - - - - - - -
C1-6A - 50.6 87.4 179.9 4664.8 - 92.3 - 3251.1 - 392.5 391.8 49.6 51.4 20.3 - 51.5 63.0 - - - - - - - - - -
C1-6B - 58.5 83.2 171.7 4581.2 - 93.4 - 3439.6 - 379.5 336.1 49.2 52.0 21.4 - 57.3 63.4 - - - - - - - - - -
C1-7A - 52.3 77.4 185.6 5610.4 - 96.4 - 3330.2 - 393.9 364.7 53.1 44.1 - - 41.3 61.0 - - - - - - - - - -
C1-7B - 54.0 80.0 189.0 5297.6 - 95.1 - 3310.6 - 381.5 351.4 53.3 49.9 - - 48.9 61.6 - - - - - - - - - -
Note: (-) < MDL
IDBenz Tol
Ethyl-
benzene
P,M-
xylene
O -
xylene
1,3,5
TMB
1,2,4
TMB
1,2,3
TMB Nap Indole
2-
Metnap
1-
Metnap
Bi-
phenyl
Ace-
naphthylene
Ace-
naphthene DbF Fluorene Phenan Anth Carb Fluoran Pyrene B(a)A Chrys
B(b)F +
B(k)F B(a)P
I[1,2,3-c,d] P
+ D[a,h]A B[g,h,i]P
MDL 1.11 0.83 0.77 1.46 0.37 0.74 0.82 0.76 2.20 2.12 4.27 1.31 1.09 1.53 1.83 1.10 1.88 3.78 5.53 2.39 1.80 1.60 4.77 5.75 5.62 13.33 18.65 11.49
LOQ 3.34 2.49 2.32 4.38 1.11 2.21 2.47 2.28 6.61 6.36 12.82 3.93 3.26 4.60 5.49 3.31 5.64 11.34 16.60 7.18 5.40 4.81 14.32 17.24 16.85 39.99 55.95 34.47
C2-1A 553.74 1823 766.285 1223.7 11823.5 149.603 1390.2 316.26 9220.2 43.088 2203 1557.96 217.47 366.92 221.68 70.86 338.03 437.84 50.77 - 59.59 101.3 - - - - - -
C2-1B 530.06 1780.9 764.902 1225.2 12414.3 158.526 1452.9 427.2 9647.1 49.52 2486.3 1740.5 211.97 415.74 180.29 86.54 338.77 558.19 65.68 - 83.48 132.36 38.33 - - - - -
C2-2A 174.64 260.84 166.919 257.3 7378.52 - 591.83 64.507 4065.7 - 496.6 356.0 89.69 201.03 110.79 35.37 164.31 74.47 - - 38.18 27.515 - - - - - -
C2-2B 175.99 265.14 171.117 254.9 7185.59 - 599.53 62.154 4023 - 538.9 434.6 87.33 200.39 115.99 42.64 158.87 72.04 - - 31.22 27.194 - - - - - -
C2-3A 148.14 228.93 135.376 207.7 3322.43 - 197.08 - 3923 - 450.1 401.6 90.85 143.70 108.77 - 141.27 66.80 51.67 - 36.78 20.5 - - - - - -
C2-3B 142.22 220.84 161.924 203.7 3383.75 - 195.71 - 3966.7 - 456.9 393.8 90.17 144.95 102.56 - 141.58 65.55 - - 26.35 20.3 - - - - - -
C2-4A 32.1 176.16 97.0353 175.7 2700.3 - 107.42 - 3878 - 320.2 392.7 89.97 99.88 99.80 - 68.60 59.43 - - 25.85 16.9 - - - - - -
C2-4B 32.2 165.66 92.1 178.3 2691.35 - 160.41 - 3848.4 - 338.7 389.3 89.33 104.22 95.99 - 66.80 61.88 - - 21.22 16.3 - - - - - -
C2-5A - 144.78 87.8786 171.3 1863.94 - 107.17 - 3838.2 - 396.9 383.5 76.80 73.45 57.64 - 58.11 53.40 - - 26.78 - - - - - - -
C2-5B - 124.8 85.8055 171.5 1918.04 - 101.62 - 3480.3 - 395.4 384.2 74.53 70.72 55.59 - 58.78 53.97 - - - - - - - - - -
C2-6A - 82.579 77.5 166.3 1105.72 - 93.1 - 3404.2 - 348.5 397.2 72.17 43.06 18.78 - 50.34 51.99 - - - - - - - - - -
C2-6B - 88.735 78.4 161.2 1127.16 - 108.04 - 3539.9 - 305.6 310.6 74.71 44.49 22.47 - 53.36 50.61 - - - - - - - - - -
C2-7A - 75.784 79.8 178.7 1172.44 - 97.143 - 3527.8 - 303.5 334.2 77.25 40.10 21.1 - 49.41 66.00 - - - - - - - - - -
C2-7B - 75.038 76.8 172.9 1015.04 - 96.306 - 3506.6 - 303.9 355.1 70.06 48.61 20.3 - 48.18 65.99 - - - - - - - - - -
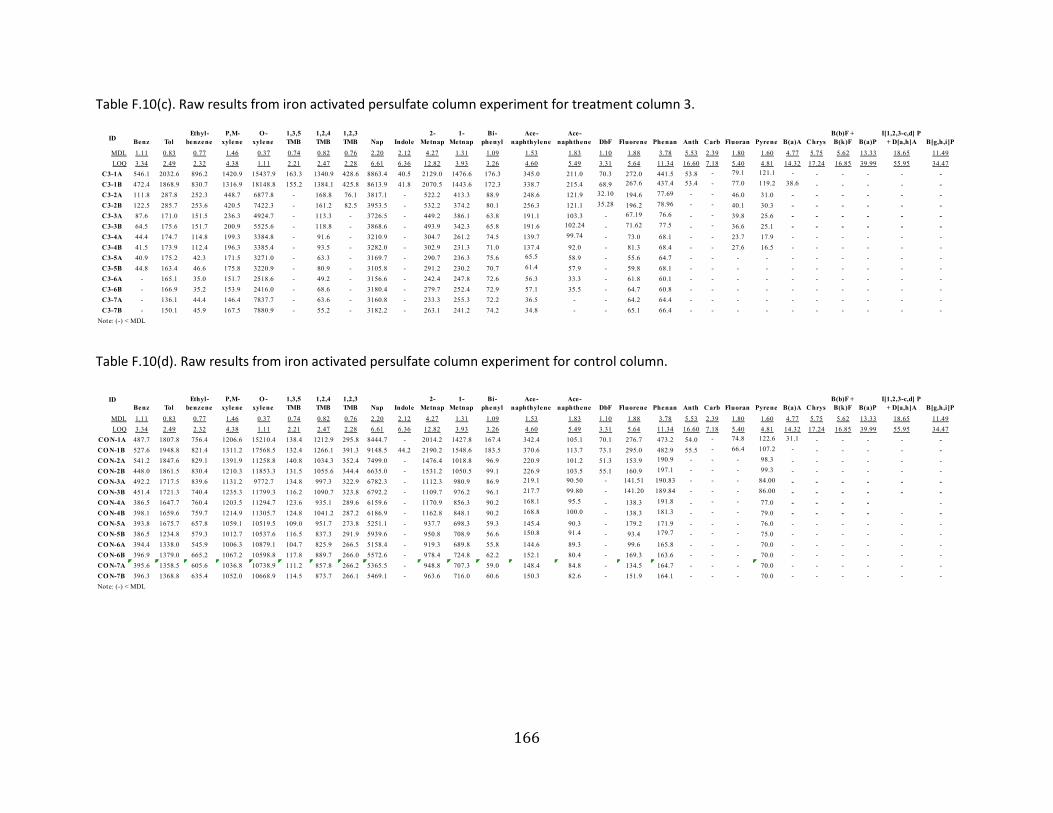
166
Table F.10(c). Raw results from iron activated persulfate column experiment for treatment column 3.
Table F.10(d). Raw results from iron activated persulfate column experiment for control column.
IDBenz Tol
Ethyl-
benzene
P,M-
xylene
O -
xylene
1,3,5
TMB
1,2,4
TMB
1,2,3
TMB Nap Indole
2-
Metnap
1-
Metnap
Bi-
phenyl
Ace-
naphthylene
Ace-
naphthene DbF Fluorene Phenan Anth Carb Fluoran Pyrene B(a)A Chrys
B(b)F +
B(k)F B(a)P
I[1,2,3-c,d] P
+ D[a,h]A B[g,h,i]P
MDL 1.11 0.83 0.77 1.46 0.37 0.74 0.82 0.76 2.20 2.12 4.27 1.31 1.09 1.53 1.83 1.10 1.88 3.78 5.53 2.39 1.80 1.60 4.77 5.75 5.62 13.33 18.65 11.49
LOQ 3.34 2.49 2.32 4.38 1.11 2.21 2.47 2.28 6.61 6.36 12.82 3.93 3.26 4.60 5.49 3.31 5.64 11.34 16.60 7.18 5.40 4.81 14.32 17.24 16.85 39.99 55.95 34.47
C3-1A 546.1 2032.6 896.2 1420.9 15437.9 163.3 1340.9 428.6 8863.4 40.5 2129.0 1476.6 176.3 345.0 211.0 70.3 272.0 441.5 53.8 - 79.1 121.1 - - - - - -
C3-1B 472.4 1868.9 830.7 1316.9 18148.8 155.2 1384.1 425.8 8613.9 41.8 2070.5 1443.6 172.3 338.7 215.4 68.9 267.6 437.4 53.4 - 77.0 119.2 38.6 - - - - -
C3-2A 111.8 287.8 252.3 448.7 6877.8 - 168.8 76.1 3817.1 - 522.2 413.3 88.9 248.6 121.9 32.10 194.6 77.69 - - 46.0 31.0 - - - - - -
C3-2B 122.5 285.7 253.6 420.5 7422.3 - 161.2 82.5 3953.5 - 532.2 374.2 80.1 256.3 121.1 35.28 196.2 78.96 - - 40.1 30.3 - - - - - -
C3-3A 87.6 171.0 151.5 236.3 4924.7 - 113.3 - 3726.5 - 449.2 386.1 63.8 191.1 103.3 - 67.19 76.6 - - 39.8 25.6 - - - - - -
C3-3B 64.5 175.6 151.7 200.9 5525.6 - 118.8 - 3868.6 - 493.9 342.3 65.8 191.6 102.24 - 71.62 77.5 - - 36.6 25.1 - - - - - -
C3-4A 44.4 174.7 114.8 199.3 3384.8 - 91.6 - 3210.9 - 304.7 261.2 74.5 139.7 99.74 - 73.0 68.1 - - 23.7 17.9 - - - - - -
C3-4B 41.5 173.9 112.4 196.3 3385.4 - 93.5 - 3282.0 - 302.9 231.3 71.0 137.4 92.0 - 81.3 68.4 - - 27.6 16.5 - - - - - -
C3-5A 40.9 175.2 42.3 171.5 3271.0 - 63.3 - 3169.7 - 290.7 236.3 75.6 65.5 58.9 - 55.6 64.7 - - - - - - - - - -
C3-5B 44.8 163.4 46.6 175.8 3220.9 - 80.9 - 3105.8 - 291.2 230.2 70.7 61.4 57.9 - 59.8 68.1 - - - - - - - - - -
C3-6A - 165.1 35.0 151.7 2518.6 - 49.2 - 3156.6 - 242.4 247.8 72.6 56.3 33.3 - 61.8 60.1 - - - - - - - - - -
C3-6B - 166.9 35.2 153.9 2416.0 - 68.6 - 3180.4 - 279.7 252.4 72.9 57.1 35.5 - 64.7 60.8 - - - - - - - - - -
C3-7A - 136.1 44.4 146.4 7837.7 - 63.6 - 3160.8 - 233.3 255.3 72.2 36.5 - - 64.2 64.4 - - - - - - - - - -
C3-7B - 150.1 45.9 167.5 7880.9 - 55.2 - 3182.2 - 263.1 241.2 74.2 34.8 - - 65.1 66.4 - - - - - - - - - -
Note: (-) < MDL
ID
Benz Tol
Ethyl-
benzene
P,M-
xylene
O -
xylene
1,3,5
TMB
1,2,4
TMB
1,2,3
TMB Nap Indole
2-
Metnap
1-
Metnap
Bi-
phenyl
Ace-
naphthylene
Ace-
naphthene DbF Fluorene Phenan Anth Carb Fluoran Pyrene B(a)A Chrys
B(b)F +
B(k)F B(a)P
I[1,2,3-c,d] P
+ D[a,h]A B[g,h,i]P
MDL 1.11 0.83 0.77 1.46 0.37 0.74 0.82 0.76 2.20 2.12 4.27 1.31 1.09 1.53 1.83 1.10 1.88 3.78 5.53 2.39 1.80 1.60 4.77 5.75 5.62 13.33 18.65 11.49
LOQ 3.34 2.49 2.32 4.38 1.11 2.21 2.47 2.28 6.61 6.36 12.82 3.93 3.26 4.60 5.49 3.31 5.64 11.34 16.60 7.18 5.40 4.81 14.32 17.24 16.85 39.99 55.95 34.47
CO N-1A 487.7 1807.8 756.4 1206.6 15210.4 138.4 1212.9 295.8 8444.7 - 2014.2 1427.8 167.4 342.4 105.1 70.1 276.7 473.2 54.0 - 74.8 122.6 31.1 - - - - -
CO N-1B 527.6 1948.8 821.4 1311.2 17568.5 132.4 1266.1 391.3 9148.5 44.2 2190.2 1548.6 183.5 370.6 113.7 73.1 295.0 482.9 55.5 - 66.4 107.2 - - - - - -
CO N-2A 541.2 1847.6 829.1 1391.9 11258.8 140.8 1034.3 352.4 7499.0 - 1476.4 1018.8 96.9 220.9 101.2 51.3 153.9 190.9 - - - 98.3 - - - - - -
CO N-2B 448.0 1861.5 830.4 1210.3 11853.3 131.5 1055.6 344.4 6635.0 - 1531.2 1050.5 99.1 226.9 103.5 55.1 160.9 197.1 - - - 99.3 - - - - - -
CO N-3A 492.2 1717.5 839.6 1131.2 9772.7 134.8 997.3 322.9 6782.3 - 1112.3 980.9 86.9 219.1 90.50 - 141.51 190.83 - - - 84.00 - - - - - -
CO N-3B 451.4 1721.3 740.4 1235.3 11799.3 116.2 1090.7 323.8 6792.2 - 1109.7 976.2 96.1 217.7 99.80 - 141.20 189.84 - - - 86.00 - - - - - -
CO N-4A 386.5 1647.7 760.4 1203.5 11294.7 123.6 935.1 289.6 6159.6 - 1170.9 856.3 90.2 168.1 95.5 - 138.3 191.8 - - - 77.0 - - - - -
CO N-4B 398.1 1659.6 759.7 1214.9 11305.7 124.8 1041.2 287.2 6186.9 - 1162.8 848.1 90.2 168.8 100.0 - 138.3 181.3 - - - 79.0 - - - - - -
CO N-5A 393.8 1675.7 657.8 1059.1 10519.5 109.0 951.7 273.8 5251.1 - 937.7 698.3 59.3 145.4 90.3 - 179.2 171.9 - - - 76.0 - - - - - -
CO N-5B 386.5 1234.8 579.3 1012.7 10537.6 116.5 837.3 291.9 5939.6 - 950.8 708.9 56.6 150.8 91.4 - 93.4 179.7 - - - 75.0 - - - - - -
CO N-6A 394.4 1338.0 545.9 1006.3 10879.1 104.7 825.9 266.5 5158.4 - 919.3 689.8 55.8 144.6 89.3 - 99.6 165.8 - - - 70.0 - - - - - -
CO N-6B 396.9 1379.0 665.2 1067.2 10598.8 117.8 889.7 266.0 5572.6 - 978.4 724.8 62.2 152.1 80.4 - 169.3 163.6 - - - 70.0 - - - - - -
CO N-7A 395.6 1358.5 605.6 1036.8 10738.9 111.2 857.8 266.2 5365.5 - 948.8 707.3 59.0 148.4 84.8 - 134.5 164.7 - - - 70.0 - - - - - -
CO N-7B 396.3 1368.8 635.4 1052.0 10668.9 114.5 873.7 266.1 5469.1 - 963.6 716.0 60.6 150.3 82.6 - 151.9 164.1 - - - 70.0 - - - - - -
Note: (-) < MDL
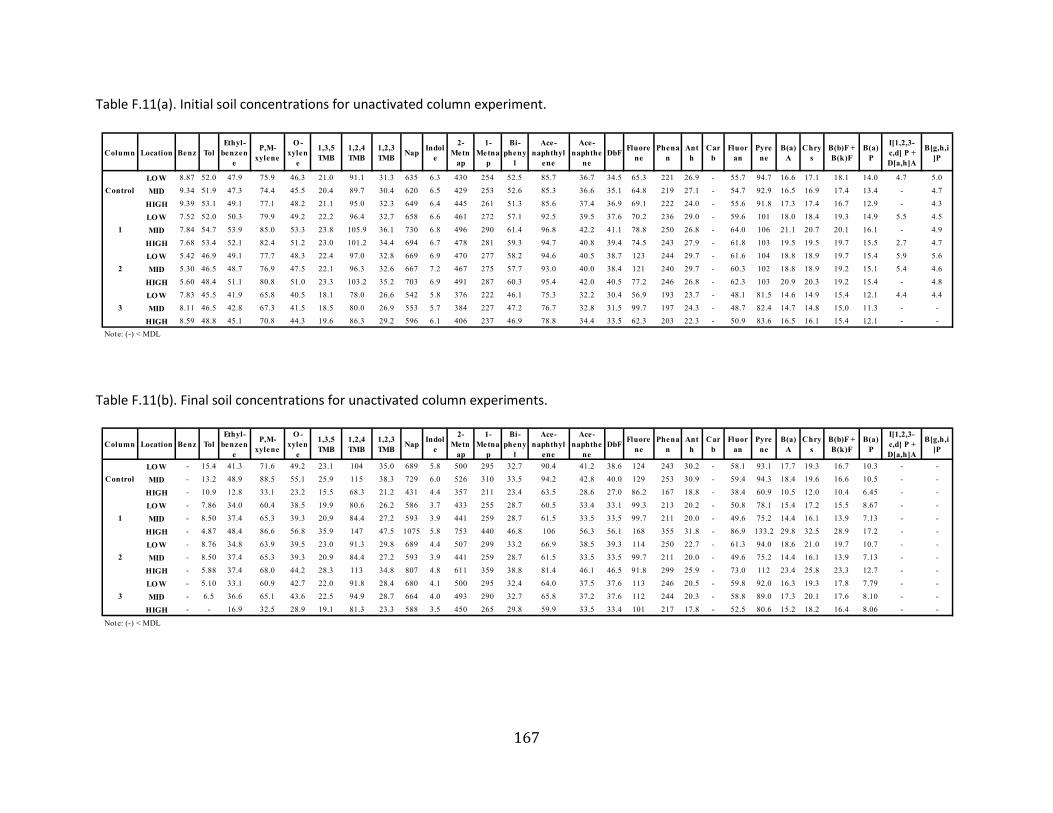
167
Table F.11(a). Initial soil concentrations for unactivated column experiment.
Table F.11(b). Final soil concentrations for unactivated column experiments.
Column Location Benz Tol
Ethyl-
benzen
e
P,M-
xylene
O -
xylen
e
1,3,5
TMB
1,2,4
TMB
1,2,3
TMBNap
Indol
e
2-
Metn
ap
1-
Metna
p
Bi-
pheny
l
Ace-
naphthyl
ene
Ace-
naphthe
ne
DbFFluore
ne
Phena
n
Ant
h
Car
b
Fluor
an
Pyre
ne
B(a)
A
Chry
s
B(b)F +
B(k)F
B(a)
P
I[1,2,3-
c,d] P +
D[a,h]A
B[g,h,i
]P
LO W 8.87 52.0 47.9 75.9 46.3 21.0 91.1 31.3 635 6.3 430 254 52.5 85.7 36.7 34.5 65.3 221 26.9 - 55.7 94.7 16.6 17.1 18.1 14.0 4.7 5.0
MID 9.34 51.9 47.3 74.4 45.5 20.4 89.7 30.4 620 6.5 429 253 52.6 85.3 36.6 35.1 64.8 219 27.1 - 54.7 92.9 16.5 16.9 17.4 13.4 - 4.7
HIGH 9.39 53.1 49.1 77.1 48.2 21.1 95.0 32.3 649 6.4 445 261 51.3 85.6 37.4 36.9 69.1 222 24.0 - 55.6 91.8 17.3 17.4 16.7 12.9 - 4.3
LO W 7.52 52.0 50.3 79.9 49.2 22.2 96.4 32.7 658 6.6 461 272 57.1 92.5 39.5 37.6 70.2 236 29.0 - 59.6 101 18.0 18.4 19.3 14.9 5.5 4.5
MID 7.84 54.7 53.9 85.0 53.3 23.8 105.9 36.1 730 6.8 496 290 61.4 96.8 42.2 41.1 78.8 250 26.8 - 64.0 106 21.1 20.7 20.1 16.1 - 4.9
HIGH 7.68 53.4 52.1 82.4 51.2 23.0 101.2 34.4 694 6.7 478 281 59.3 94.7 40.8 39.4 74.5 243 27.9 - 61.8 103 19.5 19.5 19.7 15.5 2.7 4.7
LO W 5.42 46.9 49.1 77.7 48.3 22.4 97.0 32.8 669 6.9 470 277 58.2 94.6 40.5 38.7 123 244 29.7 - 61.6 104 18.8 18.9 19.7 15.4 5.9 5.6
MID 5.30 46.5 48.7 76.9 47.5 22.1 96.3 32.6 667 7.2 467 275 57.7 93.0 40.0 38.4 121 240 29.7 - 60.3 102 18.8 18.9 19.2 15.1 5.4 4.6
HIGH 5.60 48.4 51.1 80.8 51.0 23.3 103.2 35.2 703 6.9 491 287 60.3 95.4 42.0 40.5 77.2 246 26.8 - 62.3 103 20.9 20.3 19.2 15.4 - 4.8
LO W 7.83 45.5 41.9 65.8 40.5 18.1 78.0 26.6 542 5.8 376 222 46.1 75.3 32.2 30.4 56.9 193 23.7 - 48.1 81.5 14.6 14.9 15.4 12.1 4.4 4.4
MID 8.11 46.5 42.8 67.3 41.5 18.5 80.0 26.9 553 5.7 384 227 47.2 76.7 32.8 31.5 99.7 197 24.3 - 48.7 82.4 14.7 14.8 15.0 11.3 - -
HIGH 8.59 48.8 45.1 70.8 44.3 19.6 86.3 29.2 596 6.1 406 237 46.9 78.8 34.4 33.5 62.3 203 22.3 - 50.9 83.6 16.5 16.1 15.4 12.1 - -
Control
1
2
3
Note: (-) < MDL
Column Location Benz Tol
Ethyl-
benzen
e
P,M-
xylene
O -
xylen
e
1,3,5
TMB
1,2,4
TMB
1,2,3
TMBNap
Indol
e
2-
Metn
ap
1-
Metna
p
Bi-
pheny
l
Ace-
naphthyl
ene
Ace-
naphthe
ne
DbFFluore
ne
Phena
n
Ant
h
Car
b
Fluor
an
Pyre
ne
B(a)
A
Chry
s
B(b)F +
B(k)F
B(a)
P
I[1,2,3-
c,d] P +
D[a,h]A
B[g,h,i
]P
LO W - 15.4 41.3 71.6 49.2 23.1 104 35.0 689 5.8 500 295 32.7 90.4 41.2 38.6 124 243 30.2 - 58.1 93.1 17.7 19.3 16.7 10.3 - -
MID - 13.2 48.9 88.5 55.1 25.9 115 38.3 729 6.0 526 310 33.5 94.2 42.8 40.0 129 253 30.9 - 59.4 94.3 18.4 19.6 16.6 10.5 - -
HIGH - 10.9 12.8 33.1 23.2 15.5 68.3 21.2 431 4.4 357 211 23.4 63.5 28.6 27.0 86.2 167 18.8 - 38.4 60.9 10.5 12.0 10.4 6.45 - -
LO W - 7.86 34.0 60.4 38.5 19.9 80.6 26.2 586 3.7 433 255 28.7 60.5 33.4 33.1 99.3 213 20.2 - 50.8 78.1 15.4 17.2 15.5 8.67 - -
MID - 8.50 37.4 65.3 39.3 20.9 84.4 27.2 593 3.9 441 259 28.7 61.5 33.5 33.5 99.7 211 20.0 - 49.6 75.2 14.4 16.1 13.9 7.13 - -
HIGH - 4.87 48.4 86.6 56.8 35.9 147 47.5 1075 5.8 753 440 46.8 106 56.3 56.1 168 355 31.8 - 86.9 133.2 29.8 32.5 28.9 17.2 - -
LO W - 8.76 34.8 63.9 39.5 23.0 91.3 29.8 689 4.4 507 299 33.2 66.9 38.5 39.3 114 250 22.7 - 61.3 94.0 18.6 21.0 19.7 10.7 - -
MID - 8.50 37.4 65.3 39.3 20.9 84.4 27.2 593 3.9 441 259 28.7 61.5 33.5 33.5 99.7 211 20.0 - 49.6 75.2 14.4 16.1 13.9 7.13 - -
HIGH - 5.88 37.4 68.0 44.2 28.3 113 34.8 807 4.8 611 359 38.8 81.4 46.1 46.5 91.8 299 25.9 - 73.0 112 23.4 25.8 23.3 12.7 - -
LO W - 5.10 33.1 60.9 42.7 22.0 91.8 28.4 680 4.1 500 295 32.4 64.0 37.5 37.6 113 246 20.5 - 59.8 92.0 16.3 19.3 17.8 7.79 - -
MID - 6.5 36.6 65.1 43.6 22.5 94.9 28.7 664 4.0 493 290 32.7 65.8 37.2 37.6 112 244 20.3 - 58.8 89.0 17.3 20.1 17.6 8.10 - -
HIGH - - 16.9 32.5 28.9 19.1 81.3 23.3 588 3.5 450 265 29.8 59.9 33.5 33.4 101 217 17.8 - 52.5 80.6 15.2 18.2 16.4 8.06 - -
Note: (-) < MDL
Control
1
2
3

168
Table F.11(c). Initial soil concentrations for iron-activated column experiments.
Table F.11(d). Final soil concentrations for iron-activated column experiments.
Column Location Benz Tol
Ethyl-
benzen
e
P,M-
xylene
O -
xylen
e
1,3,5
TMB
1,2,4
TMB
1,2,3
TMBNap
Indol
e
2-
Metn
ap
1-
Metna
p
Bi-
pheny
l
Ace-
naphthyl
ene
Ace-
naphthe
ne
DbFFluore
ne
Phena
n
Ant
h
Car
b
Fluor
an
Pyre
ne
B(a)
A
Chry
s
B(b)F +
B(k)F
B(a)
P
I[1,2,3-
c,d] P +
D[a,h]A
B[g,h,i
]P
1 LO W 9.28 52.3 49.2 75.8 46.7 20.8 91.9 31.3 635 6.4 435 256 52.2 85.5 36.9 35.5 66.4 221 26.0 - 55.3 93.1 16.8 17.1 17.4 13.4 1.58 4.69
MID 9.34 52.1 49.2 75.7 46.1 20.3 90.4 30.9 627 6.8 432 254 52.4 85.4 36.7 35.3 65.6 220 26.5 - 55.0 93.0 16.7 17.3 17.6 13.3 0.850 4.37
HIGH 9.31 52.1 49.2 75.1 46.1 20.6 90.8 30.9 627 6.5 432 254 52.4 85.4 36.7 35.3 65.6 220 26.5 - 55.0 93.0 16.7 17.0 17.4 13.4 0.789 4.70
2 LO W 8.00 53.0 52.0 83.0 51.0 23.0 97.0 34.0 661 7.0 486 274 59.0 94.0 41.0 38.0 74.0 239 26.4 - 60.0 104 19.0 20.0 20.0 15.0 2.50 5.00
MID 7.00 54.0 52.0 84.0 52.0 23.0 103 36.0 699 6.5 488 282 59.0 94.0 42.0 41.0 74.0 242 27.0 - 62.0 105 20.0 20.0 20.0 15.0 2.40 4.90
HIGH 7.76 54.1 53.0 83.7 52.3 23.4 104 35.3 712 6.7 487 286 60.3 95.7 41.5 40.2 76.7 246 27.4 - 62.9 104 20.3 20.1 19.9 15.8 1.37 4.83
Control LO W 5.51 47.6 50.1 79.2 49.7 22.8 100 34.0 686 6.9 480 282 59.2 95.0 41.3 39.6 100 245 28.2 - 62.0 104 19.9 19.6 19.4 15.4 2.97 5.21
MID 5.44 47.3 49.6 78.4 48.9 22.6 98.9 33.5 680 7.0 476 280 58.7 94.4 40.9 39.2 107 243 28.7 - 61.4 103 19.5 19.4 19.4 15.3 3.77 5.02
HIGH 5.48 47.4 49.9 78.8 49.3 22.7 99.5 33.8 683 6.9 478 281 59.0 94.7 41.1 39.4 104 244 28.5 - 61.7 103 19.7 19.5 19.4 15.3 3.37 5.12
3 LO W 8.21 47.2 43.5 68.3 42.4 18.8 82.2 27.9 569 5.9 391 230 46.5 77.1 33.3 31.9 59.6 198 23.0 - 49.5 82.6 15.5 15.5 15.4 12.1 2.18 2.22
MID 8.40 48.0 44.3 69.5 43.4 19.2 84.2 28.6 583 6.0 398 233 46.7 77.9 33.8 32.7 60.9 200 22.7 - 50.2 83.1 16.0 15.8 15.4 12.1 1.09 1.11
HIGH 8.49 48.4 44.7 70.2 43.8 19.4 85.3 28.9 589 6.1 402 235 46.8 78.4 34.1 33.1 61.6 201 22.5 - 50.6 83.4 16.2 16.0 15.4 12.1 0.544 0.554
Note: (-) < MDL
Column Location Benz Tol
Ethyl-
benzen
e
P,M-
xylene
O -
xylen
e
1,3,5
TMB
1,2,4
TMB
1,2,3
TMBNap
Indol
e
2-
Metn
ap
1-
Metna
p
Bi-
pheny
l
Ace-
naphthyl
ene
Ace-
naphthe
ne
DbFFluore
ne
Phena
n
Ant
h
Car
b
Fluor
an
Pyre
ne
B(a)
A
Chry
s
B(b)F +
B(k)F
B(a)
P
I[1,2,3-
c,d] P +
D[a,h]A
B[g,h,i
]P
1 Top - 3.35 20.5 39.9 26.4 17.9 73.9 25.6 702 3.4 522 309 42.4 82.2 44.2 43.0 90.8 302 21.3 - 78.2 128 20.7 22.5 22.8 12.8 7.17 5.52
Mid - 2.51 21.7 42.4 27.1 19.6 80.5 26.2 741 3.7 561 331 36.6 90.3 48.0 46.1 97.7 319 24.3 - 80.4 131 22.4 23.0 22.2 13.0 6.76 4.98
Bot - - 15.7 31.3 21.7 17.5 72.6 21.0 669 3.5 506 299 32.0 80.9 42.6 42.0 88.4 293 21.3 - 75.1 122 20.7 22.0 21.8 12.6 6.53 4.89
2 Top - 7.86 34.0 60.4 38.5 19.9 80.6 26.2 586 3.7 433 255 28.7 60.5 33.4 33.1 99.3 213 20.2 - 50.8 78.1 15.4 17.2 15.5 8.67 - -
Mid - 8.50 37.4 65.3 39.3 20.9 84.4 27.2 593 3.9 441 259 28.7 61.5 33.5 33.5 99.7 211 20.0 - 49.6 75.2 14.4 16.1 13.9 7.13 - -
Bot - 4.87 48.4 86.6 56.8 35.9 147 47.5 1075 5.8 753 440 46.8 106.2 56.3 56.1 168 355 31.8 - 86.9 133 29.8 32.5 28.9 17.2 - -
Control Top - 8.76 34.8 63.9 39.5 23.0 91.3 29.8 689 4.4 507 299 33.2 66.9 38.5 39.3 114 250 22.7 - 61.3 94.0 18.6 21.0 19.7 10.7 - -
Mid - 5.26 28.7 52.9 34.1 21.0 83.5 26.9 632 3.7 473 278 31.2 62.1 35.5 36.1 106 232 20.5 - 55.0 83.3 16.3 18.1 16.0 8.47 - -
Bot - 5.88 37.4 68.0 44.2 28.3 113 34.8 807 4.8 611 359 38.8 81.4 46.1 46.5 91.8 299 25.9 - 73.0 112 23.4 25.8 23.3 12.7 - -
3 Top - 5.10 33.1 60.9 42.7 22.0 91.8 28.4 680 4.1 500 295 32.4 64.0 37.5 37.6 113 246 20.5 - 59.8 92.0 16.3 19.3 17.8 7.79 - -
Mid - 6.53 36.6 65.1 43.6 22.5 94.9 28.7 664 4.0 493 290 32.7 65.8 37.2 37.6 112 244 20.3 - 58.8 89.0 17.3 20.1 17.6 8.10 - -
Bot - - 16.9 32.5 28.9 19.1 81.3 23.3 588 3.5 450 265 29.8 59.9 33.5 33.4 101 217 17.8 - 52.5 80.6 15.2 18.2 16.4 8.06 - -
Note: (-) < MDL
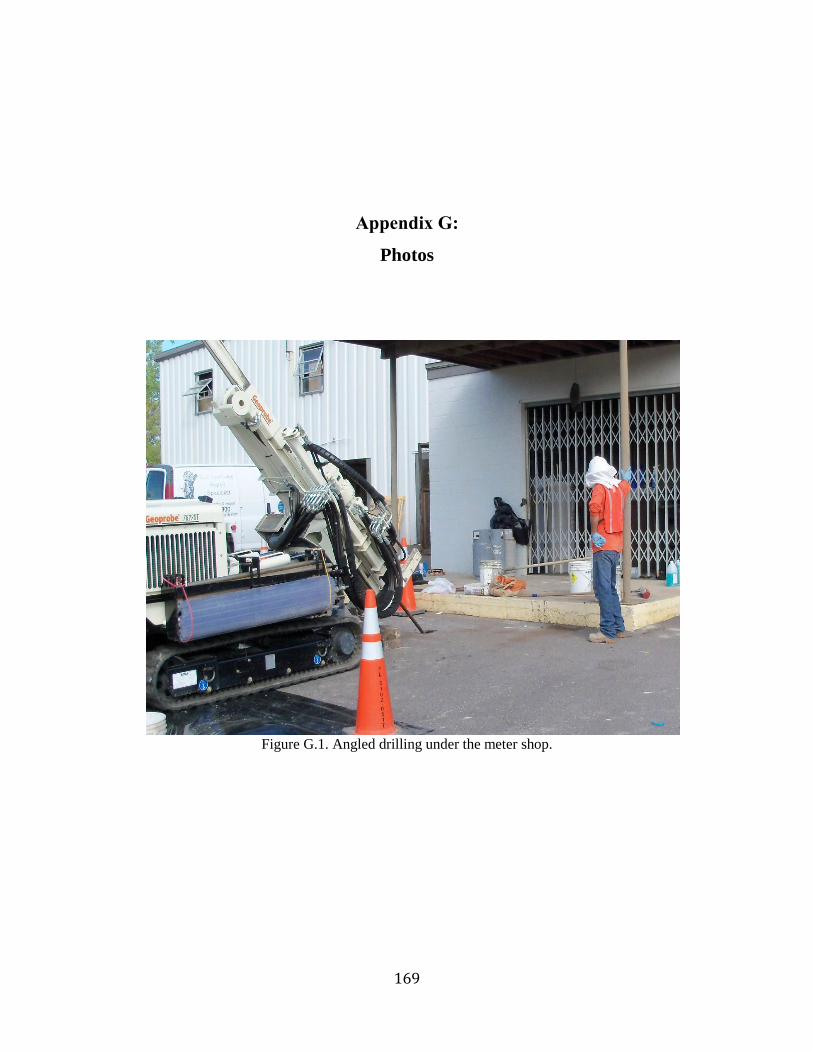
169
Appendix G:
Photos
Figure G.1. Angled drilling under the meter shop.
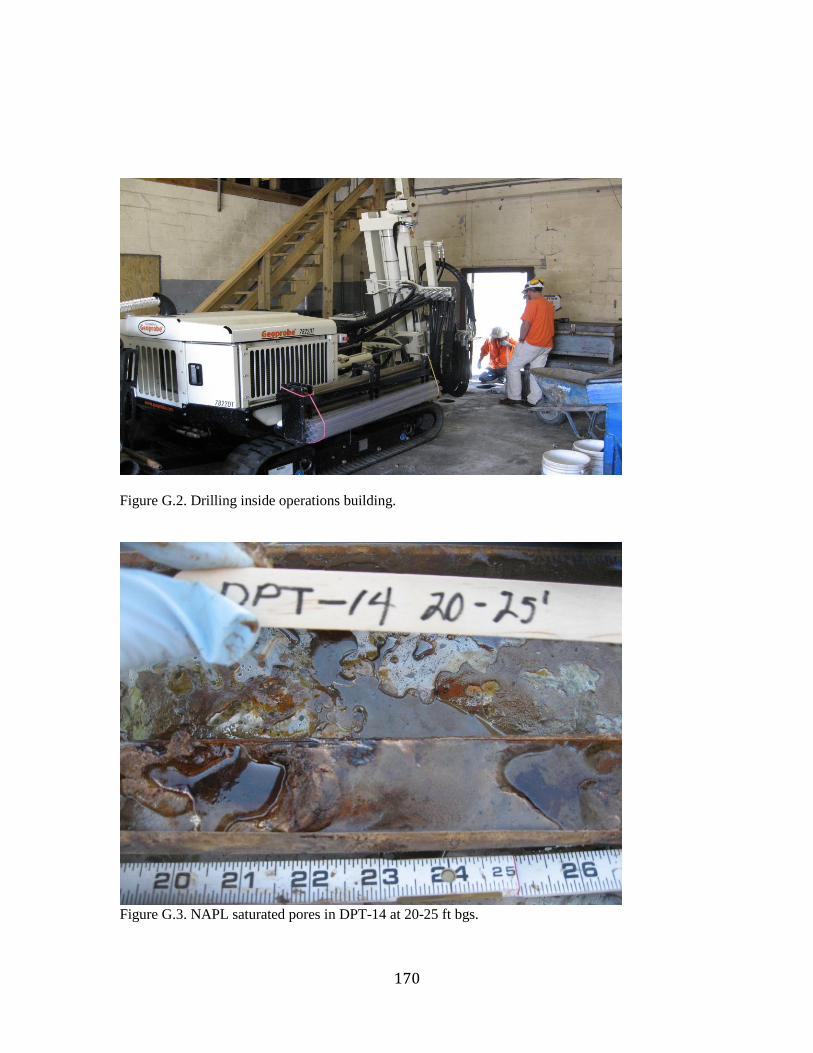
170
Figure G.2. Drilling inside operations building.
Figure G.3. NAPL saturated pores in DPT-14 at 20-25 ft bgs.

171
Figure G.4. NAPL saturated pores in DPT-23 at 13 ft bgs.
Figure G.5. Non-impacted sand in DPT-27 20 to 50 ft bgs.
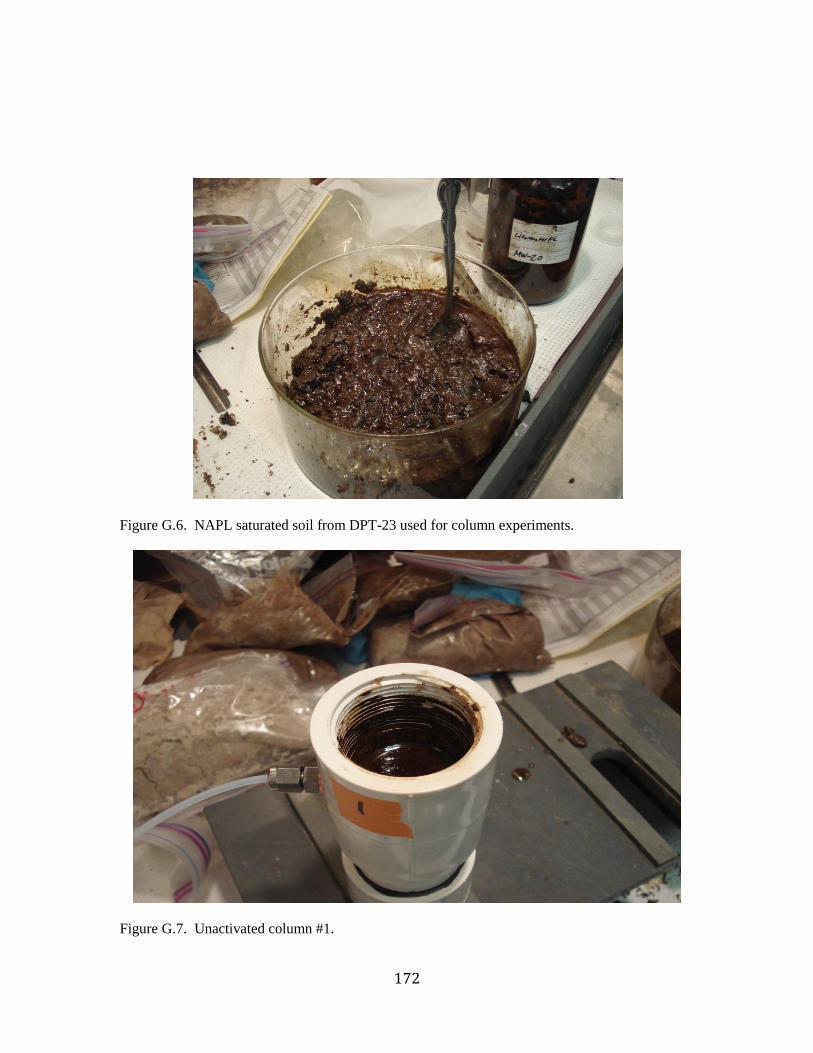
172
Figure G.6. NAPL saturated soil from DPT-23 used for column experiments.
Figure G.7. Unactivated column #1.
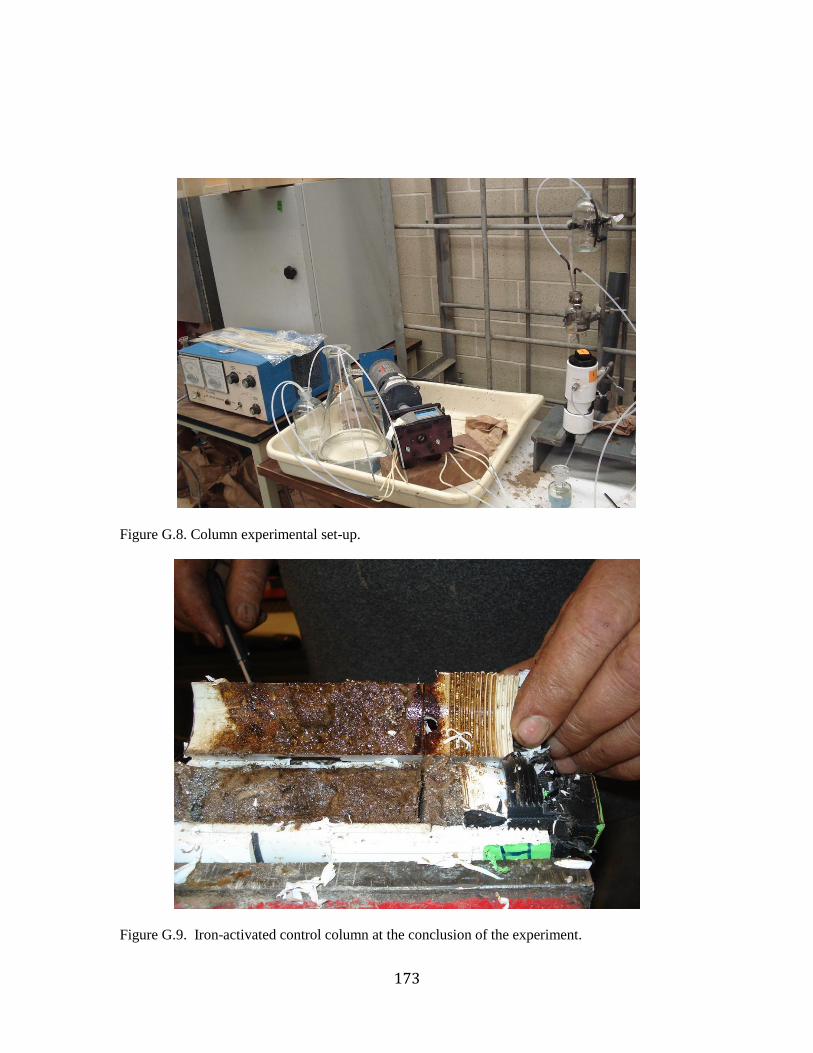
173
Figure G.8. Column experimental set-up.
Figure G.9. Iron-activated control column at the conclusion of the experiment.
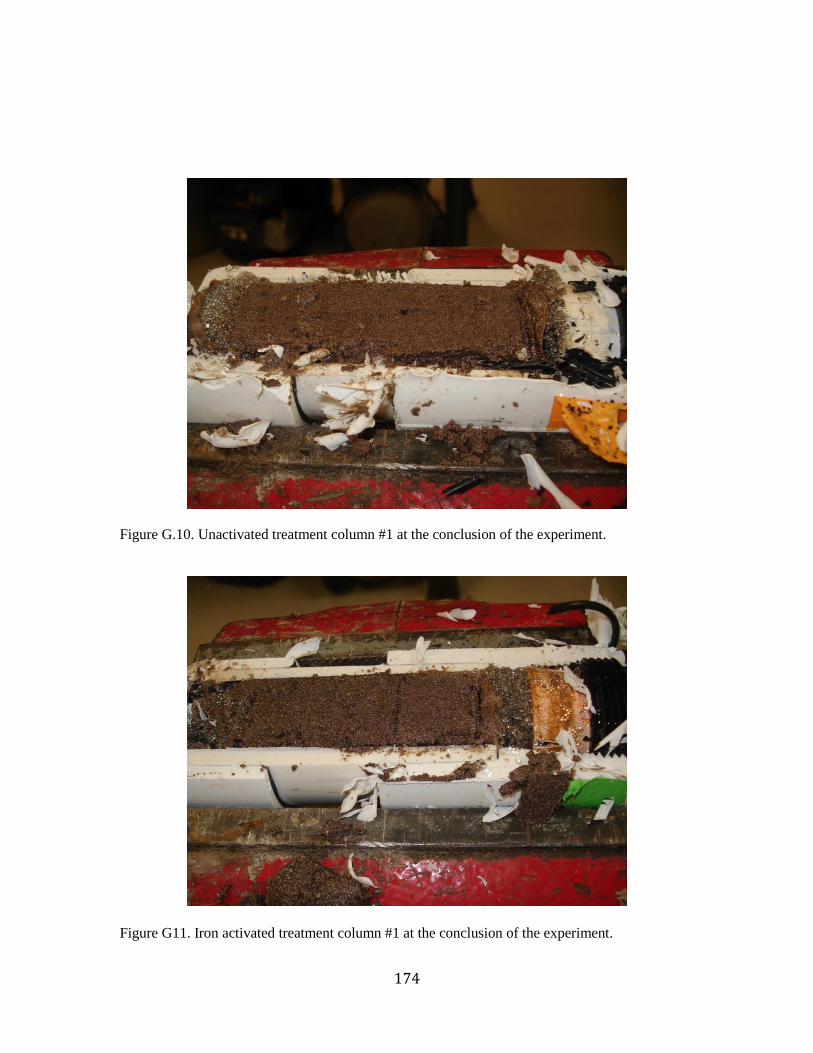
174
Figure G.10. Unactivated treatment column #1 at the conclusion of the experiment.
Figure G11. Iron activated treatment column #1 at the conclusion of the experiment.
Related Documents