Evaluation of MR markers that predict survival in patients with newly diagnosed GBM prior to adjuvant therapy Suja Saraswathy, Department of Radiology and Biomedical Imaging, UCSF, Box 2532, Byers Hall, 1700 4th Street, San Francisco, CA 94143-2532, USA Forrest W. Crawford, Department of Radiology and Biomedical Imaging, UCSF, Box 2532, Byers Hall, 1700 4th Street, San Francisco, CA 94143-2532, USA Kathleen R. Lamborn, Department of Neurological Surgery, UCSF, San Francisco, CA, USA Andrea Pirzkal, Department of Radiation Oncology, UCSF, San Francisco, CA, USA Susan Chang, Department of Neurological Surgery, UCSF, San Francisco, CA, USA Soonmee Cha, and Department of Radiology and Biomedical Imaging, UCSF, Box 2532, Byers Hall, 1700 4th Street, San Francisco, CA 94143-2532, USA Sarah J. Nelson Department of Radiology and Biomedical Imaging, UCSF, Box 2532, Byers Hall, 1700 4th Street, San Francisco, CA 94143-2532, USA UCSF/UCB Joint Graduate Group in Bioengineering, UCSF, San Francisco, CA, USA Sarah J. Nelson: [email protected] Abstract Purpose—Glioblastoma Multiforme (GBM) is the most common and lethal primary brain tumor in adults. The goal of this study was to test the predictive value of MR parameters in relation to the survival of patients with newly diagnosed GBM who were scanned prior to receiving adjuvant radiation and chemotherapy. Methods—The study population comprised 68 patients who had surgical resection and were to be treated with fractionated external beam radiation therapy and chemotherapy. Imaging scans included anatomical MRI, diffusion and perfusion weighted imaging and 1 H MRSI. The MR data were acquired 3–5 weeks after surgery and approximately 1 week before treatment with radiation therapy. The diffusion, perfusion and spectroscopic parameter values were quantified and subjected to proportional hazards analysis that was adjusted for age and scanner field strength. Results—The patients with larger lesion burden based upon volumes of anatomic lesions, volume of CNI2 (number of voxels within the T2 lesion having choline to NAA index >2), © Springer Science+Business Media, LLC. 2008 Correspondence to: Sarah J. Nelson, [email protected]. Presented in part at the 15th annual meeting of ISMRM, Berlin, Germany, May, 2007. NIH Public Access Author Manuscript J Neurooncol. Author manuscript; available in PMC 2011 January 18. Published in final edited form as: J Neurooncol. 2009 January ; 91(1): 69–81. doi:10.1007/s11060-008-9685-3. NIH-PA Author Manuscript NIH-PA Author Manuscript NIH-PA Author Manuscript

Welcome message from author
This document is posted to help you gain knowledge. Please leave a comment to let me know what you think about it! Share it to your friends and learn new things together.
Transcript

Evaluation of MR markers that predict survival in patients withnewly diagnosed GBM prior to adjuvant therapy
Suja Saraswathy,Department of Radiology and Biomedical Imaging, UCSF, Box 2532, Byers Hall, 1700 4th Street,San Francisco, CA 94143-2532, USA
Forrest W. Crawford,Department of Radiology and Biomedical Imaging, UCSF, Box 2532, Byers Hall, 1700 4th Street,San Francisco, CA 94143-2532, USA
Kathleen R. Lamborn,Department of Neurological Surgery, UCSF, San Francisco, CA, USA
Andrea Pirzkal,Department of Radiation Oncology, UCSF, San Francisco, CA, USA
Susan Chang,Department of Neurological Surgery, UCSF, San Francisco, CA, USA
Soonmee Cha, andDepartment of Radiology and Biomedical Imaging, UCSF, Box 2532, Byers Hall, 1700 4th Street,San Francisco, CA 94143-2532, USA
Sarah J. NelsonDepartment of Radiology and Biomedical Imaging, UCSF, Box 2532, Byers Hall, 1700 4th Street,San Francisco, CA 94143-2532, USA
UCSF/UCB Joint Graduate Group in Bioengineering, UCSF, San Francisco, CA, USASarah J. Nelson: [email protected]
AbstractPurpose—Glioblastoma Multiforme (GBM) is the most common and lethal primary brain tumorin adults. The goal of this study was to test the predictive value of MR parameters in relation tothe survival of patients with newly diagnosed GBM who were scanned prior to receiving adjuvantradiation and chemotherapy.
Methods—The study population comprised 68 patients who had surgical resection and were tobe treated with fractionated external beam radiation therapy and chemotherapy. Imaging scansincluded anatomical MRI, diffusion and perfusion weighted imaging and 1H MRSI. The MR datawere acquired 3–5 weeks after surgery and approximately 1 week before treatment with radiationtherapy. The diffusion, perfusion and spectroscopic parameter values were quantified andsubjected to proportional hazards analysis that was adjusted for age and scanner field strength.
Results—The patients with larger lesion burden based upon volumes of anatomic lesions,volume of CNI2 (number of voxels within the T2 lesion having choline to NAA index >2),
© Springer Science+Business Media, LLC. 2008Correspondence to: Sarah J. Nelson, [email protected] in part at the 15th annual meeting of ISMRM, Berlin, Germany, May, 2007.
NIH Public AccessAuthor ManuscriptJ Neurooncol. Author manuscript; available in PMC 2011 January 18.
Published in final edited form as:J Neurooncol. 2009 January ; 91(1): 69–81. doi:10.1007/s11060-008-9685-3.
NIH
-PA Author Manuscript
NIH
-PA Author Manuscript
NIH
-PA Author Manuscript
volume of CBV3 (number of pixels within the T2 lesion having relative cerebral blood volume>3), and volume of nADC1.5 (number of pixels within the T2 lesion having normalized apparentdiffusion coefficient <1.5) had a higher risk for poor outcome. High intensities of combinedmeasures of lactate and lipid in the T2 and CNI2 regions were also associated with poor survival.
Conclusions—Our study indicated that several pre-treatment anatomic, physiological andmetabolic MR parameters are predictive of survival. This information may be important forstratifying patients to specific treatment protocols and for planning focal therapy.
KeywordsMagnetic resonance imaging; Brain tumor; Survival analysis
IntroductionGlioblastoma multiforme (GBM) is the most common and lethal primary brain tumor inadults. It is nearly uniformly fatal, with a median survival of approximately 1 year, despitemultimodality treatment approaches. There is considerable heterogeneity in outcomebetween different patients, with a wide range of survival times. Efforts to understand whysome patients live longer than others are expected to provide insights into designingtreatment methodologies tailored to individual patients. More accurate assessment of thebaseline risk for each patient would allow improved treatment selection and may be valuablefor stratifying participants in clinical trials into subgroups with more uniform outcomes.
There are several prognostic factors described in the literature that have been proposed asinfluencing the survival of patients with glioblastoma multiforme (GBM). These includeage, performance status, histological factors, lesion location, extent of surgical resection,adequate radiation therapy, presence of epidermal growth factor, microvessel density,presence of seizures and glucocortical dependency [4,10,12,17,18,27,35,49,57]. While theseare of interest for patient evaluation and are being studied in ongoing large scale clinicaltrials, it would be beneficial if there were more specific, non-invasive parameters forassessing the likelihood of responding to therapy and for evaluating treatment effects inindividual patients.
Perfusion weighted MRI has been proposed as a candidate for predicting outcome in patientswith glioma. The data obtained with this technique can be used to calculate relative cerebralblood volume (rCBV), which is associated with tumor microvascularity and may be able todistinguish residual and/or recurrent tumor from treatment induced necrosis[7,13,16,19,26,42]. A second technique of interest is diffusion weighted MRI [3]. Thisreflects the degree of tissue structure, water content, and intra- and extra cellular space andhas been proposed as a measure of tumor cellularity [8,9,32,41,51]. A third technique isproton MR spectroscopic imaging (1H MRSI), which enables the quantitative assessment ofthe spatial distribution of tissue metabolites such as choline, creatine, N-acetylaspartate(NAA), lactate, and lipid [39,55].
The current study is based upon the hypothesis that perfusion weighted MRI, diffusionweighted MRI and 1H MRSI are valuable for identifying the true spatial extent andmalignancy of tumor and that they are useful for predicting survival in patients with GBM.The objective was to test the prognostic value of these techniques in relation to the survivalof patients with newly diagnosed GBM who were scanned after surgical resection but priorto receiving adjuvant radiation and chemotherapy.
Saraswathy et al. Page 2
J Neurooncol. Author manuscript; available in PMC 2011 January 18.
NIH
-PA Author Manuscript
NIH
-PA Author Manuscript
NIH
-PA Author Manuscript
Materials and methodsPatient population
The study population comprised 68 patients who had been classified as having grade IVglioma (GBM) based upon histological analysis of tissue samples according to the worldhealth organization (WHO II) criteria. These patients had undergone surgical resection andwere to be treated with fractionated external beam radiation therapy (XRT) andchemotherapy. All subjects gave their written informed consent.
MRI examinationMR data were acquired using either 1.5T or 3T MR scanners (GE Healthcare, Milwaukee,WI) using commercially available head coils. Thirty-five of them were scanned with a 1.5Tscanner and 33 were scanned with a 3T scanner. All 68 patients had anatomical MRI; 61patients had perfusion weighted imaging, 65 patients had diffusion weighted imaging and 67patients had 1H MRSI. The median time between surgery and the pre-radiation scan was 27days.
Anatomical MRIThe MRI protocol consisted of T1-weighted (TR/TE = 400/12 ms) sagittal scout images;axial (FLAIR) fluid attenuated inversion recovery images (TR/TE/T1 = 1000/143/2200 ms,220 × 220 × 160 mm3 field of view (FOV) with 256 × 256 × 32 matrix); and pre- and postcontrast T1-weighted (SPGR) spoiled gradient echo images (TR/TE = 32/8, 40 flip angle,180 × 240 × 186 mm3 FOV with 192 × 256 × 124 matrix). The FLAIR and pre gadoliniumSPGR images were aligned to the post gadolinium SPGR images using software developedin our laboratory [37]. Figure 1 shows examples of FLAIR and T1 weighted postGadolinium images.
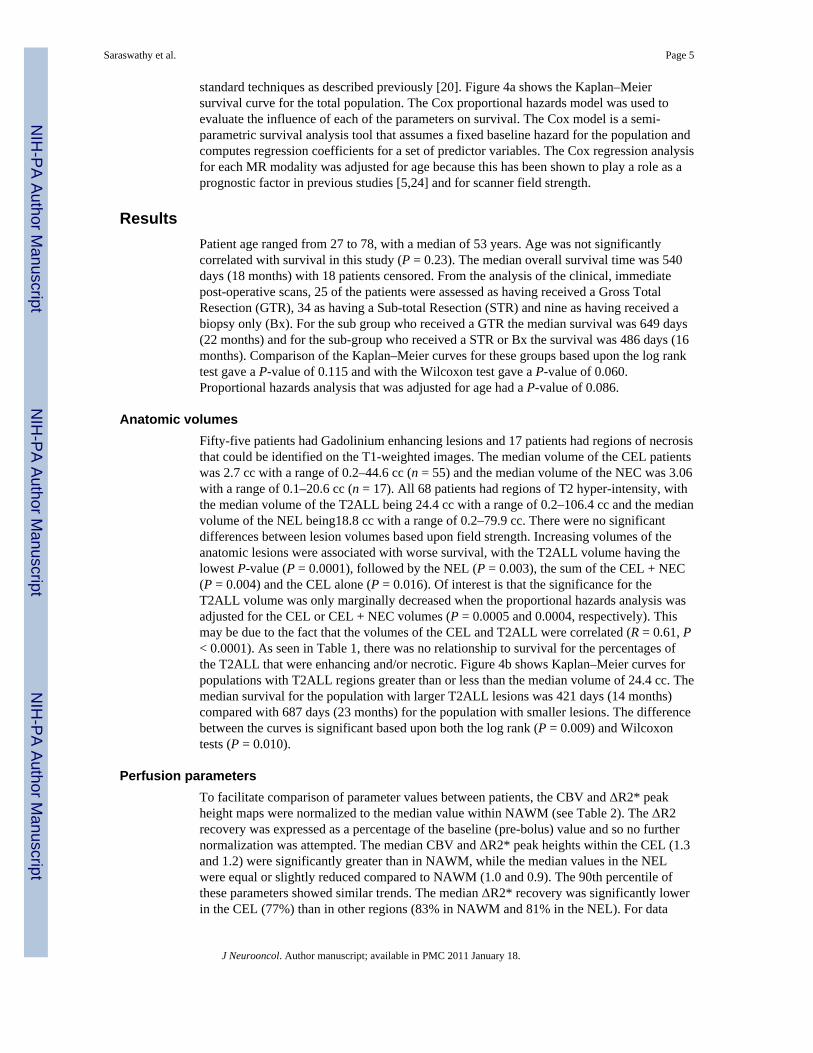
Perfusion weighted imagingA bolus of 0.1 mmol/kg of body weight gadolinium diethyl enetriamine-pentacid (Gd-DTPA) was injected rapidly into the antecubital vein using an automatic injector (Medrad,Pittsburgh, PA) at a rate of about 5 ml/s. Dynamic susceptibility contrast EPI-gradient echoimages were acquired before, during and after the bolus injection. Perfusion weightedimaging parameters were TR/TE of 1500/54 ms, 35° flip angle, 26 × 26 cm2 FOV, 128 ×128 acquisition matrix, 4 mm slice thickness and a total of 80 time points. Perfusion datasetswere processed to yield relative cerebral blood volume (rCBV), percent ΔR2* recovery, andΔR2* peak height maps using in-house software [30]. Perfusion derived maps wereresampled to the same resolution as the SPGR images and rigidly aligned to the SPGR usingthe VTK software package. Figure 2 shows an example of rCBV and ΔR2* peak heightmaps for one of the patients in the study.
Diffusion weighting imagingAn echo planar imaging (EPI) spin echo (SE) diffusion weighted pulse sequence was used toacquire images that covered supratentorial brain. DWI parameters were TR/TE = 10000/100ms, matrix 128 × 128 × 28, FOV = 360 × 360 mm3, 3 mm slice thickness, b value = 1000 s/mm2, gradient strength = 0.04 T/m, gradient duration = 21 ms and gradient separation = 27ms. The apparent diffusion coefficient (ADC) maps were calculated based upon the MRsignal intensity decay from diffusion datasets using software developed in-house. Diffusionmaps were resampled to the same resolution as the SPGR images and rigidly aligned to themusing the VTK software package. Figure 1c shows an example of a diffusionmap for one ofthe patients in the study.
Saraswathy et al. Page 3
J Neurooncol. Author manuscript; available in PMC 2011 January 18.
NIH
-PA Author Manuscript
NIH
-PA Author Manuscript
NIH
-PA Author Manuscript

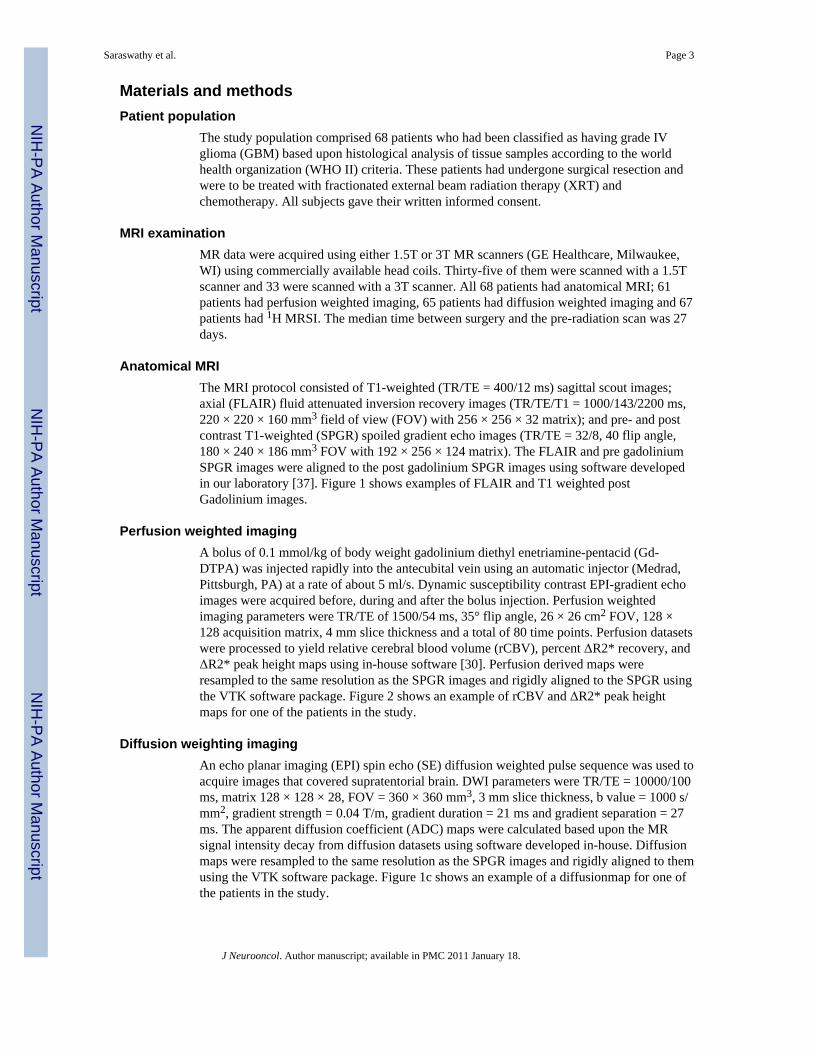
1H MRSIThree-dimensional 1H MRSI data (TR/TE = 1000/144 ms, phase encoding matrix = 12 × 12× 8 or 16 × 8 × 8) with 1 cc nominal spatial resolution was acquired with patient resolvedspectroscopic (PRESS) volume localization and very selective saturation (VSS) bands [53]for outer voxel suppression. The post gadolinium T1 weighted SPGR images were used toprescribe the PRESS selected volume to cover both the lesion and 200–300 cc of adjacentnormal appearing tissue. Areas of subcutaneous lipids and regions with rapidly varyingmagnetic susceptibility were avoided whenever possible. Of the patients who receivedspectroscopy, 35 received lactate-edited spectroscopy as described previously [48]. Figure 3shows examples of spectra that were obtained from one of the patients using a 1.5T MRscanner with a lactate edited pulse sequence.
The 1H MRSI processing algorithms were developed in-house and have been applied to alarge number of patients [36,38]. Briefly, the data were filtered with a Lorentzian functionand Fourier transformed, resulting in an array of spectra. The spectra were corrected forbaseline variations, phase shifts and frequency shifts within the region of each peak,employing a priori information about the relative location of each metabolite peak. Anautomatic search procedure was used to identify each resonance. The peak heights ofcholine, creatine, NAA, lactate and lipid resonances were quantified. In order that thepatients who did not have lactate edited 1H MRSI could be included in the analysis, an indexof combined contributions was defined to be the absolute peak intensity of the combinedpeak for the non-lactate edited case and the sum of lactate and lipid values where they wereavailable. The choline to NAA index (CNI) was calculated using an automated techniquedescribed by [33]. Metabolic maps were resampled with sinc interpolation to the sameresolution as the SPGR images. The spectroscopic data was assumed to be in alignment withthe post-gadolinium SPGR images since the 1H MRSI examination was acquired shortlyafterward.
Post processing of anatomic imagesThe contrast enhancing lesion (CEL) and necrotic (NEC) regions were contoured on the postGd SPGR images. The T2 hyperintense region (T2ALL) was contoured on the FLAIRimages and was chosen to exclude the resection cavity. The non-enhancing lesion (NEL)was defined as the T2ALL minus the CEL and NEC regions. There was no attempt todistinguish between edema and residual tumor. All tumor region-of-interest segmentationwas performed using in-house semi-automated segmentation software [46]. Normalappearing white matter (NAWM) regions were automatically segmented using the FSLsegmentation software package (http://www.fmrib.ox.ac.uk/fsl/fast/index.html).
AnalysisThe perfusion and diffusion parameter values were analyzed within each of the segmentedanatomical regions (NAWM, CEL, T2ALL, NEL and NEC), limiting the region of analysisfor the perfusion data to the region covered by the data acquisition. The diffusion-weightedimages covered the entire brain permitting an unrestricted analysis. The metabolite valueswithin the CEL were measured by its intersection with the PRESS excitation volume. Toanalyze the metabolite values, masks of the anatomic regions of interest were re-sampled tomatch the resolution of the spectral data. Voxels that were predominantly in NAWM, theCEL, the NEC or the NEL, as well voxels that had metabolite values greater than specificthresholds were used to calculate the statistics for the analysis.
Survival was determined from the date of the MR examination prior to radiation therapy.For circumstances where the patient was still alive (18 out of 68), the survival was censoredwith the date of the last physician visit. Kaplan–Meier survival curves were computed using
Saraswathy et al. Page 4
J Neurooncol. Author manuscript; available in PMC 2011 January 18.
NIH
-PA Author Manuscript
NIH
-PA Author Manuscript
NIH
-PA Author Manuscript
standard techniques as described previously [20]. Figure 4a shows the Kaplan–Meiersurvival curve for the total population. The Cox proportional hazards model was used toevaluate the influence of each of the parameters on survival. The Cox model is a semi-parametric survival analysis tool that assumes a fixed baseline hazard for the population andcomputes regression coefficients for a set of predictor variables. The Cox regression analysisfor each MR modality was adjusted for age because this has been shown to play a role as aprognostic factor in previous studies [5,24] and for scanner field strength.
ResultsPatient age ranged from 27 to 78, with a median of 53 years. Age was not significantlycorrelated with survival in this study (P = 0.23). The median overall survival time was 540days (18 months) with 18 patients censored. From the analysis of the clinical, immediatepost-operative scans, 25 of the patients were assessed as having received a Gross TotalResection (GTR), 34 as having a Sub-total Resection (STR) and nine as having received abiopsy only (Bx). For the sub group who received a GTR the median survival was 649 days(22 months) and for the sub-group who received a STR or Bx the survival was 486 days (16months). Comparison of the Kaplan–Meier curves for these groups based upon the log ranktest gave a P-value of 0.115 and with the Wilcoxon test gave a P-value of 0.060.Proportional hazards analysis that was adjusted for age had a P-value of 0.086.
Anatomic volumesFifty-five patients had Gadolinium enhancing lesions and 17 patients had regions of necrosisthat could be identified on the T1-weighted images. The median volume of the CEL patientswas 2.7 cc with a range of 0.2–44.6 cc (n = 55) and the median volume of the NEC was 3.06with a range of 0.1–20.6 cc (n = 17). All 68 patients had regions of T2 hyper-intensity, withthe median volume of the T2ALL being 24.4 cc with a range of 0.2–106.4 cc and the medianvolume of the NEL being18.8 cc with a range of 0.2–79.9 cc. There were no significantdifferences between lesion volumes based upon field strength. Increasing volumes of theanatomic lesions were associated with worse survival, with the T2ALL volume having thelowest P-value (P = 0.0001), followed by the NEL (P = 0.003), the sum of the CEL + NEC(P = 0.004) and the CEL alone (P = 0.016). Of interest is that the significance for theT2ALL volume was only marginally decreased when the proportional hazards analysis wasadjusted for the CEL or CEL + NEC volumes (P = 0.0005 and 0.0004, respectively). Thismay be due to the fact that the volumes of the CEL and T2ALL were correlated (R = 0.61, P< 0.0001). As seen in Table 1, there was no relationship to survival for the percentages ofthe T2ALL that were enhancing and/or necrotic. Figure 4b shows Kaplan–Meier curves forpopulations with T2ALL regions greater than or less than the median volume of 24.4 cc. Themedian survival for the population with larger T2ALL lesions was 421 days (14 months)compared with 687 days (23 months) for the population with smaller lesions. The differencebetween the curves is significant based upon both the log rank (P = 0.009) and Wilcoxontests (P = 0.010).
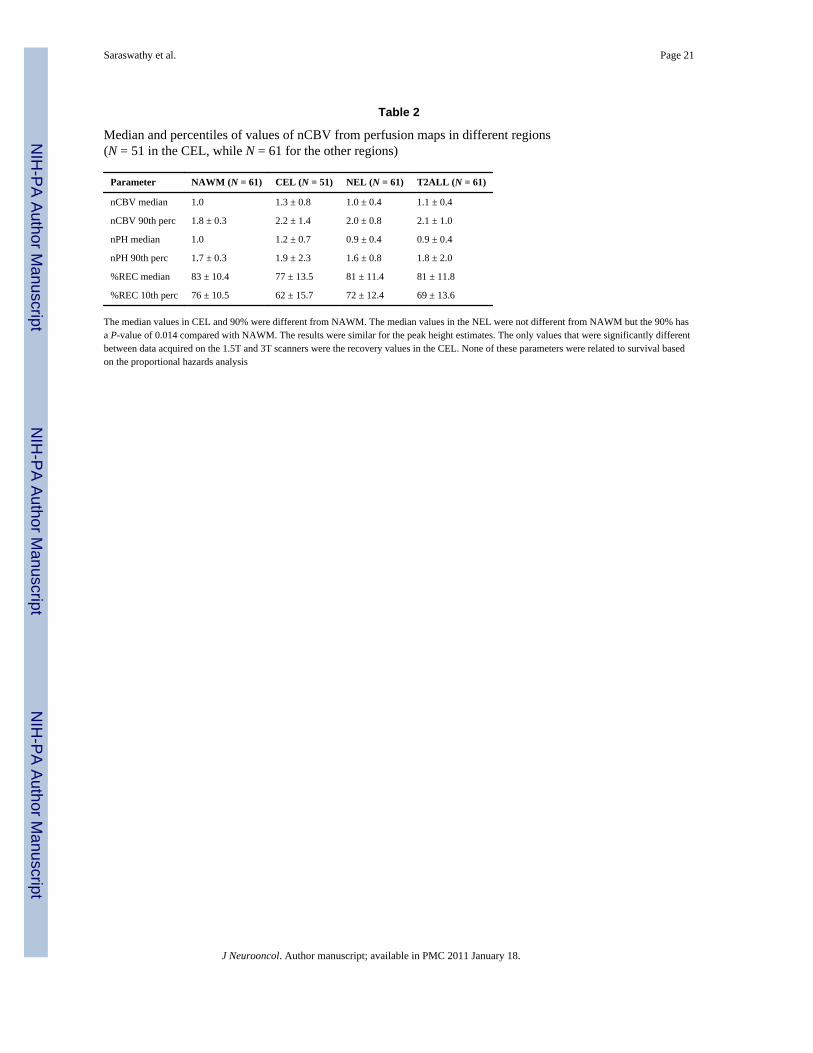
Perfusion parametersTo facilitate comparison of parameter values between patients, the CBV and ΔR2* peakheight maps were normalized to the median value within NAWM (see Table 2). The ΔR2recovery was expressed as a percentage of the baseline (pre-bolus) value and so no furthernormalization was attempted. The median CBV and ΔR2* peak heights within the CEL (1.3and 1.2) were significantly greater than in NAWM, while the median values in the NELwere equal or slightly reduced compared to NAWM (1.0 and 0.9). The 90th percentile ofthese parameters showed similar trends. The median ΔR2* recovery was significantly lowerin the CEL (77%) than in other regions (83% in NAWM and 81% in the NEL). For data
Saraswathy et al. Page 5
J Neurooncol. Author manuscript; available in PMC 2011 January 18.
NIH
-PA Author Manuscript
NIH
-PA Author Manuscript
NIH
-PA Author Manuscript
acquired using the 3T scanner, the median and 10th percentile of the ΔR2* recovery weresignificantly lower in the CEL (73% and 56%) than with the data from the 1.5T scanner(78% and 65%), presumably due to the increased sensitivity to susceptibility effects at thehigher field strength.
Although there is no standard threshold for distinguishing regions with abnormal CBV,previous studies have proposed that values greater than three times NAWM (nCBV >3) areconsidered to be abnormal [30]. Despite the fact that such regions were relatively small witha median volume of 0.6 cc, it was observed that large nCBV volumes were associated withworse survival (P = 0.039). Figure 6a shows the normalized CBV histograms within thecritical regions of interest for one of the patients. Note that there is considerable overlap inthe values between different regions and, although the distributions are different, there areelevated nCBV values in both the CEL and NEL.
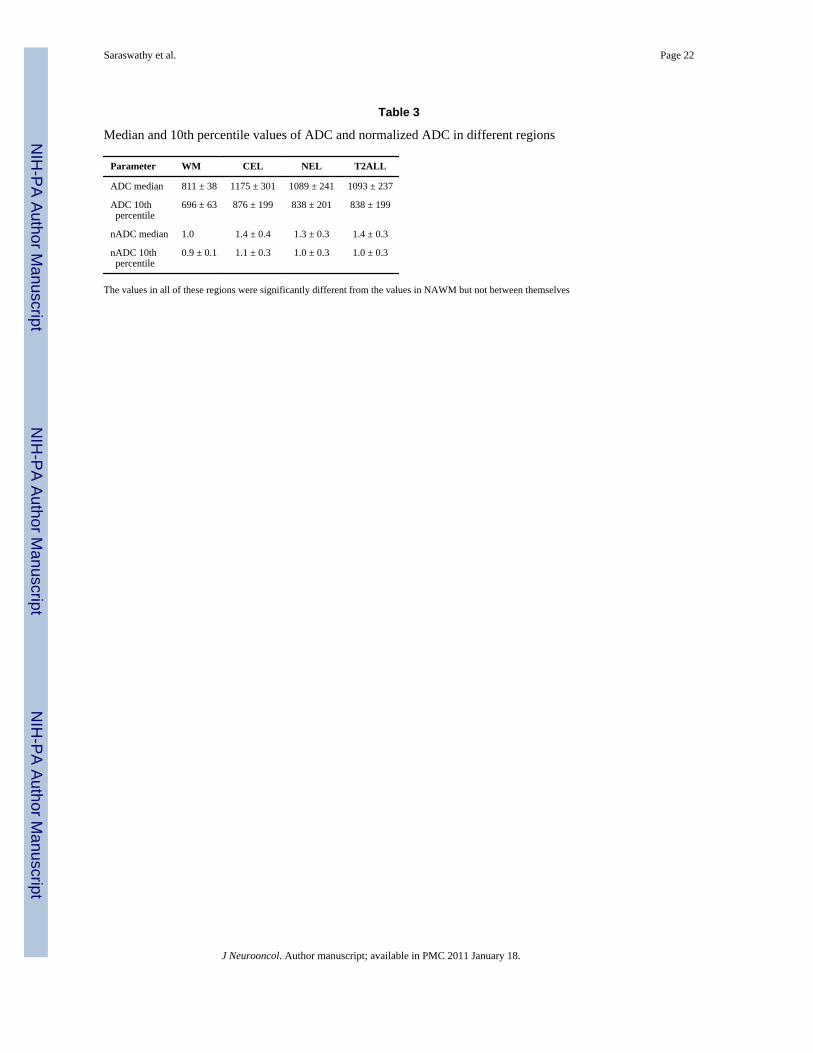
Diffusion parametersThe median ADC was increased in all anatomic regions compared to NAWM but the valueswere similar in the CEL than in the NEL (1.4 vs. 1.3, see Table 3). Figure 6b shows anexample of histograms for the normalized ADC within the various regions and illustrates thelarge overlap between them. The 10th percentiles of ADC showed similar trends to themedian values. Based upon the proportional hazards analysis there was no associationbetween the intensities of ADC or nADC in different regions and survival. As with theperfusion parameters, there is no clear cut-off for ADC that distinguishes tumor versusNAWM and edema. Our previous study had indicated that patients with median nADCvalue within the T2all less than 1.5 may have worse survival [40] and so we used thisthreshold to define the volume of the T2ALL that had low nADC. The median volume forthe current patient population was 12.9 cc and the P-value for the proportional hazardanalysis of these volumes was 0.002 (see Table 1). The median and the 10th percentile ofthe ADC and nADC values within the anatomic regions were not found to be significantlyassociated with survival.
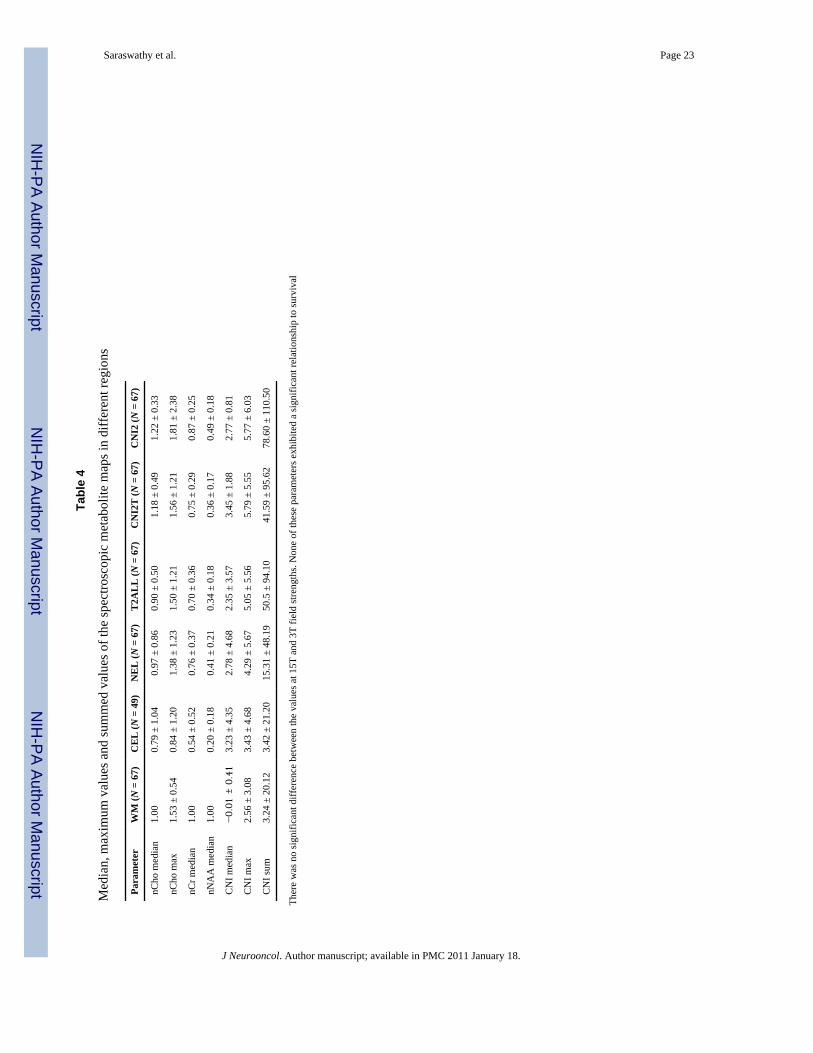
Metabolic parametersThe levels of choline, creatine and NAA are summarized in Table 4. The median cholinewas lower in the CEL than the NEL or NAWM (0.79 vs. 0.97 and 1.00). Median levels ofcreatine and NAA were decreased in all lesion regions and lowest in the CEL region (0.54and 0.20, respectively). The CNI was increased in all lesion regions with the highest medianvalues in the overall population being in the CEL region but the highest maximum and sumof CNI value being within the voxels with CNI >2. The histograms in Fig. 6c shows anexample of a patient who had highly elevated CNI in the NEL region.
The region of the lesion covered by the intersection of T2ALL and the PRESS selectedvolume with CNI value greater than 2 (termed the CNI2T) was evaluated as a measure oftumor burden. In this case the number of voxels in the CNI2T region had a median value of15.9, which means that it was larger than the CEL, but still relatively small compared withthe T2ALL. Large CNI2T volumes were associated with poor survival (P = 0.005). To seewhether this could be attributed merely to a larger CEL region, the survival analysis wasrepeated with the volume of the CEL and the volume of the CEL + NEC being considered asco-variates. The hazard ratio remained similar and the significance of the CNI2T volumeswere P = 0.021 and P = 0.009. Clearly the metabolic and anatomic parameters provideinformation about different aspects of the tumor. Figure 5 shows spectral data from in apatient with what was classified as a GTR in the immediate post-surgery scan and had verylittle contrast enhancement in the pre-RT scan but had highly elevated choline and decreasedNAA in the NEL.
Saraswathy et al. Page 6
J Neurooncol. Author manuscript; available in PMC 2011 January 18.
NIH
-PA Author Manuscript
NIH
-PA Author Manuscript
NIH
-PA Author Manuscript
It should be noted that there were voxels outside the T2ALL with CNI greater than 2 formany patients (the median total number of voxels with CNI >2 was 30.6 compared with amedian number in the CNI2T region of 15.9). From examination of the data it was observedthat many of these voxels had relatively normal levels of choline but substantially decreasedNAA. The P-value for the proportional hazards analysis for the total number of voxels withCNI >2 was 0.059 compared with the P-value of 0.005 for those that were within theT2ALL.
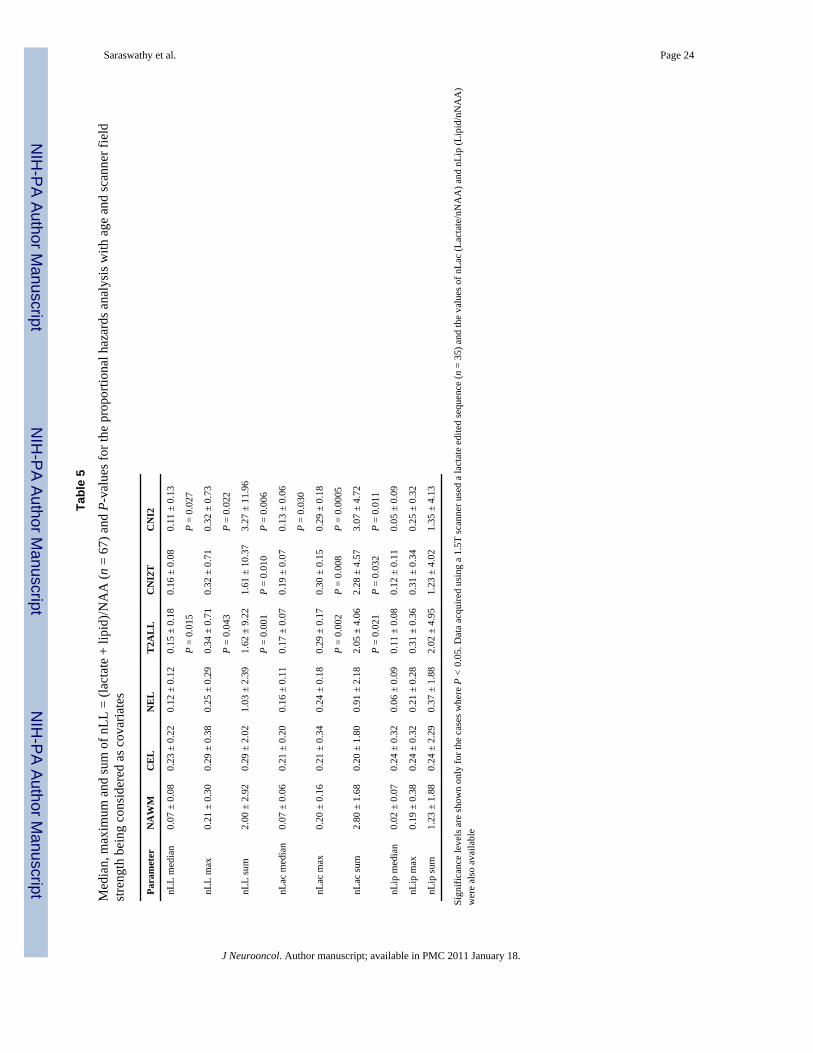
Table 5 shows the lactate and lipid levels, which were normalized to the median value ofNAA within NAWM in order to facilitate comparisons between patients. In the overallpatient population it was observed that although the combined lactate and lipid resonances(nLL) were increased in all lesion regions, they tended to have higher median intensity inthe CEL region compared to NAWM (0.23 vs. 0.07). There were however, voxels with highnLL outside the CEL, as indicated by the maximum and the sum of these values, which werehighest in the region with voxels having CNI >2. The median number of voxels withelevated nLL was significantly larger for the patients whose data were acquired on a 3Tscanner, presumably because the SNR was larger for these patients (median of 18 voxelsversus nine voxels for data from 1.5T). When controlling for age and scanner type theproportional hazards analysis indicated that the number of voxels with elevated nLL had aP-value of 0.009. Although the volumes were larger, the magnitude of the median,maximum and sum of the nLL values were significantly lower at 3T compared to 1.5T forall regions except for the CEL. Table 5 shows that, when controlling for scanner and age,parameters describing of the intensities of nLL in voxels in the T2ALL and CNI2 were alsoassociated with survival, with the P-values for sum of nLL values in T2ALL and CNI2being the smallest (0.001 and 0.006, respectively).
For the 35 patients who were scanned with lactate edited MRSI it was possible to examinethe effects of lactate and lipid separately. An example of lactate edited MRSI spectra isshown in Fig. 3. This demonstrates that there were some voxels within the CEL that haveCNI >2 but no lactate and lipid, while other voxels have both CNI >2 and elevated lactateand lipid. The histograms of lactate intensities in Fig. 6d from another of the patients in thestudy show that there were also voxels with elevated lactate in both the CEL and NEL. Thesummary values in Table 5 indicate that there were voxels with elevated Lac in all of theregions considered, but that lipid values were more likely to be focused in the CEL.Although none of the lipid parameters were associated with survival, the maximum valuesof lactate in the T2ALL, CNI2T and CNI2 regions had P-values from the proportionalhazards analysis of 0.002, 0.008 and 0.0005, respectively. The corresponding summedlactate values were also significant but had larger P-values (0.021, 0.032 and 0.011).
DiscussionThe survival for patients with glioma depends on both the underlying malignancy of thetumor and its ability to respond to treatment. Since both of these are intrinsic properties oftumor cells, the goal of the present study was to examine if there is a relationship betweenthe post-surgery, pre treatment MR parameters and survival. The most notable finding wasthat all of the post-surgery, pre-radiation measures of the tumor volume including anatomic,perfusion, diffusion and metabolic parameters were associated with survival. Althoughprevious studies have indicated that the extent of surgical resection may be an importantfactor in predicting survival for gliomas [18,21,22,24,25] this is the first time that data frompre-treatment scans have been analyzed for both the conventional and the more advancedMR imaging modalities. In the following we discuss the implications of these findings interms of how perfusion, diffusion and spectroscopic data can be interpreted in the context ofanatomic images.
Saraswathy et al. Page 7
J Neurooncol. Author manuscript; available in PMC 2011 January 18.
NIH
-PA Author Manuscript
NIH
-PA Author Manuscript
NIH
-PA Author Manuscript

Anatomic measures of tumor burdenThe fact that the volume of the T2 hyperintensity had the strongest relationship with survivaland that this remained highly significant when controlling for the volumes of theGadolinium enhancing and necrotic lesions, suggests that it was the most reliable anatomicmeasure of tumor burden for this population. These findings are in marked contrast to thosefrom a related study performed in our laboratory for patients who were scanned prior to theirinitial surgery [11]. That study found none of the pre-surgery anatomic lesion volumes to beassociated with survival. One explanation of the differences between the results at these twotime points is the variability in the extent of resection caused by the location of the tumor,which could mean that there is no clear relationship between pre- and post-surgery volumes.A second explanation is that the volume of T2 hyperintensity in the pre-surgery scan is anunreliable measure of tumor burden because it includes substantial contributions fromedema. In either case, this study is indicating that removal of portions of the tumor and theassociated reduction in mass effect results in the residual volumes of T2 hyperintensitybecoming the most accurate measure of tumor burden.
Measures of tumor cellularity/proliferation from the MRSI dataA further implication of the high level of significance for the volume of the T2hyperintensity is that the non-enhancing portion of the tumor has an impact upon survivaland should therefore play a prominent role in evaluating prognosis and directing therapy.Interestingly the number of voxels with elevated CNI that were within the T2 hyperintensityinclude substantial portions that were non-enhancing and showed a significant relationshipto survival. This implies that the CNI lesion, which reflects a combination of tumorcellularity and increased proliferation, may be a more reliable measure of tumor burden thanthe Gadolinium enhancing lesion and may be important for distinguishing tumor fromedema.
This finding is consistent with our previous studies [28,40,43,44], which showed that theregions with the highest CNI were frequently outside the enhancing tumor volume and thatthere were substantial differences between the spatial extent of morphologic and metaboliclesions. Note that high CNI values reflect both increased choline due to high cell density orproliferative capacity and loss of NAA [33,34,54]. The presence of voxels outside of the T2hyperintensity with normal choline and decreased NAA may be due to infiltrative tumor orto impairment of neuronal function in regions close to the site of resection. This may explainthe stronger association with survival for the number of voxels with elevated CNI within theT2 hyperintensity compared with the total number of voxels with elevated CNI. Futurestudies should acquire 1H MRSI data at a field strength of 3T to improve the signal to noiseratio of the data [29] and should examine the patterns of tumor progression for patients whohave abnormal voxels outside the T2 hyperintensity in order to determine whether the NAAintensities in these voxels recover with time or whether these regions show evidence oftumor growth.
Measures of tumor burden from DWI dataThe existence of large regions with ADC values within the T2 region that were less than 1.5times normal appearing white matter was observed to be associated with poor survival atpre-surgery [11] and pre-radiation time points. The latter is consistent with previous resultsfrom our laboratory in a smaller population of patients [40] and with observations that havelinked low ADC with high tumor cellularity [14,23,51,52]. Of interest is that despite thesignificance of the volumes of lower ADC, there was no relationship between the intensitiesof ADC in the Gadolinium enhancing volume as had been the case for the data from our pre-surgery population. This may be due to ambiguities in ADC intensity that are induced bypost-surgery ischemia in regions close to the surgical cavity and which have been shown to
Saraswathy et al. Page 8
J Neurooncol. Author manuscript; available in PMC 2011 January 18.
NIH
-PA Author Manuscript
NIH
-PA Author Manuscript
NIH
-PA Author Manuscript

lead to subsequent regions of Gadolinium enhancement that turn into cysticencephalomalacia in a period of 2–6 months after surgery [47]. Despite this effect, our studyimplies that the pre-radiation ADC maps may be valuable for assessing the spatial extent ofthe region of tumor, which is important for defining the target for focal therapy andcustomizing treatment planning. Other recent reports have indicated that early changes inADC have a strong potential as an early biomarker for treatment response [9,15].
Measures of tumor burden from PWI dataThe presence of regions with increased and abnormal blood vessels is an importantcharacteristic for distinguishing high grade from low grade glioma [6], and is thereforeexpected to be associated with poor survival. The relationship of the volume of the regionwithin the T2 hyperintensity with CBV greater than three times normal appearing whitematter to survival in our post-surgery pre-radiation population is therefore not surprising. Itshould be noted, however, that the regions with high CBV and high ΔR2* peak height wererelatively small and were located mainly within areas of residual Gadolinium enhancement.The findings in this study are thus consistent with the surgery removing not only asubstantial part of the enhancing lesion, but also the major component of the region withabnormal vascular parameters. While the areas with abnormal vascularity are likely to growlarger as the tumor progresses, none of the intensities of the perfusion parameters within thepre-radiation abnormalities were predictive of survival. The comparison of 1.5T and 3T datashowed similar qualitative results for the two datasets but gave improved sensitivity forseveral of the resulting MR parameters [31]. This suggests that 3T should be the fieldstrength used for future studies on patients with brain tumors. The increased sensitivity ofthe 3T data to vessel permeability as reflected by differences in ΔR2* recovery between thetwo field strengths suggest that future studies wishing to measure this parameter wouldbenefit from being performed at the higher field strength.
1H MRSI parameters reflecting malignant behaviorIn this study, the number of voxels in the T2 hyperintensity and regions with CNI greaterthan 2 that had elevated combined levels of lactate and lipid values were also related to poorsurvival. From the analysis of the lactate edited data it appears that lactate was the key factorcontributing to this poor outcome. Increased lactate may occur when the anaerobic glycolicpathway exceeds the capacity of the lactate catabolizing respiratory pathways or when thecellular capacity for exporting lactate to the blood stream is impaired [45,56]. This wouldindicate tumor metabolism, infiltration and growth. Another possibility is that the lactatepeaks are indicators of hypoxia, which has been shown to be a factor in poor response to thetreatment of radio or chemotherapy [1]. Underlying mechanisms include the presence ofoxygen which is required for fixation of radiation induced damage in DNA, the involvementof hypoxia driving genetic instability and resulting in tumor progression [50]. Previousstudies have supported the role of lactate and lipid in defining malignant behavior [2,28].
ConclusionThis study has examined the value of pre-XRT in vivo MR parameters in predicting survivalfor patients with GBM. Anatomic, physiological and metabolic measures of residual tumorvolume were strongly related with survival. Of particular interest is that several of theseparameters were different from the factors that were prognostic prior to surgical resection.Factors highlighted in this pre-radiation scan were the contribution of the non-enhancingportion of the T2 hyperintenisty, as well as the role of DWI and 1H MRSI in defining tumorwithin these regions. While our current study was limited by having incomplete coverage ofthe T2 lesion for some of the MRSI and PWI datasets, future advances in data acquisitionmethods are expected to significantly improved coverage and allow these variables to be
Saraswathy et al. Page 9
J Neurooncol. Author manuscript; available in PMC 2011 January 18.
NIH
-PA Author Manuscript
NIH
-PA Author Manuscript
NIH
-PA Author Manuscript

used for planning focal therapy. The comparison of 1.5T and 3T data showed similarqualitative results for the two datasets but gave improved sensitivity for several of theresulting MR parameters. This suggests that 3T should be the field strength used for futurestudies on patients with brain tumors. Other key parameters in predicting outcome were thespatial extent and intensities of the combined lactate and lipid peaks. Results obtained fromthe lactate-edited 1H MRSI data suggested it is the lactate within non-enhancing tumor thatis more relevant in predicting survival than residual lipid. Future studies should investigatethe parameters that have been identified in larger populations of patients and see whetherthey can also be used to assess prognosis at other time points. These results will assistoncologists to interpret the results of MR imaging examinations in order to stratify patientsfor clinical trials and tailor treatment to each individual tumor.
AcknowledgmentsThis study was financially supported by UC Discovery Grants LSIT01-10107 and ITL-BIO04-10148 funded inconjunction with GE Healthcare, and NIH Grants R01 CA059880 and P50 CA97257.
References1. Aboagye EO, Kelson AB, Tracy M, Workman P. Preclinical development and current status of the
fluorinated 2-nitroimidazole hypoxia probe N-(2-hydroxy-3,3,3-trifluoropropyl)-2-(2-nitro-1-imidazolyl) acetamide (SR 4554, CRC 94/17): a non-invasive diagnostic probe for the measurementof tumor hypoxia by magnetic resonance spectroscopy and imaging, and by positron emissiontomography. Anticancer Drug Des 1998;13:703–730. [PubMed: 9755726]
2. Alger JR, Frank JA, Bizzi A, Fulham MJ, DeSouza BX, Duhaney MO, et al. Metabolism of humangliomas: assessment with H-1 MR spectroscopy and F-18 flourodeoxyglucose PET. Radiology1990;177:633–641. [PubMed: 2243962]
3. Basser PJ, Pierpaoli C. Microstructural and physiological features of tissues elucidated byquantitative-diffusion-tensor MRI. J Magn Reson B 1996;111:209–219. doi:10.1006/jmrb.1996.0086. [PubMed: 8661285]
4. Burger PC, Green SB. Patient age, histologic features, and length of survival in patients withglioblastoma multiforme. Cancer 1987;59:1617–1625. doi:10.1002/1097-0142(19870501)59:9<1617::AID-CNCR2820590916>3.0.CO;2-X. [PubMed:3030531]
5. Burger PC, Vogel FS, Green SB, Strike TA. Glioblastoma multiforme and anaplastic astrocytoma.Pathologic criteria and prognostic implications. Cancer 1985;56:1106–1111. doi:10.1002/1097-0142(19850901)56:5<1106::AID-CNCR2820560525>3.0.CO;2-2. [PubMed:2990664]
6. Catalaa I, Henry R, Dillon WP, Graves EE, McKnight TR, Lu Y, et al. Perfusion, diffusion andspectroscopy values in newly diagnosed cerebral gliomas. NMR Biomed 2006;19:463–475. doi:10.1002/nbm.1059. [PubMed: 16763973]
7. Cha S, Lupo JM, Chen MH, Lamborn KR, McDermott MW, Berger MS, et al. Differentiation ofglioblastoma multiforme and single brain metastasis by peak height and percentage of signalintensity recovery derived from dynamic susceptibility-weighted contrast-enhanced perfusion MRimaging. AJNR Am J Neuroradiol 2007;28:1078–1084. doi:10.3174/ajnr.A0484. [PubMed:17569962]
8. Chang L, Mc Bride D, Miller BL, Cornford M, Booth RA, Buchthal SD, et al. Localized in vivo 1Hmagnetic resonance spectroscopy and in vitro analyses of heterogeneous brain tumors. JNeuroimaging 1995;5:157–163. [PubMed: 7626823]
9. Chenevert TL, Stegman LD, Taylor JM, Robertson PL, Greenberg HS, Rehemtulla A, et al.Diffusion magnetic resonance imaging: an early surrogate marker of therapeutic efficacy in braintumors. J Natl Cancer Inst 2000;92:2029–2036. doi:10.1093/jnci/92.24.2029. [PubMed: 11121466]
10. Coffey RJ, Lunsford LD. Factors determining survival of patients with malignant gliomasdiagnosed by stereotactic biopsy. Appl Neurophysiol 1987;50:183–187. doi:10.1159/000100707.[PubMed: 2835932]
Saraswathy et al. Page 10
J Neurooncol. Author manuscript; available in PMC 2011 January 18.
NIH
-PA Author Manuscript
NIH
-PA Author Manuscript
NIH
-PA Author Manuscript

11. Crawford FW, Khayal IS, McGue C, Saraswathy S, Pirzkall A, Cha S, Lamborn KR, Chang SM,Berger MS, Nelson SJ. Relationship of pre-surgery metabolic and physiological MR imagingparameters to survival for patients with untreated GBM. J Neurooncol. 2008 (in press).
12. Etienne MC, Formento JL, Lebrun-Frenay C, Gioanni J, Chatel M, Paquis P, et al. Epidermalgrowth factor receptor and labeling index are independent prognostic factors in glial tumoroutcome. Clin Cancer Res 1998;4:2383–2390. [PubMed: 9796969]
13. Fuss M, Wenz F, Scholdei R, Essig M, Debus J, Knopp MV, et al. Radiation-induced regionalcerebral blood volume (rCBV) changes in normal brain and lowgrade astrocytomas: quantificationand time and dose-dependent occurrence. Int J Radiat Oncol Biol Phys 2000;48:53–58. doi:10.1016/S0360-3016(00)00590-3. [PubMed: 10924971]
14. Guo AC, Cummings TJ, Dash RC, Provenzale JM. Lymphomas and high grade astrocytomas:comparison of water diffusibility and histologic characteristics. Radiology 2002;224:177–183. doi:10.1148/radiol.2241010637. [PubMed: 12091680]
15. Hamstra DA, Chenevert TL, Moffat BA, Johnson TD, Meyer CR, Mukherji SK, et al. Evaluationof the functional diffusion map as an early biomarker of time-to-progression and overall survivalin high-grade glioma. Proc Natl Acad Sci USA 2005;102:16759–16764. doi:10.1073/pnas.0508347102. [PubMed: 16267128]
16. Henry RG, Vigneron DB, Fischbein NJ, Grant PE, Day MR, Noworolski SM, et al. Comparison ofrelative cerebral blood volume and proton spectroscopy in patients with treated gliomas. AJNRAm J Neuroradiol 2000;21:357–366. [PubMed: 10696024]
17. Hohwieler SM, Freidberg SR, Heatley GJ, Lo TC. Glucocorticoid dependency as a prognosticfactor in radiotherapy for cerebral gliomas. Acta Oncol 1989;28:51–55. doi:10.3109/02841868909111181. [PubMed: 2539846]
18. Jeremic B, Grujicic D, Antunovic V, Djuric L, Stojanovic M, Shibamoto Y. Influence of extent ofsurgery and tumor location on treatment outcome of patients with glioblastoma multiforme treatedwith combined modality approach. J Neurooncol 1994;21:177–185. doi:10.1007/BF01052902.[PubMed: 7861194]
19. Johnson G, Wetzel SG, Cha S, Babb J, Tofts PS. Measuring blood volume and vascular transferconstant from dynamic, T(2)*-weighted contrast-enhanced MRI. Magn Reson Med 2004;51:961–968. doi:10.1002/mrm.20049. [PubMed: 15122678]
20. Kaplan EL, Meier P. Nonparametric estimation from incomplete observations. J Am Stat Assoc1958;53:457–481. doi:10.2307/2281868.
21. Keles GE, Anderson B, Berger MS. The effect of extent of resection on time to tumor progressionand survival in patients with glioblastoma multiforme of the cerebral hemisphere. Surg Neurol1999;52:371–379. doi:10.1016/S0090-3019(99)00103-2. [PubMed: 10555843]
22. Keles GE, Lamborn KR, Chang SM, Prados MD, Berger MS. Volume of residual disease as apredictor of outcome in adult patients with recurrent supratentorial glioblastomas multiforme whoare undergoing chemotherapy. J Neurosurg 2004;100:41–46. [PubMed: 14743910]
23. Kono K, Inoue Y, Nakayama K, Shakudo M, Morino M, Ohata K, et al. The role of diffusion-weighted imaging in patients with brain tumors. AJNR Am J Neuroradiol 2001;22:1081–1088.[PubMed: 11415902]
24. Lacroix M, Abi-Said D, Fourney DR, Gokaslan ZL, Shi W, DeMonte F, et al. A multivariateanalysis of 416 patients with glioblastoma multiforme: prognosis, extent of resection, and survival.J Neurosurg 2001;95:190–198. [PubMed: 11780887]
25. Lamborn KR, Chang SM, Prados MD. Prognostic factors for survival of patients withglioblastoma: recursive partitioning analysis. Neuro-oncology 2004;6:227–235. doi:10.1215/S1152851703000620. [PubMed: 15279715]
26. Lee MC, Cha S, Chang SM, Nelson SJ. Dynamic susceptibility contrast perfusion imaging ofradiation effects in normal-appearing brain tissue: changes in the first-pass and recirculationphases. J Magn Reson Imaging 2005;21:683–693. doi:10.1002/jmri.20298. [PubMed: 15906330]
27. Leon SP, Folkerth RD, Black PM. Microvessel density is a prognostic indicator for patients withastroglial brain tumors. Cancer 1996;77:362–372. doi:10.1002/(SICI)1097-0142(19960115)77:2<362::AID-CNCR20>3.0.CO;2-Z. [PubMed: 8625246]
Saraswathy et al. Page 11
J Neurooncol. Author manuscript; available in PMC 2011 January 18.
NIH
-PA Author Manuscript
NIH
-PA Author Manuscript
NIH
-PA Author Manuscript

28. Li X, Jin H, Lu Y, Oh J, Chang S, Nelson SJ. Identification of MRI and 1H MRSI parameters thatmay predict survival for patients with malignant gliomas. NMR Biomed 2004;17:10–20. doi:10.1002/nbm.858. [PubMed: 15011246]
29. Li Y, Osorio JA, Ozturk-Isik E, Chen AP, Xu D, Crane JC, et al. Considerations in applying 3DPRESS H-1 brain MRSI with an eight-channel phased-array coil at 3T. Magn Reson Imaging2006;24:1295–1302. doi:10.1016/j.mri.2006.07.012. [PubMed: 17145400]
30. Lupo JM, Cha S, Chang SM, Nelson SJ. Dynamic susceptibility-weighted perfusion imaging ofhigh-grade gliomas: characterization of spatial heterogeneity. AJNR Am J Neuroradiol2005;26:1446–1454. [PubMed: 15956514]
31. Lupo JM, Lee MC, Han ET, Cha S, Chang SM, Berger MS, et al. Feasibility of dynamicsusceptibility contrast perfusion MR imaging at 3T using a standard quadrature head coil andeight-channel phased-array coil with and without SENSE reconstruction. J Magn Reson Imaging2006;24:520–529. doi:10.1002/jmri.20673. [PubMed: 16888776]
32. McBride DQ, Miller BL, Nikas DL, Buchthal S, Chang L, Chiang F, et al. Analysis of braintumors using 1H magnetic resonance spectroscopy. Surg Neurol 1995;44:137–144. doi:10.1016/0090-3019(95)00139-5. [PubMed: 7502203]
33. McKnight TR, Noworolski SM, Vigneron DB, Nelson SJ. An automated technique for thequantitative assessment of 3D-MRSI data from patients with glioma. J Magn Reson Imaging2001;13:167–177. doi:10.1002/1522-2586(200102)13:2<167::AID-JMRI1026>3.0.CO;2-K.[PubMed: 11169821]
34. McKnight TR, von dem Bussche MH, Vigneron DB, Lu Y, Berger MS, McDermott MW, et al.Histopathological validation of a three-dimensional magnetic resonance spectroscopy index as apredictor of tumor presence. J Neurosurg 2002;97:794–802. [PubMed: 12405365]
35. Miller PJ, Hassanein RS, Girim PG, Kimler BF, O’Boynick P, Evans RG. Univariate andmultivariate statistical analysis of high-grade gliomas: the relationship of radiation dose and otherprognostic factors. Int J Radiat Oncol Biol Phys 1990;1:275–280. [PubMed: 2168352]
36. Nelson SJ. Analysis of volume MRI and MR spectroscopic imaging data for the evaluation ofpatients with brain tumors. Magn Reson Med 2001;46:228–239. doi:10.1002/mrm.1183. [PubMed:11477625]
37. Nelson SJ, Nalbandian AB, Proctor E, Vigneron DB. Registration of images from sequential MRstudies of the brain. J Magn Reson Imaging 1994;4:877–883. doi:10.1002/jmri.1880040621.[PubMed: 7865950]
38. Nelson SJ, Huhn S, Vigneron DB, Day MR, Lawrence LW, Prados M, et al. Volume MRI andMRSI techniques for the quantitation of treatment response in brain tumors: presentation of adetailed case study. J Magn Reson Imaging 1997;7:1146–1152. doi:10.1002/jmri.1880070630.[PubMed: 9400861]
39. Nelson SJ, Vigneron DB, Dillon WP. Serial evaluation of patients with brain tumors using volumeMRI and 3D 1H MRSI. NMR Biomed 1999;12:123–138. doi:10.1002/(SICI)1099-1492(199905)12:3<123::AID-NBM541>3.0.CO;2-Y. [PubMed: 10414947]
40. Oh J, Henry RG, Pirzkall A, Lu Y, Li X, Catalaa I, et al. Survival analysis in patients withglioblastoma multiforme: predictive value of choline-to-N-acetylaspartate index, apparentdiffusion coefficient, and relative cerebral blood volume. J Magn Reson Imaging 2004;19:546–554. doi:10.1002/jmri.20039. [PubMed: 15112303]
41. Peeling J, Sutherland G. High-resolution 1H NMR spectroscopy studies of extracts of humancerebral neoplasms. Magn Reson Med 1992;24:123–136. doi:10.1002/mrm.1910240113.[PubMed: 1556919]
42. Perkio J, Aronen HJ, Kangasmaki A, Liu Y, Karonen K, Salvolainen S, et al. Evaluation of fourpostprocessing methods for determination of cerebral blood volume and mean transit time bydynamic susceptibility contrast imaging. Magn Reson Med 2002;47:973–981. doi:10.1002/mrm.10126. [PubMed: 11979577]
43. Pirzkall A, McKnight TR, Graves EE, Carol MP, Sneed PK, Wara WW, et al. MR-spectroscopyguided target delineation for high-grade gliomas. Int J Radiat Oncol Biol Phys 2001;50:915–928.doi:10.1016/S0360-3016(01)01548-6. [PubMed: 11429219]
Saraswathy et al. Page 12
J Neurooncol. Author manuscript; available in PMC 2011 January 18.
NIH
-PA Author Manuscript
NIH
-PA Author Manuscript
NIH
-PA Author Manuscript

44. Pirzkall A, Li X, Oh J, Chang S, Berger MS, Larson DA, et al. 3D MRSI for resected high-gradegliomas before RT: tumor extent according to metabolic activity in relation to MRI. Int J RadiatOncol Biol Phys 2004;59:126–137. doi:10.1016/j.ijrobp.2003.08.023. [PubMed: 15093908]
45. Prichard JW. What the clinician can learn from MRS lactate measurement. NMR Biomed1991;4:99–102. doi:10.1002/nbm.1940040212. [PubMed: 1859788]
46. Saraswathy, S.; Crawford, F.; Nelson, SJ. Semi-automated segmentation of brain tumor lesions inMR Images. Proceedings of 13th ISMRM meeting (abstract); Seattle, WA, USA. 2006.
47. Smith JS, Cha S, Mayo MC, McDermott MW, Parsa AT, Chang SM, et al. Serial diffusion-weighted magnetic resonance imaging in cases of glioma: distinguishing tumor recurrence frompostresection injury. J Neurosurg 2005;103:428–438. [PubMed: 16235673]
48. Star-Lack J, Spielman D, Adalsteinsson E, Kurhanewicz J, Terris DJ, Vigneron DB. In vivo lactateediting with simultaneous detection of choline, creatine, NAA, and lipid singlets at 1.5T usingPRESS excitation with applications to the study of brain and head and neck tumors. J Magn Reson1998;133:243–254. doi:10.1006/jmre.1998.1458. [PubMed: 9716465]
49. Steltzer KJ, Sauve KI, Spence AM, Griffin TW, Berger MS. Corpus callosum involvement as aprognostic factor for patients with highgrade astrocytoma. Int J Radiat Oncol Biol Phys1997;38:27–30. doi:10.1016/S0360-3016(96)00632-3. [PubMed: 9212000]
50. Stone, HB.; Brown, JM.; Phillips, TL.; Sutherland, RM. Oxygen in human tumors: correlationsbetween methods of measurement, response to therapy. Summary of a workshop held November19–20, 1992, at the National Cancer Institute, Bethesda, Maryland; Radiat Res. 1993. p.422-434.doi:10.2307/3578556
51. Sugahara T, Korogi Y, Kochi M, Ikushima I, Shigematu Y, Hirai T, et al. Usefulness of diffusionweighted MRI with echoplanar technique in the evaluation of cellularity in gliomas. J Magn ResonImaging 1999;9:53–60. doi:10.1002/(SICI)1522-2586(199901)9:1<53::AID-JMRI7>3.0.CO;2-2.[PubMed: 10030650]
52. Tien RD, Felsberg GJ, Friedman H, Brown M, MacFall J. MR imaging of high-grade cerebralgliomas: value of diffusion-weighted echoplanar pulse sequences. AJR Am J Roentgenol1994;162:671–677. [PubMed: 8109520]
53. Tran TK, Vigneron DB, Sailasuta N, Tropp J, Le Roux P, Kurhanewicz J, et al. Very selectivesuppression pulses for clinical MRSI studies of brain and prostate cancer. Magn Reson Med2000;43:23–33. doi:10.1002/(SICI)1522-2594(200001)43:1<23::AID-MRM4>3.0.CO;2-E.[PubMed: 10642728]
54. Usenius JP, Vaino P, Hernesniemi J, Kauppinen RA. Choline-containing compounds in humanastrocytomas studied by 1H NMR spectroscopy in vivo and in vitro. J Neurochem 1994;63:1538–1543. [PubMed: 7931308]
55. Vigneron DB, Bollen A, McDermott M, Wald LL, May MR, Noworolski SM, et al. Three-dimensional magnetic resonance spectroscopic imaging of histologically confirmed brain tumors.Magn Reson Imaging 2001;19:89–101. doi:10.1016/S0730-725X(01)00225-9. [PubMed:11295350]
56. Warburg, O. The metabolism of tumors. New York: Constable; 1930.57. Winger MJ, Macdonald DR, Cairncross JG. Supratentorial anaplastic gliomas in adults. The
prognostic importance of extent of resection and prior low-grade glioma. J Neurosurg1989;71:487–493. [PubMed: 2552044]
Saraswathy et al. Page 13
J Neurooncol. Author manuscript; available in PMC 2011 January 18.
NIH
-PA Author Manuscript
NIH
-PA Author Manuscript
NIH
-PA Author Manuscript

Fig. 1.Example of a FLAIR image (a), a T1 weighted post-contrast image (b), and an apparentdiffusion coefficient map (c) from corresponding slices in a 68 year old patient with a newlydiagnosed GBM post surgery and prior to radiation therapy
Saraswathy et al. Page 14
J Neurooncol. Author manuscript; available in PMC 2011 January 18.
NIH
-PA Author Manuscript
NIH
-PA Author Manuscript
NIH
-PA Author Manuscript
Fig. 2.Example of a post-contrast T weighted image (a) and overlaid perfusion maps showing (b)rCBV and (c) ΔR2* peak height maps for a patient with a 46 year old patient with GBM
Saraswathy et al. Page 15
J Neurooncol. Author manuscript; available in PMC 2011 January 18.
NIH
-PA Author Manuscript
NIH
-PA Author Manuscript
NIH
-PA Author Manuscript
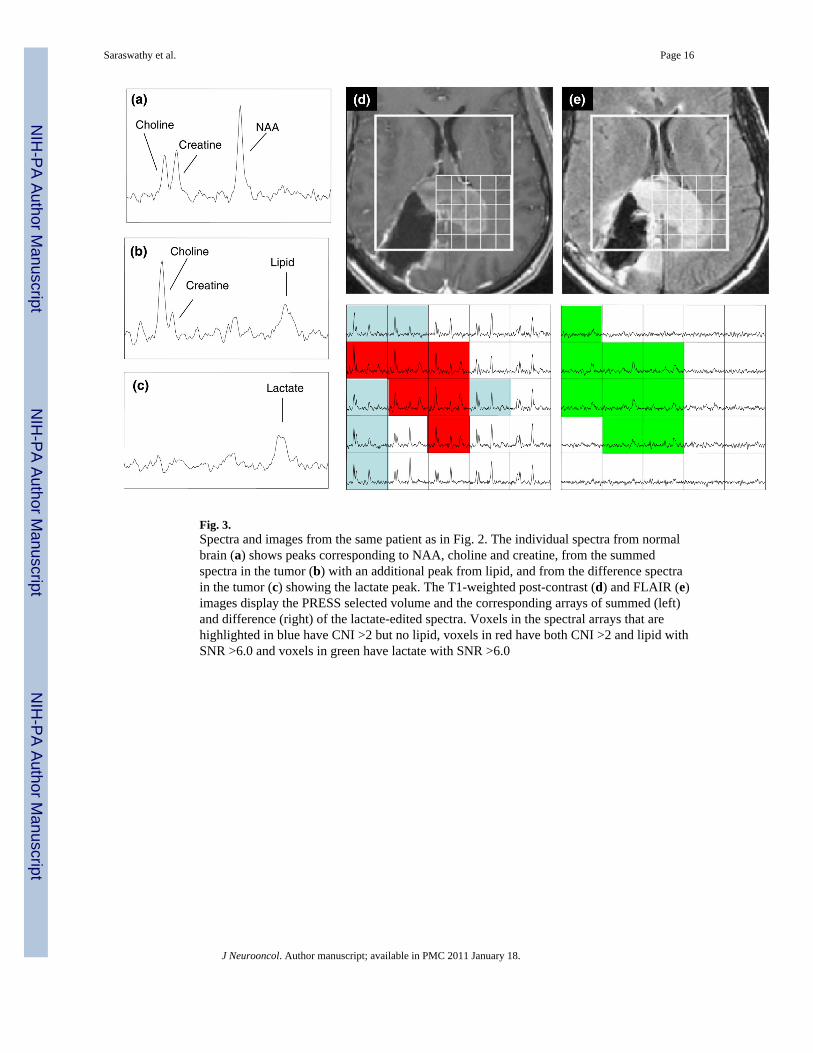
Fig. 3.Spectra and images from the same patient as in Fig. 2. The individual spectra from normalbrain (a) shows peaks corresponding to NAA, choline and creatine, from the summedspectra in the tumor (b) with an additional peak from lipid, and from the difference spectrain the tumor (c) showing the lactate peak. The T1-weighted post-contrast (d) and FLAIR (e)images display the PRESS selected volume and the corresponding arrays of summed (left)and difference (right) of the lactate-edited spectra. Voxels in the spectral arrays that arehighlighted in blue have CNI >2 but no lipid, voxels in red have both CNI >2 and lipid withSNR >6.0 and voxels in green have lactate with SNR >6.0
Saraswathy et al. Page 16
J Neurooncol. Author manuscript; available in PMC 2011 January 18.
NIH
-PA Author Manuscript
NIH
-PA Author Manuscript
NIH
-PA Author Manuscript
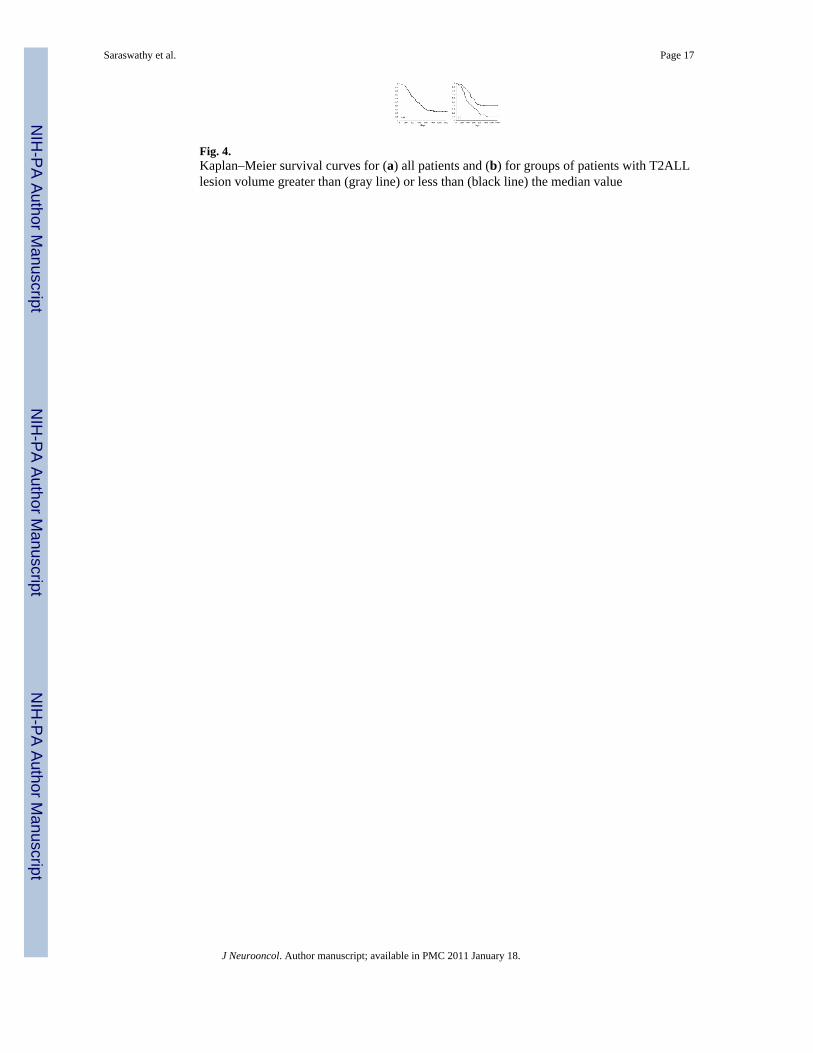
Fig. 4.Kaplan–Meier survival curves for (a) all patients and (b) for groups of patients with T2ALLlesion volume greater than (gray line) or less than (black line) the median value
Saraswathy et al. Page 17
J Neurooncol. Author manuscript; available in PMC 2011 January 18.
NIH
-PA Author Manuscript
NIH
-PA Author Manuscript
NIH
-PA Author Manuscript

Fig. 5.T1 post contrast and FLAIR images from a 49 year old patient with a newly diagnosedGBM whose lesion was classified as a gross total resection at the time of surgery. Fourweeks later and immediately prior to treatment with radiation small regions of Gadoliniumenhancement can be observed in the medial edge of the lesion and a more extensive area ofhyperintensity on FLAIR images. The MRSI data show that this abnormality has highlyelevated CNI with the blue shading showing voxels in the axial and coronal planes that haveabnormal CNI which ranges from 3.2 to 30.7. Note that the level of choline is so high intumor relative to normal voxels that the intensity scale has to be reduced by a factor of 4 tobe able to visualize them within the same array
Saraswathy et al. Page 18
J Neurooncol. Author manuscript; available in PMC 2011 January 18.
NIH
-PA Author Manuscript
NIH
-PA Author Manuscript
NIH
-PA Author Manuscript
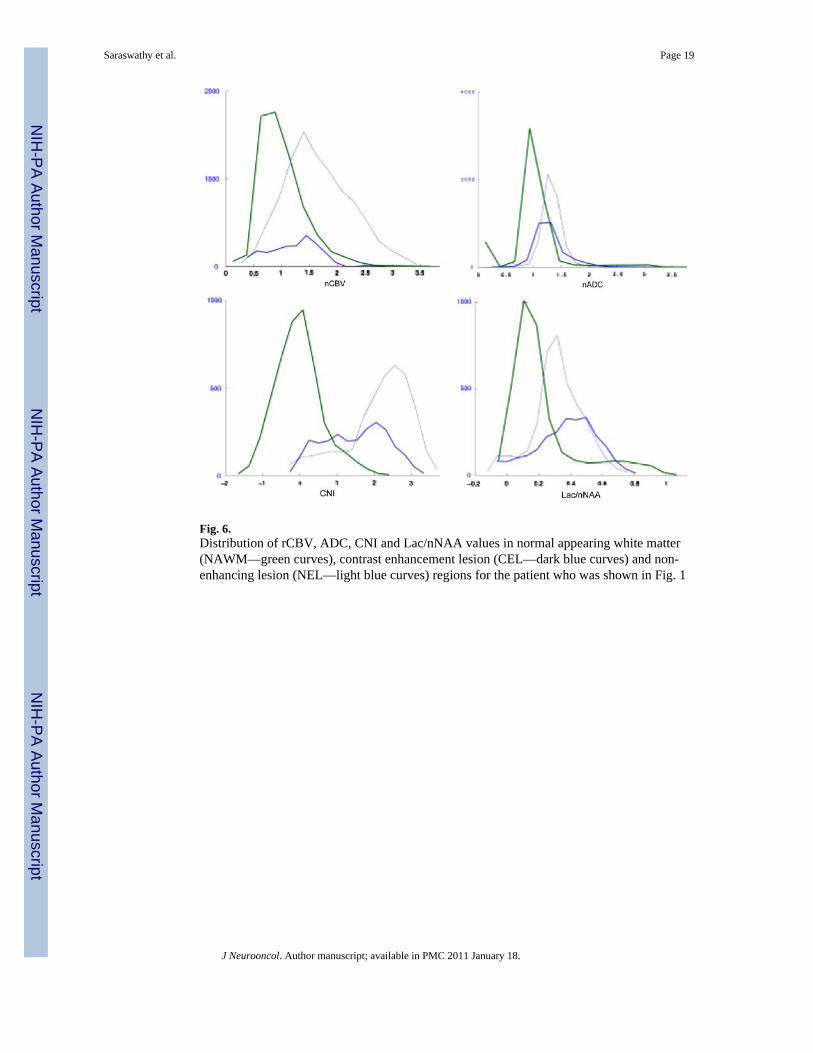
Fig. 6.Distribution of rCBV, ADC, CNI and Lac/nNAA values in normal appearing white matter(NAWM—green curves), contrast enhancement lesion (CEL—dark blue curves) and non-enhancing lesion (NEL—light blue curves) regions for the patient who was shown in Fig. 1
Saraswathy et al. Page 19
J Neurooncol. Author manuscript; available in PMC 2011 January 18.
NIH
-PA Author Manuscript
NIH
-PA Author Manuscript
NIH
-PA Author Manuscript

NIH
-PA Author Manuscript
NIH
-PA Author Manuscript
NIH
-PA Author Manuscript
Saraswathy et al. Page 20
Table 1
Median values of volumes for the CEL, CEL + NEC, NEL and T2ALL, as well as the percentage of eachvolume in T2ALL for patients where these regions could be identified
Parameter CEL (N = 50) CEL + NEC (N = 50) NEL (N = 68) T2ALL (N = 68)
Total volume (cc) 2.7 ± 5.8 3.8 ± 11.6 14.1 ± 14.3 24.4 ± 15.0
P-value for total volume 0.016* 0.004* 0.003* 0.0001*
Volume within T2ALL (%) 20.1 ± 19.8 21.5 ± 21.2 82.7 ± 21.4 100
P-value for % volume 0.788 0.653 0.672 n/a
Volumes overlapping with T2ALL nCBV >3 (N = 61) nADC <1.5 (N = 65) snrLL >6 (N = 59) CNI >2 (N = 67)
Volume cc/voxels 0.6 ± 2.8 15.4 ± 15.8 17.1 ± 4.9 15.9 ± 4.9
P-value 0.039* 0.006* 0.009* 0.005*
The P-values are age and scanner-adjusted Cox regression significance values for survival. The lower panels show similar results for the volumesof physiological and metabolic lesions that were restricted to the voxels in the intersection of the T2ALL and the excitation volume
J Neurooncol. Author manuscript; available in PMC 2011 January 18.
NIH
-PA Author Manuscript
NIH
-PA Author Manuscript
NIH
-PA Author Manuscript
Saraswathy et al. Page 21
Table 2
Median and percentiles of values of nCBV from perfusion maps in different regions(N = 51 in the CEL, while N = 61 for the other regions)
Parameter NAWM (N = 61) CEL (N = 51) NEL (N = 61) T2ALL (N = 61)
nCBV median 1.0 1.3 ± 0.8 1.0 ± 0.4 1.1 ± 0.4
nCBV 90th perc 1.8 ± 0.3 2.2 ± 1.4 2.0 ± 0.8 2.1 ± 1.0
nPH median 1.0 1.2 ± 0.7 0.9 ± 0.4 0.9 ± 0.4
nPH 90th perc 1.7 ± 0.3 1.9 ± 2.3 1.6 ± 0.8 1.8 ± 2.0
%REC median 83 ± 10.4 77 ± 13.5 81 ± 11.4 81 ± 11.8
%REC 10th perc 76 ± 10.5 62 ± 15.7 72 ± 12.4 69 ± 13.6
The median values in CEL and 90% were different from NAWM. The median values in the NEL were not different from NAWM but the 90% hasa P-value of 0.014 compared with NAWM. The results were similar for the peak height estimates. The only values that were significantly differentbetween data acquired on the 1.5T and 3T scanners were the recovery values in the CEL. None of these parameters were related to survival basedon the proportional hazards analysis
J Neurooncol. Author manuscript; available in PMC 2011 January 18.
NIH
-PA Author Manuscript
NIH
-PA Author Manuscript
NIH
-PA Author Manuscript
Saraswathy et al. Page 22
Table 3
Median and 10th percentile values of ADC and normalized ADC in different regions
Parameter WM CEL NEL T2ALL
ADC median 811 ± 38 1175 ± 301 1089 ± 241 1093 ± 237
ADC 10th percentile
696 ± 63 876 ± 199 838 ± 201 838 ± 199
nADC median 1.0 1.4 ± 0.4 1.3 ± 0.3 1.4 ± 0.3
nADC 10th percentile
0.9 ± 0.1 1.1 ± 0.3 1.0 ± 0.3 1.0 ± 0.3
The values in all of these regions were significantly different from the values in NAWM but not between themselves
J Neurooncol. Author manuscript; available in PMC 2011 January 18.
NIH
-PA Author Manuscript
NIH
-PA Author Manuscript
NIH
-PA Author Manuscript
Saraswathy et al. Page 23
Tabl
e 4
Med
ian,
max
imum
val
ues a
nd su
mm
ed v
alue
s of t
he sp
ectro
scop
ic m
etab
olite
map
s in
diff
eren
t reg
ions
Para
met
erW
M (N
= 6
7)C
EL
(N =
49)
NE
L (N
= 6
7)T
2AL
L (N
= 6
7)C
NI2
T (N
= 6
7)C
NI2
(N =
67)
nCho
med
ian
1.00
0.79
± 1
.04
0.97
± 0
.86
0.90
± 0
.50
1.18
± 0
.49
1.22
± 0
.33
nCho
max
1.53
± 0
.54
0.84
± 1
.20
1.38
± 1
.23
1.50
± 1
.21
1.56
± 1
.21
1.81
± 2
.38
nCr m
edia
n1.
000.
54 ±
0.5
20.
76 ±
0.3
70.
70 ±
0.3
60.
75 ±
0.2
90.
87 ±
0.2
5
nNA
A m
edia
n1.
000.
20 ±
0.1
80.
41 ±
0.2
10.
34 ±
0.1
80.
36 ±
0.1
70.
49 ±
0.1
8
CN
I med
ian
−0.
01 ±
0.4
13.
23 ±
4.3
52.
78 ±
4.6
82.
35 ±
3.5
73.
45 ±
1.8
82.
77 ±
0.8
1
CN
I max
2.56
± 3
.08
3.43
± 4
.68
4.29
± 5
.67
5.05
± 5
.56
5.79
± 5
.55
5.77
± 6
.03
CN
I sum
3.24
± 2
0.12
3.42
± 2
1.20
15.3
1 ±
48.1
950
.5 ±
94.
1041
.59
± 95
.62
78.6
0 ±
110.
50
Ther
e w
as n
o si
gnifi
cant
diff
eren
ce b
etw
een
the
valu
es a
t 15T
and
3T
field
stre
ngth
s. N
one
of th
ese
para
met
ers e
xhib
ited
a si
gnifi
cant
rela
tions
hip
to su
rviv
al
J Neurooncol. Author manuscript; available in PMC 2011 January 18.
NIH
-PA Author Manuscript
NIH
-PA Author Manuscript
NIH
-PA Author Manuscript
Saraswathy et al. Page 24
Tabl
e 5
Med
ian,
max
imum
and
sum
of n
LL =
(lac
tate
+ li
pid)
/NA
A (n
= 6
7) a
nd P
-val
ues f
or th
e pr
opor
tiona
l haz
ards
ana
lysi
s with
age
and
scan
ner f
ield
stre
ngth
bei
ng c
onsi
dere
d as
cov
aria
tes
Para
met
erN
AW
MC
EL
NE
LT
2AL
LC
NI2
TC
NI2
nLL
med
ian
0.07
± 0
.08
0.23
± 0
.22
0.12
± 0
.12
0.15
± 0
.18
0.16
± 0
.08
0.11
± 0
.13
P =
0.01
5P
= 0.
027
nLL
max
0.21
± 0
.30
0.29
± 0
.38
0.25
± 0
.29
0.34
± 0
.71
0.32
± 0
.71
0.32
± 0
.73
P =
0.04
3P
= 0.
022
nLL
sum
2.00
± 2
.92
0.29
± 2
.02
1.03
± 2
.39
1.62
± 9
.22
1.61
± 1
0.37
3.27
± 1
1.96
P =
0.00
1P
= 0.
010
P =
0.00
6
nLac
med
ian
0.07
± 0
.06
0.21
± 0
.20
0.16
± 0
.11
0.17
± 0
.07
0.19
± 0
.07
0.13
± 0
.06
P =
0.03
0
nLac
max
0.20
± 0
.16
0.21
± 0
.34
0.24
± 0
.18
0.29
± 0
.17
0.30
± 0
.15
0.29
± 0
.18
P =
0.00
2P
= 0.
008
P =
0.00
05
nLac
sum
2.80
± 1
.68
0.20
± 1
.80
0.91
± 2
.18
2.05
± 4
.06
2.28
± 4
.57
3.07
± 4
.72
P =
0.02
1P
= 0.
032
P =
0.01
1
nLip
med
ian
0.02
± 0
.07
0.24
± 0
.32
0.06
± 0
.09
0.11
± 0
.08
0.12
± 0
.11
0.05
± 0
.09
nLip
max
0.19
± 0
.38
0.24
± 0
.32
0.21
± 0
.28
0.31
± 0
.36
0.31
± 0
.34
0.25
± 0
.32
nLip
sum
1.23
± 1
.88
0.24
± 2
.29
0.37
± 1
.88
2.02
± 4
.95
1.23
± 4
.02
1.35
± 4
.13
Sign
ifica
nce
leve
ls a
re sh
own
only
for t
he c
ases
whe
re P
< 0
.05.
Dat
a ac
quire
d us
ing
a 1.
5T sc
anne
r use
d a
lact
ate
edite
d se
quen
ce (n
= 3
5) a
nd th
e va
lues
of n
Lac
(Lac
tate
/nN
AA
) and
nLi
p (L
ipid
/nN
AA
)w
ere
also
ava
ilabl
e
J Neurooncol. Author manuscript; available in PMC 2011 January 18.
Related Documents