EVALUATION OF MERGERS OF CADASTRAL SYSTEMS: A corporate cultural perspective TSITSI NYUKURAYI MUPARARI February, 2013 SUPERVISORS: Ir., W.T, de Vries Prof. Dr., J.A, Zevenbergen

Welcome message from author
This document is posted to help you gain knowledge. Please leave a comment to let me know what you think about it! Share it to your friends and learn new things together.
Transcript
EVALUATION OF MERGERS OF
CADASTRAL SYSTEMS:
A corporate cultural perspective
TSITSI NYUKURAYI MUPARARI
February, 2013
SUPERVISORS:
Ir., W.T, de Vries
Prof. Dr., J.A, Zevenbergen

Thesis submitted to the Faculty of Geo-Information Science and Earth
Observation of the University of Twente in partial fulfilment of the
requirements for the degree of Master of Science in Geo-information Science
and Earth Observation.
Specialization: Land Administration
SUPERVISORS:
Ir., W.T, de Vries
Prof. Dr., J.A, Zevenbergen
THESIS ASSESSMENT BOARD:
Prof.Ir.,P., van der Molen (Chair)
Dr. H. Koerten (External Examiner, University Amsterdam)
EVALUATION OF MERGERS OF
CADASTRAL SYSTEMS:
A corporate cultural perspective
TSITSI MUPARARI
Enschede, The Netherlands, February, 2013

DISCLAIMER
This document describes work undertaken as part of a programme of study at the Faculty of Geo-Information Science and
Earth Observation of the University of Twente. All views and opinions expressed therein remain the sole responsibility of the
author, and do not necessarily represent those of the Faculty.
i
ABSTRACT
There is limited empirical evidence and superficial theoretical perspective to reveal the organisation’s
adaptation and well being after the merger of land registration and the cadastre components despite that
European cadastral systems are gradually converging towards the unification strategy. The theoretical
perspective underpins that cadastral restructuring enhances land information delivery for growing land
markets and humankind to land relationship. The present research seeks to unveil how organisations adapt
to mergers through studying the corporate culture changes from before the merger until after the merger.
Four empirical objectives to measure the corporate culture changes of the cadastral mergers include; (1)
To describe the important elements of corporate culture; (2) To device the tools and methods to be used
to measure the elements of corporate culture in the Swedish cadastral system; (3) To measure the
corporate culture elements for land registration, the cadastre and the merger in the Swedish cadastral
system; (4) To compare the research findings for land registration corporate culture elements, cadastre
corporate culture elements and the merger corporate culture elements.
In order to fulfil these objectives Q methodology was applied on the basis of its ability to withdraw and
distinguish shared human subjectivity. The study purposively and conveniently sampled the Swedish
cadastral merger as the case to study the corporate culture changes. An instrument of 36 statements
constructed from the competing values framework was employed to withdraw views from 16 participants
to evaluate the post merger, 3 participants to evaluate the premerger of either the land registration and
cadastre component. Empirical findings from the statistical processing and the accompanying interviews
reveal that a small change has occurred between each of the premerger components after the merger.
On one hand the change established from the cadastre’s premerger state to the post merger involved a
shift of work processes from the incremental and consistent change relative to the organisation’s internal
environment towards flexible and adjustable work processes relative to the organisation’s external
positioning. On the contrary another set of change showed a shift from adjustable and flexible work
processes towards incrementally and consistently changed work processes. Another shift occurred from
the incremental change of work processes towards the collaborative slow review of work processes. An
opposing shift rather took place from the slow and collaborative review towards the incremental change
of work processes. Eventually the conflicting changes of work processes were found consistent with the
competing values framework. Additional shifts of the cadastre’s premerger involved a multifaceted change
from the spontaneous execution of tasks, towards the collaborative execution of tasks and controlled or
monitored execution of tasks. Simultaneously the spontaneous execution of tasks partially maintains itself.
The cadastre’s premerger also show altered collaborative decision making in preference to autonomous
decision making. On the other hand, the land registration displays a depleting preference for rules in
favour of loyalty, tradition and commitment. The leadership roles are streamlined from rule enforcers and
competitors to innovators. After the merger the director’s coercive decision making is delegated to
teamwork decision making. Overally corporate culture for either component tends to be more inclined to
flexible cultures: adhocracy and clan cultures than the hierarchical and market cultures. However, the
research remains exploratory and confined to a single case. These empirical findings cannot be generalised
to a larger population.
Therefore more researches using the same approach and research objectives with their questions will
improve the empirical findings. Moreover the function of this study remains exploratory and technically
equips the researcher with the methodology so that in future similar cadastral researches in a different
context or in Africa are pursued.
Keywords: Corporate culture, Values, Views, Cadastral systems, Land registration, Cadastre, Merger
ii
ACKNOWLEDGEMENTS
First and foremost I gratefully thank the experienced expertise of the former International Institute for
Geo-Information Science and Earth Observation (ITC) who have not only proven their passion for their
job but in fact have proven their qualities to coach newly recruited researchers like me. Beyond any
reasonable doubt I appreciate and consider the wealth of knowledge I have gained through this research.
Henceforth it is my privilege to flag the efforts of my supervisors Ir., W.T, de Vries and Prof. Dr., J.A,
Zevernbergen for constantly motivating and advising me during my research. I also equally appreciate
their efforts to source out the relevant and willing participants who shared their views and thoughts
wholeheartedly despite the difference of ethnicity between me and them. To be specific, I equally thank
Dr. J., Paasch, Dr. H., Koerten, Ir.H., Westerbek, Ir.K., Bengt and Ir., O. Olsson and the rest of my
participants, for allowing me to take off some of their precious and productive time in the name of an
Msc Thesis.
I am grateful to GOD for constantly being a shepherd to my academic desires and even leading the path
to the right education at the right time. Therefore I also take this opportunity to acknowledge the
wonderful job from NUFFIC to sponsor my education and my welfare in The Netherlands which
obviously I would never afford.
I acknowledge the support of Midlands State University which has never separated its employees with
their core value: “To be a unique, development-oriented, pace-setting and stakeholders driven University that produces
innovative and enterprising graduates”. That means I am not an exception from this bracket considering that I
had a chance to acquire the knowledge capital from the competent staff of the University of Twente.
Therefore I equally promise to impart the knowledge to our society.
I am grateful of my Husband who stayed back at home patiently to watch our kids whilst I battled to
acquire necessary education ammunition in order to survive in an African society. At the same time I
apologise to my son, Jonathan, for leaving him at a tender age of 3 months. Likewise I give many thanks
to Mutsai, my mother in-law who battled to take care of Jonathan during my studies. Therefore it is my
desire to see my kids pursuing education in the same manner I do in order to give our society dignity and
stamina.
I also thank the Indonesian team for its clannish and warm hearted behaviour which also created a
conducive environment for learning amidst the difficult and new exposure to the technological realms tied
to the programme. I refer specifically to Rizki Nugroho and Utami Djoko. I equally thank the motivating
speeches from Rory Nealon who even if we were struggling together to copy with Q methodology always
kept encouraging ourselves. Lastly I am grateful to be part of the Land administration class, who even if
there was little interaction have turned to be a family during the programme.
iii
TABLE OF CONTENTS
1. INTRODUCTION .............................................................................................................................................. 1
1.1. Introduction and Background ...................................................................................................................................1 1.2. Justification ...................................................................................................................................................................2 1.3. Research Problem ........................................................................................................................................................3 1.4. Research Objectives ....................................................................................................................................................5 1.5. Analytical Framework .................................................................................................................................................5 1.6. Overview of the Methodology .................................................................................................................................6 1.7. Thesis Structure ...........................................................................................................................................................7
1.8. Conclusion ....................................................................................................................................................................7
2. CONCEPTUALISATION OF CORPORATE CULTURE ....................................................................... 9
2.1. Introduction .................................................................................................................................................................9 2.2. Conceptualisation of culture: culture elements ......................................................................................................9 2.3. Overview of frameworks to measure Corporate Culture; The use of values ................................................ 11 2.4. Compilation of Q statements using the Competing values framework.......................................................... 16 2.5. Conclusion ................................................................................................................................................................. 17
3. COLLECTION OF VIEWS AND VALUES ............................................................................................. 18
3.1. Introduction .............................................................................................................................................................. 18 3.2. Overview of QMethodology .................................................................................................................................. 18 3.3. Research Process ...................................................................................................................................................... 19 3.4. Conclusion ................................................................................................................................................................. 26
4. VIEWS AND OPERANT VALUES IN THE SWEDISH CADASTRAL SYSTEM ........................ 28
4.1. Introduction .............................................................................................................................................................. 28 4.2. Postmerger state ....................................................................................................................................................... 28 4.3. Premerger state ......................................................................................................................................................... 35 4.4. Comparison of the Postmerger and Premerger research findings ................................................................. 41 4.5. Conclusion ................................................................................................................................................................. 50
5. COALITIONS OF VIEWS IN PRE-MERGER AND POSTMERGERS ........................................... 53
5.1. Introduction .............................................................................................................................................................. 53 5.2. Coalition of the Corporate culture changes between the Premerger and Postmerger ............................... 53 5.3. Coalition of the Corporate culture changes between the Cadastre and Postmerger ................................... 54 5.4. Coalition of the Corporate culture changes between the Land Registration and Postmerger ................... 56 5.5. Conclusion ................................................................................................................................................................. 57
6. CONCLUSIONS and recommendations ...................................................................................................... 59
6.1. Introduction .............................................................................................................................................................. 59 6.2. Research Questions .................................................................................................................................................. 59 6.3. Limitations and Strengths of the Study ............................................................................................................... 66 6.4. Recommendations .................................................................................................................................................... 67
List of references ........................................................................................................................................................ 71
Appendices .................................................................................................................................................................. 75
iv
LIST OF FIGURES
Figure 1.1: Conceptual Model ..........................................................................................................................................................6
Figure 2.1: Culture Models ...............................................................................................................................................................9
Figure 2.2: Competing values framework (Ernst, 2001) ........................................................................................................... 13
Figure 3.1: Research Process ......................................................................................................................................................... 19
Figure 3.2: Map of mergers ............................................................................................................................................................ 23
Figure 3.3: A single set of views: Q sort ...................................................................................................................................... 25
Figure 4.1: Change of work processes (Internal environment) ............................................................................................... 44
Figure 4.2: Change of work processes (Internal to External environment).......................................................................... 44
Figure 4.3: Change of work processes (External to internal environment) .......................................................................... 44
Figure 4.4: Spontaneous, collaborative and controlled execution of tasks ........................................................................... 45
Figure 4.5: Collaborative, Autonomous decision making ........................................................................................................ 45
Figure 4.6: Director making decisions, Collaborative decision making ................................................................................. 46
Figure 4.7: Shift of the Bond ......................................................................................................................................................... 48
Figure 4.8: Shift of decision making............................................................................................................................................. 49
Figure 4.9: Shift of leadership roles .............................................................................................................................................. 49
Figure 4.10: Shift of behaviour ..................................................................................................................................................... 50
Figure 4.11: Overlay of Corporate Culture Changes................................................................................................................. 50
v
LIST OF TABLES AND APPENDICES
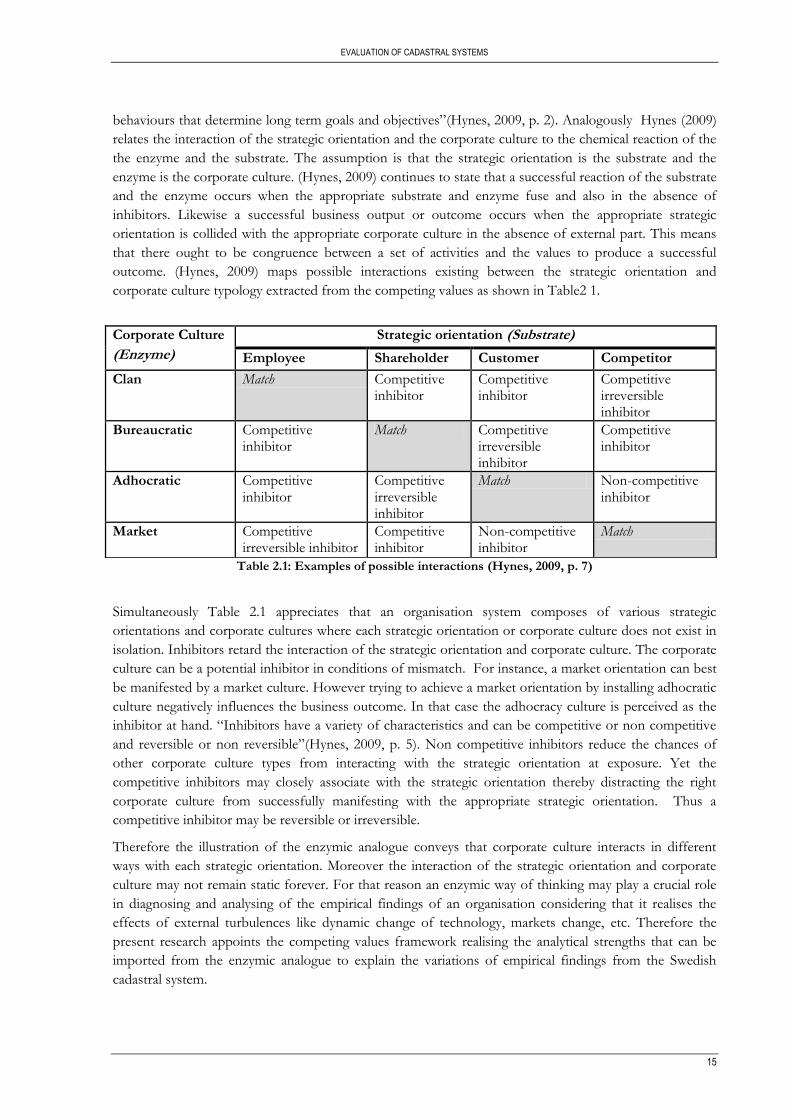
Table 2.1: Examples of possible interactions (Hynes, 2009, p. 7) .......................................................................................... 15
Table 2.2: OCAI scale of the Competing value framework (UPC, 2002-2012). .................................................................. 17
Table 3.1: Research Matrix ............................................................................................................................................................ 20
Table 3.2: Scientific Literature Sources ....................................................................................................................................... 21
Table 3.3: Matrix for European mergers ..................................................................................................................................... 23
Table 4.1: Correlation matrix for the Post merger .................................................................................................................... 29
Table 4.2: Cluster of Views and Values ....................................................................................................................................... 30
Table 4.3: Value system’s Arrays presenting the Post merger ................................................................................................. 32
Table 4.4: Layout to extract differences between the Post merger and Premerger state ................................................... 35
Table 4.5: Operant value system for the Premerger Cadastre ................................................................................................. 36
Table 4.6: Operant value system of the premerger Land registration .................................................................................... 39
Table 4.7: Value systems' matrices of Post merger versas Cadastre Premerger ................................................................... 41
Table 4.8: Realignment of clusters ............................................................................................................................................... 42
Table 4.9: Aligned Cluster of value systems ............................................................................................................................... 42
Table 4.10: Value systems' matrix ................................................................................................................................................. 46
Table 4.11: Realignment of clusters ............................................................................................................................................. 46
Table 4.12: Aligned Cluster of value systems ............................................................................................................................. 47
Appendix 1Colour Coding............................................................................................................................................................. 75
Appendix 2Protocol for Qsorting ................................................................................................................................................ 77
Appendix 3Original sources of statements ................................................................................................................................. 79
Appendix 4Main Q statements ..................................................................................................................................................... 83
Appendix 5 2nd Q Sample .............................................................................................................................................................. 90
Appendix 6 Final Q sample ........................................................................................................................................................... 92
Appendix 7Post Merger Factor crib ............................................................................................................................................ 95
Appendix 8Cadastre Premerger Factor Crib .............................................................................................................................. 99
Appendix 9Premerger: Land Registration component ........................................................................................................... 103

EVALUATION OF CADASTRAL SYSTEMS
1
1. INTRODUCTION
1.1. Introduction and Background
Cadastral systems constitute of two components namely: land registration and cadastre (Berthon, 1993;
Bogaerts et al., 2001; Çağdaş et al., 2009; Yip, 1992). The purpose of these two components derives and
develops from their historical origin. In continental Europe the cadastre evolved to serve land taxation
whilst the land registration developed to serve legal processes (Silva et al., 2002). However, according to
Silva et al. (2002) the cadastre has developed a relation with the land registration. Bogaerts et al. (2001)
state that almost 70% of data and efforts are duplicated in land registration and cadastre components.
Alongside, Bogaerts et al. (2001) reveal that the existence of separated cadastral components is a source of
inefficiency in the flow of information and decision making. Bogaerts et al (2001) further explain that
duplication of data and efforts degrades the performance of the cadastre by retarding its ability to deliver
land information at the right time for land market purposes. Accordingly the summary of previous
evaluation studies summed by Çağdaş et al. (2009) record Ting (2002) and Steudler (2004) who recognise
the need of countries to possess cadastral systems that facilitates the dialogue between the government
and its constituency and the efficient flow of information. Following the need to improve the functioning
of the land registration and cadastre some countries like Netherlands, Hungary, Lithuania, Sweden,
Romania, Turkey and Cyprus in Europe have since considered the decision to unify these components
(Bogaerts et al., 2001; Bronislovas, 2010; Elikos, 2010; Österberg, 2011; van der Molen, 2010;
Yomralioglu, 2003).
The initiative to unify the land registration and cadastre originates from FIG commission 7 where the
research findings of 1994 and 1996 show that the strategic management and operations of cadastral
systems are vested in different organisations (Kaufmann et al., 1998). Pursuing these research findings
cadastre 2014 vision is articulated by directing emphasis on unification of the land registration and
cadastre. Thereafter the research work by (Berthon, 1993; Bogaerts et al., 2001; Steudler et al., 1997;
Williamson et al., 2001) give reasons for the importance of the cadastral restructuring. Their research
confirms the articulated benefits of restructuring posed in Kaufmann et al (1998) as (1) the improvement
of customer service with increased efficiency (2) provision of more data in better quality (3) provision of
data that are sufficiently accurate (4) provision of data to the government and citizens at the right time .
The most reiterated overarching importance of cadastral restructuring is to serve the efficient operation of
the land markets segment.
In connection to the identified strengths of unification strategy, this research appreciates and embraces the
cadastral mergers. However the form to safeguard the unification strategy undertaken has not been
sincerely addressed. This research acknowledges picking out the opportunities and threats that can cease
the long term benefits of cadastral mergers. Therefore this research has chosen to focus on the least
exploited aspect of corporate culture changes in cadastral mergers. It entails that corporate culture can
either be an opportunity or a threat (Carrillo et al., 1999). When organisations choose to leverage
corporate culture investment, the fruits of mergers are reaped without difficulty (Carrillo et al., 1999). Yet
when the same organisation diverges from investing in corporate culture the same merger is prone to
bring disappointment as far as performance and efficiency amongst others are concerned (Carrillo et al.,
1999). Although this has been proven true by Carrillo et al (1999) there is limited knowledge on corporate
culture changes after merging of the land registry and the cadastre. It is therefore not known what
corporate culture typologies exist after the merger.
EVALUATION OF CADASTRAL SYSTEMS
2
This research derives the issue of corporate culture changes from finance and management disciplines
where culture difference is exhaustively discussed and considered as a threat to mergers if not managed
properly. (Carroll et al., 2002; Chatterjee et al., 1992; Zaheer et al., 2003) signify culture difference as the
main cause of merger failure or merger performance. Carrillo et al.(1999) reprimand that each organisation
has a defined corporate culture which distinguishes one organisation from another. Specifically corporate
culture is perceived as the “collective programming of the mind which distinguishes the members of one
group of people from another” (Hill, 1990, p. 5; Vrakking, 1985, p. 16). In continental Europe, cadastral
systems are made of two groups which have evolved separately with different functions appointed to them
(Çağdaş et al., 2009; Silva et al., 2002). Thus the two groups referred to are the lawyers who are
responsible for the land registration, and the surveyors whose task is centralised on the cadastre. Çağdaş et
al.(2009) state that as the cadastre evolved to serve the land taxation purpose, the land registration was
appointed to record legal processes. Each of the groups is defined by their independent education system
which has a different education protocol designed to serve the cadastre and land registration separately.
Therefore each of the components possesses a different corporate culture.
Along the aspect of corporate culture issues in cadastral systems, researchers like Koerten (2011) have
placed an effort to study culture difference between the geodesist and the cadastral surveyor towards
establishing the Geoportals of Europe. The outcome of the research established that culture difference
was responsible for the unsuccessful establishment of the Geoportals. However the discussion by Koerten
(2011) does not engage the study of corporate culture changes in cadastral mergers. The research by
Koerten (2011) restricts itself to the surveying discipline and does not extend further to other disciplines.
Thus the evaluation of cadastral system in this research is driven by the need to identify the corporate
culture changes since merging mixes distinct corporate cultures. It is from this perspective that this
research prompts to focus on the corporate culture before the merger and after the merger.
1.2. Justification
This research is justified on the basis that there seem to be a lot of discussion to improve the cadastral
systems by the land administration experts (Kaufmann et al., 1998; Silva et al., 2002). Cadastre 2014 vision
is an indication which confirms that western developed countries seek to improve their cadastral systems
through comparing and sharing of information about the performance of their cadastral systems. One way
of extracting what is happening within the cadastral systems after mergers is by assessing the corporate
culture changes. Corporate culture plays a fundamental role in revealing the true perception of the
initiatives by employees. Thus an evaluation of cadastral systems through a corporate culture lens assist
the land administration experts to gain clarity and deep understanding on the way things are done after the
merger initiative. Conversely there is limited research about the corporate culture before and after the
cadastral mergers. It entails that there is little qualitative and quantitative data on corporate culture before
and after merging of the land registration and cadastre. Moreover corporate culture typologies existing
after the merger are not known. Inevitably, this research is important to the government as it pictures the
influence of merging of land registration and cadastre organisations. The research is important to the
cadastral organisations too, as it shed light on forgotten areas of management that threaten the long term
survival of mergers which have already been proven previously as crucial. The research is crucial to the
universities and colleges in that it serves as a platform which reveals what is happening in the cadastral
industry and how experts should be groomed to fit the industry and also vice versa. In total the research
enriches the information base for the sake of cadastral development by also adding an unfamiliarly applied
research method (Q methodology) to evaluate cadastral systems.
EVALUATION OF CADASTRAL SYSTEMS
3
1.3. Research Problem
This research applies the corporate culture lens to evaluate cadastral mergers. (Drori et al., 2011; Johnson
et al., 1984) define corporate culture as the deeper level of basic values, assumptions and beliefs that are
shared by members of an organisation. (Hill, 1990) adds that corporate culture is a psychological asset of
an organisation which can be used to predict what will happen to its financial assets in the near future.
Corporate culture is an asset that influences the human brain and his/her physical interaction with
processes, the rate of engagement to new technology , the adaptation to switching external environments
and the passion or ability to drive organisational goals and strategies. Therefore (Carrillo et al., 1999)
contend that both success and failure to achieve the organisational goals is credited to the organisation’s
culture since it has the power to either retard or boost the organisation’s performance. It follows that even
though an organisation may employ adequate strategies to run long term goals and objectives, the lack of
fitness between the strategic orientation and corporate culture retards the establishment of an
organisation’s mission and goals (Gardner, 1985). In total corporate culture is one of the organisational
determinants that strongly detect goal achievement. This is backed up by the opinion that corporate
culture “defines the organization's employees, customers, competitors, and suppliers, as well as the way in
which it interacts with these”(Carrillo et al., 1999, p. 646).
The inevitable influence of corporate culture within organisations lies within its ability to draw a line
between organisations (Hill, 1990). Whilst two organisations may indicate the presence of team work as a
way to achieve a goal, Carrillo et al (1999) note that between these organisations teamwork may bear
different meanings. One of organisations may identify teamwork with humbleness and honesty whilst
another organisation may recognise team work as consensus working possessing attributes of a family
spirit. Eventually the discussion by Carrillo et al (1999) underpins that each organisation has its own
culture. Consequently there is a difference “of doing things” (corporate culture) in every organisation
which explains why different organisations have different performance levels. Thus the initiative to merge
organisations brings distinct groups of different corporate cultures under one authority to share
information, knowledge, processes, programs amongst other things in order to support the set goals and
objectives. In that case each group of employees in a merger is expected “to unlearn, to de-commit, to
develop new skills, to explore, to learn at a number of different levels, or to newly commit to different
approaches”(Vrakking, 1985). Cadastral mergers are not an exception to the exposure of this alteration
considering that it brings fields of land registration and cadastre which are known to possess distinct
historical evolutions. Yet on the other hand, there is still limited theoretical discussion about the corporate
culture aspect following the merger of land registration and the cadastre. Moreover there is no discussion
about culture differences or culture changes to reveal what occurs after the merger since the exhaustive
research about cadastral reform highlights a number of advantages.
The vast theoretical literature in cadastral systems articulate cadastral reform along the dimensions to
address the changing dynamic human-land needs and an information enabled society yet does not detail
the way things are handled beyond the merger (Denison et al., 1991; Williamson et al., 2001). For instance
Bogaerts et al. (2001) discover the Budapest’s fragmented cadastral system as responsible for a 4 year
backlog in the land registration; the diagnosis following thereafter is to either integrate the information
systems and adopt the use of a common database. Connected to this problem is an alternative diagnosis
which involves the unification of cadastral systems. The theoretical perspective about cadastral reform
has a limited say on the rate at which the stated advantages are converted into reality after the merger.
There is no precise and empirical evidence that discloses the way things are done after the merger.
Therefore one way to unveil the state of cadastral mergers is to engage an empirical research of corporate
culture changes.
EVALUATION OF CADASTRAL SYSTEMS
4
Basically the benefits arising from evaluating the corporate culture are four fold. (1) Assessing the current
culture of an organisation informs the organisation of the change management initiatives required
(Mathew et al., 2012). (2)To assess the existing corporate culture is a crucial step of organisations’ strategic
planning which helps to establish adaptability of and fit between an organization and its environment
(Mathew et al., 2012). (3) Being aware of the existing corporate culture directs and facilitates the
integration of cultures. (4) The familiarisation of corporate culture preserves the strategy of cadastral
mergers. Researching on the aspect of culture deems useful to the cadastral community as it can help to
(ex post) evaluate the changes that took place since the 80s, and it can help to (ex ante) evaluate the
possible changes / alternative in the future. It enables better understanding of complex corporate culture
and its impact on service delivery. Therefore this research applies one main objective together with four
sub-objectives to obtain the empirical data of the cadastral merger. To gain a full understanding of the
unfamiliar field of corporate culture within the field of land administration the case of Sweden cadastral
system is singled out on the basis explained in section 1.3.1
1.3.1. Swedish cadastral system
The Swedish cadastral system is a target chosen to measure the corporate culture changes on the basis that
it is a product of the cadastre and the land registry mainly that has recently merged in 2008. The origin of
the cadastre component is traced back to the 1530s where cadastral books were used for land taxation as
required by the king (Österberg, 2011). These cadastral books compiled real properties or land parcels
according to each village. Later in the 1600s the cadastral book became a useful instrument to compile
population data. In the 17th century a cadastral map was introduced and used together with the cadastral
books. The main purpose of this combination was to “improve the taxation of land and make it more just
and equal, by surveying the area and value of each land parcel”(Österberg, 2011).
Parallel to the cadastre component was the land registration component whose responsibility belonged to
the courts (Österberg, 2011).The date of its emergence is not stated but it is clear that written documents
were used to verify ownership of property since the medieval times. “In the 18th century a title registration
was introduced”(Österberg, 2011). By then the real property came into the picture. Its main purpose was
to gather the developments arising from the comparison of the court proceedings with the cadastral maps
together with the cadastral books. The real property register was considered as a special register since it
gave the real property one definition. Moreover the real property register became a necessary tool for the
title registration system.
In 1930’s the work to establish a unified national map with one geodetic system was initiated. The maps
were produced from aerial photography, photo mosaics and orthophotos techniques to come with
economic maps of scales ranging from 1:5,000-1:20,000 (Österberg, 2011). All the cadastral boundaries on
old village maps were moved to the new system by photo interpretation techniques. The task lasted until
1978. Meanwhile in the 1960s the government took the initiative to computerise the real property register
and the land registration. Precisely the real property register was computerised in 1968 and the land
registration in 1970. By 1995 the construction of the Swedish system was already finished. The system
functioned with separate land registration and cadastre component until 2008 when the two began to
function under one authority and under one roof.
These developments are evident of the change in the Swedish cadastral systems yet there is no clear
theoretical evidence and empirical data of the corporate culture changes before and after the merger.
Therefore this research appoints the main objective: To evaluate the corporate culture changes for
cadastral mergers to address the research problem. The main objective engages four sub research
questions to collect empirical data for the corporate culture using the Swedish cadastral system. Section
1.4 presents the research objectives together with their sub-objectives and the corresponding research
questions.
EVALUATION OF CADASTRAL SYSTEMS
5
1.4. Research Objectives
1.4.1. Main Objective and Main Research question
To evaluate the corporate culture changes for cadastral mergers.
How can corporate culture changes for cadastral mergers be evaluated?
1.4.2. Sub objectives and Sub research questions
Four empirical sub objectives with their corresponding research questions are presented below from item
1 up to 4
1) To describe the important elements of corporate culture.
What are the elements of corporate culture?
How can the elements of corporate culture be classified?
How can the classified corporate culture element/s be measured?
2) To device the tools and methods to be used to measure the elements of corporate culture in the
Swedish cadastral system.
Which of the methods can I use and why to observe and describe corporate culture elements in reality?
3) To measure the corporate culture elements for land registration, the cadastre and the merger in
the Swedish cadastral system.
What are the findings for the operant value systems in the Swedish cadastral post merger?
What are the findings for the operant value systems of the Swedish cadastre in the premerger?
What are the findings for operant value systems of the Swedish land registration in the premerger?
4) To compare the research findings (from objective 3) for land registration corporate culture
elements, cadastre corporate culture elements and the merger corporate culture elements.
How can the post merger operant values be differentiated from the premerger values?
How much do the post merger operant value systems relate to either the land registration or the cadastre
components of the premerger?
Which cases are likely to have had a change and how can I observe the changes?
1.5. Analytical Framework
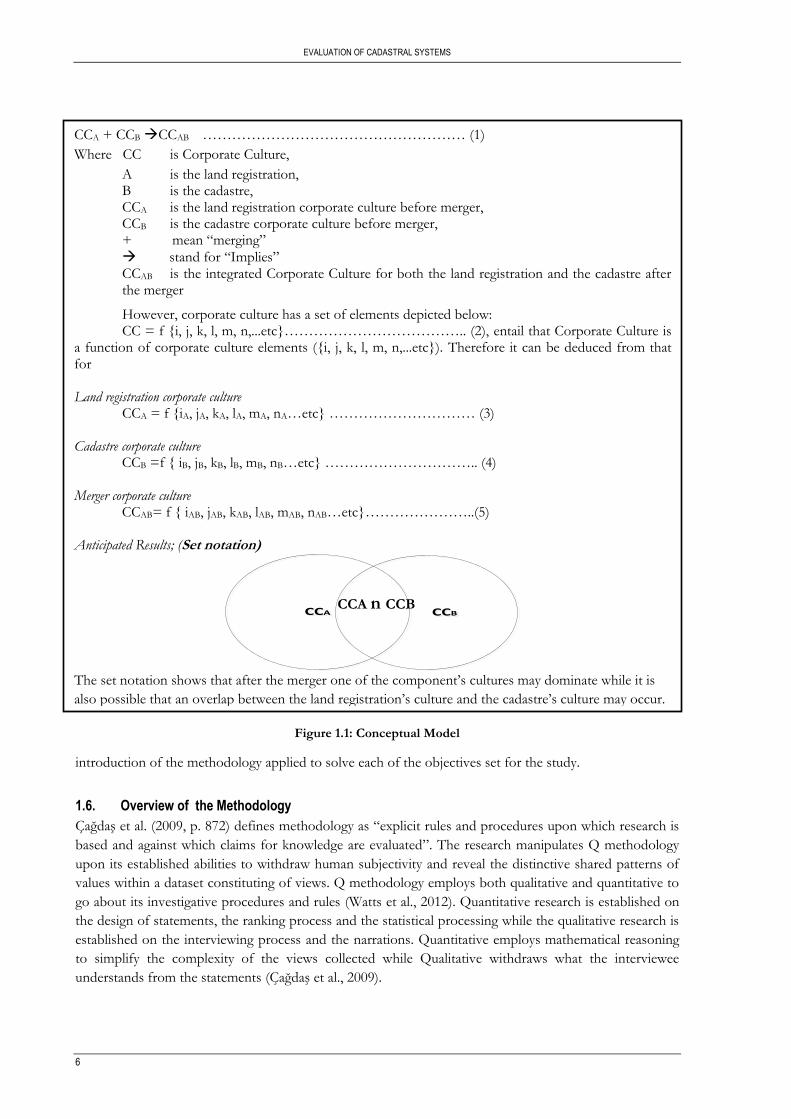
The analytical framework presented by the conceptual model in Figure 1.1 mirrors the general objective
and the sub-objectives which addresses the research problem. In other words the conceptual model is the
full apparatus which maps the beginning, through and to the end of this research. Precisely Equation 1
maps the general objective which aims to evaluate corporate culture changes of cadastral mergers. It is
assumed that for a merger to take place two organisations with different cultures are brought together.
Equation 2 is built up from the general objective assuming that corporate culture has a set of elements
that build it up. Thus the equation 2 leads to the sub-objective 1. Sub-objective 2 identifies the methods
and tools to be used from the set of elements found in sub-objective 1. Sub-objective 3 is built up from
the equations 3, 4, and 5 which identify corporate cultures for land registration, cadastre, and the merger
through utilising the tools and methods devised in sub-objective 2. Sub objective 4 concentrates on the
comparison of either the land registration value systems or the cadastre value systems relative to the post
merger.
The set notation in Figure 1.1 reflects the anticipated results of the outcome after merging the land
registration and the cadastre component. It is expected that either of the cultures inherent within these
components may dominate the other or the outcome may possibly be an overlap between the land
registration’s culture and the cadastre’s culture. To derive the nature of change Section 1.6 gives a brief
EVALUATION OF CADASTRAL SYSTEMS
6
Figure 1.1: Conceptual Model
introduction of the methodology applied to solve each of the objectives set for the study.
1.6. Overview of the Methodology
Çağdaş et al. (2009, p. 872) defines methodology as “explicit rules and procedures upon which research is
based and against which claims for knowledge are evaluated”. The research manipulates Q methodology
upon its established abilities to withdraw human subjectivity and reveal the distinctive shared patterns of
values within a dataset constituting of views. Q methodology employs both qualitative and quantitative to
go about its investigative procedures and rules (Watts et al., 2012). Quantitative research is established on
the design of statements, the ranking process and the statistical processing while the qualitative research is
established on the interviewing process and the narrations. Quantitative employs mathematical reasoning
to simplify the complexity of the views collected while Qualitative withdraws what the interviewee
understands from the statements (Çağdaş et al., 2009).
CCA + CCB CCAB ……………………………………………… (1)
Where CC is Corporate Culture,
A is the land registration, B is the cadastre,
CCA is the land registration corporate culture before merger, CCB is the cadastre corporate culture before merger, + mean “merging”
stand for “Implies” CCAB is the integrated Corporate Culture for both the land registration and the cadastre after the merger
However, corporate culture has a set of elements depicted below: CC = f {i, j, k, l, m, n,...etc}……………………………….. (2), entail that Corporate Culture is a function of corporate culture elements ({i, j, k, l, m, n,...etc}). Therefore it can be deduced from that for Land registration corporate culture CCA = f {iA, jA, kA, lA, mA, nA…etc} ………………………… (3) Cadastre corporate culture CCB =f { iB, jB, kB, lB, mB, nB…etc} ………………………….. (4) Merger corporate culture CCAB= f { iAB, jAB, kAB, lAB, mAB, nAB…etc}…………………..(5) Anticipated Results; (Set notation)
CCACCA CCB CCB
The set notation shows that after the merger one of the component’s cultures may dominate while it is
also possible that an overlap between the land registration’s culture and the cadastre’s culture may occur.
CCA n CCB
EVALUATION OF CADASTRAL SYSTEMS
7
Q methodology work with statements sampled out of the concourse that covers a broad range of the
subject at hand. For instance the concourse is developed through the research questions of objective 1 in
Table 3.1. Thereafter the methodology allows purposive and convenience sampling to choose the
appropriate case study and participants. Thus the Swedish case study is appointed for this research on the
basis that it has merged recently and the employees were open for the interviews. The participants reveal
their opinions by ranking statements according to their perception on the forced distribution scale with
reference of terms such as “strongly agree” through the neutral scale until strongly disagree (-5) (Watts et
al., 2005).
The exercise of ranking specifically responds to the research “How can the classified corporate culture element/s
be measured?” of Objective 1. The perceptions of participants upon a 36 statement-instrument formulate a
pool of views. Statistical processing by factor analysis means extract the underlying patterns together with
their distinctive nature. Meanwhile the approach to unveil the nature of shared views responds
systematically to the research question of Objective 2 in Table 3.1. Automatic statistical means lead to the
best solution which is weighted out of the varied patterns obtained. The best solution is a composite of
statements and their scores produced against each identified shared pattern of views. Thus statistical
processing helps to unveil the shared values of the post merger and each of the premerger components.
Research objective 4 compares the narrations built out of a combination of the holistic overview of
statements arrays and the interview data obtained in either the land registration and cadastre component
from Objective 3 to the post merger values. Thus Objective 4 marks the final phase of the Q
methodology process. The analysis proceeds by employing the competing values framework to plot and
interpret the culture changes in either of the premerger components relative to the post merger.
1.7. Thesis Structure
The outline below presents the chapters that are covered by the present research.
Chapter 1: Introduction: The Introduction focus on the background, research problem, research
objectives, research questions and research methodology.
Chapter 2: Conceptualisation of Corporate culture: This chapter provide a conceptualisation of the
corporate culture elements and how they can be measured basing on the chosen and proven methods. It
ends by building a sample of statements from the concourse.
Chapter 3: Collection of views and values: This chapter provide the physical procedures of Q
methodology executed in Fieldwork. It ends up by stating the steps for processing the data.
Chapter 4: Views and operant values in the Swedish cadastral system. The aim of chapter 4 is to
present the statistical results from factor analysis and display the research findings from the fieldwork. The
chapter distinguishes operant value systems of the post merger from operant value systems of the
premerger states operant value systems. The chapter ends by depicting the changes noted out of the
comparisons for each premerger value systems to the post merger.
Chapter 5: Coalition of Views and Operant values in the premerger and post merger: This chapter
discusses the research findings relative to the competing values framework.
Chapter 6: The chapter systematically responds to each of the research questions, presents the limitations
and strengths of the study and eventually profile the recommendations.
1.8. Conclusion
The formulated research problem based on the merging of the land registration and the cadastre is
addressed through the use of Q methodology. Four articulated sub objectives, together with the
EVALUATION OF CADASTRAL SYSTEMS
8
corresponding research questions are specifically designed to address the research problem of corporate
culture changes study in a merger. Each of these research objectives systematically manipulates the
investigative rules and procedures of Q methodology in order to fulfil the demands of the main objective
which is: “To evaluate corporate culture changes of the cadastral mergers”. The statements are the
instrument to fetch the views of the participants in the merger. The statistical factor analysis process helps
withdraw the shared perceptions out of a pool of views. Each premerger component and the post merger
values are obtained by interpreting the statistical findings displayed in form of statement arrays. Narrations
based on a consistent logic of abduction gains a holistic overview of each set of statement arrays.
Thereafter comparisons of the premerger relative to the post merger are conducted to derive the empirical
results for culture change.
Chapter 2 details the initial phase of accumulating the concourse and the construction of the statements
upon the identified concourse as guided by the research questions of Objective 1.
EVALUATION OF CADASTRAL SYSTEMS
9
2. CONCEPTUALISATION OF CORPORATE CULTURE
2.1. Introduction
The aim of this chapter is to address two research questions from Objective1: What are the corporate
culture elements? How can the corporate culture elements be classified? While addressing these research
questions the chapter accumulates the relevant concourse to generate Q statements for data collection.
Section 2.2 introduces the concept of culture and their elements and how they are classified. Section 2.2
concludes on the elements which are vital for use in measuring corporate culture. Section 2.3 discusses
different approaches on measuring corporate culture. Section 2.4 unveils the sources for statements
Section 2.5 is a conclusion.
2.2. Conceptualisation of culture: culture elements
The definitions of culture are diverse yet they converge on particular elements such as values, norms,
attitudes and behaviour patterns. Herzog (2008) confirms that there are 164 definitions of culture.
According to Herzog(2008) the most frequently used definition comes from Schein. Thus Schein
perceives culture as a “pattern of shared basic assumptions that the group learned as it solved its problems
of external adaptation and internal integration, that has worked well enough to be considered valid and,
therefore, to be taught to new members as the correct way to perceive, think, and feel in relation to those
problems”(Herzog, 2008, p. 1). Accordingly Hofstede further emphasise that “culture constitute the
mental programming that differentiate one group of people from another” (Contiua et al., 2012, p. 553).
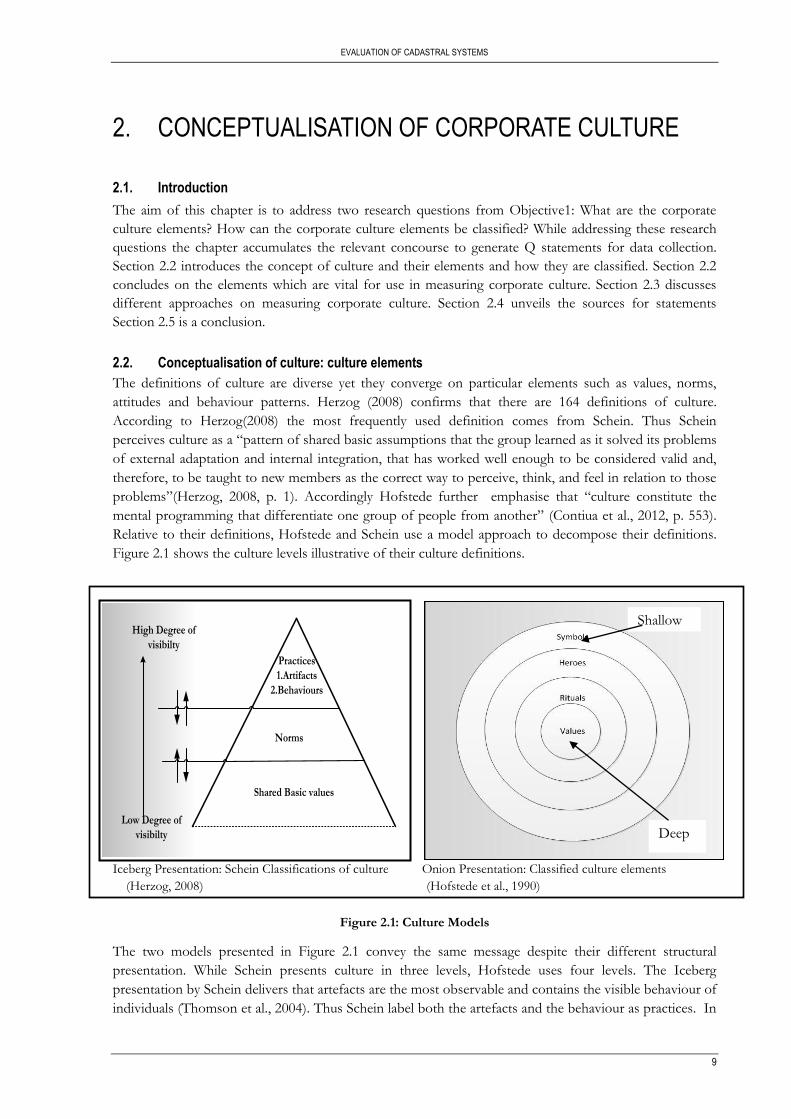
Relative to their definitions, Hofstede and Schein use a model approach to decompose their definitions.
Figure 2.1 shows the culture levels illustrative of their culture definitions.
Iceberg Presentation: Schein Classifications of culture Onion Presentation: Classified culture elements
(Herzog, 2008) (Hofstede et al., 1990)
Figure 2.1: Culture Models
The two models presented in Figure 2.1 convey the same message despite their different structural
presentation. While Schein presents culture in three levels, Hofstede uses four levels. The Iceberg
presentation by Schein delivers that artefacts are the most observable and contains the visible behaviour of
individuals (Thomson et al., 2004). Thus Schein label both the artefacts and the behaviour as practices. In
High Degree of
visibilty
Low Degree of
visibilty
Shared Basic values
Norms
Practices
1.Artifacts
2.Behaviours
Deep
Shallow
EVALUATION OF CADASTRAL SYSTEMS
10
the case of the Onion model, Hofstede states that the first three levels form the practices which are
perceived as empirically observable by (Morschett et al., 2009). In detail artefacts displayed by Schein
involve all the “the cultural phenomena that are easily perceived and empirically observable” which
include the first three layers of Hofstede model: symbols, heroes and rituals (Morschett et al., 2009, p.
204). Furthermore, Schein’s illustrative model displays that the degree of visibility deteriorates from
practices until the shared basic values. Likewise Hofstede mentions that with each layer of the onion
structure, the deepest and invisible layer is approached. This layer is perceived as the core of culture and it
is the least visible. As a result both models converge at the point where they communicate that the least
visible culture element is the value while the behaviour of individuals is the most visible.
Herzog (2008, p. 1) underpins that “shared values and beliefs help individuals understand organizational
functioning and thus provide them norms for behaviour in the organization”. Norms are informal
principles or informal rules known by the group and they provide the group with a defined unified
character that is applied in particular situations (Morschett et al., 2009). Herzog (2008) considers norms as
a link that transmit values to the common shared behaviour which is easily observable. However norms
remain abstract and are considered immeasurable (Herzog, 2008). Precisely Lamond (2002, p. 3) argues
that, “for the purpose of measuring culture, values are both more accessible than assumptions and more
reliable than artefacts”.
A study of twenty organisations by Hofstede et al(1990) already reveals the laborious and time consuming
aspects of measuring culture using symbols together with heroes and rituals. The method is designed for a
rather longer duration in order to fully capture symbols, heroes, rituals and values. The research design
employs a three phase course to collect the required data. The first phase involves a reconnaissance to
acquire a qualitative impression through using an in-depth interview together with a checklist for the
symbols, heroes, rituals and values. Thereafter the second phase employs a standardised survey
questionnaire which is administered before embarking on the final phase of pioneering a questionnaire
coupled with interviews. The whole exercise is worthy more than a year according to Hofstede et al
(1990). In addition to the longer duration spent to measure these elements, symbols/artefacts are open to
various interpretations which make it difficult to interpret them and difficult to classify (Schein, 2009).
Thus values remain the best culture element by considering the following reasons.
Deal et al (1982) indicate that values define the norms which are responsible for channelling the behaviour
of a group in one direction. Values form “the basic concepts and beliefs of an organisation” (Deal et al.,
1982, p. 14). Buono et al (1989) mention that values best reflect the shared beliefs, attitudes and
behaviours of a group thus setting a distinction between groups. Yet again values reflect the good and the
bad (basic assumptions) amongst the organisational members. Deal et al.(1982) regard values as key
determinants of the heroes, the myths, rituals and ceremonies of the organisation. At this juncture values
are perceived as a fundamental input of culture basing on their reliability to withdraw subjectivity as fully
supported in fields of psychology, sociology and political science (Narasimhan et al., 2010).
While values gain support in terms of their strength, it is fundamental to note that corporate culture
receives consensus on the basis that it is the “ pattern of shared values and beliefs that help individuals
understand organizational functioning and thus provides them norms for behaviour in the
organization”(Flamholtz, 2001; Hynes, 2009, p. 645). From the definition, the emphasis of corporate
culture dwells in the underlying values and the attitudes. These shared values are fundamental to
organisational individuals in that they convey a common understanding about organisational functioning
and provide individuals with the informal principles (norms) of operations (Herzog, 2008). Every
organisation has a set of values that influence the organisational members’ behaviour and their way of
approach to every day organisational operations (Flamholtz, 2001). Therefore, regardless of a series of
culture elements underscored above of which two elements have been added by Deal et al.(1982, p. 1) (the
EVALUATION OF CADASTRAL SYSTEMS
11
business environment and the cultural network), the present research filters values as the fundamental
corporate culture element that helps to achieve the aim of this research.
2.3. Overview of frameworks to measure Corporate Culture; The use of values
This research withdraws culture frameworks or models from scientific literature basing on their proven
reliability and validity. The key guiding corporate culture element is that of values. Whilst there is vast
consensus about the strength of values to withdraw subjectivity and display the behaviour, “values have
been conceptualised in different ways” (Narasimhan et al., 2010, p. 370). For instance models scheme the
varying meaning of values. Such models involve the rational system model versus the natural system
model. These frameworks have gained popularity due to their influence in the field of organisational
behaviour yet their difference is known for creating confusion (Quinn et al., 1981). In an effort to clear
the confusion, Richard Scott creates the third view of open system model (Quinn et al., 1981). Richard
Scott reasons in the lines that whilst the rational system model is concerned about the number of output
produced from a unit in a specified time (productivity and efficiency), the natural model system focus
largely on the activities to be engaged in order to keep the unit going (Quinn et al., 1981). Therefore
Richard Scott embarks on the open system model which “emphasise on adaptability and resource
acquisition” (Quinn et al., 1981, p. 124). These theories are crucial but with observed problems such as;
“sheer number and variety of effectiveness criteria employed” (Quinn et al., 1981, p. 124). Ultimately there
are various levels of analysis which varies all the time. In other words their quality is eroded by their
inconsistence.
Following the problems arising from the above stated models Quinn et al.(1981) outline the qualifications
that need to be met by a culture framework. These conditions are given by Quinn et al (1981, p. 125) as:
“1) the framework should be at one level of analysis; 2) the framework should integrate theoretical
perspectives and thereby provide a more holistic view; 3) the framework should resolve the problem of
multiple criteria by presenting a parsimonious and well-defined set; 4) the framework should provide
assertions (amenable to empirical test) about the relationships between criteria; 5) the framework should
recognize the coalitional and dynamic nature of organizations and the variability of criteria across time and
perspective; 6) the framework should provide an analytical tool that can be applied in specific settings,
while facilitating comparison and generalization of findings across studies; 7) the framework should
explicitly define effectiveness in an organisation”.
It is obvious that different culture frameworks are developed in order to meet the criteria of qualifications.
Section 2.3.1 presents the colour coding framework. Section 2.3.2 presents the Competing values
framework, section 2.3.3 presents the enzymic analogue of the competing values framework, and section
2.34 gives the final decision on the framework to use.
2.3.1. Colour Coding Framework
Porter wraps and reclassifies three sets of culture typologies arising from Vrakking, Quinn and McGrath
and Maccoby (Brink, 1991) into four names namely cool green, hot red, true blue and the dull gray. A
matrix of the reclassified culture typologies with their original names versas 30 organisational aspects is
shown in detail in Appendix 1. Each of the four culture typologies represents the nature and character of
the persons found within an organisation. The cool green represents those people who are comfortable at
doing their work in their own way (Brink, 1991). “These people like to do their own things without
dependence on other people and hence they respect other peoples’ independence too”(Brink, 1991, p. 2).
The second typology (hot red) constitute of people who see themselves as strong and deserving to get to
higher positions of leadership and authority. These people expect to operate with subordinates who are
calm and not rebellious. In organisations containing this character the boss is the one who dictates the
goals. Brink (1991, p. 6) says hot reds perceive that “anyone who cannot follow or lead must get out of the
EVALUATION OF CADASTRAL SYSTEMS
12
way”. Both the cool green and the hot red cultures are after achieving goals but differ in the sense that the
cool green culture individuals depict their own goals while the hot red individuals receive their goals from
their bosses and adhere to manuals, procedures and committees. Therefore the latter requires an individual
to listen carefully to instructions because they do things to meet the standards detected by their bosses.
The true blue, constitute friendly people. This group of people disfavour bossy people who display that
they know too much. Thus they consider equitability amongst themselves. Finally the dull gray harbours
people who are completely governed by a set of rules or manuals, procedures and guidelines in executing
the duties. These people observe hierarchy or bureaucracy.
The Porter’s four culture typology of motivation is not an exception of inconsistency. Although the
organisational aspects are presented uniformly to serve each culture typology, there is inconsistency in the
comparison and rating scale. Furthermore the rating cannot set how low is low, thus fostering an overlap.
The other aspects uses the rating scales labelled LOW and HIGH while other organisation aspects utilises
the rating scales USUALLY, RARELY and SOMETIMES, SHORT AND LONG. Therefore the scale
provided has various words used to distinguish one culture typology from another. Thus there is no single
scale. Whilst the culture framework contains a diverse variation of comparison it still remains an input to
the Q statement however to a considerably lower degree. The main reason of consideration lies within its
ability to deliver detailed organisational aspects that provides potential assessments of how the Swedish
cadastral system copies with a diverse range of professionals in a merger. At the same time the framework
classify these organisation aspects according to a suitable culture type. Thus the additional organisational
aspects involved are; standardisation of professional training, autonomy and standardisation of work
processes.
2.3.2. Competing Values Framework
Tianyuan et al (2009) say that the origin of competing values framework has its roots in organisational
effectiveness, where 52 organisational researchers have collaboratively worked together to build the
framework. Similarly Quinn et al (1981) capture the efforts by Campbell whose aim was to create a
consistent and economic framework. (Quinn et al., 1981) records a two stage process to process and
condense a thirty criterion framework. The involved participants from various backgrounds condense the
framework through a factorial analysis with the aim to obtain parsimonious model of two major
dimensions.
The first stage aimed to reduce an appropriate framework through the use of three rules (Quinn et al.,
1981). The first rule recognises a one organisational level of analysis with the same generality. The second
and third rules aim to obtain a list of consistent measurable and observable values (Quinn et al., 1981, p.
127). The second stage involves participants to assess the degree of similarity in the pairing criteria
through employing the comparison judgement utilising a rating scale of 1 up to 7. Eventually the process
leads to a three axes framework. (Tianyuan et al., 2009) record these axes as; internal-external, control-
flexibility and means-ends. The means-ends axes is integrated together with the two axes of control-
flexibility and internal-external axes, to come up with a model defined by two dimensions (Tianyuan et al.,
2009). These two dimensions form the theoretical basis of the competing values framework.
Each of the dimensions presents conflicting outcomes which are assumed to occur within organisations.
The “horizontal dimension is related to organizational focus, from an internal emphasis on people in the
organization to an external focus of the organization itself, while the vertical dimension contrasts stable,
order, and control structures on the one hand from flexible, spontaneous and dynamic structures on the
other” (van der Wal et al., 2011, p. 6). While some organisations are effective when they emphasise on the
internal focus of people, other organisations are effective when they emphasise on the external
environment of the organisation (Dastmalchian et al., 2000). Similarly some organisations are effective
when they emphasise on either stable structures or flexible structures instead of both extremes. However,
EVALUATION OF CADASTRAL SYSTEMS
13
“the competing values framework is based on the assumption that a balanced repertoire of the roles is an
essential prerequisite for managerial effectiveness’ (Belasen et al., 2010, p. 3). Denison et al.(1991) contend
that an imbalance of managerial roles, together with an asymmetric attention of values is a potential threat
to the organisation’s performance. They continue to say that employee involvement may retard the
organisation’s effectiveness if much attention is given to the internal environment than the external
environment.
Precisely the integration of the horizontal and vertical dimensions forms four quadrants presenting four
different values or cultures which remains idealistic and theoretically based. Some authors like (Quinn et
al., 1983) term these four culture typologies as; the human relations model, open system model, the
internal process model, and the rational goal model. Denison et al (1991) label the same quadrants as
group, developmental, hierarchical, and rational cultures. Cameron et al (2006)brand the same four culture
types as collaborate, create, control and compete. Cameron et al (2006) alternatively use the terms; clan,
adhocracy, hierarchy and market culture for the same quadrants. Therefore there is more than one version
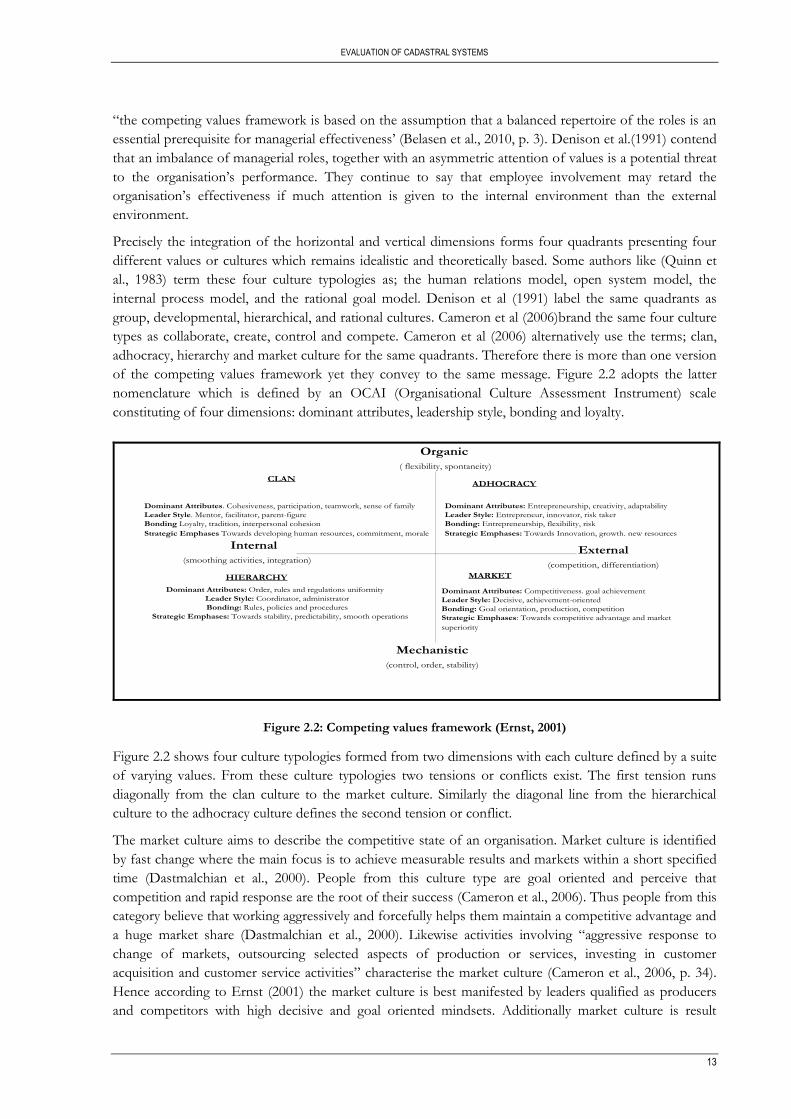
of the competing values framework yet they convey to the same message. Figure 2.2 adopts the latter
nomenclature which is defined by an OCAI (Organisational Culture Assessment Instrument) scale
constituting of four dimensions: dominant attributes, leadership style, bonding and loyalty.
Organic
( flexibility, spontaneity)
Mechanistic
(control, order, stability)
External
(competition, differentiation)
Dominant Attributes. Cohesiveness, participation, teamwork, sense of family
Leader Style. Mentor, facilitator, parent-figure
Bonding Loyalty, tradition, interpersonal cohesion
Strategic Emphases Towards developing human resources, commitment, morale
Dominant Attributes: Entrepreneurship, creativity, adaptability
Leader Style: Entrepreneur, innovator, risk taker
Bonding: Entrepreneurship, flexibility, risk
Strategic Emphases: Towards Innovation, growth. new resources
Dominant Attributes: Order, rules and regulations uniformity
Leader Style: Coordinator, administrator
Bonding: Rules, policies and procedures
Strategic Emphases: Towards stability, predictability, smooth operations
Dominant Attributes: Competitiveness. goal achievement
Leader Style: Decisive, achievement-oriented
Bonding: Goal orientation, production, competition
Strategic Emphases: Towards competitive advantage and market
superiority
CLANADHOCRACY
HIERARCHY MARKET
Internal
(smoothing activities, integration)
Figure 2.2: Competing values framework (Ernst, 2001)
Figure 2.2 shows four culture typologies formed from two dimensions with each culture defined by a suite
of varying values. From these culture typologies two tensions or conflicts exist. The first tension runs
diagonally from the clan culture to the market culture. Similarly the diagonal line from the hierarchical
culture to the adhocracy culture defines the second tension or conflict.
The market culture aims to describe the competitive state of an organisation. Market culture is identified
by fast change where the main focus is to achieve measurable results and markets within a short specified
time (Dastmalchian et al., 2000). People from this culture type are goal oriented and perceive that
competition and rapid response are the root of their success (Cameron et al., 2006). Thus people from this
category believe that working aggressively and forcefully helps them maintain a competitive advantage and
a huge market share (Dastmalchian et al., 2000). Likewise activities involving “aggressive response to
change of markets, outsourcing selected aspects of production or services, investing in customer
acquisition and customer service activities” characterise the market culture (Cameron et al., 2006, p. 34).
Hence according to Ernst (2001) the market culture is best manifested by leaders qualified as producers
and competitors with high decisive and goal oriented mindsets. Additionally market culture is result
EVALUATION OF CADASTRAL SYSTEMS
14
oriented and has tough and demanding leaders (Gotteland et al., 2006). The long term emphasis is to carry
the legacy on reputation, success and winning (Cameron et al., 2006).
Apart from marketing culture is the clan culture which focuses on flexibility and internal integration of
people. Herzog (2008) says that clan culture concern itself with values of cohesiveness, participation, and
teamwork. The environment allows employees to care for each other through sharing of personal values
and depending upon each other. The leaders of the clan are entitled to be humble reflecting the parental
figure-hood in order to facilitate thick interaction amongst the employees and also to maintain the long
term established relationships (Cameron et al., 2006). Moreover the leaders of this value system are
expected to fulfil strategies that supports human and social capital rather than financial capital (Cameron
et al., 2006; Herzog, 2008). Dastmalchian et al.(2000) prescribe those leaders with qualities of a mentor,
facilitator and parental figure as the appropriate leaders of the clan culture.
The lower left quadrant of Figure 2.2 presents the internally oriented hierarchical values with stable
structures in place. This quadrant implies that hierarchical values place their importance on formalised
rules, procedures and policies to control employees and operations Herzog (2008, p. 10). Therefore
hierarchical values enable the smooth running of the organisation through governing people, processes or
operations by rules, procedures, and policies. The aim is to install efficient and predictable processes.
Coordinators and rule enforcers are suitable leaders meant to promote the bond of formalised rules,
procedures and policies shared by individuals belonging to a hierarchical culture. The leaders have respect
for the complicated methodologies, or processes existing. Unlike the extreme opposite culture, adhocracy
is nurtured and kept alive by risk takers or innovators who has the passion for emphasising spontaneity,
flexibility, creativity, adaptability, growth and acquiring of the necessary external resources (Ernst, 2001).
Adhocracy culture “allow for freedom of thought and action among employees so that rule breaking and
stretching beyond barriers are common characteristics of the organization’s culture” (Cameron et al., 2006,
p. 36). Ernst (2001) says individual initiative, experimentation and flexibility and freedom are crucial
aspects of adhocracy culture. Adhocratic organisations strive to establish new markets, new products and
new directions for growth. These organisations can adapt to the external environment by doing things
first. Entrepreneurs, risk takers and innovators are perceived as the most appropriate leaders of this
category. Leaders are expected to bring along rapid and spontaneous strategic thinking to support the
“hyper-turbulent, fast moving environments that demand cutting edge ideas and innovations”(Cameron et
al., 2006, p. 36).
Therefore the competing values framework is found beneficial for use in that it presents four conflicting
values at one goal and allow for comparable analysis from both use of structures, and the organisation
focus. An added benefit involves the associated OCAI scale (Organisational Culture Assessment
Instrument) which provides the present research with a set of measurable indicators or dimensions. Thus
the competing values framework makes it possible to view the possible interactions amongst behaviours,
leadership role, bond and the strategic emphasis. Moreover (Hynes, 2009) displays the analytical power of
the competing values framework to mirror the organisation’s entire corporate typologies. Section 2.3.3
presents a detailed analytical strength of the competing values framework.
2.3.3. Enzymic analogy of the competing values framework
Hynes (2009)recognises that an organisation can have more than one strategy and appreciates that
organisations tend to pursue a number of different strategies at departmental level. Eventually each
organisation tends to generate subcultures. Hynes (2009) manipulate the competing values framework to
illustrate the relationship existing between the strategic orientation and the corporate culture to achieve
stipulated organisational goals and objectives. In the research, Hynes(2009, p. 4) pursue that corporate
culture “is a set of beliefs and values while the strategic orientation comprise of set of actions and
EVALUATION OF CADASTRAL SYSTEMS
15
behaviours that determine long term goals and objectives”(Hynes, 2009, p. 2). Analogously Hynes (2009)
relates the interaction of the strategic orientation and the corporate culture to the chemical reaction of the
the enzyme and the substrate. The assumption is that the strategic orientation is the substrate and the
enzyme is the corporate culture. (Hynes, 2009) continues to state that a successful reaction of the substrate
and the enzyme occurs when the appropriate substrate and enzyme fuse and also in the absence of
inhibitors. Likewise a successful business output or outcome occurs when the appropriate strategic
orientation is collided with the appropriate corporate culture in the absence of external part. This means
that there ought to be congruence between a set of activities and the values to produce a successful
outcome. (Hynes, 2009) maps possible interactions existing between the strategic orientation and
corporate culture typology extracted from the competing values as shown in Table2 1.
Table 2.1: Examples of possible interactions (Hynes, 2009, p. 7)
Simultaneously Table 2.1 appreciates that an organisation system composes of various strategic
orientations and corporate cultures where each strategic orientation or corporate culture does not exist in
isolation. Inhibitors retard the interaction of the strategic orientation and corporate culture. The corporate
culture can be a potential inhibitor in conditions of mismatch. For instance, a market orientation can best
be manifested by a market culture. However trying to achieve a market orientation by installing adhocratic
culture negatively influences the business outcome. In that case the adhocracy culture is perceived as the
inhibitor at hand. “Inhibitors have a variety of characteristics and can be competitive or non competitive
and reversible or non reversible”(Hynes, 2009, p. 5). Non competitive inhibitors reduce the chances of
other corporate culture types from interacting with the strategic orientation at exposure. Yet the
competitive inhibitors may closely associate with the strategic orientation thereby distracting the right
corporate culture from successfully manifesting with the appropriate strategic orientation. Thus a
competitive inhibitor may be reversible or irreversible.
Therefore the illustration of the enzymic analogue conveys that corporate culture interacts in different
ways with each strategic orientation. Moreover the interaction of the strategic orientation and corporate
culture may not remain static forever. For that reason an enzymic way of thinking may play a crucial role
in diagnosing and analysing of the empirical findings of an organisation considering that it realises the
effects of external turbulences like dynamic change of technology, markets change, etc. Therefore the
present research appoints the competing values framework realising the analytical strengths that can be
imported from the enzymic analogue to explain the variations of empirical findings from the Swedish
cadastral system.
Corporate Culture
(Enzyme)
Strategic orientation (Substrate)
Employee Shareholder Customer Competitor
Clan Match Competitive inhibitor
Competitive inhibitor
Competitive irreversible inhibitor
Bureaucratic Competitive inhibitor
Match Competitive irreversible inhibitor
Competitive inhibitor
Adhocratic Competitive inhibitor
Competitive irreversible inhibitor
Match Non-competitive inhibitor
Market Competitive irreversible inhibitor
Competitive inhibitor
Non-competitive inhibitor
Match
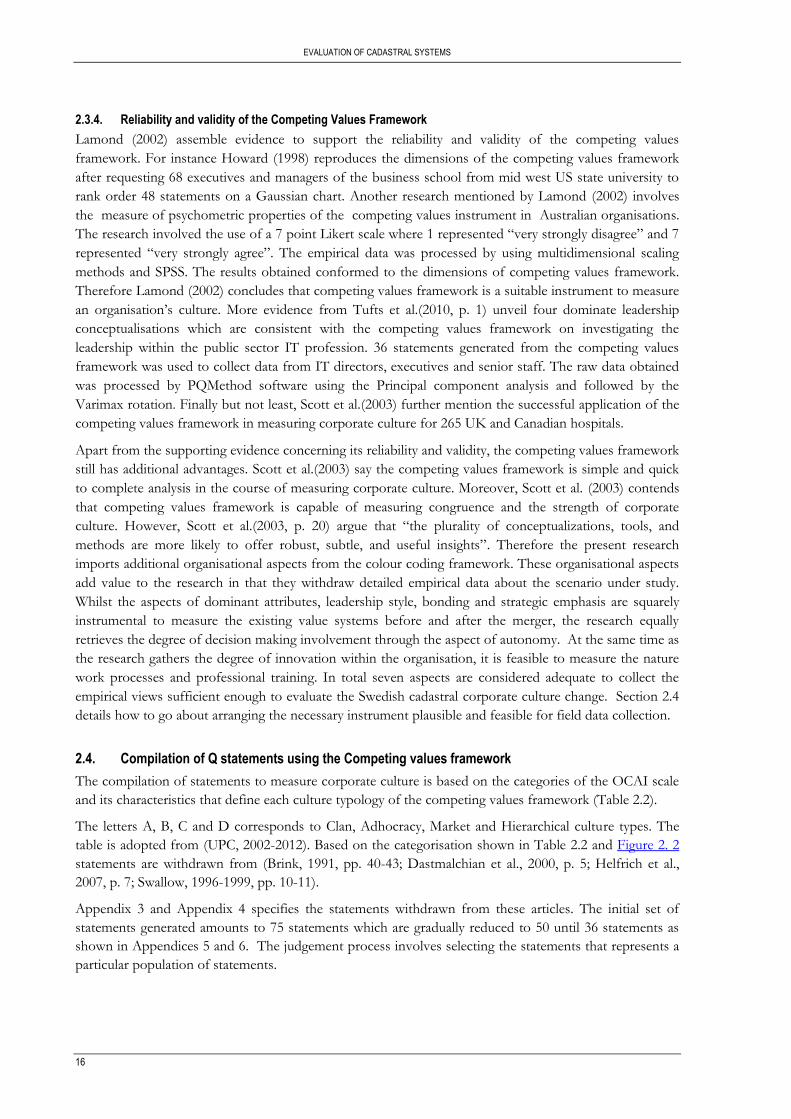
EVALUATION OF CADASTRAL SYSTEMS
16
2.3.4. Reliability and validity of the Competing Values Framework
Lamond (2002) assemble evidence to support the reliability and validity of the competing values
framework. For instance Howard (1998) reproduces the dimensions of the competing values framework
after requesting 68 executives and managers of the business school from mid west US state university to
rank order 48 statements on a Gaussian chart. Another research mentioned by Lamond (2002) involves
the measure of psychometric properties of the competing values instrument in Australian organisations.
The research involved the use of a 7 point Likert scale where 1 represented “very strongly disagree” and 7
represented “very strongly agree”. The empirical data was processed by using multidimensional scaling
methods and SPSS. The results obtained conformed to the dimensions of competing values framework.
Therefore Lamond (2002) concludes that competing values framework is a suitable instrument to measure
an organisation’s culture. More evidence from Tufts et al.(2010, p. 1) unveil four dominate leadership
conceptualisations which are consistent with the competing values framework on investigating the
leadership within the public sector IT profession. 36 statements generated from the competing values
framework was used to collect data from IT directors, executives and senior staff. The raw data obtained
was processed by PQMethod software using the Principal component analysis and followed by the
Varimax rotation. Finally but not least, Scott et al.(2003) further mention the successful application of the
competing values framework in measuring corporate culture for 265 UK and Canadian hospitals.
Apart from the supporting evidence concerning its reliability and validity, the competing values framework
still has additional advantages. Scott et al.(2003) say the competing values framework is simple and quick
to complete analysis in the course of measuring corporate culture. Moreover, Scott et al. (2003) contends
that competing values framework is capable of measuring congruence and the strength of corporate
culture. However, Scott et al.(2003, p. 20) argue that “the plurality of conceptualizations, tools, and
methods are more likely to offer robust, subtle, and useful insights”. Therefore the present research
imports additional organisational aspects from the colour coding framework. These organisational aspects
add value to the research in that they withdraw detailed empirical data about the scenario under study.
Whilst the aspects of dominant attributes, leadership style, bonding and strategic emphasis are squarely
instrumental to measure the existing value systems before and after the merger, the research equally
retrieves the degree of decision making involvement through the aspect of autonomy. At the same time as
the research gathers the degree of innovation within the organisation, it is feasible to measure the nature
work processes and professional training. In total seven aspects are considered adequate to collect the
empirical views sufficient enough to evaluate the Swedish cadastral corporate culture change. Section 2.4
details how to go about arranging the necessary instrument plausible and feasible for field data collection.
2.4. Compilation of Q statements using the Competing values framework
The compilation of statements to measure corporate culture is based on the categories of the OCAI scale
and its characteristics that define each culture typology of the competing values framework (Table 2.2).
The letters A, B, C and D corresponds to Clan, Adhocracy, Market and Hierarchical culture types. The
table is adopted from (UPC, 2002-2012). Based on the categorisation shown in Table 2.2 and Figure 2. 2
statements are withdrawn from (Brink, 1991, pp. 40-43; Dastmalchian et al., 2000, p. 5; Helfrich et al.,
2007, p. 7; Swallow, 1996-1999, pp. 10-11).
Appendix 3 and Appendix 4 specifies the statements withdrawn from these articles. The initial set of
statements generated amounts to 75 statements which are gradually reduced to 50 until 36 statements as
shown in Appendices 5 and 6. The judgement process involves selecting the statements that represents a
particular population of statements.
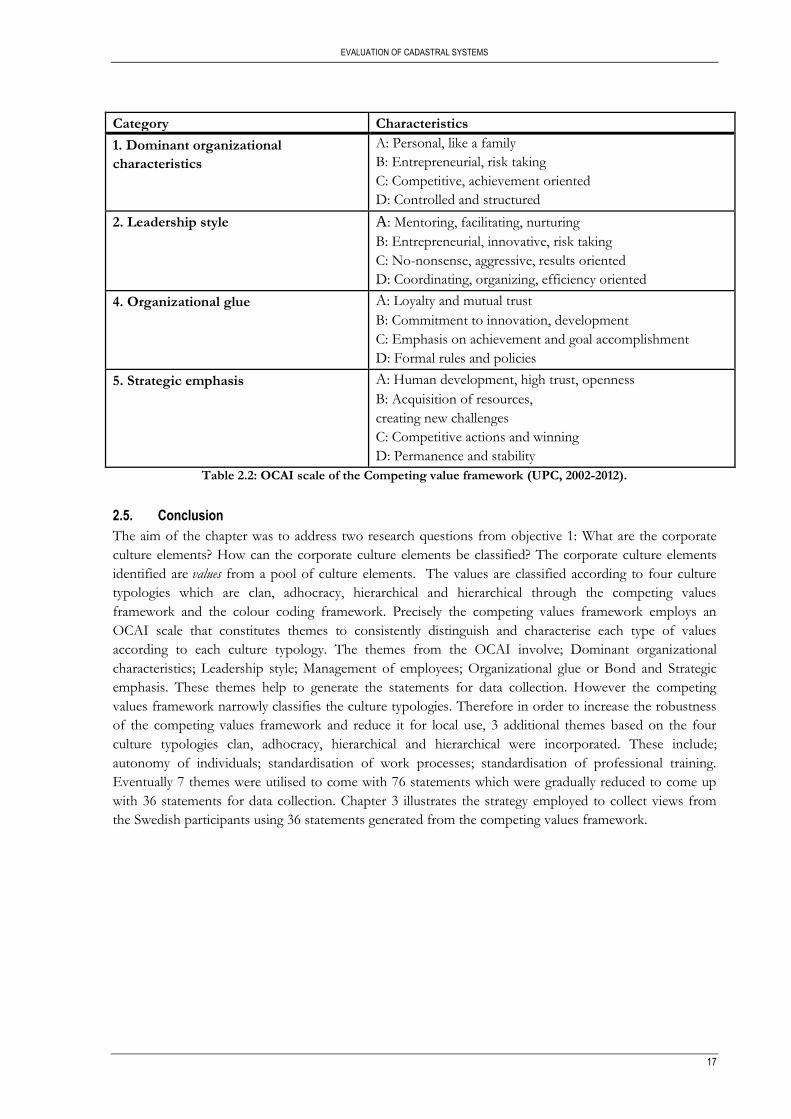
EVALUATION OF CADASTRAL SYSTEMS
17
Category Characteristics
1. Dominant organizational
characteristics
A: Personal, like a family
B: Entrepreneurial, risk taking
C: Competitive, achievement oriented
D: Controlled and structured
2. Leadership style A: Mentoring, facilitating, nurturing
B: Entrepreneurial, innovative, risk taking
C: No-nonsense, aggressive, results oriented
D: Coordinating, organizing, efficiency oriented
4. Organizational glue A: Loyalty and mutual trust
B: Commitment to innovation, development
C: Emphasis on achievement and goal accomplishment
D: Formal rules and policies
5. Strategic emphasis A: Human development, high trust, openness
B: Acquisition of resources,
creating new challenges
C: Competitive actions and winning
D: Permanence and stability
Table 2.2: OCAI scale of the Competing value framework (UPC, 2002-2012).
2.5. Conclusion
The aim of the chapter was to address two research questions from objective 1: What are the corporate
culture elements? How can the corporate culture elements be classified? The corporate culture elements
identified are values from a pool of culture elements. The values are classified according to four culture
typologies which are clan, adhocracy, hierarchical and hierarchical through the competing values
framework and the colour coding framework. Precisely the competing values framework employs an
OCAI scale that constitutes themes to consistently distinguish and characterise each type of values
according to each culture typology. The themes from the OCAI involve; Dominant organizational
characteristics; Leadership style; Management of employees; Organizational glue or Bond and Strategic
emphasis. These themes help to generate the statements for data collection. However the competing
values framework narrowly classifies the culture typologies. Therefore in order to increase the robustness
of the competing values framework and reduce it for local use, 3 additional themes based on the four
culture typologies clan, adhocracy, hierarchical and hierarchical were incorporated. These include;
autonomy of individuals; standardisation of work processes; standardisation of professional training.
Eventually 7 themes were utilised to come with 76 statements which were gradually reduced to come up
with 36 statements for data collection. Chapter 3 illustrates the strategy employed to collect views from
the Swedish participants using 36 statements generated from the competing values framework.
EVALUATION OF CADASTRAL SYSTEMS
18
3. COLLECTION OF VIEWS AND VALUES
3.1. Introduction
The objective of this chapter is to reflect upon the strategy applied to collect views concerning corporate
culture before and after the merger using 36 statements generated in Chapter2. Meanwhile the chapter gives a
feedback on the research question: “How can the classified corporate culture element/s be measured?” The
chapter ends by highlighting the procedure that will be used to process the collected views. The research
question that accompanies this requirement is: “Which of the methods can I use to observe and describe
corporate culture elements in reality?” Section 3.2 gives an overview of Q methodology, section 3.3 outlines
the research process and section 3.4 concludes the chapter.
3.2. Overview of QMethodology
Q methodology has gained popularity on its established power to withdraw human subjectivity (Barry et
al., 1999). Even though methodologies such as the Cultural Consensual Analysis and Cultural Modelling
are equally suitable to withdraw human subjectivity, there tend to be distinctive remarks associated with Q
methodology. Unlike Cultural Consensual Analysis and Cultural Modelling, Q methodology withdraws the
distinctive shared patterns of beliefs or values (Rinne et al., 2012). Furthermore, while the Cultural
Consensual Analysis is a quantitative methodology, “Q methodology integrates qualitative and quantitative
techniques to identify and categorize individual perceptions and opinions” (Rinne et al., 2012; Tufts et al.,
2010, p. 4; Webler et al., 2009). On the contrary, Cultural Modelling methodology is a pure qualitative
method but lacks the quantitative part. While quantitative methods are known for their statistical
inclination, qualitative methods seek a deep understanding and meaning behind the events of study. Hence
Q methodology owns the wisdom to manipulate statistical investigative procedures in order to withdraw
the underlying patterns at the same time leverage observations and interviews to explain the opinions.
Rinne et al (2012) claims that the statistical and sampling techniques associated with the quantitative
research designs makes it possible for the research findings to be generalised to a wider population of
people. Yet even though Q methodology constitutes the quantitative statistical techniques, its results
cannot be generalisable to a population of people (Jedeloo et al., 2010). Moreover, Q methodology results
do not tell the proportions of participants or refer to the personal characteristics. Instead, Q methodology
emphasises the “participant’s point of view as central to its investigative procedures and describes a
population of viewpoints” (Goldman, 1999, p. 589; Jedeloo et al., 2010, p. 595). Purposively the views are
the target to reveal the shared patterns of values and beliefs that conceptualises corporate culture.
Therefore in order to observe and describe corporate culture elements in reality, the present research
applied the wisdom of Q methodology to collect views using 36 statements generated in Chapter 2.
Briefly the first step of Q methodology process begins by identifying the relevant concourse or literature
from which statements are generated around the topic of interest (Webler et al., 2009). To ensure a
detailed and consistent coverage of the study, statements are generated according to devised themes or
categories. The second step engages the appropriate participants to grade the statements on a graduated
forced distribution chart with specified reference of terms such as “strongly agree” for (+5), neutral for (0)
and “strongly disagree” for (-5) (Coogan et al., 2011). The third step involves intercorrelating and factor
analysing the overall configurations or views. The aim is to obtain the shared perceptions or values
amongst the views obtained. The final fourth step involves the factor analytic process and the
construction of narrations based on the mathematical solution generated by the statistical processing
together with the accompanying interview data. Section 3.3 proceeds to reflect on the practical systematic
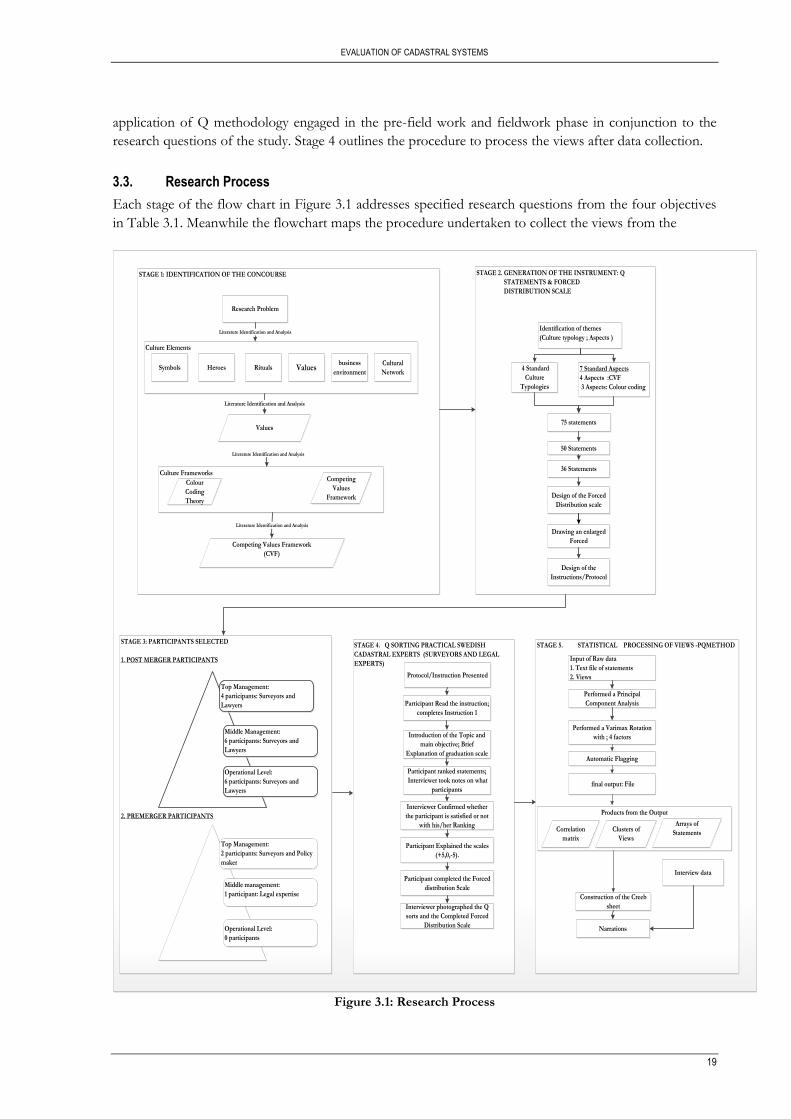
EVALUATION OF CADASTRAL SYSTEMS
19
application of Q methodology engaged in the pre-field work and fieldwork phase in conjunction to the
research questions of the study. Stage 4 outlines the procedure to process the views after data collection.
3.3. Research Process
Each stage of the flow chart in Figure 3.1 addresses specified research questions from the four objectives
in Table 3.1. Meanwhile the flowchart maps the procedure undertaken to collect the views from the
STAGE 3: PARTICIPANTS SELECTED
1. POST MERGER PARTICIPANTS
2. PREMERGER PARTICIPANTS
STAGE 1: IDENTIFICATION OF THE CONCOURSE
Culture Frameworks
Culture Elements
Values
Colour
Coding
Theory
Competing
Values
Framework
Symbols RitualsHeroes Values
Literature Identification and Analysis
Research Problem
Literature Identification and Analysis
Competing Values Framework
(CVF)
Literature Identification and Analysis
Literature Identification and Analysis
business
environment
Cultural
Network
STAGE 5. STATISTICAL PROCESSING OF VIEWS -PQMETHOD STAGE 4. Q SORTING PRACTICAL SWEDISH
CADASTRAL EXPERTS (SURVEYORS AND LEGAL
EXPERTS)
Protocol/Instruction Presented
Participant Read the instruction;
completes Instruction 1
Introduction of the Topic and
main objective; Brief
Explanation of graduation scale
Participant ranked statements;
Interviewer took notes on what
participants
Interviewer Confirmed whether
the participant is satisfied or not
with his/her Ranking
Participant Explained the scales
(+5,0,-5).
Participant completed the Forced
distribution Scale
Interviewer photographed the Q
sorts and the Completed Forced
Distribution Scale
STAGE 2. GENERATION OF THE INSTRUMENT: Q
STATEMENTS & FORCED
DISTRIBUTION SCALE
Identification of themes
(Culture typology ; Aspects )
4 Standard
Culture
Typologies
7 Standard Aspects
4 Aspects :CVF
3 Aspects: Colour coding
50 Statements
36 Statements
Design of the Forced
Distribution scale
Drawing an enlarged
Forced
Design of the
Instructions/Protocol
75 statements
Performed a Principal
Component Analysis
Performed a Varimax Rotation
with ; 4 factors
final output: File
Construction of the Creeb
sheet
Input of Raw data
1. Text file of statements
2. Views
Narrations
Interview data
Automatic Flagging
Products from the Output
Arrays of
StatementsCorrelation
matrix
Clusters of
Views
Top Management:
4 participants: Surveyors and
Lawyers
Middle Management:
6 participants: Surveyors and
Lawyers
Operational Level:
6 participants: Surveyors and
Lawyers
Top Management:
2 participants: Surveyors and Policy
maker
Middle management:
1 participant: Legal expertise
Operational Level:
0 participants
Figure 3.1: Research Process
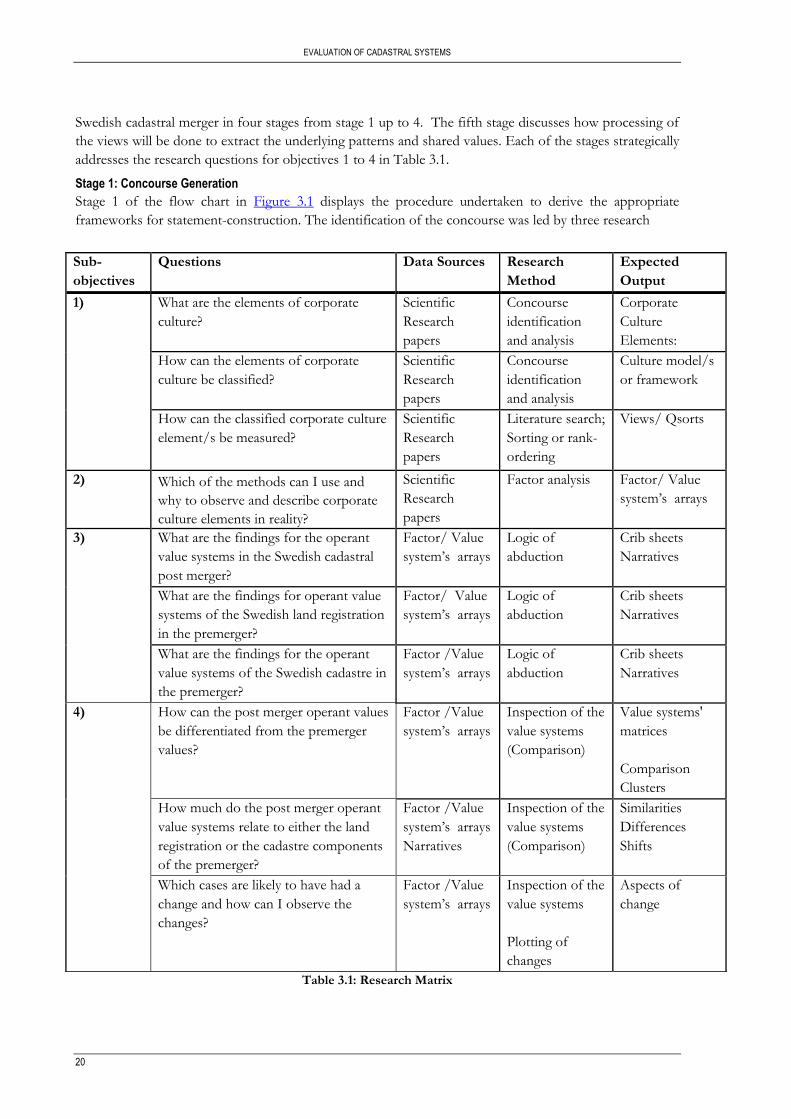
EVALUATION OF CADASTRAL SYSTEMS
20
Swedish cadastral merger in four stages from stage 1 up to 4. The fifth stage discusses how processing of
the views will be done to extract the underlying patterns and shared values. Each of the stages strategically
addresses the research questions for objectives 1 to 4 in Table 3.1.
Stage 1: Concourse Generation
Stage 1 of the flow chart in Figure 3.1 displays the procedure undertaken to derive the appropriate
frameworks for statement-construction. The identification of the concourse was led by three research
Table 3.1: Research Matrix
Sub-
objectives
Questions Data Sources Research
Method
Expected
Output
1)
What are the elements of corporate
culture?
Scientific
Research
papers
Concourse
identification
and analysis
Corporate
Culture
Elements:
How can the elements of corporate
culture be classified?
Scientific
Research
papers
Concourse
identification
and analysis
Culture model/s
or framework
How can the classified corporate culture
element/s be measured?
Scientific
Research
papers
Literature search;
Sorting or rank-
ordering
Views/ Qsorts
2)
Which of the methods can I use and
why to observe and describe corporate
culture elements in reality?
Scientific
Research
papers
Factor analysis
Factor/ Value
system’s arrays
3)
What are the findings for the operant
value systems in the Swedish cadastral
post merger?
Factor/ Value
system’s arrays
Logic of
abduction
Crib sheets
Narratives
What are the findings for operant value
systems of the Swedish land registration
in the premerger?
Factor/ Value
system’s arrays
Logic of
abduction
Crib sheets
Narratives
What are the findings for the operant
value systems of the Swedish cadastre in
the premerger?
Factor /Value
system’s arrays
Logic of
abduction
Crib sheets
Narratives
4) How can the post merger operant values
be differentiated from the premerger
values?
Factor /Value
system’s arrays
Inspection of the
value systems
(Comparison)
Value systems'
matrices
Comparison
Clusters
How much do the post merger operant
value systems relate to either the land
registration or the cadastre components
of the premerger?
Factor /Value
system’s arrays
Narratives
Inspection of the
value systems
(Comparison)
Similarities
Differences
Shifts
Which cases are likely to have had a
change and how can I observe the
changes?
Factor /Value
system’s arrays
Inspection of the
value systems
Plotting of
changes
Aspects of
change
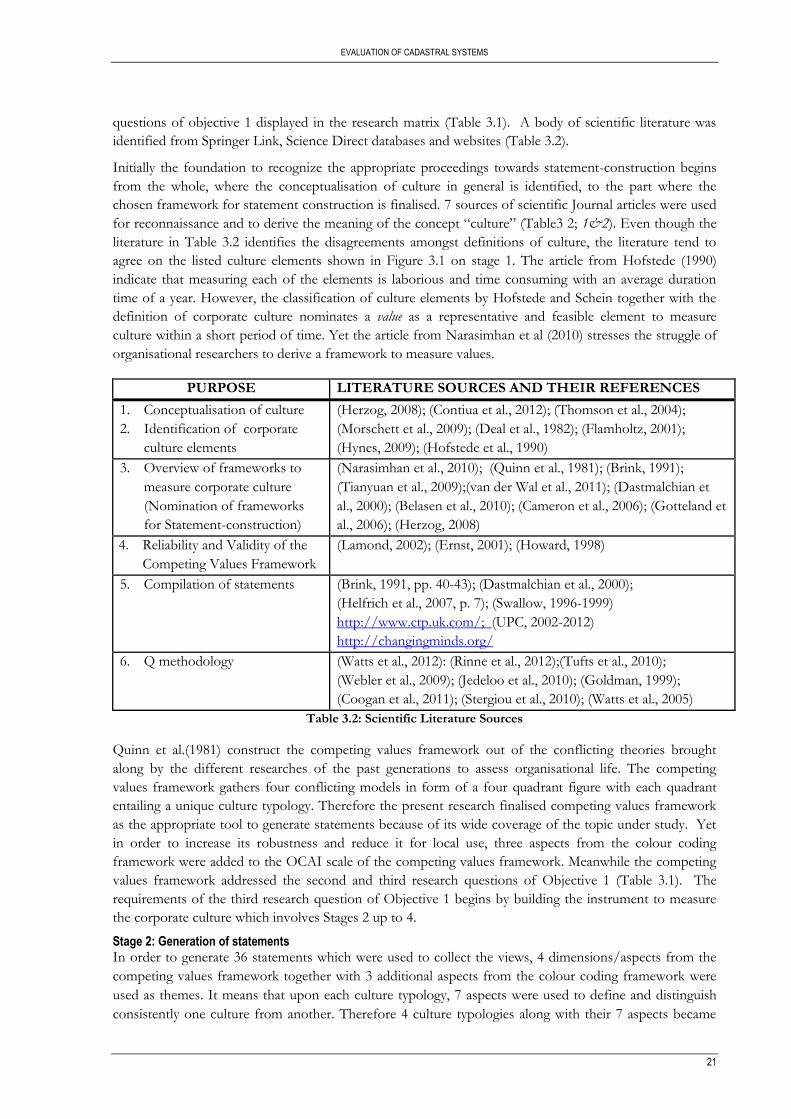
EVALUATION OF CADASTRAL SYSTEMS
21
questions of objective 1 displayed in the research matrix (Table 3.1). A body of scientific literature was
identified from Springer Link, Science Direct databases and websites (Table 3.2).
Initially the foundation to recognize the appropriate proceedings towards statement-construction begins
from the whole, where the conceptualisation of culture in general is identified, to the part where the
chosen framework for statement construction is finalised. 7 sources of scientific Journal articles were used
for reconnaissance and to derive the meaning of the concept “culture” (Table3 2; 1&2). Even though the
literature in Table 3.2 identifies the disagreements amongst definitions of culture, the literature tend to
agree on the listed culture elements shown in Figure 3.1 on stage 1. The article from Hofstede (1990)
indicate that measuring each of the elements is laborious and time consuming with an average duration
time of a year. However, the classification of culture elements by Hofstede and Schein together with the
definition of corporate culture nominates a value as a representative and feasible element to measure
culture within a short period of time. Yet the article from Narasimhan et al (2010) stresses the struggle of
organisational researchers to derive a framework to measure values.
PURPOSE LITERATURE SOURCES AND THEIR REFERENCES
1. Conceptualisation of culture
2. Identification of corporate
culture elements
(Herzog, 2008); (Contiua et al., 2012); (Thomson et al., 2004);
(Morschett et al., 2009); (Deal et al., 1982); (Flamholtz, 2001);
(Hynes, 2009); (Hofstede et al., 1990)
3. Overview of frameworks to
measure corporate culture
(Nomination of frameworks
for Statement-construction)
(Narasimhan et al., 2010); (Quinn et al., 1981); (Brink, 1991);
(Tianyuan et al., 2009);(van der Wal et al., 2011); (Dastmalchian et
al., 2000); (Belasen et al., 2010); (Cameron et al., 2006); (Gotteland et
al., 2006); (Herzog, 2008)
4. Reliability and Validity of the
Competing Values Framework
(Lamond, 2002); (Ernst, 2001); (Howard, 1998)
5. Compilation of statements (Brink, 1991, pp. 40-43); (Dastmalchian et al., 2000);
(Helfrich et al., 2007, p. 7); (Swallow, 1996-1999)
http://www.ctp.uk.com/; (UPC, 2002-2012)
http://changingminds.org/
6. Q methodology (Watts et al., 2012): (Rinne et al., 2012);(Tufts et al., 2010);
(Webler et al., 2009); (Jedeloo et al., 2010); (Goldman, 1999);
(Coogan et al., 2011); (Stergiou et al., 2010); (Watts et al., 2005)
Table 3.2: Scientific Literature Sources
Quinn et al.(1981) construct the competing values framework out of the conflicting theories brought
along by the different researches of the past generations to assess organisational life. The competing
values framework gathers four conflicting models in form of a four quadrant figure with each quadrant
entailing a unique culture typology. Therefore the present research finalised competing values framework
as the appropriate tool to generate statements because of its wide coverage of the topic under study. Yet
in order to increase its robustness and reduce it for local use, three aspects from the colour coding
framework were added to the OCAI scale of the competing values framework. Meanwhile the competing
values framework addressed the second and third research questions of Objective 1 (Table 3.1). The
requirements of the third research question of Objective 1 begins by building the instrument to measure
the corporate culture which involves Stages 2 up to 4.
Stage 2: Generation of statements
In order to generate 36 statements which were used to collect the views, 4 dimensions/aspects from the
competing values framework together with 3 additional aspects from the colour coding framework were
used as themes. It means that upon each culture typology, 7 aspects were used to define and distinguish
consistently one culture from another. Therefore 4 culture typologies along with their 7 aspects became
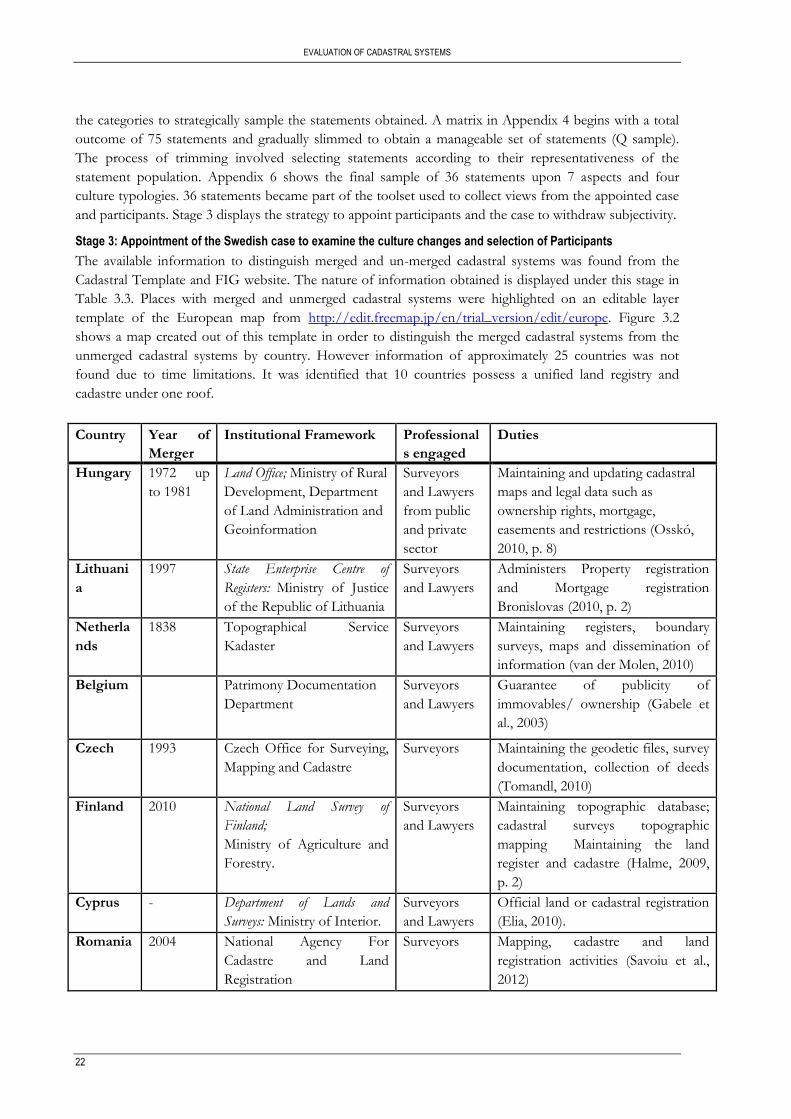
EVALUATION OF CADASTRAL SYSTEMS
22
the categories to strategically sample the statements obtained. A matrix in Appendix 4 begins with a total
outcome of 75 statements and gradually slimmed to obtain a manageable set of statements (Q sample).
The process of trimming involved selecting statements according to their representativeness of the
statement population. Appendix 6 shows the final sample of 36 statements upon 7 aspects and four
culture typologies. 36 statements became part of the toolset used to collect views from the appointed case
and participants. Stage 3 displays the strategy to appoint participants and the case to withdraw subjectivity.
Stage 3: Appointment of the Swedish case to examine the culture changes and selection of Participants
The available information to distinguish merged and un-merged cadastral systems was found from the
Cadastral Template and FIG website. The nature of information obtained is displayed under this stage in
Table 3.3. Places with merged and unmerged cadastral systems were highlighted on an editable layer
template of the European map from http://edit.freemap.jp/en/trial_version/edit/europe. Figure 3.2
shows a map created out of this template in order to distinguish the merged cadastral systems from the
unmerged cadastral systems by country. However information of approximately 25 countries was not
found due to time limitations. It was identified that 10 countries possess a unified land registry and
cadastre under one roof.
Country Year of
Merger
Institutional Framework Professional
s engaged
Duties
Hungary 1972 up
to 1981
Land Office; Ministry of Rural
Development, Department
of Land Administration and
Geoinformation
Surveyors
and Lawyers
from public
and private
sector
Maintaining and updating cadastral
maps and legal data such as
ownership rights, mortgage,
easements and restrictions (Osskó,
2010, p. 8)
Lithuani
a
1997 State Enterprise Centre of
Registers: Ministry of Justice
of the Republic of Lithuania
Surveyors
and Lawyers
Administers Property registration
and Mortgage registration
Bronislovas (2010, p. 2)
Netherla
nds
1838 Topographical Service
Kadaster
Surveyors
and Lawyers
Maintaining registers, boundary
surveys, maps and dissemination of
information (van der Molen, 2010)
Belgium Patrimony Documentation
Department
Surveyors
and Lawyers
Guarantee of publicity of
immovables/ ownership (Gabele et
al., 2003)
Czech 1993 Czech Office for Surveying,
Mapping and Cadastre
Surveyors Maintaining the geodetic files, survey
documentation, collection of deeds
(Tomandl, 2010)
Finland 2010 National Land Survey of
Finland;
Ministry of Agriculture and
Forestry.
Surveyors
and Lawyers
Maintaining topographic database;
cadastral surveys topographic
mapping Maintaining the land
register and cadastre (Halme, 2009,
p. 2)
Cyprus - Department of Lands and
Surveys: Ministry of Interior.
Surveyors
and Lawyers
Official land or cadastral registration
(Elia, 2010).
Romania 2004 National Agency For
Cadastre and Land
Registration
Surveyors Mapping, cadastre and land
registration activities (Savoiu et al.,
2012)
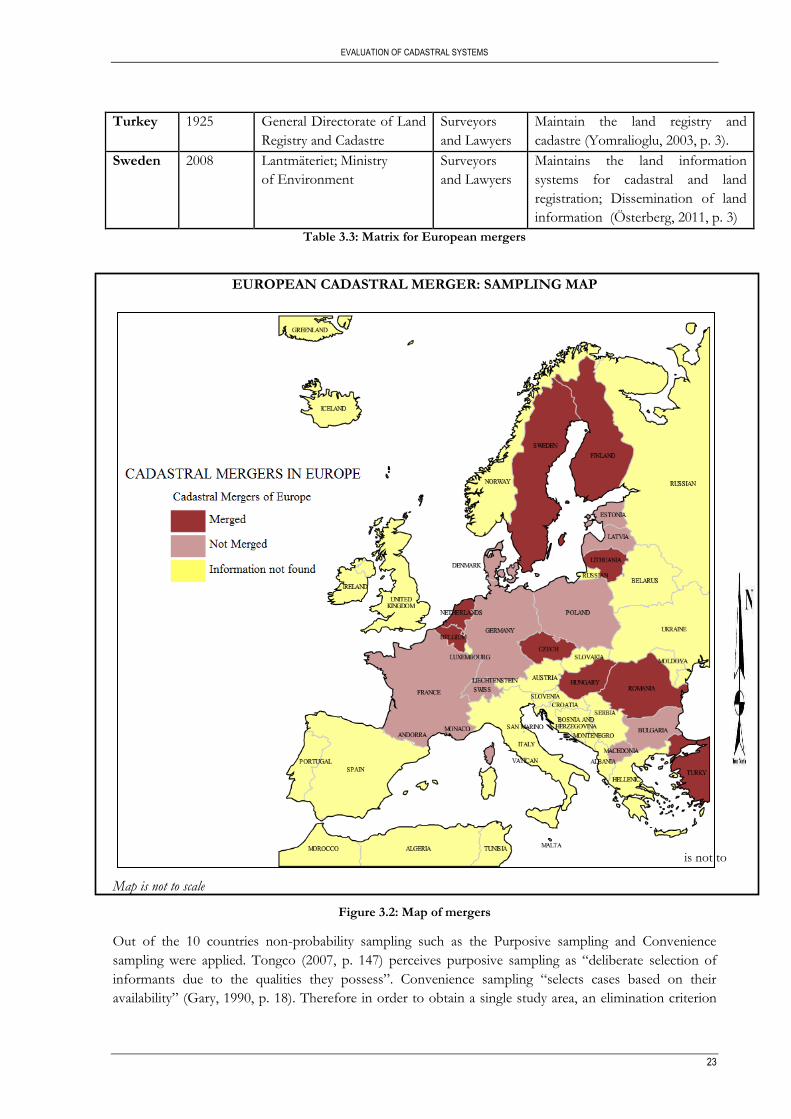
EVALUATION OF CADASTRAL SYSTEMS
23
Turkey 1925 General Directorate of Land
Registry and Cadastre
Surveyors
and Lawyers
Maintain the land registry and
cadastre (Yomralioglu, 2003, p. 3).
Sweden 2008 Lantmäteriet; Ministry
of Environment
Surveyors
and Lawyers
Maintains the land information
systems for cadastral and land
registration; Dissemination of land
information (Österberg, 2011, p. 3)
Table 3.3: Matrix for European mergers
EUROPEAN CADASTRAL MERGER: SAMPLING MAP
Map is not to scale
Figure 3.2: Map of mergers
Out of the 10 countries non-probability sampling such as the Purposive sampling and Convenience
sampling were applied. Tongco (2007, p. 147) perceives purposive sampling as “deliberate selection of
informants due to the qualities they possess”. Convenience sampling “selects cases based on their
availability” (Gary, 1990, p. 18). Therefore in order to obtain a single study area, an elimination criterion
is not to
EVALUATION OF CADASTRAL SYSTEMS
24
involved duration of the merger, availability of information and convenience e.g. how accessible the
professionals are. Countries like Hungary, Lithuania, Netherlands, Czech and Turkey were screened off
because of the long life span of the merger despite that they have both surveyors and lawyers. Finland and
Romania were screened because of inconvenience to the participants. Eventually Sweden was nominated
on the basis that informants or participants were accessible and the merger is also recent. The Swedish
merger of the land registration and cadastre occurred in 2008. The history of the cadastre and land
registration is outlined in Section 1.3.1.
In order to access participants from the Swedish cadastral system, both purposive and convenience
sampling were applied. Two surveyors were contacted to recruit surveyors and legal expertise with
knowledgeable backgrounds of English language from the top management, middle management and
operational level Figure 3.1: Stage 3. The contacts were requested to engage participants from the merger
and those cadastral professionals who have not experienced the cadastral merger. 16 participants turned
for the interview to sort for the cadastral merger while for the premerger only 3 participants turned out.
The premerger lacked attendance to the extent that only 2 participants from the Swedish cadastral merger
opted to evaluate the land registration and cadastre based on memories of their past before the merger.
The third participant with policy making experience offered to evaluate for the premerger states of the
cadastre and the land registration.
Stergiou et al (2010, p. 314) states that “in small sample Q studies the number of statements is a function
of the individuals taking part in the study and hence the statements can be twice as the number of the
individuals” . Hence according to this reasoning it can be regarded that the ideal number of participants to
evaluate the merger were supposed to be 18 which also apply for each premerger state. Thus the total
participants were supposed to 54. Typically participants are regarded to range from 40 to 60 (Stergiou et
al., 2010). However, due to lack of willing participants coupled with limited time, English illiteracy and a
constricted budget for extending fieldwork period, only 16 participants evaluating the merger and 3
participants evaluating the premerger were found. It was even more difficult to find participants from
outside Lantmäteriet. Yet Watts et al.(2005, p. 79) stress the best statistical eloquence behind fewer
participants. They state that the “range of 40-60 is only a rule of thumb hence far fewer participants can
produce a highly effective Q study” Watts et al.(2005, p. 79). They also assert that fewer participants yield
quality on the outcome and yet still consistency and pattern can still be detected even though the “breadth
of views might be limited”(Webler et al., 2009, p. 9). Therefore, the rank ordering process with the
participants at hand progressed as stated in Stage 4.
Stage 4: Rank ordering or Sorting of statements
The final sample of statements is not an end in itself because it does not carry meaning before rank
ordering. Therefore a forced distribution chart with 36 boxes and a scale ranging from +5 (strongly agree),
through 0 (neutral) up to -5 (strongly disagree) was designed to accompany the statements. The extreme
parts of the scale, +5 and -5 consisted of only one box each, in order to strain out the feel of the
participant’s evaluation. The neutral part consisted of 6 boxes for 6 statements. Therefore the forced
distribution chart became an important part of the toolbox where participants expressed their views.
Figure 3.1 shows that for each participant out of 19 participants, a protocol defining a set of instructions
was issued out before commencing the sorting exercise (Appendix 2). Each participant was left to read the
instructions first. The protocol’s function was to maintain the consistence of instructions for each
participant. Meanwhile the protocol also collected each participant’s personal profile and preliminarily
introduced the sorting exercise to each participant. The interviewer also briefed the purpose of the
meeting and highlighted on the requirement to place each statement on a single box as shown in Figure
3.3.
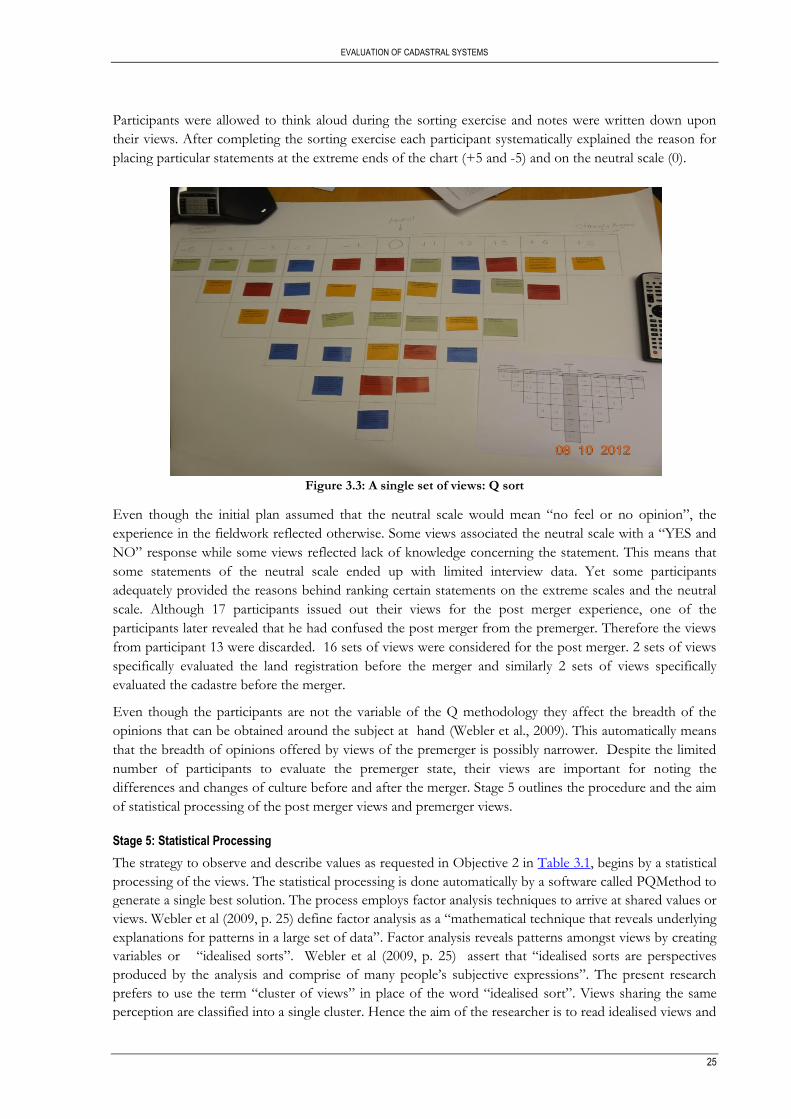
EVALUATION OF CADASTRAL SYSTEMS
25
Participants were allowed to think aloud during the sorting exercise and notes were written down upon
their views. After completing the sorting exercise each participant systematically explained the reason for
placing particular statements at the extreme ends of the chart (+5 and -5) and on the neutral scale (0).
Figure 3.3: A single set of views: Q sort
Even though the initial plan assumed that the neutral scale would mean “no feel or no opinion”, the
experience in the fieldwork reflected otherwise. Some views associated the neutral scale with a “YES and
NO” response while some views reflected lack of knowledge concerning the statement. This means that
some statements of the neutral scale ended up with limited interview data. Yet some participants
adequately provided the reasons behind ranking certain statements on the extreme scales and the neutral
scale. Although 17 participants issued out their views for the post merger experience, one of the
participants later revealed that he had confused the post merger from the premerger. Therefore the views
from participant 13 were discarded. 16 sets of views were considered for the post merger. 2 sets of views
specifically evaluated the land registration before the merger and similarly 2 sets of views specifically
evaluated the cadastre before the merger.
Even though the participants are not the variable of the Q methodology they affect the breadth of the
opinions that can be obtained around the subject at hand (Webler et al., 2009). This automatically means
that the breadth of opinions offered by views of the premerger is possibly narrower. Despite the limited
number of participants to evaluate the premerger state, their views are important for noting the
differences and changes of culture before and after the merger. Stage 5 outlines the procedure and the aim
of statistical processing of the post merger views and premerger views.
Stage 5: Statistical Processing
The strategy to observe and describe values as requested in Objective 2 in Table 3.1, begins by a statistical
processing of the views. The statistical processing is done automatically by a software called PQMethod to
generate a single best solution. The process employs factor analysis techniques to arrive at shared values or
views. Webler et al (2009, p. 25) define factor analysis as a “mathematical technique that reveals underlying
explanations for patterns in a large set of data”. Factor analysis reveals patterns amongst views by creating
variables or “idealised sorts”. Webler et al (2009, p. 25) assert that “idealised sorts are perspectives
produced by the analysis and comprise of many people’s subjective expressions”. The present research
prefers to use the term “cluster of views” in place of the word “idealised sort”. Views sharing the same
perception are classified into a single cluster. Hence the aim of the researcher is to read idealised views and
EVALUATION OF CADASTRAL SYSTEMS
26
write a narrative describing each of them in order to compose readable perspectives or values (Webler et
al., 2009, p. 25). Figure 3.1 show the technical process of factor analysis involved.
The technical process begins by inputting a text file of statements and collected views. Thereafter Principal
Component Analysis is engaged to identify the commonality and specificity of views (Webler et al., 2009).
The technique of principal component analysis generates a table of Eigen values. The aim of the Eigen
values is to qualify the statistical strength and explanatory power of a single cluster of views. (Watts et al.,
2012) asserts that clusters of views to be considered must have a magnitude of more than 1. The next step
involves the extraction of those clusters whose Eigen values are greater than 1. The process to judge and
decide upon the number of clusters to be extracted is called Rotation (Webler et al., 2009). The aim of
rotation is to come up with the best solution by generating the number of clusters as guided by Eigen
values and specifying the position of each individual view in a single cluster. The solution is a matrix
reflecting the degree of relationship existing between a single set of views with each cluster of views
through a correlation. The next step involves marking the views which best approximate each cluster
using a threshold determined by equation 6 below:
Threshold value = +2.5 (1/√n) where n=number of “view sets” involved in the sorting process…………………….. (6)
After the software has identified views which closely approximates each cluster, the weighted averaging
automatically generates the best fit set of views based on the marked views. The output text file shows the
best fit arrays which is automatically the shared perceptions identified by statistical operations of factor
analysis. The output text file also contains the correlation matrix and the cluster of views which shows the
best approximating views on every cluster. However the best fit arrays is the ultimate and final solution for
Objective 2 (see Table 3.1), although the Chapter 4 gradually presents the results using the correlation
matrix and the cluster of values. The aim is to demonstrate the derivation of the solution.
Chapter 4 presents the results obtained based on this procedure. The statistical processing is done first for
the post merger, followed by the cadastre component and then lastly the land registration component.
Three sets of best fit arrays will be generated specifically for the post merger, the land registration and the
cadastre. Simultaneously each part will have its own cluster of views. Thus best fit arrays helps derive the
value systems for each of the research questions of Objective 3 through crib sheets and narrations.
According to Watts et al (2012) a crib sheet is a template aiming to gain a holistic overview through
extracting meaning along subtopics that capture; (1) extreme scores (extremely positive and negative); (2)
highly emphasised scores on the particular array relative to its companion arrays; (3) lowly emphasised
scores on that particular array relative its companion arrays. The aim of the crib sheet is to consistently
derive and crystallise meaning for each array. The technique avoids eliminating some meaning from the
statements and their arrays.
After obtaining the value systems from the post merger and each of the premerger components, the next
phase involves comparison of each premerger component to the post merger values. The comparison
strategically resumes from the present to the past. Therefore the technique to identify the changes involves
adding premerger views to the post merger views and identifying the impact the impact they cause. Their
influence automatically is culture change and likewise the processing of each integration is done in a
similar fashion like the post merger. Chapter 4 details and explains the derivation of empirical results.
Therefore Chapter 4 ends by responding systematically to the Objective 4 (see Table 3.1).
3.4. Conclusion
The objective of this chapter was to reflect on the data collection strategy which involved answering the
research question “How can the classified corporate culture element/s be measured?” The preferred
methodology applied to measure corporate culture values is Q methodology. The methodology is good
when there are limited numbers of participants. Moreover the methodology is best known for
EVALUATION OF CADASTRAL SYSTEMS
27
withdrawing human subjectivity which happens to be the fundamental considerable feature to measure
values. The methodology employs statements to withdraw subjectivity. Each participant ranks statements
on a forced distribution scale upon his/her opinions. Thus 36 statements were used to withdraw
subjectivity or views from a purposively sampled set of participants convenient to the researcher. The
good part of Q methodology when constructing statements is that it emphasises building statements from
a broad coverage of the study. Thereafter a strategic sampling of the statements builds up the final sample.
Therefore the views obtained from participants actually reveal the shared perception of the population of
views. In that manner statements constitute a sample of a wide collection of communicability while rank
ordering gives the statements the actual position relative to their existence in the organisational context.
Eventually, the views collected lead to the determination of values that are present within the specified
cadastral system. The limitation is that the extent of the population of statements designed for rank
ordering cannot be claimed to adequately cover the whole communicability of culture.
The good part of Q methodology for rank ordering is that it triangulates the qualitative and quantitative
research and hence possesses a hybrid of qualitative and quantitative strengths. For instance the statistical
rank ordering phase does not go in vain without eliciting the meaning behind the opinions expressed by
participants on the forced distribution chart. The forced distribution itself withdraws subjectivity by
forcing the participants to give preference to their options. Therefore highly and lowly emphasised
preferences are displayed. The limitation encountered in the rank ordering process was that participants
complained that the process was strenuous and the boxes for ranking gave them limited freedom to
express flexibly their views. However the same participants turned to like the process eventually.
Q methodology constitutes a regulated statistical process where rank ordering is kept consistent by use of
a protocol on every participant. Q methodology possesses a systematic and methodical statistical
investigative procedure to reveal underlying distinctive patterns of the massive data set. Eventually the
methodology embraces the inductive consistent logic to convey meaning of the Q methodology results by
lacing qualitative narratives to crystallise the statistical results of Q methodology. Therefore Q
methodology offers clearly defined steps and these can be repeated with the same set of objectives and
research questions in a different cadastral system or even at a different time in the same cadastral system.
By this repetition of collecting views it means a pool of value systems can be created and their quality and
meaning compared. Q methodology creates a platform to gather data that can eventually be generalised to
a larger population of views after several measurements. Moreover, the statistical processing excludes the
researcher’s bias by shielding the output results from own subjectivity/thinking. There is a higher degree
to preserve the participants’ original subjectivity or views. Hence the present research applies Q
methodology as a tool to measure the corporate culture elements: values, but it realises the disadvantages of
Q methodology.
Even though a diverse range of views is unveiled, these views cannot be generalised to people populations.
Q methodology results do not consider the people proportion or causal relationships between variables.
However these weaknesses are taken into account as research proceeds to pursue Q methodology based
on the strengths mentioned. The measurement of values engaged participants from the Swedish cadastral
system because of easy availability and convenience of the participants. Moreover, the Swedish cadastral
merger is also recent. However other cases such as Finland and Romania could be equally evaluated to
guard content validity yet time was limited to pay attention to other cases.
The second objective of the chapter calls an answer for the research question: “Which of the methods can
I use to observe and describe corporate culture elements in reality?” In order to observe and describe
corporate culture elements in reality, Q methodology employs factor analysis. Thereafter narrations of the
best fit set of arrays based on the crib sheets constructed (Appendix 7 to 9) are used to describe corporate
culture elements. Chapter 4 present the empirical results at the same time reveal the means of processing.
EVALUATION OF CADASTRAL SYSTEMS
28
4. VIEWS AND OPERANT VALUES IN THE SWEDISH
CADASTRAL SYSTEM
4.1. Introduction
This chapter addresses four research questions from sub-objective 3 and 4. The specific research
questions referred to are stated as follows; (1) “what are the findings for the operant value systems in the
Swedish cadastral post merger?”; “what are the findings for the operant value systems in the Swedish
cadastre before the merger?” what are the findings for operant value systems in the Swedish land
registration before the merger?”; “how can one differentiate the operant beliefs during the post merger
and the operant beliefs during the premerger?”; “how much do the post merger operant value systems
relate to either the land registration or the cadastre components of the premerger?”; “which cases are
likely to have had a change and how can I observe the changes?” In order to answer these research
questions, the empirical views are processed according to the procedure outlined by Webler et al.(2009)
and Watts et al (2012) as explained in Chapter 3. Therefore this chapter first presents results on the
operant value systems of the post merger state and then presents the operant value systems in the
premerger states of the cadastre and land registration as required by the research questions. The operant
value systems of the post merger state are presented gradually in Section 4.2 from three products namely
the correlation matrix, value systems’ matrix and value systems’ arrays. Section 4.3 presents the procedure
to derive the premerger states. The same section continues to present the operant value systems of the
premerger. Section 4.4 proceeds to compare the value systems emerging from the post merger and each
of the premerger states. Section 4.5 is the concluding section.
4.2. Postmerger state
According to Stergiou et al (2010, p. 315) ideally “Q studies function with 40 to 60 participants” yet Watts
et al (2005, p. 79) tend to conflict by asserting that “employing a larger sample of participants poses the
danger of negating many of the complexities and fine distinctions contained in the data”. A smaller sample
of participants elevates quality and consistency of the output and distinctive patterns can still be obtained
(Watts et al., 2005).
The post merger value system is produced from the statistical processing of views expressed by 16
cadastral professionals. 15 cadastral professionals are from the Swedish cadastral system while 1 cadastral
expert is from the Netherlands cadastral system. Each set of views is a fundamental input of the value
system. Thus 16 sets of views form the value system of the post merger which remains clumsy and raw
before the statistical processing. After processing the views three products gradually explain the variation
of the views by first pitching the relationship existing between the views, followed by identifying the
groups of views existing until the revelation of the specific elements forming the groups. As a matter of
recap, a series of 36 statements were presented before 16 participants from whom each of the participant’s
views was expressed. Thus the thinking variation forms the difference and similarities of views. The
present section’s interest is to acquire that which is shared in the post merger. Thus the most prominent
strength of a value is to present that which is shared in the midst of views. Therefore to arrive on specific
values the statistical processing presents a correlation matrix, followed by a grouping of the similar views
into categories of value systems and then the specification of the statements that formed the variation or
difference. From the statements arrays the narrations are modelled from the statements arrays.
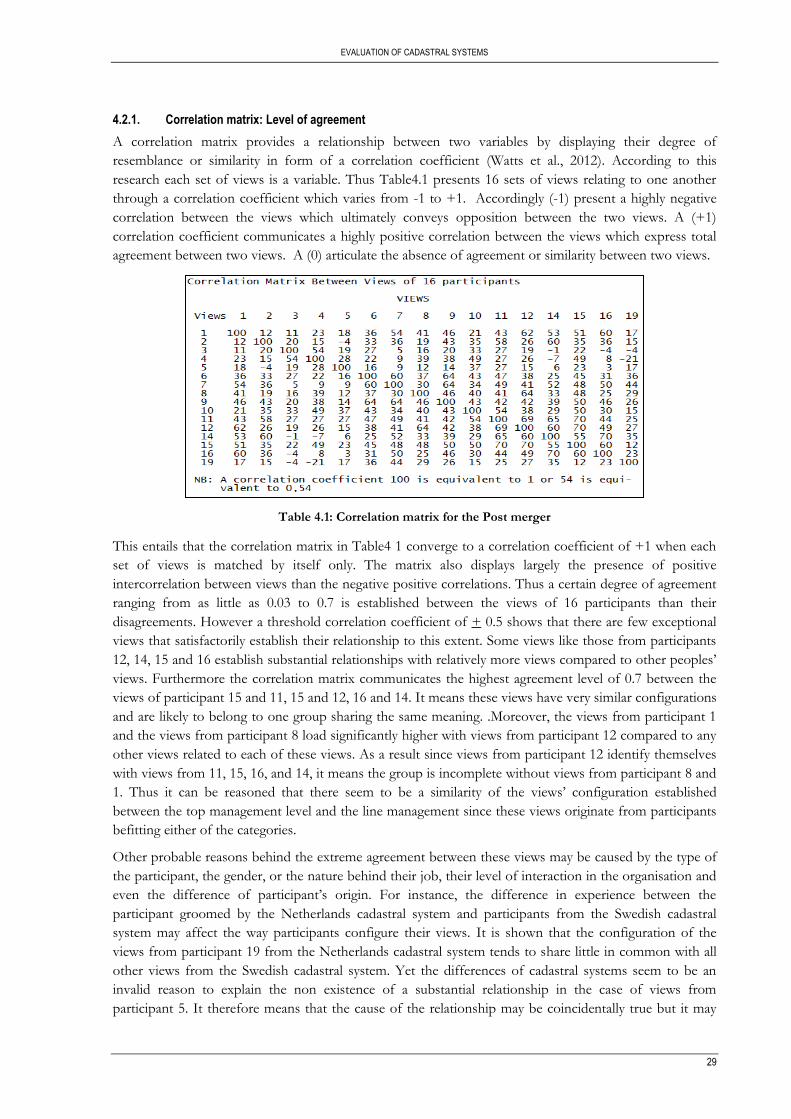
EVALUATION OF CADASTRAL SYSTEMS
29
4.2.1. Correlation matrix: Level of agreement
A correlation matrix provides a relationship between two variables by displaying their degree of
resemblance or similarity in form of a correlation coefficient (Watts et al., 2012). According to this
research each set of views is a variable. Thus Table4.1 presents 16 sets of views relating to one another
through a correlation coefficient which varies from -1 to +1. Accordingly (-1) present a highly negative
correlation between the views which ultimately conveys opposition between the two views. A (+1)
correlation coefficient communicates a highly positive correlation between the views which express total
agreement between two views. A (0) articulate the absence of agreement or similarity between two views.
Table 4.1: Correlation matrix for the Post merger
This entails that the correlation matrix in Table4 1 converge to a correlation coefficient of +1 when each
set of views is matched by itself only. The matrix also displays largely the presence of positive
intercorrelation between views than the negative positive correlations. Thus a certain degree of agreement
ranging from as little as 0.03 to 0.7 is established between the views of 16 participants than their
disagreements. However a threshold correlation coefficient of + 0.5 shows that there are few exceptional
views that satisfactorily establish their relationship to this extent. Some views like those from participants
12, 14, 15 and 16 establish substantial relationships with relatively more views compared to other peoples’
views. Furthermore the correlation matrix communicates the highest agreement level of 0.7 between the
views of participant 15 and 11, 15 and 12, 16 and 14. It means these views have very similar configurations
and are likely to belong to one group sharing the same meaning. .Moreover, the views from participant 1
and the views from participant 8 load significantly higher with views from participant 12 compared to any
other views related to each of these views. As a result since views from participant 12 identify themselves
with views from 11, 15, 16, and 14, it means the group is incomplete without views from participant 8 and
1. Thus it can be reasoned that there seem to be a similarity of the views’ configuration established
between the top management level and the line management since these views originate from participants
befitting either of the categories.
Other probable reasons behind the extreme agreement between these views may be caused by the type of
the participant, the gender, or the nature behind their job, their level of interaction in the organisation and
even the difference of participant’s origin. For instance, the difference in experience between the
participant groomed by the Netherlands cadastral system and participants from the Swedish cadastral
system may affect the way participants configure their views. It is shown that the configuration of the
views from participant 19 from the Netherlands cadastral system tends to share little in common with all
other views from the Swedish cadastral system. Yet the differences of cadastral systems seem to be an
invalid reason to explain the non existence of a substantial relationship in the case of views from
participant 5. It therefore means that the cause of the relationship may be coincidentally true but it may
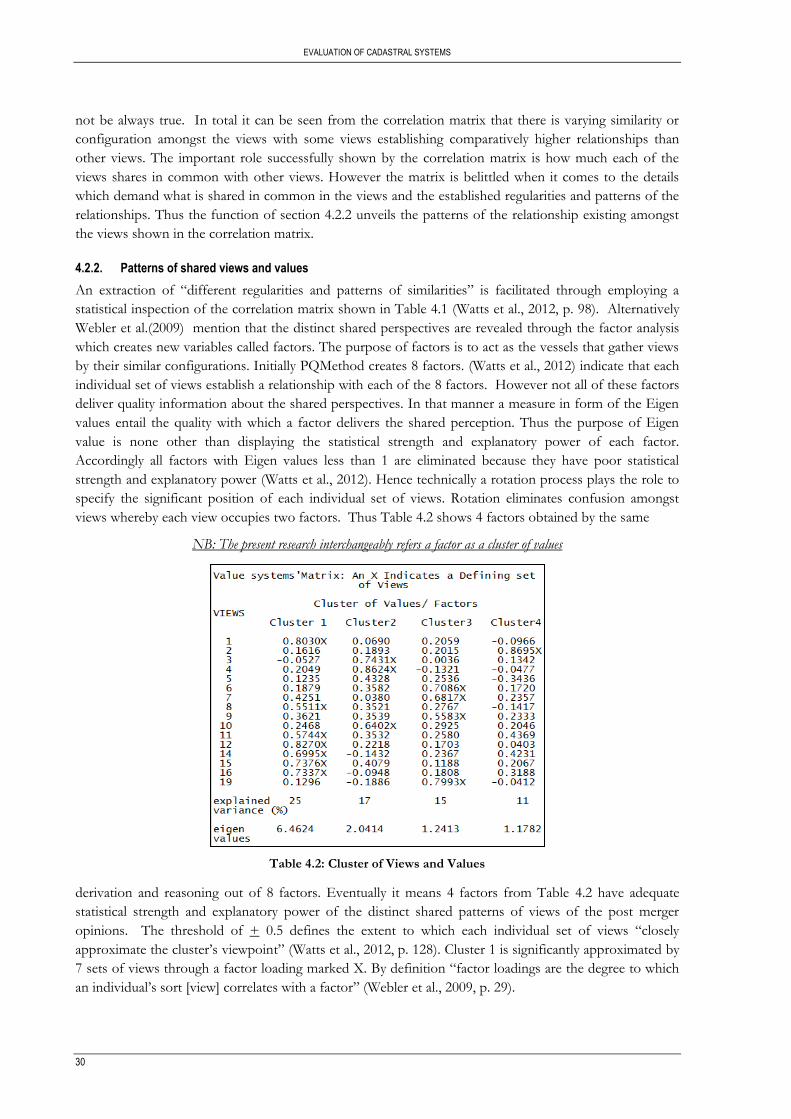
EVALUATION OF CADASTRAL SYSTEMS
30
not be always true. In total it can be seen from the correlation matrix that there is varying similarity or
configuration amongst the views with some views establishing comparatively higher relationships than
other views. The important role successfully shown by the correlation matrix is how much each of the
views shares in common with other views. However the matrix is belittled when it comes to the details
which demand what is shared in common in the views and the established regularities and patterns of the
relationships. Thus the function of section 4.2.2 unveils the patterns of the relationship existing amongst
the views shown in the correlation matrix.
4.2.2. Patterns of shared views and values
An extraction of “different regularities and patterns of similarities” is facilitated through employing a
statistical inspection of the correlation matrix shown in Table 4.1 (Watts et al., 2012, p. 98). Alternatively
Webler et al.(2009) mention that the distinct shared perspectives are revealed through the factor analysis
which creates new variables called factors. The purpose of factors is to act as the vessels that gather views
by their similar configurations. Initially PQMethod creates 8 factors. (Watts et al., 2012) indicate that each
individual set of views establish a relationship with each of the 8 factors. However not all of these factors
deliver quality information about the shared perspectives. In that manner a measure in form of the Eigen
values entail the quality with which a factor delivers the shared perception. Thus the purpose of Eigen
value is none other than displaying the statistical strength and explanatory power of each factor.
Accordingly all factors with Eigen values less than 1 are eliminated because they have poor statistical
strength and explanatory power (Watts et al., 2012). Hence technically a rotation process plays the role to
specify the significant position of each individual set of views. Rotation eliminates confusion amongst
views whereby each view occupies two factors. Thus Table 4.2 shows 4 factors obtained by the same
NB: The present research interchangeably refers a factor as a cluster of values
Table 4.2: Cluster of Views and Values
derivation and reasoning out of 8 factors. Eventually it means 4 factors from Table 4.2 have adequate
statistical strength and explanatory power of the distinct shared patterns of views of the post merger
opinions. The threshold of + 0.5 defines the extent to which each individual set of views “closely
approximate the cluster’s viewpoint” (Watts et al., 2012, p. 128). Cluster 1 is significantly approximated by
7 sets of views through a factor loading marked X. By definition “factor loadings are the degree to which
an individual’s sort [view] correlates with a factor” (Webler et al., 2009, p. 29).
EVALUATION OF CADASTRAL SYSTEMS
31
The high approximation marked with an X for views from Cluster1 coincidentally originate from top and
line management cadastral experts. Although the origin can be traced these results suffer from the
limitation that they cannot be proportioned to people or their professions. Therefore the position of
clustering views is only to show patterns of shared views and how much these views as a group explain the
variation of subjectivity. Thus Cluster1 is able to explain 25% of the distinct variation delivered by four
clusters.
3 sets of views closely approximate the shared meaning and perception of Cluster 2. As these views
approximate this cluster, they play a role to distinguish Cluster2 from any of the 4 clusters shown in Table
4.2. The cluster tends to explain 17 % of the variation existing cross 4 clusters. Accidentally these 3 sets of
views come from a few survey experts at operational level only. Yet the reasoning from Q methodology
does not crystallise the cause as related to people although long lasting friendship and companionship of
people can influence their thinking or opinions. Hence, even though Cluster 2 is approximated by
participants of the same professionals, their views just form a type of value existing in the post merger.
This means not all surveyors think in the same manner.
Cluster3 is distinguished from all other three clusters by 4 sets of views. Cluster 3 explains 15% of the
variation existing within these four clusters. Coincidentally, only participants with survey backgrounds
form significant approximating views of Cluster3. Similarly, these views cannot be generalised to all
surveyors but they exist to indicate the presence of a particular distinct type of values.
Finally, Cluster4 is distinguished from three clusters by one set of views. Inadvertently, the origin of the
views can be tracked from the top management level. Thus the purpose of Cluster 4, like all the clusters
discussed, identifies one of the value systems existing in the post merger. Cluster4 explains 11% of the
variation delivered by these four clusters.
The explanatory power of each cluster of values tends to deteriorate gradually from the first cluster to the
last cluster. However they all deliver the reliable information about each cluster. The total explanatory
strength of all 4 clusters accounts for 68% variance occurring in the correlation matrix in Table4 1. In
simple terms four clusters are able to explain only 68% of the differences and similarities existing amongst
the views shown by the correlation matrix in Table 4.1. It is important to note that the distinction and
similarities of views identified in Table4 2 does not sample the participants per se but samples the views.
One can reason and conclude that views in Table4 2 grouped themselves as influenced by the
organisational level since the dominant views clearly distinguish themselves accordingly. At the same time
the reasoning can be overridden by other reasons too. The most prominent aspect on hand is that there
are evidently four groups of value systems whose meaning is not known yet. Section 4.2.3 derive the
labels to each value system presented in Figure 4.1.
4.2.3. Cluster of value systems of the Post merger cadastral system.
The clusters of views and values displayed in Table4.2 forms the bridge to the final output containing
specified statements together with their respective scores as shown in Table 4.3. The arrays of statements
shown in Table 4.3 are derived from weighted averaging of significant views marked with an X for each
clusters of values in Table 4.2. Hence the scores are the best estimate obtained from the averaging of the
views significantly defining each cluster of values. The sufficient delivery and presentation of each cluster
of values is credited to Watts et al.(2012). Their form to present holistically each cluster employs the use
of crib sheets. A crib sheet is a consistent logic to extract the statements and their scores from the value
systems’ arrays shown in Table 4.3. Thus each cluster of values is modelled consistently by four headings
which are; (1) statements scoring +5; (2) statements ranking higher in that particular cluster of value
system than any other cluster; (3) statements ranking lower in that particular cluster of value system than
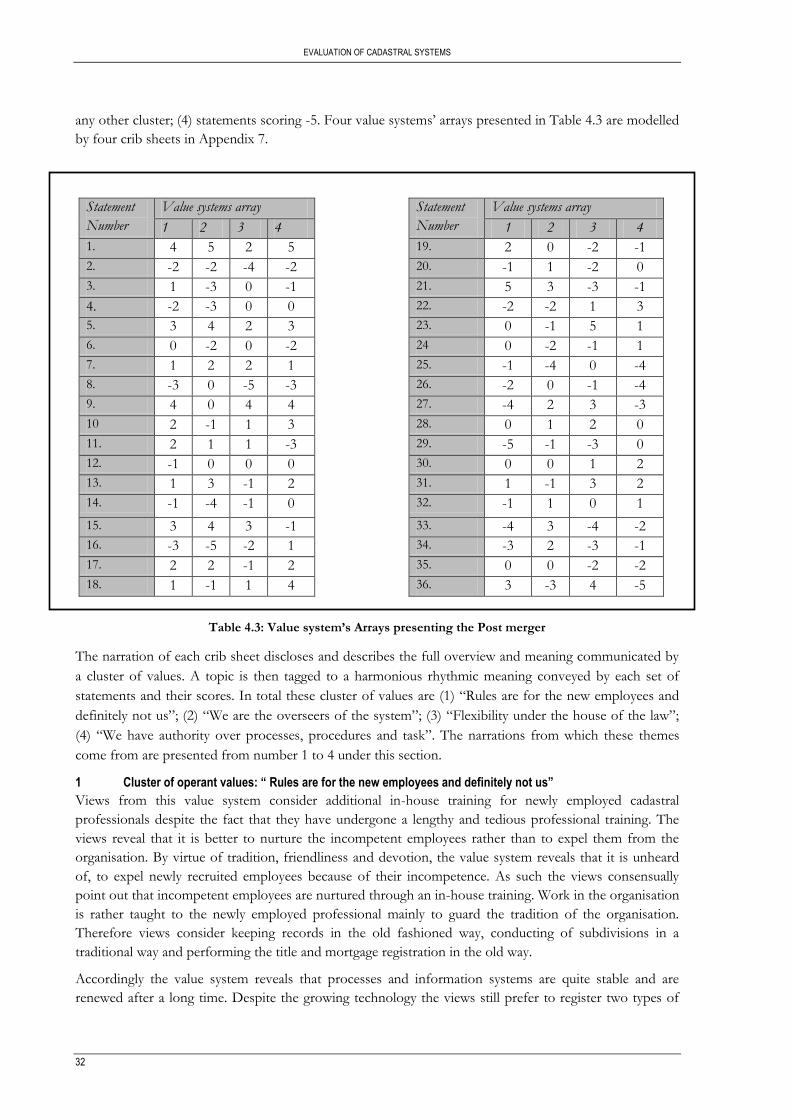
EVALUATION OF CADASTRAL SYSTEMS
32
any other cluster; (4) statements scoring -5. Four value systems’ arrays presented in Table 4.3 are modelled
by four crib sheets in Appendix 7.
Table 4.3: Value system’s Arrays presenting the Post merger
The narration of each crib sheet discloses and describes the full overview and meaning communicated by
a cluster of values. A topic is then tagged to a harmonious rhythmic meaning conveyed by each set of
statements and their scores. In total these cluster of values are (1) “Rules are for the new employees and
definitely not us”; (2) “We are the overseers of the system”; (3) “Flexibility under the house of the law”;
(4) “We have authority over processes, procedures and task”. The narrations from which these themes
come from are presented from number 1 to 4 under this section.
1 Cluster of operant values: “ Rules are for the new employees and definitely not us”
Views from this value system consider additional in-house training for newly employed cadastral
professionals despite the fact that they have undergone a lengthy and tedious professional training. The
views reveal that it is better to nurture the incompetent employees rather than to expel them from the
organisation. By virtue of tradition, friendliness and devotion, the value system reveals that it is unheard
of, to expel newly recruited employees because of their incompetence. As such the views consensually
point out that incompetent employees are nurtured through an in-house training. Work in the organisation
is rather taught to the newly employed professional mainly to guard the tradition of the organisation.
Therefore views consider keeping records in the old fashioned way, conducting of subdivisions in a
traditional way and performing the title and mortgage registration in the old way.
Accordingly the value system reveals that processes and information systems are quite stable and are
renewed after a long time. Despite the growing technology the views still prefer to register two types of
Statement
Number
Value systems array Statement
Number
Value systems array
1 2 3 4 1 2 3 4
1. 4 5 2 5 19. 2 0 -2 -1
2. -2 -2 -4 -2 20. -1 1 -2 0
3. 1 -3 0 -1 21. 5 3 -3 -1
4. -2 -3 0 0 22. -2 -2 1 3
5. 3 4 2 3 23. 0 -1 5 1
6. 0 -2 0 -2 24 0 -2 -1 1
7. 1 2 2 1 25. -1 -4 0 -4
8. -3 0 -5 -3 26. -2 0 -1 -4
9. 4 0 4 4 27. -4 2 3 -3
10 2 -1 1 3 28. 0 1 2 0
11. 2 1 1 -3 29. -5 -1 -3 0
12. -1 0 0 0 30. 0 0 1 2
13. 1 3 -1 2 31. 1 -1 3 2
14. -1 -4 -1 0 32. -1 1 0 1
15. 3 4 3 -1 33. -4 3 -4 -2
16. -3 -5 -2 1 34. -3 2 -3 -1
17. 2 2 -1 2 35. 0 0 -2 -2
18. 1 -1 1 4 36. 3 -3 4 -5
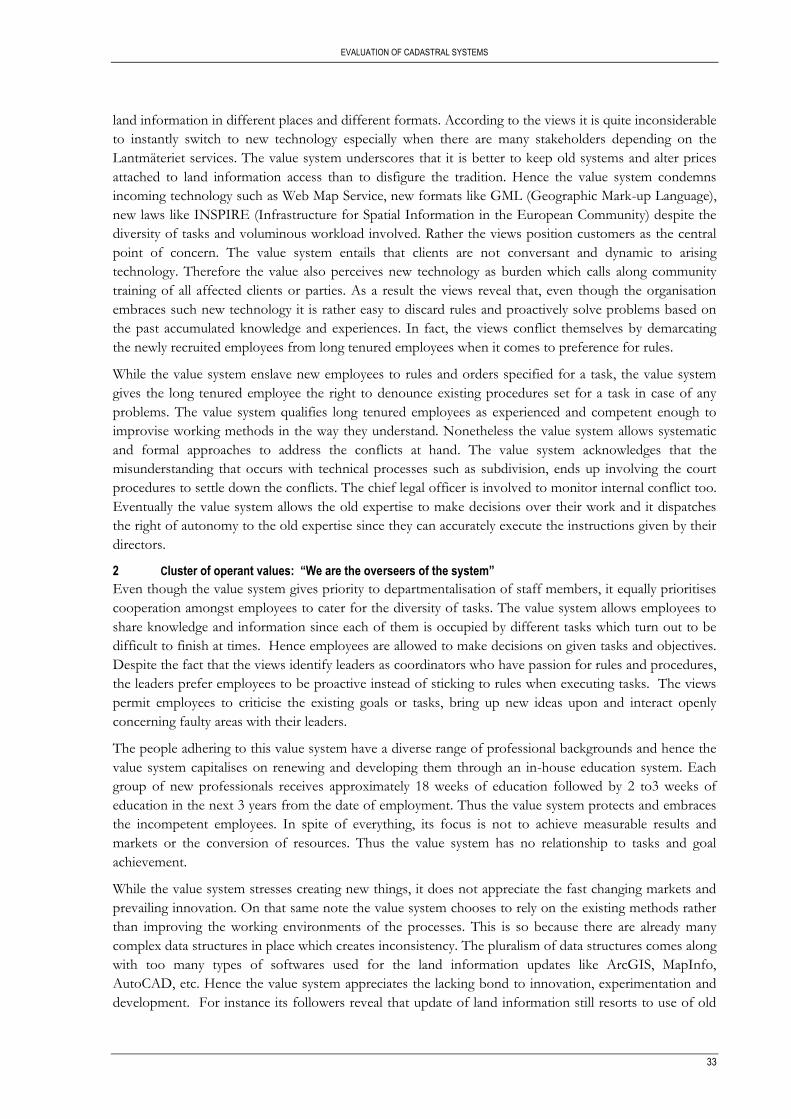
EVALUATION OF CADASTRAL SYSTEMS
33
land information in different places and different formats. According to the views it is quite inconsiderable
to instantly switch to new technology especially when there are many stakeholders depending on the
Lantmäteriet services. The value system underscores that it is better to keep old systems and alter prices
attached to land information access than to disfigure the tradition. Hence the value system condemns
incoming technology such as Web Map Service, new formats like GML (Geographic Mark-up Language),
new laws like INSPIRE (Infrastructure for Spatial Information in the European Community) despite the
diversity of tasks and voluminous workload involved. Rather the views position customers as the central
point of concern. The value system entails that clients are not conversant and dynamic to arising
technology. Therefore the value also perceives new technology as burden which calls along community
training of all affected clients or parties. As a result the views reveal that, even though the organisation
embraces such new technology it is rather easy to discard rules and proactively solve problems based on
the past accumulated knowledge and experiences. In fact, the views conflict themselves by demarcating
the newly recruited employees from long tenured employees when it comes to preference for rules.
While the value system enslave new employees to rules and orders specified for a task, the value system
gives the long tenured employee the right to denounce existing procedures set for a task in case of any
problems. The value system qualifies long tenured employees as experienced and competent enough to
improvise working methods in the way they understand. Nonetheless the value system allows systematic
and formal approaches to address the conflicts at hand. The value system acknowledges that the
misunderstanding that occurs with technical processes such as subdivision, ends up involving the court
procedures to settle down the conflicts. The chief legal officer is involved to monitor internal conflict too.
Eventually the value system allows the old expertise to make decisions over their work and it dispatches
the right of autonomy to the old expertise since they can accurately execute the instructions given by their
directors.
2 Cluster of operant values: “We are the overseers of the system”
Even though the value system gives priority to departmentalisation of staff members, it equally prioritises
cooperation amongst employees to cater for the diversity of tasks. The value system allows employees to
share knowledge and information since each of them is occupied by different tasks which turn out to be
difficult to finish at times. Hence employees are allowed to make decisions on given tasks and objectives.
Despite the fact that the views identify leaders as coordinators who have passion for rules and procedures,
the leaders prefer employees to be proactive instead of sticking to rules when executing tasks. The views
permit employees to criticise the existing goals or tasks, bring up new ideas upon and interact openly
concerning faulty areas with their leaders.
The people adhering to this value system have a diverse range of professional backgrounds and hence the
value system capitalises on renewing and developing them through an in-house education system. Each
group of new professionals receives approximately 18 weeks of education followed by 2 to3 weeks of
education in the next 3 years from the date of employment. Thus the value system protects and embraces
the incompetent employees. In spite of everything, its focus is not to achieve measurable results and
markets or the conversion of resources. Thus the value system has no relationship to tasks and goal
achievement.
While the value system stresses creating new things, it does not appreciate the fast changing markets and
prevailing innovation. On that same note the value system chooses to rely on the existing methods rather
than improving the working environments of the processes. This is so because there are already many
complex data structures in place which creates inconsistency. The pluralism of data structures comes along
with too many types of softwares used for the land information updates like ArcGIS, MapInfo,
AutoCAD, etc. Hence the value system appreciates the lacking bond to innovation, experimentation and
development. For instance its followers reveal that update of land information still resorts to use of old
EVALUATION OF CADASTRAL SYSTEMS
34
Geodatabase Alfa which was created specifically for the geometry part in 1988 followed by the textual part
created in 1972. For this reason the value system neglects the view whereby the leaders are seen as tough
and demanding but rather admits to identify these leaders as warm-hearted, cheerful and teachers.
3 Cluster of operant values: “Flexibility under the house of the law”
According to this value system it is a matter of choice to engage further education considering that
employees pursued a tedious and lengthy educational protocol. The views reveals a sense of security by
mentioning that no one is chased away for incompetence. Consequently the value system figures out the
harder part of education and chooses to isolate the role it plays. Alternatively, the value system fantasises
cooperation amongst its followers when it comes to task achievement. Furthermore it gives room for its
followers to share ideas and knowledge so that they complete the task within a reasonable time. Hence
the value system recognises its strong association with loyalty, cohesion and tradition.
According to the followers of this value system creating new things is not an option contributing to their
tradition. Yet the value system continues to apply a gradual change of the existing processes. Gradual
alterations of processes are all depicted by law which forms part of the tradition. However the alterations
of processes imply that the value system does not consider meeting standards and stability. In actual fact
the value system frequently reviews the existing processes consistently.
Another aspect characteristic to this value system is that it honours structure and rules. For instance while
the value system organises its followers into departments it prefers to have the lower offices execute
orders coming from higher offices. The professionals following this value system recognises the clear
distinction and the demand for adhering to procedures set for tasks implicated by the value system.
Moreover, the followers of this value system are led by appropriate rules, policies and guidelines yet the
followers choose not follow. The value system gives its followers the opportunity to raise conflicting
opinions concerning tasks at hand and also to bring on table exceptional ideas. The value system allows
frank communication between the lower levels and higher levels. In total the value system has rules but
hosts autonomy for its followers thus creating a freedom space for them.
4 Cluster of operant values 4: “we have authority over processes, procedures and task”
Even though in the past, the education offered by universities was synchronised to Lantmäteriet, presently
the universities provides a diverse range of cadastral programmes tailored for Surveying and Geomatics on
the market. The existing education is no more standardised according to the views of this value system.
Thus the value system employs an in-house training to harmonise different backgrounds into the needs of
Lantmäteriet. As a result, incompetent employees are nurtured and developed by an in-house training.
The value system promotes collaboration and disengages rules and innovation amongst employees as far
as task and goal achievement is concerned. Accordingly, competent employees transfer the knowledge to
the incompetent employees. After all, the views entail that leaders are not coordinators and therefore
employees are not enforced to follow rules. Instead the views express that tasks can be criticised, new
ideas raised and even decision made by the employees. Accordingly the views flexibly adjust processes
relative to dynamic human needs.
The aim posted by this value system is to achieve planned objectives and goals even though the leaders
involved are not coercive and instructive. Likewise the views specifically decline the legitimacy of
competition within the value system. This explains why the views impulsively relate the disengagement of
once a division of Lantmäteriet; METRIA. The division once belonged to Lantmäteriet functioning as a
commercial part that competed with the private sector. However the views reveal that its eviction is
mainly explained by its competitive positioning to the clients who happens to be recipient of land
information. The views specifically states that, it is inconsiderate and unethical for Lantmäteriet to
compete with the one they give information. However the value system recognises the importance to
adapt to dynamic markets and modernization.
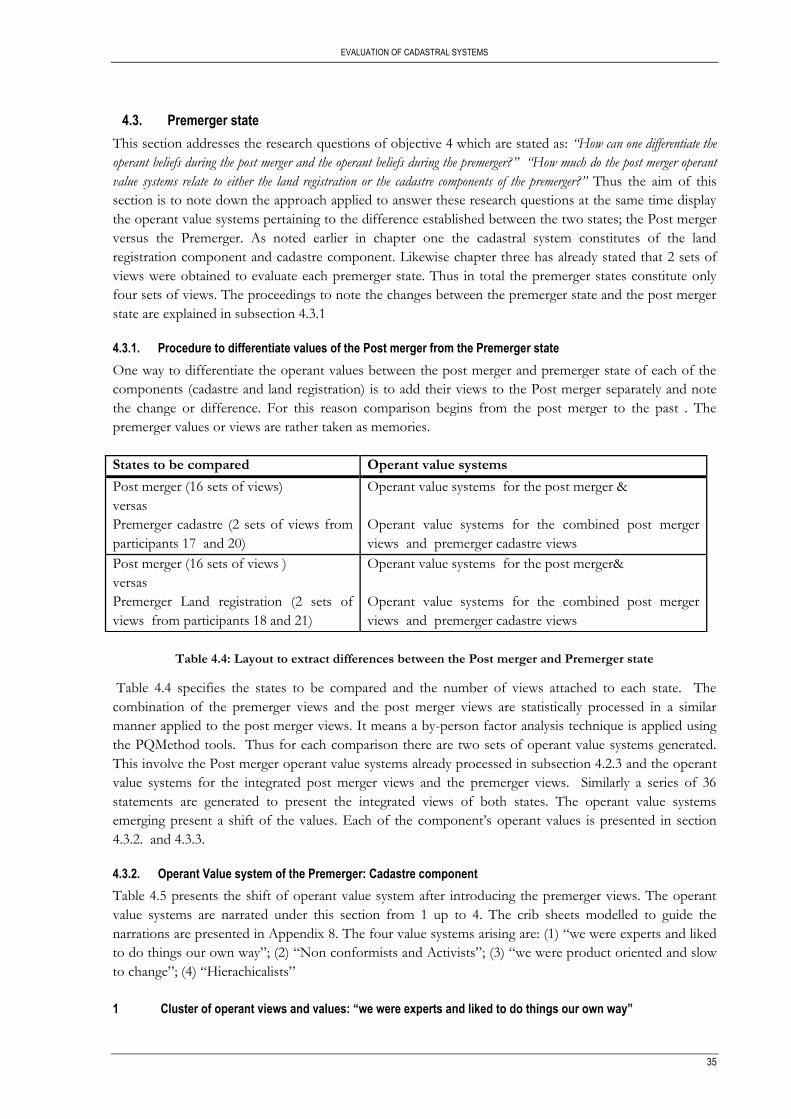
EVALUATION OF CADASTRAL SYSTEMS
35
4.3. Premerger state
This section addresses the research questions of objective 4 which are stated as: “How can one differentiate the
operant beliefs during the post merger and the operant beliefs during the premerger?” “How much do the post merger operant
value systems relate to either the land registration or the cadastre components of the premerger?” Thus the aim of this
section is to note down the approach applied to answer these research questions at the same time display
the operant value systems pertaining to the difference established between the two states; the Post merger
versus the Premerger. As noted earlier in chapter one the cadastral system constitutes of the land
registration component and cadastre component. Likewise chapter three has already stated that 2 sets of
views were obtained to evaluate each premerger state. Thus in total the premerger states constitute only
four sets of views. The proceedings to note the changes between the premerger state and the post merger
state are explained in subsection 4.3.1
4.3.1. Procedure to differentiate values of the Post merger from the Premerger state
One way to differentiate the operant values between the post merger and premerger state of each of the
components (cadastre and land registration) is to add their views to the Post merger separately and note
the change or difference. For this reason comparison begins from the post merger to the past . The
premerger values or views are rather taken as memories.
Table 4.4: Layout to extract differences between the Post merger and Premerger state
Table 4.4 specifies the states to be compared and the number of views attached to each state. The
combination of the premerger views and the post merger views are statistically processed in a similar
manner applied to the post merger views. It means a by-person factor analysis technique is applied using
the PQMethod tools. Thus for each comparison there are two sets of operant value systems generated.
This involve the Post merger operant value systems already processed in subsection 4.2.3 and the operant
value systems for the integrated post merger views and the premerger views. Similarly a series of 36
statements are generated to present the integrated views of both states. The operant value systems
emerging present a shift of the values. Each of the component’s operant values is presented in section
4.3.2. and 4.3.3.
4.3.2. Operant Value system of the Premerger: Cadastre component
Table 4.5 presents the shift of operant value system after introducing the premerger views. The operant
value systems are narrated under this section from 1 up to 4. The crib sheets modelled to guide the
narrations are presented in Appendix 8. The four value systems arising are: (1) “we were experts and liked
to do things our own way”; (2) “Non conformists and Activists”; (3) “we were product oriented and slow
to change”; (4) “Hierachicalists”
1 Cluster of operant views and values: “we were experts and liked to do things our own way”
States to be compared Operant value systems
Post merger (16 sets of views)
versas
Premerger cadastre (2 sets of views from
participants 17 and 20)
Operant value systems for the post merger &
Operant value systems for the combined post merger
views and premerger cadastre views
Post merger (16 sets of views )
versas
Premerger Land registration (2 sets of
views from participants 18 and 21)
Operant value systems for the post merger&
Operant value systems for the combined post merger
views and premerger cadastre views
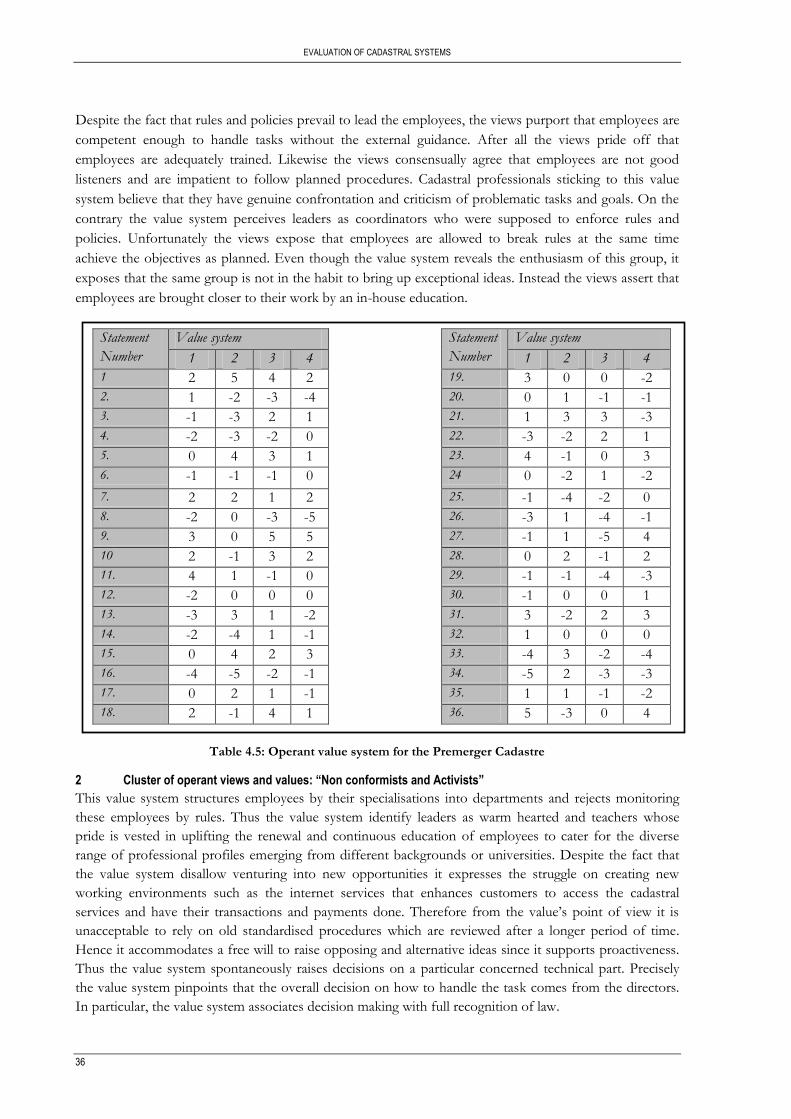
EVALUATION OF CADASTRAL SYSTEMS
36
Despite the fact that rules and policies prevail to lead the employees, the views purport that employees are
competent enough to handle tasks without the external guidance. After all the views pride off that
employees are adequately trained. Likewise the views consensually agree that employees are not good
listeners and are impatient to follow planned procedures. Cadastral professionals sticking to this value
system believe that they have genuine confrontation and criticism of problematic tasks and goals. On the
contrary the value system perceives leaders as coordinators who were supposed to enforce rules and
policies. Unfortunately the views expose that employees are allowed to break rules at the same time
achieve the objectives as planned. Even though the value system reveals the enthusiasm of this group, it
exposes that the same group is not in the habit to bring up exceptional ideas. Instead the views assert that
employees are brought closer to their work by an in-house education.
Table 4.5: Operant value system for the Premerger Cadastre
2 Cluster of operant views and values: “Non conformists and Activists”
This value system structures employees by their specialisations into departments and rejects monitoring
these employees by rules. Thus the value system identify leaders as warm hearted and teachers whose
pride is vested in uplifting the renewal and continuous education of employees to cater for the diverse
range of professional profiles emerging from different backgrounds or universities. Despite the fact that
the value system disallow venturing into new opportunities it expresses the struggle on creating new
working environments such as the internet services that enhances customers to access the cadastral
services and have their transactions and payments done. Therefore from the value’s point of view it is
unacceptable to rely on old standardised procedures which are reviewed after a longer period of time.
Hence it accommodates a free will to raise opposing and alternative ideas since it supports proactiveness.
Thus the value system spontaneously raises decisions on a particular concerned technical part. Precisely
the value system pinpoints that the overall decision on how to handle the task comes from the directors.
In particular, the value system associates decision making with full recognition of law.
Statement
Number
Value system Statement
Number
Value system
1 2 3 4 1 2 3 4
1 2 5 4 2 19. 3 0 0 -2
2. 1 -2 -3 -4 20. 0 1 -1 -1
3. -1 -3 2 1 21. 1 3 3 -3
4. -2 -3 -2 0 22. -3 -2 2 1
5. 0 4 3 1 23. 4 -1 0 3
6. -1 -1 -1 0 24 0 -2 1 -2
7. 2 2 1 2 25. -1 -4 -2 0
8. -2 0 -3 -5 26. -3 1 -4 -1
9. 3 0 5 5 27. -1 1 -5 4
10 2 -1 3 2 28. 0 2 -1 2
11. 4 1 -1 0 29. -1 -1 -4 -3
12. -2 0 0 0 30. -1 0 0 1
13. -3 3 1 -2 31. 3 -2 2 3
14. -2 -4 1 -1 32. 1 0 0 0
15. 0 4 2 3 33. -4 3 -2 -4
16. -4 -5 -2 -1 34. -5 2 -3 -3
17. 0 2 1 -1 35. 1 1 -1 -2
18. 2 -1 4 1 36. 5 -3 0 4
EVALUATION OF CADASTRAL SYSTEMS
37
The perspectives delivered henceforth by the value system align the leadership role with rule enforcing
whereby the cadastral professionals are supposed to bow to rules, policies and procedures. Unfortunately
the value system identifies vividly that although strict programmes and procedures exist, some of the
cadastral professionals choose to break the rules and report later on what was done. Moreover the
perspective of rule enforcement is further crippled by unclear authorities over processes and lack of clear
guidelines. This leaves the value system with no choice other than to offer its followers independence by
letting them guide themselves rather than being led by rules and procedures. In that case the value system
boldly shares that no external party has the right to dictate directions for employees. Therefore the value
system courageously disconnects itself from rules and gives employees the responsibility to carry out tasks
their own way. Accordingly this value system offers different tasks to each person yet it turns around and
declares that it has no attachments with tasks and goal achievement. At the same time it further exposes
the view whereby leaders are never coercive and detective since there is totally no need to achieve
stipulated objectives. It is unfortunate that the value system does not sympathise with the transformation
of resources. Eventually according to this value system it is despicable to qualify leaders as innovators.
3 Cluster of operant views and values: “we were product oriented and slow to change”
There may be order and structure in terms of departments, ranks are absolutely not distinguishable. The
value system states that there is no respect for hierarchy even though there are departments. Rules and
policies are not at all important. For instance the views show that the main aim is to achieve tasks and
goals but it is not important to adhere to the accompanying set procedures. Accordingly the value system
exposes task, procedures and goals to criticism. It means the tasks are open to judgement through allows
employees to challenge the existing procedures. The value system then employs a formal approach to
resolve the conflicts about the task or goal encountered. The main concern of this value system is to reach
the stipulated measurable results and markets through decreasing the cost of the cadastral procedures. The
value system identifies that even though there is a cost of 1250Kronos per hour in the subdivision
procedure, there is still room to cut off the price together with their costs. Therefore according to the
value system it would not be conducive to keep track with law. The value system underscores that law
takes ages to revise because it is hard to change. Therefore the value rests its preference and focus on
improving the standardised procedures established by the law many years ago.
The value system negotiates continuous adaptation to the external dynamic markets but attest that change
is slow. Moreover the value system entails that it accepts reviewing processes after a longer period of time.
According to this value system all key players are the immediate input to the final decision. Eventually the
value system emphasises that each decision is evaluated frequently to check its feasibility and societal
acceptance. Hence the value system advises to buy time while the decision is being evaluated. Ultimately
the value system has no flexible processes in place.
4 Cluster of operant views and values: “ Hierachicalists”
The value system totally disagrees with the view which expresses lack of order and structure. According to
this value system it identifies and uplifts the use of the handbooks which is the simpler version of law.
Consequently the value system attaches work practices or activities with the law. It carries forward the idea
that loyalty, cohesion and tradition are fundamental aspects that defines its existence. Thus the value
system discerns that cadastral systems are known for delivering the democracy and economic importance.
Moreover the value system magnifies the importance of the surveying professional which has reached the
peoples’ hearts. Accordingly, this value system appreciates the view whereby people are grateful of the
surveying professional due to its unquestionable submission to the economic importance. However, the
value system reveals that the activities enrolled capture a high degree of order whereby cadastral experts
are organised into departments with their respective specialisation.
EVALUATION OF CADASTRAL SYSTEMS
38
This value system establishes a clear division and authority between ranks and over processes. The value
system keeps hold of rules, procedures and guidelines in order to execute processes. For instance it guards
the view whereby legal advice is delineated to the technical employee who operates closely with the
demarcation of boundaries. The value system does not hide that in the case of law adjustment, a protocol
via the Ministry of justice is employed to carry out the necessary procedures. At daily basis work the value
system engages between the higher and lower levels. Accordingly it entails that ideas for change are sent to
higher levels via the appropriate levels and the feedback is formally returned following the same path of
hierarchy to the lower levels. At the same time the value system grades itself with qualities of good
listening and obedience when it comes to the interaction between the higher level and the lower level.
Thus the value system does not hesitate to underline the respect existing between the higher and the lower
ranks. This entails that plans made by the chiefs are eventually combined together with the lowest levels.
Hence the value system recycles obedience amongst all organisational levels. For this reason the value
systems finds the right to say that it associates close loyalty to the employment of rules and procedures to
carry out the task or goal . The value system promotes individual guidance since the law is clear.
The uniqueness of this value system is that it stretches its qualities towards the promotion of individual
guidance and autonomy as far as task achievement is concerned. The value system has many different
tasks which are engaged by different approaches thereby attracting the need for independence. One way
that the value system engages to go along with the diversity of tasks and ways of doing things is that it
reviews processes frequently to meet the changing human needs. Thus the end result registered to the
value system is that it has no intention to either meet standards and stability or to create new things.
4.3.3. Operant Value system of the Premerger: land registration component
This subsection presents the narration of the value system of the land registration before the merger. A
detailed presentation of the shift of each value system contains 36 statements and their corresponding
scores as shown Table 4.6. Each value system is narrated as directed by crib sheets presented in Appendix
9. Four conceptualisations of value systems are: Four conceptualisations of value systems are: “We were
goal oriented and fast to change”; “we were like a family”; “we were conservative and obedient”; “we
struggled to break new grounds yet we remained obedient to our leaders”. The narrations of the value
systems are presented under this section from number 1 to 4.
1. Cluster of operant values: “We were goal oriented and fast to change”
On one hand the value system is deeply profound in the views which express minimum order and little
adherence to rules. The value system expresses clearly that the bond existing amongst employees in not
defined by rules. For instance, the value system harbours a mixed group of professionals whose training is
not standardised. Moreover, even though the value system accommodates the organisation of
professionals into departments, the ranking system of the higher and lower levels remains clumsy. Yet
again the value system does not adhere to rules and procedures planned for a particular goal or task at that
time. This discord does not stop the lower levels from passing on the decisions on the given objectives.
On the other hand the value system prefers order. For instance, even though the value system allows
employees to make decisions, rules and regulations exist to determine the extent of the decisions. The
executive board passes final judgement concerning the alterations to be made. Furthermore, the value
system considers standardised processes sometimes and prefers to guide employees. The value system
confers that law is built in standardised digital technical procedures. Hence the role of employees is to
check the structure of the data to see if it meets the standards set. For example all mortgages that do not
follow the standards are rejected. The value system also recognises that there are many processes tailor
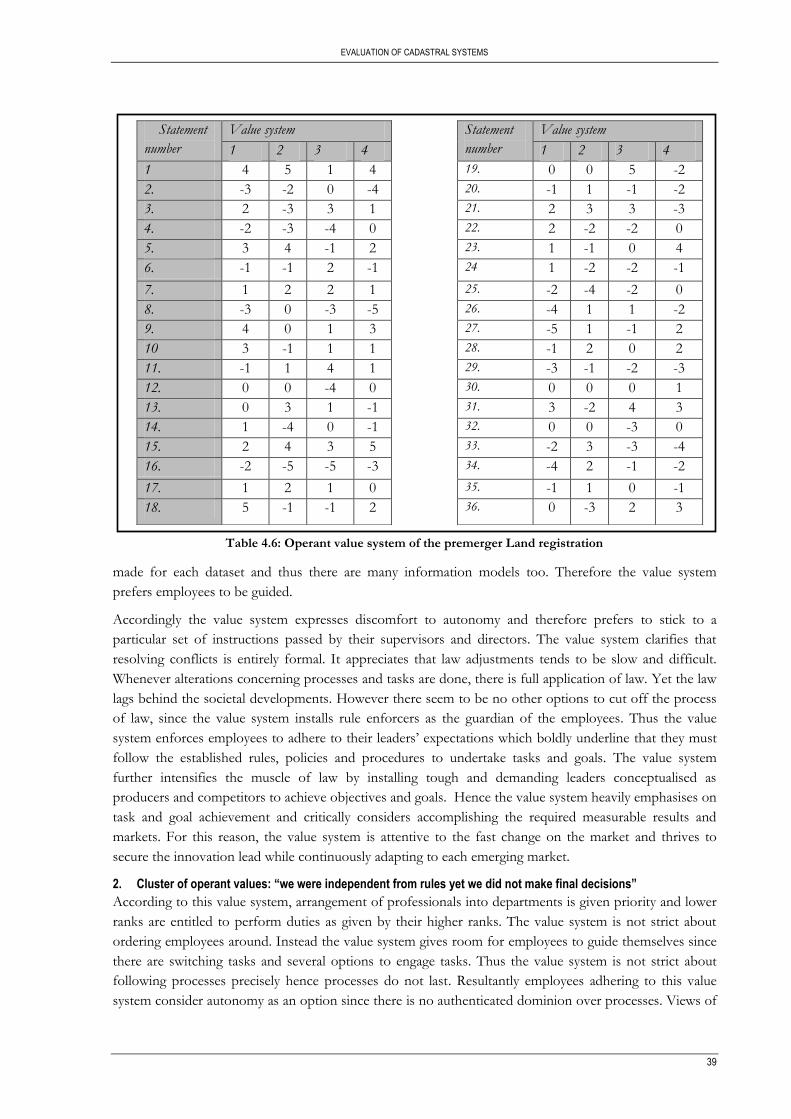
EVALUATION OF CADASTRAL SYSTEMS
39
Table 4.6: Operant value system of the premerger Land registration
made for each dataset and thus there are many information models too. Therefore the value system
prefers employees to be guided.
Accordingly the value system expresses discomfort to autonomy and therefore prefers to stick to a
particular set of instructions passed by their supervisors and directors. The value system clarifies that
resolving conflicts is entirely formal. It appreciates that law adjustments tends to be slow and difficult.
Whenever alterations concerning processes and tasks are done, there is full application of law. Yet the law
lags behind the societal developments. However there seem to be no other options to cut off the process
of law, since the value system installs rule enforcers as the guardian of the employees. Thus the value
system enforces employees to adhere to their leaders’ expectations which boldly underline that they must
follow the established rules, policies and procedures to undertake tasks and goals. The value system
further intensifies the muscle of law by installing tough and demanding leaders conceptualised as
producers and competitors to achieve objectives and goals. Hence the value system heavily emphasises on
task and goal achievement and critically considers accomplishing the required measurable results and
markets. For this reason, the value system is attentive to the fast change on the market and thrives to
secure the innovation lead while continuously adapting to each emerging market.
2. Cluster of operant values: “we were independent from rules yet we did not make final decisions”
According to this value system, arrangement of professionals into departments is given priority and lower
ranks are entitled to perform duties as given by their higher ranks. The value system is not strict about
ordering employees around. Instead the value system gives room for employees to guide themselves since
there are switching tasks and several options to engage tasks. Thus the value system is not strict about
following processes precisely hence processes do not last. Resultantly employees adhering to this value
system consider autonomy as an option since there is no authenticated dominion over processes. Views of
Statement
number
Value system Statement
number
Value system
1 2 3 4 1 2 3 4
1 4 5 1 4 19. 0 0 5 -2
2. -3 -2 0 -4 20. -1 1 -1 -2
3. 2 -3 3 1 21. 2 3 3 -3
4. -2 -3 -4 0 22. 2 -2 -2 0
5. 3 4 -1 2 23. 1 -1 0 4
6. -1 -1 2 -1 24 1 -2 -2 -1
7. 1 2 2 1 25. -2 -4 -2 0
8. -3 0 -3 -5 26. -4 1 1 -2
9. 4 0 1 3 27. -5 1 -1 2
10 3 -1 1 1 28. -1 2 0 2
11. -1 1 4 1 29. -3 -1 -2 -3
12. 0 0 -4 0 30. 0 0 0 1
13. 0 3 1 -1 31. 3 -2 4 3
14. 1 -4 0 -1 32. 0 0 -3 0
15. 2 4 3 5 33. -2 3 -3 -4
16. -2 -5 -5 -3 34. -4 2 -1 -2
17. 1 2 1 0 35. -1 1 0 -1
18. 5 -1 -1 2 36. 0 -3 2 3
EVALUATION OF CADASTRAL SYSTEMS
40
the value systems perceive leaders as warm hearted with mentoring and parental qualities. As a result the
value system gives employees the responsibility over their jobs, education life and the opportunity to be
proactive. However, that does not mean that the value system neglect self renewal through additional
educational training.
Cadastral employees adhering to this value system are flexible and free to oppose and bring along
exceptional ideas about tasks and present them to their leaders. However, the value system does not allow
all employees to make decisions. According to the value system directors pass the final judgement to
decisions in order to meet a stable environment. It follows that the value system has no inclination to
innovation since it also records the absence of risk takers within it. Moreover the value system does not
involve the conversion of resources. Hence the value system neither modifies nor alters the existing
processes or even old processes. The value system does not emphasise on the creation of new things nor
expansion.
The diversity and numerous standards within this value system forces it to choose stability and
maintenance of processes over dynamism. As such the value system does not consider production because
leaders are not tough and demanding. Thus it delivers the message that there is neither a need to
accomplish measurable results and neither markets nor the need to focus on tasks and goal achievement
but rather a family approach is suitable to accomplish a task.
3. Cluster of operant values: “we were conservative and obedient”
Cadastral professionals adhering to this value system are organised according to their specialisation with
lower levels ready to receive orders from the higher levels. Thus the value system insinuates that the lower
levels closely execute orders according to the planned procedures set by the higher levels. It realises the
significance of handbooks which simplifies the land registration laws. These handbooks are instrumental
for guiding data entry in the computers.
While the value system has a firm grip on rules, procedures, guidelines and policies, it neither tolerates an
interactive environment between leaders and subordinates nor withstand opposition about the procedures,
goals and task arising from employees. Hence the value system is dedicated to rules, guidelines and
policies. Thus cadastral experts who adhere to this value system consider clear line authority over
processes. Simultaneously the value system considers decision making as a responsibility of directors.
Clearly spotted is the point that the value system aims for stability and consistence. For instance the value
system takes long to review processes. Thus the value system installs slow change by developing old
processes launched many years ago.
Likewise the value system completely rejects to be associated with innovation and risk taking. It is clear
from this value system that it does not accommodate venturing into new opportunities. It does not pay
particular attention to markets dynamics or the innovation lead. It therefore follows that the value system
seeks not for the recurrent adjustment of processes to match the external markets. Hence the value system
has inflexible processes which do not suit the dynamic changing human needs. For this reason the value
system prefers to employ rules as a tool to guide its fanatics in activities since it also gauges its followers as
incompetent. In total the value system disconnect itself from innovation, experimentation and
development.
4. Cluster of values: “we struggled to break new grounds yet we remained obedient to our leaders”
This value system associates adequate professional training with extreme competence. It then assumes that
employees are capable of guiding themselves and therefore promote autonomy. It subsequently protects
the incompetent employees by exposing them to education that is local to their work. However it allows
employees to either chase or discard additional education besides the in-house education. Accordingly the
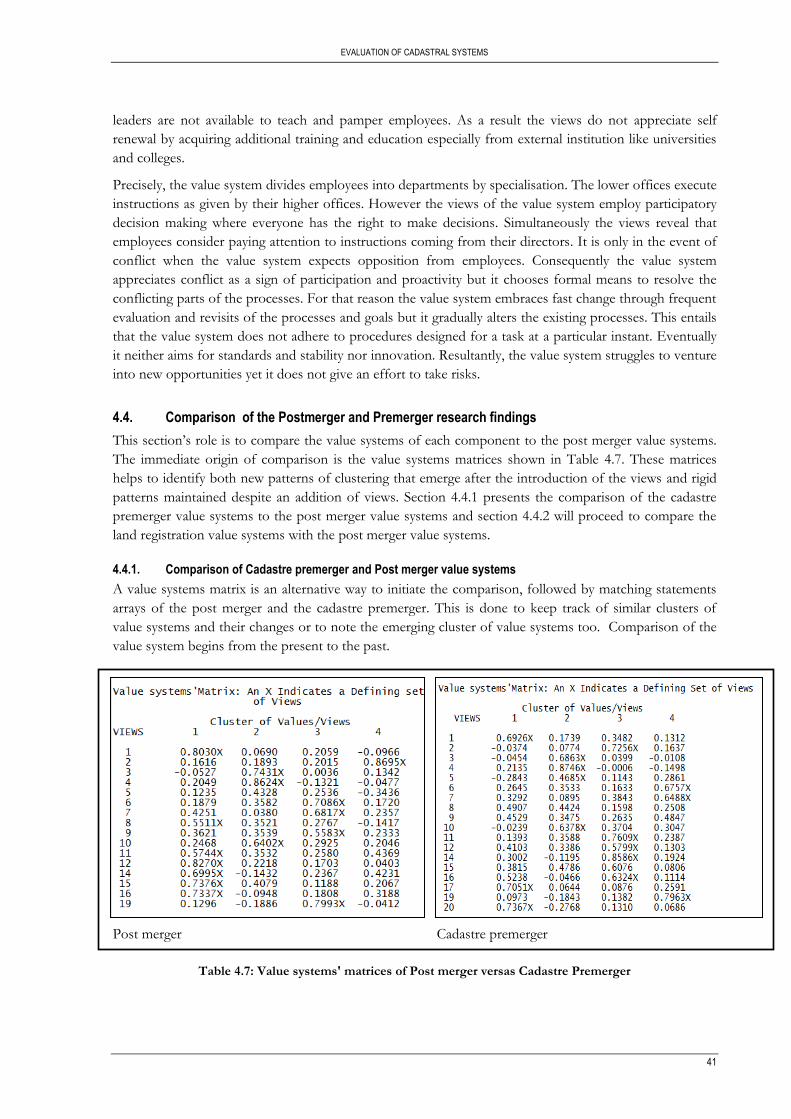
EVALUATION OF CADASTRAL SYSTEMS
41
leaders are not available to teach and pamper employees. As a result the views do not appreciate self
renewal by acquiring additional training and education especially from external institution like universities
and colleges.
Precisely, the value system divides employees into departments by specialisation. The lower offices execute
instructions as given by their higher offices. However the views of the value system employ participatory
decision making where everyone has the right to make decisions. Simultaneously the views reveal that
employees consider paying attention to instructions coming from their directors. It is only in the event of
conflict when the value system expects opposition from employees. Consequently the value system
appreciates conflict as a sign of participation and proactivity but it chooses formal means to resolve the
conflicting parts of the processes. For that reason the value system embraces fast change through frequent
evaluation and revisits of the processes and goals but it gradually alters the existing processes. This entails
that the value system does not adhere to procedures designed for a task at a particular instant. Eventually
it neither aims for standards and stability nor innovation. Resultantly, the value system struggles to venture
into new opportunities yet it does not give an effort to take risks.
4.4. Comparison of the Postmerger and Premerger research findings
This section’s role is to compare the value systems of each component to the post merger value systems.
The immediate origin of comparison is the value systems matrices shown in Table 4.7. These matrices
helps to identify both new patterns of clustering that emerge after the introduction of the views and rigid
patterns maintained despite an addition of views. Section 4.4.1 presents the comparison of the cadastre
premerger value systems to the post merger value systems and section 4.4.2 will proceed to compare the
land registration value systems with the post merger value systems.
4.4.1. Comparison of Cadastre premerger and Post merger value systems
A value systems matrix is an alternative way to initiate the comparison, followed by matching statements
arrays of the post merger and the cadastre premerger. This is done to keep track of similar clusters of
value systems and their changes or to note the emerging cluster of value systems too. Comparison of the
value system begins from the present to the past.
Post merger Cadastre premerger
Table 4.7: Value systems' matrices of Post merger versas Cadastre Premerger
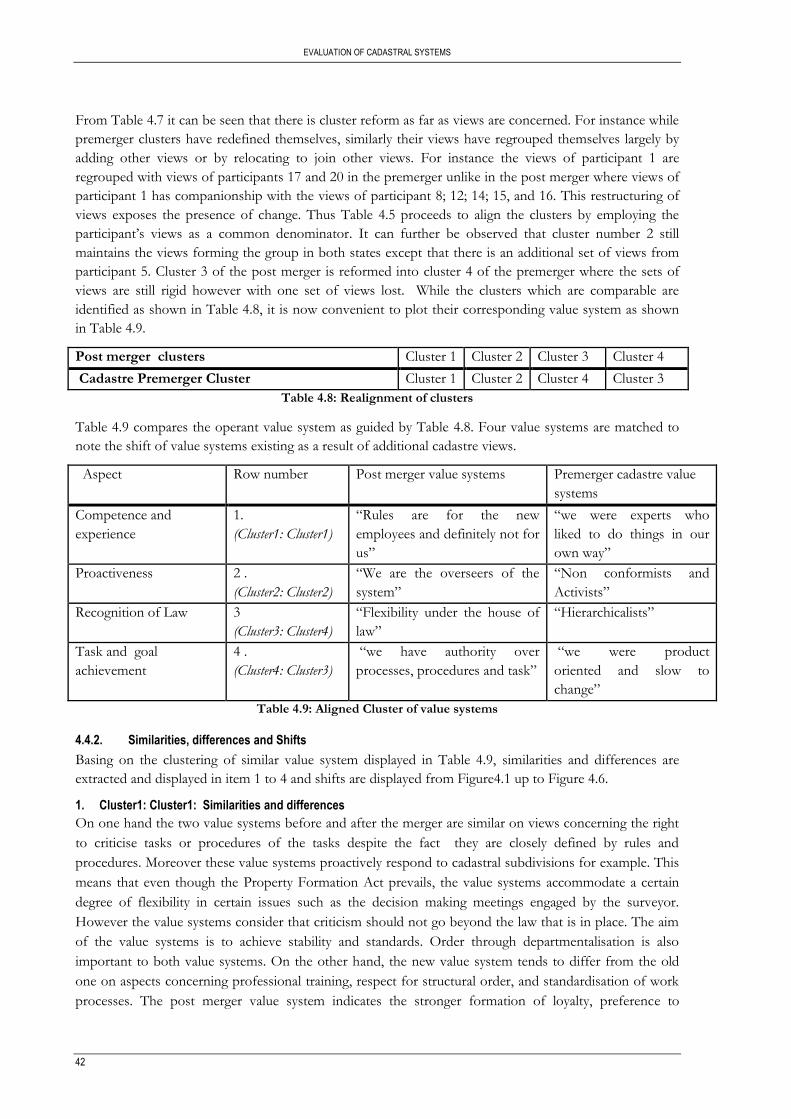
EVALUATION OF CADASTRAL SYSTEMS
42
From Table 4.7 it can be seen that there is cluster reform as far as views are concerned. For instance while
premerger clusters have redefined themselves, similarly their views have regrouped themselves largely by
adding other views or by relocating to join other views. For instance the views of participant 1 are
regrouped with views of participants 17 and 20 in the premerger unlike in the post merger where views of
participant 1 has companionship with the views of participant 8; 12; 14; 15, and 16. This restructuring of
views exposes the presence of change. Thus Table 4.5 proceeds to align the clusters by employing the
participant’s views as a common denominator. It can further be observed that cluster number 2 still
maintains the views forming the group in both states except that there is an additional set of views from
participant 5. Cluster 3 of the post merger is reformed into cluster 4 of the premerger where the sets of
views are still rigid however with one set of views lost. While the clusters which are comparable are
identified as shown in Table 4.8, it is now convenient to plot their corresponding value system as shown
in Table 4.9.
Post merger clusters Cluster 1 Cluster 2 Cluster 3 Cluster 4
Cadastre Premerger Cluster Cluster 1 Cluster 2 Cluster 4 Cluster 3
Table 4.8: Realignment of clusters
Table 4.9 compares the operant value system as guided by Table 4.8. Four value systems are matched to
note the shift of value systems existing as a result of additional cadastre views.
Aspect Row number Post merger value systems Premerger cadastre value
systems
Competence and
experience
1.
(Cluster1: Cluster1)
“Rules are for the new
employees and definitely not for
us”
“we were experts who
liked to do things in our
own way”
Proactiveness 2 .
(Cluster2: Cluster2)
“We are the overseers of the
system”
“Non conformists and
Activists”
Recognition of Law 3
(Cluster3: Cluster4)
“Flexibility under the house of
law”
“Hierarchicalists”
Task and goal
achievement
4 .
(Cluster4: Cluster3)
“we have authority over
processes, procedures and task”
“we were product
oriented and slow to
change”
Table 4.9: Aligned Cluster of value systems
4.4.2. Similarities, differences and Shifts
Basing on the clustering of similar value system displayed in Table 4.9, similarities and differences are
extracted and displayed in item 1 to 4 and shifts are displayed from Figure4.1 up to Figure 4.6.
1. Cluster1: Cluster1: Similarities and differences
On one hand the two value systems before and after the merger are similar on views concerning the right
to criticise tasks or procedures of the tasks despite the fact they are closely defined by rules and
procedures. Moreover these value systems proactively respond to cadastral subdivisions for example. This
means that even though the Property Formation Act prevails, the value systems accommodate a certain
degree of flexibility in certain issues such as the decision making meetings engaged by the surveyor.
However the value systems consider that criticism should not go beyond the law that is in place. The aim
of the value systems is to achieve stability and standards. Order through departmentalisation is also
important to both value systems. On the other hand, the new value system tends to differ from the old
one on aspects concerning professional training, respect for structural order, and standardisation of work
processes. The post merger value system indicates the stronger formation of loyalty, preference to
EVALUATION OF CADASTRAL SYSTEMS
43
tradition and cohesion amongst the employees. It also promotes people development and enhancement of
the community through offering an in-house education to the incoming new employee. The education
involves training about the Swedish cadastral subdivision or property formation, how to engage meetings
with a client, the technical issues on cadastral index map, etc.
2. Cluster2:Cluster2: Similarities and differences
The value systems of the premerger and post merger are similar in that they both consider people
development and community development. Hence in both the premerger and the post merger, the value
systems install mentors, facilitators and parental figures. Accordingly the value systems allows for an
interactive environment whereby staff members are given the chance to speak openly and frankly
concerning the faulty areas about tasks and procedures for the tasks. Yet still, both value systems
appreciate the presence of order through departmentalising of the staff members. In that regard the value
system employ the coordinators, rule enforcers and organisers with expectations to engage the staff
members to rules, procedures and policies. However, it turns out that the value systems simultaneously do
not install clear authority over processes. Ultimately the end result is that the value systems emphasise on
acquiring new working environments through acquiring new technologies such as the Web Map Service,
new formats such as the GML, etc. Yet still, the value system of the post merger tend to differ from the
post merger in terms of work related issues, the way staff members conduct their everyday activities, the
relationships existing between the staff members and the conduct of decision making.
3. Cluster3:Cluster4 : Similarities and differences
The value systems for the premerger and post merger tend to prefer order through departmentalising staff
members. Moreover the value systems enforce a clear distinction between higher and lower ranks and the
lower offices are expected to execute orders coming from the higher offices. The value systems are strictly
tied to planned procedures concerning the tasks at hand. At the same time both value systems offers
different approaches to handle tasks. However, the value systems are flexible on matters concerning the
interaction of staff member to fulfil the procedure for the task. While the value systems allow the staff
members to depend on each other upon executing a procedure for a task, the same value systems allow
for autonomy, and loyalty. Consequently the value systems appreciate sticking to tradition as far as the
relationships amongst staff members towards executing the tasks are concerned. Yet still, the post merger
tend to differ from the premerger value system in that it prefers frank and open communication between
the lower and the higher offices.
4. Cluster4:Cluster3 : Similarities and differences The premerger and post merger value systems are connected by three similar views that emphasises order
through departmentalisation, continual adaptation to fast changing markets, task and goal achievement,
and freedom to criticise the task or procedure in place. There is a difference between these two values.
The post merger value system stress its concern on matters concerning collaborative, loyalty, tradition to
achieve the tasks and goals. After the merger it is vivid that the new value system is concerned about
meeting the stipulated objectives and goals coming from their leaders. Moreover the new value system
appreciates risk takers, and innovators for leaders.
Therefore as these value systems prove that they are almost similar, there are observable shifts with
particular views such as the work processes, the approach to execute tasks and the decision making.
Figure4.1 up to Figure 4.6 displays the respective original culture typology and their post merger culture
typology.
1. Change of work processes
Figure 4.1 up to Figure 4.6 shows the shift of views concerning the work processes from the premerger to
the post merger state. Precisely Figure 4.1 shows contradicting shifts of views. One set of shift shows that
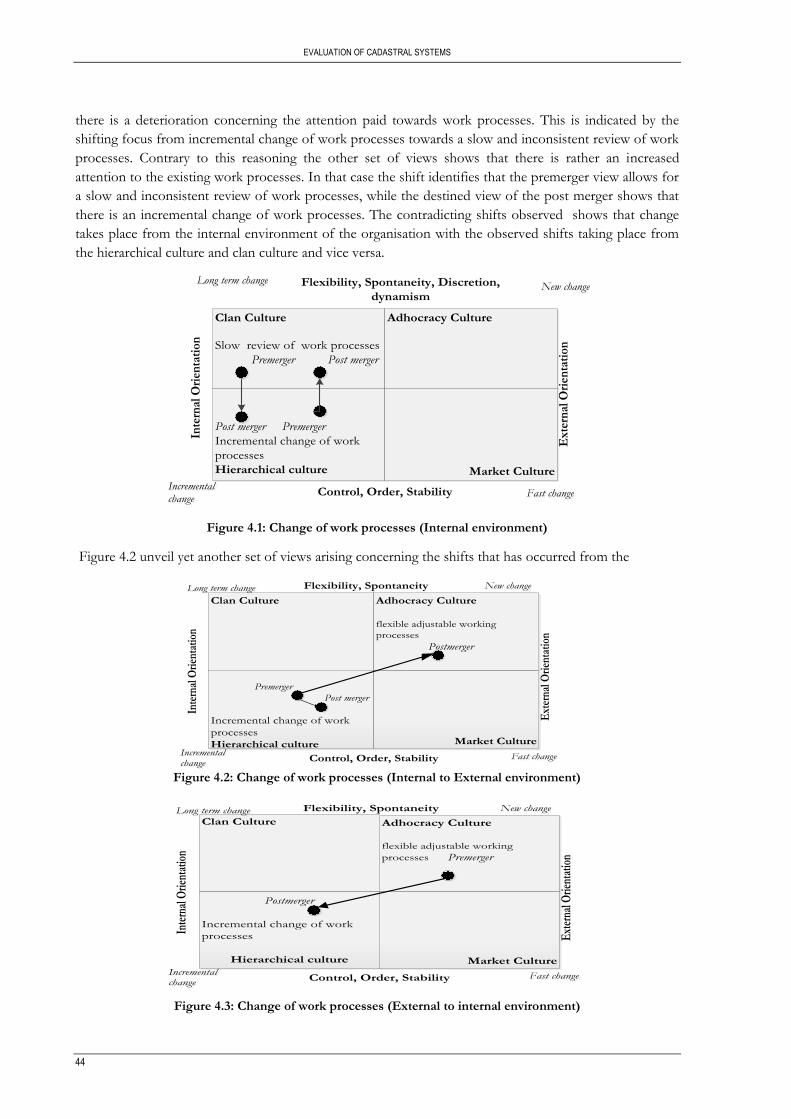
EVALUATION OF CADASTRAL SYSTEMS
44
there is a deterioration concerning the attention paid towards work processes. This is indicated by the
shifting focus from incremental change of work processes towards a slow and inconsistent review of work
processes. Contrary to this reasoning the other set of views shows that there is rather an increased
attention to the existing work processes. In that case the shift identifies that the premerger view allows for
a slow and inconsistent review of work processes, while the destined view of the post merger shows that
there is an incremental change of work processes. The contradicting shifts observed shows that change
takes place from the internal environment of the organisation with the observed shifts taking place from
the hierarchical culture and clan culture and vice versa.
Clan Culture
Slow review of work processes
Premerger Post merger
Adhocracy Culture
Post merger Premerger
Incremental change of work
processes
Hierarchical culture Market Culture
Ext
ern
al O
rien
tati
on
Inte
rnal
Ori
enta
tio
n
Flexibility, Spontaneity, Discretion,
dynamism
Control, Order, Stability
Long term change Long term change New change New change
Incremental
change
Incremental
change Fast change Fast change
Figure 4.1: Change of work processes (Internal environment)
Figure 4.2 unveil yet another set of views arising concerning the shifts that has occurred from the
Clan Culture
Adhocracy Culture
flexible adjustable working
processes
Postmerger
Premerger Post merger
Incremental change of work
processes
Hierarchical culture Market Culture
Ext
erna
l Ori
enta
tion
Inte
rnal
Ori
enta
tion
Flexibility, Spontaneity
Control, Order, Stability
Long term change Long term change New change New change
Incremental
change
Incremental
change Fast change Fast change
Figure 4.2: Change of work processes (Internal to External environment)
Clan Culture
Adhocracy Culture
flexible adjustable working
processes Premerger
Postmerger
Incremental change of work
processes
Hierarchical culture Market Culture
Ext
erna
l Orie
ntat
ion
Inte
rnal
Orie
ntat
ion
Flexibility, Spontaneity
Control, Order, Stability
Long term change Long term change New change New change
Incremental
change
Incremental
change Fast change Fast change
Figure 4.3: Change of work processes (External to internal environment)
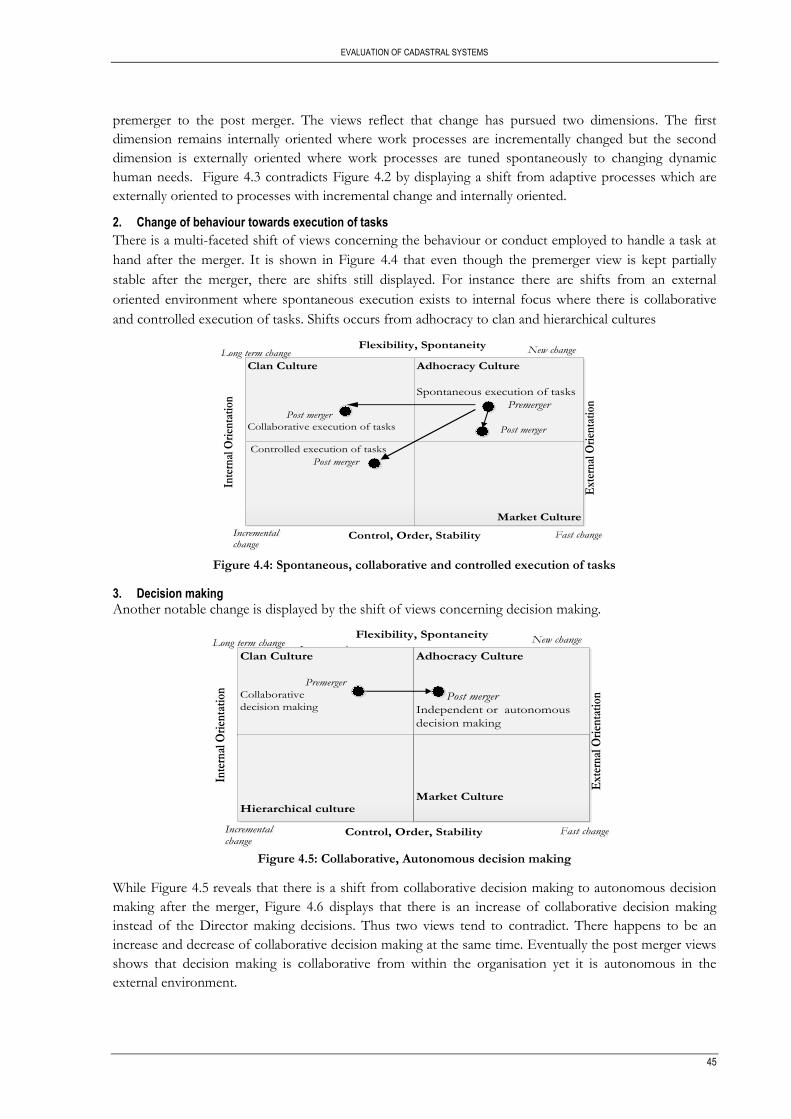
EVALUATION OF CADASTRAL SYSTEMS
45
premerger to the post merger. The views reflect that change has pursued two dimensions. The first
dimension remains internally oriented where work processes are incrementally changed but the second
dimension is externally oriented where work processes are tuned spontaneously to changing dynamic
human needs. Figure 4.3 contradicts Figure 4.2 by displaying a shift from adaptive processes which are
externally oriented to processes with incremental change and internally oriented.
2. Change of behaviour towards execution of tasks
There is a multi-faceted shift of views concerning the behaviour or conduct employed to handle a task at
hand after the merger. It is shown in Figure 4.4 that even though the premerger view is kept partially
stable after the merger, there are shifts still displayed. For instance there are shifts from an external
oriented environment where spontaneous execution exists to internal focus where there is collaborative
and controlled execution of tasks. Shifts occurs from adhocracy to clan and hierarchical cultures
Clan Culture
Post merger
Collaborative execution of tasks
Adhocracy Culture
Spontaneous execution of tasks
Premerger
Post merger
Controlled execution of tasks
Post merger
Market Culture
Ext
erna
l Ori
enta
tion
Inte
rnal
Ori
enta
tion
Flexibility, Spontaneity
Control, Order, Stability
Long term change Long term change New change New change
Incremental
change
Incremental
change Fast change Fast change
Figure 4.4: Spontaneous, collaborative and controlled execution of tasks
3. Decision making
Another notable change is displayed by the shift of views concerning decision making.
Control, Order, StabilityIncremental
change
Incremental
change Clan Culture
Premerger
Collaborative
decision making
Adhocracy Culture
Post merger
Independent or autonomous
decision making
Hierarchical culture
Market Culture
Ext
erna
l Ori
enta
tion
Inte
rnal
Ori
enta
tion
Flexibility, Spontaneity
Control, Order, Stability
Long term change Long term change New change New change
Incremental
change
Incremental
change Fast change Fast change
Figure 4.5: Collaborative, Autonomous decision making
While Figure 4.5 reveals that there is a shift from collaborative decision making to autonomous decision
making after the merger, Figure 4.6 displays that there is an increase of collaborative decision making
instead of the Director making decisions. Thus two views tend to contradict. There happens to be an
increase and decrease of collaborative decision making at the same time. Eventually the post merger views
shows that decision making is collaborative from within the organisation yet it is autonomous in the
external environment.
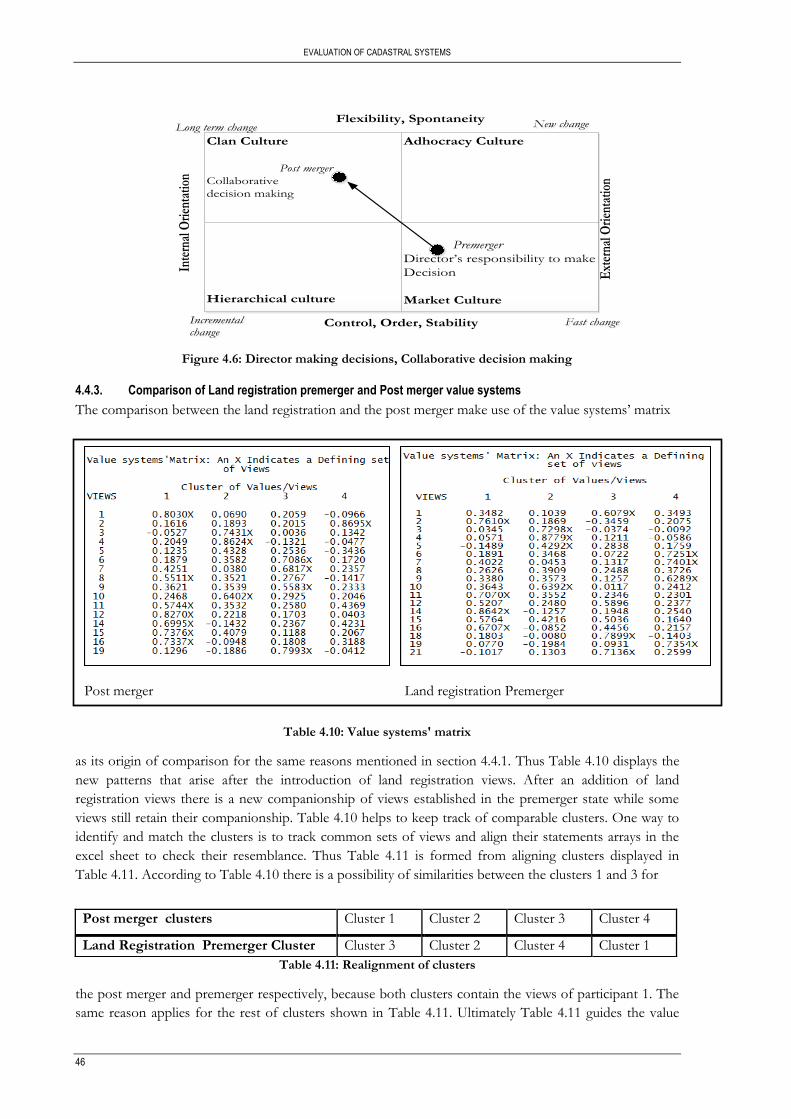
EVALUATION OF CADASTRAL SYSTEMS
46
Clan Culture
Post merger
Collaborative
decision making
Adhocracy Culture
Hierarchical culture
Premerger
Director’s responsibility to make
Decision
Market Culture
Ext
erna
l Ori
enta
tion
Inte
rnal
Ori
enta
tion
Flexibility, Spontaneity
Control, Order, Stability
Long term change Long term change New change New change
Incremental
change
Incremental
change Fast change Fast change
Figure 4.6: Director making decisions, Collaborative decision making
4.4.3. Comparison of Land registration premerger and Post merger value systems
The comparison between the land registration and the post merger make use of the value systems’ matrix
Table 4.10: Value systems' matrix
as its origin of comparison for the same reasons mentioned in section 4.4.1. Thus Table 4.10 displays the
new patterns that arise after the introduction of land registration views. After an addition of land
registration views there is a new companionship of views established in the premerger state while some
views still retain their companionship. Table 4.10 helps to keep track of comparable clusters. One way to
identify and match the clusters is to track common sets of views and align their statements arrays in the
excel sheet to check their resemblance. Thus Table 4.11 is formed from aligning clusters displayed in
Table 4.11. According to Table 4.10 there is a possibility of similarities between the clusters 1 and 3 for
Table 4.11: Realignment of clusters
the post merger and premerger respectively, because both clusters contain the views of participant 1. The
same reason applies for the rest of clusters shown in Table 4.11. Ultimately Table 4.11 guides the value
Post merger clusters Cluster 1 Cluster 2 Cluster 3 Cluster 4
Land Registration Premerger Cluster Cluster 3 Cluster 2 Cluster 4 Cluster 1
Post merger Land registration Premerger
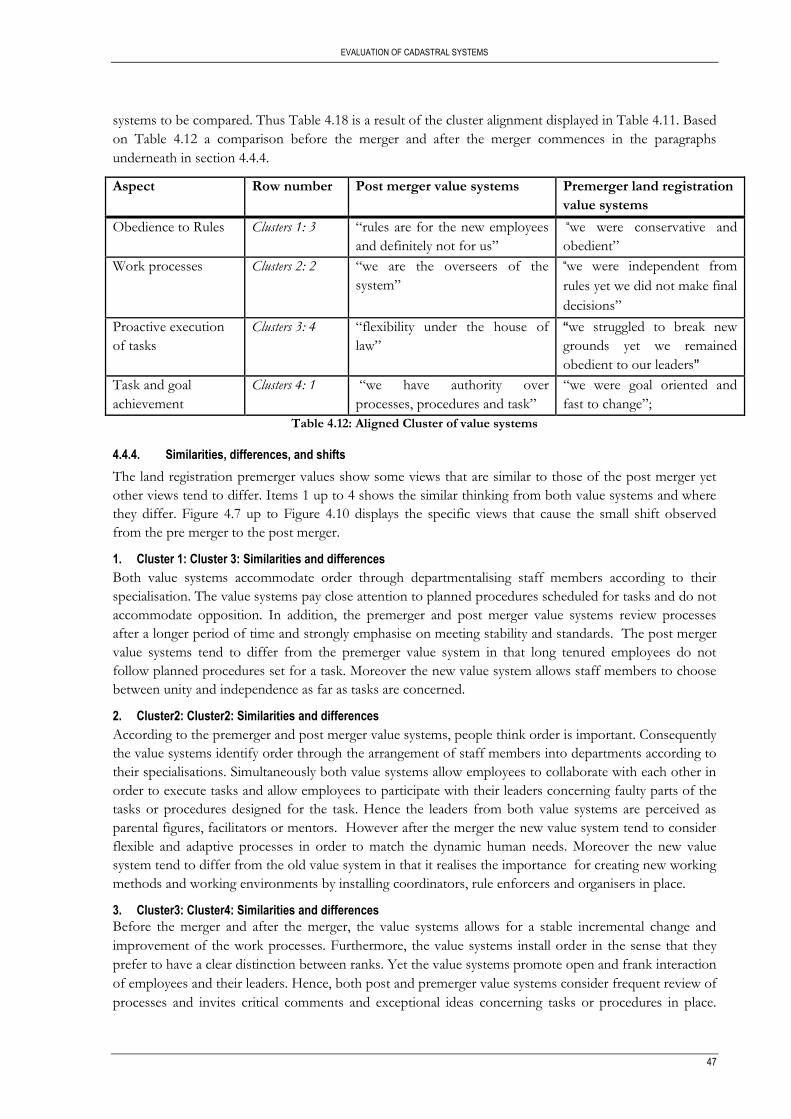
EVALUATION OF CADASTRAL SYSTEMS
47
systems to be compared. Thus Table 4.18 is a result of the cluster alignment displayed in Table 4.11. Based
on Table 4.12 a comparison before the merger and after the merger commences in the paragraphs
underneath in section 4.4.4.
Aspect Row number Post merger value systems Premerger land registration
value systems
Obedience to Rules Clusters 1: 3 “rules are for the new employees
and definitely not for us”
“we were conservative and
obedient”
Work processes Clusters 2: 2 “we are the overseers of the
system”
“we were independent from
rules yet we did not make final
decisions”
Proactive execution
of tasks
Clusters 3: 4 “flexibility under the house of
law”
“we struggled to break new
grounds yet we remained
obedient to our leaders”
Task and goal
achievement
Clusters 4: 1 “we have authority over
processes, procedures and task”
“we were goal oriented and
fast to change”;
Table 4.12: Aligned Cluster of value systems
4.4.4. Similarities, differences, and shifts
The land registration premerger values show some views that are similar to those of the post merger yet
other views tend to differ. Items 1 up to 4 shows the similar thinking from both value systems and where
they differ. Figure 4.7 up to Figure 4.10 displays the specific views that cause the small shift observed
from the pre merger to the post merger.
1. Cluster 1: Cluster 3: Similarities and differences
Both value systems accommodate order through departmentalising staff members according to their
specialisation. The value systems pay close attention to planned procedures scheduled for tasks and do not
accommodate opposition. In addition, the premerger and post merger value systems review processes
after a longer period of time and strongly emphasise on meeting stability and standards. The post merger
value systems tend to differ from the premerger value system in that long tenured employees do not
follow planned procedures set for a task. Moreover the new value system allows staff members to choose
between unity and independence as far as tasks are concerned.
2. Cluster2: Cluster2: Similarities and differences
According to the premerger and post merger value systems, people think order is important. Consequently
the value systems identify order through the arrangement of staff members into departments according to
their specialisations. Simultaneously both value systems allow employees to collaborate with each other in
order to execute tasks and allow employees to participate with their leaders concerning faulty parts of the
tasks or procedures designed for the task. Hence the leaders from both value systems are perceived as
parental figures, facilitators or mentors. However after the merger the new value system tend to consider
flexible and adaptive processes in order to match the dynamic human needs. Moreover the new value
system tend to differ from the old value system in that it realises the importance for creating new working
methods and working environments by installing coordinators, rule enforcers and organisers in place.
3. Cluster3: Cluster4: Similarities and differences
Before the merger and after the merger, the value systems allows for a stable incremental change and
improvement of the work processes. Furthermore, the value systems install order in the sense that they
prefer to have a clear distinction between ranks. Yet the value systems promote open and frank interaction
of employees and their leaders. Hence, both post and premerger value systems consider frequent review of
processes and invites critical comments and exceptional ideas concerning tasks or procedures in place.
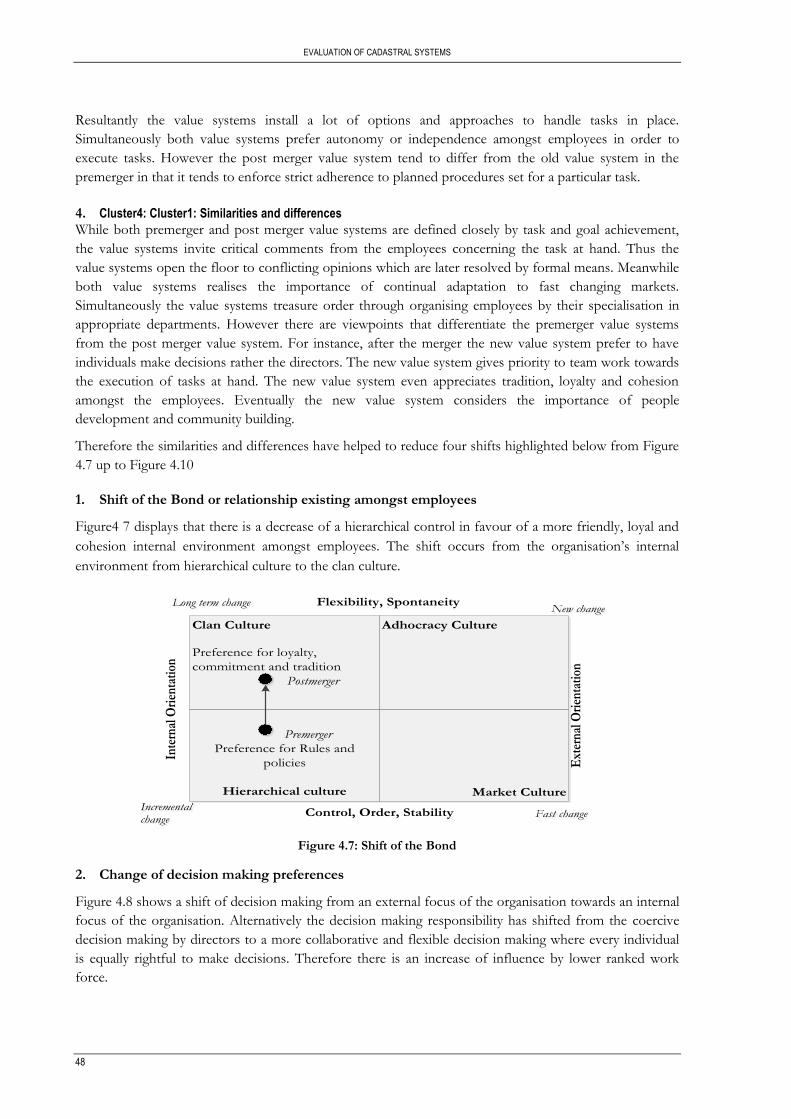
EVALUATION OF CADASTRAL SYSTEMS
48
Resultantly the value systems install a lot of options and approaches to handle tasks in place.
Simultaneously both value systems prefer autonomy or independence amongst employees in order to
execute tasks. However the post merger value system tend to differ from the old value system in the
premerger in that it tends to enforce strict adherence to planned procedures set for a particular task.
4. Cluster4: Cluster1: Similarities and differences While both premerger and post merger value systems are defined closely by task and goal achievement,
the value systems invite critical comments from the employees concerning the task at hand. Thus the
value systems open the floor to conflicting opinions which are later resolved by formal means. Meanwhile
both value systems realises the importance of continual adaptation to fast changing markets.
Simultaneously the value systems treasure order through organising employees by their specialisation in
appropriate departments. However there are viewpoints that differentiate the premerger value systems
from the post merger value system. For instance, after the merger the new value system prefer to have
individuals make decisions rather the directors. The new value system gives priority to team work towards
the execution of tasks at hand. The new value system even appreciates tradition, loyalty and cohesion
amongst the employees. Eventually the new value system considers the importance of people
development and community building.
Therefore the similarities and differences have helped to reduce four shifts highlighted below from Figure
4.7 up to Figure 4.10
1. Shift of the Bond or relationship existing amongst employees
Figure4 7 displays that there is a decrease of a hierarchical control in favour of a more friendly, loyal and
cohesion internal environment amongst employees. The shift occurs from the organisation’s internal
environment from hierarchical culture to the clan culture.
Clan Culture
Preference for loyalty,
commitment and tradition
Postmerger
Adhocracy Culture
Premerger
Preference for Rules and
policies
Hierarchical culture Market Culture
Ext
erna
l Ori
enta
tion
Inte
rnal
Ori
enta
tion
Flexibility, Spontaneity
Control, Order, Stability
Long term change Long term change New change New change
Incremental
change
Incremental
change Fast change Fast change
Figure 4.7: Shift of the Bond
2. Change of decision making preferences
Figure 4.8 shows a shift of decision making from an external focus of the organisation towards an internal
focus of the organisation. Alternatively the decision making responsibility has shifted from the coercive
decision making by directors to a more collaborative and flexible decision making where every individual
is equally rightful to make decisions. Therefore there is an increase of influence by lower ranked work
force.
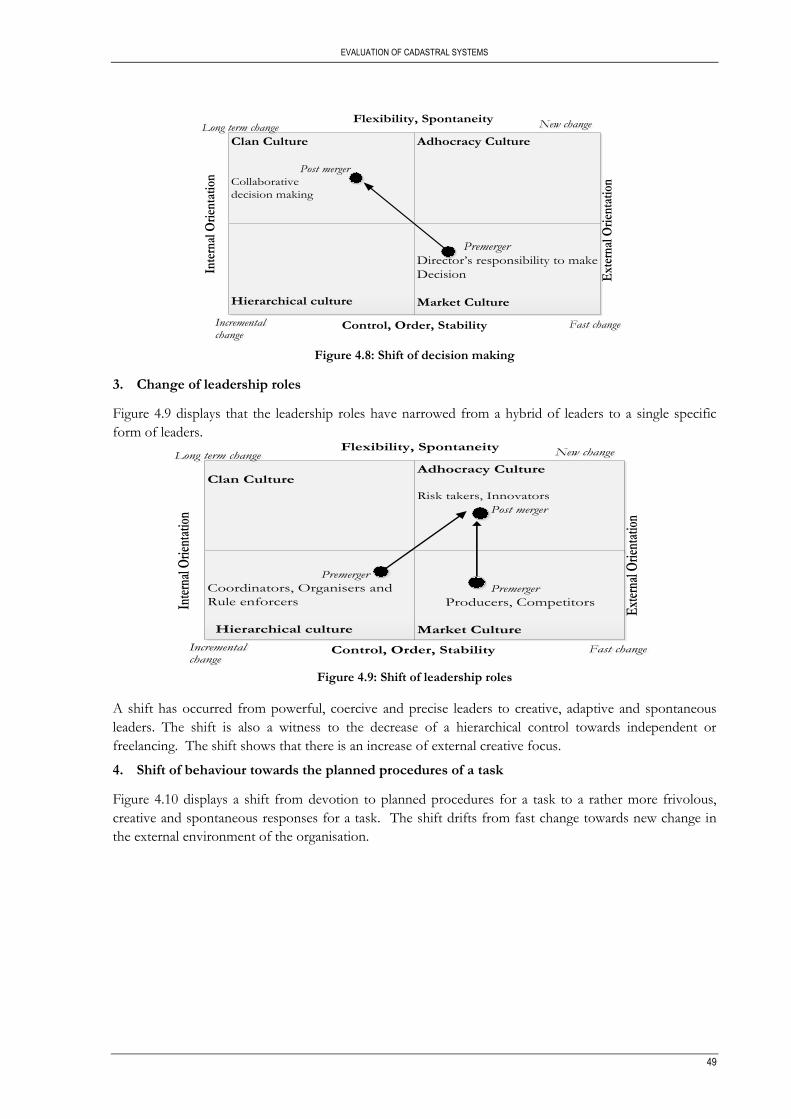
EVALUATION OF CADASTRAL SYSTEMS
49
Clan Culture
Post merger
Collaborative
decision making
Adhocracy Culture
Hierarchical culture
Premerger
Director’s responsibility to make
Decision
Market Culture
Ext
erna
l Ori
enta
tion
Inte
rnal
Ori
enta
tion
Flexibility, Spontaneity
Control, Order, Stability
Long term change Long term change New change New change
Incremental
change
Incremental
change Fast change Fast change
Figure 4.8: Shift of decision making
3. Change of leadership roles
Figure 4.9 displays that the leadership roles have narrowed from a hybrid of leaders to a single specific
form of leaders.
Clan Culture
Adhocracy Culture
Risk takers, Innovators
Post merger
Premerger
Coordinators, Organisers and
Rule enforcers
Hierarchical culture
Premerger Producers, Competitors
Market CultureE
xter
nal O
rient
atio
n
Inte
rnal
Orie
ntat
ion
Flexibility, Spontaneity
Control, Order, Stability
Long term change Long term change New change New change
Incremental
change
Incremental
change Fast change Fast change
Figure 4.9: Shift of leadership roles
A shift has occurred from powerful, coercive and precise leaders to creative, adaptive and spontaneous
leaders. The shift is also a witness to the decrease of a hierarchical control towards independent or
freelancing. The shift shows that there is an increase of external creative focus.
4. Shift of behaviour towards the planned procedures of a task
Figure 4.10 displays a shift from devotion to planned procedures for a task to a rather more frivolous,
creative and spontaneous responses for a task. The shift drifts from fast change towards new change in
the external environment of the organisation.
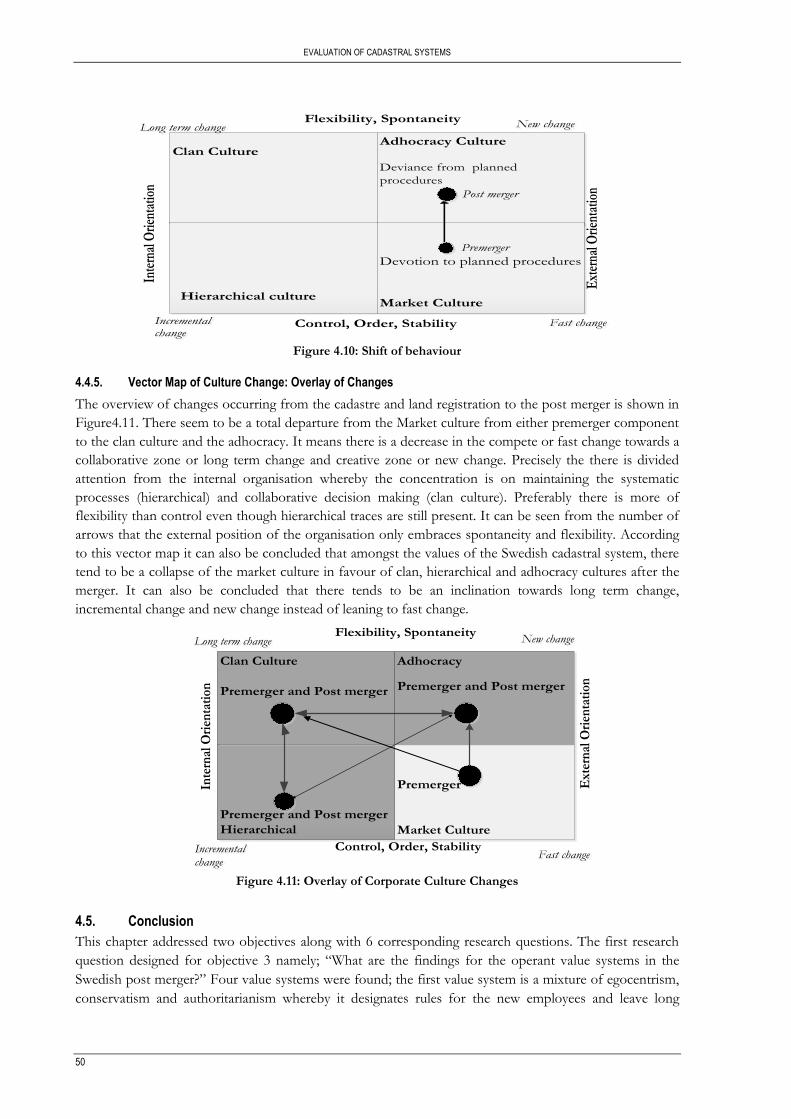
EVALUATION OF CADASTRAL SYSTEMS
50
Clan Culture
Adhocracy Culture Deviance from planned
procedures
Post merger
Hierarchical culture
Premerger
Devotion to planned procedures
Market Culture
Ext
erna
l Orie
ntat
ion
Inte
rnal
Orie
ntat
ion
Flexibility, Spontaneity
Control, Order, Stability
Long term change Long term change New change New change
Incremental
change
Incremental
change Fast change Fast change
Figure 4.10: Shift of behaviour
4.4.5. Vector Map of Culture Change: Overlay of Changes
The overview of changes occurring from the cadastre and land registration to the post merger is shown in
Figure4.11. There seem to be a total departure from the Market culture from either premerger component
to the clan culture and the adhocracy. It means there is a decrease in the compete or fast change towards a
collaborative zone or long term change and creative zone or new change. Precisely the there is divided
attention from the internal organisation whereby the concentration is on maintaining the systematic
processes (hierarchical) and collaborative decision making (clan culture). Preferably there is more of
flexibility than control even though hierarchical traces are still present. It can be seen from the number of
arrows that the external position of the organisation only embraces spontaneity and flexibility. According
to this vector map it can also be concluded that amongst the values of the Swedish cadastral system, there
tend to be a collapse of the market culture in favour of clan, hierarchical and adhocracy cultures after the
merger. It can also be concluded that there tends to be an inclination towards long term change,
incremental change and new change instead of leaning to fast change.
Premerger and Post merger
Hierarchical
Premerger
Market Culture
Clan Culture
Premerger and Post merger
Adhocracy
Premerger and Post merger
Flexibility, Spontaneity
Ext
ern
al O
rien
tati
on
Inte
rnal
Ori
enta
tion
Control, Order, StabilityIncremental
change
Incremental
change Fast change Fast change
Long term change Long term change New change New change
Figure 4.11: Overlay of Corporate Culture Changes
4.5. Conclusion
This chapter addressed two objectives along with 6 corresponding research questions. The first research
question designed for objective 3 namely; “What are the findings for the operant value systems in the
Swedish post merger?” Four value systems were found; the first value system is a mixture of egocentrism,
conservatism and authoritarianism whereby it designates rules for the new employees and leave long
EVALUATION OF CADASTRAL SYSTEMS
51
tenured employees to spontaneously attend to activities. The value system conserves the tradition of
keeping old information systems in favour of the external clients; the second value system is a mix of
collectivism, compassionate and proactiveness; the third value system displays flexibility, compassionate,
conservatism and collectivism; the fourth value system declares traditional collectivism, pragmatism and
entrepreneurialism over the existing tasks and procedures.
The second research question is; “What are the findings for operant value systems of the Swedish cadastre
in the premerger?” There are four value systems; the first value system is egocentric and exhibit
conscientiousness and impulsiveness towards solving problems; the second value system expresses
antagonism or non-conformism between freedom to criticise existing tasks and their procedures and the
need to follow rules, policies and procedures in place; the third value system exhibit conservatism in terms
of keeping tradition through depending on old standardised procedures and maintaining stability.
Simultaneously the value system expresses irrationalism whereby views reveal that employees do not
adhere to procedures and rules in place although the aim is to accomplish quantifiable results and markets.
The fourth value system is a mix of conservatism and authoritarianism; the views displays that people
consider listening to the instructions issued out by supervisors and adhere closely to given procedure. The
views shows that there is also preference for loyalty, tradition and commitment and it is normal that lower
ranks perform duties as given by the higher ranks.
The third research question is; “What are the findings for the operant value systems of the Swedish land
registration in the premerger?” There are four value systems; the first value system displays results
oriented pragmatism whereby the emphasis is to achieve tasks or goals at hand and measurable results
through installing order; the second value system displays monitored collectivism whereby the emphasis is
to depend and share information amongst each other. The value system allows criticism and exceptional
ideas but the directors pass final judgement; the third value system appreciates conservatism and
authoritarianism whereby the value systems prefers to keep the rules, policies and procedures that are in
place; the fourth value system displays an endeavour for entrepreneurialism whereby it struggles to bring
along new technology to transform the way land information should look like. Yet the involvement of
formalising new ideas retards the progressiveness of creating new working environments.
The fourth research question; “How can post merger operant value systems be distinguished from the
premerger operant value systems?” The first step involved automatic statistical processing of integrated
views of the post merger and cadastre’s premerger views. Results from the integrated views such as the
value system’s matrix and arrays, were compared to the post merger value system’s matrix and arrays.
Each value systems’ matrix is a composite of four clusters made up of views. Hence a set of views became
the denominator to crosscheck new and maintained classification or companionship of views after
introducing the premerger views. Similar classifications or companionship of views upon each cluster
from the value systems’ matrices of the post merger and the cadastre’s premerger identified unchanged
cluster of views. Simultaneously new classification of views indicated the presence of change. The second
step involved crosschecking the scores from value systems’ arrays of the post merger with value systems
arrays of integrated views on a Microsoft excel sheet. Therefore, post merger value systems were
distinguished by first mixing views of the premerger to identify the changes occurring to the value systems
of the post merger.
The fifth research question requires knowing; “How much do the post merger operant value systems
relate to either the land registration or the cadastre components of the premerger?” The relationship of
each component to the post merger was provided in form of similarities, differences and shifts. For
instance the cadastre’s value systems relate to the post merger value systems in that they display
conscientiousness and egocentricism towards solving problems attached to given tasks. Thus the value
systems of the cadastre inductively and proactively provide a unique solution for each incoming task.
However after the merger the new value systems allows new employees to systematically follow the
EVALUATION OF CADASTRAL SYSTEMS
52
existing processes to this value system gives its followers the official right to make decisions. It is also
observed that before the merger there used to be autonomy but after the merger the value system shifts to
cooperation when executing orders. While the greater emphasis on task and goal achievement and meeting
stipulated objectives is still maintained after the merger, the value system has turned to offer its followers
the opportunity to make instantaneous decisions at the point of the problem.
The land registration has its own shifts, differences and similarities too. For example there is a shift from
strict adherence to rules to flexible approaches to rules due to wider options of approaches made available
to tackle tasks. However the old employees are only ones who are confident and trusted to break rules
while the new employees remain the typical reflection of the previous “obedient” value system. While
maintaining the privilege to raise conflicting and exceptional ideas, after the merger the value system
removes the burden of making leaders the ultimate examiner, judge over problematic areas observed by its
followers on tasks and procedures. Thus the value system appreciates that its followers are competent
enough to undertake the rightful decisions. It is also true that before the merger the value system makes
an effort to acquire new opportunities under flexible conditions but after the merger the effort is
overridden by the shift to cooperation over doing things. Yet again after the merger, views begin to
consider a task and goal orientation. Before the merger all decisions around task and goal achievement are
approached according to the protocol of law while after merger decisions are made informally by those
employees affected by the problem.
The sixth research question is: “Which cases are likely to have had a change and how can I observe the
changes?” The cases that have changed involve the way decision making is done, behaviour concerning
the execution of tasks, work processes, leadership roles, and planned procedures. Changes were observed
by first extracting the similarities and differences from the narrations produced. Thereafter views involved
in the shift were tracked back to their culture typologies and mapped on the corresponding quadrant of
the competing values framework.
The present research recognises the limitations brought along by fewer premerger participants’ attendance.
Though fewer Qsorts/views of the premerger mean a smaller breadth of information, the present research
does not undermine the impact and strength they have to indicate change. However the present research
notices that if more premerger participants were available to evaluate the premerger components, there are
chances that there could have been more variation and changes.
Other possible notable limitations may be arising from the application of competing values framework to
build the statements for data collection. Even though Competing Values Framework may seem to cover a
broad range of organisational values, the present research cannot claim that the ideal values offered by the
framework are adequate. There tends to be constricted and aggregate culture typologies. Therefore it can
be said that the instrument is still universal and not local to depict a lot of changes. There seem to be an
erosion of validity caused by the nature of statements especially for Market culture. Hence it is neither
known if the problem is on the construction or meaning of statements that are market oriented. The
observations in field show that even though views accept the existence of task and goal achievement they
do seem to associate production with manufacturing in heavy industries. They do not see production in
terms of their line of business. Helfrich et al.(2007) identifies that the limitation associated with the
competing values framework is that of internal validity. Therefore the present research realises the
shortcoming of the competing values framework but does not repel the small noted changes observed.
Moreover the definition by Schein specifies that culture is gradually learnt by noting the assumptions that
arise from the internal integration and external positioning. Hence the present research gains confidence in
the use of Competing Values Framework because it gathers both the external and internal environments.
Moreover a qualitative and quantitative Q methodology guards the authenticity of the results. Therefore
Chapter 5 utilises the Competing values framework to contrast the findings identified.
EVALUATION OF CADASTRAL SYSTEMS
53
5. COALITIONS OF VIEWS IN PRE-MERGER AND POSTMERGERS
5.1. Introduction
This chapter contrasts the empirical shifts occurring from the premerger operant value systems to the post
merger operant values systems of the Swedish cadastral system with the competing values framework.
Therefore the objective of the chapter is to evaluate the change of the operant value systems from the
premerger state to the post merger state with the competing values framework. Section 5.2 evaluates the
cadastre empirical shifts from the premerger to the post merger while section 5.3 evaluates the land
registration empirical shifts from the premerger land registration to the post merger.
5.2. Coalition of the Corporate culture changes between the Premerger and Postmerger
The authenticity of culture changes obtained is constrained by the multifaceted origin of the participants
who evaluated the post merger cadastral system. Employees from sections of cadastral index maps, data
collaboration, real-property legislation, methods and specification, real-property formation and law and
regulations were found at disposal to evaluate the cadastral system. Each of these sections has
multifaceted teams organised to execute tasks. On one hand the organisational arrangement of the
participants can possibly constrain the quality of the changes obtained. Yet on the other hand, the
diversity of sections increase the confidence in the results obtained for the post merger in that the
constitution also tends to be varied enough to reflect the various distinctive value systems (Watts et al.,
2005). However the constitutions of the cadastre and land registration are streamlined to only three
sources of views; a surveyor or lawyer at top management and a policy maker. That means the premerger
components have a narrower breadth of views than the post merger (Webler et al., 2009). In addition
participants who evaluated for both the premerger and the post merger tend to have served the cadastral
system since before the merger with an average duration of 25-35 years. Some participants testified that
they had forgotten their experiences before the merger. This explains why three participants were available
to evaluate for the premerger state of the cadastre component. Ultimately change obtained turned out to
be small.
The nature of change is also constrained by the small education distance between the legal expertise and
the surveyors. Universities such as Lund are still producing expertise tailored to serve the Swedish
cadastral system. That means there are a lot of similarities between the law profession and survey
profession of Sweden. After all new recruits of Lantmäteriet organisation are tailored to learn the job at
hand by an in-house training of 18 months. Alternatively, it can be concluded that the findings are valid in
that the two teams are possibly similar and there change is possibly smaller.
Yet another constraint can be that, fewer women than men turned out for the interview to share their
views. Probably adding more women would have yielded some other additional subjectivity.
Apart from these limitations, the prime strength of the Organisational Culture Assessment Instrument
cannot be rejected. An OCAI instrument is a questionnaire constructed from a list of items that run across
four culture typologies consistently with the aim to differentiate types of organisational life. The
questionnaire is open to additional scales. For instance the present research utilised the OCAI scale which
employs four items to differentiate each culture typology; dominant attributes, leadership style, bonding
and strategic emphases (Ernst, 2001) (see section 2.3.2). For each culture typology the construction of
each items’ validity is confirmed from the research work by Desphande and others; Cameroon and
Freeman; Jaworski and Kohli (Ernst, 2001). The research by Deshpandé et al (1993) confirmed the fitness
EVALUATION OF CADASTRAL SYSTEMS
54
of customer orientation in the external environment with the dominant attributes of entrepreneurship and
competitiveness using Japanese companies as an example. Market culture is validated upon an
environment of “high turbulence in terms of the market, technology and competitive intensity”(Jaworski
et al., 1993, p. 1). Another research of 344 higher education institutions by Cameron et al (199l) shows
that the clan culture closely capitalises on morale and human relations. They also discover that adhocracy
and market culture are externally oriented. Furthermore, they confirm that strategies of control increase
the effectiveness of hierarchical culture. More empirical evidence from their study confirms the possibility
of having plural cultures in a single organisation. These results tally with the changes that occur from the
premerger of either cadastre or land registration component where the post merger ends up with more
than one culture (see section 4.4.5).
Based on the confirmations which are highlighted under this section and in Chapter2, the present research
continues to contrast the empirical findings to the competing values framework. The present research
realises the narrowness and aggregated culture typologies of the competing values framework. However
besides this limitation, the research realises the high face validity of competing values framework.
The competing values framework reflects the face value of culture which clearly mirrors its definition
from Schein. The definition “culture” by Schein conceptualises culture as the shared beliefs and values
that are gradually learnt by a group of people to copy with the internal environment and the external
environment. Likewise the framework of competing values is based on the comparison of the internal and
external assessment of the organisation. In the same respect it includes an additional comparison of
organisational structures. These comparisons formulate four different organisational lives (culture) that
organisations leverage to adapt the external and the internal environments. Therefore the competing
values framework immediately delivers the function to relate different types of cultures in terms of the
organisation’s adaptation.
The competing values framework exhausts its explanatory strength to the extent of SCHEIN’ culture
definition and HYNES’ corporate culture definition. (Hynes, 2009, p. 645) perceives corporate culture “as
the shared values and beliefs that help individuals understand organisational functioning and thus provide
them norm for behaviour”. Values tend to be an important element with influence on learning the
organisation’s functioning. Therefore the strength of competing values framework dwells in that it
appoints “values” as an instrument to measure culture. Simultaneously it provides the basis for analysis
too. Since the present research extracted statements using the OCAI scale of the competing values
framework, it also finds it viable to contrast the findings with the competing values framework.
The present research gains confidence in both the framework employed for analysing results and the
empirical shifts in that both qualitative and quantitative techniques were applied to collect data. Thus
interviews followed after the ranking of statements. Thereafter a statistical process free from the
researcher’s interruption was applied to unveil the underlying distinctive patterns of views for either the
premerger or the post merger. This means the results are free from the researcher’s bias. Unexpectedly
and fortunately, all participants involved completed the ranking exercise despite the fact that the method
was new to them.
Therefore discussions in the following sections employ the competing values framework to explain the
nature of changes depicted.
5.3. Coalition of the Corporate culture changes between the Cadastre and Postmerger
The discussions from section 5.3.1 up to section 5.2.3 focus on the observed changes of work processes,
behaviour towards task execution and decision making.
EVALUATION OF CADASTRAL SYSTEMS
55
5.3.1. Discussion on the change of work processes after the merger
The shifts presented by the work processes denote the presence of the competing values. Figure 4.2 and
Figure 4.3 presents that work processes have shifted from an internal environment towards an external
environment, and also work processes have shifted their focus from an external environment towards the
internal environment respectively. On one hand it means that some tasks are better handled with flexible
and adaptable work processes that are externally positioned relative to the customers and clients. These
work processes can be tuned according to the employees’ judgement and conscientious. Lawrence et
al.(2002) assert that the preference for flexibility involves inductive reasoning. Therefore it means that the
employees functioning with the externally positioned working processes use inductive reasoning towards
problem solving. They tune the work processes to adapt to the needs of the customers to the external
environment. Empirical data reveals that the subdivision procedure is flexible to involve the customers
concerning the pricing and service delivery, and therefore each meeting yields a different decision. Yet if a
step of the procedure is found unnecessary it can be eliminated. This is not true with working processes of
the land registration where they have stable complex information models specifically designed for each
data set. Therefore on the other hand, some work processes are effective when they are kept stable and
internally orientated. These work processes involve a methodical response where each procedure is
handled with caution and carefulness to avoid errors. Therefore the internally positioned work processes
are kept stable with incremental and consistent change.
Figure 4.1 displays the competing values within the internal environment of the organisation. The shift
reflect the polarity of flexible and collaborative attention over work processes versas the stable and
controlled attention over work processes. The competing values reveal a slow and flexible review of
working processes at the same time reveal an incremental change of working processes. This means that
some work processes flow smoothly and effectively when all key players collaborate and bring foward
their own ideas. Processes are reviewed to achieve satisfaction for everyone involved. Simultaneously
some work processes are effective when review is incremental and systematic to achieve quality, efficient
and error free processes.
5.3.2. Discussion on the change of behaviour towards task execution
The competing values framework identifies that value creation connects the specified behaviour to the
specified competencies and eventually to the created value (Cameron et al., 2006). Figure 4.4 displays
competing values as far as the behaviour involved to execute the tasks is concerned. It is therefore shown
that the execution of tasks is either internally oriented or externally oriented. On one hand, after the
merger, the spontaneous execution of tasks opposes the controlled execution of tasks. It means that there
is preferable effectiveness or value creation when people spontaneously respond to tasks or methodically
respond to tasks. Thus relating to externally positioned work processes referred in section 5.3.1, the
spontaneity and creativity towards the execution of tasks produces adaptive working processes that
emerge spontaneously to solve a given problem. According to the theory, there is congruence and fitness
that exists between the spontaneous proactive behaviour and the adaptive working processes. Hence these
findings also confirm the conceptualisation of adhocracy culture according to the competing values
framework in the context of the Swedish values.
On the other hand, the organisation’s internal environment tends to secure both collaborative execution
of tasks and the controlled execution of tasks. This means optimal effectiveness in the internal
environment of the organisation is achieved when people resort to helping each other and when they
systematically and consistently employ processes to guide themselves in the execution of tasks. The
manipulation of collaborative behaviour can simultaneously strengthen other cultures required by the
organisation. For instance if collaborative behaviour places more emphasis and enforcement on the stable
behaviour than the spontaneous behaviour, there is an opportunity to raise more stable internal-oriented
EVALUATION OF CADASTRAL SYSTEMS
56
work processes than flexible working processes. However this still stands as a presupposition but the
bottom line is that the views shows that the organisation prefers to have controlled, collaborative and
spontaneous execution of the tasks at the same time. In that case all these three behaviours work together
to yield effectiveness within the Swedish cadastral organisation.
5.3.3. Discussion on the change of decision making
Figure 4.5 presents a shift from a competitive decision making with external positioning relative to the
emerging markets to a collaborative decision making with internal focus relative to the people in the
organisation. The new preference enforces participatory and involvement in decision making than a
competitive and impatient focuses. It also means that there is there is preference for long term decision
making than fast short term decision making. Together Figure 4.5 and Figure 4.6 reveal that after the
merger, decision making has shifted into two opposing values; collaborative and autonomous decision
making. This means that effectiveness is achieved when both internal and external environments fosters
flexible and dynamic decision making. In that regard decision making calls for the freedom of each
employee or key player affected to participate at the same time calls for dynamic and adaptive response to
changing external environments. While the collaborative decision making seeks to achieve the satisfaction
of all the participants, it is equally important to achieve customer satisfaction through adaptive decision
making.
5.4. Coalition of the Corporate culture changes between the Land Registration and Postmerger
The merger between the Land registration and the cadastre results in three notable shifts of the Land
registration namely; the bond existing amongst the employees, the decision making and the leadership
roles too.
5.4.1. Discussion on the shift of the Bond or relationship existing amongst employees
Figure 4.7 reflects the collapse and deterioration of the hierarchical bond defined by rules, policies and
procedures towards a friendly bond characterised by loyalty, tradition and commitment. Preference to
converge in an internal friendly environment promotes value creation and effectiveness. The internal
environment of the organisation recognises the need for flexibility and dynamism in order to be
effectiveness instead of the systematic and controlled relationship where operation and functioning is
strictly authorised. It means ranks and authority becomes less recognisable too. Instead equality dominates
in the post merger. Thus in the post merger people begin to see each other from the same level. They
instead resort to helping each other than to be controlled.
5.4.2. Discussion on the change of decision making preferences
Figure 4.8 displays the presence of competing values in the sense that before the merger there is a
preference for competitive decision making by directors yet after the merger a collaborative decision
making dominates. Figure 4.8 shows the departure from an externally oriented decision making towards
an internally oriented decision making. Before the merger there is a preference for decision making that is
competitively positioned. The decision making embraces short-term emerging markets in order to satisfy
the customers by gaining a more markets. Moreover the decision making is competitively positioned to
outcompete the private sector. After the merger the attention shifts in disfavour of competition towards a
more flexible and long term decision making. The focus favours tradition to promote value creation and
satisfy the customer needs. There is tendency to satisfy the customer needs relative to employees’ needs in
the organisation. The authenticity of this analysis is further supported by empirical evidence that exhibits
the dismissal of the former Lantmäteriet division called METRIA after the merger. While the Lantmäteriet
political objectives favours tradition, before the merger METRIA department favoured competing with
EVALUATION OF CADASTRAL SYSTEMS
57
private sector. Upon this reasoning the participants evaluating the views sync this evidence to the shift
from compete value to collaborate value.
5.4.3. Discussion on the change of leadership roles
Figure 4.9 displays a shift from a hybrid leadership to a narrowly defined leadership. Thus there is a shift
from a wide strategic thinking to foster control and compete environments toward the creative strategic
thinking. Before the merger, effectiveness and value creation is deeply profounded through a hybrid of
leaders with competencies promoting competition and control in the organisation. Effectiveness is
achieved through paying attention to both the external environment of the organisation and the internal
environment of the organisation. Therefore before the merger the focus is more on achieving the results
fast and more dependence of incremental improvement of activities. Eventually the coordinators are
installed to drive stability and control to cultivate effectiveness before the merger. Similarly the
competitive directors are found effective through promoting a fast and speedy recovery of strategic
thinking to match the external positioning. After the merger the innovators, risk takers are installed with
emphasis to the spontaneous and creative strategic thinking that drives radical innovation in the external
environment of the organisation.
5.4.4. Discussion on the shift of behaviour towards the planned procedures of a task
Figure 4.10 presents a shift from dedicated adherence to planned procedures set for a task, towards
deviation from planned procedures set for a particular task. Moreover, the shift occurs from the external
focus of the organisation where preference for spontaneous and innovative thinking dominates over the
strict adherence to planned procedures detected. Therefore it means innovative thinking is rather effective
for tasks in place instead of sticking to detected procedures. Also the organisation is better off with an
innovative and creative external positioning than a competitive and controlled positioning.
5.5. Conclusion
The discussion addressed the demands of the chapter which prompts for the evaluation of the extent to
which the competing values framework could explain the empirical shifts. The competing values
framework could explain the shifts in terms of the organisational focus and the nature of structures. It
means the shifts were explained from either their external positioning or their internal positioning and
from either their flexibility or stability. From these continuums flexibility versas stability and internal
integration versas external position the competing values framework manipulated the characteristics of
each quadrant to explain the empirical findings too. It also means the analysis engaged a holistic overview
of cultures assuming that an organisation will bear more than one culture. For instance the premerger
cadastre transition to the post merger has four notable changes. These include a shift from externally
oriented and flexible work processes towards internally oriented and stable work processes. Alternatively
another shift displays a departure from internally oriented work processes to externally oriented work
processes. Hence work processes tend to alter their position between the hierarchical and the adhocracy
cultures. Additionally work processes shifts internally from the hierarchical control to the clan culture. On
the other hand work processes tend to shift from the clan culture where equality is responsible for slow
review, towards the hierarchical culture where efficiency increases the effectiveness of working processes.
The cadastre component also maintains the spontaneous and flexible behaviour at the same time departs
towards the stable and collaborative behaviours as far as the execution of tasks is involved. Therefore the
behaviour engaged to execute tasks shift from the adhocracy culture to the collaborative culture and the
hierarchical culture. The cadastre component also displays a shift from competitive decision making
towards the collaborative decision making. Alternatively there is a shift from collaborative decision making
towards the adaptive decision making. This means decision making has shifted from the clan culture
towards the adhocracy culture.
EVALUATION OF CADASTRAL SYSTEMS
58
The Land registration component indicate shifts of the bond or relationship existing amongst employees,
decision making preferences, leadership roles and behaviour towards the planned procedures of a task.
There is a decrease of the hierarchical bond in favour of the collaborative friendly bond. Decision making
also shifts from the coercive directors towards a collaborative and participatory decision making.
Leadership roles are narrowed from a hybrid of coordinator or rule enforcers and producers or
competitors to innovators or entrepreneurs. Finally there is a shift from a systematic and methodical
response to task towards a spontaneous proactive response to tasks.
The authenticity of these results is guaranteed on the basis of the methods applied to extract, process the
data and analyse the empirical findings. Their analysis is also guaranteed to the reputable competing values
framework with reiterated high face validity and reliability. There seem to be exactness in what the
competing values framework claim to measure in conjunction with the definition of SCHEIN’s culture
and HYNES’ definition of corporate culture. Values are the pivotal element to display the types of
organisations. Likewise the competing values framework employs values as the core instrument to measure
culture. Hence the present research gains confidence in both the results and the framework used to
analyse the findings. In that case it can be highlighted that the framework played two roles; generation of
statement and analysis. The advantage of the framework is that it has a flexible questionnaire structured
systematically and consistently across each culture type. Thus the advantage tends to be a disadvantage
from another extreme in that the questionnaire (OCAI) tends to come in varied versions. Some
questionnaire employs 6 items while some have 5 items measure culture. Thus the present research
employed a 4 item questionnaire validated by Desphande and others. Probably there could be some
erosion of quality by dropping one scale. It turns out that fewer statements keep the participants active in
the process than more statements which can easily frustrate and stress the participant. It is possible that a
participant may fail to finish the process.
The capacity of Q methodology during the research was established in combining the qualitative and the
quantitative methods in order to collect views. Ultimately the processing of the values did not depend on a
single source of data. Thus the quantitative rank ordering was accompanied by interviews to secure the
true meaning of the views. Therefore the value systems obtained for each state (either the premerger or
the post merger) maintained originality and displayed subjectivity as obtained in the field. Moreover, the
automatic statistical processing of the results was free from the researcher’s interruption and therefore Q
results obtained were free from the researcher’s bias. Furthermore, during the research the strength of Q
methodology was noticed in the ability to pick out the smallest changes of corporate culture from the
transition from before the merger to after the merger. Q methodology was able to distinguish existing
patterns of shared values from the raw data whose state remains clumsy and complicated to manually pick
out the shared values. In that manner the variation of emphasis for each value system was obtained. It can
also be said that the suit of methods accompanying Q methodology was able to derive interpretable
results. Yet the prime limitation encountered during the data collection was that participants remarked the
ranking process as difficult. Even though participants turned to like it and complete the targets, the
method was new to them. Other participants often found it difficult to prioritise statements. Some
participants rather thought it was better if there was an asymmetrical or freedom offered by the forced
distribution scale. Some participants suspected that the method was beyond the research material and felt
they were rather putting their organisation at stake. However even though they started by complaining,
eventually they would turn to like the process.
A possible limitation from using the Swedish case is that there seem to be a close professional distance
between the law and the survey professions, hence the small culture change. The empirical findings from
this case remain exploratory and cannot be generalised to other cases. Chapter 6 further highlight the
limitations of results through conclusions on each research question.
EVALUATION OF CADASTRAL SYSTEMS
59
6. CONCLUSIONS AND RECOMMENDATIONS
6.1. Introduction
The objective of this chapter is to respond systematically to each of the research questions displayed in
chapter 1. Thereafter the chapter takes note of the limitations and the extent of validity within the research
findings of the Q methodology utilised section 6.3. Recommendations to achieve more change, future
research and to the practitioners in the Swedish cadastral system are noted down in section 6.4. Finally the
conclusion withdrawn from the thesis is articulated in section 6.5.
6.2. Research Questions
The present research’s main objective was to evaluate corporate culture changes in cadastral mergers. The
drive behind this objective was to note the changes through the corporate culture lens after merging the
land registration and the cadastre components. The research utilised the Swedish cadastral merger by
appointing Lantmäteriet as the organisation to study the changes that have occurred after the merger.
Four objectives were designed to address the main objective: (1) To describe the important elements of
corporate culture elements; (2) To device the tools and methods to be used to measure the elements of
corporate culture in the Swedish cadastral system; (3) To measure the corporate culture elements for land
registration, the cadastre and the merger in the Swedish cadastral system; (4) To compare the research
findings for land registration corporate culture elements, cadastre corporate culture elements and the
merger corporate culture elements. The extent and adequacy of answers to these objectives and their
research questions are outlined in the following paragraphs.
6.2.1. Objective1: To describe the important elements of corporate culture
Three research questions designed to address this objective involved; (1) What are the elements of
corporate culture? (2) How can the elements of corporate culture be classified? (3) How can the classified
corporate culture element/s be measured? The extent with which each of the research questions was
addressed is unveiled below.
What are the elements of corporate culture?
The term “culture” was the foundation to initiate the response to the research question. The definitions
from Schein quoted by Herzog(2008) and Hofstede cited by Contiua et al (2012) were used on the basis
that they are frequently referred to by other researchers. Schein perceives culture as a “pattern of shared
basic assumptions that the group learned as it solved its problems of external adaptation and internal
integration, that has worked well enough to be considered valid and, therefore, to be taught to new
members as the correct way to perceive, think, and feel in relation to those problems”(Herzog, 2008, p. 1).
Simultaneously Hofstede perceives culture as the “mental programming that differentiate one group of
people from another” (Contiua et al., 2012, p. 553). These definitions were considered because of; (1) the
separate historical evolution of land registration and cadastre components; (2) the different education
systems involved to raise the legal expertise responsible for the land registration and the surveyor
responsible for the cadastre component. Hence the assumption was that the upbringing of the lawyers
influence their value systems differently from the surveyor’s values whose upbringing is also different.
According to Schein and Hofstede, the key elements of culture involve the symbols, heroes, rituals, norms
and values. Other authors like Deal et al (1982) add two more culture elements such as the business
environment and the cultural network. Therefore the elements of culture involve symbols, heroes, rituals,
norms, values, the business environment and the cultural network. The models of Hofstede and Schein
EVALUATION OF CADASTRAL SYSTEMS
60
together with the definition of corporate culture converge to a value as the prime element of corporate
culture. Likewise the present research considered a value as the central element of corporate culture.
How can the elements of corporate culture be classified?
There are two frameworks to classify the values were identified. These include the colour coding framework and the competing values framework.
The colour coding framework gathers and matches similar culture typologies from 3 researchers who have
employed different nomenclatures. There are four culture typologies that are classified. According to
Vrakking’s nomenclature the four types are: Task, Power, Persons and Role. According to Quinn and
McGrath’s nomenclature the four types are: Ideological, Rational, Consensual and Hierarchical. Relative to
the nomenclature by Maccoby the four types are: Expert, Innovator, Helper and Defender. The colour
coding framework by Porter, gathers similar types of culture into one group where they obtain one single
name according to Porter. Four groups of this various nomenclature are: Cool green, Hot Red, True blue
and Dull gray.
The Cool Green is made up of: Task, Ideological and Expert;
The Hot Red is made up of: Power, Rational and Innovator;
The True blue is made up of: Persons, Consensual and Helper;
The Dull gray is made up of: Role, Hierarchical and Defender.
Thus the for culture types by Porter’s colour coding theory involve: The Cool Green, The Hot Red; The
True Blue and The Dull Gray. This classification of values tallies with the competing values framework.
However the limitation behind the framework is the approach to measure the differences of the values.
There tend to be a variation and inconsistency of scales overlapped on one framework to identify the
nature of each of the 30 organisational aspects used to characterise each typology. For this reason the
present research considers some of the scales from this framework based on their corresponding culture
typology.
The competing values framework classifies values by overlapping the two dimensions displaying
conflicting descriptions of the organisational structures and focus (Dastmalchian et al., 2000). The vertical
dimension differentiates flexible, adaptable, dynamic and spontaneous structures from control, stable and
order structures. The horizontal dimension differentiates the organisation’s internal focus from the
organisation’s external focus. The two dimensions form four quadrants classifying values into four types:
clan; adhocracy; hierarchical and market or alternatively collaborate, create, control and compete
respectively. Each quadrant is defined by a set of an OCAI scale (questionnaire) consisting of sub- items
to uniformly display the characteristics of each quadrant or value. The advantage identified by the present
research is the consistency and uniform manner supplied to measure the values through the OCAI scale.
Moreover the framework itself provides a basis to analyse the empirical findings. Therefore the present
research considered the competing values framework together with a four validated OCAI scale from
Desphande and others. The OCAI scale include: Dominant attributes, Leadership style, Bonding, and
Strategic emphasis (Ernst, 2001). However the scale is flexible for additional scales.
Therefore additional scales were obtained from the colour coding framework with the intent to sharpen
the robustness and locality of competing values framework. The nomenclature from the competing values
framework was adopted to differentiate the values: Clan, Adhocracy, Hierarchy and Market cultures.
These four cultures are identical to Porter’s culture typology. Clan is identified as True Blue; Hot Red is
identified as Market; Cool green s identified as Adhocracy while Dull grey s identified as the Hierarchy.
From the Colour coding framework three scales involved were Standardisation of work processes,
Standaridisation of professional training and Autonomy of individuals. Eventually the OCAI scale carried
7 scales in total in order to generate the statements for withdrawing the views or opinions from the
Swedish cadastral merger.
EVALUATION OF CADASTRAL SYSTEMS
61
How can the classified corporate culture element/s be measured?
According to Lamond(2002) values can be measured using Q methodology and the competing values
framework. Lamond (2002, pp. 50-52) asserts that “varied series of instruments based on the Q
methodology” can be applied. One way involves requesting respondents to distribute 100 points against
each of the six items of the questionnaire including: Dominant characteristics; organisational leader;
organisational glue; organisational climate; criteria for success and management style (Lamond, 2002).
“ For each of the items respondents are provided with four descriptions of organisations corresponding to
each of the four competing values” (Lamond, 2002, pp. 50-52). The total score for each item is averaged
to produce a profile against each of the values. However, researches from O’Reilly et al (1991) express
dissatisfaction and rather choose to employ a 5 point Likert scale with terms of reference varying from
“little extent” up to “great extent”. Their choice for Likert scale is that it enables the correlation analysis
of values. Out of the same six items of the OCAI scale, Howard (1998) generates a “48 item paper-and-
pencil version of a Q sort data collection instrument to capture the competing values dimensions”
(Lamond, 2002, p. 51). A multi-dimensional scaling data analysis is employed to assess the variation of the
findings. A research by (Tufts et al., 2010) to investigate leadership styles uses 36 statements from the
competing values framework based on the Qmethodology techniques. Their research applies forced
ranking to extract the variation of leadership types within public sector IT professionals. They apply factor
analysis techniques to extract the patterns of leadership types and uses narrations to conceptualise each of
the leadership.
Therefore the present research utilises Q methodology and a set of 36 statements formulated from the
competing values framework to measure the corporate culture element; values. The statements are
generated using four items from the Competing values framework questionnaire: Dominant attributes,
Leadership style, Bonding, and Strategic emphasis and three additional scales from the colour coding
framework. Each of the items is described according to four types of values or culture typology from the
competing values framework. The views collected are differentiated and classified into distinct patterns
by employing factor analysis. Eventually the best mathematical solution produced is synthesised by
narration to conceptualise each value system obtained.
6.2.2. Objective2: To device the tools and methods to be used to measure the elements of corporate culture in the Swedish cadastral system
Which of the methods can I use and why to observe and describe corporate culture elements in
reality?
Q methodology was applied because of its statistical investigative procedures that help to retrieve shared
human subjectivity or perceptions. The first step of Q methodology began by identifying the relevant
concourse of corporate culture elements, their classification and how they can be measured. The analysis
of corporate culture concourse determined competing values framework as the most feasible framework
to measure corporate culture within a short specified period of six months. The Organisation Culture
Assessment Instrument of the competing values framework became the prominent tool to strategically
design statements. Q methodology allows the appointed participants to express their views by sorting the
selected statements on a graduated forced distribution scale. Therefore the source of the statements was
the competing values framework and the seven aspects concluded in objective 1. The seven aspects were
consistently varied across four culture types provided by the competing values framework. For each
culture typology a set of statements was generated based on those seven aspects. In total 76 statements
were generated in the beginning and reduced gradually by judging their representativeness of other
statements formed around a single aspect. The end result of the statements involved 36 statements.
Therefore the statements became part of the tools to be used. The package of 36 statements to evaluate
the corporate culture changes in the Swedish cadastral merger was accompanied by a forced distribution
EVALUATION OF CADASTRAL SYSTEMS
62
scale graduated from (+5) through (0) to (-5). A protocol to guard the consistent flow of instructions
across the participants formed part of the tools too.
Likewise the participants from the Swedish merger were allowed to express their opinions on the
graduated scale constituting 36 boxes belonging to a particular graduation. The graduation stretched from
“strongly agree” at (+5) through “neutral” at (0) until “strongly disagree” at (-5). Eventually the expression
of views from each participant produced a gestalt of views and communicability. 16 sets of views were
obtained from 16 participants who expressed their perception for the post merger. 2 additional sets of
views expressed the individuals’ perceptions about the land registration before the merger. Similarly 2 sets
of views were obtained from the individuals’ perception concerning the Cadastre component before the
merger. Obtained views were automatically the raw data and tool to observe and describe corporate
culture elements. However, statistical processing was done to extract distinct regularities and patterns
similarities of the views obtained from the Swedish cadastral professionals. Statistical tools from the
PQMethod program engaged the Principal Component Analysis to classify the views of the cadastral
professionals installed in the program and to arrive into a single best mathematical solution. The solution
constitute products such as the correlation matrix, a cluster of views or value systems and the best “set or
arrays of views” (value systems array) to represent all the views uploaded for statistical processing. The
best “set of views” contains 36 statements evaluated according to the shared perception in form of the
score varying from “strongly agree” at (+5) through “neutral” at (0) until “strongly disagree” at (-5). Four
groups or clusters of views were obtained. For each array of the four groups identified, the logic of
abduction from Watts et al (2012) was employed to consistently and holistically narrate the contents of
each value system. In that way the message conveyed by each value system was revealed by the narrations. Therefore 3 separate similar statistical operations were applied to the post merger views, the integrated
post merger and land registration views, and the integrated post merger and cadastre views. This tactical
approach allowed the comparison of the post merger views with the premerger views. This reveals the
massive strength of the Principal component analysis. However the weakness of Principal component
analysis is that it lacks the form to interpret the results it has produced. Therefore the present research
turned to seek the meaning of results from the competing values framework.
In total tools and methods to observe and describe corporate culture elements can be separated in three
parts. In order to solicit the views of participants tools such as; (1) statements; (2) Graduated forced
distribution scale; (3) Protocol or “condition of instruction” to govern consistence. In order to classify the
views of cadastral experts a statistical tool called the Principal Component Analysis was used. In order to
interpret the statistical results, a logic tool from (Watts et al., 2012) was applied to narrate each value
system. In order to note the culture changes and interpret the meaning of the changes the competing
values framework was used.
6.2.3. Objective3: To measure the corporate culture elements for land registration, the cadastre and the merger in the Swedish cadastral system
What are the findings for the operant value systems in the post merger?
Four value systems were found; the first value system is a mixture of egocentrism, conservatism and
authoritarianism whereby it designates rules for the new employees and leave long tenured employees to
spontaneously attend to activities. The value system is conservative to the tradition of keeping old
information systems in favour of the external clients; the second value system is a mix of collectivism,
compassionate and proactiveness; the third value system displays flexibility, compassionate, conservatism
and collectivism; the fourth value system declares collectivism, pragmatism and entrepreneurialism over
the existing tasks and procedures.
What are the findings for operant value systems of the land registration in the premerger?
EVALUATION OF CADASTRAL SYSTEMS
63
There are four value systems; the first value system displays results oriented pragmatism whereby the
emphasis is to achieve tasks or goals at hand and measurable results through installing order; the second
value system displays monitored collectivism whereby the emphasis is to depend and share information
amongst each other. The value system allows criticism and exceptional ideas but the directors pass final
judgement; the third value system appreciates conservatism and authoritarianism whereby the value
systems prefers to keep the rules, policies and procedures that are in place; the fourth value system
displays an endeavour for entrepreneurialism whereby it struggles to bring along new technology to
transform the way land information should look like. Yet the involvement of formalising new ideas retards
the progressiveness of creating new working environments.
What are the findings for the operant value systems of the cadastre in the premerger?
There are four value systems; the first value system is egocentric and exhibit conscientiousness and
impulsiveness towards solving problems; the second value system expresses antagonism or non-
conformism between freedom to criticise existing tasks and their procedures and the need to follow rules,
policies procedures in place; the third value system exhibit conservatism in terms of keeping tradition
through depending on old standardised procedures and slow change. Simultaneously the value system
expresses irrationalism whereby views reveal that people do not adhere to procedures and rules in place
although the aim is to achieve measurable results and markets. The fourth value system is a mix of
conservatism and authoritarianism; the views displays that people consider listening to the instructions
issued out by supervisors and adhere closely to given procedure. The views shows that there is also
preference for loyalty, tradition and commitment and it is normal that lower levels execute orders from
higher levels without complaining.
6.2.4. Objective4: To compare the research findings for land registration corporate culture elements, cadastre corporate culture elements and the merger corporate culture elements
How can the post merger operant values be differentiated from and the premerger values?
Views of the post merger are statistically processed by factor analysis techniques to generate a single best
solution from which products such as the cluster of values and statements arrays are useful for
differentiation. While the cluster of values displays the pattern of shared views and those views which best
approximates a cluster, the statements arrays withdraws best fit scores against 36 statements based on the
weighted averaging of significant approximating views per each cluster. The cluster of values and the
statement arrays are the source of comparison between the post merger and the premerger. However the
premerger components suffer from limited number of participants therefore there is a narrow breadth of
views.
Each of the premerger components constitutes of 2 sets of views which cannot be statistically processed
alone. Thus views from each of the premerger component are added separately to the post merger to
note the changes they cause. Each integration, (post merger and cadastre views or post merger and land
registration views) is statistically processed by factor analysis techniques to obtain the best mathematical
solution comprising of the “cluster of values” and “value systems’ arrays”. The role of factor analysis is
therefore to expose the underlying distinctive patterns of the value system. Comparison of the views from
the post merger with the new generated values from the integration of either components is done through
tracking the patterns of views which best approximate a “cluster of values”. When views approximating
each “cluster of values” are maintained after the integration, it is most probable that the cluster has kept
its rigidity or changed a little bit. Yet when there is a change of views approximating a cluster of values,
there are higher chances that there is a new meaning delivered by the value. The scores of the statements
arrays are re-established when a new pattern of views arises after the premerger views are integrated with
the post merger. Therefore based on the statements arrays befitting each cluster of values, a holistic
narration for both the post merger and the premerger value systems are crystallised to reveal their
meaning.
EVALUATION OF CADASTRAL SYSTEMS
64
Narrations are based on the quantitative statistical findings of statement arrays together with the
qualitative findings from the interviews to enrich the meaning conveyed. The narrations are done for the
post merger, the land registration premerger and the cadastre premerger separately. Each premerger
component is related to the post merger via the value systems created and the meaning posted by each of
the value systems. However, the matrices of cluster of values are put to use for comparison of these
narrated value systems. Since views of the premerger components are few, they did not disturb the entirety
of the views of the post merger. Thus some views maintained their companionship and pattern even after
the integration of views for both premerger and the post merger. This implies no change or little change
as far as those particular clusters are concerned. Thus similar grouping of views are matched together and
compared to fetch out any difference in their meaning. At the same time some views are disturbed and an
excel sheet is used to extract almost similar views. Eventually each cluster of values within either of the
premerger component is cross matched with the corresponding cluster in the post merger values to
identify similar and almost similar views. Their narrations are compared correspondingly following the suit
of matching clusters. The similarities, differences, and shifts conveyed by the comparisons are noted
down.
How much do the post merger operant value systems relate to either the land registration or the
cadastre components of the premerger?
Similarities, differences and shifts permit to relate the post merger to either the land registration or the
cadastre component. The empirical findings depict the plurality of conflicting values. This strange
occurrence is inconsistent and familiar with the theory of the competing values framework.
On one hand, both the cadastre and post merger values consider criticising the existing procedures
planned for tasks. Even though rules prevail to guide employees in the premerger, limitations such as
unclear ranks and authorities over processes forces the coordinators or rule enforcers to loosen up and
allow the employees to criticise the tasks. In a similar fashion but in a different way the premerger value
stimulates pomposity and pride out of the competent and long trained employee by endorsing that they
are competent enough not to listen to orders or procedures accompanying the tasks. After the merger the
value system finds another reason to raise criticisms. For instance, the new value condemns incoming new
technology such as Web Map Service, new formats like GML (Geographic Mark-up Language), new laws
like INSPIRE (Infrastructure for Spatial Information in the European Community) despite the diversity of
tasks and voluminous workload involved. The perspective said by the value system is that long tenured
employees applies accumulated knowledge and experience to solve problems with a customer at mind
instead of leveraging technologies that eventually strain the unconversant client who is yet to learn new
technology.
On the other hand, both premerger values of the cadastre component and post merger values are related
through order whereby they foster clear authority over processes and prefer to structure employees by
rules. In that manner the value system consider employees to follow planned procedures set for a
particular task or goal. Maintaining order through organising the employees by their specialisation into
departments prevail in both the post merger and the premerger value systems.
Additional similarities between the old cadastre and the new post merger value systems involve the
renewal of people through an in-house training.
Finally another set of value system that links the post merger with the premerger cadastre involves task
and goal achievement. In that manner, both old and new value systems prefer a continuous adaptation to
ever changing markets.
The transition from the premerger values to the post merger results in a multifaceted changes of work
processes. The nature of changes of values yields opposing values that are consistent with the competing
EVALUATION OF CADASTRAL SYSTEMS
65
values framework. For instance while the hierarchical control of some processes deteriorates in favour of
slow collaborative review after the merger, some work processes shifts from slow reviewing to a
consistent and incremental change after the merger. Thus after the merger, from the internal environment
of the organisation there is preference to keep other processes in the hands of the team’s attention while
some other processes are better off when they are strictly monitored and controlled. In addition some
work processes hibernate a double faced change whereby the same work processes are kept stable and
incrementally changed but on other end they are rather flexible and adjustable relative to customers’
needs. The change of work processes is accompanied by the change of behaviour towards the execution
of these work processes. It turns out that the behaviour towards the execution of tasks takes a
multifaceted change from the spontaneous execution of tasks in the premerger towards a controlled and
collaborative execution of tasks in the post merger. However, the behaviour of execution of tasks also
secures a position of spontaneity. Likewise, decision making transit from the coercive hands of the
directors before the merger and delegated to employees’ collaborative authority after the merger. Yet some
decisions are withdrawn from collaborative attention by employees to individual authority where
autonomy prevails. It can then be concluded that culture change from the premerger to post merger is
gradually and carefully undertaken instead of revolved. Therefore a multifaceted change tends to occur
while maintain some parts of the premerger values.
Plural conflicting value types characterise both the premerger of the Land registration and the post
merger. On one hand both land registration and post merger values consider paying close attention to
planned procedures scheduled for tasks. The land registration value system before the merger, is entitled
to adhere to planned procedures because employees cannot copy or memorise the complicated inbuilt
digital technical laws for each information model designed for each data set. After the merger the value
system entitles employees to follow planned procedures because they are incompetent and are at the
learning stage. In both cases there is no opposition raised against the procedures at hand. On the other
hand both old and new values consider criticism and collective participation. Conflict is perceived as a sign
of participation revitalising the group to fully engage with a diverse range of tasks which are accompanied
by a varied range of approaches. Thus employees engage with each other to share ideas and knowledge.
On one hand the old and new values review processes after a longer period of time in order to
accommodate stability and standards within some information models that are designed for building data
sets, land parcels data sets, etc. On the contrary the old and new value systems consider a fast review of
processes to quickly address the changing tasks as the changing markets take charge. Both the land
registration and post merger values thrives to secure innovation lead at the same time achieve measurable
markets. In return the value systems are faced with a diversity of tasks accompanied by a wide choice of
options. Nevertheless in case of conflict, the value system relies on law processes and hence it is only
formal means are used to resolve conflicts. However there are shifts that distinguish the land registration
values from the post merger values.
The post merger values depart from land registration premerger values through aspects of decision
making, leadership roles and bonding systems. Thus before the merger the value system confers that
employees are held together by law but after the merger there is a decrease of the hierarchical control in
favour of friendliness, tradition and commitment. The value system shifts from the coercive control in
courts where the judge is the decision maker and seen as the head to a flexible environment where a chief
line manager functions close to his group to motivate people towards participation and make decisions as
a group. Thus the director’s responsibility to make decisions is decreased in favour of collaborative
decision making. Moreover, after merger the leadership is narrowed from a hybrid coordinators and
competitors to innovators. In actual fact leaders with flexible and creative mindsets are preferred after the
merger than leaders with coercive and methodical mindsets. Alternatively, the strategic thinking is
narrowed after the merger. Yet again, there tends to be a deterioration of the devotion by employees as far
EVALUATION OF CADASTRAL SYSTEMS
66
as planned procedures are concerned in favour of deviance from the planned procedures. The shift of the
from the old value to the new value expresses the need for flexible inductive thinking than a controlled
short-timed thinking that is accompanied by instructions.
Which cases are likely to have had a change and how can I observe the changes?
The cases that have changed involve the way decision making is done, behaviour concerning the execution
of tasks, work processes, leadership roles, and planned procedures. Changes were observed by first
extracting the similarities and differences from the narrations produced. Thereafter each view involved in
the shift was tracked back to its culture typology and mapped on the corresponding quadrant of the
competing values framework. It means the competing values framework was utilised to map the original
state before the merger and map the destined state after the merger.
6.2.5. Reflection on Anticipated results
The vector map in section 4.4.5 indicates that the direction of change from either of the components is in
favour of the flexible, long term change and new change than stable, incremental and fast change. Thus
change prefers to occur in preference to flexible cultures of Clan and Adhocracy than cultures calling for
order and stability like the Hierarchical and Market cultures although the traces of these stable cultures are
still present. The land registration decreases the controlled coercive decision making in favour of the
clannish flexible decision making by all employees. However already some culture change of the cadastre’s
component oscillates or alternate between flexible cultures of adhocracy and clan cultures. Therefore both
components pursues change in the direction of flexible cultures.
6.3. Limitations and Strengths of the Study
The limitations inherent to the present research propagate from the fewer premerger views obtained. Thus
fewer views result in a smaller breath of variability and information. Alternatively fewer views cut off the
amount of change. Yet their influence and impact to depict differences is realised vividly despite the fact
that the change they are able to show is small. It means that the methods employed to withdraw change
are undeniably robust. The use of Q methodology determines the distinctive shared patterns on the views
thus exposing the difference by statement arrays and their scores instead of person data like age,
experience, height etc. The methodology remains focused on the views instead of the person. Therefore Q
method empirical results only can be generalised to the population of views and not to the people
population.
At this juncture it can be recalled that during the construction of statements, a framework whose coverage
is broad enough to reflect the communicability relative to past theories was employed. The limitation of
the competing values framework is that it has narrow and aggregated culture types. That means it does not
refine itself for local use as it is. However the accompanying OCAI scale is operational enough to be used
to extract the value systems. Meanwhile the OCAI scale is open for additional scales that draw closer to
the study at hand. In that manner the present research employed 7 aspects to pick the details of the
organisational lives. Furthermore, the strength of competing values framework lies with the ability to
gather conflicting theories of the past generation on a single point of analysis. Simultaneously the
competing values framework is able to compare internal organisational adaptation relative to the
organisation’s external positioning. This gives enough coverage of the organisational life. However the
present research cannot claim that the statements obtained based on the competing values framework had
broad coverage for all culture communicability. But, the present research is convinced that the statements
covered the broad range of four forms of organisations reiterated; hierarchical; clan; adhocracy and
market.
Simultaneously additional limitations from Q methodology lie within the ranking exercise of statements.
While the force distribution scale strain the participant to reflect emphasised views, participants began by
EVALUATION OF CADASTRAL SYSTEMS
67
complaining because they said the task was difficult. However, they ended up liking the exercise and all of
them completed their portion of exercise. The strength of the data collection procedure is based on the
notion that both Quantitative and Qualitative methods were applied. The ranking process itself is
quantitative while the accompanying interviews to explain the flow communicated by their ranking are
qualitative. Interviews also targeted extreme highly emphasised views and those neutralised views. It
means interviews were able to unveil different interpretations of scale like “Neutral”. It happens that the
scale played different roles to the participants. The constitution of the participants also covered a variety
of sections thus creating variability of thinking. However men tended to be more than women. This can
be a limitation in that probably women perceive the organisational life in different manner. Yet the views
are pivotal to this research and they are variables themselves hence the person is not the concentration of
this research.
The statistical processing arrested the quantitative views for analysis thus rescuing the introduction of bias
in the views. The strength of the statistical process offered by factor analysis seems to be the core input to
this research. The processing was the root where values were identified according to the shared perception
and their distinctive variation or nature. This proves that Q methodology directly measures corporate
culture and meets the demands of corporate culture instantly. Therefore Q methodological statistical
processing together with the ranking can be qualified as a valid methodology to measure corporate culture.
The distinctive thinking by Hofstede is revealed when the participant is given freedom to rank statements
according to his/her opinion or thinking. The shared perception revealed by the Factor analysis is
consistent with the central pivotal concept of a value. Following the Q empirical findings a consistent logic
of abduction is applied as adapted by Watts. This closes the weakness behind limited method to interpret
Q statistical results.
The use of a single case study remains exploratory and confined for the present research. That means the
empirical findings cannot be generalised to the whole world, or to Europe itself and definitely not to
Africa either. The fact that cadastral systems are varied in terms of their operations means that Sweden
forms its own unique cadastral system too. For instance the present research discovered that there is a
small professional distance established between the law professionals and the survey professionals.
Lantmäteriet uses an in-house training as a gate of entry to new employees. Lawyers are not an exception
to this bracket as revealed by the interviews. This implies that changes could be more or less. Yet if the
methodology is applied in the context of other merger cases where the professional distance between
surveyors and lawyers is large, there can be a big differences obtained but it cannot be guaranteed that
change obtained in those cases will be small or big. A large distance of professions may actually yield
resistance and end up indicating no change. Therefore the culture changes obtained from the Swedish
cadastre remains important in the manner that even with fewer views the presence of change were noted.
Yet the present research is confident to stress that the Swedish case may actually be having more changes
based on the noted observations. More views for the premerger would turn out to enlighten more
changes.
6.4. Recommendations
Based on the corporate culture changes obtained, the present research considers the following
recommendations:
6.4.1. Swedish Managers/ Practitioners
The contrast of the empirical findings to the competing values framework helped to identify the direction
of change; Culture change tends to be more inclined to flexibility than stability. Precisely change takes
place to three cultures: Adhocracy, Clan and Hierarchical. Therefore the present research recommends:
EVALUATION OF CADASTRAL SYSTEMS
68
Managers to consider that an overemphasis of one culture may cripple the effectiveness and progress
in the organisation. For example an overemphasis of people involvement and too much participation
may actually inhibit decision making and steer ignorance and frustration. Therefore managers must
appreciate that collaborative decision making is as good as its opposing/conflicting culture
competitive fast decision making. Thus considering both opposing culture from the positive
perspective, creates an opportunity to develop a new value. For instance the opposing culture of a
collaborative decision making versus competitive fast decision making can be manipulated to yield a
composite culture value “collaborative fast decision making” (Figure 4.6). That means the team ends
up dedicating themselves to fast decision making and accomplishment. In other words the negative of
each culture typology is pruned off to embrace the strengths of each of the two opposing culture
typologies. Therefore the present research highlights that considering all four culture types is
important. The opposing culture types can be manipulated or triangulated or integrated from their
positive perspective to create a new value.
In order to steer change the Managers need to dress up the cultures they expect to see eventually in
their subordinates.
Leaders need to improve the Hierarchical culture by installing and maintaining the processes
constantly than deserting them and turning to them when they need them.
6.4.2. Future Research
While the context of the corporate culture changes fit a single case, the Swedish cadastral system, the
empirical findings cannot be generalised to a wider population of cadastral systems. The application of
the research findings is constrained by the professional distance existing between the lawyers and the
surveyors. The views revealed a close relationship between the legal professionals and the survey
professionals of the Swedish cadastral systems. The views also revealed the close relationship between
some universities like Lund with the Lantmäteriet. These kinds of relationships can actually be
different by each country. Hence in the context of a large professional difference, the aspects
changing and their rate of change may be different from the Swedish cadastral system. Therefore the
present research recommends that gaining more insight and convincing evidence of the nature of
culture changes in cadastral mergers has to be done with more case studies. The same objectives and
research questions, same methodology and statements can be used to measure culture change in a
different cadastral merger despite the country but as long as there are separate lawyers and surveyors
with a large professional distance. Therefore the present research further recommends that a
reconnaissance to identify the nature of the professional distance is important before embarking on
the study of culture change.
It is recommendable to find out what is the preferred future corporate culture for the work processes
since the present corporate culture of the work processes is already known. In that case the future
research will require collecting views that reflects what the Swedish cadastral system wants to be.
The present research also suggests in future it is advisable to enrich the empirical evidence of culture
change with the archival data.
In the context of the Swedish merger, the present research recommends that more views for the
premerger has to be considered and processed by similar statistical approaches and logic to note
whether there nature of culture changes are maintained or improved.
Arising questions that may be interesting to research in future may include:
How much of the culture changes are not shown by the present research in the context of the
Swedish cadastral systems?
What is likely to be the nature of change after two or three years down the line?
What is likely to be the nature of the professional training specific to surveying and law in Sweden five
years down the line?
EVALUATION OF CADASTRAL SYSTEMS
69
How do the external stakeholders influence the culture changes?
How does corporate culture change of work process influence the e-governance?
What is the difference between the planned corporate culture and the existing individual values?
What is the difference between the planned corporate culture and the expected corporate culture?

EVALUATION OF CADASTRAL SYSTEMS
70
EVALUATION OF CADASTRAL SYSTEMS
71
LIST OF REFERENCES
Barry, J., & Proops, J. (1999). Seeking sustainability discourses with Q methodology. Ecological Economics, 28(3), 337-345.
Belasen, A., & Frank, N. (2010). A Peek Through the Lens of the Competing Values Framework: What Managers Communicate and How. Atlantic Journal of Communication, 18(5), 280-296.
Berthon, P. R. (1993). Psychological type and corporate culture: Relationship and dynamics. Omega, 21(3), 329-344.
Bogaerts, T., & Zevenbergen, J. (2001). Cadastral systems — alternatives. Computers, Environment and Urban Systems, 25(4–5), 325-337.
Brink, T. L. (1991). Corporate cultures: A color coding metaphor. Business Horizons, 34(5), 39-44. Bronislovas, M. (2010). Country Report:Cadastral Template 2003. from
http://www.cadastraltemplate.org/countryreport/Lithuania-27Sep2010.pdf Buono, A. F., & Bowditch, J. L. (1989). The human side of mergers and acquisitions. Washington DC:
Beardbooks. Çağdaş, V., & Stubkjær, E. (2009). Doctoral research on cadastral development. Land Use Policy, 26(4),
869-889. Cameron, Quinn, R. E., DeGraff, J., & Thakor, A. V. (2006). Competing Values Leadership; Creating Value in
Organizations. Cheltenham, UK: Northampton, USA: Edward Elgar Publishing Limited. Cameron, K., Freeman, S. J., & Passmorc, W. A. (199l). Cultural Congruence, Strength and Type:
Relationships to Effectiveness. Research in Organizational Change and Development 5, 23-58. Cameron, K. S., & Quinn, R. E. (2006). Diagnosing and changing organisational culture; Based on the competing
values framework. San Fransisco: Joss-Bass. Carrillo, & Gromb, D. (1999). On the strength of corporate cultures. European Economic Review, 43(4–6),
1021-1037. Carroll, G. R., & Richard Harrison, J. (2002). Come together? The organizational dynamics of post-merger
cultural integration. Simulation Modelling Practice and Theory, 10(5–7), 349-368. Chatterjee, S., Lubatkin, M. H., Schweiger, D. M., & Weber, Y. (1992). Cultural differences and
shareholder value in related mergers: Linking equity and human capital. Strategic Management Journal, 13(5), 319-334.
Contiua, L. C., Gaborb, M. R., & Stefanescuc, D. (2012). Hofstede's Cultural Dimensions and Student's Ability to Develop an Entrepreneurial Spirit. Procedia - Social and Behavioral Sciences, 46(0), 5553-5557.
Coogan, J., & Herrington, N. (2011). Q methodology: an overview. Researcn in secondary teacher education 1(2), 24-28.
Dastmalchian, A., Lee, S., & Ng, I. (2000). The interplay between organizational and national cultures: a comparison of organizational practices in Canada and South Korea using the Competing Values Framework. The International Journal of Human Resource Management, 11(2), 388-412.
Deal, T., E., & Kennedy, A., A. (1982). Corporate cultures: The Rites and Rituals of Corporate Life. Amsterdam: ADDISON-WESLEY
Denison, D. R., & Spreitzer, G. M. (1991). Organisational Culture and Organisational development; A competing values approach. In R.W. Woodman &W. A. Pasmore (Eds.). Research in organisational changeand development 5, 1-21.
Deshpandé, R., Farley, J. U., & Webster Jr, F. E. (1993). Corporate Culture Customer Orientation, and Innovativeness in Japanese Firms: A Quadrad Analysis. [Article]. Journal of Marketing, 57(1), 23-37.
Drori, I., Wrzesniewski, A., & Ellis, S. (2011). Cultural clashes in a "merger of equals": the case of high-techs. [Article]. Human Resource Management, 50(5), 625-649.
Elia, E. (2010). Country Report:Cadastral Template. from http://www.cadastraltemplate.org/countryreport/Cyprus-14Sept2010.pdf
Elikos, E. (2010). Country Report:Cadastral Template 2003. from http://www.cadastraltemplate.org/countryreport/Cyprus-14Sept2010.pdf
Ernst, H. (2001). Corporate culture and innovative performance of the firm. New York: Ieee.
72
Flamholtz, E. (2001). Corporate culture and the bottom line. European Management Journal, 19(3), 268-275. Gabele, F., Fraisse, P., & Vanderschueren, M. (2003). Country Report:Cadastral Template 2003. from
http://www.cadastraltemplate.org/countryreport/Belgium-16Sep2003.pdf Gardner, M. P. (1985). Creating a corporate culture for the eighties. Business Horizons, 28(1), 59-63. Gary, T. H. (1990). Practical sampling (Vol. 21). United Kingdom: SAGE Publications. Goldman, I. (1999). Q-methodology as process and context in interpretivism, communication, and
psychoanalytic psychotherapy research. The Psychological Record, 49, 589–604. Gotteland, D., & Boulé, J.-M. (2006). The market orientation–new product performance relationship:
Redefining the moderating role of environmental conditions. International Journal of Research in Marketing, 23(2), 171-185.
Halme, P. (2009). Country Report: Cadastral Template 2003. from http://www.cadastraltemplate.org/countryreport/Finland-7Sep2009.pdf
Helfrich, C. D., Li, Y. F., Mohr, D. C., Meterko, M., & Sales, A. E. (2007). Assessing an organizational culture instrument based on the Competing Values Framework: Exploratory and confirmatory factor analyses. [Article]. Implementation science, 2.
Herzog, P. (2008). Open and Closed Innovation: Different Cultures for Different Strategies: Innovation culture: Gabler. Hill, S. (1990). Technology, corporate culture, and the insurance industry: The Australian experience.
Technology in Society, 12(1), 11-25. Hofstede, G., Neuijen, B., Ohayv, D. D., & Sanders, G. (1990). Measuring Organizational Cultures: A
Qualitative and Quantitative Study Across Twenty Cases. Administrative Science Quarterly, 35(2), 286-316.
Howard, L. W. (1998). Validating the competing values model as a representation of organisational cultures. International Journal of Organisational Analysis, 6(3), 231-250.
Hynes, N. (2009). Corporate culture, strategic orientation, and business performance: New approaches to modeling complex relationships. Technological Forecasting and Social Change, 76(5), 644-651.
Jaworski, B. J., & Kohli, A. K. (1993). Market orientation: Antecedents and consequences [Article]. Journal of Marketing, 57(3), 53-70.
Jedeloo, S., van Staa, A., Latour, J. M., & van Exel, N. J. A. (2010). Preferences for health care and self-management among Dutch adolescents with chronic conditions: A Q-methodological investigation. International Journal of Nursing Studies, 47(5), 593-603.
Johnson , G., & Scholes , K. (1984). Exploring Corporate Strategy. Englewood Cliffs, NJ, USA: Prentice-Hall. Kaufmann, J., & Steudler, D. (1998). Cadastre 2014: A vision for a future cadastral system Paper presented at
the Working Group 1 of FIG Commission 7. Koerten, H. (2011). Taming technology; The narrative anchor reconciling time, territory and technology of geoinfornation
infrastructures., Defti University of Technology Amsterdam. Lamond, D. (2002). The value of Quinn’s competing values model in an Australian context. Journal of
Managerial Psychology, 18(1), 46 - 59. Lawrence, P. R., & Nohria, N. (2002). Driven: How Human Nature Shapes Our Choices. San Francisco:Jossey-
Bass. Mathew, J., Ogbonna, E., & Harris, L. C. (2012). Culture, employee work outcomes and performance: An
empirical analysis of Indian software firms. [Article]. Journal of World Business, 47(2), 194-203. Moe, N. B., Dingsøyr, T., & Dybå, T. (2010). A teamwork model for understanding an agile team: A case
study of a Scrum project. Information and Software Technology, 52(5), 480-491. Morschett, D., Schramm-Klein, H., & Zentes, J. (2009). Corporate Culture as Coordination Mechanism Strategic International Management (pp. 203-220): Gabler. Narasimhan, N., Bhaskar, K., & Prakhya, S. (2010). Existential Beliefs and Values. Journal of Business Ethics,
96(3), 369-382. Osskó, A. (2010). Country Report; Cadastral Template 2003. from
http://www.cadastraltemplate.org/countryreport/Hungary-23Jul2010.pdf Österberg, T. (2011). Country Report; Cadastral Template 2003. from
http://www.cadastraltemplate.org/countryreport/Sweden-5Dec2003.pdf Quinn, & Rohrbaugh, J. (1981). A Competing Values Approach to Organizational Effectiveness. Public
Productivity Review, 5(2), 122-140. Quinn, & Rohrbaugh, J. (1983). A spatial model of effectiveness criteria; Towards a competing values
approach to organisational analysis. Management Science, 29, 363-377. Rego, A., & Cunha, M. P. e. (2008). Authentizotic climates and employee happiness: Pathways to
individual performance? Journal of Business Research, 61(7), 739-752.
EVALUATION OF CADASTRAL SYSTEMS
73
Rinne, T., & Fairweather, J. (2012). A Mixed Methods Approach: Using Cultural Modeling and Consensus Analysis to Better Understand New Zealand's International Innovation Performance. [Article]. Journal of Mixed Methods Research, 6(3), 166-183.
Savoiu, I., & Grigore, M. (2012). Romanian Cadaster and Land Registration System: Developing a secure Land Rights System for Romania. Paper presented at the FIG Working Week 2012: Knowing to manage the territory, protect the environment, evaluate the cultural heritage, Romania.
Schein, E. (2009). The corporate culture survival guide (2nd ed.). New York,: NY:Wiley. Scott, T., Mannion, R., Davies, H., & Marshall, M. (2003). The Quantitative Measurement of
Organizational Culture in Health Care: A Review of the Available Instruments. Health Services Research, 38(3), 923-945.
Silva, M. A., & Stubkjær, E. (2002). A review of methodologies used in research on cadastral development. Computers, Environment and Urban Systems, 26(5), 403-423.
Stergiou, D., & Airey, D. (2010). Q-methodology and tourism research. Current Issues in Tourism, 14(4), 311-322.
Steudler, D. (2004). A framework for the evaluation of land administration systems. Retrieved from http://www.geom.unimelb.edu.au/research/publications/PhDThesisDanielS.pdf
Steudler, D., Williamson, I., Kaufmann, J., & Grant, D. (1997). Benchmarking cadastral systems. Australian Surveyor, 42(3), 87-106.
Swallow, D. (1996-1999). Creating culture change: White Paper. from http://www.ctp.uk.com/resources/white-papers.aspx
Thomson, K.-L., & von Solms, R. (2004). Towards Corporate Information Security Obedience Information Security Management, Education and Privacy. In Y. Deswarte, F. Cuppens, S. Jajodia & L. Wang (Eds.), (Vol. 148, pp. 19-31): Springer Boston.
Tianyuan, Y., & Nengquan, W. (2009). A Review of Study on the Competing Values Framework. International Journal of Business and Management, 4(7), 37-42.
Ting, L. A. (2002). Principles for an integrated land administration system to support sustainable development. Unpublished Ph.D. Dissertation., University of Melbourne.
Tomandl, L. (2010). Country Report: Cadastral Template 2003. from http://www.cadastraltemplate.org/countryreport/CzechRepublic-4Mar2010.pdf
Tongco , M. D. C. (2007). Purposive sampling as a tool for informant selection. Ethnobotany Research & Applications. Ethnobotany Research and Applications, 5(12), 147-158.
Tufts, S. H., & Jacobson, W. S. (2010). Visions of leadership: An examination of how IT professionals prioritise leadership attributes. Journal of Information Technology Management, XXI(1).
UPC. (2002-2012). Changing minds: The Competing values framework. from http://changingminds.org/explanations/culture/competing_values.htm
van der Molen, P. (2010). County Report: Cadastral Template 2003. from http://www.cadastraltemplate.org/countryreport/Netherlands-7Sep2010.pdf
van der Wal, Z., de Graaf, G., & Lawton, A. (2011). Competing Values in Public Management. Public Management Review, 13(3), 331-341.
Vrakking, W. J. (1985). "Revamping organisations through cultural interventions". Journal of management consulting, (2, 3), 10-16.
Watts, S., & Stenner, P. (2005). Doing Q methodology: theory, method and interpretation. Qualitative Research in Psychology, 2(1), 67-91.
Watts, S., & Stenner, P. (2012). Doing Q methodological research; Theory, Method and interpretation.: SAGE Publications Inc.
Webler, T., Danielson, S., & Tuler, S. (2009). Using Q method to reveal social perspectives in environmental research. Greenfield.
Williamson, I. P., & Ting, L. (2001). Land administration and cadastral trends — a framework for re-engineering. Computers, Environment and Urban Systems, 25(4–5), 339-366.
Yip, G. S. (1992). Total Global Strategy: Managing for Worldwide Competitive Advantage. Englewood Cliffs: NJ: Prentice Hall.
Yomralioglu, T. (2003). Country Report: Cadastre Template 2003. from http://www.cadastraltemplate.org/countryreport/Turkey-3Nov2003.pdf
Zaheer, S., Schomaker, M., & Genc, M. (2003). Identity Versus Culture in Mergers of Equals. European Management Journal, 21(2), 185-191.

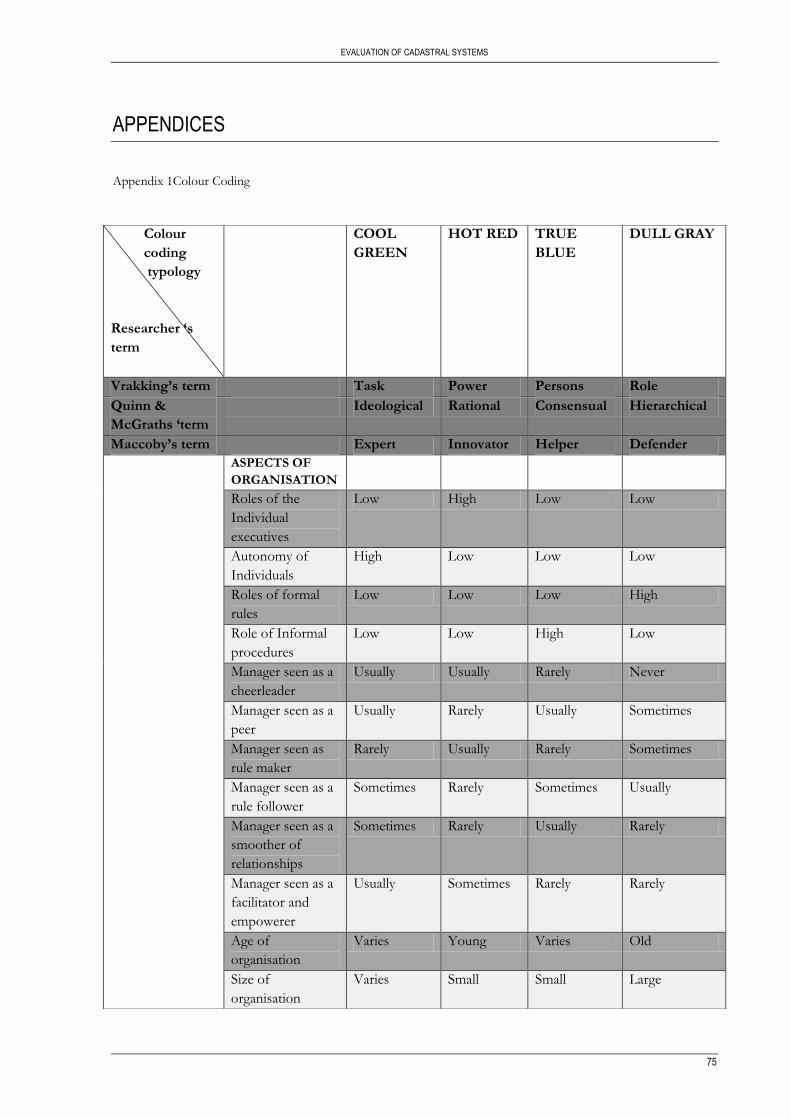
EVALUATION OF CADASTRAL SYSTEMS
75
APPENDICES
Appendix 1Colour Coding
Colour
coding
typology
Researcher ‘s
term
COOL
GREEN
HOT RED
TRUE
BLUE
DULL GRAY
Vrakking’s term Task Power Persons Role
Quinn &
McGraths ‘term
Ideological Rational Consensual Hierarchical
Maccoby’s term Expert Innovator Helper Defender
ASPECTS OF
ORGANISATION
Roles of the
Individual
executives
Low High Low Low
Autonomy of
Individuals
High Low Low Low
Roles of formal
rules
Low Low Low High
Role of Informal
procedures
Low Low High Low
Manager seen as a
cheerleader
Usually Usually Rarely Never
Manager seen as a
peer
Usually Rarely Usually Sometimes
Manager seen as
rule maker
Rarely Usually Rarely Sometimes
Manager seen as a
rule follower
Sometimes Rarely Sometimes Usually
Manager seen as a
smoother of
relationships
Sometimes Rarely Usually Rarely
Manager seen as a
facilitator and
empowerer
Usually Sometimes Rarely Rarely
Age of
organisation
Varies Young Varies Old
Size of
organisation
Varies Small Small Large
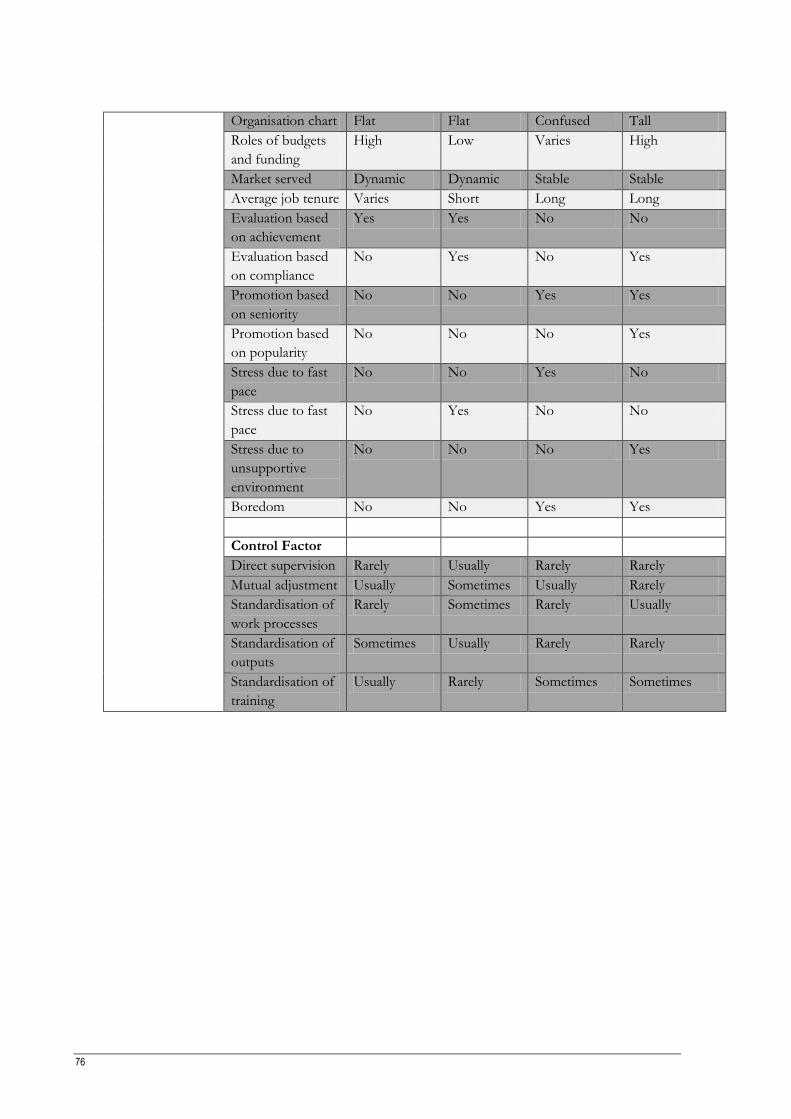
76
Organisation chart Flat Flat Confused Tall
Roles of budgets
and funding
High Low Varies High
Market served Dynamic Dynamic Stable Stable
Average job tenure Varies Short Long Long
Evaluation based
on achievement
Yes Yes No No
Evaluation based
on compliance
No Yes No Yes
Promotion based
on seniority
No No Yes Yes
Promotion based
on popularity
No No No Yes
Stress due to fast
pace
No No Yes No
Stress due to fast
pace
No Yes No No
Stress due to
unsupportive
environment
No No No Yes
Boredom No No Yes Yes
Control Factor
Direct supervision Rarely Usually Rarely Rarely
Mutual adjustment Usually Sometimes Usually Rarely
Standardisation of
work processes
Rarely Sometimes Rarely Usually
Standardisation of
outputs
Sometimes Usually Rarely Rarely
Standardisation of
training
Usually Rarely Sometimes Sometimes
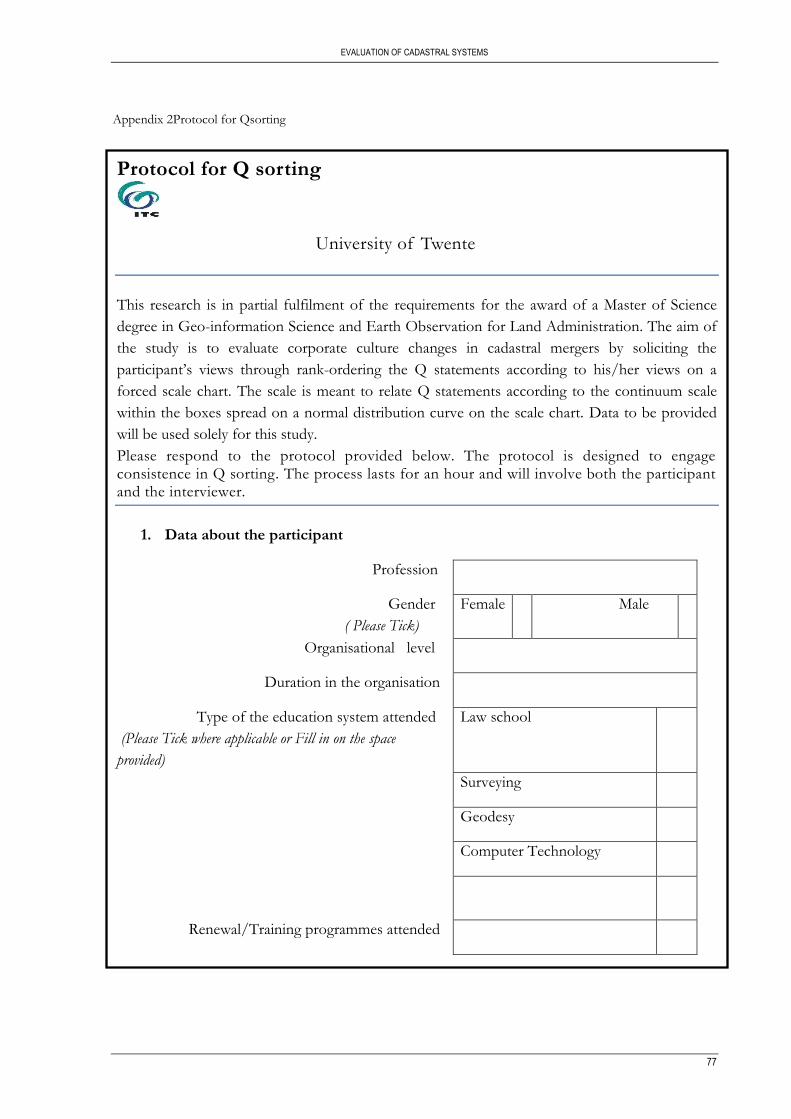
EVALUATION OF CADASTRAL SYSTEMS
77
Appendix 2Protocol for Qsorting
Protocol for Q sorting
University of Twente
This research is in partial fulfilment of the requirements for the award of a Master of Science
degree in Geo-information Science and Earth Observation for Land Administration. The aim of
the study is to evaluate corporate culture changes in cadastral mergers by soliciting the
participant’s views through rank-ordering the Q statements according to his/her views on a
forced scale chart. The scale is meant to relate Q statements according to the continuum scale
within the boxes spread on a normal distribution curve on the scale chart. Data to be provided
will be used solely for this study.
Please respond to the protocol provided below. The protocol is designed to engage consistence in Q sorting. The process lasts for an hour and will involve both the participant and the interviewer.
1. Data about the participant
Profession
Gender
( Please Tick)
Female Male
Organisational level
Duration in the organisation
Type of the education system attended
(Please Tick where applicable or Fill in on the space
provided)
Law school
Surveying
Geodesy
Computer Technology
Renewal/Training programmes attended
1. You are entitled to arrange 36 Q statements on a hard surface by portraying the scaled chart
provided.
2. You will model your point of view by rank-ordering Q-sample statements along a continuum
scale of -5 to +5 of the chart.

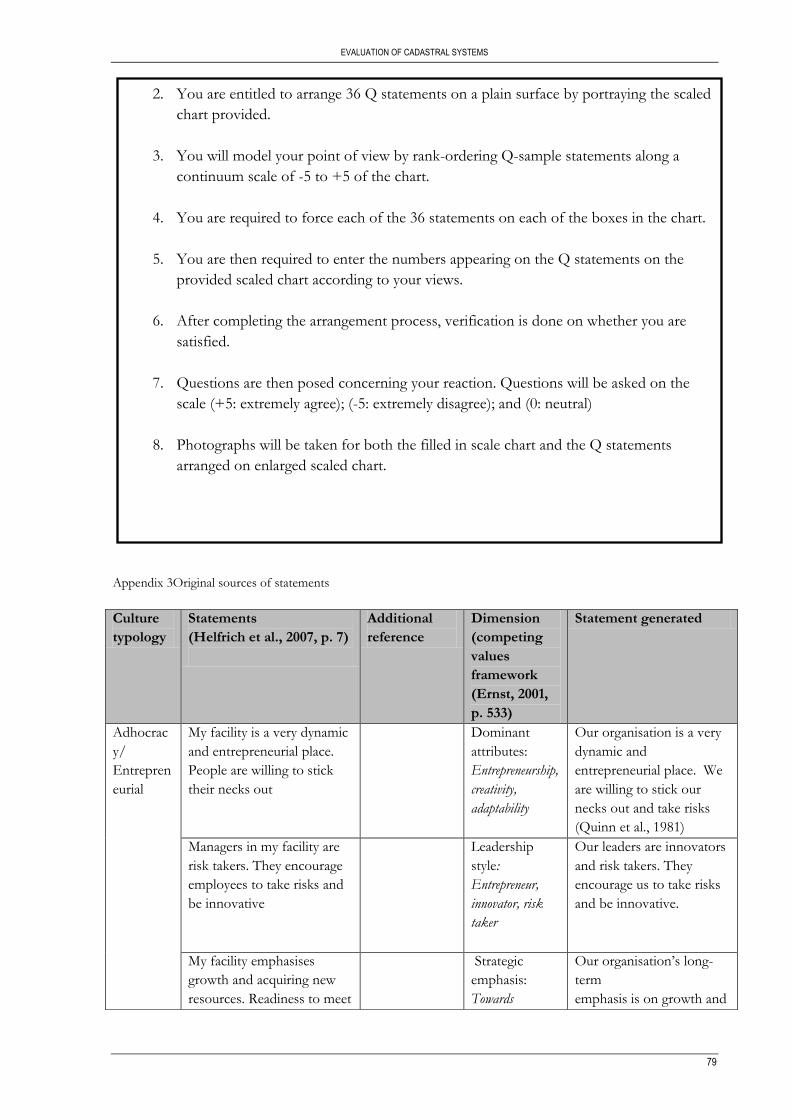
EVALUATION OF CADASTRAL SYSTEMS
79
Appendix 3Original sources of statements
Culture
typology
Statements
(Helfrich et al., 2007, p. 7)
Additional
reference
Dimension
(competing
values
framework
(Ernst, 2001,
p. 533)
Statement generated
Adhocrac
y/
Entrepren
eurial
My facility is a very dynamic
and entrepreneurial place.
People are willing to stick
their necks out
Dominant
attributes:
Entrepreneurship,
creativity,
adaptability
Our organisation is a very
dynamic and
entrepreneurial place. We
are willing to stick our
necks out and take risks
(Quinn et al., 1981)
Managers in my facility are
risk takers. They encourage
employees to take risks and
be innovative
Leadership
style:
Entrepreneur,
innovator, risk
taker
Our leaders are innovators
and risk takers. They
encourage us to take risks
and be innovative.
My facility emphasises
growth and acquiring new
resources. Readiness to meet
Strategic
emphasis:
Towards
Our organisation’s long-
term
emphasis is on growth and
2. You are entitled to arrange 36 Q statements on a plain surface by portraying the scaled
chart provided.
3. You will model your point of view by rank-ordering Q-sample statements along a
continuum scale of -5 to +5 of the chart.
4. You are required to force each of the 36 statements on each of the boxes in the chart.
5. You are then required to enter the numbers appearing on the Q statements on the
provided scaled chart according to your views.
6. After completing the arrangement process, verification is done on whether you are
satisfied.
7. Questions are then posed concerning your reaction. Questions will be asked on the
scale (+5: extremely agree); (-5: extremely disagree); and (0: neutral)
8. Photographs will be taken for both the filled in scale chart and the Q statements
arranged on enlarged scaled chart.
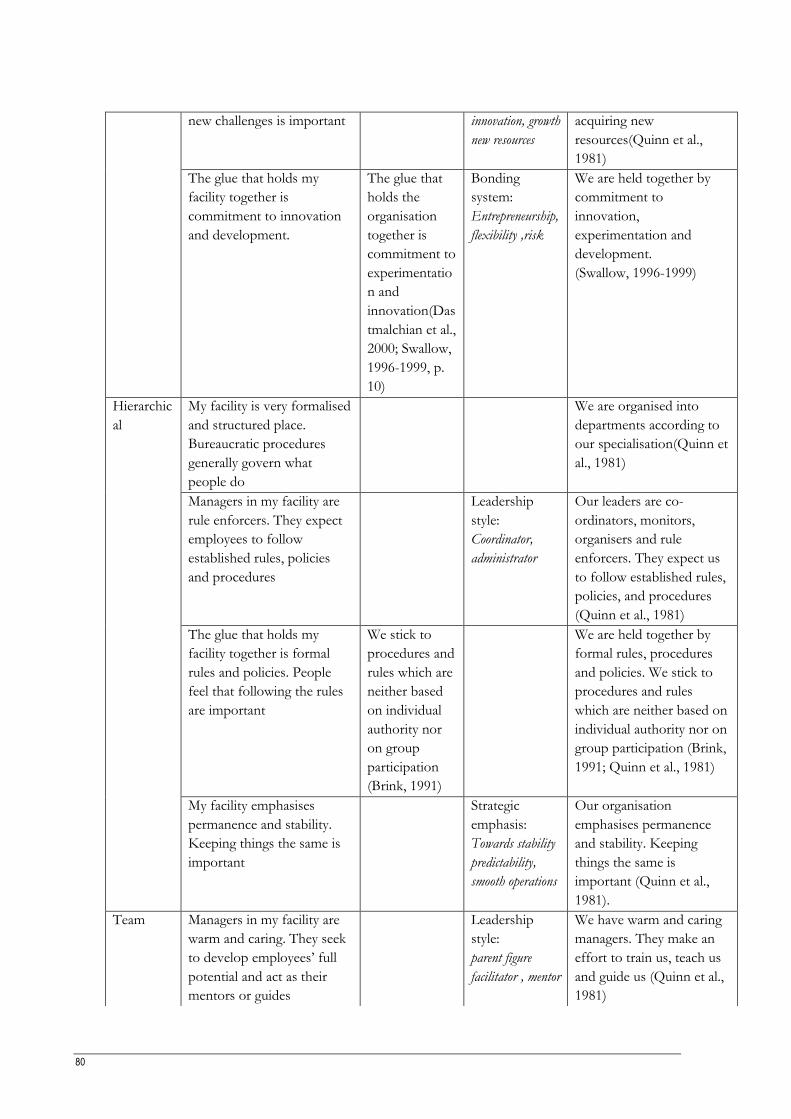
80
new challenges is important innovation, growth
new resources
acquiring new
resources(Quinn et al.,
1981)
The glue that holds my
facility together is
commitment to innovation
and development.
The glue that
holds the
organisation
together is
commitment to
experimentatio
n and
innovation(Das
tmalchian et al.,
2000; Swallow,
1996-1999, p.
10)
Bonding
system:
Entrepreneurship,
flexibility ,risk
We are held together by
commitment to
innovation,
experimentation and
development.
(Swallow, 1996-1999)
Hierarchic
al
My facility is very formalised
and structured place.
Bureaucratic procedures
generally govern what
people do
We are organised into
departments according to
our specialisation(Quinn et
al., 1981)
Managers in my facility are
rule enforcers. They expect
employees to follow
established rules, policies
and procedures
Leadership
style:
Coordinator,
administrator
Our leaders are co-
ordinators, monitors,
organisers and rule
enforcers. They expect us
to follow established rules,
policies, and procedures
(Quinn et al., 1981)
The glue that holds my
facility together is formal
rules and policies. People
feel that following the rules
are important
We stick to
procedures and
rules which are
neither based
on individual
authority nor
on group
participation
(Brink, 1991)
We are held together by
formal rules, procedures
and policies. We stick to
procedures and rules
which are neither based on
individual authority nor on
group participation (Brink,
1991; Quinn et al., 1981)
My facility emphasises
permanence and stability.
Keeping things the same is
important
Strategic
emphasis:
Towards stability
predictability,
smooth operations
Our organisation
emphasises permanence
and stability. Keeping
things the same is
important (Quinn et al.,
1981).
Team Managers in my facility are
warm and caring. They seek
to develop employees’ full
potential and act as their
mentors or guides
Leadership
style:
parent figure
facilitator , mentor
We have warm and caring
managers. They make an
effort to train us, teach us
and guide us (Quinn et al.,
1981)
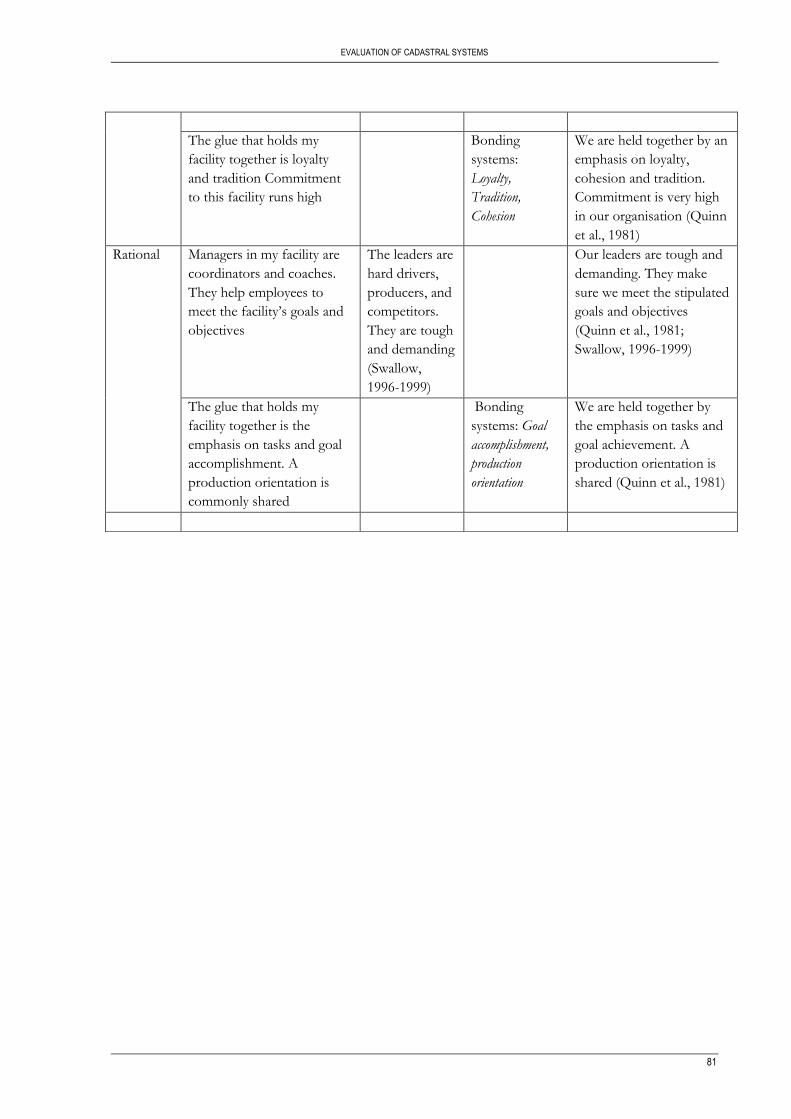
EVALUATION OF CADASTRAL SYSTEMS
81
The glue that holds my
facility together is loyalty
and tradition Commitment
to this facility runs high
Bonding
systems:
Loyalty,
Tradition,
Cohesion
We are held together by an
emphasis on loyalty,
cohesion and tradition.
Commitment is very high
in our organisation (Quinn
et al., 1981)
Rational Managers in my facility are
coordinators and coaches.
They help employees to
meet the facility’s goals and
objectives
The leaders are
hard drivers,
producers, and
competitors.
They are tough
and demanding
(Swallow,
1996-1999)
Our leaders are tough and
demanding. They make
sure we meet the stipulated
goals and objectives
(Quinn et al., 1981;
Swallow, 1996-1999)
The glue that holds my
facility together is the
emphasis on tasks and goal
accomplishment. A
production orientation is
commonly shared
Bonding
systems: Goal
accomplishment,
production
orientation
We are held together by
the emphasis on tasks and
goal achievement. A
production orientation is
shared (Quinn et al., 1981)

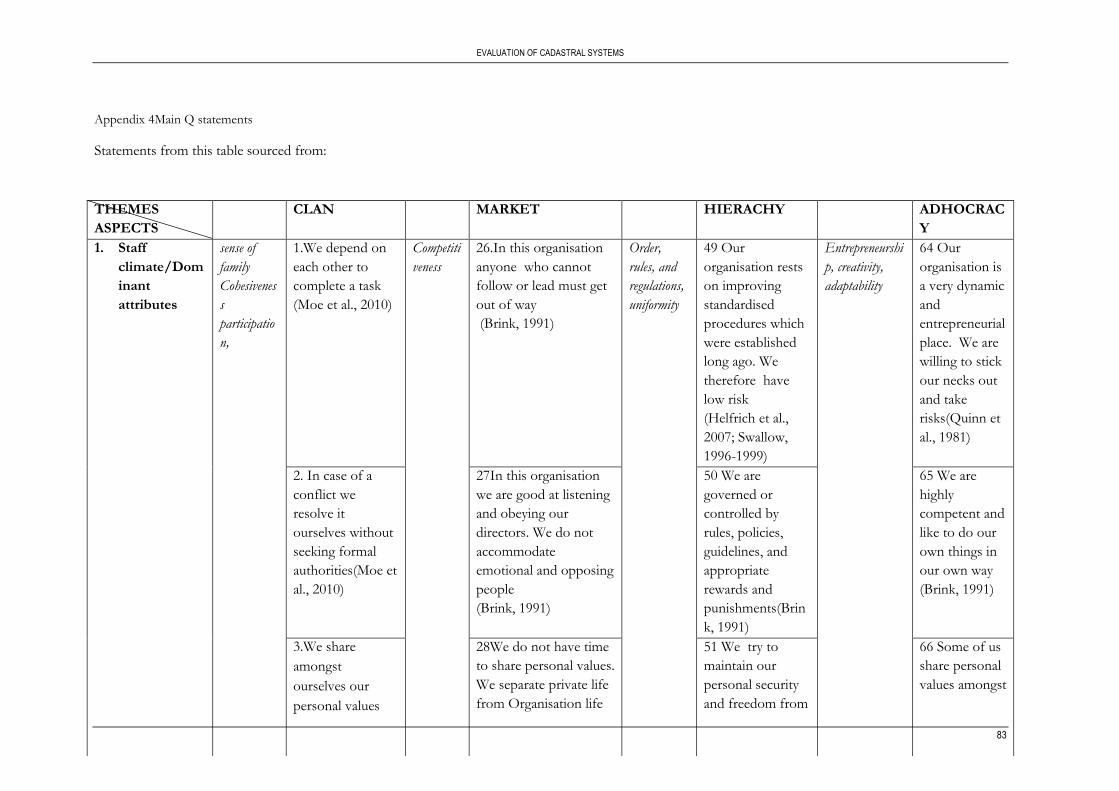
EVALUATION OF CADASTRAL SYSTEMS
83
Appendix 4Main Q statements
Statements from this table sourced from:
THEMES
ASPECTS
CLAN MARKET HIERACHY ADHOCRAC
Y
1. Staff
climate/Dom
inant
attributes
sense of
family
Cohesivenes
s
participatio
n,
1.We depend on
each other to
complete a task
(Moe et al., 2010)
Competiti
veness
26.In this organisation
anyone who cannot
follow or lead must get
out of way
(Brink, 1991)
Order,
rules, and
regulations,
uniformity
49 Our
organisation rests
on improving
standardised
procedures which
were established
long ago. We
therefore have
low risk
(Helfrich et al.,
2007; Swallow,
1996-1999)
Entrepreneurshi
p, creativity,
adaptability
64 Our
organisation is
a very dynamic
and
entrepreneurial
place. We are
willing to stick
our necks out
and take
risks(Quinn et
al., 1981)
2. In case of a
conflict we
resolve it
ourselves without
seeking formal
authorities(Moe et
al., 2010)
27In this organisation
we are good at listening
and obeying our
directors. We do not
accommodate
emotional and opposing
people
(Brink, 1991)
50 We are
governed or
controlled by
rules, policies,
guidelines, and
appropriate
rewards and
punishments(Brin
k, 1991)
65 We are
highly
competent and
like to do our
own things in
our own way
(Brink, 1991)
3.We share
amongst
ourselves our
personal values
28We do not have time
to share personal values.
We separate private life
from Organisation life
51 We try to
maintain our
personal security
and freedom from
66 Some of us
share personal
values amongst
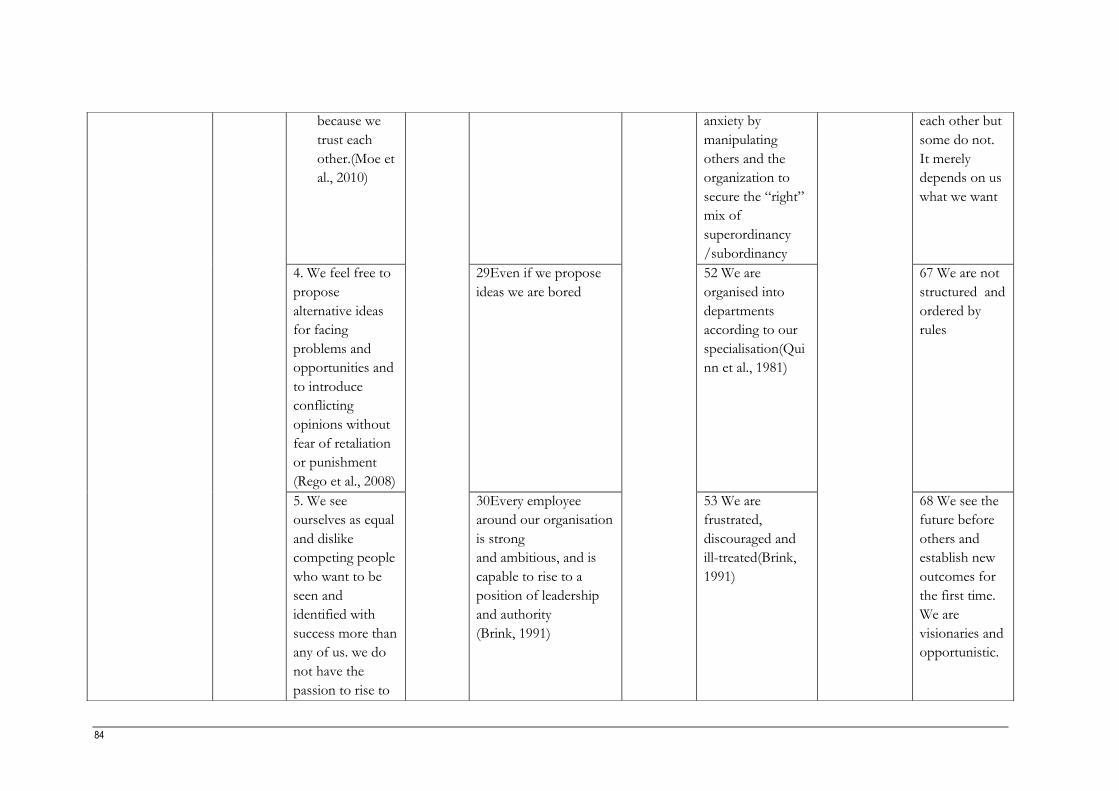
84
because we
trust each
other.(Moe et
al., 2010)
anxiety by
manipulating
others and the
organization to
secure the “right”
mix of
superordinancy
/subordinancy
each other but
some do not.
It merely
depends on us
what we want
4. We feel free to
propose
alternative ideas
for facing
problems and
opportunities and
to introduce
conflicting
opinions without
fear of retaliation
or punishment
(Rego et al., 2008)
29Even if we propose
ideas we are bored
52 We are
organised into
departments
according to our
specialisation(Qui
nn et al., 1981)
67 We are not
structured and
ordered by
rules
5. We see
ourselves as equal
and dislike
competing people
who want to be
seen and
identified with
success more than
any of us. we do
not have the
passion to rise to
30Every employee
around our organisation
is strong
and ambitious, and is
capable to rise to a
position of leadership
and authority
(Brink, 1991)
53 We are
frustrated,
discouraged and
ill-treated(Brink,
1991)
68 We see the
future before
others and
establish new
outcomes for
the first time.
We are
visionaries and
opportunistic.
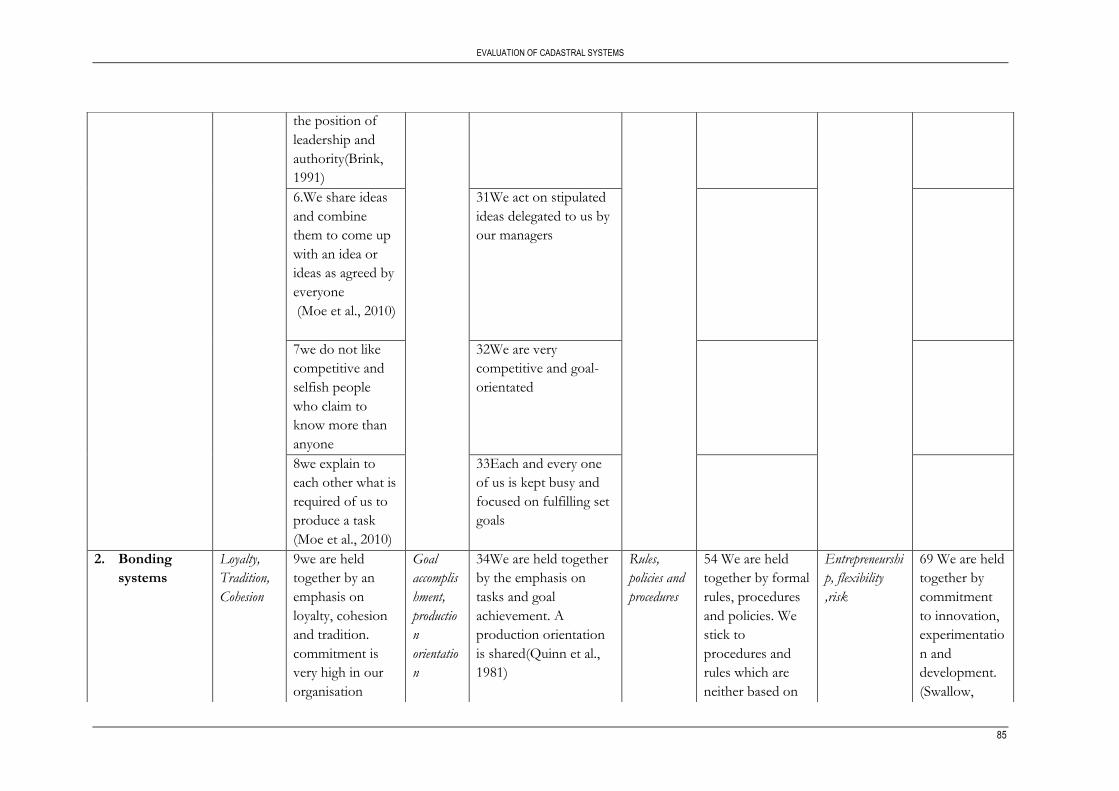
EVALUATION OF CADASTRAL SYSTEMS
85
the position of
leadership and
authority(Brink,
1991)
6.We share ideas
and combine
them to come up
with an idea or
ideas as agreed by
everyone
(Moe et al., 2010)
31We act on stipulated
ideas delegated to us by
our managers
7we do not like
competitive and
selfish people
who claim to
know more than
anyone
32We are very
competitive and goal-
orientated
8we explain to
each other what is
required of us to
produce a task
(Moe et al., 2010)
33Each and every one
of us is kept busy and
focused on fulfilling set
goals
2. Bonding
systems
Loyalty,
Tradition,
Cohesion
9we are held
together by an
emphasis on
loyalty, cohesion
and tradition.
commitment is
very high in our
organisation
Goal
accomplis
hment,
productio
n
orientatio
n
34We are held together
by the emphasis on
tasks and goal
achievement. A
production orientation
is shared(Quinn et al.,
1981)
Rules,
policies and
procedures
54 We are held
together by formal
rules, procedures
and policies. We
stick to
procedures and
rules which are
neither based on
Entrepreneurshi
p, flexibility
,risk
69 We are held
together by
commitment
to innovation,
experimentatio
n and
development.
(Swallow,

86
(Quinn et al.,
1981)
individual
authority nor on
group
participation
(Brink, 1991;
Quinn et al., 1981)
1996-1999)
10.we are
concerned about
our satisfaction
rather than
winning
(Herzog, 2008)
35We are held together
by an emphasis on
winning and gaining the
market share (Swallow,
1996-1999).
3. Leadership parent
figure
facilitator ,
mentor
11.our leaders are
mentors,
facilitators and
reflect parental
figures(Ernst,
2001)
Decisive,
achieveme
nt
oriented
36. Our leaders are hard
drivers, producers, and
competitors (Swallow,
1996-1999).
Coordinator
,
administrat
or
55 Our leaders are
co-ordinators,
monitors,
organisers and
rule enforcers.
They expect us to
follow established
rules, policies, and
procedures
(Quinn et al.,
1981)
Entrepreneur,
innovator, risk
taker
70 Our leaders
are innovators
and risk takers.
They
encourage us
to take risks
and be
innovative.(He
lfrich et al.,
2007)
12.we have warm
and caring
managers. they
make an effort to
train us, teach us
and guide us
(Quinn et al.,
1981)
37 Our leaders are
tough and demanding.
They make sure we
meet the stipulated
goals and
objectives(Quinn et al.,
1981)
56 Our leaders
pride themselves
on being good
coordinators and
organisers who are
efficiency-minded
71 Our leaders
depend on us.
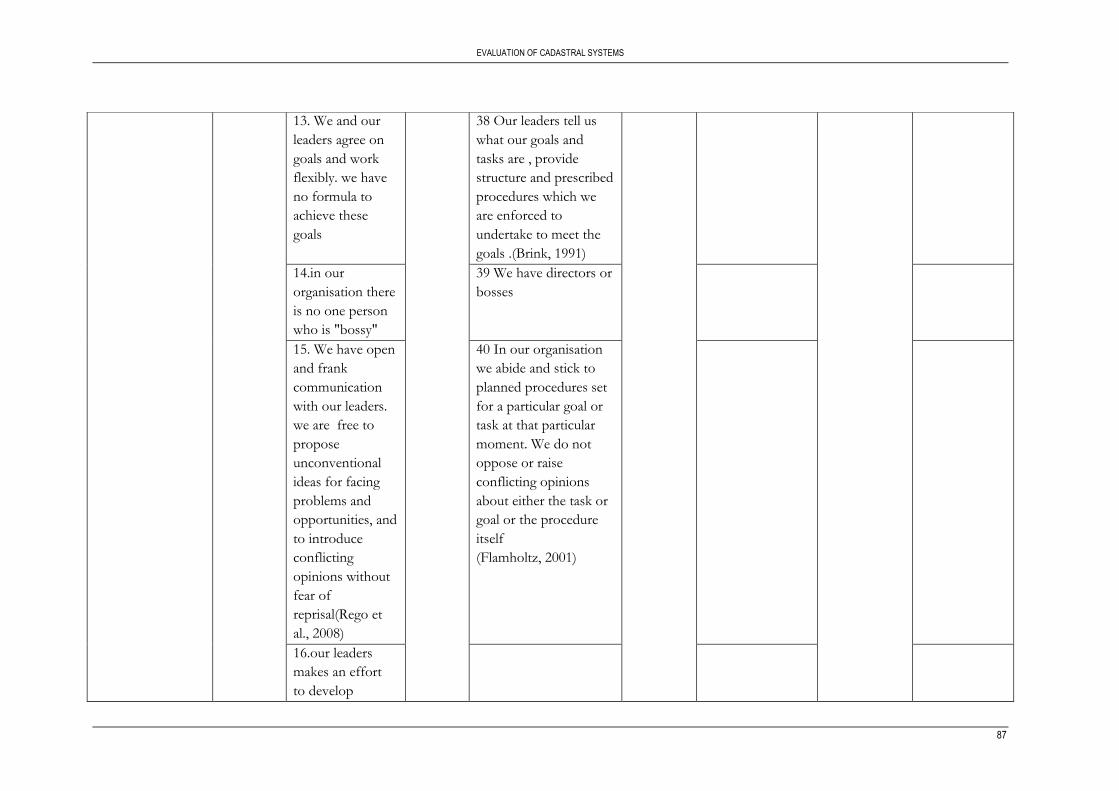
EVALUATION OF CADASTRAL SYSTEMS
87
13. We and our
leaders agree on
goals and work
flexibly. we have
no formula to
achieve these
goals
38 Our leaders tell us
what our goals and
tasks are , provide
structure and prescribed
procedures which we
are enforced to
undertake to meet the
goals .(Brink, 1991)
14.in our
organisation there
is no one person
who is "bossy"
39 We have directors or
bosses
15. We have open
and frank
communication
with our leaders.
we are free to
propose
unconventional
ideas for facing
problems and
opportunities, and
to introduce
conflicting
opinions without
fear of
reprisal(Rego et
al., 2008)
40 In our organisation
we abide and stick to
planned procedures set
for a particular goal or
task at that particular
moment. We do not
oppose or raise
conflicting opinions
about either the task or
goal or the procedure
itself
(Flamholtz, 2001)
16.our leaders
makes an effort
to develop
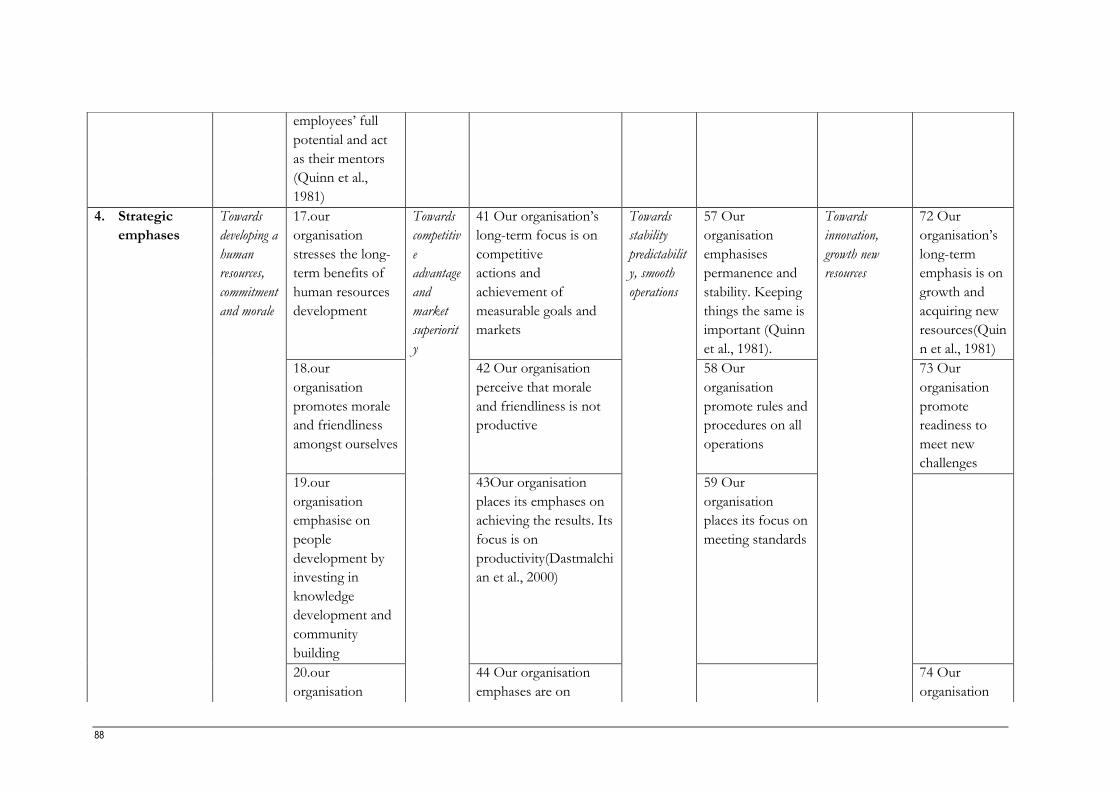
88
employees’ full
potential and act
as their mentors
(Quinn et al.,
1981)
4. Strategic
emphases
Towards
developing a
human
resources,
commitment
and morale
17.our
organisation
stresses the long-
term benefits of
human resources
development
Towards
competitiv
e
advantage
and
market
superiorit
y
41 Our organisation’s
long-term focus is on
competitive
actions and
achievement of
measurable goals and
markets
Towards
stability
predictabilit
y, smooth
operations
57 Our
organisation
emphasises
permanence and
stability. Keeping
things the same is
important (Quinn
et al., 1981).
Towards
innovation,
growth new
resources
72 Our
organisation’s
long-term
emphasis is on
growth and
acquiring new
resources(Quin
n et al., 1981)
18.our
organisation
promotes morale
and friendliness
amongst ourselves
42 Our organisation
perceive that morale
and friendliness is not
productive
58 Our
organisation
promote rules and
procedures on all
operations
73 Our
organisation
promote
readiness to
meet new
challenges
19.our
organisation
emphasise on
people
development by
investing in
knowledge
development and
community
building
43Our organisation
places its emphases on
achieving the results. Its
focus is on
productivity(Dastmalchi
an et al., 2000)
59 Our
organisation
places its focus on
meeting standards
20.our
organisation
44 Our organisation
emphases are on
74 Our
organisation
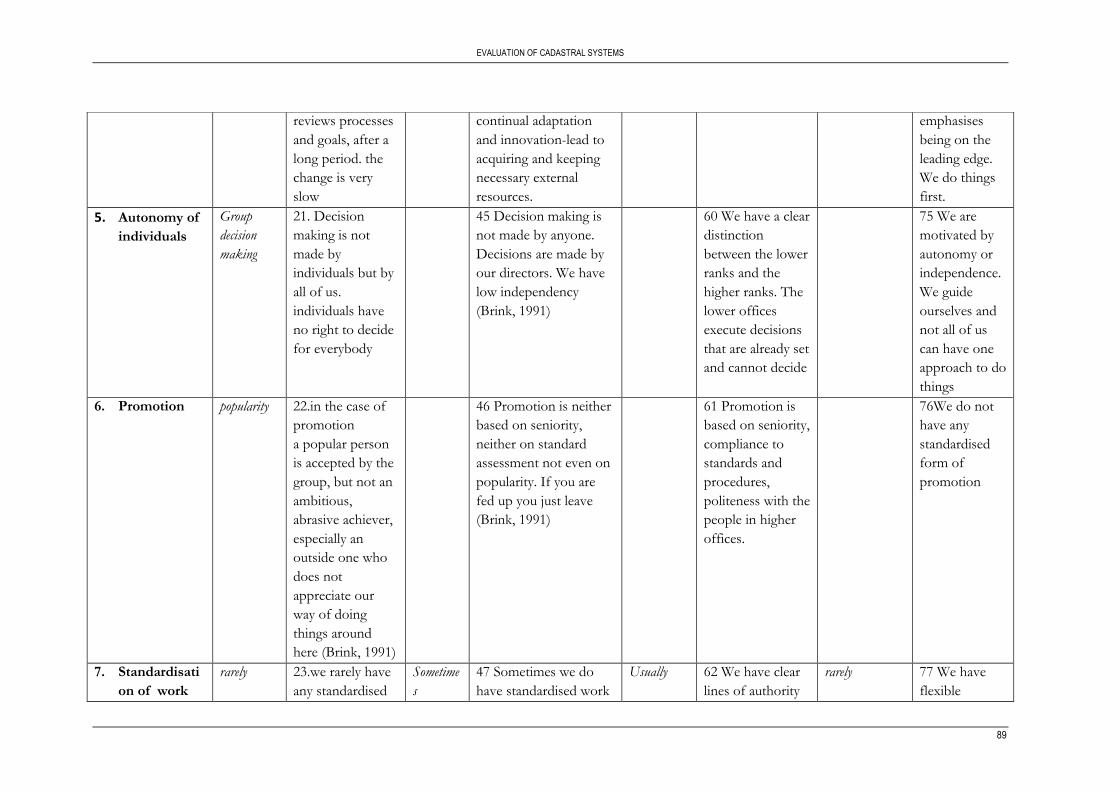
EVALUATION OF CADASTRAL SYSTEMS
89
reviews processes
and goals, after a
long period. the
change is very
slow
continual adaptation
and innovation-lead to
acquiring and keeping
necessary external
resources.
emphasises
being on the
leading edge.
We do things
first.
5. Autonomy of
individuals
Group
decision
making
21. Decision
making is not
made by
individuals but by
all of us.
individuals have
no right to decide
for everybody
45 Decision making is
not made by anyone.
Decisions are made by
our directors. We have
low independency
(Brink, 1991)
60 We have a clear
distinction
between the lower
ranks and the
higher ranks. The
lower offices
execute decisions
that are already set
and cannot decide
75 We are
motivated by
autonomy or
independence.
We guide
ourselves and
not all of us
can have one
approach to do
things
6. Promotion popularity 22.in the case of
promotion
a popular person
is accepted by the
group, but not an
ambitious,
abrasive achiever,
especially an
outside one who
does not
appreciate our
way of doing
things around
here (Brink, 1991)
46 Promotion is neither
based on seniority,
neither on standard
assessment not even on
popularity. If you are
fed up you just leave
(Brink, 1991)
61 Promotion is
based on seniority,
compliance to
standards and
procedures,
politeness with the
people in higher
offices.
76We do not
have any
standardised
form of
promotion
7. Standardisati
on of work
rarely 23.we rarely have
any standardised
Sometime
s
47 Sometimes we do
have standardised work
Usually 62 We have clear
lines of authority
rarely 77 We have
flexible
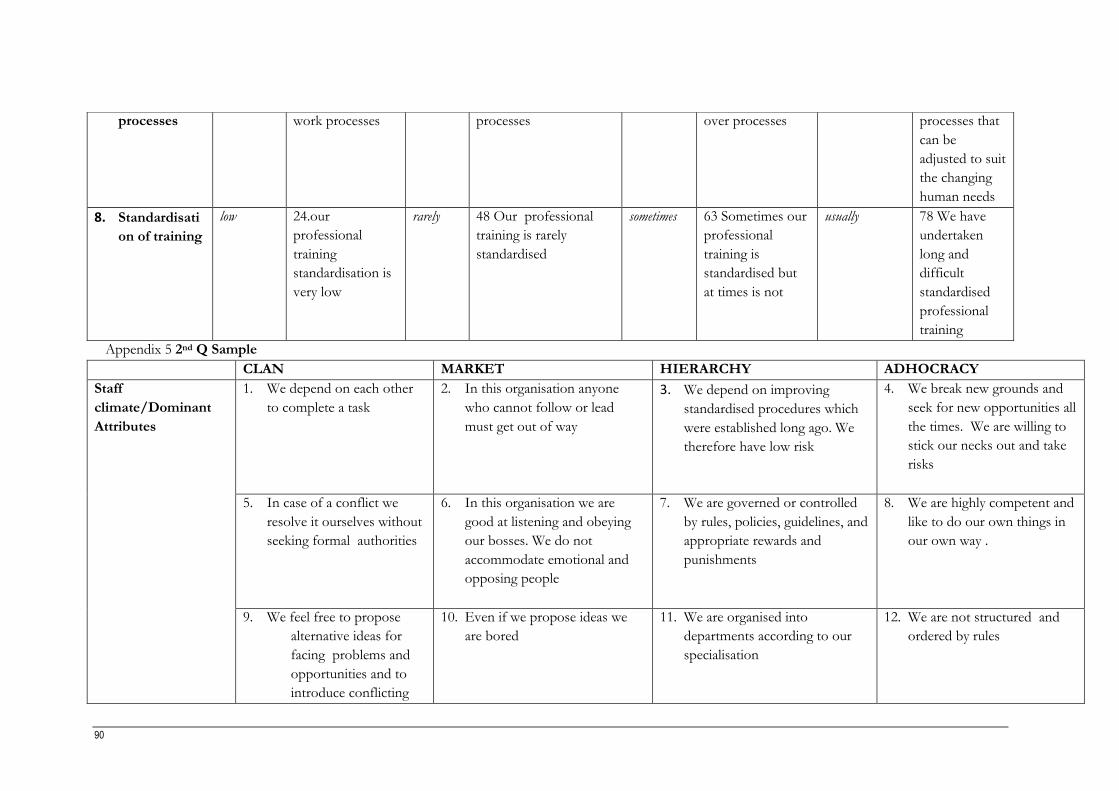
90
Appendix 5 2nd Q Sample
CLAN MARKET HIERARCHY ADHOCRACY
Staff
climate/Dominant
Attributes
1. We depend on each other
to complete a task
2. In this organisation anyone
who cannot follow or lead
must get out of way
3. We depend on improving
standardised procedures which
were established long ago. We
therefore have low risk
4. We break new grounds and
seek for new opportunities all
the times. We are willing to
stick our necks out and take
risks
5. In case of a conflict we
resolve it ourselves without
seeking formal authorities
6. In this organisation we are
good at listening and obeying
our bosses. We do not
accommodate emotional and
opposing people
7. We are governed or controlled
by rules, policies, guidelines, and
appropriate rewards and
punishments
8. We are highly competent and
like to do our own things in
our own way .
9. We feel free to propose
alternative ideas for
facing problems and
opportunities and to
introduce conflicting
10. Even if we propose ideas we
are bored
11. We are organised into
departments according to our
specialisation
12. We are not structured and
ordered by rules
processes work processes processes over processes processes that
can be
adjusted to suit
the changing
human needs
8. Standardisati
on of training
low 24.our
professional
training
standardisation is
very low
rarely 48 Our professional
training is rarely
standardised
sometimes 63 Sometimes our
professional
training is
standardised but
at times is not
usually 78 We have
undertaken
long and
difficult
standardised
professional
training
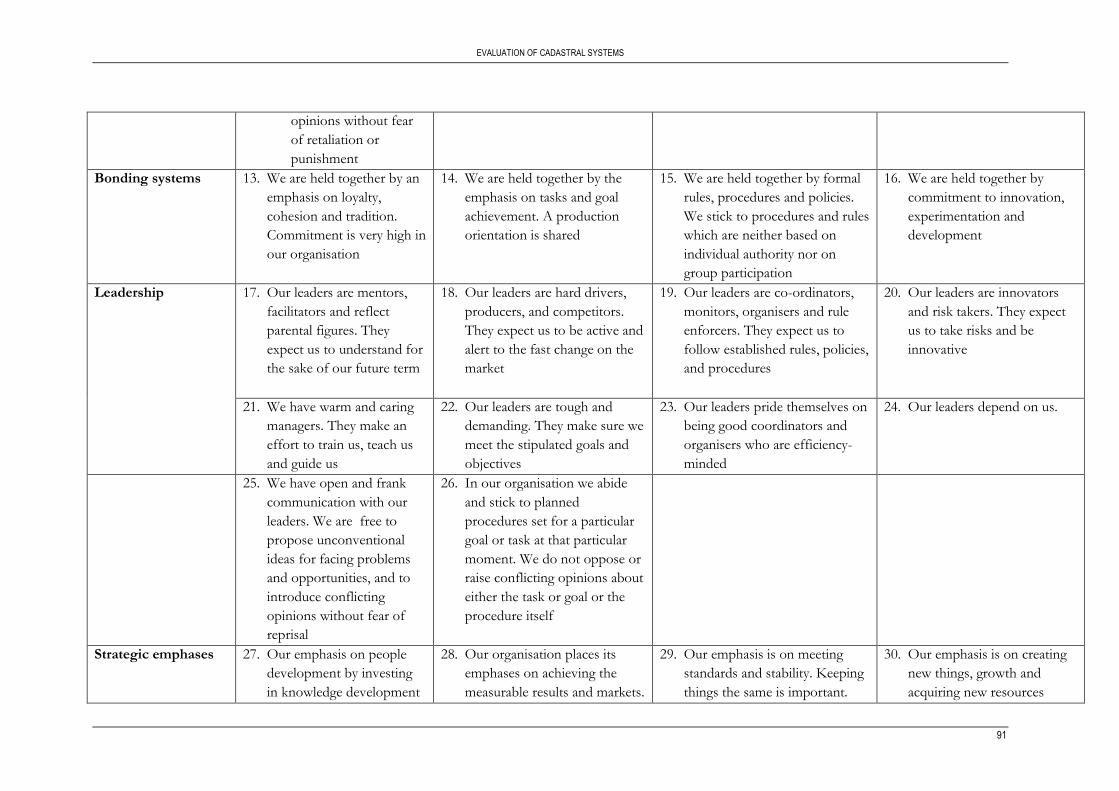
EVALUATION OF CADASTRAL SYSTEMS
91
opinions without fear
of retaliation or
punishment
Bonding systems
13. We are held together by an
emphasis on loyalty,
cohesion and tradition.
Commitment is very high in
our organisation
14. We are held together by the
emphasis on tasks and goal
achievement. A production
orientation is shared
15. We are held together by formal
rules, procedures and policies.
We stick to procedures and rules
which are neither based on
individual authority nor on
group participation
16. We are held together by
commitment to innovation,
experimentation and
development
Leadership 17. Our leaders are mentors,
facilitators and reflect
parental figures. They
expect us to understand for
the sake of our future term
18. Our leaders are hard drivers,
producers, and competitors.
They expect us to be active and
alert to the fast change on the
market
19. Our leaders are co-ordinators,
monitors, organisers and rule
enforcers. They expect us to
follow established rules, policies,
and procedures
20. Our leaders are innovators
and risk takers. They expect
us to take risks and be
innovative
21. We have warm and caring
managers. They make an
effort to train us, teach us
and guide us
22. Our leaders are tough and
demanding. They make sure we
meet the stipulated goals and
objectives
23. Our leaders pride themselves on
being good coordinators and
organisers who are efficiency-
minded
24. Our leaders depend on us.
25. We have open and frank
communication with our
leaders. We are free to
propose unconventional
ideas for facing problems
and opportunities, and to
introduce conflicting
opinions without fear of
reprisal
26. In our organisation we abide
and stick to planned
procedures set for a particular
goal or task at that particular
moment. We do not oppose or
raise conflicting opinions about
either the task or goal or the
procedure itself
Strategic emphases 27. Our emphasis on people
development by investing
in knowledge development
28. Our organisation places its
emphases on achieving the
measurable results and markets.
29. Our emphasis is on meeting
standards and stability. Keeping
things the same is important.
30. Our emphasis is on creating
new things, growth and
acquiring new resources
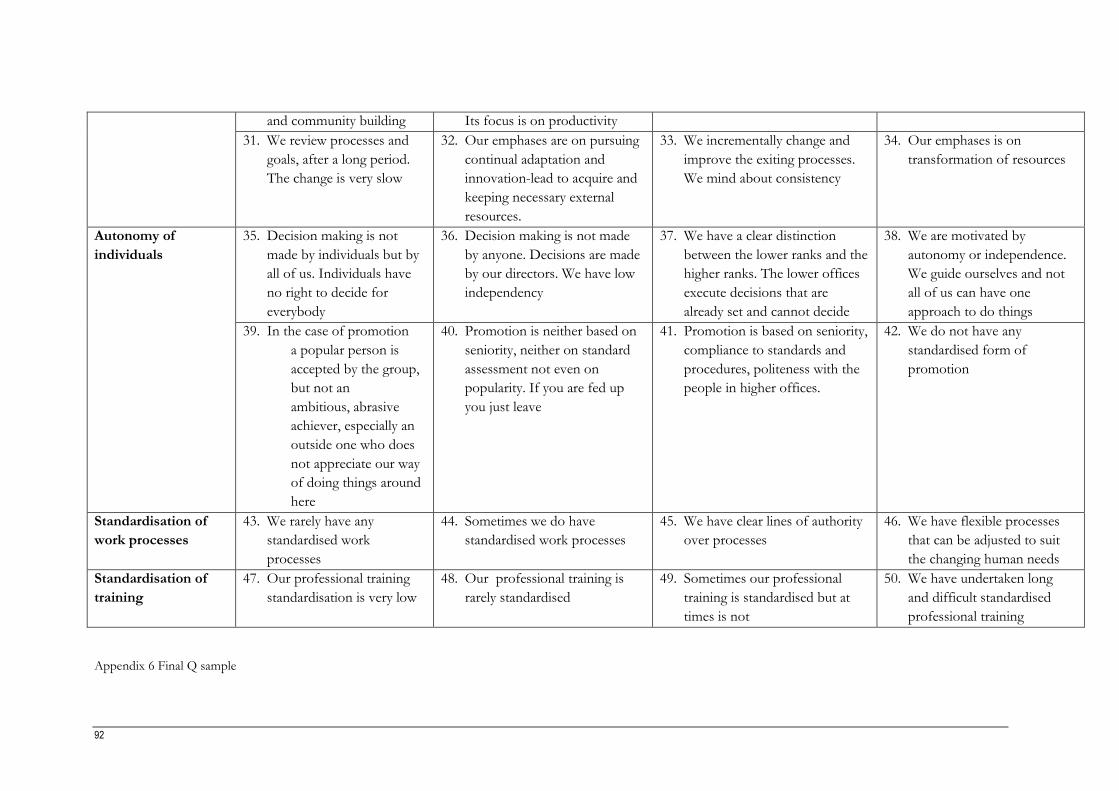
92
and community building Its focus is on productivity
31. We review processes and
goals, after a long period.
The change is very slow
32. Our emphases are on pursuing
continual adaptation and
innovation-lead to acquire and
keeping necessary external
resources.
33. We incrementally change and
improve the exiting processes.
We mind about consistency
34. Our emphases is on
transformation of resources
Autonomy of
individuals
35. Decision making is not
made by individuals but by
all of us. Individuals have
no right to decide for
everybody
36. Decision making is not made
by anyone. Decisions are made
by our directors. We have low
independency
37. We have a clear distinction
between the lower ranks and the
higher ranks. The lower offices
execute decisions that are
already set and cannot decide
38. We are motivated by
autonomy or independence.
We guide ourselves and not
all of us can have one
approach to do things
39. In the case of promotion
a popular person is
accepted by the group,
but not an
ambitious, abrasive
achiever, especially an
outside one who does
not appreciate our way
of doing things around
here
40. Promotion is neither based on
seniority, neither on standard
assessment not even on
popularity. If you are fed up
you just leave
41. Promotion is based on seniority,
compliance to standards and
procedures, politeness with the
people in higher offices.
42. We do not have any
standardised form of
promotion
Standardisation of
work processes
43. We rarely have any
standardised work
processes
44. Sometimes we do have
standardised work processes
45. We have clear lines of authority
over processes
46. We have flexible processes
that can be adjusted to suit
the changing human needs
Standardisation of
training
47. Our professional training
standardisation is very low
48. Our professional training is
rarely standardised
49. Sometimes our professional
training is standardised but at
times is not
50. We have undertaken long
and difficult standardised
professional training
Appendix 6 Final Q sample
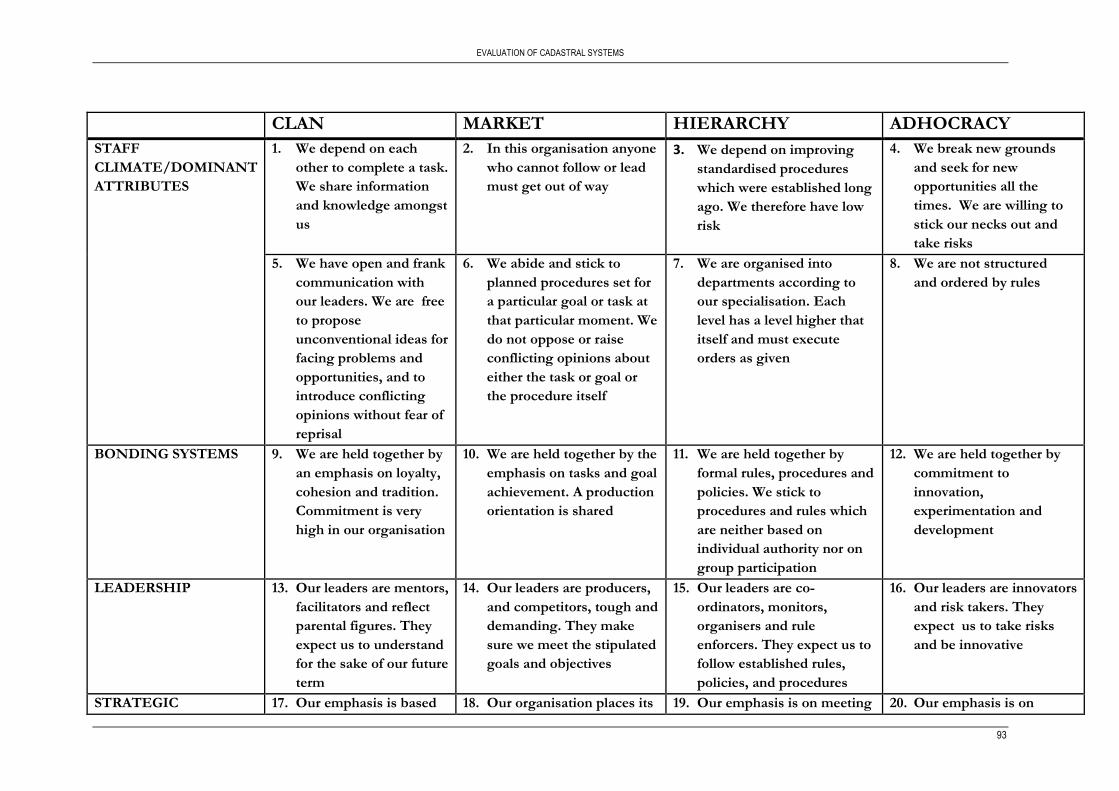
EVALUATION OF CADASTRAL SYSTEMS
93
CLAN MARKET HIERARCHY ADHOCRACY
STAFF
CLIMATE/DOMINANT
ATTRIBUTES
1. We depend on each
other to complete a task.
We share information
and knowledge amongst
us
2. In this organisation anyone
who cannot follow or lead
must get out of way
3. We depend on improving
standardised procedures
which were established long
ago. We therefore have low
risk
4. We break new grounds
and seek for new
opportunities all the
times. We are willing to
stick our necks out and
take risks
5. We have open and frank
communication with
our leaders. We are free
to propose
unconventional ideas for
facing problems and
opportunities, and to
introduce conflicting
opinions without fear of
reprisal
6. We abide and stick to
planned procedures set for
a particular goal or task at
that particular moment. We
do not oppose or raise
conflicting opinions about
either the task or goal or
the procedure itself
7. We are organised into
departments according to
our specialisation. Each
level has a level higher that
itself and must execute
orders as given
8. We are not structured
and ordered by rules
BONDING SYSTEMS
9. We are held together by
an emphasis on loyalty,
cohesion and tradition.
Commitment is very
high in our organisation
10. We are held together by the
emphasis on tasks and goal
achievement. A production
orientation is shared
11. We are held together by
formal rules, procedures and
policies. We stick to
procedures and rules which
are neither based on
individual authority nor on
group participation
12. We are held together by
commitment to
innovation,
experimentation and
development
LEADERSHIP 13. Our leaders are mentors,
facilitators and reflect
parental figures. They
expect us to understand
for the sake of our future
term
14. Our leaders are producers,
and competitors, tough and
demanding. They make
sure we meet the stipulated
goals and objectives
15. Our leaders are co-
ordinators, monitors,
organisers and rule
enforcers. They expect us to
follow established rules,
policies, and procedures
16. Our leaders are innovators
and risk takers. They
expect us to take risks
and be innovative
STRATEGIC 17. Our emphasis is based 18. Our organisation places its 19. Our emphasis is on meeting 20. Our emphasis is on
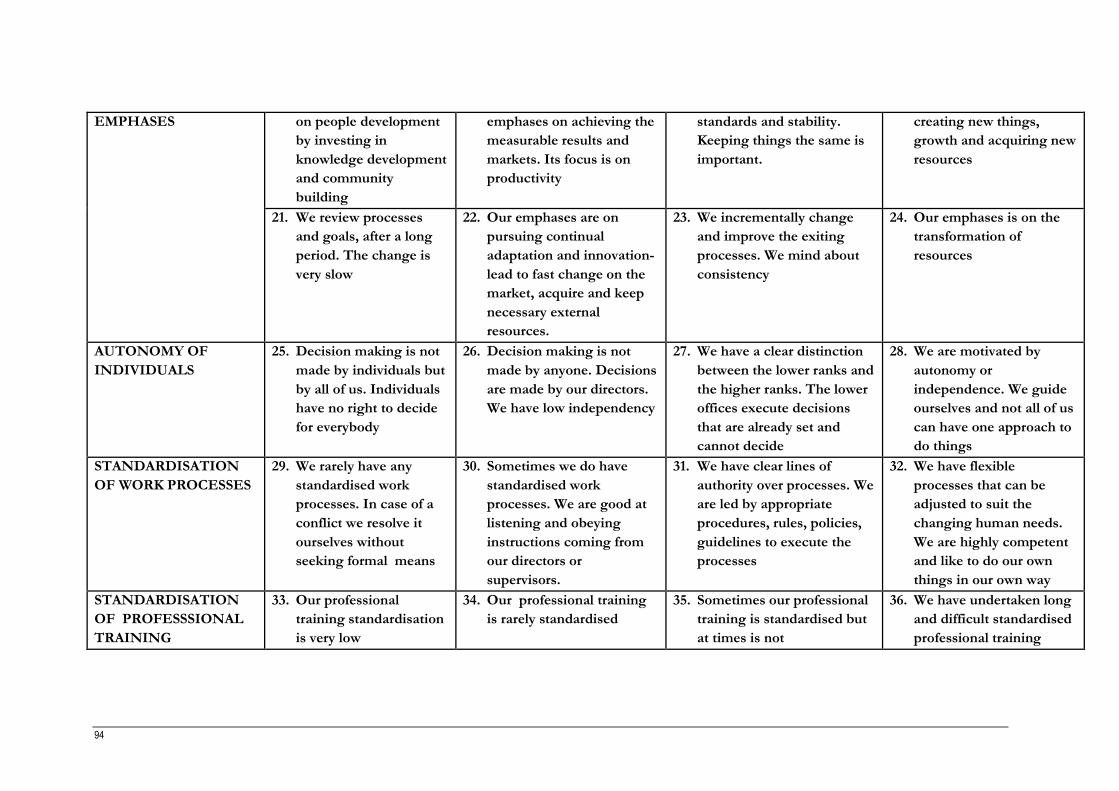
94
EMPHASES on people development
by investing in
knowledge development
and community
building
emphases on achieving the
measurable results and
markets. Its focus is on
productivity
standards and stability.
Keeping things the same is
important.
creating new things,
growth and acquiring new
resources
21. We review processes
and goals, after a long
period. The change is
very slow
22. Our emphases are on
pursuing continual
adaptation and innovation-
lead to fast change on the
market, acquire and keep
necessary external
resources.
23. We incrementally change
and improve the exiting
processes. We mind about
consistency
24. Our emphases is on the
transformation of
resources
AUTONOMY OF
INDIVIDUALS
25. Decision making is not
made by individuals but
by all of us. Individuals
have no right to decide
for everybody
26. Decision making is not
made by anyone. Decisions
are made by our directors.
We have low independency
27. We have a clear distinction
between the lower ranks and
the higher ranks. The lower
offices execute decisions
that are already set and
cannot decide
28. We are motivated by
autonomy or
independence. We guide
ourselves and not all of us
can have one approach to
do things
STANDARDISATION
OF WORK PROCESSES
29. We rarely have any
standardised work
processes. In case of a
conflict we resolve it
ourselves without
seeking formal means
30. Sometimes we do have
standardised work
processes. We are good at
listening and obeying
instructions coming from
our directors or
supervisors.
31. We have clear lines of
authority over processes. We
are led by appropriate
procedures, rules, policies,
guidelines to execute the
processes
32. We have flexible
processes that can be
adjusted to suit the
changing human needs.
We are highly competent
and like to do our own
things in our own way
STANDARDISATION
OF PROFESSSIONAL
TRAINING
33. Our professional
training standardisation
is very low
34. Our professional training
is rarely standardised
35. Sometimes our professional
training is standardised but
at times is not
36. We have undertaken long
and difficult standardised
professional training
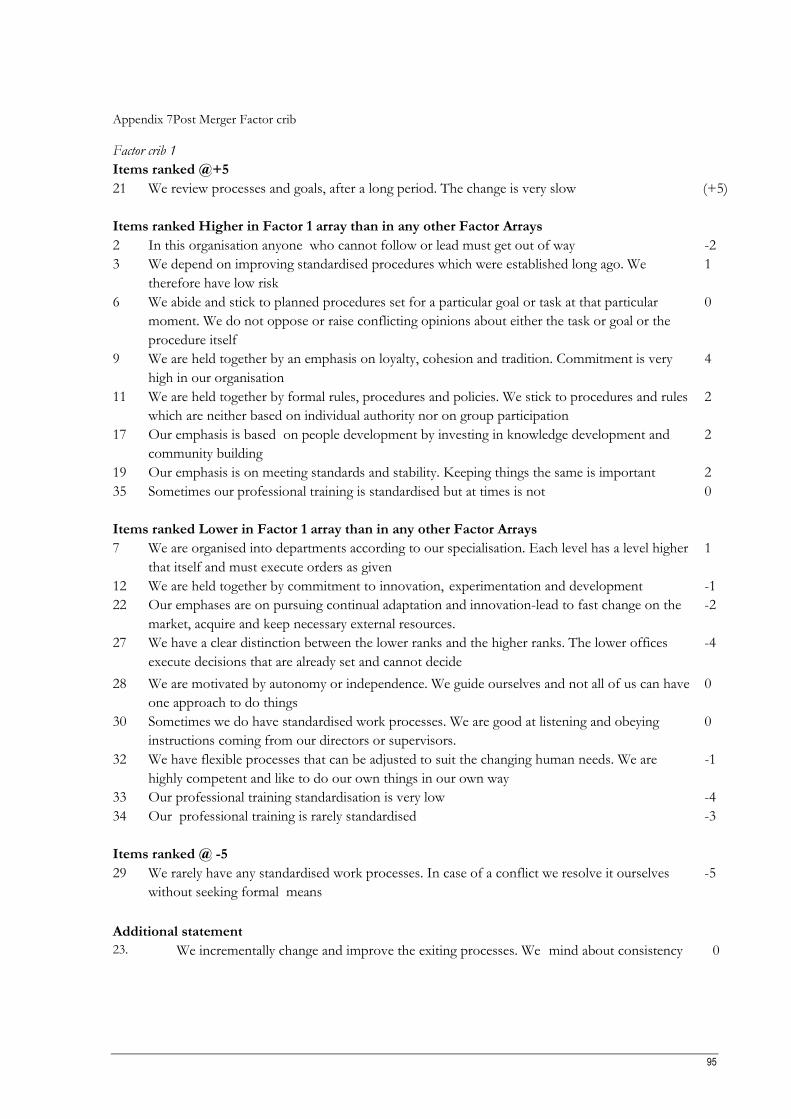
95
Appendix 7Post Merger Factor crib
Factor crib 1
Items ranked @+5
21 We review processes and goals, after a long period. The change is very slow (+5)
Items ranked Higher in Factor 1 array than in any other Factor Arrays
2 In this organisation anyone who cannot follow or lead must get out of way -2
3 We depend on improving standardised procedures which were established long ago. We
therefore have low risk
1
6 We abide and stick to planned procedures set for a particular goal or task at that particular
moment. We do not oppose or raise conflicting opinions about either the task or goal or the
procedure itself
0
9 We are held together by an emphasis on loyalty, cohesion and tradition. Commitment is very
high in our organisation
4
11 We are held together by formal rules, procedures and policies. We stick to procedures and rules
which are neither based on individual authority nor on group participation 2
17 Our emphasis is based on people development by investing in knowledge development and
community building
2
19 Our emphasis is on meeting standards and stability. Keeping things the same is important 2
35 Sometimes our professional training is standardised but at times is not 0
Items ranked Lower in Factor 1 array than in any other Factor Arrays
7 We are organised into departments according to our specialisation. Each level has a level higher
that itself and must execute orders as given
1
12 We are held together by commitment to innovation, experimentation and development -1
22 Our emphases are on pursuing continual adaptation and innovation-lead to fast change on the
market, acquire and keep necessary external resources. -2
27 We have a clear distinction between the lower ranks and the higher ranks. The lower offices
execute decisions that are already set and cannot decide -4
28 We are motivated by autonomy or independence. We guide ourselves and not all of us can have
one approach to do things 0
30 Sometimes we do have standardised work processes. We are good at listening and obeying
instructions coming from our directors or supervisors.
0
32 We have flexible processes that can be adjusted to suit the changing human needs. We are
highly competent and like to do our own things in our own way
-1
33 Our professional training standardisation is very low -4
34 Our professional training is rarely standardised -3
Items ranked @ -5
29 We rarely have any standardised work processes. In case of a conflict we resolve it ourselves
without seeking formal means
-5
Additional statement
23. We incrementally change and improve the exiting processes. We mind about consistency 0
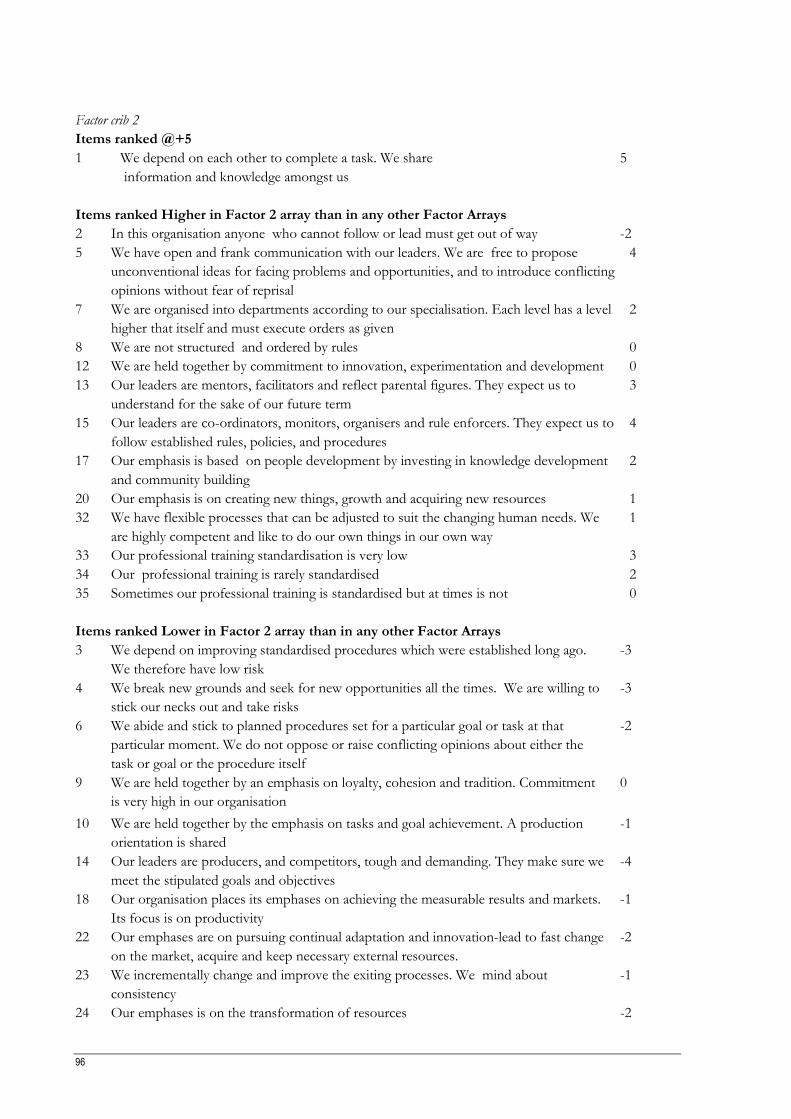
96
Factor crib 2
Items ranked @+5
1 We depend on each other to complete a task. We share
information and knowledge amongst us
5
Items ranked Higher in Factor 2 array than in any other Factor Arrays
2 In this organisation anyone who cannot follow or lead must get out of way -2
5 We have open and frank communication with our leaders. We are free to propose
unconventional ideas for facing problems and opportunities, and to introduce conflicting
opinions without fear of reprisal
4
7 We are organised into departments according to our specialisation. Each level has a level
higher that itself and must execute orders as given
2
8 We are not structured and ordered by rules 0
12 We are held together by commitment to innovation, experimentation and development 0
13 Our leaders are mentors, facilitators and reflect parental figures. They expect us to
understand for the sake of our future term
3
15 Our leaders are co-ordinators, monitors, organisers and rule enforcers. They expect us to
follow established rules, policies, and procedures
4
17 Our emphasis is based on people development by investing in knowledge development
and community building
2
20 Our emphasis is on creating new things, growth and acquiring new resources 1
32 We have flexible processes that can be adjusted to suit the changing human needs. We
are highly competent and like to do our own things in our own way
1
33 Our professional training standardisation is very low 3
34 Our professional training is rarely standardised 2
35 Sometimes our professional training is standardised but at times is not 0
Items ranked Lower in Factor 2 array than in any other Factor Arrays
3 We depend on improving standardised procedures which were established long ago.
We therefore have low risk
-3
4 We break new grounds and seek for new opportunities all the times. We are willing to
stick our necks out and take risks
-3
6 We abide and stick to planned procedures set for a particular goal or task at that
particular moment. We do not oppose or raise conflicting opinions about either the
task or goal or the procedure itself
-2
9 We are held together by an emphasis on loyalty, cohesion and tradition. Commitment
is very high in our organisation
0
10 We are held together by the emphasis on tasks and goal achievement. A production
orientation is shared
-1
14 Our leaders are producers, and competitors, tough and demanding. They make sure we
meet the stipulated goals and objectives
-4
18 Our organisation places its emphases on achieving the measurable results and markets.
Its focus is on productivity
-1
22 Our emphases are on pursuing continual adaptation and innovation-lead to fast change
on the market, acquire and keep necessary external resources.
-2
23 We incrementally change and improve the exiting processes. We mind about
consistency
-1
24 Our emphases is on the transformation of resources -2
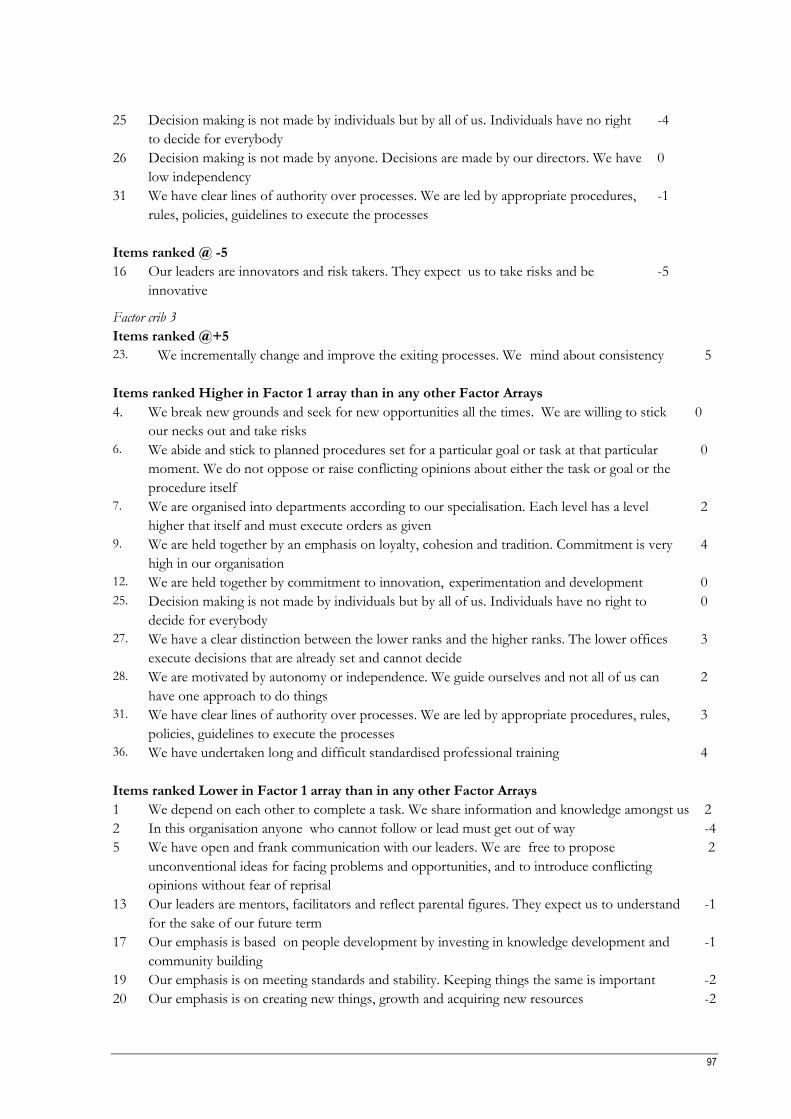
97
25 Decision making is not made by individuals but by all of us. Individuals have no right
to decide for everybody
-4
26 Decision making is not made by anyone. Decisions are made by our directors. We have
low independency
0
31 We have clear lines of authority over processes. We are led by appropriate procedures,
rules, policies, guidelines to execute the processes
-1
Items ranked @ -5
16 Our leaders are innovators and risk takers. They expect us to take risks and be
innovative
-5
Factor crib 3
Items ranked @+5
23. We incrementally change and improve the exiting processes. We mind about consistency 5
Items ranked Higher in Factor 1 array than in any other Factor Arrays
4. We break new grounds and seek for new opportunities all the times. We are willing to stick
our necks out and take risks
0
6. We abide and stick to planned procedures set for a particular goal or task at that particular
moment. We do not oppose or raise conflicting opinions about either the task or goal or the
procedure itself
0
7. We are organised into departments according to our specialisation. Each level has a level
higher that itself and must execute orders as given
2
9. We are held together by an emphasis on loyalty, cohesion and tradition. Commitment is very
high in our organisation 4
12. We are held together by commitment to innovation, experimentation and development 0
25. Decision making is not made by individuals but by all of us. Individuals have no right to
decide for everybody 0
27. We have a clear distinction between the lower ranks and the higher ranks. The lower offices
execute decisions that are already set and cannot decide 3
28. We are motivated by autonomy or independence. We guide ourselves and not all of us can
have one approach to do things 2
31. We have clear lines of authority over processes. We are led by appropriate procedures, rules,
policies, guidelines to execute the processes 3
36. We have undertaken long and difficult standardised professional training 4
Items ranked Lower in Factor 1 array than in any other Factor Arrays
1 We depend on each other to complete a task. We share information and knowledge amongst us 2
2 In this organisation anyone who cannot follow or lead must get out of way -4
5 We have open and frank communication with our leaders. We are free to propose
unconventional ideas for facing problems and opportunities, and to introduce conflicting
opinions without fear of reprisal
2
13 Our leaders are mentors, facilitators and reflect parental figures. They expect us to understand
for the sake of our future term -1
17 Our emphasis is based on people development by investing in knowledge development and
community building
-1
19 Our emphasis is on meeting standards and stability. Keeping things the same is important -2
20 Our emphasis is on creating new things, growth and acquiring new resources -2
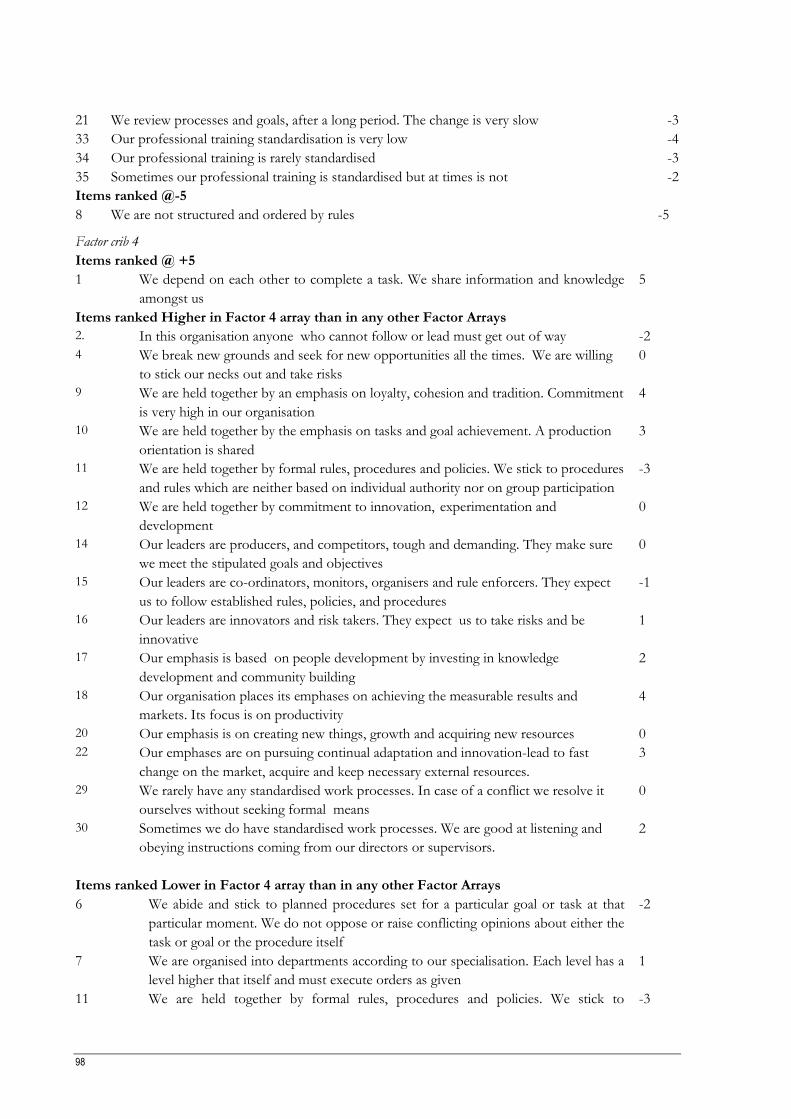
98
21 We review processes and goals, after a long period. The change is very slow -3
33 Our professional training standardisation is very low -4
34 Our professional training is rarely standardised -3
35 Sometimes our professional training is standardised but at times is not -2
Items ranked @-5
8 We are not structured and ordered by rules -5
Factor crib 4
Items ranked @ +5
1 We depend on each other to complete a task. We share information and knowledge
amongst us
5
Items ranked Higher in Factor 4 array than in any other Factor Arrays
2. In this organisation anyone who cannot follow or lead must get out of way -2
4 We break new grounds and seek for new opportunities all the times. We are willing
to stick our necks out and take risks
0
9 We are held together by an emphasis on loyalty, cohesion and tradition. Commitment
is very high in our organisation
4
10 We are held together by the emphasis on tasks and goal achievement. A production
orientation is shared 3
11 We are held together by formal rules, procedures and policies. We stick to procedures
and rules which are neither based on individual authority nor on group participation -3
12 We are held together by commitment to innovation, experimentation and
development 0
14 Our leaders are producers, and competitors, tough and demanding. They make sure
we meet the stipulated goals and objectives 0
15 Our leaders are co-ordinators, monitors, organisers and rule enforcers. They expect
us to follow established rules, policies, and procedures
-1
16 Our leaders are innovators and risk takers. They expect us to take risks and be
innovative
1
17 Our emphasis is based on people development by investing in knowledge
development and community building
2
18 Our organisation places its emphases on achieving the measurable results and
markets. Its focus is on productivity 4
20 Our emphasis is on creating new things, growth and acquiring new resources 0
22 Our emphases are on pursuing continual adaptation and innovation-lead to fast
change on the market, acquire and keep necessary external resources. 3
29 We rarely have any standardised work processes. In case of a conflict we resolve it
ourselves without seeking formal means
0
30 Sometimes we do have standardised work processes. We are good at listening and
obeying instructions coming from our directors or supervisors.
2
Items ranked Lower in Factor 4 array than in any other Factor Arrays
6 We abide and stick to planned procedures set for a particular goal or task at that
particular moment. We do not oppose or raise conflicting opinions about either the
task or goal or the procedure itself
-2
7 We are organised into departments according to our specialisation. Each level has a
level higher that itself and must execute orders as given
1
11 We are held together by formal rules, procedures and policies. We stick to -3
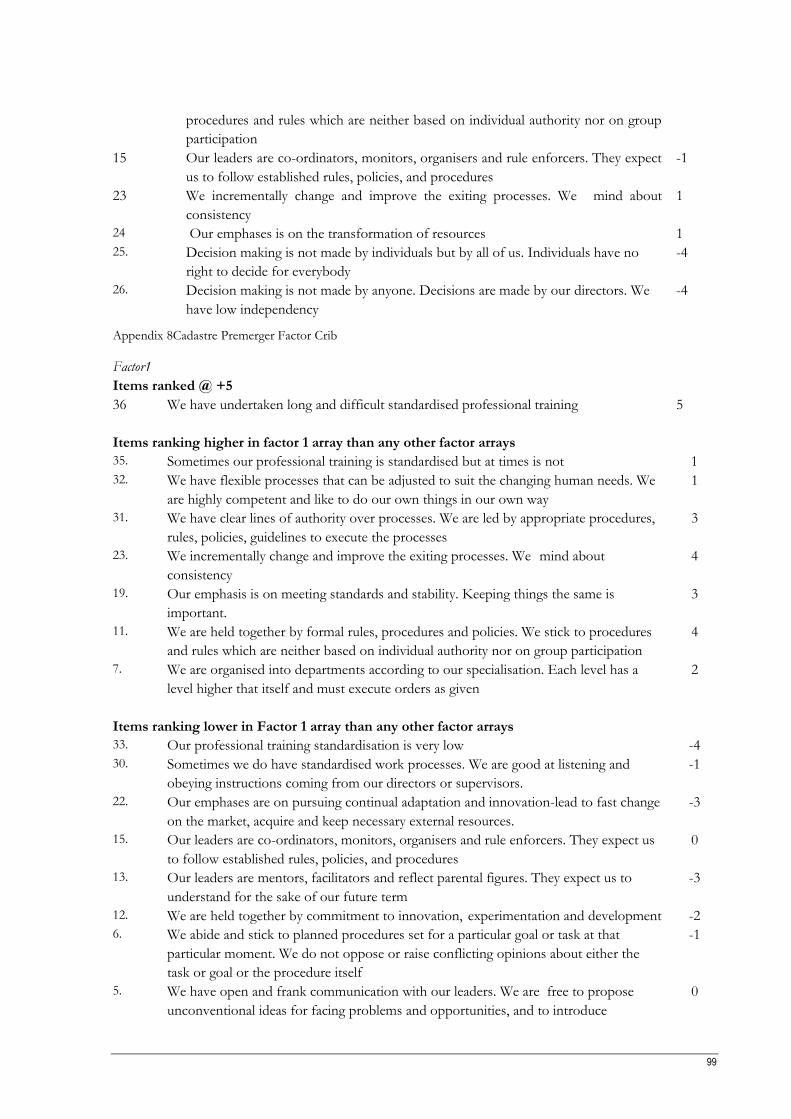
99
procedures and rules which are neither based on individual authority nor on group
participation 15 Our leaders are co-ordinators, monitors, organisers and rule enforcers. They expect
us to follow established rules, policies, and procedures
-1
23 We incrementally change and improve the exiting processes. We mind about
consistency
1
24 Our emphases is on the transformation of resources 1
25. Decision making is not made by individuals but by all of us. Individuals have no
right to decide for everybody -4
26. Decision making is not made by anyone. Decisions are made by our directors. We
have low independency -4
Appendix 8Cadastre Premerger Factor Crib
Factor1
Items ranked @ +5
36 We have undertaken long and difficult standardised professional training 5
Items ranking higher in factor 1 array than any other factor arrays
35. Sometimes our professional training is standardised but at times is not 1
32. We have flexible processes that can be adjusted to suit the changing human needs. We
are highly competent and like to do our own things in our own way 1
31. We have clear lines of authority over processes. We are led by appropriate procedures,
rules, policies, guidelines to execute the processes 3
23. We incrementally change and improve the exiting processes. We mind about
consistency 4
19. Our emphasis is on meeting standards and stability. Keeping things the same is
important. 3
11. We are held together by formal rules, procedures and policies. We stick to procedures
and rules which are neither based on individual authority nor on group participation 4
7. We are organised into departments according to our specialisation. Each level has a
level higher that itself and must execute orders as given
2
Items ranking lower in Factor 1 array than any other factor arrays
33. Our professional training standardisation is very low -4
30. Sometimes we do have standardised work processes. We are good at listening and
obeying instructions coming from our directors or supervisors.
-1
22. Our emphases are on pursuing continual adaptation and innovation-lead to fast change
on the market, acquire and keep necessary external resources. -3
15. Our leaders are co-ordinators, monitors, organisers and rule enforcers. They expect us
to follow established rules, policies, and procedures 0
13. Our leaders are mentors, facilitators and reflect parental figures. They expect us to
understand for the sake of our future term -3
12. We are held together by commitment to innovation, experimentation and development -2
6. We abide and stick to planned procedures set for a particular goal or task at that
particular moment. We do not oppose or raise conflicting opinions about either the
task or goal or the procedure itself
-1
5. We have open and frank communication with our leaders. We are free to propose
unconventional ideas for facing problems and opportunities, and to introduce
0
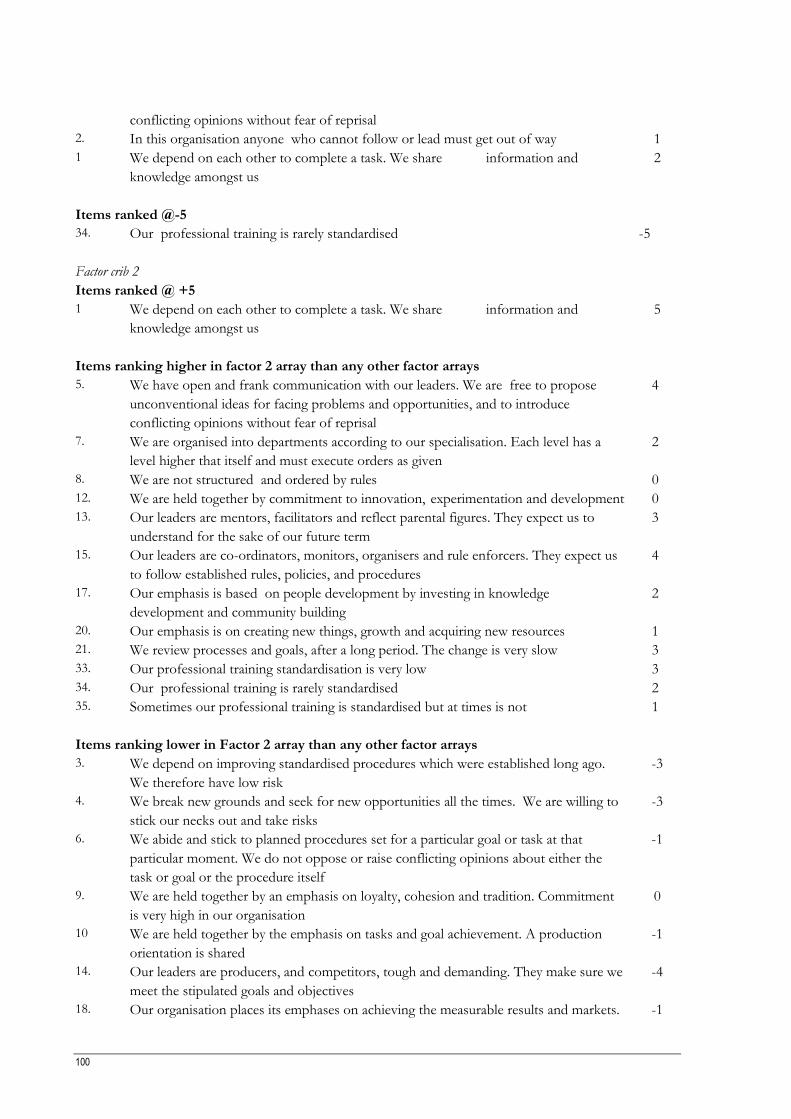
100
conflicting opinions without fear of reprisal
2. In this organisation anyone who cannot follow or lead must get out of way 1
1 We depend on each other to complete a task. We share information and
knowledge amongst us
2
Items ranked @-5
34. Our professional training is rarely standardised -5
Factor crib 2
Items ranked @ +5
1 We depend on each other to complete a task. We share information and
knowledge amongst us
5
Items ranking higher in factor 2 array than any other factor arrays
5. We have open and frank communication with our leaders. We are free to propose
unconventional ideas for facing problems and opportunities, and to introduce
conflicting opinions without fear of reprisal
4
7. We are organised into departments according to our specialisation. Each level has a
level higher that itself and must execute orders as given
2
8. We are not structured and ordered by rules 0
12. We are held together by commitment to innovation, experimentation and development 0
13. Our leaders are mentors, facilitators and reflect parental figures. They expect us to
understand for the sake of our future term 3
15. Our leaders are co-ordinators, monitors, organisers and rule enforcers. They expect us
to follow established rules, policies, and procedures 4
17. Our emphasis is based on people development by investing in knowledge
development and community building
2
20. Our emphasis is on creating new things, growth and acquiring new resources 1
21. We review processes and goals, after a long period. The change is very slow 3
33. Our professional training standardisation is very low 3
34. Our professional training is rarely standardised 2
35. Sometimes our professional training is standardised but at times is not 1
Items ranking lower in Factor 2 array than any other factor arrays
3. We depend on improving standardised procedures which were established long ago.
We therefore have low risk
-3
4. We break new grounds and seek for new opportunities all the times. We are willing to
stick our necks out and take risks
-3
6. We abide and stick to planned procedures set for a particular goal or task at that
particular moment. We do not oppose or raise conflicting opinions about either the
task or goal or the procedure itself
-1
9. We are held together by an emphasis on loyalty, cohesion and tradition. Commitment
is very high in our organisation 0
10 We are held together by the emphasis on tasks and goal achievement. A production
orientation is shared -1
14. Our leaders are producers, and competitors, tough and demanding. They make sure we
meet the stipulated goals and objectives -4
18. Our organisation places its emphases on achieving the measurable results and markets. -1
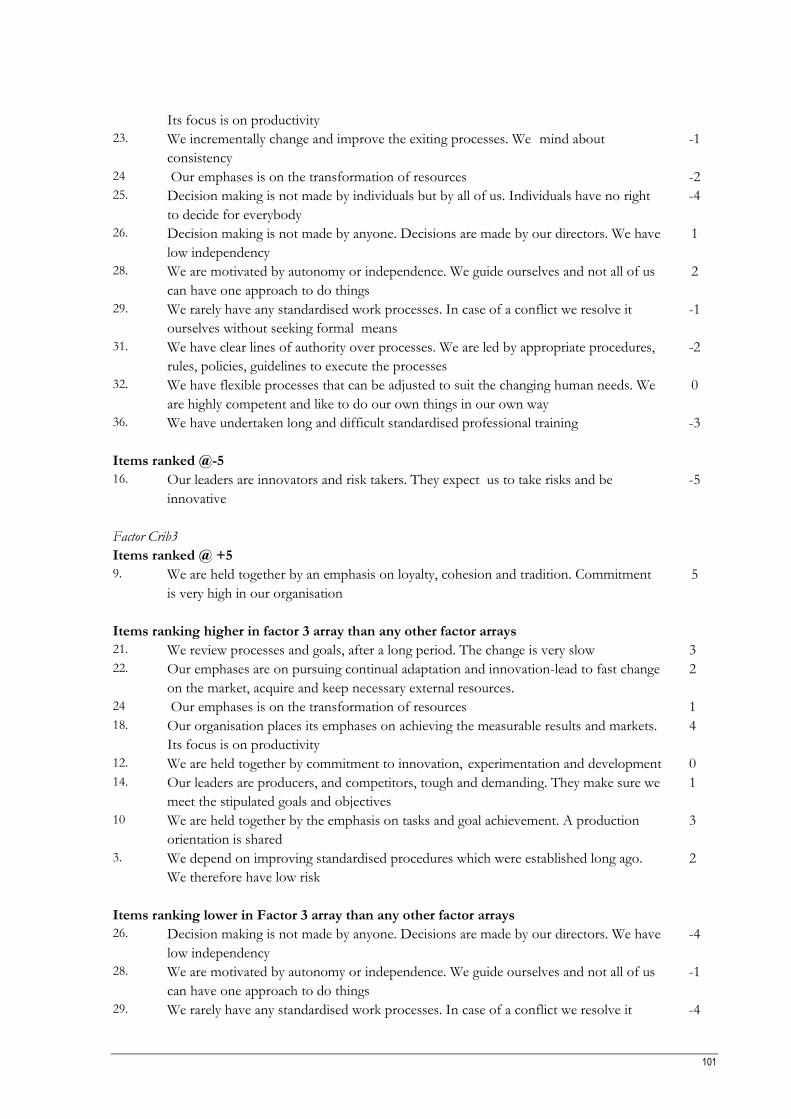
101
Its focus is on productivity 23. We incrementally change and improve the exiting processes. We mind about
consistency -1
24 Our emphases is on the transformation of resources -2
25. Decision making is not made by individuals but by all of us. Individuals have no right
to decide for everybody -4
26. Decision making is not made by anyone. Decisions are made by our directors. We have
low independency 1
28. We are motivated by autonomy or independence. We guide ourselves and not all of us
can have one approach to do things 2
29. We rarely have any standardised work processes. In case of a conflict we resolve it
ourselves without seeking formal means -1
31. We have clear lines of authority over processes. We are led by appropriate procedures,
rules, policies, guidelines to execute the processes -2
32. We have flexible processes that can be adjusted to suit the changing human needs. We
are highly competent and like to do our own things in our own way 0
36. We have undertaken long and difficult standardised professional training -3
Items ranked @-5
16. Our leaders are innovators and risk takers. They expect us to take risks and be
innovative
-5
Factor Crib3
Items ranked @ +5
9. We are held together by an emphasis on loyalty, cohesion and tradition. Commitment
is very high in our organisation 5
Items ranking higher in factor 3 array than any other factor arrays
21. We review processes and goals, after a long period. The change is very slow 3
22. Our emphases are on pursuing continual adaptation and innovation-lead to fast change
on the market, acquire and keep necessary external resources. 2
24 Our emphases is on the transformation of resources 1
18. Our organisation places its emphases on achieving the measurable results and markets.
Its focus is on productivity 4
12. We are held together by commitment to innovation, experimentation and development 0
14. Our leaders are producers, and competitors, tough and demanding. They make sure we
meet the stipulated goals and objectives 1
10 We are held together by the emphasis on tasks and goal achievement. A production
orientation is shared 3
3. We depend on improving standardised procedures which were established long ago.
We therefore have low risk
2
Items ranking lower in Factor 3 array than any other factor arrays
26. Decision making is not made by anyone. Decisions are made by our directors. We have
low independency -4
28. We are motivated by autonomy or independence. We guide ourselves and not all of us
can have one approach to do things -1
29. We rarely have any standardised work processes. In case of a conflict we resolve it -4
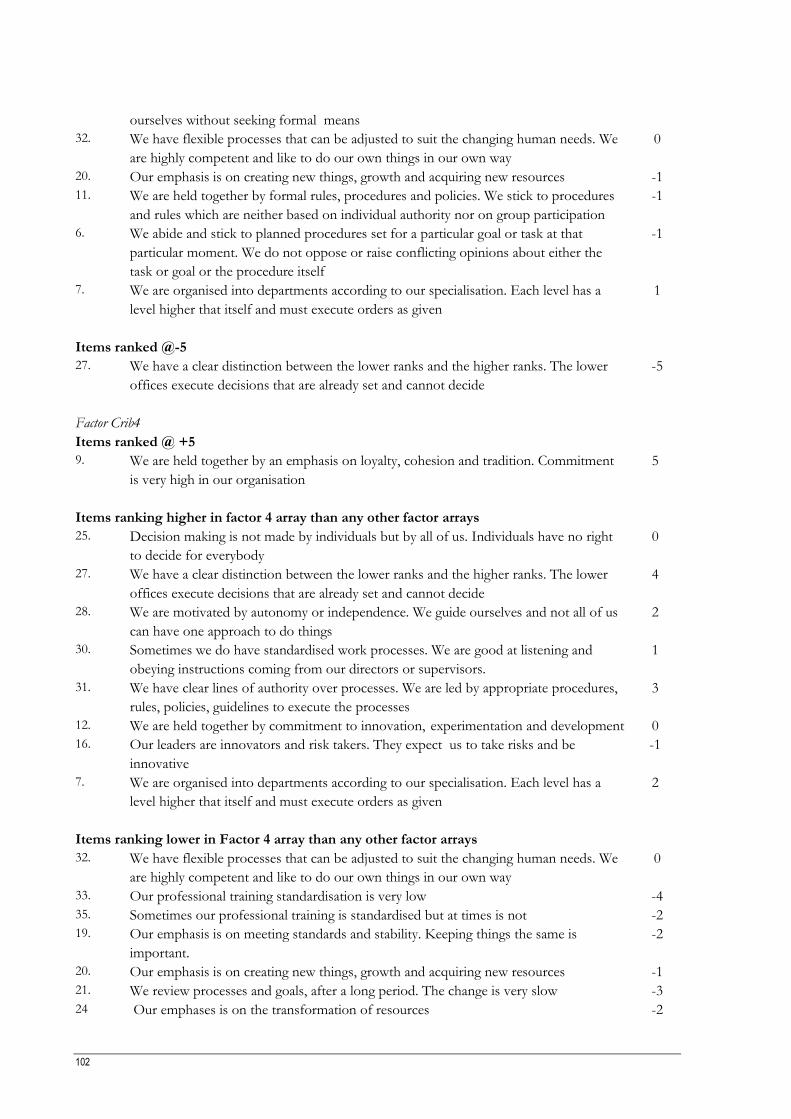
102
ourselves without seeking formal means 32. We have flexible processes that can be adjusted to suit the changing human needs. We
are highly competent and like to do our own things in our own way 0
20. Our emphasis is on creating new things, growth and acquiring new resources -1
11. We are held together by formal rules, procedures and policies. We stick to procedures
and rules which are neither based on individual authority nor on group participation -1
6. We abide and stick to planned procedures set for a particular goal or task at that
particular moment. We do not oppose or raise conflicting opinions about either the
task or goal or the procedure itself
-1
7. We are organised into departments according to our specialisation. Each level has a
level higher that itself and must execute orders as given
1
Items ranked @-5
27. We have a clear distinction between the lower ranks and the higher ranks. The lower
offices execute decisions that are already set and cannot decide -5
Factor Crib4
Items ranked @ +5
9. We are held together by an emphasis on loyalty, cohesion and tradition. Commitment
is very high in our organisation 5
Items ranking higher in factor 4 array than any other factor arrays
25. Decision making is not made by individuals but by all of us. Individuals have no right
to decide for everybody 0
27. We have a clear distinction between the lower ranks and the higher ranks. The lower
offices execute decisions that are already set and cannot decide 4
28. We are motivated by autonomy or independence. We guide ourselves and not all of us
can have one approach to do things 2
30. Sometimes we do have standardised work processes. We are good at listening and
obeying instructions coming from our directors or supervisors.
1
31. We have clear lines of authority over processes. We are led by appropriate procedures,
rules, policies, guidelines to execute the processes 3
12. We are held together by commitment to innovation, experimentation and development 0
16. Our leaders are innovators and risk takers. They expect us to take risks and be
innovative
-1
7. We are organised into departments according to our specialisation. Each level has a
level higher that itself and must execute orders as given
2
Items ranking lower in Factor 4 array than any other factor arrays
32. We have flexible processes that can be adjusted to suit the changing human needs. We
are highly competent and like to do our own things in our own way 0
33. Our professional training standardisation is very low -4
35. Sometimes our professional training is standardised but at times is not -2
19. Our emphasis is on meeting standards and stability. Keeping things the same is
important. -2
20. Our emphasis is on creating new things, growth and acquiring new resources -1
21. We review processes and goals, after a long period. The change is very slow -3
24 Our emphases is on the transformation of resources -2
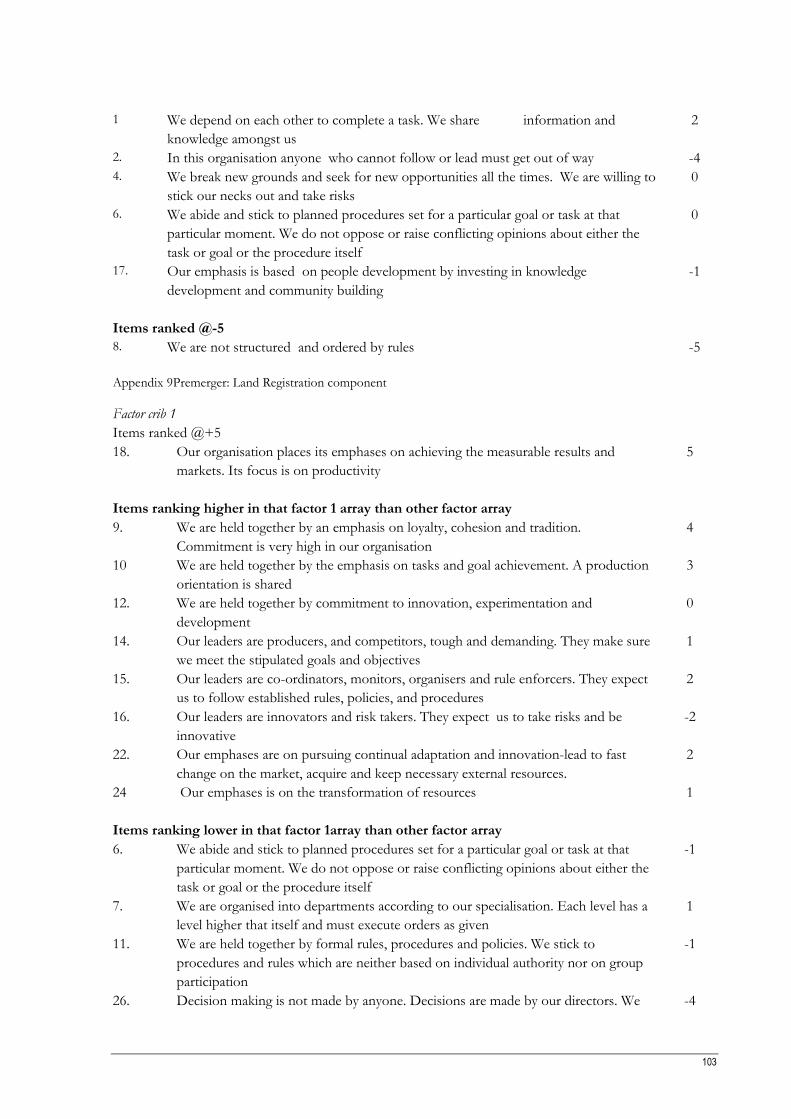
103
1 We depend on each other to complete a task. We share information and
knowledge amongst us
2
2. In this organisation anyone who cannot follow or lead must get out of way -4
4. We break new grounds and seek for new opportunities all the times. We are willing to
stick our necks out and take risks
0
6. We abide and stick to planned procedures set for a particular goal or task at that
particular moment. We do not oppose or raise conflicting opinions about either the
task or goal or the procedure itself
0
17. Our emphasis is based on people development by investing in knowledge
development and community building
-1
Items ranked @-5
8. We are not structured and ordered by rules -5
Appendix 9Premerger: Land Registration component
Factor crib 1
Items ranked @+5
18. Our organisation places its emphases on achieving the measurable results and
markets. Its focus is on productivity
5
Items ranking higher in that factor 1 array than other factor array
9. We are held together by an emphasis on loyalty, cohesion and tradition.
Commitment is very high in our organisation
4
10 We are held together by the emphasis on tasks and goal achievement. A production
orientation is shared
3
12. We are held together by commitment to innovation, experimentation and
development
0
14. Our leaders are producers, and competitors, tough and demanding. They make sure
we meet the stipulated goals and objectives
1
15. Our leaders are co-ordinators, monitors, organisers and rule enforcers. They expect
us to follow established rules, policies, and procedures
2
16. Our leaders are innovators and risk takers. They expect us to take risks and be
innovative
-2
22. Our emphases are on pursuing continual adaptation and innovation-lead to fast
change on the market, acquire and keep necessary external resources.
2
24 Our emphases is on the transformation of resources 1
Items ranking lower in that factor 1array than other factor array
6. We abide and stick to planned procedures set for a particular goal or task at that
particular moment. We do not oppose or raise conflicting opinions about either the
task or goal or the procedure itself
-1
7. We are organised into departments according to our specialisation. Each level has a
level higher that itself and must execute orders as given
1
11. We are held together by formal rules, procedures and policies. We stick to
procedures and rules which are neither based on individual authority nor on group
participation
-1
26. Decision making is not made by anyone. Decisions are made by our directors. We -4
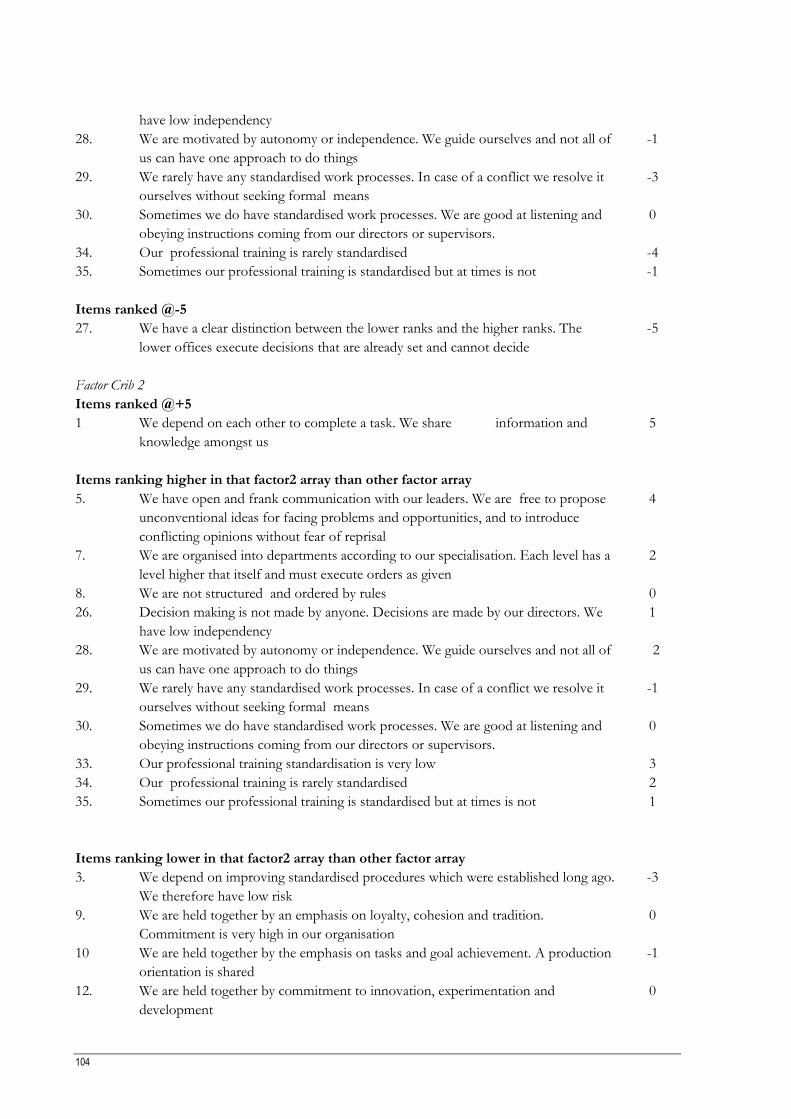
104
have low independency
28. We are motivated by autonomy or independence. We guide ourselves and not all of
us can have one approach to do things
-1
29. We rarely have any standardised work processes. In case of a conflict we resolve it
ourselves without seeking formal means
-3
30. Sometimes we do have standardised work processes. We are good at listening and
obeying instructions coming from our directors or supervisors.
0
34. Our professional training is rarely standardised -4
35. Sometimes our professional training is standardised but at times is not -1
Items ranked @-5
27. We have a clear distinction between the lower ranks and the higher ranks. The
lower offices execute decisions that are already set and cannot decide
-5
Factor Crib 2
Items ranked @+5
1 We depend on each other to complete a task. We share information and
knowledge amongst us
5
Items ranking higher in that factor2 array than other factor array
5. We have open and frank communication with our leaders. We are free to propose
unconventional ideas for facing problems and opportunities, and to introduce
conflicting opinions without fear of reprisal
4
7. We are organised into departments according to our specialisation. Each level has a
level higher that itself and must execute orders as given
2
8. We are not structured and ordered by rules 0
26. Decision making is not made by anyone. Decisions are made by our directors. We
have low independency
1
28. We are motivated by autonomy or independence. We guide ourselves and not all of
us can have one approach to do things
2
29. We rarely have any standardised work processes. In case of a conflict we resolve it
ourselves without seeking formal means
-1
30. Sometimes we do have standardised work processes. We are good at listening and
obeying instructions coming from our directors or supervisors.
0
33. Our professional training standardisation is very low 3
34. Our professional training is rarely standardised 2
35. Sometimes our professional training is standardised but at times is not 1
Items ranking lower in that factor2 array than other factor array
3. We depend on improving standardised procedures which were established long ago.
We therefore have low risk
-3
9. We are held together by an emphasis on loyalty, cohesion and tradition.
Commitment is very high in our organisation
0
10 We are held together by the emphasis on tasks and goal achievement. A production
orientation is shared
-1
12. We are held together by commitment to innovation, experimentation and
development
0
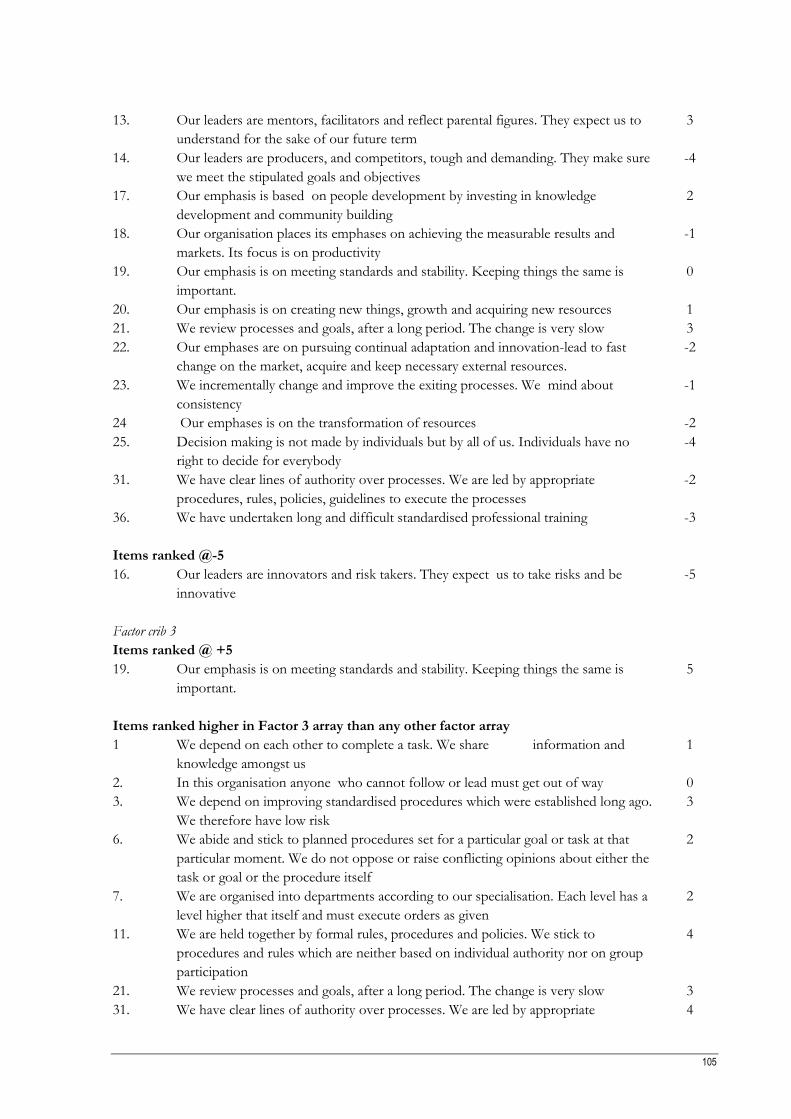
105
13. Our leaders are mentors, facilitators and reflect parental figures. They expect us to
understand for the sake of our future term
3
14. Our leaders are producers, and competitors, tough and demanding. They make sure
we meet the stipulated goals and objectives
-4
17. Our emphasis is based on people development by investing in knowledge
development and community building
2
18. Our organisation places its emphases on achieving the measurable results and
markets. Its focus is on productivity
-1
19. Our emphasis is on meeting standards and stability. Keeping things the same is
important.
0
20. Our emphasis is on creating new things, growth and acquiring new resources 1
21. We review processes and goals, after a long period. The change is very slow 3
22. Our emphases are on pursuing continual adaptation and innovation-lead to fast
change on the market, acquire and keep necessary external resources.
-2
23. We incrementally change and improve the exiting processes. We mind about
consistency
-1
24 Our emphases is on the transformation of resources -2
25. Decision making is not made by individuals but by all of us. Individuals have no
right to decide for everybody
-4
31. We have clear lines of authority over processes. We are led by appropriate
procedures, rules, policies, guidelines to execute the processes
-2
36. We have undertaken long and difficult standardised professional training -3
Items ranked @-5
16. Our leaders are innovators and risk takers. They expect us to take risks and be
innovative
-5
Factor crib 3
Items ranked @ +5
19. Our emphasis is on meeting standards and stability. Keeping things the same is
important.
5
Items ranked higher in Factor 3 array than any other factor array
1 We depend on each other to complete a task. We share information and
knowledge amongst us
1
2. In this organisation anyone who cannot follow or lead must get out of way 0
3. We depend on improving standardised procedures which were established long ago.
We therefore have low risk
3
6. We abide and stick to planned procedures set for a particular goal or task at that
particular moment. We do not oppose or raise conflicting opinions about either the
task or goal or the procedure itself
2
7. We are organised into departments according to our specialisation. Each level has a
level higher that itself and must execute orders as given
2
11. We are held together by formal rules, procedures and policies. We stick to
procedures and rules which are neither based on individual authority nor on group
participation
4
21. We review processes and goals, after a long period. The change is very slow 3
31. We have clear lines of authority over processes. We are led by appropriate 4
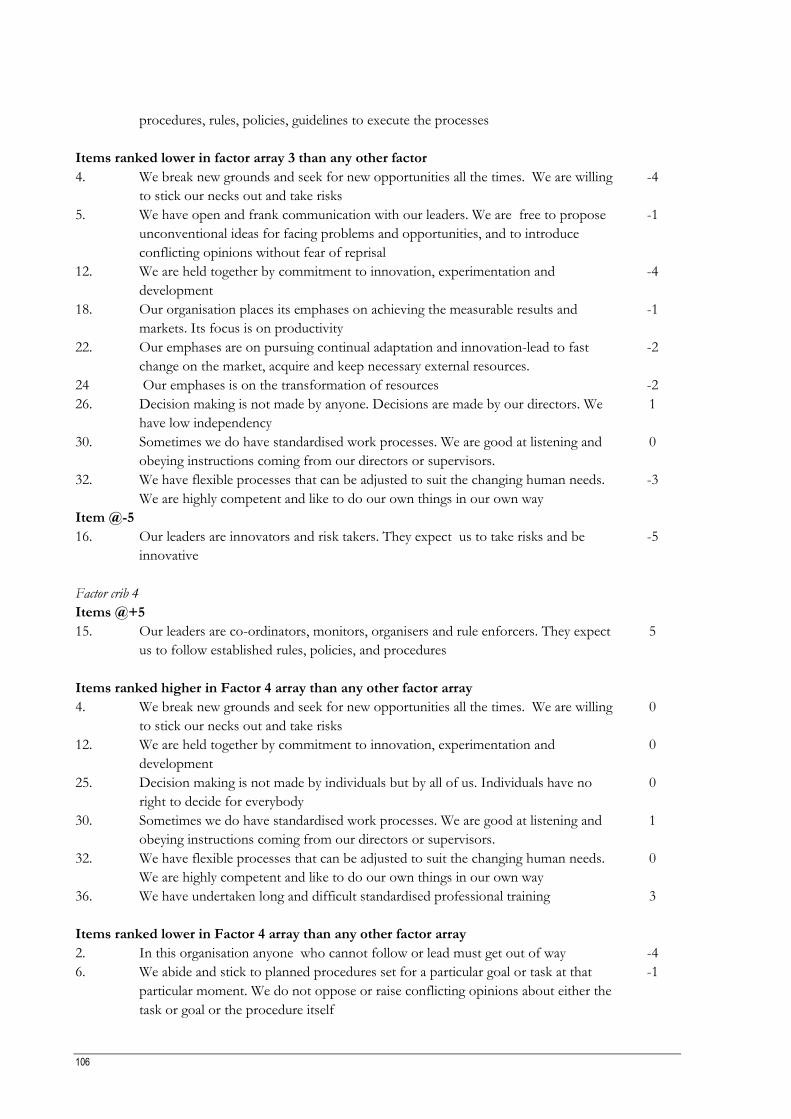
106
procedures, rules, policies, guidelines to execute the processes
Items ranked lower in factor array 3 than any other factor
4. We break new grounds and seek for new opportunities all the times. We are willing
to stick our necks out and take risks
-4
5. We have open and frank communication with our leaders. We are free to propose
unconventional ideas for facing problems and opportunities, and to introduce
conflicting opinions without fear of reprisal
-1
12. We are held together by commitment to innovation, experimentation and
development
-4
18. Our organisation places its emphases on achieving the measurable results and
markets. Its focus is on productivity
-1
22. Our emphases are on pursuing continual adaptation and innovation-lead to fast
change on the market, acquire and keep necessary external resources.
-2
24 Our emphases is on the transformation of resources -2
26. Decision making is not made by anyone. Decisions are made by our directors. We
have low independency
1
30. Sometimes we do have standardised work processes. We are good at listening and
obeying instructions coming from our directors or supervisors.
0
32. We have flexible processes that can be adjusted to suit the changing human needs.
We are highly competent and like to do our own things in our own way
-3
Item @-5
16. Our leaders are innovators and risk takers. They expect us to take risks and be
innovative
-5
Factor crib 4
Items @+5
15. Our leaders are co-ordinators, monitors, organisers and rule enforcers. They expect
us to follow established rules, policies, and procedures
5
Items ranked higher in Factor 4 array than any other factor array
4. We break new grounds and seek for new opportunities all the times. We are willing
to stick our necks out and take risks
0
12. We are held together by commitment to innovation, experimentation and
development
0
25. Decision making is not made by individuals but by all of us. Individuals have no
right to decide for everybody
0
30. Sometimes we do have standardised work processes. We are good at listening and
obeying instructions coming from our directors or supervisors.
1
32. We have flexible processes that can be adjusted to suit the changing human needs.
We are highly competent and like to do our own things in our own way
0
36. We have undertaken long and difficult standardised professional training 3
Items ranked lower in Factor 4 array than any other factor array
2. In this organisation anyone who cannot follow or lead must get out of way -4
6. We abide and stick to planned procedures set for a particular goal or task at that
particular moment. We do not oppose or raise conflicting opinions about either the
task or goal or the procedure itself
-1
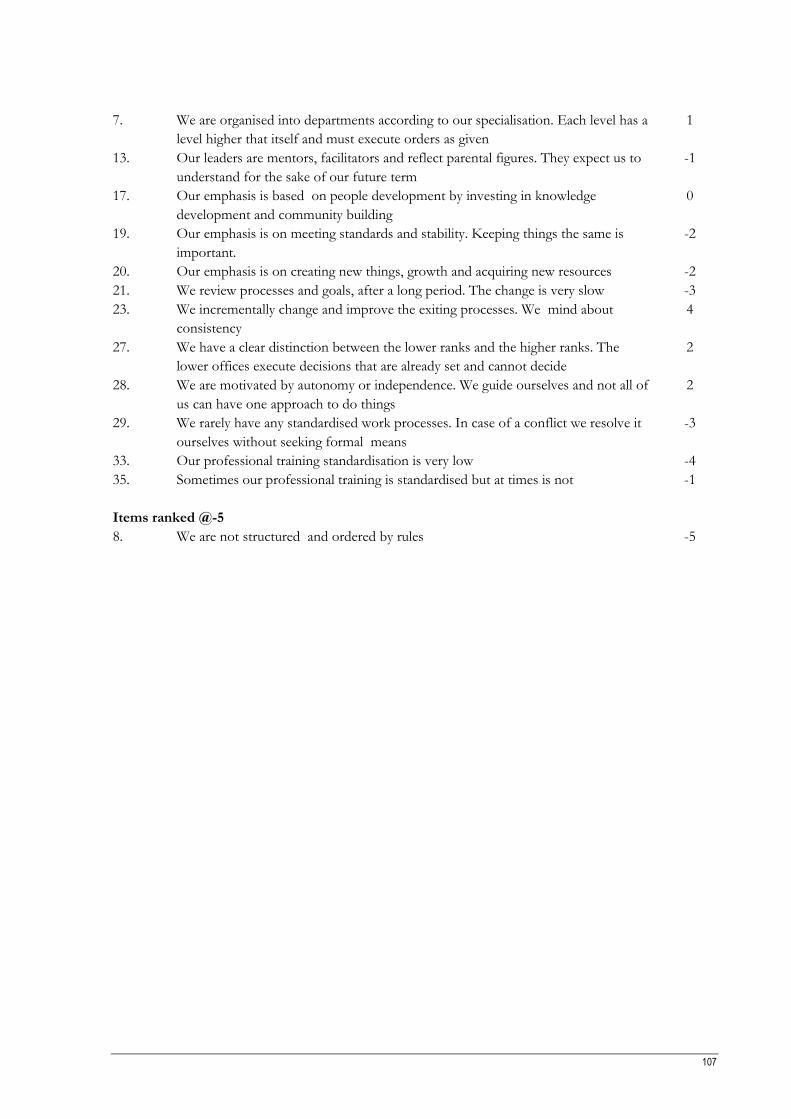
107
7. We are organised into departments according to our specialisation. Each level has a
level higher that itself and must execute orders as given
1
13. Our leaders are mentors, facilitators and reflect parental figures. They expect us to
understand for the sake of our future term
-1
17. Our emphasis is based on people development by investing in knowledge
development and community building
0
19. Our emphasis is on meeting standards and stability. Keeping things the same is
important.
-2
20. Our emphasis is on creating new things, growth and acquiring new resources -2
21. We review processes and goals, after a long period. The change is very slow -3
23. We incrementally change and improve the exiting processes. We mind about
consistency
4
27. We have a clear distinction between the lower ranks and the higher ranks. The
lower offices execute decisions that are already set and cannot decide
2
28. We are motivated by autonomy or independence. We guide ourselves and not all of
us can have one approach to do things
2
29. We rarely have any standardised work processes. In case of a conflict we resolve it
ourselves without seeking formal means
-3
33. Our professional training standardisation is very low -4
35. Sometimes our professional training is standardised but at times is not -1
Items ranked @-5
8. We are not structured and ordered by rules -5
Related Documents