The Centers for Medicare & Medicaid Services' Office of Research, Development, and Information (ORDI) strives to make information available to all. Nevertheless, portions of our files including charts, tables, and graphics may be difficult to read using assistive technology. Persons Vvith disabilities experiencing problems accessing portions of any file should contact ORDI through e-mail at [email protected]. Contract No.: 500-00.0033(13) MPR Reference No.: 6216-711 MATHEMATICA Policy Research, Inc. Evaluation of Medicare Advantage Special Needs Plans Summary Report September 30, 2008 Robert Schmitz Angela Merrill Jennifer Schore Rachel Shapiro Jim Verdier Submitted to: Centers for Medicare & Medicaid Services 7500 Security Blvd., C3.20.17 Baltimore, MD 21244-1850 Submitted by: Mathematica Policy Research, Inc. 955 Massachusetts Ave., Suite 801 Cambridge, MA 02139 Telephone: (617) 491-7900 Facsinri1e: (617) 491-8044 Project Officer: Susan Radke James Hawthorne Project Director: Robert Schmitz

Welcome message from author
This document is posted to help you gain knowledge. Please leave a comment to let me know what you think about it! Share it to your friends and learn new things together.
Transcript

The Centers for Medicare & Medicaid Services' Office of Research, Development, and Information (ORDI) strives to make information available to all. Nevertheless, portions of our files including charts, tables, and graphics may be difficult to read using assistive technology. Persons Vvith disabilities experiencing problems accessing portions of any file should contact ORDI through e-mail at [email protected].
Contract No.: 500-00.0033(13) MPR Reference No.: 6216-711 MATHEMATICA
Policy Research, Inc.
Evaluation of Medicare Advantage Special Needs Plans
Summary Report
September 30, 2008
Robert Schmitz Angela Merrill Jennifer Schore Rachel Shapiro Jim Verdier
Submitted to:
Centers for Medicare & Medicaid Services 7500 Security Blvd., C3.20.17 Baltimore, MD 21244-1850
Submitted by:
Mathematica Policy Research, Inc. 955 Massachusetts Ave., Suite 801 Cambridge, MA 02139 Telephone: (617) 491-7900 Facsinri1e: (617) 491-8044
Project Officer: Susan Radke James Hawthorne
Project Director: Robert Schmitz
ii
CONTENTS
Chapter Page
EXECUTIVE SUMMARY ............................................................................................ X
I BACKGROUND AND OVERVIEW OF THE EVALUATION ...................................1
A. LEGISLATIVE AND POLICY BACKGROUND .................................................1
1. Legislative Mandate .........................................................................................1
2. Evolution of CMS Policies ..............................................................................2
B. FINDINGS FROM CMS DEMONSTRATIONS SERVING SPECIAL
POPULATIONS ......................................................................................................4
1. Dual-Eligible Demonstrations..........................................................................4
2. Nursing Home Demonstrations ........................................................................5
3. Chronic-Condition Demonstrations .................................................................7
C. CONVERSION OF DEMONSTRATION PLANS TO SNPS ................................7
D. OVERVIEW OF THE EVALUATION DESIGN ...................................................9
E. ORGANIZATION OF THE REPORT ..................................................................11
II THE EVOLUTION OF SNPS: 2004-2008 ..................................................................12
A. THE GROWTH OF SNP PLANS .........................................................................12
1. Terminology ...................................................................................................12
2. An Overview of SNP Growth ........................................................................13
3. The Impact of Enrollment Policies on SNP Growth ......................................15
4. Enrollment and Disenrollment Trends by SNP Type ....................................18
B. SNP CHARACTERISTICS ...................................................................................24
C. SUMMARY ...........................................................................................................37
III RESULTS FROM A SURVEY OF SNPS ...................................................................38
A. BACKGROUND AND METHODS .....................................................................38

iii
CONTENTS (continued)
Chapter Page
III (continued)
B. RESULTS ..............................................................................................................38
C. SUMMARY ...........................................................................................................40
IV PLAN OPERATIONS AND ENROLLEE INTERVENTIONS: FINDINGS FROM
VISITS AND FOCUS GROUPS FOR SELECTED PLANS ......................................46
A. COORDINATION WITH MEDICAID ................................................................47
B. PROVISION OF SPECIAL SERVICES ...............................................................48
C. ADAPTATION OF SERVICES TO INDIVIDUAL NEEDS ...............................52
D. ENROLLEE SATISFACTION WITH ENROLLMENT AND PLAN
SERVICES .............................................................................................................52
E. CONCLUSION ......................................................................................................52
V STATE MEDICAID PERSPECTIVES ........................................................................58
A. MEDICAID CONTRACTING ARRANGEMENTS AND SNP
ENROLLMENT ....................................................................................................58
B. MEDICAID AGENCY SITE VISITS AND INTERVIEWS: VARIATIONS
IN STATE INTEREST IN SNP ............................................................................65
1. Why Some States Want to Work With SNPs ................................................66
2. Why Most States Are Not Currently Interested in SNPs ...............................67
C. ANALYSIS OF STATE INCENTIVES TO WORK WITH SNPS ......................68
1. Acute Care Services .......................................................................................68
2. Managed Long-Term Care .............................................................................69
3. CMS Efforts to Reduce Obstacles .................................................................70
D. SUMMARY ...........................................................................................................70

iv
CONTENTS (continued)
Chapter Page
VI CHARACTERISTICS OF SNP AND NON-SNP BENEFICIARIES .........................72
A. METHODS ............................................................................................................72
B. RESULTS ..............................................................................................................74
C. SUMMARY ...........................................................................................................76
VII ANALYSIS OF SNP AND MA PLAN BIDS ..............................................................95
A. BACKGROUND ...................................................................................................95
B. METHODS ............................................................................................................95
C. RESULTS ..............................................................................................................96
D. DISCUSSION ........................................................................................................97
VIII CONCLUSIONS ...........................................................................................................98
REFERENCES ............................................................................................................101

v
CONTENTS (continued)
Chapter Page
APPENDIX I: KEY SECTIONS OF US CODE PERTAINING TO SPECIAL
NEEDS PLANS
APPENDIX II: CONFERENCE AGREEMENT ON SECTION 231 OF THE
MEDICARE PRESCRIPTION DRUG, IMPROVEMENT, AND
MODERNIZATION ACT OF 2003
APPENDIX III: GLOSSARY
APPENDIX IV: TECHNICAL APPENDIX TO CHAPTER VII
APPENDIX V: CMS GUIDANCE ON INTEGRATION OF MEDICARE AND
MEDICAID

vi
TABLES
Table Page
E.1 PLAN AND ENROLLMENT GROWTH, 2004-2007 ............................................... XII
E.2 SELECTED PLAN FEATURES, 2007 ..................................................................... XIII
E.3 MEDICAID CONTRACTS, 2006 ............................................................................ XIV
I.1 POLICY CHANGES CENTRAL TO THE EVOLUTION OF SNPS ...........................3
I.2 SNP EVALUATION RESEARCH QUESTIONS AND DATA SOURCES,
WITH CHAPTER CONTAINING FINDINGS .............................................................9
II.1 PLANS AND ENROLLEES, BY SNP TYPE: 2005-2008 ..........................................14
II.2 SNP ENROLLMENT AND DISENROLLMENT, 2004-2007 ....................................21
II.3 SNP ENROLLMENT, OVERALL AND BY MODE OF ENROLLMENT ...............22
II.4 SNP DISENROLLMENT, OVERALL AND BY MODE OF ENROLLMENT .........23
II.5 SNP ENROLLEES, AS OF MARCH 2007 ..................................................................25
II.6 SNP PLAN CHARACTERISTICS, 2006.....................................................................28
II.7 SNP PLAN CHARACTERISTICS, 2007.....................................................................30
II.8 SNP PLAN CHARACTERISTICS, 2008 (APPLICATIONS) ....................................32
II.9 PERCENT OF SNP ENROLLEES IN MEDICAID, 2006 ..........................................33
II.10 CONDITIONS TARGETED BY CHRONIC CONDITION SNPS, 2006
AND 2007 .....................................................................................................................34
II.11 SNP ENROLLMENT IN TOP 10 ORGANIZATIONS, BY TYPE ............................35
III.1 SURVEY DISPOSITION .............................................................................................38
III.2 TYPE OF ORGANIZATION AND TARGET POPULATION ...................................41
III.3 MEDICAID SERVICES ...............................................................................................42
III.4 PROVIDER ARRANGEMENTS .................................................................................43

vii
TABLES (continued)
Table Page
III.5 IDENTIFICATION OF MEMBERS WHO NEED SPECIAL SERVICES .................44
III.6 SPECIAL PLAN SERVICES OFFERED ....................................................................45
IV.1 LOCATION AND DATES OF SITE VISITS ..............................................................47
IV.2 COORDINATION WITH MEDICAID ........................................................................54
IV.3 OVERVIEW OF CARE COORDINATION AND DISEASE MANAGEMENT
AND PLAN ADAPTATIONS TO INDIVIDUAL NEEDS .........................................55
IV.4 ENROLLEES‘ ENROLLMENT EXPERIENCES AND SATISFACTION WITH
PLAN SERVICES ........................................................................................................57
V.1 SNP ACTIVITY BY STATE, 2006-2007 ....................................................................59
VI.1 DEMOGRAPHIC CHARACTERISTICS OF SNP ENROLLEES AND THEIR
ELIGIBLE NON ENROLLEE (ENE) COUNTERPARTS, 2005 ................................77
VI.2 INDICATORS OF HEALTH FOR SNP ENROLLEES AND THEIR ELIGIBLE
NON ENROLLEE (ENE) COUNTERPARTS, 2005 ...................................................78
VI.3 UTILIZATION AND EXPENDITURE FOR SNP ENROLLEES AND THEIR
ELIGIBLE NON ENROLLEE (ENE) COUNTERPARTS, 2005 ................................80
VI.4 CHARACTERISTICS OF DUAL-ELIGIBLE DEMONSTRATION SNP
ENROLLEES AND THEIR ELIGIBLE NON ENROLLEE (ENE)
COUNTERPARTS, 2005 .............................................................................................81
VI.5 CHARACTERISTICS OF INSTITUTIONAL EQUIVALENT SNP ENROLLEES
(WPP AND SHMO), 2005 ............................................................................................83
VI.6 CHARACTERISTICS OF DUAL-ELIGIBLE SNP ENROLLEES, BY PASSIVE
ENROLLMENT, AND THEIR ELIGIBLE NON ENROLLEE (ENE)
COUNTERPARTS, 2005 .............................................................................................85
VI.7 DEMOGRAPHIC CHARACTERISTICS OF SNP ENROLLEES MEETING
TARGET CRITERIA AND THEIR ELIGIBLE NON ENROLLEE (ENE)
COUNTERPARTS, 2005 .............................................................................................87

viii
TABLES (continued)
Table Page
VI.8 INDICATORS OF HEALTH FOR SNP ENROLLEES MEETING TARGET
CRITERIA AND THEIR ELIGIBLE NON ENROLLEE (ENE)
COUNTERPARTS, 2005 .............................................................................................88
VI.9 UTILIZATION AND EXPENDITURE FOR SNP ENROLLEES MEETING
TARGET CRITERIA AND THEIR ELIGIBLE NON ENROLLEE (ENE)
COUNTERPARTS, 2005 .............................................................................................90
VI.10 CHARACTERISTICS OF DUAL-ELIGIBLE DEMONSTRATION SNP ENROLLEES
MEETING TARGET CRITERIA AND THEIR ELIGIBLE NON ENROLLEE
(ENE) COUNTERPARTS, 2005 ..................................................................................91
VI.11 CHARACTERISTICS OF DUAL-ELIGIBLE SNP ENROLLEES MEETING
TARGET CRITERIA, BY PASSIVE ENROLLMENT, AND THEIR ELIGIBLE
NON ENROLLEE (ENE) COUNTERPARTS, 2005 ...................................................93
VII.1 MEAN BID-TO-BENCHMARK RATIOS FOR SNP AND MA PLANS
WITH OVERLAPPING MARKET AREAS: 2006 AND 2007 ...................................96

ix
FIGURES
Figure Page
II.1 2005-2007 SNP ENROLLMENT, BY SNP TYPE ......................................................15

x
EXECUTIVE SUMMARY
Section 231 of the Medicare Prescription Drug, Improvement, and Modernization Act of
2003 (MMA) for the first time permitted Medicare Advantage (MA) plans to target beneficiaries
in certain categories: beneficiaries residing in nursing homes, those dually eligible for Medicare
and Medicaid, and those with severe or disabling chronic conditions. The Act termed such plans
―specialized MA plans for special needs individuals‖ but they are commonly referred to as
Special Needs Plans (SNPs). Previous to this legislation, MA plans were required to enroll any
interested beneficiary residing in their service area. SNPs are intended to provide specialized
models of care to serve their targeted groups.
In addition to defining the three target populations, Section 231 granted the Secretary of
Health and Human Services (HHS) the authority to define the severe or disabling conditions that
could be served by SNPs and to approve SNPs that served disproportionate percentages of
special needs individuals as well as SNPs that served such populations exclusively. The Centers
for Medicare & Medicaid Services (CMS) subsequently introduced a number of important policy
decisions through rule making and subregulatory guidance. These decisions:
Expanded the definition of ―Institutional‖ - In the preamble to the final rules for SNPs,
CMS stated that it would consider as institutionalized ―those individuals living in the
community but requiring a level-of-care equivalent to that of those individuals in ... long
term care facilities.‖1 (This report refers to them as institutional equivalent (IE) SNPs.)
Defined a disproportionate percentage SNP - as one that enrolls a greater proportion of
the target group than occurs nationally in the Medicare population.
Permitted passive enrollment of dual-eligible beneficiaries (those enrolled in both
Medicare and Medicaid) on a one-time basis in January, 2006 - 46 dual eligible SNPs
approved for 2006 were owned by managed care organizations (MCOs) with existing
Medicaid managed care contracts. These ―dually contracted‖ MCOs were allowed to
enroll dually eligible members of their Medicaid plans into their dual eligible SNPs
effective January 1, 2006. Members were notified in advance and allowed to ―opt out‖ if
they objected.
Defined dual eligible subsets - In the call letter of April, 2007, CMS added two new sub-
types of dual eligible SNPs to the two types originally approved (all dual eligibles and
full benefit dual eligibles only): ―Zero Cost Sharing‖ dual eligibles2 and plans that target
subsets of dual eligibles that coincide with existing or proposed subsets in Medicaid
1 Federal Register Vol. 70, No. 18 pp 4588-4741
2 Zero cost sharing dual eligibles are Qualified Medicare Beneficiaries (QMBs) who are also enrolled in
Medicaid. These individuals are entitled to Medicare Part A, have income of 100 percent of the Federal poverty
level or less, and resources that do not exceed twice the limit for SSI eligibility. Most elderly and disabled Medicaid
enrollees are eligible for the QMB program, although not all apply for it. Medicaid covers their Medicare Part B
premiums as well as Part C (Medicare Advantage) premiums, cost sharing, and deductibles.

xi
managed care contracts. The intention was to facilitate the development of SNPs with
fully integrated Medicare and Medicaid managed care contracts. For this SNP sub-type,
CMS requires an applicant MCO to provide written documentation that the State supports
the proposed sub-setting methodology.
Section 231 also requires the Secretary to submit a report to Congress by December 31,
2007 that assesses the impact of specialized MA plans on the cost and quality of care provided to
special needs individuals. CMS contracted with Mathematica Policy Research, Inc. to evaluate
SNPs and to assist in the development of its report to Congress. This report fulfills that mandate.
During the period when this report was being prepared, two laws affecting SNPs were enacted,
the Medicare, Medicaid, and SCHIP Extension Act of 2007 (MMSEA) and the Medicare
Improvements for Patients and Providers Act of 2008 (MIPPA). This report does not examine
these changes to the SNP program. The study examined the program as it was in effect prior to
the enactment of this legislation.
The evaluation sought to answer the following basic questions about aspects of SNP
operations and outcomes:
How have plans proliferated, and how has enrollment grown since 2004?
What are the basic features of SNPs operating in 2006?
What specific steps did SNPs take in 2006 to improve care for their special-needs target
populations?
To what extent did States develop relationships with SNPs to better coordinate Medicaid
and Medicare services?
How did 2006 SNP members compare with other Medicare beneficiaries who were
eligible to enroll but did not?
How did the bids of SNPs compare to those of other similar MA plans?
Do SNPs appear to have the potential to improve care quality for their target populations?
What are the effects of SNPs on Medicare costs?
The evaluation relied on both primary and secondary data. It administered a mail survey of
SNPs to provide an overview of all plans operating in 2006, including their provider networks,
relations with Medicaid, and member interventions. To describe plan features and operations in
detail, it conducted site visits with selected plans and parent organizations that operated multiple
plans. To gain the member perspective on plan operations, it also conducted focus groups with
members of many of the visited plans. Interviews with State Medicaid officials gauged State
government reaction to SNPs and in particular to dual-eligible SNPs.
The evaluation also assessed plan growth, compared plan members with eligible
nonmembers, and assessed differences in bids. Data from the Health Plan Management System
Payment Files were used to describe SNP enrollment and disenrollment between January 2005

xii
and March 2007. These data were merged with beneficiary data to estimate the number of dual-
eligible beneficiaries who were passively enrolled into SNPs in 2006. The evaluation used the
2005 Medicare Beneficiary Database, the Minimum Data Set for nursing home residents, and
Hierarchical Condition Category (HCC) risk-group data to identify Medicare beneficiaries in
individual SNP market areas who appeared eligible to enroll in SNPs but did not enroll (that is,
eligible nonenrollees), in order to compare them to SNP members. The MA bid data for SNPs
were compared with those of non-SNP MA plans in overlapping market areas for 2006 and 2007
as a means of determining whether the bid-to-benchmark ratios for SNPs differed, on average,
from those associated with other similar MA plans.
The Growth of SNPs
The number of SNPs has increased rapidly since 2004, the year following passage of the
MMA, when there were 11 SNPs were in operation. By 2006, the first year in which all three
types of SNPs were offered, there were 276 plans and by 2007, 491 (see Table E.1). CMS
received over 400 applications for new SNPs or expansions of existing SNPs in 2008. About two
thirds of all SNPs are dual-eligible SNPs.
TABLE E.1
PLAN AND ENROLLMENT GROWTH, 2004-2007
All SNPs Dual Eligible Institutional Chronic Condition
Plans
Ever
Enrolled Plans
Ever
Enrolled Plans
Ever
Enrolled Plans
Ever
Enrolled
2004 11 12,774 11 12,774 0 0 0 0
2005 137 129,220 108 103,896 29 25,329 0 0
2006 276 747,430 226 626,605 37 49,200 13 87,502
2007 491 887,583 323 654,458 84 146,259 84 90,467
Source: MPR analysis of Medicare Health Plan Management System (HPMS) and HMO Payment Files.
Note: Institutional SNPs include institutional and institutional-equivalent plans. Because some beneficiaries enrolled in
more than one type of plan during a year, enrollment by type of plan will not sum to ―All SNP‖ total; 2007
enrollment is as of March 2007.
As of December 2007, the number of SNPs had decreased to 477 due to the withdrawal of some plans. Overall SNP
enrollment, however, had increased by nearly 25 percent to 1,098, 754. See
http://www.cms.hhs.gov/MCRAdvPartDEnrolData/SNP.
SNP enrollment rose dramatically in January 2006 due to passive enrollment (a one time
event), which was responsible for 212,000 new SNP enrollees. Plan redesignations (that is, the
conversion of an existing plan, such as a demonstration program, into a SNP) and plan transfers
(from a non-SNP plan to a dual eligible SNP plan within the same MCO) also contributed
substantially to the January 2006 increase but are also not likely to be repeated in the future.
Institutional SNP enrollment increased sharply in January 2007, primarily because of the
conversion of a large demonstration plan (the SCAN Social/ HMO) with roughly 90,000
members to an institutional-equivalent SNP. As of March 2007, total SNP enrollment had
reached nearly 860,000 (Table E.2); dual-eligible SNPs accounted for 74 percent of total SNP
enrollment and 66 percent of all SNPs.

xiii
Enrollment in chronic-care and institutional SNPs tended to be concentrated in plans
operated by particular large parent organizations. The chronic-care SNP offered by Medicare y
Mucho Mas of Puerto Rico accounted for over 70 percent of all enrollment in chronic-care SNPs
in 2007. In that same year, SNPs offered by two organizations – SCAN and United Healthcare –
accounted for over 80 percent of enrollment in institutional SNPs. By contrast, the largest dual-
eligible SNP in 2007 was operated by the Kaiser Foundation; it accounted for just nine percent of
enrollment in dual-eligible plans.
Disenrollment rates for SNPs, initially quite high (at 19 percent in 2005), have declined over
time and now more closely resemble those of other MA plans (at 14 percent in 2006). The
extent of disenrollment among those enrolled passively or through plan redesignations, and
among beneficiaries inadvertently enrolling in free-standing Part D drug plans (triggering
disenrollment from SNPs) could not be examined completely in time for inclusion in this study.
TABLE E.2
SELECTED PLAN FEATURES, 2007
(Percentage)
All SNPs Dual Eligible Institutional Chronic Condition
Plans Enrollees Plans Enrollees Plans Enrollees Plans Enrollees
Medicaid contract 10.0 29.1 13.6 39.0 4.8 1.4 1.2 0.8
Disproportionate percentage 19.6 26.6 20.7 18.5 10.7 76.5 23.8 5.5
For-profit 83.3 65.2 82.0 70.3 82.1 21.9 89.3 98.6
Stand-alone 24.4 26.2 18.6 26.8 20.2 28.4 51.2 18.0
Total number 491 856,571 323 632,372 84 139,845 84 84,354
Source: CMS HMO Payment Files and Health Plan Management System (HPMS) files, 2007.
Notes: Enrollees are categorized in the type of SNP in which they were enrolled during March 2007. Includes plans active in 2007.
―Stand-Alone‖ organization is defined as a plan that does not have other non-SNPs under the same contract number, or under
different contract numbers for the organization. Table does not include people who had SNP payment records for March 2007 but were identified by enrollment files as having died prior to March.
Just under 40 percent of 2007 dual-eligible SNP members were enrolled in plans with
Medicaid contracts; those plans made up 14 percent of all dual-eligible SNPs. For institutional
and chronic condition SNPs, the proportion of plans with Medicaid contracts is under 5 percent.
Enrollment in disproportionate-percentage SNPs varies from less than 6 percent of chronic
condition SNP enrollees to over 76 percent of enrollees in institutional SNPs, although the latter
percentage was heavily skewed by SCAN, an institutional equivalent, disproportionate
percentage plan that accounted for 65 percent of all institutional SNP enrollees.
The number of SNPs has increased rapidly, from 11 in 2004 to 491 in 2007. With over 400
applications to CMS from organizations wishing to expand existing SNPs or offer new SNPs for
2008, it is clear that health plans do see a potential for increased enrollment. Nevertheless, the
number of SNP plans with minimal enrollment may be worth further study and further
monitoring.
xiv
Selected SNP Features in 2006
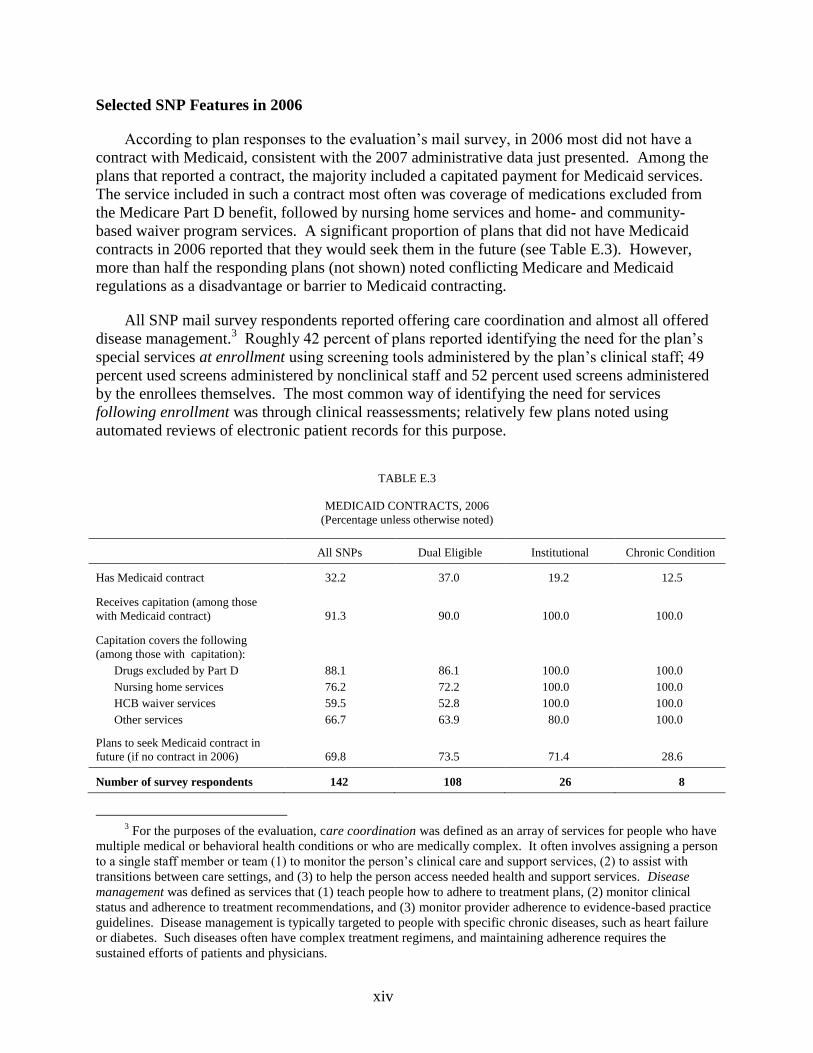
According to plan responses to the evaluation‘s mail survey, in 2006 most did not have a
contract with Medicaid, consistent with the 2007 administrative data just presented. Among the
plans that reported a contract, the majority included a capitated payment for Medicaid services.
The service included in such a contract most often was coverage of medications excluded from
the Medicare Part D benefit, followed by nursing home services and home- and community-
based waiver program services. A significant proportion of plans that did not have Medicaid
contracts in 2006 reported that they would seek them in the future (see Table E.3). However,
more than half the responding plans (not shown) noted conflicting Medicare and Medicaid
regulations as a disadvantage or barrier to Medicaid contracting.
All SNP mail survey respondents reported offering care coordination and almost all offered
disease management.3 Roughly 42 percent of plans reported identifying the need for the plan‘s
special services at enrollment using screening tools administered by the plan‘s clinical staff; 49
percent used screens administered by nonclinical staff and 52 percent used screens administered
by the enrollees themselves. The most common way of identifying the need for services
following enrollment was through clinical reassessments; relatively few plans noted using
automated reviews of electronic patient records for this purpose.
TABLE E.3
MEDICAID CONTRACTS, 2006
(Percentage unless otherwise noted)
All SNPs Dual Eligible Institutional Chronic Condition
Has Medicaid contract 32.2 37.0 19.2 12.5
Receives capitation (among those
with Medicaid contract) 91.3 90.0 100.0 100.0
Capitation covers the following
(among those with capitation):
Drugs excluded by Part D 88.1 86.1 100.0 100.0
Nursing home services 76.2 72.2 100.0 100.0
HCB waiver services 59.5 52.8 100.0 100.0
Other services 66.7 63.9 80.0 100.0
Plans to seek Medicaid contract in
future (if no contract in 2006) 69.8 73.5 71.4 28.6
Number of survey respondents 142 108 26 8
3 For the purposes of the evaluation, care coordination was defined as an array of services for people who have
multiple medical or behavioral health conditions or who are medically complex. It often involves assigning a person
to a single staff member or team (1) to monitor the person‘s clinical care and support services, (2) to assist with
transitions between care settings, and (3) to help the person access needed health and support services. Disease
management was defined as services that (1) teach people how to adhere to treatment plans, (2) monitor clinical
status and adherence to treatment recommendations, and (3) monitor provider adherence to evidence-based practice
guidelines. Disease management is typically targeted to people with specific chronic diseases, such as heart failure
or diabetes. Such diseases often have complex treatment regimens, and maintaining adherence requires the
sustained efforts of patients and physicians.

xv
Source: Evaluation mail survey conducted between March and May 2007
Note: HCB = home and community based; ―Other services‖ includes behavioral health care and other services that
supplement Medicare
Plans reported the majority of institutional and chronic condition SNP enrollees (79 and 88
percent, respectively) received disease management in 2006, as compared with just 32 percent of
dual-eligible SNP enrollees. Roughly similar percentages of institutional and chronic condition
plan enrollees received care coordination, while 43 percent of dual-eligible plan enrollees did so.
Other special services provided by SNPs included transportation to medical appointments, pain
management services, and wound care. Relatively few plans offered special services for
enrollees with dementia.
SNP Interventions in 2006
The evaluator conducted site visits to 10 individual SNPs and 4 parent organizations that
operated multiple but similar plans. The evaluation also conducted focus groups of enrollees at
the 10 individual plans to gauge their satisfaction with the enrollment process and plan services.
While not a random sample of all plans operating in 2006, they represented a geographically
diverse group serving the three SNP target populations and having substantial membership. Site
visits focused on three broad areas to determine what made plans ―special‖: level of integration
with Medicaid, adaptation of services to individual needs, and provision of special services.
Integration with Medicaid. An arrangement with state Medicaid programs that renders
SNPs in some way responsible for the cost or coordination of Medicaid services for their
enrollees could benefit all plans that serve dual-eligible beneficiaries, but especially the dual-
eligible SNPs. For example, a capitated contract for all Medicaid services would eliminate
incentives to make care decisions based on payer and might give plans more leverage over
providers, thus improving enrollee access to Medicaid-covered services.
Few visited plans had capitated contracts with Medicaid programs that included all (or
almost all) Medicaid-covered services. Only two plans did; both were in Arizona, a state with a
long history of managed long-term care. A third plan, whose sponsor was the County Organized
Health System administering Medicaid for its SNP‘s service area, had a Medicaid contract that
included most services but excluded institutional and some types of community based long-term
care. Three other plans had capitated contracts for wraparound services only.
Nevertheless, staff from several plans with Medicaid contracts noted the importance of
having information about services received in both the Medicare and the Medicaid programs and
of having the ability to intervene effectively, when the need arose, with both Medicare and
Medicaid providers. In addition, concentrating enrollees with special needs into a single plan
seemed to cause staff to focus on the depth of those needs more than when such enrollees were a
minority in regular plans.
Adaptation to Individual Needs. All the visited SNPs adapted their services to at least some
degree in recognition of the fact that, collectively, beneficiaries in all three target groups are
more likely to have limited literacy, poor English proficiency, needs for basic services (such as
food and housing), complex medical problems, cognitive limitations, or behavioral health

xvi
problems. Having trained staff and clear procedures to address these problems allows enrollees
and their health care providers to focus on improving health. Most commonly the visited plans
employed social workers or behavioral health professionals to assist nurses with enrollees who
had complex psychosocial problems or mental health disorders. Further, most plans either had
staff who were bilingual or had their written materials translated into the languages commonly
spoken by their enrollees. It was not possible to say whether these efforts went beyond those
typical of regular MA plans.
Provision of Special Services. All the visited plans offered care coordination and disease
management; most offered it only to enrollees determined to be ―high risk.‖ Staff at some plans
estimated that 5 to 10 percent of enrollees received care coordination at any given time. Among
plans that viewed disease management as a discrete intervention (rather than an educational
component of care coordination), staff reported that between 15 and 35 percent of enrollees used
the service. However, all enrollees of the two visited chronic-condition SNPs were considered to
need disease management, at least for their target conditions.
It is unclear whether many of the visited plans could improve enrollee health substantially,
as they were operating at the time of the visits. The literature suggests that success requires
having highly trained staff and actively involved providers, as well as a structured intervention
that can be adapted to individual patient needs (see for example, Chen et al. 2000). Recent
evaluations of CMS‘s fee-for-service care coordination demonstrations suggest that in-person
contact with enrollees may also contribute to success (Brown et al. 2007).
All the visited plans had some of the features recommended by the literature. They had
nurses providing these services, and most required that they be registered nurses or have
some experience in community nursing. Further, all the plans conducted comprehensive
assessments and from them derived care plans.
Most of the visited plans lacked many of the recommended features, however. Few of
these plans integrated physicians into the delivery of their special services, and few took
a structured approach to enrollee education but relied instead on nurse-judgment-driven
approaches. Few had the ability to contact enrollees in person, and few had software
systems that supported special service delivery or could generate quality-monitoring
reports. Among these plans, staff reported that care coordination and disease
management were very similar to services already provided in their sponsors‘ Medicare
or Medicaid managed care plans.
On the other hand, several visited plans might have greater potential to improve enrollee
health. These plans based their special SNP services on previous experience either
operating demonstration programs or as commercial chronic disease management
providers. All had relatively structured self-care education and regular monitoring by
nurses and other professionals with a frequency at least at a pre-set minimum. Some of
these plans had the ability to contact enrollees in person. All had also developed
sophisticated software to guide staff in consistently providing care coordination and
disease management services, to warehouse data on enrollees using those services, and to
produce monitoring reports from those data upon which to make decisions on refining
intervention features as necessary.

xvii
Finally, most focus group participants from most plans were satisfied overall with the
services. However, for only two plans (one dual-eligible plan and one chronic-care plan) did
most members believe their care was better under the SNP than previously. Members of the
dual-eligible plan particularly liked the SNP because it lacked the stigma they had felt as
members of a Medicaid plan (even though it was operated by the same sponsor as the SNP).
They also liked the plan‘s pharmacy benefit and disease management services. Members of the
chronic condition plan liked the calls from nurses.
In summary, the year 2006, the first year of operations for most of the visited plans,
presented SNP staff with complications related to the start of the Medicare Part D benefit and the
competitive bidding process, and to CMS‘s new enrollment database, MARX. During 2006,
some of the visited plans were focused on resolving various enrollment problems, and others
were just starting to realize they needed to refine their special services by making them more
structured (for example, by adopting forms and protocols rather than relying primarily on
individual nurse judgment) or more intense (for example, by being longer-term rather than
episodic, or by giving staff smaller enrollee caseloads). It is thus too early to tell whether the
SNPs will ultimately improve beneficiary health beyond what might be expected in a regular MA
plan.
Medicaid Staff Views on SNPs
In early 2007, evaluation staff interviewed Medicaid staff in 14 States about their interest in
contracting with SNPs. In some States, Medicaid directors saw SNPs as an opportunity to
integrate Medicare and Medicaid services and thereby improve the quality and cost-effectiveness
of care or to reduce the incentives for cost shifting between the programs. In general, however,
States with such views are those that already have Medicaid managed care programs that include
long-term care services, or plan to develop such programs in the near future. In States that used
managed care contracts only for acute care services, Medicaid directors tended to view
contracting with SNPs as of limited value because enrollees in SNPs are Medicare eligible and
their acute care needs are thus covered by Medicare. The directors reported that they saw few
advantages to contracting with SNPs because of the limited scope of the Medicaid services that
would be covered.
Medicaid directors and their staffs cited several factors that may account for States‘ lack of
interest in managed long-term care. First, providers, advocacy groups, and even unions have, at
times, opposed managed care, (or, at least, managed care for long-term care services) and have
attempted to prevent its introduction. Second, it can be costly, in terms of time and resources,
for States to develop capitated rates and negotiate contracts with managed care organizations. In
States with relatively small Medicaid populations, it may not be cost effective to do so. Finally,
States may not be convinced that integrating Medicare and Medicaid services for their dual
eligible populations would produce sufficient benefits to the State to justify the resources needed
to accomplish this goal.

xviii
SNP Enrollees Compared with Eligible Nonenrollees
SNP enrollees were consistently healthier than the eligible but not enrolled population,
based on 2006 risk scores.4 This was the case even when comparisons were restricted to those
strictly eligible for plans‘ target groups.5 It was not possible to determine whether this difference
was due to plan marketing practices or to a tendency on the part of less healthy individuals to
avoid managed care. Because the HCC system pays plans more accurately than did the former
system, which adjusted capitation payments only on the basis of demographic characteristics, the
apparent difference in health status should not result in over or underpayment. It is too early at
this point to determine whether or not enrollees are more likely to disenroll from SNPs when
their health declines. As data become available, CMS will be able to compare disenrollment
rates of beneficiaries by level of health risk as measured by HCC scores.
SNP Bids
The ratio of SNP bids to their benchmark amount are about the same, on average, as the
ratio of bid-to-benchmark amount for MA plans that resemble SNPs and whose market areas
overlap with those of SNPs. Since required benefit packages, payment rates, and risk adjustment
for SNPs are identical to those of other MA plans, this result is to be expected. With only two
years of bids available for analysis and the somewhat uncertain relationship between bids and
actual financial performance, it is clearly too early to reach any conclusions about whether SNP
bids will ultimately be higher or lower than those at non-SNP plans.
Conclusions
Despite limitations imposed by data availability, the material contained in this report
provides important information about the variety of new models of care that SNPs are
developing, the populations they are serving along with some preliminary indications of what
they are accomplishing. Note that the study includes the time period prior to further legislative
changes made to the SNP program as were enacted by MMSEA and MIPPA.
The opportunity that SNPs provide for specializing in care of particular groups of
Medicare beneficiaries has proven to be attractive to industry. Organizations wishing to
offer new SNPs or expand existing SNPs submitted over 400 applications to CMS for 2008. If all
applications were approved, there would be 815 SNPs in 2008—nearly triple the number
4 The comparisons between SNP enrollees and eligible non-enrollees have some limitations, particularly for
chronic condition and institutional equivalent plans. First, diagnoses drawn from Hierarchical Condition Category
(HCC) data may not always replicate the specific groups targeted by chronic condition SNPs. Second, the HCC data
themselves were not available to the evaluation for beneficiaries entering SNPs in 2006. Thus, our approach will
fail to identify beneficiaries who were first diagnosed with a target condition in 2006. Third, it was not possible to
identify beneficiaries in traditional Medicare who were nursing-home certifiable using CMS administrative data.
This precluded construction of a comparison group for institutional-equivalent SNPs.
5 As noted, SNPs are not required to limit enrollment exclusively to their target group. Disproportionate
percentage SNPs can include a substantial percentage of non-target group members.
xix
operating in 2006. The number of chronic-condition SNPs has grown especially rapidly, from 13
in 2006 to 84 in 2007, with 264 applications for new and existing plans submitted for 2008.
Despite this rapid growth in the number of SNPs, a substantial proportion—about 30 percent in
2007—had fewer than 50 enrollees, suggesting that some plans are unlikely to be sustainable
over a longer term.
While SNP enrollment grew rapidly from 2005 to 2007, their ultimate appeal to
Medicare beneficiaries is not yet clear. Enrollment in dual-eligible SNPs grew substantially in
2006 due in part to the one-time passive enrollment policy implemented by CMS and the
redesignation of some MA contractors to SNP status. Growth continued more slowly between
2006 and 2007. Enrollment in institutional SNPs increased more rapidly during that time period,
but this was due, in large part, to the conversion of a large demonstration plan to SNP
institutional-equivalent status. While passive enrollment and plan redesignation accounted for a
substantial share of SNP enrollment, at least 45 percent of beneficiaries ever enrolled in a SNP
between 2004 and 2006 (353,000 out of 774,000) made an active choice to do so, either by
leaving fee-for-service Medicare to enroll in a SNP or by leaving an MA plan to enroll in a SNP
operated by a different parent organization. Rates of disenrollment from SNPs have declined
over time and resemble rates of disenrollment from other MA plans.
Still it is impossible to tell what the long-term enrollment in SNPs is likely to be. If about
half of those who enrolled in SNPs made an active decision to do so, then about half did not.
Some events that contributed significantly to enrollment trends in 2006 and 2007, such as
passive enrollment and the conversion of demonstration plans to SNP status, were one-time
occurrences, while others, such as plan redesignations and transfers within MCO‘s will play a
diminishing role in the future. As current enrollees leave SNPs due to death, loss of eligibility,
or disenrollment, total enrollment in SNPs will be maintained only if an equal number are
attracted to actively enroll in SNPs. This in turn will require that SNPs convince prospective
enrollees of the value of the special services and interventions they offer.
Integration of Medicare and Medicaid services through SNPs may require several
years to achieve in many States. With the exception of demonstration SNPs, few dual-eligible
SNPs have entered into risk-based contracts with States for coverage of full Medicaid services.
In some States with experience and current interest in promoting managed Medicaid long-term
care, the barriers to Medicare/Medicaid integration may consist primarily of conflicts between
State and Federal policy or other procedural problems. But in a majority of States, Medicaid
officials appear to feel that other competing issues are more pressing at this point than
developing and contracting for integrated approaches to Medicaid long-term care. Some State
officials and staff noted that there were suspicions of large for-profit managed care organizations
in their States, and concerns that managed care would be disruptive to providers in their State.
Managed care organizations, for their part, indicated some reluctance to engage in long-term
negotiations and discussions with Medicaid agencies that do not appear to be receptive, and also
expressed concerns about shifting State requirements and priorities.
Staff members from several of the plans visited for the evaluation pointed out that joint
contracting provides information that permits more effective coordination of care and helps them
intervene more effectively when the need arises. Perhaps for this reason, 70 percent of health
plans responding to the survey of SNPs in this study indicated an interest in pursuing Medicaid
contract arrangements. In the States without a defined interest in SNPs, the process of
xx
contracting with SNPs to provide full Medicaid coverage might require several years of ongoing
contact between a SNP, CMS, and a State Medicaid agency, as it did in Massachusetts,
Minnesota, and Wisconsin.
In 2007, 18 States had entered into Medicaid contracts with one or more SNPs. Of these,
eight included some form of long-term care benefit. Because incentives to contract with SNPs
appear limited for States that do not include long-term care services in their Medicaid managed-
care contracts, we will need to improve our understanding of State attitudes and decision-making
regarding managed long-term care. Without better information on this issue, it will be difficult
to understand or anticipate the prospects for growth in the number of dually contracted SNPs.
It is too early to tell whether SNPs improve care and thus outcomes for their members. As noted above, SNPs are so new that quality measures derived from CAHPS, HEDIS, and HOS
are not yet available. That said, visits to SNPs turned up promising indications. SNP staff at most
of the visited sites displayed a strong sense of mission and a keen desire to do whatever is
necessary to address member‘s health problems and concerns. In survey responses, all SNPs
reported providing care-coordination and disease-management services. However, these terms
can be used to describe a wide range of practices with varying degrees of intensity. It was
beyond the scope of the evaluation to examine individual plan practices in a way that would
allow a detailed analysis of the manner in which plans were implementing these programs.
At the same time, some evidence indicates that SNP enrollees may have somewhat lower
care needs than comparable beneficiaries who did not enroll in SNPs. Whether this pattern stems
primarily from a reluctance of beneficiaries with the most severe health problems to enroll in
managed care plans or whether this is a result of specific SNP marketing strategies is difficult to
ascertain. In any case, the introduction of HCC risk adjusted payments has substantially
reduced the likelihood that plans enjoying favorable selection will be overpaid. HCC risk
adjustment, takes diagnostic information into account and consequently does a much better job
of matching payments to medical complexity and cost than the previous payment system that
relied only on demographic information to predict expenditures.
There is no evidence at this point that Medicare payments to SNPs differ from
payments to other MA plans. Because SNPs are paid in the same way as all MA plans, they
will impose the same costs on the Medicare program unless (1) their enrollees are more or less
likely, on average, to transition to higher-paying HCCs than are similar beneficiaries enrolled in
MA plans, or (2) their bids are systematically lower than those of other MA plans. Assessment of
SNP and MA bids indicated that the ratios of plan bids to local benchmarks were nearly identical
for SNPs and MA plans with overlapping market areas. There is no reason at this point to
suggest that result will change in future years. A potential avenue for cost reduction through
SNPs is the prospect that improved care might retard the progression of chronic illness,
benefiting SNP enrollees and lowering cost to Medicare by slowing the growth of capitation
payments. It is still too early to examine this possibility because HCC scores reflecting
beneficiary health conditions in 2006 were not available in time for this analysis.

1
I. BACKGROUND AND OVERVIEW OF THE EVALUATION
A. LEGISLATIVE AND POLICY BACKGROUND
1. Legislative Mandate
Section 231 of the Medicare Prescription Drug, Improvement, and Modernization Act of
2003 (MMA) for the first time permitted Medicare Advantage (MA) plans to target beneficiaries
in certain categories: institutionalized beneficiaries, those enrolled in both Medicare and
Medicaid (dual eligibles), and those with severe or disabling chronic conditions6. The Act termed
such plans ―specialized MA plans for special needs individuals‖ but they are commonly referred
to as Special Needs Plans (SNPs). SNPs are intended to provide specialized models of care to
serve their targeted groups.
In addition to defining the three special needs populations noted above, Section 231
contained the following provisions:
authorized the Secretary of Health and Human Services (HHS) to define the severe or
disabling chronic conditions that could be served by SNPs
authorized ―disproportionate percentage SNPs‖ that would not be required to limit
enrollment exclusively to beneficiaries with special needs
required CMS to submit to Congress, no later than December 31, 2007, a report on the
impact of SNPs on the cost and quality of services provided to enrollees
included a ―sunset‖ provision that terminated, as of December 31, 2008, the authority
for SNPs to limit enrollment to special needs groups
The major effect of the law was to allow MA plans, for the first time (aside from certain
demonstrations), to restrict enrollment to specific sub-groups of Medicare beneficiaries with
special needs. Aside from this change in enrollment policy, the law does not exempt SNPs from
any of the requirements for existing MA plans nor does it provide for any special payment
arrangements. SNPs participate in competitive bidding and must meet the same standards for
provider networks, member rights, solvency and marketing and enrollment practices as any other
MA plan. CMS also requires all SNPs to offer a Part D plan. Section 231 does not define the
kinds of special programs or services to be provided by SNPs nor does the associated conference
report. The conference report does suggest that SNPs could offer ―targeted geriatric approaches
and innovations in chronic illness care‖ and cites the Evercare and the Wisconsin Partnership
Program demonstrations as examples of ―specialized Medicare Advantage plans ...... that
exclusively serve special needs beneficiaries.‖ While it included dual eligible beneficiaries as a
special needs group, the legislation did not require dual eligible SNPs to enter into contracts with
Medicaid programs. SNPs represent a significant new Medicare Advantage (MA) option that is
available under program—not demonstration—authority for millions of Medicare beneficiaries.
6 The full text of Section 231 is in Appendix I; the Conference Agreement is in Appendix II.

2
The projected growth in the number of Medicare beneficiaries for the next five to ten years
underlines the need for the development of new and more effective treatment options for people
with severe and chronic illnesses.
This chapter describes the evolution and implementation of SNP policies by CMS. It then
gives a brief history of numerous demonstrations that pioneered the development of special
programs for special needs groups. (In many ways, these programs can be legitimately viewed
as early prototypes for SNPs and, as already noted, two of them were explicitly cited in the
MMA conference report as examples of existing programs serving special needs populations.)
The chapter concludes with a brief overview of the evaluation design. With a due date of
December 31, 2007, a full evaluation of the impact of SNP plans on the quality and cost of care
provided to special needs populations was not feasible since the data required for such an
evaluation were not available in time for inclusion in this report. Most of the information
gathered for the report is descriptive in nature and is intended to provide early indications and
impressions. The descriptive information is supplemented by analyses of the data that were
available, at the time the study was conducted, from CMS enrollment and payment files and
from bids submitted by SNPs and comparison plans.
2. Evolution of CMS Policies
Perhaps the most important policy change that enabled the implementation of SNPs was the
introduction of the Hierarchical Condition Category (HCC) risk adjusted payment model in
2004. The implementation of this new payment model was unrelated to the introduction of SNPs,
but without the resulting increased accuracy of payments, it would not have been possible for
SNPs to target special populations. The previous payment system, based only on demographic
factors, underpaid plans that disproportionately enrolled more medically complex beneficiaries.
The HCC model, which uses diagnostic as well as demographic information, generates more
accurate payments for both frail and healthy beneficiaries and thus makes it possible for plans to
target the former without the adverse financial impact that would have resulted under the
previous payment system.
Additional policy changes pertaining directly to SNPs are summarized in Table I.1. Note
that the content of this report does not pertain to the legislative changes to the SNP program as
were enacted in the MMSEA and MIPPA. These changes, however, are included in the table.

3
TABLE I.1
POLICY CHANGES CENTRAL TO THE EVOLUTION OF SNPS
CMS call letter issued June 22, 2004
- Invited interested plans to submit applications for SNPs serving dual-eligible and institutionalized beneficiaries for contract year 2005.
- Did not solicit applications for chronic-condition SNPs, but promised guidance about these types of plans through later rulemaking.
CMS Medicare Advantage Program regulation: Preamble to Final Rule January 28, 2005 (Federal Register, vol. 70, no. 18)a
- Stated that for contract year 2006, CMS would consider proposals for chronic-condition SNPs on a case-by-case basis; ―[b]ecause this is a
new ‗untested‘ type of MA plan, we are not setting forth in regulation a detailed definition of severe and disabling chronic condition that
might limit plan flexibility.‖ (p. 4596)
- Stated that ―those individuals living in the community but requiring a level of care equivalent to that of individuals in . . . long-term care
facilities‖ would be considered institutionalized. (p. 4596)
- defined a disproportionate percentage SNP as ―one that enrolls a greater proportion of the target group of special needs individuals than
occurs nationally in the Medicare population based on data acceptable to CMS.‖ (p. 4595)
CMS call letter issued April 15, 2005
- CMS announced that, subject to prior CMS approval, Managed Care Organizations (MCOs) with Medicaid managed care contracts would
be allowed to passively enroll members of their Medicaid plan into their Medicare dual eligible SNP. To passively enroll dual eligibles,
plans were required to submit proposals to CMS stipulating that they would not charge premiums for Medicare Part A and Part B services and would retain qualified Medicaid providers in their networks. Plans were also required to send a CMS-approved letter to members,
notifying them that they would be enrolled in the SNP on January 1, 2006 unless they notified the plan that they did not wish to be so
enrolled.
CMS call letter issued April 19, 2007, announced new subsets for dual-eligible plans
- Prior to 2008, CMS allowed SNPs to limit enrollment to all dual eligibles or just to dual eligibles with full Medicaid benefits. For contract
year 2008, four dual-eligible SNP subsets would be permitted: (1) All dual eligibles (those with comprehensive Medicaid benefits as well as
those with more limited cost sharing such as QMBs, SLMBs, and QIs); (2) Full dual eligibles (those with comprehensive Medicaid benefits); (3) Zero Cost Sharing dual eligibles (QMB-only or QMB with comprehensive Medicaid benefits) and (4) Medicaid subsets - subsets of dual
eligibles that coincide with existing or proposed subsets in Medicaid managed care contracts. For this SNP sub-type, CMS requires an applicant MCO to provide written documentation that the State approves the proposed sub-setting methodology.
Increased Specification of Models of Care
- The application for contract year 2008 required SNPs to provide a much more detailed description of their models of care. The model of care
must be specific enough to clearly identify what process and outcome measures could be used by a SNP to determine if the structures and processes of care were having the intended effect on the target population. Protocols must be specific enough to define the circumstances or
conditions under which specific actions should be taken. The model of care must describe the types of clinicians who would be involved, the
types of clinical expertise that would be required, how clinical care would be organized and delivered, and the special benefits and services that would be provided to meet the special needs of members.
- The 2008 application also added the requirement that an institutional SNP must have written contracts with every nursing facility in which it
operates. The contracts must describe in detail the nature of the relationship between the SNP and the nursing facility, delineating the
responsibilities of each party and describing how they will coordinate patient care activities.
Quality Measurement Initiatives
- CMS collaborated with the National Committee for Quality Assurance (NCQA) and the Geriatric Measurement Advisory Panel (GMAP) to
select evaluation measures that were SNP-specific. The proposed measures were posted for public comment by NCQA on December 12,
2007. In 2008, NCQA will begin a three-year strategy to collect and analyze these evaluation measures. In the first year, NCQA will collect 13 HEDIS measures and 13 structure/process measures (existing NCQA accreditation measures) from every SNP at the plan level. HOS and
CAHPS will collect 2008 survey data at the contract level for SNPs. In year two, NCQA will expand the number of HEDIS and
structure/process measures to include measures that focus on the care for older adults. Benchmark measures will be tested as well and CAHPS and HOS will be collected by each SNP. If the SNP legislation is extended beyond its projected December 31, 2009 sunset, NCQA
may expand the HEDIS measures to include access/availability of care, service utilization, and cost of care in year three.
Extension of SNP Authority
- On December 29, 2007, the President signed into law the Medicare, Medicaid, and SCHIP Extension Act of 2007 [42 U.S.C. 1395w-21(b)(1)
and (2) of the Social Security Act]. Section 108 of the statute extended the SNP enrollment authority to December 31, 2009. The statute
precludes the designation of MA plans as SNPs after January 1, 2008. In addition, the statute restricts SNP enrollment to existing SNP service areas which were open for enrollment on January 1, 2008.
- On July 15, 2008, the Medicare Improvements for Patients and Providers Act of 2008 (PL 110-275) was enacted. Section 164, for which CMS is developing guidance, include the following changes to SNPs:
Extending the SNP program through December 31, 2010.
For CY 2010, a new moratorium precludes CMS from approving other plans as SNPs.
New requirements were added for institutional, dual eligible and disabling or chronic condition SNPs. In 2010, all new
enrollees must meet the definition and requirements as ―institutionalized‖ or ―institutional equivalent‖; as ―dual eligible‖; or must meet the definition and requirements for the ―chronic condition.‖

4
Table I.1 (continued)
All new and existing SNPs must meet care management requirements in 2010.
SNPs shall provide for the collection, analysis, and reporting of data that permits the measurement of health outcomes and other indices of quality with respect to the model of care for each SNP type in 2010.
All new dual-eligible SNPs must have a State contract that provides or arranges for benefits under Title XIX in 2010. During 2010, existing 2009 dual-eligible SNPs without Medicaid contracts will not be allowed to expand their service area.
States are not required to enter into a contract with the MA organization.
CMS was tasked to convene a panel of clinical advisors to determine the chronic conditions that meet the definition of severe or disabling
chronic condition. It will also provide staff and resources that can address coordination of the State and Federal programs with respect to
dual-eligible SNPs for State inquiries.
aSubsequent instructions and guidance were provided to potential MA applicants through the annual MA application process, through materials
disseminated via CMS‘s Health Plan Management System, and through conferences with health plans and interested outside organizations. In the
application cycles for contract years 2005 through 2008, CMS provided much of its guidance through annual ―call letters‖ and advance notices of change in payment policies.
bQMB - Qualified Medicare Beneficiary; SLMB - Specified Low-Income Medicare Beneficiaries; QI - Qualified Individuals.
B. FINDINGS FROM CMS DEMONSTRATIONS SERVING SPECIAL
POPULATIONS
Underpinning the creation of SNPs is the idea that concentrating certain groups into a
managed care arrangement leads to benefits, including better health outcomes, more efficient
care delivery, and reduced acute-care use. The specific mechanisms that bring about these
benefits may vary across types of SNP. For each of these interventions, however, there are
evaluations of CMS demonstration projects that provide relevant findings. Results of these
evaluations are discussed in the following three sections.
1. Dual-Eligible Demonstrations
Dual eligibles require more health care services, on average, than do other Medicare
beneficiaries. They are more likely to have chronic illnesses, are more likely to be disabled, and
are more likely to be hospitalized. The wide variety of health problems and the frequency with
which these problems may be accompanied by non-medical issues such as inadequate caregiver
support, substandard housing, and language barriers make it difficult to design effective
interventions, particularly if the interventions are limited to Medicare-covered services. Even
joint provision of Medicare and Medicaid services under managed care contracts may be of
limited value unless the Medicaid services include long-term care services such as nursing-home
care, personal care, and other community supportive services.
CMS has supported three demonstration programs that provide Medicare and Medicaid
services to dual eligibles under joint capitation arrangements—two in Minnesota and one in
Massachusetts7. The Minnesota Senior Health Options (MSHO) and Minnesota Disability Health
Options (MnDHO) provide acute and community based8 long-term care services to elderly and
7 While the Wisconsin Partnership Program demonstration is usually included in the category of dual eligible
demonstrations, we discuss it in the section on nursing home demonstrations because it limits enrollment to
beneficiaries requiring a nursing home level of care. WPP plans were originally approved as institutional SNPs
although they were recently reclassified as dual eligible SNPs with institutional equivalent subsets.
8 Plans are at risk for the first 180 days of nursing home care only.

5
disabled dual eligibles in the State. MSHO began operation in 1997, MnDHO in 1999. All
members in both programs are assigned a coordinator at the time of their enrollment. The
coordinator ensures that each member has an ongoing source of primary care and manages
primary, acute, and long-term care services across all settings. To facilitate early intervention and
management of chronic conditions and manage access to community-based services, all
members are assessed within 30 days of enrollment.
An evaluation of the two Minnesota programs was performed by Kane and Homyak (2003).
For many of the outcome measures examined, there was no significant difference between
MHSO or MnDHO and a fee-for-service comparison group. They did find, however, that
preventable emergency-department admissions were significantly reduced among MSHO and
MnDHO members and that hospital length of stay was reduced.
The Massachusetts Senior Care Options (SCO) Dual Eligible Demonstration began
operation in 2004. SCO plans deliver care through a geriatric model, financed by the pooling of
Medicare and Medicaid revenues at the plan level. Like plans in the Wisconsin Partnership
Program demonstration (WPP), SCO plans use care teams rather than a single coordinator to
develop care plans and manage member care across settings. Unlike the Wisconsin and
Minnesota demonstrations, SCO plans provide care only to aged dual eligibles. The SCO
program has not been subject to an evaluation of its cost effectiveness and quality as were the
Wisconsin and Minnesota demonstrations, but it incorporates many of their features. All three
demonstrations are described in detail in a recent report by Leutz et al (2007).
2. Nursing Home Demonstrations
Institutional SNPs may serve two distinct categories of beneficiary: long-term nursing-home
residents and community residents who are certified by their State as requiring a nursing-home
level of care. A common complaint about nursing homes is that operators have little incentive to
provide skilled monitoring and preventive care for residents. Therefore even minor medical
problems can lead to emergency-room visits and perhaps inpatient admissions. An institutional
SNP that is at risk for acute care services can place its own nurses or nurse practitioners in
nursing homes to help prevent exacerbations of mild conditions and thereby reduce the rate of
hospitalizations.
The Evercare demonstration, which served nursing home residents exclusively, was an early
prototype for institutional SNPs. Evercare plans placed nurse practitioners in nursing homes to
monitor residents and to communicate directly with hospital staff if residents required
hospitalization. An evaluation found dramatic reductions in use of acute care by Evercare
members, with no adverse effects on care quality, relative to comparison groups of nursing home
residents not receiving the intervention (Kane and Keckhafer 2002).
Institutional SNPs may also target beneficiaries who live in the community but are certified
by their State as requiring a nursing-home level of care (we refer to these as institutional
equivalent SNPs). Two demonstrations have targeted such beneficiaries with interventions that
fully integrate Medicare and Medicaid services: (1) the Program for All-Inclusive Care of the

6
Elderly (PACE), and (2) the Wisconsin Partnership Program (WPP)9. Both provide integrated
medical, restorative, and long-term care funded by pooled Medicare and Medicaid capitation
payments. Both use interdisciplinary care teams of physicians, nurses, and social workers to
oversee patient care, though PACE teams also have additional disciplines such as therapists,
home care coordinators and dieticians. The two programs differ primarily in their locus of care.
Most PACE care is provided at centers that typically house both a day program and a health
clinic with primary care physicians, nurses, and rehabilitative staff present. In contrast to PACE,
the WPP plans provide most healthcare services through contracted providers and, with certain
exceptions10
, do not operate day programs or primary care centers. A WPP nurse practitioner
serves as team leader and is responsible for maintaining communication with each member‘s
primary care physician and obtaining his or her input into the treatment planning process.
An early evaluation of PACE found the program to be associated with reduced likelihood of
hospital admission and reduced number of nursing home days relative to a comparison group of
beneficiaries who expressed interest in PACE but did not enroll (Chatterji et al. 1998). However,
a later evaluation found that the combined Medicare and Medicaid capitation payments were
somewhat higher than they would have been in the absence of PACE (again comparing PACE
participants to those interested in the program but not participating) (White et al. 2000).
However, evaluation data permitted cost projections only for a single year following PACE
enrollment.
An evaluation of the WPP (Kane and Homyak 2004) found relatively modest differences
among the WPP program and three comparison groups: (1) participants in the State‘s Medicaid
home- and community-based waiver program who resided in a WPP county; (2) participants in
the waiver program who did not reside in a WPP county; and (3) participants in PACE who
resided in a WPP county. WPP participants had somewhat fewer preventable hospital
admissions than the second comparison group and fewer emergency-room visits than either the
first or second comparison groups. There was also a modest trend suggesting lower mortality for
WPP enrollees with disabilities compared to similar non-enrolled beneficiaries in the two waiver
participant comparison groups. PACE participants had slightly lower rates of hospitalization but
did not differ from WPP participants in the overall number of hospital days per member year.
The evaluation was limited to the first three years of the demonstration. Two of the plans were
evolved from Centers for Independent Living and had no prior experience as healthcare
providers or as MCOs so that only a minority of the enrollees in these plans were exposed to
fully developed programs for more than a year. In contrast, both the PACE and waiver programs
had been in operation for many years at the time of the study.
9 PACE, which began as a Medicare demonstration in 1990, became a permanent part of the Medicare program
under the BBA and thus had no need to seek approval as a SNP. The WPP plans have operated under demonstration
authority, which will end December, 31, 2007. However, they, along with other demonstration programs, are
transitioning from demonstration to regular program status as SNPs. (This is discussed more fully in Section C.)
10 The exceptions are two organizations, one that operates its WPP plan side-by-side with its PACE plan, and a
second that was previously a PACE plan. The former provides access to PACE facilities and services for some of its
WPP members and the latter continues to provide day program services for some of its WPP members in space
previously used for this purpose by its PACE program.

7
The Social Health Maintenance Organization (S/HMO) demonstration plans - ElderPlan and
Senior Care Action Network (SCAN) - also served institutional-equivalent beneficiaries,
although they comprised a relatively small portion of their total membership. S/HMO plans
received a supplement to the regular Medicare capitation payment to provide care coordination
and expanded community long-term care services. The plans were at risk for acute care benefits
but not for institutional care. Evaluations of the S/HMO plans by Newcomer et al. (1995) and
Wooldridge et al. (2001) found no consistent evidence, as of 2000, that they improved
beneficiary outcomes. The S/HMOs have continued to evolve since these evaluations were
completed, however. In 2005, ElderPlan initiated a virtual team-based approach to support its
members, using proprietary software to aid prevention of adverse events. Both SCAN and
ElderPlan were rated among U.S. News‘s Best Health Plans of 2006.
3. Chronic-Condition Demonstrations
Chronic-condition SNPs are meant to provide the type of disease management interventions
that have recently become popular in commercial managed care plans and some Medicaid
programs. Plans that enroll a sufficient number of members with a specified illness or condition
can thereby invest in targeted interventions designed to provide a point of contact for members in
order to provide information about worrisome symptoms, educate members about their illness,
attempt to change some behaviors, such as smoking, diet, and exercise, and improve their ability
to manage certain aspects of their condition. Moreover, by relying on explicit disease-
management protocols for treating chronic conditions, together with systematic monitoring and
contact with members, plans can provide care using established evidence-based clinical
practices. If plans succeed in these efforts and if the progression of chronic illness is sufficiently
sensitive to altered behavior and management, then disease management, and by extension,
chronic condition SNPs, may improve health outcomes and reduce acute-care needs by
beneficiaries with chronic conditions.
Numerous studies have arrived at conflicting assessments about the promise and effects of
disease management. A recent random-assignment-based evaluation of a CMS demonstration of
15 coordinated care programs for fee-for-service Medicare beneficiaries with chronic illness
found that only one appeared to reduce the probability of hospitalization during the first year
after enrollment (Brown et al. 2007). None was associated with substantially improved patient
adherence to treatment recommendations or with reduced Medicare spending. Program
participants, however, were highly satisfied with the care they received, and physicians tended to
rate the programs highly. Outcomes of these demonstrations over three years will be available in
a separate Report to Congress. CMS has also funded a random-assignment-based evaluation of
disease management programs supplemented with a prescription drug benefit for fee-for-service
Medicare beneficiaries (which predates implementation of Medicare Part D). Results of that
evaluation can be found in Peikes et al. (2007).
C. CONVERSION OF DEMONSTRATION PLANS TO SNPS
Over the same period that it was developing SNP policies, CMS was working with
demonstration programs to help them to transition from demonstration to regular program status
as SNPs. These demonstrations had targeted subsets of beneficiaries with special needs and had
substantial experience in developing specialized services for their populations. Waivers for

8
many of the demonstrations were set to expire at the end of 2007 and the SNP legislation was
critical in allowing these plans to continue operating without demonstration waivers.
The following demonstrations have become SNPs and are currently operating under regular
MA program authority or will be doing so by January 1, 2008:
The Evercare demonstration - The Evercare demonstration plans, serving institutionalized
beneficiaries, were designated as institutional SNPs effective January 1, 2005, and have
operated without demonstration waivers since that time.
Capitated Disease Management Demonstration - Two of the sites approved for the
capitated disease management demonstration were approved as chronic condition SNPs
for contract year 2006. These sites were thus able to implement their programs even
though the demonstration itself was cancelled.
Social/Health Maintenance Organizations (S/HMOs) - The ElderPlan S/HMO became an
institutional-equivalent SNP effective January 1, 2006; one of the SCAN S/HMOs
became a chronic condition SNP effective January 1, 2006 and another became an
institutional-equivalent SNP effective January 1, 2007.
Medicaid/Medicare Integration Demonstrations - Participating plans in Massachusetts
and Minnesota were approved as dual-eligible SNPs and the Wisconsin plans were
approved as institutional SNPs, all effective January 1, 2006. As of 2008, the Wisconsin
plans will be re-classified as dual eligible SNPs with Medicaid subsets. With the
exception of a frailty adjustment provided under a Medicare 402/222 payment waiver,11
all of the Medicaid/Medicare integration demonstration plans are operating under the
same regulations as other MA SNPs. The frailty adjustment will be phased out by the end
of 2010.
End-stage Renal disease (ESRD) demonstration - This demonstration began enrolling
participants in 2006. Two of the participating plans were also approved as chronic
condition SNPs effective January 1, 2006. This will allow them to continue serving
ESRD beneficiaries when the demonstration ends.
Many of these demonstration plans had managed care contracts with both Medicare and
Medicaid. They relied, in varying degrees, on demonstration waivers to reconcile conflicting
requirements arising from the different legislative and regulatory authorities governing Medicare
and Medicaid (for example, regarding quality improvement, enrollment, marketing, grievances,
and program monitoring). As the demonstration programs became SNPs, they had to find ways
to reconcile the conflicting requirements without demonstration waivers. Similar challenges
were faced by MCOs that sought to align new dual-eligible SNPs with existing Medicaid plans.
To assist all of these plans, CMS formed a workgroup that identified areas in which Medicare
and Medicaid regulations appeared to conflict and issued a series of working papers12
to provide
11
Section 402 of the Social Security Amendments of 1967 (PL 90-248) and Section 222 of the Social Security
Amendments of 1972 (PL 92-318).
12 See http://www.cms.hhs.gov/DualEligible/04_IntegratedMedicareandMedicaidModels.asp#

9
guidance to States, health plans, and CMS regional offices on how to accommodate Medicare
and Medicaid requirements in ways that facilitated the integration of the two programs at the
plan level. A second goal of this work group was to eliminate or minimize duplicative oversight
and monitoring activities, an effort that is ongoing.
D. OVERVIEW OF THE EVALUATION DESIGN
The SNP evaluation sought to answer basic questions about plan features and member
interventions, trends in the growth of plans, relationships between plans and State Medicaid
programs, the types of beneficiaries who enrolled in the plans, and the relationship of SNP bids
to bids of other MA plans.
The evaluation drew on multiple data sources to address these questions (Table I.3). It
administered a mail survey of SNPs to provide an overview of all plans operating in 2006,
including their provider networks, relations with Medicaid, and member interventions. So that it
could describe plan features and operations in detail, it conducted site visits with selected plans
and parent organizations that operated multiple plans. To gain the member perspective on plan
operations, it also conducted focus groups with members of many of the visited plans.
Interviews with State Medicaid officials gauged State government reaction to SNPs and in
particular to dual-eligible SNPs. One focus of these interviews was the willingness of States to
contract with SNPs for the provision of Medicaid services to dual-eligible SNP members.
TABLE I.2
SNP EVALUATION RESEARCH QUESTIONS AND DATA SOURCES, WITH CHAPTER CONTAINING FINDINGS
Research Question Data Source Report Chapter
How have plans proliferated, and how has enrollment grown since 2004? CMS 2006-2007 MA payment files
CMS Health Plan Management System
(HPMS)
CMS Medicare Beneficiary Database (MBD)
CMS 2008 SNP Application File
II
What are the basic features of SNPs operating in 2006? MPR SNP mail survey
CMS 2006 SNP Application File
III
What specific steps did SNPs take in 2006 to improve care for their
special-needs target populations? MPR site visits to selected plans
MPR focus groups with members of selected
plans
IV
To what extent did States develop relationships with SNPs to better
coordinate Medicaid and Medicare services?
MPR site visits with selected State Medicaid
and Medicare regional office staff
V
How did 2006 SNP members compare with other Medicare beneficiaries
who were eligible to enroll but did not? CMS Enrollment Database (EDB)
CMS MBD
CMS 2006 Budget Neutrality file for HCCs
CMS MA payment files
CMS Minimum Dataset (MDS)
CMS CCW Beneficiary 2005 Summary file
VI
How did the bids of SNPs compare to those of other MA plans? CMS 2006 and 2007 plan bid data files VII
Do SNPs appear to have the potential to improve care quality for their
target populations?
What are the effects of SNPs on Medicare costs?
Synthesis of quantitative and qualitative
evaluation findings VIII
Note: CCW = Chronic Condition Warehouse.

10
The evaluation also used a variety of administrative databases to examine plan growth, to
compare plan members with eligible nonmembers, and to assess differences in bids. Data from
the Health Plan Management System Payment Files were used to describe SNP enrollment and
disenrollment between January 2005 and March 2007. These data were merged to another CMS
database to estimate the number of dual-eligible beneficiaries who were passively enrolled into
SNPs in 2006. The evaluation used the 2005 Medicare Beneficiary Database, the Minimum Data
Set for nursing home residents, and HCC risk-group data to identify Medicare beneficiaries in
individual SNP market areas who appeared eligible to enroll in SNPs but did not enroll (that is,
eligible non-enrollees), in order to compare them to SNP members. The MA bid data for SNPs
were compared with those of similar non-SNP MA plans in the same market area for 2006 and
2007 as a means of determining whether there were systematic differences between the two types
of plans.
Some analyses that might ordinarily be conducted as part of an evaluation were precluded in
this case by time and data limitations. A typical approach to evaluation of beneficiary outcomes
associated with SNP enrollment might compare the trajectory of utilization and health status for
beneficiaries enrolled in SNPs with those of selected comparison group beneficiaries who were
similar in terms of demographic characteristics and prior health status and utilization. That
strategy is not available here for two reasons. First, SNPs were approved as regular MA plans,
not as demonstration projects. SNPs therefore report only those data that are required of all other
MA plans, including the Health Plan Employer Data and Information Set (HEDIS) and the
Medicare Health Outcomes Survey (HOS). No beneficiary-level claims or encounter data are
available that would permit comparison with non-enrollees. Second, the time frame for the
evaluation requires analyses to be completed before other data such as the 2006 HEDIS and HOS
surveys or HCC risk scores reflecting 2006 diagnoses become available. Later analyses of SNP
outcomes could employ these data to compare the risk status, utilization, and personal
assessments of SNP enrollees with those of similar beneficiaries in fee-for-service Medicare or
non-SNP MA plans.
The assessment of the impact of SNPs on Medicare costs and the quality of care will rely
primarily on comparisons of SNPs with other MA plans. While such comparisons are useful,
they should be considered in the context of broader changes that were occurring as a result of
the MMA. The quantitative analyses reported in this evaluation focus primarily on SNP
operations in 2006, the same year in which two major changes were introduced to the MA
program - the Medicare Part D drug benefit and competitive bidding. As a result, SNPs - a
substantial number of which were in their first year of operation - were implementing two major
new Medicare initiatives at the same time that they were implementing their special needs
programs. In addition, MA plans were also midway through the process of implementing risk
adjustment, a major change in payment methods mandated by the Balanced Budget Act (BBA)
of 1997. This required MA plans to transition from a relatively simple system of payment based
on demographic factors to the HCC payment model, a much more complex system based on the
diagnoses of individual plan members. The transition began in 2004 and most MA plans
completed the transition and were receiving fully risk-adjusted payments as of January, 2007.
Demonstration plans that became SNPs were granted an additional year to complete the
transition.

11
E. ORGANIZATION OF THE REPORT
The remainder of this report is organized as follows. Chapter II describes the growth of
Medicare SNPs and SNP enrollment from 2004 to 2007. Chapter III briefly describes results of a
mail survey of SNPs in operation in 2006, highlighting their means of assessment and provision
of special services. Chapter IV describes the operation of SNPs as observed during site visits to
11 SNPs and focus groups with members of 9 of those same organizations. Chapter V assesses
the perspective of State Medicaid agencies about SNPs and the prospects for joint Medicare-
Medicaid contracting with SNPs. Chapter VI contains an analysis of the characteristics and
health risk of SNP enrollees compared with those of samples of eligible non-enrollees. Chapter
VII compares the bids of SNPs for plan years 2006 and 2007 with those of other non-SNP MA
plans. Chapter VIII presents conclusions.

12
II. THE EVOLUTION OF SNPS: 2004 - 2008
This chapter examines the characteristics of SNPs and their enrollees from 2004, when the
first SNPs were approved, through 2008. It draws on data from the Health Plan Management
System (HPMS), the Medicare Enrollment Database (EDB), MA Payment files, and data
provided by CMS identifying plans approved to passively enroll dual-eligible beneficiaries in
2006. The first section below describes the growth in the number of SNPs from 2004 through
2008 and in their enrollment through March 2007. The second section examines the
characteristics of SNP plans with accompanying enrollment numbers to provide perspective on
the relative number of beneficiaries enrolled in plans of various types.
A. THE GROWTH OF SNP PLANS
1. Terminology
For purposes of clarity, we will begin this section by defining the terms that will be used in
discussing managed care organizations. The terms ―managed care plan‖ or ―plan‖ are often
used interchangeably with the term ―managed care organization‖, but the term ―plan‖ has a
specific meaning in CMS administrative terminology and it is therefore important to be precise
in how we use these and related terms.
For administrative purposes CMS defines a plan as a distinct combination of services
(benefits), premiums, and cost sharing arrangements offered in a specified service area as part of
a contract between CMS and a Managed Care Organization13
(MCO). ―Plan‖ is shorthand for
―plan benefit package‖ (PBP). Contracts may be regional - covering CMS defined areas of one
or more States - or local - limited to a single State or portions of a State. An MCO may have one
or more contracts with CMS in different States or regions as well as contracts with State
Medicaid agencies. A SNP is a plan as defined above; an MCO may offer one or more SNPs,
along with one or more regular plans under the same or different contracts.
Medicare MCOs are part of the Medicare Advantage (MA) Program (often referred to as
Medicare Part C), which includes several types of coordinated care plans14
as well as medical
savings accounts, and private fee-for service plans. SNPs are a type of coordinated care plan,
defined in 42CFR422.4 as a plan that has (1) a network of contracted providers approved by
CMS, (2) mechanisms to control utilization, and (3) financial arrangements with providers that
offer incentives to furnish high quality and cost-effective care. Coordinated care plans include
local and regional preferred provider organizations (PPOs), health maintenance organizations
13
CMS actually uses the term Medicare Advantage Organization (MAO) to refer to the contracting entity. We
decided to use MCO to refer to the contracting entities responsible for SNPs because MAO includes Medical
Savings Accounts and Private Fee-for-Service Plans, which cannot be SNP sponsors.
14 The reader will note that the use of the term ―plan‖ in the Medicare regulations sometimes differs from its
usage in this report)
13
(HMOs), and provider sponsored organizations (PSOs), but not private fee for service (PFFS)
plans.
2. An Overview of SNP Growth
SNPs vary widely in terms of both enrollment and service areas making it impossible to
describe SNP growth accurately using plan numbers alone. One MCO, for example, has two
dual-eligible SNPs - one covering all of northern California and the other covering all of
southern California. Their combined enrollment exceeds 50,000 members. In contrast, another
MCO in a different State offers 28 dual eligible SNPs with service areas that correspond to
individual counties and overall enrollment of fewer than 10,000 members. Aside from the fact
that they have different service areas, the 28 SNPs appear to be identical except for relatively
minor variations in premiums and cost sharing requirements. As these examples indicate, plan
numbers alone are not a reliable measure of SNP growth. They should be used only in
conjunction with enrollment numbers as a means of describing SNP growth.
Table II.1 presents the number of plans and the number of beneficiaries ever enrolled from
2004 through March, 2007. It also includes the number of plans that may be available in 2008
based on applications submitted in 2007. The sharp growth in the number of plans over the
period is evident. The total number of plans doubled between 2005 and 2006, and increased by
another 78 percent between 2006 and 2007. Over 880,000 Medicare beneficiaries were enrolled
in a SNP at some point in the first three months of 2007. A substantial majority of SNP members
are enrolled in dual-eligible SNPs. The number of beneficiaries enrolled in dual-eligible and
chronic condition SNPs grew slowly between 2006 and 2007. The rapid increase in enrollment in
institutional equivalent SNPs between 2006 and 2007 was accounted for almost entirely by the
conversion of the Senior Care Action Network (SCAN) S/HMO demonstration plan, with about
90,000 enrollees, to SNP status on January 1, 2007.
Figure II.1 shows that there were sharp spikes in SNP enrollment each January, followed by
more gradual growth for dual-eligible SNPs and limited growth for institutional SNPs and
chronic condition SNPs during the remainder of each year. The underlying reasons for the
growth patterns in Figure II.1 will be discussed next.
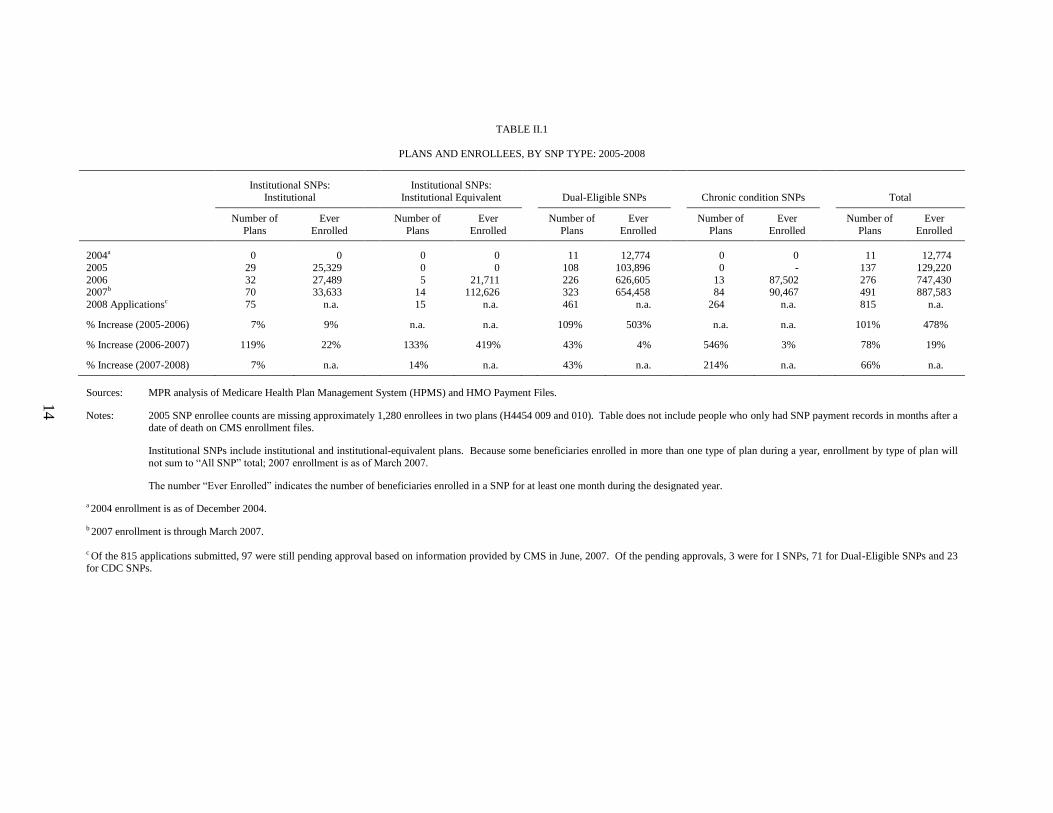
14
TABLE II.1
PLANS AND ENROLLEES, BY SNP TYPE: 2005-2008
Institutional SNPs:
Institutional
Institutional SNPs:
Institutional Equivalent
Dual-Eligible SNPs
Chronic condition SNPs
Total
Number of
Plans
Ever
Enrolled
Number of
Plans
Ever
Enrolled
Number of
Plans
Ever
Enrolled
Number of
Plans
Ever
Enrolled
Number of
Plans
Ever
Enrolled
2004a 0 0 0 0 11 12,774 0 0 11 12,774
2005 29 25,329 0 0 108 103,896 0 - 137 129,220
2006 32 27,489 5 21,711 226 626,605 13 87,502 276 747,430 2007b 70 33,633 14 112,626 323 654,458 84 90,467 491 887,583
2008 Applicationsc 75 n.a. 15 n.a. 461 n.a. 264 n.a. 815 n.a.
% Increase (2005-2006) 7% 9% n.a. n.a. 109% 503% n.a. n.a. 101% 478%
% Increase (2006-2007) 119% 22% 133% 419% 43% 4% 546% 3% 78% 19%
% Increase (2007-2008) 7% n.a. 14% n.a. 43% n.a. 214% n.a. 66% n.a.
Sources: MPR analysis of Medicare Health Plan Management System (HPMS) and HMO Payment Files.
Notes: 2005 SNP enrollee counts are missing approximately 1,280 enrollees in two plans (H4454 009 and 010). Table does not include people who only had SNP payment records in months after a
date of death on CMS enrollment files.
Institutional SNPs include institutional and institutional-equivalent plans. Because some beneficiaries enrolled in more than one type of plan during a year, enrollment by type of plan will
not sum to ―All SNP‖ total; 2007 enrollment is as of March 2007.
The number ―Ever Enrolled‖ indicates the number of beneficiaries enrolled in a SNP for at least one month during the designated year.
a 2004 enrollment is as of December 2004.
b 2007 enrollment is through March 2007.
c Of the 815 applications submitted, 97 were still pending approval based on information provided by CMS in June, 2007. Of the pending approvals, 3 were for I SNPs, 71 for Dual-Eligible SNPs and 23 for CDC SNPs.

15
0
100,000
200,000
300,000
400,000
500,000
600,000
700,000
Jan
2005
Feb
2005
Mar
2005
Apr
2005
May
2005
Jun
2005
Jul
2005
Aug
2005
Sep
2005
Oct
2005
Nov
2005
Dec
2005
Jan
2006
Feb
2006
Mar
2006
Apr
2006
May
2006
Jun
2006
Jul
2006
Aug
2006
Sep
2006
Oct
2006
Nov
2006
Dec
2006
Jan
2007
Feb
2007
Mar
2007
Dual-eligible
Institutional
Institutional equivalent
Chronic-care
Source: CMS HMO Payment files.
FIGURE II.1
2005-2007 SNP ENROLLMENT, BY SNP TYPE
3. The Impact of Enrollment Policies on SNP Growth
Most of the spikes in enrollment that occurred in January of each year (Figure II.1) are
attributable to CMS policy decisions concerning enrollment. The policy decisions having the
greatest impact on enrollment trends were those pertaining to election periods and passive
enrollment. Intra-MCO transfers (from a non-SNP plan into a SNP within the same MCO) were
initiated either by the MCOs or by beneficiaries and did not result from a CMS policy decision.
a. Election Periods and Enrollment Procedures
Enrollment in an MA plan is a two-step process in which a beneficiary first chooses (elects)
to join or change a plan and then implements that election by enrolling or disenrolling.15
Election Periods – All Medicare Advantage eligible beneficiaries may elect to enroll in or
disenroll from an MA plan during the annual election period (AEP) that runs from November 15
through December 31 each year. An individual is eligible to elect an MA plan when s/he meets
certain conditions, such as entitlement to Medicare Part A and enrollment in Part B, permanently
resides in the service area of the MA plan, is not medically determined to have ESRD, etc.).
Medicare Advantage also provides an initial coverage election period (ICEP) that is available to
15
Election and enrollment rules are complex and the present discussion summarizes only those that are most
relevant to SNPs. A complete presentation of these rules can be found in Chapter 2 of the Managed Care Manual
(http://www.cms.hhs.gov/MedicareMangCareEligEnrol/Downloads/Chapter2UpdateMAEnrollmentDisenrollment.p
df).

16
beneficiaries when they first become entitled to both Medicare Part A and B. There are also
numerous special election periods (SEPs) available to beneficiaries in specific circumstances.
Finally, during the Open Enrollment Period (OEP) an MA eligible beneficiary may make
one MA OEP election from January 1 through March 31 each year, which will be discussed in
more detail in the next section.
1. Dual Eligibles – Individuals who are entitled to Medicare Part A and Part B and
receiving any type of assistance from the Title XIX (Medicaid) program have an SEP
that begins the month the individual becomes dually-eligible and exists as long as he
or she receives Medicaid benefits. An SEP is also available to individuals who lose
their Medicaid eligibility. (Neither SEP is limited to dual eligibles seeking to enroll
in or disenroll from SNPs, but apply to all MA plans.)
2. Individuals Who Lose Special Needs Status – CMS provides an SEP for those
enrolled in a SNP who are no longer eligible for the SNP because they no longer meet
the specific special needs status. This SEP begins the month the individual‘s special
needs status changes and ends the earlier of when the beneficiary makes an election or
three months after the expiration of the period of deemed continued eligibility.
3. Individuals with Chronic Conditions – CMS provides an SEP (for MA and Part D)
to allow individuals with severe or disabling chronic conditions to enroll in a Chronic
Condition SNP. The SEP begins when the individual is diagnosed with the qualifying
condition and ends once he or she enrolls in a SNP. Once the SEP ends, that
individual may make changes only during regular MA election and open enrollment
periods.
Enrollment Procedures – Elections made during an AEP become effective on January 1 of
the following year. Elections made during ICEPs and SEPs generally become effective on the
first day of the month following the month in which the election is made.
As indicated earlier, elections can also be made during open enrollment periods, although
MA organizations are not required to open their MA plans for enrollment during an OEP. The
following are the open enrollment policies most relevant to SNPs (although they are not
necessarily limited to SNPs):
1. 2006 Open Enrollment16
- any MA eligible individual was allowed to make one
MA OEP election from January 1 through June 30, 2006.
2. Open Enrollment for 2007 and subsequent years – the OEP is from January 1,
through March 31.
16
Part D enrollment rules differ slightly from the MA rules. When Part D coverage was introduced in 2006,
the initial election period ran from November 15, 2005 through May 15, 2006. The AEP is often referred to as
―Open Enrollment‖ which can be confusing and is technically not correct. The open enrollment period established
by the MMA is limited in scope and intended only to allow beneficiaries an opportunity to change Part D plans but
not to pick up or drop Part D coverage.

17
3. Open Enrollment for Institutionalized individuals (OEPI) – any institutionalized
individual (including community resident individuals who qualify for an Institutional
Equivalent SNP) may elect to enroll in or disenroll from a plan at any time during
the year and can make an unlimited number of elections during the year.
While open enrollment periods in 2006 and subsequent years have allowed beneficiaries to
enroll in MA plans after January 1, most enrollment decisions continue to be made during the
annual election period from November 15 to December 31, becoming effective on January 1 of
the following year. Accordingly, a major portion of MA enrollment continues to become
effective in January. However, the greater flexibility of SNP-eligible beneficiaries to enroll and
disenroll throughout the year, and the ability of SNPs to use more targeted marketing strategies
has resulted in a comparatively robust growth in SNP enrollment throughout the year.
b. Determinants of SNP Enrollment Patterns
The trends in SNP enrollment shown in Figure II.1 reflect the combined effects of a number
of factors that are described in detail below. One of these factors was passive enrollment, a one-
time occurrence that contributed substantially to the large spike in enrollment that can be seen in
January, 2006. Two other factors - intra-MCO transfers and plan redesignations - had
significant impacts in 2006 and 2007, but are unlikely to play a significant role in future
enrollment gains. A final factor, and one that contributes substantially to the steady increases in
enrollment that can be seen from February through December, is the ability of beneficiaries to
enroll in SNPs in any month of the year.17
Passive Enrollment. Passive enrollment (described in Section B.1) took place in 2006 on a
one-time basis. We identified beneficiaries who were passively enrolled into SNPs by
means of an indicator variable in the Medicare Beneficiary Database (MBD) used by
Medicare to prevent SNP plan members from being auto-enrolled in a Part D plan other than
the one provided by their plan.18
We defined a beneficiary to be passively enrolled if (1) the
MBD contained a Part D opt-out reason code of ―SNP‖ and (2) he or she was enrolled,
between November, 2005 and March 2006, into a SNP approved by CMS for passive
enrollment. (A small number of beneficiaries with the SNP flag were enrolled prior to
17
Institutionalized beneficiaries and dual eligible beneficiaries were already allowed to enroll and disenroll in
MA plans in any month even before the development of SNPs. Beneficiaries with qualifying chronic conditions
may enroll for the first time in a chronic condition SNP in any month. Once enrolled for the first time, however,
they become subject to the same enrollment limitations as other, non-dual eligible and non-institutionalized
beneficiaries.
18 On January 1, 2006, dual eligible beneficiaries already enrolled in MA plans were to be automatically
enrolled in their MA plan‘s prescription drug plan. Dual eligibles not enrolled in an MA plan could chose to enroll
in an MA plan that offered prescription drug coverage or they could remain in traditional Medicare and enroll in a
free-standing PDP. If they failed to do one or the other, they were to be automatically enrolled in a free-standing
PDP. A mechanism was needed to ensure that beneficiaries, who were selected for passive enrollment into a SNP
and who did not opt out, were not auto-enrolled into a free-standing PDP. This was accomplished by giving the
MBD indicator a value of ―SNP‖.

18
January 1 or later in February or March. However 95 percent of passive enrollments
occurred in January, 2006).
Redesignation. MCOs were permitted to convert an existing plan into a SNP provided that
the SNP offered the same, or more generous, benefits and allowed members who did not
meet the SNP enrollment criteria to remain in the plan. We identified a plan as a
redesignated SNP if it was identified as a non-SNP plan in one year and as a SNP in the
next. Beneficiaries who were enrolled in the new SNP were assigned a flag for
redesignation.
Intra-MCO Transfers. Some SNP enrollees, particularly those entering dual eligible
SNPs, transferred19
from another plan operated by the same MCO. These transfers were
identified in the payment files as beneficiaries who were enrolled in a non-SNP MA plan in
one month and enrolled in the SNP plan in the same MCO the following month.
Otherwise Enrolled. SNP enrollees who were not assigned to one of the above three
categories were considered to be otherwise enrolled. Most enrollees in this category simply
enrolled in a SNP from traditional Medicare, from another MA plan, or they enrolled in the
SNP upon enrolling in Medicare. For ease of exposition, we refer to these enrollees as
having actively enrolled.20
4. Enrollment and Disenrollment Trends by SNP Type
Tables II.2, II.3, and II.4 each show patterns of enrollment and disenrollment between 2004
and March, 2007. Table II.2 presents a year-by-year sequence, showing number enrolled at the
start of the year, number who enrolled, disenrolled, and died during the year, and the number
enrolled at the end of the year. Tables II.3 and II.4 show enrollment and disenrollment in
2005/2006 combined and for early 2007 by mode of entry into a SNP.21
Note that Tables II.2
and II.3 differ in their approach to counting SNP enrollees. Table II.2 counts each enrolled
beneficiary, even if he or she enrolled in two different types of SNP during a year. Tables II.3
and II.4 assign each beneficiary to the SNP type in which he or she was first enrolled during a
year.22
19
Plans must obtain beneficiary consent to such transfers.
20 Beneficiaries may be erroneously assigned to the ―otherwise enrolled‖ category if administrative data
elements are missing. For example, if the Part D opt-out flag was not set to ―SNP‖ for some enrollees, they would
inappropriately be categorized as ―otherwise enrolled.‖ The ―otherwise enrolled‖ category may therefore overstate
the number of beneficiaries who actively enrolled in a SNP.
21 2005 and 2006 are combined since our definition of passive enrollment spans the two years. This time period
is also the one used for later analysis of enrollee characteristics.
22 Tables II.3 and II.4 do not distinguish institutional from institutional-equivalent SNPs in the way that Tables
II.1 and II.2 do.
19
The discussion that follows treats the results from both tables by type of SNP. Note that the
reported disenrollment rates may overstate the long-term probability of disenrolling from a SNP.
Information collected during site visits suggests that many cases of disenrollment occurred
because SNP members mistakenly believed they needed to enroll in a Part D prescription drug
plan. Enrolling in such a plan, however, automatically disenrolled them from the SNP, a situation
they might discover only when they visited a provider who told them they were no longer
enrolled. In most cases, it was possible for the plan to correct the problem and re-enroll the
beneficiary. (We count disenrollment as any break in enrollment from a plan.)
a. Institutional SNPs
By the end of 2006, enrollment in institutional-equivalent SNPs was nearly equal to that of
regular institutional SNPs. During 2007, enrollment in institutional-equivalent SNPs grew much
more rapidly, due primarily to the conversion of SCAN Health Plan to this form of SNP. By
March, 2007, there were more than three times as many enrollees in institutional-equivalent
SNPs as in regular institutional SNPs (Table II.2).23
Among those first enrolled into institutional
SNPs from 2005 to 2006, 30 percent were enrolled at the beginning of 2005 (Table II.3).
Roughly 40 percent actively enrolled and 27 percent were in plans redesignated as SNPs. Note
that over 100,000 enrollees entered institutional SNPs via redesignation of plans between
January 2005 and March 2007, while only about 5,500 beneficiaries entered dual-eligible or
chronic condition SNPs in this manner. Enrollees in institutional SNPs that were redesignated
from other MA plans were actually somewhat less likely to disenroll than those who actively
enrolled.
b. Dual-Eligible SNPs
Though dual-eligible SNPs exhibit higher disenrollment rates than either institutional or
chronic condition SNPs, they also show substantial spikes in enrollment at the beginning of each
year followed by steady growth through out the remainder of the year24
(Table II.2). Nearly 48
percent of beneficiaries who first enrolled in a dual-eligible SNP in 2005 or 2006 actively
23
Of the 109,000 beneficiaries enrolled in institutional-equivalent SNPs in March, 2007, more than 95
percent were enrolled in Elderplan and SCAN. Both are disproportionate percentage SNPs and the target population
of community-resident, nursing home certifiable beneficiaries comprises 26% of their combined enrollment as of
February, 2007 (data provided by CMS Office of Research, Development, and Information). The remaining 74% of
the plans‘ enrollees are not required to be nursing home certifiable. (CMS policy, described in Table I.1, is that
disproportionate percentage plans are not required to limit enrollment exclusively to their target group but must
enroll ―a greater proportion of the target group of special needs individuals than occurs nationally in the Medicare
population based on data acceptable to CM.‖
24 Disenrollment rates from dual-eligible SNPs range from 18 to 21 percent in 2005 and 2006, and are
substantially higher than the rates for MA plans overall, which average 6 percent according to the current Medicare
Personal Plan Finder. At least some of this increase probably results from the freedom of dual eligibles to disenroll
in any month and to passive enrollment and plan redesignations. These enrollment methods were unique to SNPs
and could have resulted in increased rates of disenrollment. Further study will be needed to fully understand the
higher SNP disenrollment rates in SNPs.
20
enrolled (Table II.3). The 42 plans approved for passive enrollment enrolled 212,525 members in
this fashion, amounting to 27 percent of total SNP enrollment for 2006.
One third were passively enrolled and 13 percent transferred from other plans offered by the
same organization. Those who actively enrolled were just as likely to disenroll from a SNP as
those who were passively enrolled in 2006. In each case, the fraction of the group that later
disenrolled was about 26 percent. The 26 percent disenrollment rate in Table II.4 does not
include those beneficiaries who were informed by their plans (as required by CMS) that they
would be passively enrolled and exercised their option to reject it. These beneficiaries were
never enrolled into a SNP and so never appear in Tables II.3 or II.4.
c. Chronic-condition SNPs
Chronic-condition SNPs became available to Medicare beneficiaries in January 2006. Fewer
than 800 beneficiaries enrolled in SNPs during the regular MA enrollment period (Table II.2).
More than 86,000 enrolled during the CY 2006. Most of these were transferred by a single
organization, Puerto Rico‘s Medicare y Mucho Mas, from its other MA plans into its SNPs.25
As
Table II.3 shows, two thirds of beneficiaries entering chronic-condition SNPs in 2006 were
transferred from other plans offered by the same organization. Rates of disenrollment were about
the same for those who were transferred and those who actively entered a chronic-condition
SNP.
25
MMM has both a dual-eligible and chronic-care SNP, and transferred people to both plans from their regular
MA plan.

21
TABLE II.2
SNP ENROLLMENT AND DISENROLLMENT, 2004 - 2007
Institutional SNPs Institutional Equivalent SNPs Dual-Eligible SNPs Chronic-Disease SNPs All SNPs
Number Percent Number Percent Number Percent Number Percent Number Percent
2004
Enrollment as of December 31 0 0 0 0 12,774 - 0 0 12,774 -
2005
Enrolled in January 16,726 - - - 39,100 - - - 55,826 -
New Enrollment, February-December 8,603 - - - 64,796 - - - 73,394 -
Disenrollment (not due to death)a 1,411 6 - - 15,558 15 - - 16,964 19
Dieda 5,301 21 - - 1,989 2 - - 7,290 6
Enrollment as of December 31 18,617 - - - 86,349 - - - 104,966 -
2006
Still Enrolled on January 1 17,495 - - 78,390 - - 96,085 -
Newly Enrolled in January 976 - 17,577 - 281,560 - 794 - 300,707 -
New Enrollment, February-
December 9,018 -
4,134 - 266,655 - 86,708 - 350,638 -
Disenrollment (not due to death)a 1,648 6 2,376 11 80,450 13 13,707 9 82,572 14
Dieda 5,708 21 957 4 21,021 3 1,870 2 29,288 4
Enrollment as of December 31 20,133 - 18,378 - 525,134 - 71,925 - 635,570 -
2007 (through March)
Still Enrolled on January 1 18,896 - 17,624 - 505,203 - 66,708 - 610,657 -
Newly Enrolled in January 11,485 - 89,283 - 102,506 - 12,089 - 213,137 -
New Enrollment, February-March 3,282 - 5,719 - 46,749 - 11,670 - 63,789 -
Disenrollment (not due to death)a 1,629 5 3,633 3 17,974 3 5,705 4 25,318 3
Dieda 1,018 3 164 0 4,112 1 408 0 5,694 1
Enrollment as of March 31 31,016 - 108,829 - 632,372 - 84,354 - 856,571 -
Source: CMS HMO Payment files and Health Plan Management System (HPMS) files.
Notes: SNP enrollees can be counted in more than one type of SNP (more than one column) if they switch between SNP types. SNP enrollment by type of SNP as of December 31 (or March 31) will sum to total SNP enrollment. Entries in other rows will not necessarily sum to the total for all SNPs.
The difference between ―Enrollment as of December 31‖ and ―Still Enrolled on January 1‖ represents the number of beneficiaries who disenrolled at the end of the calendar year.
aAll percentages are calculated as a proportion of those ever enrolled during a year.

22
TABLE II.3
SNP ENROLLMENT, OVERALL AND BY MODE OF ENROLLMENT
Institutional SNPs Dual-Eligible SNPs Chronic-Disease SNPs All SNPs
Number Percent Number Percent Number Percent Number Percent
Ever Enrolled, 2005-2006a 56,278 100.0 636,105 100.0 81,960 100.0 774,343 100.0
In SNP January 1, 2005b 16,726 29.7 39,100 6.1 0 0.0 55,826 7.2
Passively enrolled --* --* 211,965 33.3 357 0.4 212,323 27.4
Redesignated into SNP plan 15,304 27.2 80 0.0 --* --* 15,389 2.0
Transferred into SNP plan 1,631 2.9 82,854 13.0 53,755 65.6 138,240 17.9
Otherwise enrolled 22,616 40.2 302,106 47.5 27,843 34.0 352,565 45.5
(New) Enrollment 2007 116,754 100.0 169,419 100.0 23,931 100.0 310,104 100.0
Redesignated into SNP plan 90,367 77.4 5,490 3.2 0 0.0 95,857 30.9
Transferred into SNP plan 1,438 1.2 71,638 42.3 2,252 9.4 75,328 24.3
Otherwise enrolled 24,949 21.4 92,291 54.5 21,679 90.6 138,919 44.8
Source: HMO Payment files for enrollment and disenrollment information, and Medicare Beneficiary Database (MBD) for identifying passive enrollees.
Note: Beneficiaries are assigned to each column based on the SNP plan type they first enrolled in, so totals do not equal "ever enrolled." Passive enrollees were identified as
those identified in the MBD with a Part D Opt Out reason of "SNP" and who enrolled into a SNP plan approved for passive enrollment between August 2005 and May
2006. Redesignated enrollees were identified as beneficiaries in a plan (contract number/plan ID) that became a SNP. Transfers were identified as beneficiaries moved
from a non-SNP plan to a SNP plan under the same contract. Since 2004 payment file data were not available, beneficiaries in the ―Already in SNP in January 2005‖
group may have been redesignated or transferred at that time.
The number of beneficiaries reported as ―Ever Enrolled 2005-2006‖ represents unique individuals. This differs from the procedure followed in Table II.2. There,
beneficiaries who disenroll from a SNP in 2005 and re-enroll in 2006 are counted twice, once for each enrollment. Thus, summing enrollment in 2005 and 2006 from
Table II.2 may produce a total exceeding the ―Ever Enrolled‖ figure in Table II.3.
aIncludes people enrolled in 2004 who remained enrolled into 2005. bIncludes people still enrolled and newly enrolled in January 2005.
* Number too small to report.

23
TABLE II.4
SNP DISENROLLMENT, OVERALL AND BY MODE OF ENROLLMENT
Institutional SNPs Dual-Eligible SNPs Chronic-Disease SNPs All SNPs
Number Percent Number Percent Number Percent Number Percent
Disenrollment (including died),
2005-2006 6,679 11.9 169,117 26.6 14,886 18.2 190,682 24.6
Already in SNP in January 05 2,237 13.4 19,466 49.8 0 - 21,703 38.9
Passively enrolled --* --* 54,339 25.6 41 11.5 54,381 25.6
Redesignated into SNP plan 1,577 10.3 13 16.3 --* --* 1,592 10.3
Transferred into SNP plan 87 5.3 16,263 19.2 10,320 19.2 26,670 19.3
Otherwise enrolled 2,777 12.3 79,036 26.2 4,523 16.2 86,336 24.5
Source: HMO Payment files for enrollment and disenrollment information, and Medicare Beneficiary Database (MBD) for identifying passive enrollees.
Note: Beneficiaries are assigned to each column based on the SNP plan type they first enrolled in, so totals do not equal "ever enrolled." Passive enrollees were identified as
those identified in the MBD with a Part D Opt Out reason of "SNP" and who enrolled into a SNP plan approved for passive enrollment between August 2005 and May
2006. Redesignated enrollees were identified as beneficiaries in a plan (contract number/plan ID) that became a SNP. Transfers were identified as beneficiaries moved
from a non-SNP plan to a SNP plan under the same contract. Since 2004 payment file data were not available, beneficiaries in the ―Already in SNP in January 2005‖
group may have been redesignated or transferred at that time.
Beneficiaries who disenroll from a SNP and re-enroll in another SNP of the same type in the same year are counted as disenrollees in Table II.4, but not in Table II.2.
Therefore, the number of disenrollees reported in Table II.4 may exceed the total number reported in Table II.2.
All percents are computed as a proportion of the corresponding number in Table II.3. Hence columns will not sum to 100 percent.
* Number too small to report.
24
B. SNP CHARACTERISTICS
Table II.5 shows the distribution of SNP enrollment in March 2007 by plan characteristics.
The regional distribution is remarkable primarily in the disproportionate number of enrollees in
Puerto Rico, which accounts for one quarter of all SNP enrollment. Approximately 36 percent of
all Medicare beneficiaries in Puerto Rico are enrolled in a SNP.
While the absolute number of enrollees differs markedly across SNP types, the distribution
of enrollees by size of SNP is similar for each of the three SNP types. Roughly three quarters of
enrollees in each type (with institutional and institutional-equivalents combined) belong to SNPs
with more than 5,000 members; less than one percent, in each case, belong to plans with fewer
than 50 members.
For institutional and chronic condition SNPs, the remaining characteristics of Table II.5 are
strongly skewed by two plans. SCAN Health Plan is a non-profit, institutional equivalent SNP
with no Medicaid contract that operates as a S/HMO demonstration and is part of a larger
organization. Its 90,000 members represent over 80 percent of all enrollment in institutional-
equivalent SNPs in 2007. Its effect on the distribution of enrollment by plan characteristics is
evident in the table. Much the same is true of Medicare y Mucho Mas (MMM), a for-profit CCP
that has a limited Medicaid contract that covers Medicare deductibles and cost sharing as well as
physical therapy, vision, and dental care. MMM is not a disproportionate percentage SNP and so
enrolls only those beneficiaries with specific targeted conditions. It has 61,000 enrollees, 73
percent of all chronic condition SNP enrollment in 2007.
Most enrollees in dual-eligible SNPs belong to plans with no Medicaid contract of any kind.
Plans with a Medicaid contract tend, on average to be larger than those without a contract—the
14 percent of dual-eligible SNPs with a Medicaid contract in 2007 (Table II.7) account for 39
percent of the dual-eligible enrollees.
The broad characteristics of SNPs operating in 2006 and 2007 are shown in Tables II.6 and
II.7. The great majority of SNPs are local coordinated care plans and are operated by for-profit
entities. Dual-eligible plans tend to be larger than either institutional or chronic condition SNPs,
which may reflect their greater use of passive enrollment and the greater ease of identifying dual
eligibles among existing managed-care enrollees. Over 28 percent of dual-eligible SNPs had
more than 1,000 members in March 2007, compared to 17 percent of (combined) institutional
SNPs and 7 percent of chronic condition SNPs. More rapid growth of plans relative to enrollees
caused the average size of plans to shrink between 2006 and March 2007. For each of the three
SNP types, the proportion of plans with fewer than 50 enrollees grew between 2006 and 2007.
Over 80 percent of institutional and dual-eligible SNPs—but fewer than half of chronic condition
or institutional-equivalent SNPs—were part of organizations offering other MA plans in 2007.
Finally, as mentioned above, a small proportion of dual-eligible SNPs held contracts with the
Medicaid program in their State.

25
TABLE II.5
SNP ENROLLEES, AS OF MARCH 2007
Institutional SNPs Institutional Equivalent SNPs Dual-Eligible SNPs Chronic condition SNPs All SNPs
Number Percent Number Percent Number Percent Number Percent Number Percent
Total 31,016 100.0 108,829 100.0 632,372 100.0 84,354 100.0 856,571 100.0
By U.S. Census Region
Northeast 14,926 48.1 16,706 15.4 159,236 25.2 677 0.8 191,545 22.4
South 9,401 30.3 137 0.1 122,344 19.3 16,575 19.6 148,457 17.3
Midwest 3,667 11.8 1,978 1.8 45,147 7.1 3,167 3.8 53,959 6.3
West 2,845 9.2 90,008 82.7 154,491 24.4 2,278 2.7 249,622 29.1
Puerto Rico 177 0.6 0 0.0 151,154 23.9 61,657 73.1 212,988 24.9
By Plan Size
<50 members 161 0.5 36 0.0 974 0.2 457 0.5 1,628 0.2
50 – 1,000 members 7,075 22.8 2,104 1.9 52,511 8.3 11,961 14.2 73,651 8.6
1,000 – 5,000 members 18,284 59.0 0 0.0 120,678 19.1 10,721 12.7 149,683 17.5
> 5,000 members 5,496 17.7 106,689 98.0 458,209 72.5 61,215 72.6 631,609 73.7
Plan Tax Status
For profit 30,385 98.0 166 0.2 444,545 70.3 83,132 98.6 558,228 65.2
Not for profit 631 2.0 108,663 99.8 185,825 29.4 1,222 1.4 296,341 34.6
Organization Type
Local CCP 31,016 100.0 0 0.0 584,321 92.4 74,091 87.8 689,428 80.5
Regional CCP 0 0.0 0 0.0 7,135 1.1 9,544 11.3 16,679 1.9
Demonstration 0 0.0 108,829 100.0 40,916 6.5 719 0.9 150,464 17.6
Stand-Alone Organization
Stand-alone SNP 21,081 68.0 18,655 17.1 169,671 26.8 15,159 18.0 224,566 26.2
Part of larger contract 9,935 32.0 90,174 82.9 462,701 73.2 69,195 82.0 632,005 73.8
Medicaid Contract Status
Medicaid contract 0 0.0 1,974 1.8 246,534 39.0 638 0.8 249,146 29.1
No Medicaid contract 31,016 100.0 106,855 98.2 376,919 59.6 83,716 99.2 598,506 69.9

TABLE II.5 (continued)
26
Institutional SNPs Institutional Equivalent SNPs Dual-Eligible SNPs Chronic condition SNPs All SNPs
Number Percent Number Percent Number Percent Number Percent Number Percent
Disproportionate Percentage
Yes 216 0.7 106,707 98.1 116,680 18.5 4,621 5.5 228,224 26.6
No 30,800 99.3 2,122 1.9 515,692 81.5 79,733 94.5 628,347 73.4
Source: CMS HMO Payment Files and Health Plan Management System (HPMS) files, 2007.
Notes: Enrollees are categorized in the type of SNP in which they were enrolled during March 2007. ―Stand-Alone‖ organization is defined as a plan that does not have other non-SNPs under the
same contract number, or under different contract numbers for the organization. Table does not include people who had SNP payment records for March 2007 but were identified by enrollment files as having died prior to March.
Sums/percents within categories may not add to the totals due to missing values of descriptive variables.

27
Table II.8 shows the configuration of SNPs that would result in 2008 if all submitted
applications are approved. While the general configuration of SNPs would change little (in terms
of measures that are available at present), nearly half of all SNPs operating in 2008 would be
new—402 of 815 plans. The three tables also show the steadily rising proportion of
disproportionate-percentage SNPs, fueled largely by the increase in chronic condition SNPs with
this feature.
As Table II.9 shows, over 80 percent of all SNP enrollees were dual-eligible in 2006. Even
among chronic condition SNPs, which were approved for the first time in 2006, 40 percent of
SNP members were enrolled in Medicaid.
As noted earlier, the CMS regulation did not restrict the type of health condition which
chronic condition SNPs might target, stating instead that applications would be reviewed on a
case-by-case basis.26
Table II.10 shows the types of conditions that chronic condition SNPs
targeted in 2006 and 2007. Diabetes, COPD, and heart failure were more frequently specified
than other health problems. About one quarter of chronic condition SNPs in 2007 defined their
target population on the basis of a single condition. Most defined their target population using
four or more conditions. Nearly all of these, however, were of the form ―condition A or
condition B.‖ Only a few chronic condition SNPs used multiple conditions to define a
particularly ill population by limiting enrollment to those with two or more conditions
simultaneously, as in ―condition A and condition B.‖ (An exception is the Evercare chronic
condition SNP operating in Massachusetts, which targets, among others, beneficiaries with four
or more conditions from a list including asthma, COPD, dementia, or others.)
Table II.11 shows SNP enrollment by largest organizations in 2006 and 2007. Overall, 10
organizations account for just over half of SNP enrollment. The situation is quite different,
however, for each of the three SNP types. Among dual-eligible SNPs, the distribution of
enrollment across the top ten organizations is relatively uniform, with the largest—Kaiser
Foundation—accounting for just under nine percent of enrollment. Among institutional SNPs,
two organizations—SCAN Health Plan and United Healthcare (which owns Evercare) account
for nearly 85 percent of enrollment. The distribution of enrollment is equally skewed for chronic
condition SNPs, where Medicare y Mucho Mas (MMM) of Puerto Rico accounts for almost 73
percent of all beneficiaries enrolled in 2007.
26
CMS officials have stated that in 2008, CMS will work with industry experts to more clearly define the types
of severe or disabling chronic conditions that might appropriately be served by SNPs.

28
TABLE II.6
SNP PLAN CHARACTERISTICS, 2006
Institutional SNPs Institutional Equivalent SNPs Dual-Eligible SNPs Chronic condition SNPs All SNPs
2006 Characteristics Number Percent Number Percent Number Percent Number Percent Number Percent
Total Plans 32 100 5 100 226 100 13 100 276 100
New vs. Existing
Existing 3 9.4 0 0.0 86 38.1 0 0.0 89 32.2
New in 2006 29 90.6 5 100.0 140 61.9 13 100.0 187 67.8
Census Region, 2006
Northeast 6 18.8 1 20.0 70 31.0 0 0.0 77 27.9
South 15 46.9 0 0.0 75 33.2 4 30.8 94 34.1
Midwest 3 9.4 4 80.0 25 11.1 3 23.1 35 12.7
West 6 18.8 0 0.0 43 19.0 5 38.5 54 19.6
Puerto Rico 2 6.3 0 0.0 13 5.8 1 7.7 16 5.8
Plan Size, as of December 2006
0 members 6 18.8 0 0.0 11 4.9 0 0.0 17 6.2
1 – 50 members 6 18.8 0 0.0 21 9.3 2 15.4 29 10.5
50 – 1,000 members 15 46.9 4 90.0 113 50.0 10 76.9 142 51.4
1,000 – 5,000 members 4 12.5 0 0.0 50 22.1 0 0.0 54 19.6
> 5,000 members 1 3.1 1 20.0 31 13.7 1 7.7 34 12.3
Tax Status
For profit 30 93.8 0 0.0 194 85.8 10 76.9 234 84.8
Not for profit 2 6.3 5 100.0 31 13.7 3 23.1 41 14.9
Organization Type
Local CCP 32 100.0 0 0.0 210 92.9 11 84.6 253 91.7
Regional CCP 0 0.0 0 0.0 3 1.3 0 0.0 3 1.1
Demonstration 0 0.0 5 100.0 13 5.8 2 15.4 20 7.2
Stand-Alone Organization
Stand-alone SNP 4 12.5 5 100.0 31 13.7 9 69.2 49 17.8
Not stand-alone 28 87.5 0 0.0 195 86.3 4 30.8 227 82.2
Disproportionate Percentage
Disproportionate 1 3.1 1 20.0 45 19.9 0 0.0 47 17.0
Exclusive 31 96.9 4 80.0 179 79.2 13 100.0 227 82.2
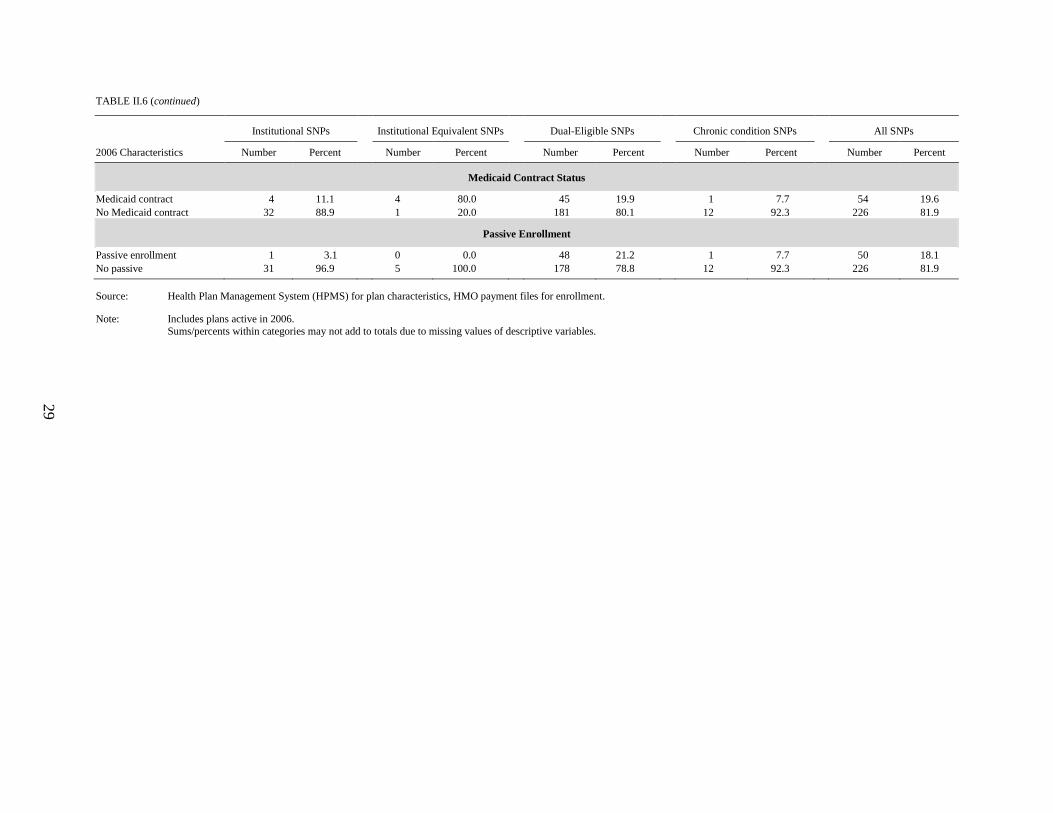
TABLE II.6 (continued)
29
Institutional SNPs Institutional Equivalent SNPs Dual-Eligible SNPs Chronic condition SNPs All SNPs
2006 Characteristics Number Percent Number Percent Number Percent Number Percent Number Percent
Medicaid Contract Status
Medicaid contract 4 11.1 4 80.0 45 19.9 1 7.7 54 19.6
No Medicaid contract 32 88.9 1 20.0 181 80.1 12 92.3 226 81.9
Passive Enrollment
Passive enrollment 1 3.1 0 0.0 48 21.2 1 7.7 50 18.1
No passive 31 96.9 5 100.0 178 78.8 12 92.3 226 81.9
Source: Health Plan Management System (HPMS) for plan characteristics, HMO payment files for enrollment.
Note: Includes plans active in 2006.
Sums/percents within categories may not add to totals due to missing values of descriptive variables.

30
TABLE II.7
SNP PLAN CHARACTERISTICS, 2007
Institutional SNPs Institutional Equivalent SNPs Dual-Eligible SNPs Chronic condition SNPs All SNPs
Number Percent Number Percent Number Percent Number Percent Number Percent
Total SNPs 70 100 14 100 323 100 84 100 491 100
New vs. Existing
Existing 30 42.9 5 35.7 182 56.3 13 15.5 230 46.8
New in 2007 40 57.1 9 64.3 141 43.7 71 84.5 261 53.2
Census Region
Northeast 19 27.1 3 21.4 75 23.2 16 19.0 113 23.0
South 30 42.9 2 14.3 117 36.2 48 57.1 197 40.1
Midwest 10 14.3 5 35.7 34 10.5 7 8.3 56 11.4
West 10 14.3 4 28.6 64 19.8 10 11.9 88 17.9
Puerto Rico 1 1.4 0 0.0 33 10.2 3 3.6 37 7.5
Plan Size, as of March 2007
0 members 20 28.6 0 0.0 24 7.4 11 13.1 55 11.2
1 – 50 members 19 27.1 4 28.6 51 15.8 22 26.2 96 19.6
50 – 1,000 members 22 31.4 5 35.7 156 48.3 45 53.6 228 46.4
1,000 – 5,000 members 8 11.4 0 0.0 59 18.3 5 6.0 72 14.7
> 5,000 members 1 1.4 5 35.7 33 10.2 1 1.2 40 8.1
Tax Status
For profit 64 82.1 5 82.1 265 82.0 75 89.3 409 83.3
Not for profit 6 17.9 9 17.9 56 17.3 9 10.7 80 16.3
Organization Type
Local CCP 69 98.6 0 0.0 307 95.0 45 53.6 421 85.7
Regional CCP 0 0.0 0 0.0 3 0.9 27 32.1 30 6.1
Demonstration 1 1.4 14 100.0 13 4.0 12 14.3 40 8.1

TABLE II.7 (continued)
31
Institutional SNPs Institutional Equivalent SNPs Dual-Eligible SNPs Chronic condition SNPs All SNPs
Number Percent Number Percent Number Percent Number Percent Number Percent
Stand-Alone Organization
Stand-alone SNP 8 11.4 9 64.3 60 18.6 43 51.2 120 24.4
Part of larger contract 62 88.6 5 35.7 263 81.4 41 48.8 371 75.6
Disproportionate Percentage
Disproportionate 2 2.9 7 50.0 67 20.7 20 23.8 96 19.6
Exclusive 68 97.1 7 50.0 245 75.9 64 76.2 384 78.2
Medicaid Contract Status
Medicaid contract 0 0.0 4 28.6 44 13.6 1 1.2 49 10.0
No Medicaid contract 70 100.0 10 71.4 270 83.6 83 98.8 433 88.2
Source: Health Plan Management System (HPMS) for plan characteristics, HMO payment files for enrollment.
Note: Includes plans active in 2007.
Sums/percents within categories may not add to totals due to missing values of descriptive variables.

32
TABLE II.8
SNP PLAN CHARACTERISTICS, 2008 (APPLICATIONS)
Institutional SNPs Institutional Equivalent SNPs Dual-Eligible SNPs Chronic condition SNPs All SNPs
Number Percent Number Percent Number Percent Number Percent Number Percent
Total SNPs 75 100 15 100 461 100 264 100 815 100
New vs. Existing
Existing 50 66.7 12 80.0 277 60.1 74 28.0 413 50.7
New in 2008 25 33.3 3 20.0 184 39.9 190 72.0 402 49.3
Census Region
Northeast 21 28.0 2 13.3 90 19.5 25 9.5 138 16.9
South 27 36.0 7 46.7 158 34.3 140 53.0 332 40.7
Midwest 12 16.0 2 13.3 66 14.3 38 14.4 118 14.5
West 14 18.7 4 26.7 86 18.7 42 15.9 146 17.9
Puerto Rico 1 1.3 0 0.0 40 8.7 9 3.4 50 6.1
Missing 0 0.0 0 0.0 21 4.6 10 3.8 31 3.8
Organization Type
Local CCP 73 97.3 10 66.7 458 99.3 208 78.8 749 91.9
Regional CCP 1 1.3 0 0.0 3 0.7 43 16.3 47 5.8
Demonstration 1 1.3 5 33.3 0 0.0 13 4.9 19 2.3
Disproportionate Percentage
Disproportionate 6 8.0 5 33.3 95 20.6 74 28.0 180 22.1
Exclusive 69 92.0 10 66.7 366 79.4 190 72.0 635 77.9
Source: 2008 SNP Application File.
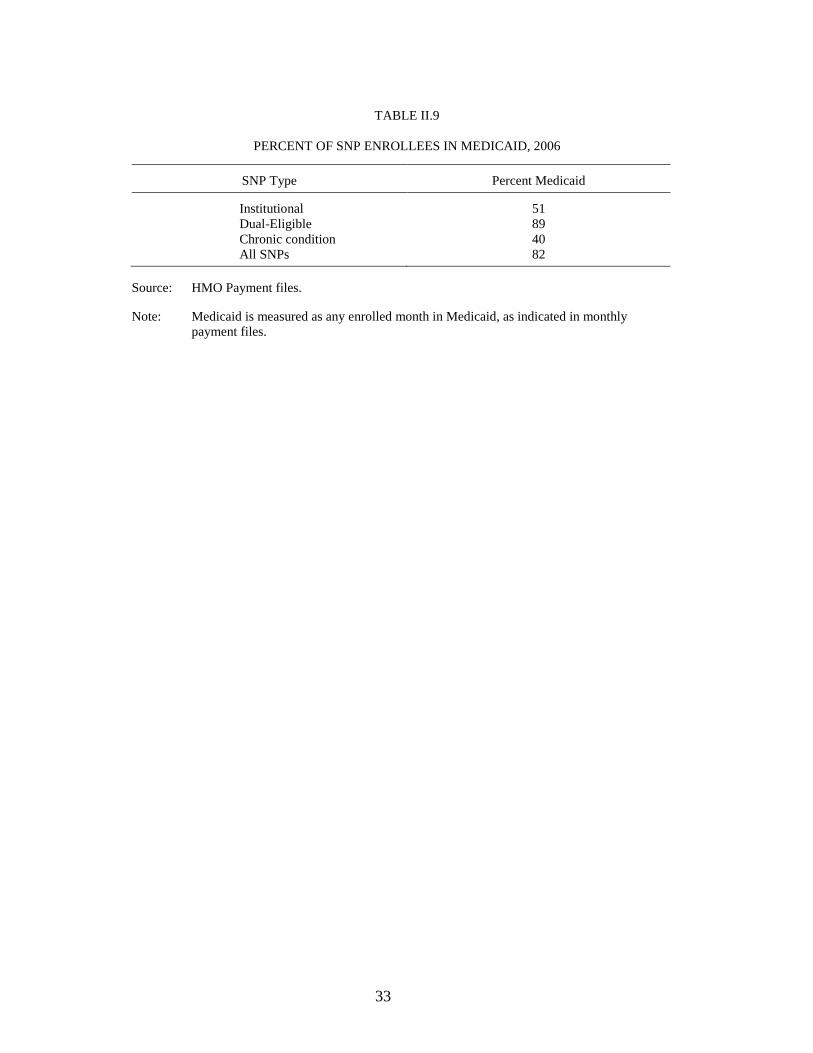
33
TABLE II.9
PERCENT OF SNP ENROLLEES IN MEDICAID, 2006
SNP Type Percent Medicaid
Institutional 51
Dual-Eligible 89
Chronic condition 40
All SNPs 82
Source: HMO Payment files.
Note: Medicaid is measured as any enrolled month in Medicaid, as indicated in monthly
payment files.

34
TABLE II.10
CONDITIONS TARGETED BY CHRONIC CONDITION SNPS, 2006 AND 2007
Number of SNPs Targeting Condition in:
Condition 2006 2007
Diabetes a 7 72
Heart failure b 10 62
Chronic obstructive pulmonary disease 8 60
Chronic kidney disease c 8 44
Coronary artery disease d 9 35
Asthma 0 17
Dementia 0 14
Psychiatric disorders e 2 13
Hypertension 1 13
Prior cardiac events 3 9
Peripheral vascular disease 3 9
Arthritis 0 4
Ischemic stroke 1 3
Neurological conditions 0 3
HIV 1 1
Cancer 1 1
Hypercholesterolemia 0 1
Obesity 0 1
Plans targeting one condition 3 20
Plans targeting two conditions 1 1
Plans targeting three conditions 2 3
Plans targeting four or more conditions 7 60
Notes: There were 13 total CDC SNPs in 2006 and 84 in 2007. Most plans cover more than
one disease.
aIncludes retinopathy, diabetes, and peripheral neuropathy.
bIncludes ‗advanced heart failure‘.
cIncludes end-stage renal disease (ESRD), ‗pre-ESRD‘, ‗renal disease‘, ‗renal failure‘, ‗post
transplant kidney transplant‘.
dIncludes ‗cardiovascular disease,‘ ‗chronic cardiomyopathy,‘ and ‗chronic heart disease.‘
eIncludes depression and ‗severely mentally ill‘.

35
TABLE II.11
SNP ENROLLMENT IN TOP 10 ORGANIZATIONS, BY TYPE
Organization
Enrollment
(Dec 2006)
Percent of
Total Organization
Enrollment
(Mar 2007)
Percent of
Total
All SNPs 635,570 100.0 All SNPs 856,571 100.0
Top 10 SNPs 362,739 57.1 Top 10 SNPs 485,605 56.7
MMM Healthcare, Inc. 99,151 15.6 MMM Healthcare, Inc. 93,101 10.9
United Healthcare 51,073 8.0 Scan Health Plan 90,514 10.6
MCS Life Insurance Company 37,181 5.9 United Healthcare 68,954 8.1
Preferred Medicare Choice, Inc. 31,756 5.0 Kaiser Foundation HP 54,836 6.4
Gateway Health Plan, Inc. 25,672 4.0 MCS Life Insurance Company 41,706 4.9
Healthspring, Inc. 25,566 4.0 Preferred Medicare Choice, Inc. 29,937 3.5
Keystone Health Plan 25,288 4.0 Humana 29,674 3.5
Managed Health, Inc. 24,495 3.9 Healthspring, Inc. 26,157 3.1
Humana 23,011 3.6 Managed Health, Inc. 25,419 3.0
Pacificare 19,546 3.1 Keystone Health Plan 25,307 3.0
All Dual-Eligible SNPs 525,134 100.0 All Dual-Eligible SNPs 632,372 100.0
Dual-Eligible SNPs - Top 10 274,546 52.3 Dual-Eligible SNPs - Top 10 326,203 51.6
MCS Life Insurance Company 37,181 7.1 Kaiser Foundation HP 54,836 8.7
United Healthcare 32,229 6.1 MCS Life Insurance Company 41,706 6.6
Preferred Medicare Choice, Inc. 31,667 6.0 United Healthcare 36,348 5.7
MMM Healthcare, Inc. 29,895 5.7 MMM Healthcare, Inc.. 31,875 5.0
Gateway Health Plan, Inc. 25,672 4.9 Preferred Medicare Choice, Inc. 29,760 4.7
Healthspring, Inc. 25,562 4.9 Humana 29,674 4.7
Keystone Health Plan 25,288 4.8 Healthspring, Inc. 26,153 4.1
Managed Health, Inc. 24,495 4.7 Managed Health, Inc. 25,419 4.0
Humana 23,011 4.4 Keystone Health Plan 25,307 4.0
Pacificare 19,546 3.7 Gateway Health Plan, Inc. 25,125 4.0
All Institutional SNPs 38,511 100.0 All Institutional SNPs 139,845 100.0
Institutional SNPs - Top 10 38,554 100.0 Institutional SNPs - Top 10 139,299 99.6
United Healthcare 18,760 48.7 Scan Health Plan 90,008 64.4
ElderPlan, Inc. - SHMO 16,471 42.8 United Healthcare 28,318 20.2
Fidelis Securecare 1,115 2.9 Elderplan, Inc. - SHMO 16,683 11.9
Partnercare Health Plan, Inc. 821 2.1 Fidelis Securecare 1,318 0.9
Elder Care Health Plan Inc. 575 1.5 Partnercare Health Plan, Inc. 1,143 0.8
Selectcare 235 0.6 Elder Care Health Plan, Inc. 591 0.4
Community Care Health Plan, Inc. 235 0.6 Independent Health Association, Inc. 509 0.4
Health Plan for Community Living,
Inc. 191 0.5
Oxford Health Plans 260 0.2
Preferred Medicare Choice, Inc. 89 0.2
Health Plan for Community Living,
Inc. 236 0.2
Elderplan, Inc. 62 0.2 Community Care Health Plan, Inc. 233 0.2
All Chronic condition SNPs 71,925 100.0 All Chronic condition SNPs 84,354 100.0
Chronic condition SNPs - Top 10 71,917 100.0 Chronic condition SNPs - Top 10 82,984 98.4
MMM Healthcare, Inc. 69,256 96.3 MMM Healthcare, Inc. 61,226 72.6
AIDS Healthcare Foundation 580 0.8 Care Improvement Plus 9,544 11.3

TABLE II.11 (continued)
36
Organization
Enrollment
(Dec 2006)
Percent of
Total Organization
Enrollment
(Mar 2007)
Percent of
Total
Care Improvement Associates of MD 473 0.7 United Healthcare 4,288 5.1
Universal Care 438 0.6 Cariten Health Plan Inc 2,001 2.4
Scan Health Plan 249 0.3 SD State Medical Holding Company 1,990 2.4
SD State Medical Holding Company 239 0.3 Care Improvement Associates of MD 1,289 1.5
Health Net 228 0.3 Group Health Plan, Inc. 952 1.1
Sun Health Medisun, Inc. 192 0.3 AIDS Healthcare Foundation 638 0.8
Aveta 178 0.2 Universal Care 614 0.7
United Healthcare Insurance Company 84 0.1 American Health, Inc. 442 0.5
Source: CMS HMO Payment Files, 2006-2007.
Note: Organizations are grouped by main SNP contract holders, across States.

37
C. SUMMARY
The number of SNPs has increased rapidly, from 137 in 2005 to 491 in 2007. In 2008, there
could be over 800 approved SNPs. As of March 2007, dual-eligible SNPs accounted for two
thirds of all SNPs and about 74 percent of total SNP enrollment. The concentration of enrollment
in particular organizations varies by type of SNP. The largest dual-eligible SNP is operated by
the Kaiser Foundation and accounted for nine percent of SNP enrollment in dual-eligible plans in
2007. By contrast, 73 percent of enrollees in a chronic condition SNP in 2007 were enrolled in
plans offered by Medicare y Mucho Mas of Puerto Rico.
The way in which beneficiaries entered SNPs also differed sharply by type of SNP. Most
beneficiaries entering dual-eligible and chronic condition SNPs in 2007 appeared to have
actively enrolled. Over three quarters of those entering an institutional SNP were members of
redesignated plans (many of those were enrolled in SCAN Health Plan). A substantial number of
new enrollees to dual-eligible SNPs in 2007 were transferred from other plans operated by the
same organization. Whether this pattern of varying modes of entry to SNP will continue in 2008
is impossible to determine at this point. While disenrollment rates varied by type of SNP, they
did not vary substantially by mode of entry into the SNP.
Nearly 60 percent of dual-eligible SNP members are enrolled in plans with no Medicaid
contract. For institutional and chronic condition SNPs, the proportion is under 2 percent.
Enrollment in disproportionate-percentage SNPs varies from less than 6 percent of chronic
condition SNP enrollees to over 76 percent of enrollees in institutional SNPs.

38
III. RESULTS FROM A SURVEY OF SNPS
A. BACKGROUND AND METHODS
To collect uniform information about their structure and operation, a mail survey of SNPs
was conducted between March and May 2007. The survey questionnaire asked about their
population, relationships with providers, member screening and assessment, services offered,
relationship with Medicaid, and pharmacy benefits. Because many organizations offered a
number of distinct SNPs that appeared to be centrally managed, we sent one questionnaire to
each contact person listed in the CMS Health Plan Management System for each organization,
State, and SNP type. Questionnaires were therefore sent to 193 plans that appeared to constitute
distinct SNPs. SNPs that did not return the questionnaire by May were called and asked to
complete the questionnaire by telephone. All SNPs reporting that they were not operating or that
they had no members were declared ineligible. The disposition of this sample is shown below.
TABLE III.1
SURVEY DISPOSITION
Institutional Dual-Eligible
Chronic
Condition Total
Questionnaires mailed 34 147 12 193
Number ineligible 2 9 0 11
Number complete 27 108 10 145
Response rate 84% 78% 83% 80%
Note: Response rate is computed as (number complete) (number mailed-number ineligible).
Because the population of SNPs is so heavily skewed toward dual-eligible plans, it is
difficult to make reliable statements about differences across the three plan types. Such
differences will be noted below when they appear informative, but must be interpreted with
caution. Table III.2 presents broad characteristics of survey respondents. Among dual-eligible
SNPs that responded to the survey, 69 percent served full dual eligibles only; these 75 SNPs
constituted more than half the respondent sample. Of the 21 institutional SNPs that provided
information about their target population, all but one served permanent nursing-home residents.
Only five served institutional-equivalent community residents. Among chronic condition SNPs
that responded, most provided care for heart failure or other cardiovascular disease. More than
half of the dual-eligible and institutional SNPs had more than 1,000 members. Chronic condition
SNPs were smaller—7 of 10 respondents had fewer than 1,000 members.
B. RESULTS
Most SNPs Provide Medicare-Covered Services Only. Roughly one-third of SNPs who
enrolled dual-eligible beneficiaries held any type of contract with Medicaid in their State. Even

39
among dual-eligible SNPs, only 37 percent (40 of 108 respondent SNPs) held a Medicaid
contract in 2006 (See Table III.3). Most of those who did hold a Medicaid contract entered into a
capitation arrangement that placed them at financial risk for the cost of services. Only about half
of the contracts explicitly covered cost sharing (coinsurance and deductibles) for Medicare
services provided to dual eligibles.
Most respondents indicated that their Medicaid contracts covered more than simple wrap-
around services. Most covered nursing-home care, prescription drugs not covered under
Medicare Part D, and behavioral health services. Fewer than half covered community services
provided under Medicaid waivers.
Nearly three quarters of dual-eligible plans that did not hold a Medicaid contract stated they
planned to seek one in the future. Some, however, pointed to the difficulty of maintaining
capitation contracts with both Medicare and Medicaid for care of dual eligibles. When asked in
an open-ended question to describe the difficulty of contracting with Medicaid, respondents
referred, for example, to ―two regulatory bodies or complex dual (state and federal) requirements
that sometimes conflict,‖ and the ―difficulty coordinating timing of different state and federal
fiscal years.‖ Because of the open-ended nature of the question, it was not possible to quantify
the extent to which these responses were representative of all plans.
Risk-Sharing Arrangements and Financial Incentives for Providers Are Common. Financial arrangements with providers are shown in Table III.4. About 70 percent of SNPs (100
of 145 respondents) had instituted some form of financial risk sharing with health care providers.
Risk-sharing arrangements were much more common for primary-care physicians than for any
other type of provider. A somewhat smaller number offered financial incentives of some kind for
performance against a non-financial benchmark. Again, these arrangements were typically made
with primary care providers and, in the case of dual-eligible and institutional SNPs, with skilled
nursing facilities.
Only a handful—9 of 145 responding plans—reported that they managed their own
pharmacy benefit. All others had some type of arrangement with a pharmacy benefits manager.
None had risk-sharing contracts with the benefits manager.
Most SNPs Assess the Needs of New Members at Enrollment. The majority of SNPs
conduct some type of risk assessment at enrollment (Table III.5). Among survey respondents,
institutional and chronic-condition SNPs were more likely than dual-eligible plans to carry out
the assessment using clinical staff. Dual-eligible plans were also more likely to report using a
self-administered screening instrument.
Nearly all SNPs reported conducting a comprehensive assessment of members identified as
at high-risk during the initial assessment. The mean percentage of members so identified varied
from 43 percent among dual-eligible SNPs to 92 percent for institutional SNPs. About three
quarters of survey respondents (including 34 of the 37 institutional and chronic- condition
respondents) said that all their members were at high risk.
SNPs Provided an Array of Special Services to Members. All SNPs reported that they
furnished care coordination services and nearly all reported providing disease management

40
(Table III.6). Almost all provided disease management for heart disease, diabetes, and chronic
lung conditions. About half provided disease management for severe physical disability or
mental illness. Institutional and chronic care SNPs reported that 80 percent or more of their
members received disease management. Dual-eligible SNPs reported, on average, that 32 percent
received disease management and 43 percent received care coordination.
SNPs reported that they furnished a variety of special services to their members. Most
offered medical transportation, education and support groups, medication management, alcohol
and drug abuse services and end-of-life care. Smaller numbers provided caregiver support,
consumable supplies, or special programs for people with dementia. While numbers are small
and perhaps therefore unreliable, institutional SNPs tended to be more likely than dual-eligible
and chronic-condition SNPs to provide special services.
C. SUMMARY
Survey responses indicated that most SNPs enroll a disproportionate number of beneficiaries
at high risk for adverse health outcomes. The average proportions at high risk as judged by the
SNPs themselves varied from 43 to 92 percent. Most carry out an assessment of care needs at the
time of enrollment, though dual-eligible SNPs were substantially less likely than institutional and
chronic-condition SNPs to use clinical staff for this purpose. In keeping with the high-risk nature
of their enrollees, all survey respondents said they provided care coordination and nearly all
provided disease management as well. Though not explicitly required to do so, nearly all SNPs
provided other special services such as medical transportation, pain management, and medication
management.
That less than half of SNPs—even dual-eligible SNPs—reported holding Medicaid contracts
is of interest. As noted earlier, there is little evidence and perhaps weak rationale for benefits
associated with special needs plans for dual eligibles if the plan manages only Medicare-funded
services. Nonetheless, the professed desire of three quarters of dual-eligible and institutional
SNPs to enter into Medicaid contracts, combined with anecdotal evidence that such contracts can
require some time to complete, provide reasonable hope that more SNPs will manage both
Medicare and Medicaid services in the future.

41
TABLE III.2
TYPE OF ORGANIZATION AND TARGET POPULATION
(Number, Unless Noted)
Dual-Eligible
SNPs
Institutional
SNPs
Chronic
Condition
SNPs All SNPs
Target Population by Plan Type
Dual Eligible SNP
Full dual eligibles 75 -- -- 75
All dual eligibles 33 -- -- 33
Institutional SNPa
Permanent nursing home residents -- 20 -- 20
Residents in intermediate care facilities for people
with mental retardation -- 0 -- 0
NHC assisted/independent living facility residents -- 5 -- 5
NHC senior/retirement community residents -- 4 -- 4
NHC community residents -- 5 -- 5
Other -- 1 -- 1
Chronic or Disabling SNPa
Heart failure or other heart disease (not CAD) -- -- 5 5
CAD or other cardiovascular disease -- -- 3 3
COPD -- -- 2 2
Diabetes -- -- 2 2
Serious mental illness -- -- 2 2
Physical disability -- -- 0 0
Other -- -- 5 5
Mean number of chronic or disabling conditions -- -- 1 1
Enrollment
Current Enrollment
1-50 8 2 1 11
51-1,000 45 12 6 63
1,001-5,000 28 6 2 36
Over 5,000 27 7 1 35
Number of Survey Respondents 108 27 10 145
Source: Mail survey of SNPs active in 2006, administered between March and May 2007.
aMay sum to more than total because respondents could indicate more than one category.
NHC = nursing home certifiable;
CAD = coronary artery disease;
COPD = chronic obstructive pulmonary disease.

42
TABLE III.3
MEDICAID SERVICES
(Number of Plans)
Dual-Eligible
SNPs
Institutional
SNPs
Chronic
Condition
SNPs
All
SNPs
Has Medicaid Contract 40 5 1 46
If SNP has Medicaid contract, receives capitation payment 36 5 1 42
If SNP has capitation payment, includes Medicare cost
sharing 20 3 0 23
Services Covered Under Medicaid Contract and/or
Capitation Payment
Nursing home care 26 5 1 32
Home and Community Based Waiver Services 19 5 1 25
Drugs not covered under Medicare Part D 31 5 1 37
Behavioral health care 26 5 0 31
Other 23 4 1 28
If SNP has no Medicaid contract, plans to seek Medicaid
contract in future 50 15 2 67
Major disadvantages of having Medicaid contract
Conflicting Medicare/Medicaid regulations 59 18 3 80
Difficulties with marketing materials and delays in
approval process 16 0 0 16
States view integration as a way to subsidize Medicaid
services with Medicare dollars 12 0 0 12
Number of Survey Respondents 108 26 8 142
Source: Mail survey of 2006 SNPs active in 2006, administered between March and May 2007.
Note: Presents information from 142 SNPs that reported enrolling dual-eligible beneficiaries. Three SNPs
reported that they enrolled no dual-eligible beneficiaries.

43
TABLE III.4
PROVIDER ARRANGEMENTS
(Number of Plans)
Dual-Eligible
SNPs
Institutional
SNPs
Chronic
Condition
SNPs All SNPs
Plans with risk-sharing contracts with providers 75 21 4 100
Types of providers with risk-sharing contracts
Primary care providers 67 21 4 92
Hospitals 5 0 2 7
Other 2 0 0 2
Types of risk-sharing arrangements
Capitation 8 0 1 9
Percentage withheld 5 16 0 21
Other 62 5 3 70
Plans with financial incentives for providers (for
improving performance, quality of care, or member
outcomes)a
60 21 5 86
Types of providers who are offered financial incentives
Primary care providers 56 21 2 79
Hospitals 3 0 0 3
Skilled nursing facilities 39 14 0 53
Other 3 0 1 4
Types of financial incentives
Pay for performance 50 0 0 50
Other 10 21 5 36
Plan pharmacy benefit
Self-administers benefit 7 0 2 9
Pharmacy benefits manager administers benefit 101 27 8 136
If uses pharmacy benefits manager, number with risk-
sharing contract 0 0 0 0
Number of Survey Respondents 108 27 10 145
Source: Mail survey of SNPs active in 2006, administered between March and May 2007.
aFinancial incentives are any partial withholding of payments from or any additional payments to providers (other
than risk-sharing arrangements) that are based on non-financial performance.

44
TABLE III.5
IDENTIFICATION OF MEMBERS WHO NEED SPECIAL SERVICES
Percentage (Unless Noted)
Dual-Eligible
SNPs
Institutional
SNPs
Chronic
Condition
SNPs
All
SNPs
All members need special services 69 89 100 75
All members assessed for risk at enrollment using:a
Risk screening survey administered at enrollment by
non-clinical plan staff 58 15 50 49
Risk screening survey administered at enrollment by
clinical plan staff 27 96 60 42
Self-administered risk screening survey administered
at enrollment 65 11 30 52
Referral for special services by member‘s primary
care provider at enrollment 65 67 50 65
Member risk level monitored over time using:a
Automated alerts based on electronic patient records 49 11 50 42
Regular manual review of electronic records or
hardcopy patient charts 68 74 60 68
Referral for special services by member‘s primary
care provider 82 74 40 77
Regular reassessment by primary care provider or
SNP clinical staff 86 100 90 89
Regular administration (or re-administration) of
screening survey 63 89 50 67
Following risk assessment, conducts comprehensive
assessment 92 100 90 93
Uses other processes to identify members in need of
special services 70 74 60 70
If comprehensive assessment conducted for high risk
members, mean percentage of membership identified as
high risk 43 95 87 55
Number of Survey Respondents 108 27 10 145
Source: Mail survey of SNPs active in 2006, administered between March and May 2007.
a Category sums to more than 100 percent because respondents could mark more than one category.
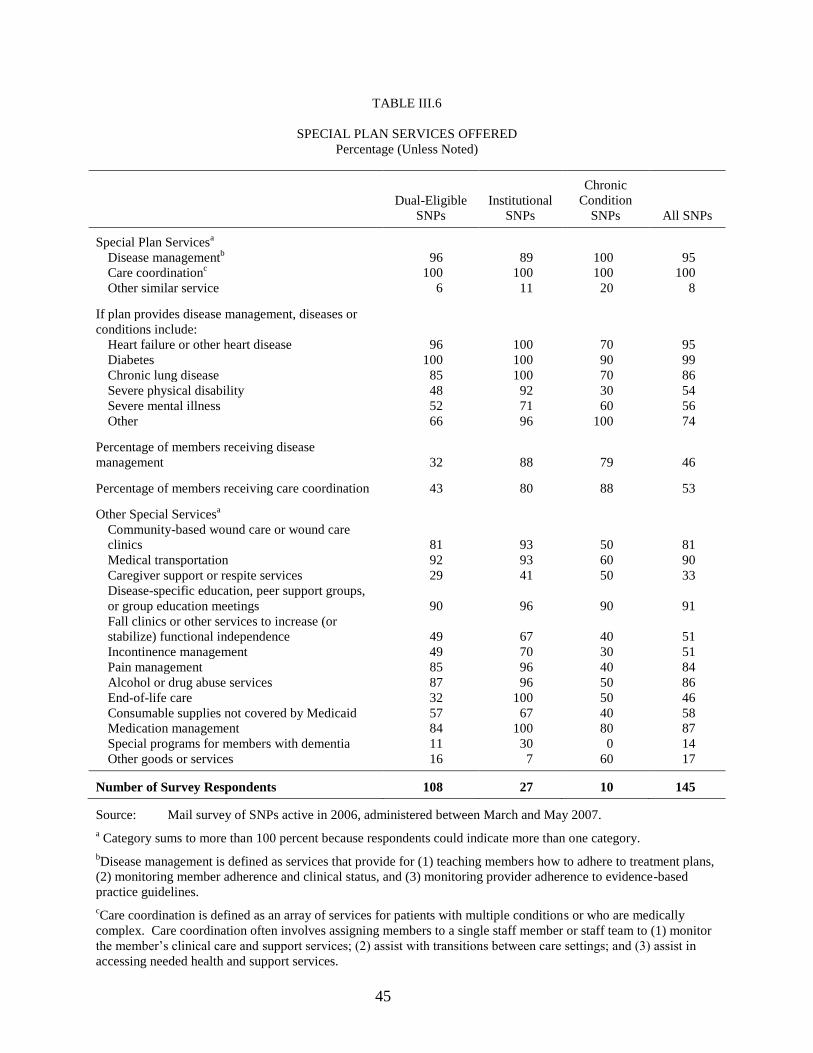
45
TABLE III.6
SPECIAL PLAN SERVICES OFFERED
Percentage (Unless Noted)
Dual-Eligible
SNPs
Institutional
SNPs
Chronic
Condition
SNPs All SNPs
Special Plan Servicesa
Disease managementb
96 89 100 95
Care coordinationc 100 100 100 100
Other similar service 6 11 20 8
If plan provides disease management, diseases or
conditions include:
Heart failure or other heart disease 96 100 70 95
Diabetes 100 100 90 99
Chronic lung disease 85 100 70 86
Severe physical disability 48 92 30 54
Severe mental illness 52 71 60 56
Other 66 96 100 74
Percentage of members receiving disease
management 32 88 79 46
Percentage of members receiving care coordination 43 80 88 53
Other Special Servicesa
Community-based wound care or wound care
clinics 81 93 50 81
Medical transportation 92 93 60 90
Caregiver support or respite services 29 41 50 33
Disease-specific education, peer support groups,
or group education meetings 90 96 90 91
Fall clinics or other services to increase (or
stabilize) functional independence 49 67 40 51
Incontinence management 49 70 30 51
Pain management 85 96 40 84
Alcohol or drug abuse services 87 96 50 86
End-of-life care 32 100 50 46
Consumable supplies not covered by Medicaid 57 67 40 58
Medication management 84 100 80 87
Special programs for members with dementia 11 30 0 14
Other goods or services 16 7 60 17
Number of Survey Respondents 108 27 10 145
Source: Mail survey of SNPs active in 2006, administered between March and May 2007.
a Category sums to more than 100 percent because respondents could indicate more than one category.
bDisease management is defined as services that provide for (1) teaching members how to adhere to treatment plans,
(2) monitoring member adherence and clinical status, and (3) monitoring provider adherence to evidence-based
practice guidelines.
cCare coordination is defined as an array of services for patients with multiple conditions or who are medically
complex. Care coordination often involves assigning members to a single staff member or staff team to (1) monitor
the member‘s clinical care and support services; (2) assist with transitions between care settings; and (3) assist in
accessing needed health and support services.

46
IV. PLAN OPERATIONS AND ENROLLEE INTERVENTIONS: FINDINGS FROM
VISITS AND FOCUS GROUPS FOR SELECTED PLANS
While the MMA specified that SNPs target three groups of beneficiaries—dual eligibles,
nursing home eligibles and residents, and those with severe and disabling conditions—it did not
require that plans include any particular interventions or make other arrangements to meet
enrollees‘ special needs beyond those that apply to all Medicare Advantage plans. This chapter
(1) describes how SNPs chose to address enrollees‘ special needs, and (2) assesses the likelihood
that those efforts will improve enrollee health.
The evaluation looked for three broad areas to determine what made plans ―special‖: the
level of coordination with Medicaid, the provision of special services, and the adaptation of
services to individual needs. To provide insight into how plans performed in each of these areas,
the evaluation visited staff of selected plans and conducted focus groups with plan enrollees
(Table IV.1). Four corporate parent organizations offering multiple, but similar, plans and 10
individual plans were selected for site visits.27
The visits were conducted by teams of two people
who used a basic discussion guide that was developed for the evaluation and adapted for each
plan; each visit took one full business day.
For simplicity of exposition, this section refers to ―13 visited plans,‖ which includes 8
individual plans visited, 2 individual Evercare plans visited (incorporating information from the
visit with corporate Evercare staff), and the 3 other corporate parent organizations visited (each
of which operated multiple, but similar, plans).
With the goal of gaining the enrollee perspective on plan implementation, the evaluation
conducted focus groups between February and April 2007 with enrollees of the 10 visited
individual plans. Overall, 93 SNP enrollees participated. Groups were conducted by
experienced moderators who were briefed in advance by site visitors about plan features and who
used guides developed for the evaluation to organize participant discussions. Sessions focused
on (1) enrollee awareness and use of plan services, and (2) satisfaction with the enrollment
process and plan services.
27
In 2006, the four visited corporate parent organizations, HealthSpring, Molina, United Healthcare/Evercare,
and Wellcare, operated 12, 4, 65, and 69 plans, respectively (for a total of 150). Staff from each corporate
organization reported that the procedures and interventions provided under all their plans were similar in most
respects. Thus, this chapter describes each corporate organization as if it offered a single plan, noting any important
differences across its plans. In addition to Evercare‘s corporate organization, site visits also included two individual
Evercare plans (one dual-eligible plan and one institutional plan).

47
TABLE IV.1
LOCATION AND DATES OF SITE VISITS
Visited Plan (abbreviation in tables, if used) Individual or Corporate Date of Visit Location of Visit Focus Group Conducted
CalOptima Individual (D) April 2006 Orange, CA √ Evercare Individual (D and I) June 2006 Phoenix, AZ √√ Cariten Individual (D) November 2006 Knoxville, KY √ Molina Corporate (D) November 2006 Midvale, UT Colorado Access (CO Access) Individual (D) December 2006 Denver, CO √ CareOregon (CareOR) Individual (D) December 2006 Portland, OR √ Health Partners (HealthPtr) Individual (D) December 2006 Philadelphia, PA √ Evercarea Corporate (D and I) January 2007 Minnetonka, MN HeartLine Plus (HrtLine+) Individual (C) January 2007 Eatontown, NJ √ HealthSpring (HealthSpr) Corporate (D) January 2007 Nashville, TN Medicare y Mucho Mas (MMM) Individual (D and C) February 2007 San Juan, PR √√ Wellcare Corporate (D) February 2007 Tampa, FL
D = dual-eligible SNP; C = chronic and disabling condition SNP; I = institutional SNP.
√√ means focus groups were conducted with enrollees of each type of SNP visited. aInformation from the visit with Evercare corporate staff is integrated into the description of its two individual plans.
A. COORDINATION WITH MEDICAID
An arrangement with State Medicaid programs that renders SNPs in some way responsible
for the cost or coordination of Medicaid services for their enrollees could benefit plans that serve
dual-eligible beneficiaries (which includes plans targeting any of the three groups, but especially
the dual-eligible SNPs). A capitated contract could potentially include all Medicaid services,
including regular State plan services that ―wrap around‖ Medicare (such as vision, dental,
medical transportation, and other acute or behavioral health services that extend beyond those
provided by Medicare); institutional and community-based long-term care; and drugs excluded
under Medicare Part D. Having a capitated contract covering all these services would eliminate
incentives to make care decisions based on payer and might give plans more leverage over
service providers, thus improving enrollee access to Medicaid-covered services.
Few plans had capitated contracts that included all (or almost all) Medicaid-covered services
(Table IV.2). Only two plans did; they were both in Arizona, a State with a long history of
managed long-term care. A third plan, whose sponsor was the County Organized Health System
administering Medicaid for its SNP‘s service area, had a Medicaid contract that included most
services but excluded institutional long-term care, personal care, and adult day health care.
Three other plans had capitated contracts just for wraparound services. One of the visited
corporate sponsors had capitated contracts with three of the four States in which it operated
SNPs; only one of those three included long-term care, and then only for SNP enrollees who
were also part of a Medicaid integration demonstration. Plan staff noted that most States seem
reluctant to enter into capitated contracts with privately held companies. Even those willing to
do so faced the key difficulty of having to negotiate with plans for payment rates for long-term
care.

48
Nevertheless, staff from several plans with Medicaid contracts noted the importance of
having information about services received in both the Medicare and the Medicaid programs and
of having the ability to intervene effectively, when the need arose, with both Medicare and
Medicaid providers. In addition, concentrating enrollees with special needs into a single plan
seemed to cause staff to focus on the depth of those needs more than when such enrollees were a
minority in regular plans. Perhaps most telling was the surprise at the high proportions of SNP
enrollees whose behavioral health problems and physical disabilities were noted by staff from
plans whose sponsors previously had served the same people with their Medicaid or Medicare
managed care products.
B. PROVISION OF SPECIAL SERVICES
In authorizing SNPs, Congress intended to provide MA plans with the explicit opportunity
to serve beneficiaries known to have complex health care and health-related needs. Over the past
decade, care coordination and disease management have been recognized as important tools for
caring for such patients. However, there is little reliable evidence indicating precisely what these
tools should entail, and rigorous evaluations of their effectiveness have produced mixed results
(see, for example, Brown et al. 2007 and Congressional Budget Office 2004). Nevertheless, the
literature suggests that care coordination and disease management interventions that have
achieved some measure of operational success share some basic features (Chen et al. 2000).
They begin with a multifaceted assessment that results in a written care plan for monitoring
patient progress to specific goals, and they include ongoing patient education that not only
provides factual information but also teaches techniques for making needed lifestyle changes and
improving self-management. They also include structures and procedures for reducing
fragmentation of care, for example, by improving communication across providers, managing
transitions across care settings, identifying and addressing medication problems, and increasing
access to health-related support services. Finally, staff must be highly trained and the providers
actively involved, and efforts must include providing periodic feedback so that interventions not
having the desired effect can be modified.
A few of the visited plans had developed other special services not covered by the Medicare
and Medicaid programs, such as fall clinics or efforts to manage pain or incontinence. Some had
adapted their Part D pharmacy benefits to the plans‘ target populations either by establishing
formularies that specifically included medications recommended for conditions common among
their target populations or by reducing enrollee cost sharing.
All the visited plans offered care coordination and disease management; most offered it only
to enrollees determined to be ―high risk‖ according to the plan‘s risk-assessment tool, a review of
claims data, physician referral, or some combination of the three.28,29
Staff at some plans
28
Care coordination refers to an array of services for people who have multiple medical or behavioral health
conditions or who are medically complex. It often involves assigning a person to a single staff member or team
(1) to monitor the person‘s clinical care and support services, (2) to assist with transitions between care settings,
and (3) to help the person access needed health and support services.

49
estimated that 5 to 10 percent of enrollees received care coordination at any given time. Some
plans provided disease management as an education-focused component of a more holistic care
coordination effort. Others viewed it as a discrete, disease-specific intervention; staff of those
plans reported that between 15 and 35 percent of enrollees used the service, although all
enrollees of the two visited chronic-condition SNPs were considered to need disease
management, at least for their target conditions.30
Care coordination was conducted primarily by nurses and social workers directly employed
by the plans. Disease management was conducted by plan nurses for most of the visited plans;
two plans contracted this service out to a disease management vendor. Most plans required that
nurses be registered nurses; only the institutional SNP required that they be nurse practitioners.
A number of plans included social workers in their care coordination teams to address enrollees‘
psychosocial problems and support service needs. Some plans also either used multidisciplinary
care coordination teams or had other in-house staff to consult with care coordinators when
specific enrollee problems arose. These staff most frequently were pharmacists or behavioral
health practitioners.
All visited plans conducted a comprehensive assessment of enrollees identified as eligible
for care coordination or disease management services and developed care plans to guide staff
interventions with the enrollees. The assessment was most commonly conducted by telephone;
few plans conducted them in person. All developed enrollee care plans based on the
assessments, updating them regularly or following a hospitalization or other acute episode.
Plan staff regularly monitored enrollees receiving care coordination or disease management;
such monitoring was almost exclusively by telephone, although all enrollees of the institutional
SNP were routinely monitored in person. None of the plans reported much use of home
telemonitoring equipment (to electronically apprise staff of symptoms, weights, or other
indicators). While such equipment has not been shown unequivocally to improve patient health,
at a minimum it provides quick feedback on changes in clinical indicators that could signal an
acute exacerbation of a chronic illness (Moreno et al. 2007). Further, if a regular reading is
missed, it could provide the most timely indication that the enrollee had been hospitalized.
(continued) 29
Disease management includes services that (1) teach people how to adhere to treatment plans, (2) monitor
clinical status and adherence to treatment recommendations, and (3) monitor provider adherence to evidence-based
practice guidelines. Disease management is typically targeted to people with specific chronic diseases, such as heart
failure or diabetes. Such diseases often have complex treatment regimens, and maintaining adherence requires the
sustained efforts of patients and physicians.
30 Staff for a few plans did not know how many SNP members used care coordination or disease management,
because they did not track use separately across the sponsors‘ managed care products. By contrast, mail survey
respondents generally indicated that half or more of their members were high-risk and thus would have been
receiving such services.

50
Routine contacts with enrollees receiving care coordination or disease management often
included disease-specific education geared toward improving adherence to treatment
recommendations. For most plans, education seemed to be an ad hoc process, with staff relying
on lists of educational topics and teachable moments to educate enrollees, and with no formal
approach for assessing whether individual enrollees understood educational messages or were
making necessary lifestyle changes. Education was primarily the delivery of factual information,
not explicit assistance and encouragement to change behavior (that is, it did not focus on
understanding individual barriers to change and working to overcome them). However, a few
plans used highly structured curricula; for two plans belonging to the same corporate parent, the
education intervention was housed on nurses‘ laptop computers and used routinely during
telephone or in-person visits with enrollees.
Most plans did not cultivate close working relationships between enrollee physicians and
care coordinators. Physicians in most plans were not affiliated exclusively with SNPs. Thus,
when care coordinators aimed to improve care provided in physicians‘ offices, they tried not to
appear to question or criticize individual treatment decisions, which plan staff believed would
reduce trust and alienate physicians. When major quality problems were identified, care
coordinators tended to refer issues to the plan medical directors for possible ―doctor-to-doctor‖
communication. Nonetheless, care coordinators for all visited plans had regular telephone
contact with their enrollees‘ physicians or their office staff concerning patient-specific issues.
Several programs supplemented these contacts with regularly mailed patient-specific profiles that
included medication lists or trends in clinical indicators. Most plans did not expect physicians to
update care coordinators when their patients‘ medical treatment plans changed.
Because they process claims for Medicare acute care and pharmacy benefits, and because
their care coordinators have regular contact with (at least high-risk) enrollees, SNPs are uniquely
equipped to improve management of care setting transitions and medications. In managing
transitions, most commonly hospital discharges, finding out about the hospitalization in a timely
way is crucial to making sure that enrollees understand discharge instructions and changes in
medication regimens, and that health and support services are in place at discharge. Some of the
visited plans themselves contacted hospitals in their networks each day to track the status of
hospitalized enrollees, while other plans relied on regular reports from hospital admissions or
discharge staff. Plans typically responded by assisting with discharge planning, including
arranging for support services and following up with enrollees after discharge to identify ways to
avoid a repeat admission.31
The importance of managing medications was a clear focus of
almost all visited plans. In addition to discussing medications directly with enrollees, some plans
fed claims data from their pharmacy benefits managers (PBMs) into their own software to
identify potential problems, while others contracted with the PBMs to identify and report
31
The visited institutional SNP had as a primary goal to reduce ―cycling‖ between nursing homes and hospitals
by treating members in the nursing home whenever possible (for example, for pneumonia or urinary tract
infections). When members did go to the hospital, care coordinators had the responsibility of providing all
necessary information about the member to hospital staff. Nursing home staff were instructed to notify the care
coordinators prior to or concurrent with any emergency room visit or hospital admission for any SNP member
(although staff noted that in practice this did not always happen).

51
problems. Plans typically responded to problems by reviewing them with their own pharmacists
or medical directors and then following up with enrollees‘ physicians.
Assisting with activities of daily living for those who need it, providing transportation to
medical appointments, or ensuring regular meals consistent with a physician‘s dietary
recommendations can be critical to beneficiary health and well-being. All visited plans
identified such needs through their assessments of enrollees receiving care coordination and
through their ongoing contacts with enrollees. In some cases, plans gave enrollees lists of
providers to contact for services, and in others they arranged for the services directly. None
reported directly providing or paying for services not covered by Medicare or Medicaid.
From what the literature on care coordination and disease management cites as important, it
is unclear whether many of the visited plans could improve enrollee health substantially. The
literature suggests that success requires having highly trained staff and actively involved
providers, as well as offering a structured intervention that can be adapted to individual patient
needs. Recent evaluations of CMS‘s fee-for-service care coordination demonstrations suggest
that in-person contact with enrollees may also contribute to success (Brown et al. 2007).
All the visited plans had some of the features recommended by the literature. They had
nurses providing care coordination and disease management, and most required that they
be registered nurses or have some experience in community nursing. Further, all the
plans conducted comprehensive assessments of those enrollees using care coordination or
disease management and from them derived care plans.
However, 8 of the 13 visited plans lacked many of the recommended features (Table
IV.3). Taken as a group, few of these 8 plans integrated physicians into the delivery of
their special services, and few took a structured approach to enrollee education but relied
instead on nurse-judgment-driven approaches. Few had the ability to contact enrollees in
person, and few had software systems that supported special service delivery or could
generate quality-monitoring reports. Among these plans, staff reported that care
coordination and disease management were very similar to services already provided in
their sponsors‘ Medicare or Medicaid managed care plans. Staff from some of those plans
noted, however, that for the SNPs, these services had either been made more structured
(for example, by adopting forms and protocols rather than relying primarily on individual
nurse judgment) or more intense (for example, by being longer-term rather than episodic,
or by giving staff smaller enrollee caseloads).
The other five plans might have greater potential to improve enrollee health. These plans
based their special SNP services on previous experience either operating demonstration
programs or as commercial chronic disease management providers. All had relatively
structured self-care education and regular monitoring by nurses and other professionals
with a frequency at least at a pre-set minimum. Three had the ability to contact enrollees
in person (although one of those plans did so infrequently). All five had also developed
sophisticated software to guide staff in providing care coordination and disease
management services, to warehouse data on enrollees using those services, and to

52
produce monitoring reports from those data upon which to make decisions on refining
intervention features as necessary.
C. ADAPTATION OF SERVICES TO INDIVIDUAL NEEDS
All the visited SNPs adapted their services to at least some degree in recognition of the fact
that, collectively, beneficiaries in all three target groups are more likely to have limited literacy,
poor English proficiency, needs for basic services (such as food and housing), complex medical
problems, cognitive limitations, and behavioral health problems. Having trained staff and clear
procedures to address these problems allows enrollees and their health care providers to focus on
improving health. Usually the visited plans employed social workers or behavioral health
professionals to assist nurses with enrollees who had complex psychosocial problems or mental
health disorders (Table IV.3). Further, most plans either had staff who were bilingual or had
their written materials translated into the languages commonly spoken by their enrollees. A few
plans also provided cultural competency training or hired staff familiar with the culture of the
service area.
D. ENROLLEE SATISFACTION WITH ENROLLMENT AND PLAN SERVICES
Most focus group participants said that they enrolled in their SNPs (or chose not to opt out)
either because their physicians were participating or because they found plan benefits attractive
(Table IV.4). However, most enrollees of three plans (who either were passively enrolled or
―rolled into‖ the SNP from a demonstration program) believed they had no choice but to remain
enrolled, even though staff reported having notified them of their choice.
Most focus group participants from most plans were satisfied overall with the services.
However, for only two plans (one dual-eligible plan and one chronic-condition plan) did most
enrollees believe their care was better under the SNP than previously. Enrollees in the dual-
eligible plan particularly liked the SNP because it lacked the stigma they had previously felt as
enrollees in a Medicaid plan (even though it was operated by the same sponsor as the SNP).
They also liked the plan‘s pharmacy benefit and disease management services. Enrollees in the
chronic-condition plan liked the regular calls from nurses.
Most focus group participants at one plan and some enrollees at a few plans believed their
care was worse under the SNP. However, since for many in the dual-eligible plans, ―previous
care‖ would have been (1) Medicaid managed care with the old Medicaid pharmacy benefit that
seldom included a copayment, and (2) fee-for-service Medicare with providers of their choosing,
this is not surprising.
E. CONCLUSION
The 13 visited plans, while not a random sample of all plans operating in 2006, were a
geographically diverse group serving the three SNP target populations and having substantial
membership. Moreover, including all the individual plans of the visited corporate parent
53
organizations, they represented 158 of the 276 plans operating that year. At the time of
evaluation visits, few had achieved full integration with Medicaid, and most were providing the
same relatively unstructured care coordination and disease management services to SNP
enrollees that their sponsors provide to enrollees in their other managed care products.
For most of the visited plans, it was not possible to say whether efforts to adapt basic plan
services to individual member differences in language, literacy, and cognitive ability went
beyond those typical of MA plans. Nevertheless, staff said that concentrating enrollees with
special needs into a single plan seemed to focus staff attention on the depth of enrollees‘ special
problems more intensely than when such enrollees were a minority in regular plans. The year
2006, the first year of operations for most of the visited plans, presented SNP staff with
complications related to the start of the Medicare Part D benefit and the competitive bidding
process, and to CMS‘s new enrollment database, MARX. During 2006, some of the visited
plans were focused on resolving various enrollment problems, and others were just starting to
realize they needed to refine their special services. It is thus too early to tell whether the SNPs
will ultimately improve beneficiary health beyond what might be expected in a regular MA plan.
On the other hand, several visited plans did appear to provide more specialized services than
would be found in regular MA plans. These plans based their special SNP services on previous
experience either operating demonstration programs or as commercial chronic disease
management providers. All had relatively structured self-care education and regular monitoring
by nurses and other professionals with a frequency at least at a pre-set minimum. Some of these
plans had the ability to contact enrollees in person. All had also developed sophisticated
software to guide staff in consistently providing care coordination and disease management
services, to warehouse data on enrollees using those services, and to produce monitoring reports
from those data upon which to make decisions on refining intervention features as necessary.

54
TABLE IV.2
COORDINATION WITH MEDICAID
CalOptima Evercare Cariten Molina CO Access CareOR HealthPtr HrtLine+ HealthSpr MMM Wellcare
SNP type Dual Dual (D) Institutional (I)
Dual Dual Dual Dual Dual Chronic Duala Dual (D)
Chronic (C)
Dual
Sponsor held Medicaid
contract prior to SNP √ D: √
(for one county
only)
√ √ √
(mental
health only)
√ √ √
SNP has contract with
Medicaid
Has capitated contract √ √ (D and I)
√b √ √
(D and C)
Contract includes:
Wrap-around servicesc
√ √ √b
√ √
Community-based
long-term care √d √
√
WA only
Institutional long-term
care √ √
WA only
Source: Discussions with plan staff during site visits conducted between April 2006 and February 2007
Notes: Staff visited two Evercare SNPs (one dual-eligible and one institutional) and two MMM SNPs (one dual-eligible and one chronic-condition). Descriptions presented in the tables apply to both plan types unless otherwise noted. Descriptions of the visited Evercare plans generally apply to all United Healthcare/Evercare SNPs (by type) in 2006, as do descriptions of the HealthSpring,
Molina, and Wellcare plans. (These corporate sponsors operated 65, 12, 4, and 69 plans, respectively, in 2006, for a total of 150 plans.)
aHealthSpring also operated institutional SNPs; however, they had very few members in 2006.
bMolina receives a capitated payment from California and Michigan and from Washington only for SNP enrollees who are also in the Washington Medicaid Integration Partnership (WMIP). Molina has a fee-for-service contract with Medicaid in Utah. Washington enrollees who are not in the WMIP receive Medicaid services through the regular fee-for-service program.
c―Wraparound services‖ pertains to Medicaid benefits that ―wrap around‖ Medicare coverage, such as vision, dental, medical transportation, and other acute or behavioral health services that extend those provided by Medicare.
dCalOptima‘s capitated payment excludes personal care and adult day health care but includes home health, durable medical equipment, and other community-based long-term care services.

55
TABLE IV.3
OVERVIEW OF CARE COORDINATION AND DISEASE MANAGEMENT
AND PLAN ADAPTATIONS TO INDIVIDUAL NEEDS
CalOptima Evercare Cariten Molina CO Access CareOR HealthPtr HrtLine+ HealthSpr MMM Wellcare
Staff providing
Care
Coordination
(CC)
RNs, MSW D: Nurses,
social
workers
I: NPs, social
workers
RNs RNs, social
workers RNs Nurses,
MSWs
RNs, social
workers RNs RNs, LPNs,
LVNs
RNs, social
workers
RNs, LPNs,
LVNs
Staff providing
Disease
Management
(DM)
RNs D: Nurses
I: NPs
Nurses RNs, health
educators Nurses Nurses RNs RNs Nurses RNs Nurses
CC/DM
developed for
SNPa
D: √
I: √
√ D: √
C: √
CC/DM
assessment ever
in person
√ √ √
b
Routine CC/DM
monitoring in
person
√ √ √
b b
Routine CC/DM
monitoring has
minimum
frequency
specified
√ √ √
√ √ √
CC/DM
education
structuredc
√ √ √
√ √ √ √
SNP software
supports
CC/DMd
√ √ √
√ √ √
Software
produces quality
monitoring
reports
√ √
√ √ √ √
SNP involved
physicians in
CC/DMe
√ √ √
√ √ √

56
CalOptima Evercare Cariten Molina CO Access CareOR HealthPtr HrtLine+ HealthSpr MMM Wellcare
Adaptations to
Individual
Differencesf
Social workers/
behavioral staff
available
√ √ √ √ √ √
√ √ √
Bilingual and
culturally
appropriate staff
or materials
√ √ √ √ √ √
√ √ √
Materials adapted
for low literacy √ √
√ √
Materials adapted
for vision/hearing
impaired
√ √ √
Source: Discussions with plan staff during site visits conducted between April 2006 and February 2007.
Notes: Staff visited two Evercare SNPs (one dual-eligible and one institutional) and two MMM SNPs (one dual-eligible and one chronic-condition). Descriptions presented in the tables apply to both plan types unless otherwise noted. Descriptions of the visited Evercare plans generally apply to all United Healthcare/Evercare SNPs (by type) in 2006, as do descriptions of the HealthSpring,
Molina, and Wellcare plans. (These corporate sponsors operated 65, 12, 4, and 69 plans, respectively, in 2006, for a total of 150 plans.)
aPlans with check marks developed their CC and DM interventions specifically for the SNP (or as part of a demonstration). Those without check marks used the same general interventions for enrollees of SNP and non-SNP products.
bHeartLine Plus staff reported that South Dakota-based nurses could assess or contact enrollees in person, but did so very infrequently. HealthSpring staff reported that nurses contacted some enrollees in person when they were hospitalized and contacted those who were part of a clinic pilot project for one plan.
cStaff described enrollee education as either somewhat or highly structured, rather than based simply on checklists of topics and teachable moments.
dSoftware supports care coordination and disease management by tracking intervention intensity or intermediate outcomes, or by generating task lists or reminders for staff.
ePhysician involvement includes collaboration with nurses (that is, participating in multidisciplinary team meetings, providing CCs with clinical or other information about enrollees, calling plan staff
with information about changes in enrollees‘ conditions or to request assistance for enrollees), or physicians providing input to CC/DM care plans, as well as the SNP actively providing physician education (as compared with simply providing care guidelines).
fAdaptations of plan interventions based on limited literacy, limited English proficiency, needs for basic services (such as food and housing), complex medical problems, cognitive limitations, or behavioral health problems.
RN = registered nurse; NP = nurse practitioner; MSW = Master of Social Work; BH = behavioral health.

57
TABLE IV.4
ENROLLEES‘ ENROLLMENT EXPERIENCES AND SATISFACTION WITH PLAN SERVICES
CalOptima Evercare Cariten CO Access CareOR HealthPtr HrtLine+ MMM
Plan passively
enrolleda
√ √a √ √ √ √
Enrollees contacted
were aware of
membership
Almost all/most D: Almost all/ most
I: All
Almost all/most All Almost all/most All All All
Main reason for
enrollingb
Physician in
network/physician or
agency
recommendation
Almost all/most D: Some None Some Few None None None
Attractive benefits Few D: Few All Some Few Almost
all/most
Almost
all/most
Did not think had
choice I: Almost all/most Most Almost all/ most
Satisfied overall Most D: Few
I: All
Most Most Some Few Most C: Most
D: Most
Plan care better than
previous
arrangement
None D: Few
I: Some
Most Some Few Few All C: Some
D: Few
Plan care worse than
previous
arrangement
Few D: Few
I: Some
None Some Some Most None C: Few
D: Few
Number of
participants 7 D: 8
I: 11
7 6 11 10 14 D: 8
C: 11
Source: All information from focus groups with plan enrollees conducted between February and April 2007 except that on use of passive enrollment which came from plan staff during site visits.
Notes: Staff visited and conducted focus groups with enrollees of two Evercare SNPs (one dual-eligible and one institutional) and two MMM SNPs (one dual-eligible and one chronic-condition).
Plan descriptions and focus group responses presented in the tables apply to both plan types unless otherwise noted.
aSee page 16 for an explanation of passive enrollment. Evercare‘s dual-eligible SNP passively enrolled in one county only; its institutional plan was redesignated from a demonstration to a SNP, and all
participants were automatically enrolled in the SNP.
bIncluding decision/reasons not to opt out if passively enrolled. HeartLine Plus and MMM did not use passive enrollment. Evercare-D did not use passive enrollment in Pima county (Tucson). Evercare-I enrollees were automatically switched from the Evercare nursing home demonstration to the SNP in August 2005.

58
V. STATE MEDICAID PERSPECTIVES
State interest in and involvement with SNPs depends largely on each State‘s history with
Medicaid managed care and the State‘s future plans for such care. States that cover at least some
benefits for dual eligibles in Medicaid managed care or have plans to extend it to cover services
heavily used by dual eligibles, such as long-term care, are likely to have a substantial interest in
SNPs. For other States, the benefits of contracting or working with SNPs are less apparent.
A. MEDICAID CONTRACTING ARRANGEMENTS AND SNP ENROLLMENT
As Table V.1 shows, current SNP activity is heavily concentrated in a small number of
States. Over ninety percent of the total SNP enrollment of 842,840 in March 2007 was in just
11 States (Pennsylvania, California, New York, Arizona, Texas, Minnesota, Florida, Tennessee,
Oregon, Alabama, and Massachusetts) and Puerto Rico.32
As the table also shows, 212,520 full
dual eligibles were passively enrolled33
in SNPs in late 2005 and early 2006, although some
subsequently disenrolled. All but 14,525 of the initial passive enrollees were in the 11 States
mentioned. Initial passive enrollment from Medicaid plans thus accounts for one quarter of total
SNP enrollment, with passive enrollment heavily concentrated in a small number of States.
Nationally, 14 percent of dual eligibles with full Medicaid benefits were enrolled in a SNP
in February 2007, and the percentage of full duals enrolled in SNPs exceeded 14 percent in nine
States. Over 90 percent of the remaining full-benefit dual eligibles are enrolled in stand-alone
Medicare prescription drug plans, into which they were auto-enrolled in late 2005 and early
2006. Although SNPs have the potential to increase their enrollment by persuading full-benefit
dual eligibles who are enrolled in prescription drug plans to switch to SNPs, dual eligibles can be
difficult to identify and contact, and polls indicate that the great majority of them are content
with their current Medicare coverage. Table V.1 also shows that of 18 States that contracted
with SNPs for provision of some Medicaid services, eight included some form of long-term care
benefit in the contract. The reasons for this relationship are discussed in more detail in Section
C.
32
Note that the SNP enrollment totals shown in Table V.1 differ somewhat from enrollment totals used
elsewhere in this report, since the SNP enrollment data for this table are based on a Kaiser Family Foundation
(KFF) analysis of enrollment data publicly reported by CMS in March 2007, and posted on the KFF
statehealthfacts.org web site. These data permit consistent measurement of SNP enrollment and the number of full-
benefit dual-eligible beneficiaries by state.
33 See page 16 for an explanation of passive enrollment.

59
TABLE V.1
SNP ACTIVITY BY STATE, 2006-2007
State SNP Type
Number of
SNP Contracts by Typea
(March 2007)
Total SNP
Enrollment by Typeb
(March 2007)
Total Passive
Enrollment Into SNPs
From Medicaid Managed Care Plans
(2005-2006)
Total Full
Dualsc
(February
2007)
Total SNP Enrollment
(March 2007) as a
Percentage of Total Full Duals
(February 2007)
SNPs Contract with Medicaid for Some
Medicaid Benefitsd
Medicaid
Managed Care Includes LTC
Benefitse
Some Dual Eligibles
Enrolled in
Capitated Medicaid Managed Care, June
2006f
Totals DE 172 621,986
I 63 139,761
CC 44 81,093
All 224 842,840 212,520 5,985,723 14.1%
Alabama DE 3 14,496
No No No
I 2 *
CC 1 * 0 87,924 16.4%
Alaska DE 0 0
No No No
I 0 0
CC 0 0 0 11,977 0.0%
Arizona DE 9 46,341
Yes Yes Yes (MCO)
I 1 1,163
CC 4 563 32,819 98,928 48.6%
Arkansas DE 3 342
No No No
I 0 0
CC 1 1,237 0 63,859 2.5%
*California DE 13 82,211
Yes, in some counties
Yes, in some counties
Yes (HIO, MCO, PACE)
I 3 89,292
CC 5 1,878 20,955 1,012,909 17.1%
*Colorado DE 4 6,060
Yes
No, except in
PACE Yes (MCO, PIHP,
PACE)
I 2 2,280
CC 0 0 1,887 51,671 16.1%
*Connecticut DE 5 1,499
No No No
I 2 1,493
CC 1 127 0 66,869 4.7%
Delaware DE 1 *
No No No
I 1 287
CC 0 0 0 9,494 3.0%
District of Columbia
DE 1 4,233
No No Yes (MCO, PIHP) I 1 31
CC 0 0 0 16,567 25.7%

TABLE V.1 (continued)
60
State SNP Type
Number of
SNP Contracts
by Typea (March 2007)
Total SNP
Enrollment by
Typeb (March 2007)
Total Passive Enrollment Into SNPs
From Medicaid
Managed Care Plans (2005-2006)
Total Full
Dualsc
(February 2007)
Total SNP
Enrollment (March 2007) as a
Percentage of
Total Full Duals (February 2007)
SNPs Contract with
Medicaid for Some Medicaid Benefitsd
Medicaid
Managed Care
Includes LTC Benefitse
Some Dual Eligibles Enrolled in
Capitated Medicaid
Managed Care, June 2006f
*Florida DE 18 25,977
No
Only in some
small demos Yes (MCO, PACE)
I 5 2,380
CC 2 1,794 789 291,973 10.3%
Georgia DE 6 2,329
No No Yes (PIHP)
I 2 2,498
CC 3 2,918 0 126,549 6.1%
Hawaii DE 3 1,037
No No No
I 0 0
CC 0 0 0 25,426 4.1%
Idaho DE 1 164
Planned; not yet implemented
Planned; not
yet implemented No
I 0 0
CC 0 0 0 19,219 0.9%
Illinois DE 5 3,992
Yes, in 2007 No No
I 2 *
CC 3 812 0 228,232 2.1%
Indiana DE 1 344
No No No I 0 0
CC 0 0 0 78,559 0.4%
Iowa DE 1 44
No No Yes (PIHP)
I 2 117
CC 0 0 0 56,353 0.3%
*Kansas DE 1 *
No No, except in
PACE Yes (PACE)
I 0 0
CC 0 0 0 38,348 0.0%
Kentucky DE 1 9,745
Yes (one plan)
Yes, home
health in one
plan Yes (MCO)
I 0 0
CC 0 0 9,598 90,351 10.8%
Louisiana DE 3 1,591
No No No
I 0 0
CC 0 0 0 94,049 1.7%
Maine DE 2 *
No No No
I 1 19
CC 1 * 0 47,250 0.0%

TABLE V.1 (continued)
61
State SNP Type
Number of
SNP Contracts
by Typea (March 2007)
Total SNP
Enrollment by
Typeb (March 2007)
Total Passive Enrollment Into SNPs
From Medicaid
Managed Care Plans (2005-2006)
Total Full
Dualsc
(February 2007)
Total SNP
Enrollment (March 2007) as a
Percentage of
Total Full Duals (February 2007)
SNPs Contract with
Medicaid for Some Medicaid Benefitsd
Medicaid
Managed Care
Includes LTC Benefitse
Some Dual Eligibles Enrolled in
Capitated Medicaid
Managed Care, June 2006f
Maryland DE 2 4,277
I 2 2,585
No No Yes (PACE) CC 2 1,150 0 61,732 13.0%
Massachusetts DE 4 7,402
Yes, in dual demos
Yes, in dual
demos and PACE
Yes (MCO and PACE)
I 2 5,631
CC 3 75 0 202,452 6.5%
Michigan DE 2 272
No No Yes (PACE)
I 2 644
CC 1 17 0 195,407 0.5%
Minnesota DE 6 35,630
Yes, in dual demos Yes, in dual
demos Yes (MCO)
I 0 0
CC 0 0 23,700 96,190 37.0%
Mississippi DE 2 855
No No No
I 1 *
CC 0 0 0 71,158 1.2%
Missouri DE 1 861
No No Yes (PACE)
I 0 0
CC 2 1,873 0 127,122 2.2%
Montana DE 0 0
No No No
I 0 0
CC 0 0 0 12,629 0.0%
Nebraska DE 1 44
No No No
I 1 117
CC 0 0 0 32,630 0.5%
Nevada DE 1 *
No No No
I 0 0
CC 2 * 0 18,355 0.0%
New Hampshire
DE 0 0
No No No
I 0 0
CC 0 0 0 17,096 0.0%
New Jersey DE 1 1,844
Yes No Yes (MCO)
I 2 225
CC 2 114 1,460 151,965 1.4%

TABLE V.1 (continued)
62
State SNP Type
Number of
SNP Contracts
by Typea (March 2007)
Total SNP
Enrollment by
Typeb (March 2007)
Total Passive Enrollment Into SNPs
From Medicaid
Managed Care Plans (2005-2006)
Total Full
Dualsc
(February 2007)
Total SNP
Enrollment (March 2007) as a
Percentage of
Total Full Duals (February 2007)
SNPs Contract with
Medicaid for Some Medicaid Benefitsd
Medicaid
Managed Care
Includes LTC Benefitse
Some Dual Eligibles Enrolled in
Capitated Medicaid
Managed Care, June 2006f
New Mexico DE 2 153
Yes, in 2007 No Yes (PACE)
I 1 118
CC 0 0 0 33,532 0.8%
*New York DE 15 42,938
Yes, in small pilots Yes, in small
pilots Yes (MCO, PIHP,
PACE)
I 7 21,857
CC 1 145 7 554,372 11.7%
North Carolina DE 1 1,624
No No Yes (PIHP)
I 2 1,300
CC 0 0 0 218,040 1.3%
North Dakota DE 0 0
No No No
I 0 0
CC 0 0 0 9,573 0.0%
Ohio DE 2 1,991
No No Yes (PACE)
I 2 2,365
CC 0 0 0 169,251 2.6%
Oklahoma DE 2 76
No No No
I 1 183
CC 0 0 0 78,705 0.3%
*Oregon DE 7 17,006 Yes, for Medicare
cost sharing for plans that have Medicaid
contracts
No, except in
PACE
Yes (MCO, PIHP,
PACE)
I 2 131
CC 0 0 11,066 52,641 32.6%
*Pennsylvania DE 10 100,475
No
No, except in
PACE
Yes (MCO, PIHP,
PACE)
I 2 894
CC 1 34 78,735 279,247 36.3%
*Rhode Island DE 2 2,413
No No Yes (PACE)
I 1 1,026
CC 0 0 0 29,584 11.6%
South Carolina DE 1 125
No No Yes (PACE)
I 0 0
CC 1 2,800 0 117,034 2.5%
South Dakota DE 1 *
No No No
I 0 0
CC 1 1,927 0 11,826 16.3%

TABLE V.1 (continued)
63
State SNP Type
Number of
SNP Contracts
by Typea (March 2007)
Total SNP
Enrollment by
Typeb (March 2007)
Total Passive Enrollment Into SNPs
From Medicaid
Managed Care Plans (2005-2006)
Total Full
Dualsc
(February 2007)
Total SNP
Enrollment (March 2007) as a
Percentage of
Total Full Duals (February 2007)
SNPs Contract with
Medicaid for Some Medicaid Benefitsd
Medicaid
Managed Care
Includes LTC Benefitse
Some Dual Eligibles Enrolled in
Capitated Medicaid
Managed Care, June 2006f
Tennessee DE 7 23,265
Yes in 2006 No
Yes (MCO, PIHP,
PACE)
I 2 14
CC 1 1,582 13,853 191,424 13.0%
*Texas DE 12 33,566 Yes, for some plans
in some counties for
Medicare cost
sharing; developing plans to capitate
some Medicaid
wraparound services
Yes, in four
urban
counties, but only for
community
services Yes (MCO, PIHP,
PACE)
I 4 261
CC 5 3,142 16,071 339,286 10.9%
Utah DE 2 1,779
Yes No Yes (PIHP)
I 1 *
CC 0 0 1,520 22,484 7.9%
Vermont DE 0 0
No No Yes (MCO)
I 0 0
CC 0 0 0 16,357 0.0%
Virginia DE 1 *
Planned; not yet implemented
Planned; not
yet implemented No
I 3 2497
CC 1 12 0 104,387 2.4%
Washington DE 3 762
Yes, in a small pilot
No, but
developing
plan to do so
Yes (MCO, PIHP,
PACE)
I 1 234
CC 0 0 60 97,772 1.0%
West Virginia DE 0 0
No No No
I 0 0
CC 0 0 0 41,133 0.0%
*Wisconsin DE 2 1,508
Yes, in dual demos;
considering for other
SNPs
Yes, in dual
demos, Family
Care, and
PACE
Yes (MCO,
PACE)
I 4 2,586
CC 1 38 0 110,125 3.8%
Wyoming DE 0 0
No No No
I 0 0
CC 0 0 0 5,707 0.0%
Puerto Rico DE 10 146,917
Yes No Yes (MCO, PIHP)
I 1 84
CC 2 63,237 0 -- --
*States visited or interviewed for the evaluation.

TABLE V.1 (continued)
64
aDE = Dual Eligible; I = Institutional; CC = Chronic Condition. Note that the number of contracts is smaller than the total number of SNP plans, since a single contract may include multiple plans and more than one type of SNP. The distribution of contracts by State is from the Kaiser Family Foundation, statehealthfacts.org, at http://www.statehealthfacts.org/comparetable.jsp?ind=333&cat=6
(accessed October 10, 2007), and is based on data from the CMS MA Personal Plan Finder.
bSource: Kaiser Family Foundation, statehealthfacts.org, at http://www.statehealthfacts.org/comparetable.jsp?ind=334&cat=6 (accessed October 10, 2007), based on March 2007 CMS Special Needs Plan Enrollment Report by SNP Type. Note that State enrollment subtotals do not add to national totals, since enrollment in contracts that span two States is shown in the table for both States.
cSource: CMS monthly count of full duals for State Part D ―clawback‖ payments
dSources: CMS report of SNPs with dual capitation arrangements with States (2006), MPR site visits to State Medicaid agencies and CMS regional offices (2007), and CHCS survey of States (December 2006).
eSources cited in footnote 3, supplemented by Saucier and Burwell (2007), Saucier and Fox-Grage (2005), Kronick and LLanos (2007), and State and health plan web sites.
fCMS 2007b, p. 12. Capitated managed care includes Health Insuring Organization (HIO), Managed Care Organization (MCO), Prepaid Inpatient Health Plan (PIHP), and Program for All-Inclusive
Care for the Elderly (PACE), but not Primary Care Case Management (PCCM), Prepaid Ambulatory Health Plan (PAHP), and Other. PIHPs are generally specialized behavioral health plans that cover less than comprehensive services on an at-risk basis. See CMS 2007b, p. 55 for detailed explanations of all these managed care entities.

65
B. MEDICAID AGENCY SITE VISITS AND INTERVIEWS: VARIATIONS IN STATE
INTEREST IN SNP
SNPs provide a natural mechanism for improved coordination and integration of Medicare
and Medicaid services for dual eligibles in those States that seek such coordination. Nonetheless,
few SNPs have entered into contracts with State Medicaid agencies, whether from a lack of
interest on the part of States, or an absence of attempts by the SNPs, or some combination of the
two. Table V.1 shows SNP enrollment and State contracting with SNPs in 2007.
The evaluation conducted site visits to State Medicaid agencies and CMS regional offices
between January and April 2007, to elicit their perspectives and opinions on the role SNPs can
play in their local environment. Prior to the site visits, to facilitate discussion about specific
SNPs, we provided interviewees with publicly available summary and enrollment information on
the SNPs operating in their State or region. We also sent interviewees copies of the interview
protocols we planned to use so they could have the appropriate people available to respond to
questions. The States we visited or interviewed are marked with an asterisk (*) in Table V.1.
States were chosen to reflect a range of SNP activity and State experience with
Medicare/Medicaid contracting.
In general, State attitudes toward SNPs ranged from enthusiasm to indifference, with
varying degrees of selective interest in between. Arizona (not visited for this project) indicated
the greatest degree of enthusiasm for SNPs, followed by the dual-demonstration States
(Minnesota, Wisconsin, and Massachusetts), and then Texas, Florida, New York, California, and
Oregon. The dual-demonstration States, while very enthusiastic about integrating Medicare and
Medicaid, commented that in some ways SNPs are less effective than their previous programs
for such integration. Some other States not specifically visited for this evaluation, including
New Mexico, Washington, Maryland, Virginia, and Michigan, reported that they are also
exploring the potential for SNPs. In most cases, States said that they are focusing on managed
care organizations (MCOs) that already contract with the State for Medicaid services and that are
also SNPs or plan to become SNPs. Medicaid representatives stated they were looking for SNPs
that understand the specific care needs of the Medicaid population, and who understand how to
work with state governments. Most States visited for the evaluation expressed skepticism that
SNPs, whose primary experience is typically with Medicare, had that kind of understanding.
Some States, such as Arizona, Texas, and Florida, indicated that they were more open to SNPs
that are new to the State, but even those States said that they are looking for SNPs with Medicaid
experience.
The reasons for this selective interest flow from the incentives, discussed in more detail in
Section C, for States to work with SNPs. States that cover or plan to cover long-term care
services in managed care see the greatest potential benefit from SNPs over the longer term. Out
of the 18 States shown in Table V.1 that currently or soon plan to contract with SNPs for some
Medicaid benefits, at least 8 either include some long-term-care services in Medicaid managed
care, or plan to do so in the near future. Several other States that are in early planning stages for
Medicaid managed long-term care, such as New Mexico and Virginia, see SNPs as a potential
component in their managed care plans.

66
Another factor in State decisions to contract with SNPs relates to State familiarity and
experience with particular SNPs. If a SNP has been a Medicaid managed care contractor in a
State for a number of years, the State is likely to be more willing and able to contract with that
plan when it becomes a SNP. This was the situation in California, Oregon, and several other
States when Medicaid managed care plans were authorized as SNPs in 2005 and 2006, and the
State agreed to contract with the new SNP. State Medicaid agencies often believe that their
programs, beneficiaries, and providers require MCOs that understand the specific needs of
Medicaid and the context in which Medicaid programs operate, and they are not confident that
―outside‖ Medicare-only MCOs have such understanding and experience. They are therefore
interested primarily in SNPs with demonstrated experience in Medicaid. It can also be difficult
in many States to contract with new managed care plans without going through a new State
procurement process, which may not be necessary in the case of SNPs with which the State
already has a Medicaid managed care contract.
1. Why Some States Want to Work with SNPs
Based on site visits to States and CMS regional offices for the evaluation, recent published
reports (Saucier and Burwell 2007; Verdier and Au 2006; Saucier and Fox-Grage 2005), and
industry and Medicaid conferences on SNPs, the major reasons States appear to want to work
with SNPs include:
The opportunity to fully integrate Medicaid and Medicare acute and long-term care
benefits. Minnesota, Wisconsin, and Massachusetts are now doing this in their dual
demonstration programs; Arizona is close to full integration as well, although its SNPs
currently operate Medicaid and Medicare managed care programs on a ―side-by-side‖
rather than a fully integrated basis.
The desire to accommodate existing Medicaid plans that wished to become SNPs.
California and Oregon are in this category. Medicaid plans in both States had significant
dual-eligible enrollment in 2005 and wanted to build on it to become SNPs. Both States
have been working for years on initiatives to further integrate Medicaid acute and long-
term care benefits through managed care, but stakeholder and legislative opposition has
hindered the development of these initiatives, so SNPs are not currently viewed as a
major step toward fully integrated care in these States, at least in the short term.
The desire to fit SNPs into current or emerging Medicaid managed care initiatives.
Texas has an existing Medicaid managed care program (STAR+PLUS) that covers
Medicaid acute care and community long-term care benefits in several urban counties
through MCOs. Some of these MCOs are also SNPs, so Medicaid and Medicare benefits
can be provided to dual eligibles, albeit on a side-by-side rather than a fully integrated
basis. Texas is exploring ways to integrate SNPs more fully into STAR+PLUS. New
York is trying to meld two pre-existing Medicaid managed care programs into a program
that will cover both acute and long-term care on the Medicaid side, and attract SNP
contractors who could add Medicare benefits. Similarly, Florida is developing a
Medicaid managed care program that would integrate Medicaid acute and long-term care
benefits. This program, Florida Senior Care, has not been implemented yet, but the State
67
expects that it will attract considerable SNP interest and may present opportunities to
fully integrate Medicaid and Medicare managed care for dual eligibles. Other States
such as New Mexico, Washington, Virginia, Maryland, and Michigan, are not as far
along in developing Medicaid initiatives that could include SNPs, but there is interest in
all these States.
As shown in Table V.1, all 18 States that currently or soon plan to contract with SNPs for
some Medicaid benefits either included some duals in capitated Medicaid managed care in 2006
or include long-term care benefits in Medicaid managed care, so those two factors appear to be a
significant element in State decisions to contract with SNPs.
2. Why Most States Are Not Currently Interested in SNPs
As of June 30, 2006, dual eligibles were enrolled in some form of capitated Medicaid
managed care in 26 States plus Puerto Rico. In 10 of those States the only managed care
programs were Prepaid Inpatient Health Plans (PIHP), which are primarily specialized
behavioral health plans that offer less-than-comprehensive benefits, or Program for All-Inclusive
Care for the Elderly (PACE) programs. Of the 7.5 million full and partial dual eligibles in 2006,
about 1.4 million (19 percent) were enrolled in some form of capitated Medicaid managed care
(Centers for Medicare & Medicaid Services 2007b). For the 0.7 million enrolled in
comprehensive managed care plans, their capitated benefit often included only limited Medicaid
services, such as Medicare cost sharing. For States that do not include dual eligibles in managed
care, there is generally no mechanism or procedure for contracting with SNPs for Medicaid
services, and little reason to enter such arrangements. If States have no plans to include duals or
long-term care services in Medicaid managed care, that further diminishes their interest in SNPs.
To get a better sense of the factors that led to their apparent lack of interest, we visited or
interviewed five States (Colorado, Connecticut, Kansas, Pennsylvania, and Rhode Island) that
have had limited or no involvement with SNPs. The main reasons for their lack of interest fell
into three categories:
Few or no SNPs in the State. Kansas fell most clearly into this category. While the
State covered some duals in a small PACE program in 2006, there is only one SNP in the
State (Evercare) and it had fewer than 10 enrollees in March 2007. State staff were not
very familiar with SNPs in general or with the Evercare SNP.
Limited coverage of Medicaid acute-care benefits that overlap with Medicare benefits. Pennsylvania is in this category. As noted earlier, Medicaid coverage of services that
overlap with Medicare is quite limited, and behavioral health services for duals are
covered by separate behavioral health MCOs, so the State does not believe that there is
anything to be gained by contracting with SNPs, particularly after implementation of Part
D. As a result, all duals were removed from Medicaid managed care as of January 2006.
No coverage of long-term care benefits in Medicaid managed care, or current plans to
do so. All five States were in this category, even though there were factors in some of
them that might have led them to be interested in SNPs. Colorado covers some dual

68
eligibles in Medicaid managed care and has four SNPs (Evercare, Kaiser, Colorado
Access, and Denver Health Medical Plan), but the State has no current plans to extend
Medicaid managed care to long-term care services or to contract with SNPs. Connecticut
has four SNPs (Evercare, WellCare, Health Net, and Senior Whole Health), but no plans
to extend Medicaid managed care to long-term care services. However, the legislature in
its 2007 session included language in a budget measure recommending that the State
contract with SNPs ―to provide for the integration of Medicaid funding and benefits with
the Medicare SNPs‖ operating in the State, and allocated $10 million in fiscal year 2008
and $15 million in fiscal year 2009 ―to establish integrated care plans.‖ Rhode Island has
had tentative and preliminary discussions with the two SNPs in the State (Evercare and
Blue Chip), but appears to be in a ―wait and see‖ mode and is not actively pursuing
relationships with the SNPs. Although some duals are covered by Medicaid managed
care in a small PACE program, there are no current plans to cover Medicaid long-term
care services in the State‘s broader managed care program.
C. ANALYSIS OF STATE INCENTIVES TO WORK WITH SNPS
As described above, State interest in working with SNPs varies substantially, reflecting the
incentives that flow out of the State‘s existing and planned Medicaid programs and the specific
context of each State. This interest is also likely to change over time as State Medicaid programs
and SNPs evolve, and as changes occur in State government leadership and other aspects of the
State context. This section describes the incentives for States to work with SNPs that flow out of
the current and planned structure of State Medicaid programs.
States that currently cover some or all Medicaid long-term care benefits through managed
care may see SNPs as a way of expanding their integrated care model to include Medicare
services, though there is opposition in some of these States to including ―outside‖ MCOs in their
Medicaid program, and concern about the administrative and other complexities involved in
dealing with Medicare (Verdier 2006; Saucier and Burwell 2007). If there are no SNPs in a State,
or if those that are present have not enrolled a significant number of Medicaid beneficiaries,
States may see few benefits to working with SNPs. Even if there is significant enrollment of dual
eligibles in SNPs in a State, there may be limited incentives for the State to develop a
relationship with the SNPs if it involves only dealing with Medicare cost sharing or the limited
remaining Medicaid acute care services for duals. In Pennsylvania, for example, where more
dual eligibles were passively enrolled than in any other State, dual eligibles were removed from
Medicaid managed care with the advent of Part D in January 2006, because the State did not
believe it had anything to gain by including the minimal remaining Medicaid acute care benefits
for dual eligibles in managed care.
1. Acute Care Services
While State Medicaid programs are responsible for Medicare cost sharing34
and some acute
care benefits for dual eligibles, States can fulfill that responsibility by providing those benefits to
34
States are legally responsible for Medicare cost sharing only to the extent that Medicaid payment for the
service exceeds the Medicare payment minus the beneficiary cost sharing responsibility. (Social Security Act,
Section 1902(n)(2)). Since Medicaid payments are often below or only slightly above Medicare payments, the

69
duals on a fee-for-service basis without contracting with SNPs. It is potentially more efficient
administratively for States, SNPs, beneficiaries, and providers if States are willing to contract
with SNPs to pay for Medicare cost sharing and these limited Medicaid acute care benefits
through an up-front capitated payment to the SNP for each dual-eligible SNP enrollee. However,
it can be costly in terms of time and resources for States to develop capitated rates and negotiate
contracts with SNPs, so States do not typically do so unless they already have contractual or
other relationships with SNPs or have broader reasons for wanting to develop such relationships
(Verdier 2006).
Some States, such as New York, have sought to capture savings for Medicaid that may result
when SNPs and other MA plans cover services that Medicaid also covers, such as vision, dental,
transportation, and home health, or when provision of Medicaid services (personal care
assistance, care coordination, community-based services) reduces use of inpatient hospitalization
and other Medicare acute care services. Doing so requires willingness on the part of Medicare
plans to provide information to the State on Medicare services they provide that overlap with
Medicaid, and plans will generally provide such information only if the State requires it as a
condition for contracting with Medicaid. Even if Medicare plans are willing to share these data
with the State, it may not be easy for the State and the plans to agree on how to calculate savings
to Medicare from Medicaid programs, and how those savings should be divided between the
plans and the State (Verdier 2006).
2. Managed Long-Term Care
It is generally only when States see SNPs as a way of providing Medicaid long-term care
services through managed care and coordinating those services with Medicare that States
evidence substantial interest in contracting with SNPs. A number of States already contract with
SNPs to cover Medicaid long-term care services for dual eligibles (Arizona, California,
Massachusetts, Minnesota, Texas, and Wisconsin), and others are considering doing so (Florida,
Washington) (Saucier and Burwell 2007; Kronick and Llannos 2007). However, Medicaid
officials noted that beneficiary advocates and providers sometimes oppose the inclusion of long-
term care services into managed-care contracts. Those States that have done so have typically
introduced managed long-term care in limited areas of the State (Saucier and Fox-Grage 2005;
Saucier and Burwell 2007). This evaluation did not otherwise pursue the sources and extent of
opposition to managed long-term care.
One of the other obstacles to Medicaid managed long-term care in the past has been the
limited number of MCOs with the experience and capability needed to provide this kind of care.
States that have implemented Medicaid managed care programs for long-term care have often
relied on locally sponsored MCOs developed by counties, nursing facilities, and other traditional
Medicaid long-term care providers rather than on the multi-State MCOs that have become
increasingly common in Medicaid, and that are heavily represented among SNPs.
(continued) extent of the Medicaid responsibility for this Medicare cost sharing can be quite limited, although some states
choose to pay a greater share than federal law requires.

70
With the advent of SNPs, there are now more MCOs that States may be able to contract with
to cover Medicaid long-term care services. In States like Wisconsin and Minnesota, however,
where plans are required to be non-profits and most are locally sponsored, some State Medicaid
staff express doubt that national MCOs know how to serve the Medicaid population with long-
term care needs. With some exceptions, most current multi-State SNPs do not have extensive
experience in managing Medicaid long-term care services, especially the home and community-
based services that are an important part of Medicaid. (Some organizations, including Evercare,
have considerable experience in managing nursing facility care, but less with community
services.) In addition, to the extent that these national MCOs are viewed by beneficiary
advocates and providers as ―outsiders‖ without strong ties to the State, they may not be in a good
position to help State Medicaid agencies allay provider and beneficiary concerns about managed
long-term care. Further, some national MCOs may be reluctant to contract with local
community-based service providers or other long-term care providers that Medicaid enrollees
have relied on in the past, or may want to establish financial or performance accountability
conditions that these providers are unwilling to accept. As States and SNPs gain more
experience with managed long-term care in specific States, enough evidence should accumulate
about the strengths and limitations of this approach to help resolve these provider and beneficiary
concerns one way or the other. State interest in contracting with SNPs is likely to increase or
diminish accordingly.
3. CMS Efforts to Reduce Obstacles
As noted above, developing Medicaid contracts with dual eligible SNPs presents added
challenges for both States and plans. For States, contracting just for those Medicaid services that
are not covered by Medicare may increase the State‘s rate-setting burden. It also means that
States must adapt their monitoring and oversight procedures to accommodate the fact that dual-
eligible SNPs are also subject to monitoring and oversight by Medicare. There is added
complexity for plans as well. The addition of a second payer makes financial planning and bid
submissions more challenging, as does the addition of a Medicaid monitoring and oversight
process with requirements that are sometimes inconsistent with those of Medicare. Recognizing
these challenges, CMS launched an Integrated Care Initiative in December 2005 when an intra-
agency workgroup was formed at the request of the CMS Administrator. The workgroup sought
input from both States and plans through groups such as the Center for Health Care Strategies
and the National SNP Alliance. The purpose of this workgroup was to reduce administrative
barriers to implementing Special Needs Plans (SNPs) and to increase State awareness of the
opportunity to better integrate care for dual eligible beneficiaries. Detailed information about the
Integrated Care Initiative is available at http://www.cms.hhs.gov/IntegratedCareInt/ and a
summary of the guidance provided by the group is attached as Appendix V.
D. SUMMARY
The attitudes of State Medicaid agencies toward contracting with SNPs for Medicaid
services vary widely. For States that currently have Medicaid managed long-term care programs,
or plan to develop them in the near future, SNPs present an important opportunity to move

71
toward full integration of Medicare and Medicaid acute and long-term care services. Other States
that include dual eligibles in Medicaid managed care only for acute care services may view
contracting with SNPs as a way of at least modestly improving the coordination of Medicaid and
Medicare acute care for these beneficiaries. States that had contracts with plans for Medicaid
managed care services before the plans became SNPs are also likely to be inclined to contract
with these new SNPs. For most of the States that do not currently include dual eligibles in any
kind of managed care, do not have pre-existing Medicaid contractual relations with specific
SNPs, or do not have plans to extend managed care to cover disabled and chronically ill
populations or long-term care services, there is generally little interest in contracting with SNPs.

72
VI. CHARACTERISTICS OF SNP AND NON-SNP BENEFICIARIES
There is no reason to expect, a priori, that SNP enrollees should be older, frailer, or in
poorer health than the overall population of beneficiaries eligible to enroll in SNPs. The question
is nonetheless of interest, particularly because of the absence of currently available data on
health outcomes or utilization of SNP enrollees. This chapter compares the demographic and
health characteristics in 2005 of beneficiaries who enrolled in a SNP in 2006, with those of
Medicare beneficiaries who appeared, on the basis of their 2005 characteristics, to meet the
eligibility criteria for each SNP type.
We first compare—for each SNP type—the characteristics in 2005 among 2006 SNP
enrollees with those of beneficiaries eligible to enroll in the SNP. We also focus on three subsets
of SNP enrollees who might be expected to differ from the larger group of SNP enrollees: those
in dual-eligible and institutional demonstration plans and those who were passively enrolled into
dual eligible SNPs. Because some SNP plans are disproportionate-percentage plans that do not
limit enrollment to those meeting the stated eligibility criteria, we also make comparisons
restricting SNP enrollees to those who meet the relevant target criteria based on available data.
A. METHODS
To compare 2006 SNP enrollees with other beneficiaries who might have joined SNPs, we
constructed comparison groups of eligible non-enrollees (ENEs) from residents of the market
area for each SNP, using CMS service-area and enrollment files. ENE members were selected
based on their apparent eligibility for SNP enrollment, given characteristics and diagnoses from
2005. Groups were further defined as follows:
Dual-Eligible SNPs. The ENE group for dual SNPs was defined either as all dual eligibles
or all dual eligibles with full Medicaid benefits (as appropriate to SNPs‘ defined population)
residing in a market area served by dual-eligible SNPs. Dual-eligible status was drawn from the
Medicare Beneficiary Database (MBD) in the last quarter of 2005.
Institutional SNPs. The ENE group for institutional SNPs was defined as all Medicare
beneficiaries with at least two nursing-home Minimum Data Set (MDS) assessments or one 90-
day assessment in 2005.
Chronic condition SNPs. The ENE group for each SNP was defined as all Medicare
beneficiaries with evidence of the specific conditions covered by the SNP, identified by
indicators for the corresponding Hierarchical Condition Categories (HCCs) in the CMS 2006
Budget Neutrality file (which reflects utilization for CY 2005). 35
35
For plans covering ESRD beneficiaries, we also used ESRD enrollment status from CMS enrollment files.

73
Beneficiaries who were first enrolled in a SNP in 2005 or were new to Medicare in 2006
(and thus had no 2005 data) were excluded from the analysis, so SNP totals do not equal those
presented earlier in this report. Separate ENE groups were constructed for beneficiaries who
entered a SNP from another MA plan and for those who entered a SNP from fee-for-service
Medicare, based on their HMO enrollment status in the month prior to enrollment. We compared
2005 demographic and enrollment characteristics, as well as the presence of common health
conditions, as measured by HCCs based on 2005 diagnoses, for SNP enrollees with those of the
appropriate ENE group. For those entering from fee-for-service, we also compared Medicare
utilization and spending in 2005 using the Medicare Chronic Condition Warehouse36
(CCW).
The comparisons are intended to be indicative rather than definitive, especially for
institutional and chronic condition SNPs. Subject to CMS approval, chronic care SNPs define
both the chronic conditions they will serve and the criteria which they will use to determine
whether applicants meet the criteria for the targeted conditions. We used HCC indicators to
identify the target population populations in chronic condition SNPs but it is possible that this
approach may not precisely match the criteria actually used by plans. For dual eligible SNPs, we
used the Medicaid indicator from the HMO payment files in the month of SNP enrollment and
for institutional SNPs we used the long-term nursing home indicator (LTI) flag.
Tables VI.1 through VI.3 present comparisons of demographic characteristics, health
indicators, and utilization for each of the three SNP types. Tables VI.4 and VI.5 present
characteristics for SNP enrollees in the dual eligible and institutional demonstration plans
separately.37
Table VI.6 presents results for dual eligible SNP enrollees, broken out by passive
enrollment status. The next set of tables – VI.7 through VI.11 – repeats these tables restricting
SNP enrollees to those who appear to meet the plan target criteria based on available data; we do
not repeat the table for institutional demonstrations since the data to identify the target
populations were not available. Because these comparisons cover the entire population of SNP
enrollees and their ENE counterparts and because we do not draw inferences about SNP behavior
in any other period, no statistical tests of these results were performed. Results from this chapter
should not be interpreted as an indication of behavior or outcomes in any other period.
36
Section 723 of the Medicare Prescription Drug, Improvement, and Modernization Act of 2003. Section 723
required the Secretary to make Medicare data readily available to researchers who are studying chronic illness in the
Medicare population. To support this effort, CMS contracted with the Iowa Foundation for Medical Care (IFMC) to
establish the Chronic Condition Data Warehouse (CCW). The CCW contains existing CMS beneficiary data (from
multiple data sources) linked by a unique identifier, allowing researchers to analyze information across the
continuum of care. The CCW currently contains data from fee-for-service Institutional and Non-institutional claims,
enrollment/eligibility, and assessment (all payers) data (Minimum Data Set, Outcome and Assessment Information
Set, swing bed assessments, and Inpatient Rehabilitation Facility Patient Assessment Instrument) from January 1,
1999 forward for a random 5 percent Medicare beneficiary population, and 100 percent of the Medicare beneficiary
population for January 1, 2005 forward.
37 Since a few of the institutional SNPs (Wisconsin Partnership and Elderplan SHMO) plans enrolled
community-based nursing home certifiable beneficiaries, our ENE group (and target identification) is not ideal; they
are left out of the SNP target group comparison.

74
B. RESULTS
SNP enrollees were more likely to enroll from managed care arrangements than from fee-
for-service, except for dual eligible SNPs. Most dual eligible SNP enrollees were in fee-for-
service the month prior to first SNP enrollment (Table VI.1), perhaps due to the larger number
who were passively enrolled from Medicaid managed care. On the other hand, the majority of
institutional and chronic condition SNP enrollees were likely to be in managed care
arrangements in the month prior to SNP enrollment. (This is consistent with the findings in Table
II.3 that found that institutional and chronic care SNP enrollees were more likely to have been
redesignated or transferred from managed care plans.)
In very broad terms, SNP enrollees resemble their ENE counterparts in terms of age and
gender, but are more likely to be minorities. Members of chronic condition SNPs tend to be
younger than their ENE counterparts, reflecting the greater proportion of disabled beneficiaries
in such SNPs compared to the eligible population (Table VI.1). SNP enrollees in all types were
generally less likely to be white, with the exception of the dual eligible demonstrations (Table
VI.4).
The comparison of health characteristics suggests that SNP enrollees are uniformly in
better health and have lower utilization than the members of the comparison groups. Members
of the comparison group are more likely to have been institutionalized in 2005, more likely to die
in 2006, and more likely to have had an inpatient stay, outpatient visit, or physician visit in 2005
than were SNP enrollees. SNP enrollees have lower risk scores than the comparison groups in all
SNP types. In nearly every instance, SNP enrollees are less likely to exhibit chronic conditions
as indicated by presence of HCC codes for COPD, diabetes, heart failure, and other common
conditions, than were members of the comparison group.
In part, these results surely reflect the presence of SNP members who did not meet the target
criteria who were enrolled in disproportionate-percentage SNPs; this is examined below. But the
presence of some beneficiaries who are not in the target population cannot account for all of the
differences in Tables VI.2 and VI.3. Though none of the chronic-condition SNPs operating in
2006 was approved as a disproportionate-percentage SNP, the differences between SNP and
ENE groups are no smaller for chronic-condition SNPs than for dual-eligible and institutional
SNPs.
Enrollees in dual eligible demonstration plans resemble their eligible non-enrolled
counterparts more closely than do other SNP enrollees. Table VI.4 shows the same
comparisons for dual-eligible demonstration plans and their comparison group. Because the
demonstration SNPs have been operating for a longer period with ―SNP-like‖ enrolled
populations, they might constitute a more reliable indicator of differences among mature SNPs.
The comparisons do suggest differences, at least in some respects, from results seen in the earlier
tables. While SNP enrollees do seem to be more likely to reside in rural areas (see Table VI.1),
enrollees in demonstration SNPs were 10 times more likely to live in a rural county than were
members of the comparison groups. Those who entered the SNP from Medicare fee-for-service
(though not those entering from MA) were also more likely to have been institutionalized in
2005 than were members of the comparison group. While most of the chronic health conditions

75
shown in the table appear more prevalent in the comparison group, Medicare utilization in 2005
is quite similar for SNP enrollees and members of the comparison group. The risk scores are also
closer between the two groups than in the earlier tables. For members entering from fee-for-
service, the dual demonstration enrollees had a slightly higher death rate than those in the ENE
group.
Table VI.5 presents the characteristics of enrollees in the two institutional equivalent SNP
demonstration plans in 2005 and 2006 – the Wisconsin Partnership plans and the Elderplan
SHMO.38
Since the data to identify the appropriate comparison group of nursing home
certifiable community beneficiaries is unavailable, the table presents only the SNP enrollee data.
Compared to the entire institutional SNP sample (Table VI.1), the demonstration enrollees were
younger (due to age restrictions) and less likely to be white. The WPP plans and Elderplan had
fewer institutionalized enrollees, which is to be expected since these plans serve beneficiaries
who are nursing home certifiable but able to remain in the community with the support of the
services provided by the plans. The institutional-equivalent enrollees appear healthier than the
overall institutional SNP group in Tables VI.2 and VI.3: they had lower risk scores, were less
likely to die, and generally had lower prevalence of health conditions and lower utilization and
spending.
Enrollees who were passively enrolled from fee-for-service Medicare were more likely to
be disabled, but were otherwise similar in health status to SNP enrollees who were not
passively enrolled. Table VI.6 compares dual-eligible SNP members who were passively
enrolled, dual-eligible SNP members who were not passively enrolled, and beneficiaries in the
dual eligible ENE group from Table VI.1.39
Beneficiaries passively enrolled from fee-for-
service Medicare into dual-eligible SNPs were more likely to be disabled, to be institutionalized,
and to die, while less likely to be nonwhite than those who were not passively enrolled. Health
conditions of the two groups, as measured by risk score and by proportion with specified health
conditions, were similar. Both groups were less likely to be institutionalized or to die and were
in slightly better health than enrollees in the ENE group. While patterns were different for those
passively enrolled, the total number so enrolled was only about 8,000 beneficiaries, less than 5
percent of all those passively enrolled.
SNP enrollees who met the eligibility criteria for their SNP type were somewhat healthier
(in terms of HCC risk scores) than their eligible-but-not-enrolled counterparts in other MA
plans and in Medicare FFS. The results presented in Tables VI.1 and VI.2 include some
enrollees who did not meet the stated target criteria for the SNP, either because they were in a
38
As of 2007, the WPP plans were re-classified as dual eligible SNPs with Medicaid subsets. The Medicare
beneficiaries they serve are both dual eligible and nursing home certifiable. New enrollees must be community
resident or, if residing in a nursing home, able to return to the community on admission to the program.
39 This table does not include the small number of people passively enrolled by chronic condition and
institutional SNPs.

76
disproportionate percentage SNP plan, or possibly because the SNP inadvertently enrolled
people not meeting the eligibility criteria.40
Tables VI.7 through VI.11 present comparisons that
are similar to those presented in the earlier tables, but exclude SNP enrollees who did not meet
the SNP eligibility criteria. In general Tables VI.7 and VI.11 show that SNP enrollees (with the
possible exception of enrollees in chronic condition SNPs) appear healthier than their ENE
counterparts and have lower rates of pre-enrollment institutionalization and mortality along with
lower utilization and expenditure levels.
C. SUMMARY
The comparisons between SNP enrollees and eligible non-enrollees are limited by data
availability. Our construction of eligible non-enrolled groups for any plan may not reflect the
flexibility CMS provided to chronic condition SNPs in identifying eligible enrollees. For
example, the data are incomplete in identifying 2006 chronic care SNP enrollees who had the
conditions targeted by their plan at the time of enrollment in 2006. More recent data from 2006
and further study would aid the accuracy of these comparisons of the SNP target population with
those who did not enroll.
Nonetheless, the results do suggest that SNP enrollees are consistently healthier than the
eligible but not enrolled population, even when comparisons are restricted to target groups. Dual
demonstration enrollees and those passively enrolled into SNPs appear to resemble the non-
enrolled population more closely than do enrollees in other SNPs, but are nevertheless slightly
healthier than the non-enrolled population. It should be noted that the comparisons shown in this
chapter are based on early beneficiary enrollment experience in SNPs. The comparison groups
used here are composed of beneficiaries who, in 2006, remained in their 2005 arrangements –
whether fee-for-service or MA. The SNP enrollees used in the comparison all moved from either
fee-for-service or MA to a SNP. If beneficiaries who are particularly ill or at higher-than-
average risk are less likely to change their current status, as seems plausible, then the observed
differences between SNP enrollees and the two comparison groups may be in part an artifact of a
reluctance of those who are currently ill to enter new plans. If this is the case, one might expect
to see the differences between the groups diminish over time. The study period for this analysis
could not include the several years of enrollment experience that would be necessary to
determine whether observed differences persist over longer periods of enrollment.
40
The data available to identify the target group for the chronic care SNPs are not ideal in that they only
indicate presence of health conditions in 2005, where as beneficiaries did not enroll in a SNP until 2006.

77
TABLE VI.1
DEMOGRAPHIC CHARACTERISTICS OF SNP ENROLLEES AND THEIR ELIGIBLE NON ENROLLEE (ENE) COUNTERPARTS, 2005
Dual-Eligible SNP Previously in Medicare
FFS
Dual-Eligible SNP Previously in Medicare
MA
Chronic-Condition SNP Previously in Medicare
FFS
Chronic-Condition SNP Previously in Medicare
MA
Institutional SNP Previously in Medicare
FFS
Institutional SNP Previously in Medicare
MA
Characteristics SNP ENE SNP ENE SNP ENE SNP ENE SNP ENE SNP ENE
Total Number 388,715 2,154,744 125,552 300,130 16,515 903,913 50,002 419,503 14,768 198,777 26,060 14,691
Age
<65 42.3 47.5 24.7 19.7 30.8 13.1 21.0 7.0 10.0 10.2 4.2 6.1
65-74 29.9 23.6 38.9 33.0 37.1 34.4 47.1 38.4 20.0 14.5 36.7 15.6
75-84 19.4 18.3 25.8 31.9 23.9 36.3 24.5 40.5 32.8 34.5 34.2 37.0 85+ 8.5 10.6 10.6 15.4 8.2 16.2 7.5 14.1 37.2 40.9 25.0 41.4
Gender
Male 38.8 43.3 36.7 36.6 46.9 44.2 44.6 46.6 29.6 35.7 37.1 36.2 Female 61.2 56.7 63.3 63.4 53.1 55.8 55.4 53.4 70.3 64.3 62.9 63.8
Race
White 62.4 64.5 63.4 63.6 63.1 72.7 65.9 77.9 74.8 79.8 63.7 71.5
African American 17.6 22.2 17.0 21.8 9.8 12.1 6.5 9.7 20.1 16.7 29.1 22.0
Other 19.8 13.1 19.4 14.4 27.0 15.1 27.5 12.3 4.9 3.4 7.0 6.4
Missing Race 0.2 0.2 0.2 0.2 0.1 0.2 0.1 0.1 0.2 0.1 0.2 0.2
Medicare Eligibility
Aged 57.4 52.2 75.1 80.2 68.4 86.7 78.9 92.8 89.9 89.6 95.4 93.8
Disabled 40.2 47.7 24.0 19.8 24.0 12.8 20.6 7.0 9.1 10.3 4.2 6.2 ESRD 0.5 0.1 0.2 0.1 2.1 0.4 0.1 0.2 0.0 0.1 0.3 0.0
None/missing 1.9 0.0 0.7 0.0 5.4 0.0 0.4 0.0 1.0 0.0 0.1 0.0
Urban/Rural Urban 89.9 91.7 90.9 97.0 94.7 98.2 95.9 99.8 94.3 95.0 99.1 98.8
Rural 10.0 8.3 9.1 3.0 5.2 1.8 4.1 0.2 5.6 5.0 0.8 1.2 Missing 0.1 0.0 0.0 0.0 0.1 0.0 0.0 0.0 0.1 0.0 0.1 0.0
Source: CMS enrollment, claims, HCC, and HMO payment files; MDS; CCW Beneficiary Annual Summary File.
Notes: Includes SNP enrollees first enrolled in a SNP in 2006. Demographic characteristics were measured in late 2005. Sample excludes people who died in 2005, or who were new to Medicare in 2006. Dual SNP ENE group was identified as people living in counties served by dual SNPs who met the eligibility criteria for the dual SNP(s)–Full or partial Medicaid–in
the last quarter of 2005. Dual eligibility was drawn from MMA variables in the Medicare Beneficiary Database. Chronic condition SNP ENEs were identified as people living in chronic condition SNP counties who had the health conditions served by that chronic condition SNP(s), as identified by HCC condition flags in HCC data from CMS for 2005. Institutional SNP
ENEs were identified as people living in Institutional SNP counties who had MDS assessments (one 90-day or two or more) in 2005.
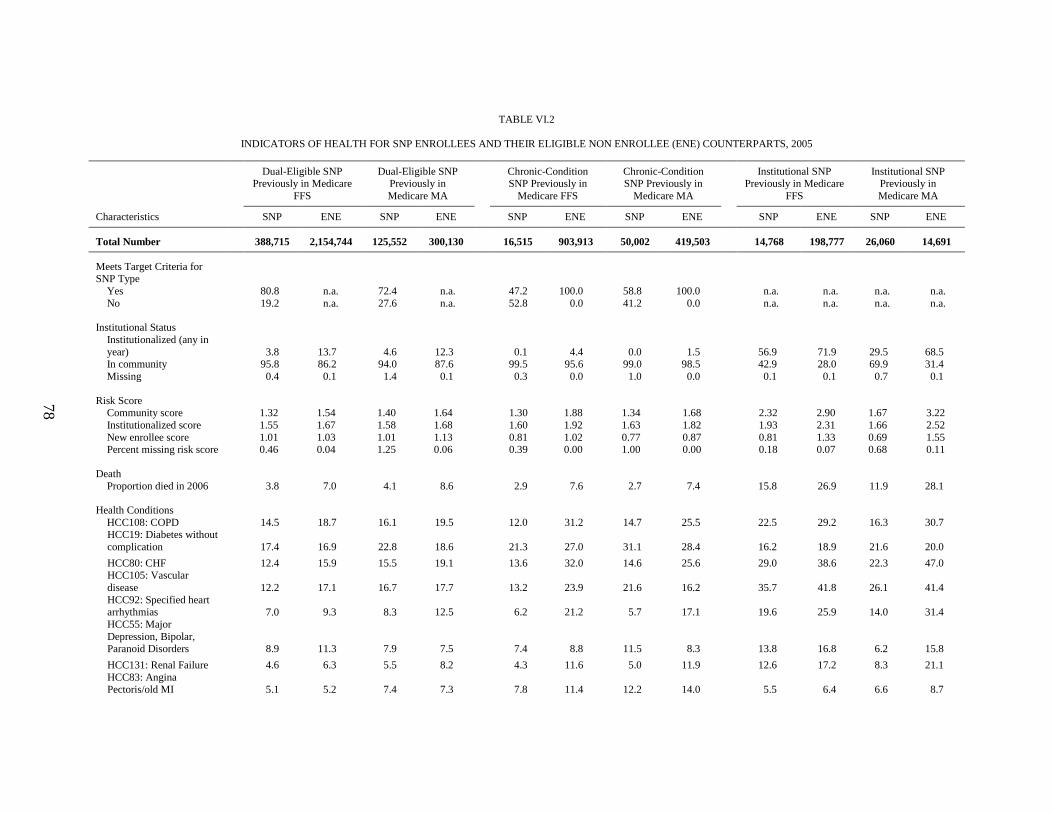
78
TABLE VI.2
INDICATORS OF HEALTH FOR SNP ENROLLEES AND THEIR ELIGIBLE NON ENROLLEE (ENE) COUNTERPARTS, 2005
Dual-Eligible SNP Previously in Medicare
FFS
Dual-Eligible SNP Previously in
Medicare MA
Chronic-Condition SNP Previously in
Medicare FFS
Chronic-Condition SNP Previously in
Medicare MA
Institutional SNP Previously in Medicare
FFS
Institutional SNP Previously in
Medicare MA
Characteristics SNP ENE SNP ENE SNP ENE SNP ENE SNP ENE SNP ENE
Total Number 388,715 2,154,744 125,552 300,130 16,515 903,913 50,002 419,503 14,768 198,777 26,060 14,691
Meets Target Criteria for SNP Type
Yes 80.8 n.a. 72.4 n.a. 47.2 100.0 58.8 100.0 n.a. n.a. n.a. n.a.
No 19.2 n.a. 27.6 n.a. 52.8 0.0 41.2 0.0 n.a. n.a. n.a. n.a.
Institutional Status
Institutionalized (any in
year) 3.8 13.7 4.6 12.3
0.1 4.4 0.0 1.5
56.9 71.9 29.5 68.5 In community 95.8 86.2 94.0 87.6 99.5 95.6 99.0 98.5 42.9 28.0 69.9 31.4
Missing 0.4 0.1 1.4 0.1 0.3 0.0 1.0 0.0 0.1 0.1 0.7 0.1
Risk Score
Community score 1.32 1.54 1.40 1.64 1.30 1.88 1.34 1.68 2.32 2.90 1.67 3.22
Institutionalized score 1.55 1.67 1.58 1.68 1.60 1.92 1.63 1.82 1.93 2.31 1.66 2.52
New enrollee score 1.01 1.03 1.01 1.13 0.81 1.02 0.77 0.87 0.81 1.33 0.69 1.55 Percent missing risk score 0.46 0.04 1.25 0.06 0.39 0.00 1.00 0.00 0.18 0.07 0.68 0.11
Death
Proportion died in 2006 3.8 7.0 4.1 8.6 2.9 7.6 2.7 7.4 15.8 26.9 11.9 28.1
Health Conditions
HCC108: COPD 14.5 18.7 16.1 19.5 12.0 31.2 14.7 25.5 22.5 29.2 16.3 30.7 HCC19: Diabetes without
complication 17.4 16.9 22.8 18.6 21.3 27.0 31.1 28.4 16.2 18.9 21.6 20.0
HCC80: CHF 12.4 15.9 15.5 19.1 13.6 32.0 14.6 25.6 29.0 38.6 22.3 47.0 HCC105: Vascular
disease 12.2 17.1 16.7 17.7 13.2 23.9 21.6 16.2 35.7 41.8 26.1 41.4
HCC92: Specified heart arrhythmias 7.0 9.3 8.3 12.5 6.2 21.2 5.7 17.1 19.6 25.9 14.0 31.4
HCC55: Major
Depression, Bipolar, Paranoid Disorders 8.9 11.3 7.9 7.5 7.4 8.8 11.5 8.3 13.8 16.8 6.2 15.8
HCC131: Renal Failure 4.6 6.3 5.5 8.2 4.3 11.6 5.0 11.9 12.6 17.2 8.3 21.1
HCC83: Angina Pectoris/old MI 5.1 5.2 7.4 7.3 7.8 11.4 12.2 14.0 5.5 6.4 6.6 8.7

TABLE VI.2 (continued)
79
Dual-Eligible SNP
Previously in Medicare
FFS
Dual-Eligible SNP
Previously in
Medicare MA
Chronic-Condition
SNP Previously in
Medicare FFS
Chronic-Condition
SNP Previously in
Medicare MA
Institutional SNP
Previously in Medicare
FFS
Institutional SNP
Previously in
Medicare MA
Characteristics SNP ENE SNP ENE SNP ENE SNP ENE SNP ENE SNP ENE
HCC10: Breast, Prostate,
Colorectal, Other Cancers 4.1 4.6 5.9 6.5 5.4 12.7 8.2 13.7 6.3 7.3 7.2 8.1
HCC96: Ischemic or unspecified stroke 4.3 6.6 5.5 7.4 5.2 7.9 6.2 6.1 15.9 21.7 8.7 23.1
Source: CMS enrollment, claims, HCC, and HMO payment files; MDS; CCW Beneficiary Annual Summary File.
Notes: Includes SNP enrollees first enrolled in a SNP in 2006. Risk score and health conditions apply to CY 2005. Sample excludes people who died in 2005, or who were new to Medicare in 2006. Dual SNP ENE group was identified as people living in counties served by dual SNPs who met the eligibility criteria for the dual SNP(s)–Full or partial Medicaid–in the last
quarter of 2005. Dual eligibility was drawn from MMA variables in the Medicare Beneficiary Database. Chronic condition SNP ENEs were identified as people living in chronic condition SNP counties who had the health conditions served by that chronic condition SNP(s), as identified by HCC condition flags in HCC data from CMS for 2005. Institutional SNP
ENEs were identified as people living in Institutional SNP counties who had MDS assessments (one 90-day or two or more) in 2005.
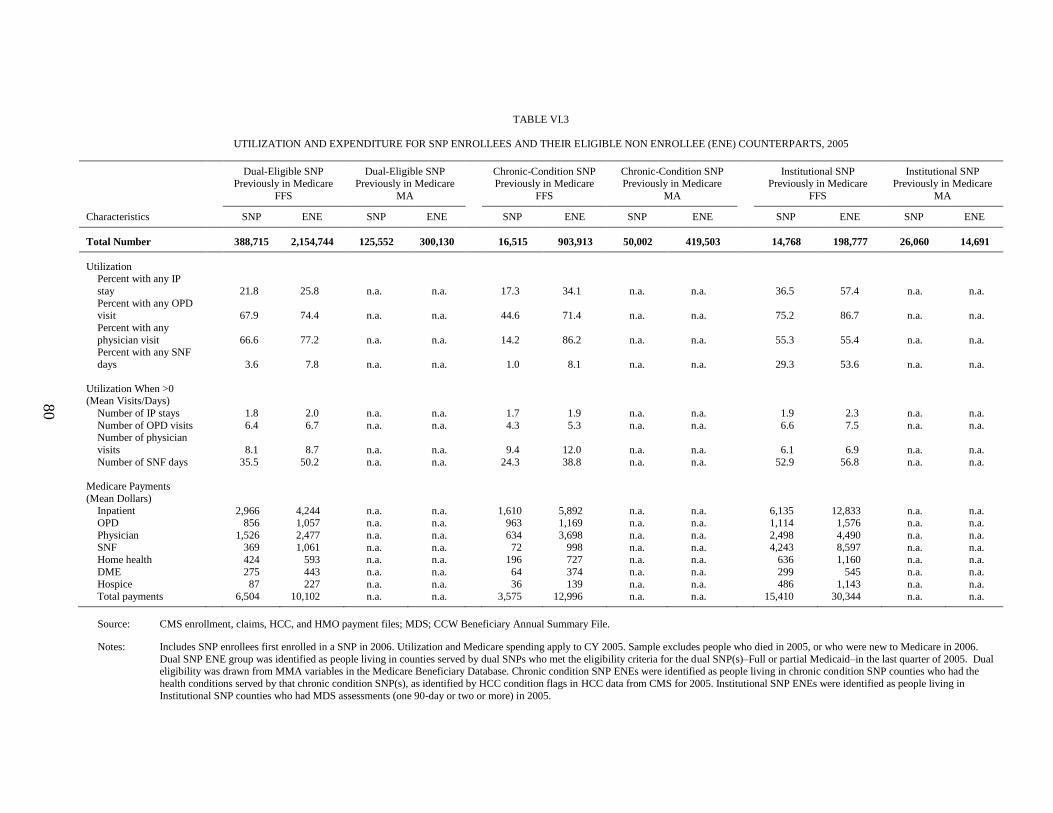
80
TABLE VI.3
UTILIZATION AND EXPENDITURE FOR SNP ENROLLEES AND THEIR ELIGIBLE NON ENROLLEE (ENE) COUNTERPARTS, 2005
Dual-Eligible SNP Previously in Medicare
FFS
Dual-Eligible SNP Previously in Medicare
MA
Chronic-Condition SNP Previously in Medicare
FFS
Chronic-Condition SNP Previously in Medicare
MA
Institutional SNP Previously in Medicare
FFS
Institutional SNP Previously in Medicare
MA
Characteristics SNP ENE SNP ENE SNP ENE SNP ENE SNP ENE SNP ENE
Total Number 388,715 2,154,744 125,552 300,130 16,515 903,913 50,002 419,503 14,768 198,777 26,060 14,691
Utilization
Percent with any IP
stay
21.8 25.8 n.a. n.a.
17.3 34.1 n.a. n.a.
36.5 57.4 n.a. n.a.
Percent with any OPD visit
67.9 74.4 n.a. n.a.
44.6 71.4 n.a. n.a.
75.2 86.7 n.a. n.a.
Percent with any
physician visit
66.6 77.2 n.a. n.a.
14.2 86.2 n.a. n.a.
55.3 55.4 n.a. n.a. Percent with any SNF
days
3.6 7.8 n.a. n.a.
1.0 8.1 n.a. n.a.
29.3 53.6 n.a. n.a.
Utilization When >0 (Mean Visits/Days)
Number of IP stays 1.8 2.0 n.a. n.a. 1.7 1.9 n.a. n.a. 1.9 2.3 n.a. n.a.
Number of OPD visits 6.4 6.7 n.a. n.a. 4.3 5.3 n.a. n.a. 6.6 7.5 n.a. n.a. Number of physician
visits
8.1 8.7 n.a. n.a.
9.4 12.0 n.a. n.a.
6.1 6.9 n.a. n.a.
Number of SNF days 35.5 50.2 n.a. n.a. 24.3 38.8 n.a. n.a. 52.9 56.8 n.a. n.a.
Medicare Payments
(Mean Dollars)
Inpatient 2,966 4,244 n.a. n.a. 1,610 5,892 n.a. n.a. 6,135 12,833 n.a. n.a. OPD 856 1,057 n.a. n.a. 963 1,169 n.a. n.a. 1,114 1,576 n.a. n.a.
Physician 1,526 2,477 n.a. n.a. 634 3,698 n.a. n.a. 2,498 4,490 n.a. n.a. SNF 369 1,061 n.a. n.a. 72 998 n.a. n.a. 4,243 8,597 n.a. n.a. Home health 424 593 n.a. n.a. 196 727 n.a. n.a. 636 1,160 n.a. n.a.
DME 275 443 n.a. n.a. 64 374 n.a. n.a. 299 545 n.a. n.a.
Hospice 87 227 n.a. n.a. 36 139 n.a. n.a. 486 1,143 n.a. n.a. Total payments 6,504 10,102 n.a. n.a. 3,575 12,996 n.a. n.a. 15,410 30,344 n.a. n.a.
Source: CMS enrollment, claims, HCC, and HMO payment files; MDS; CCW Beneficiary Annual Summary File.
Notes: Includes SNP enrollees first enrolled in a SNP in 2006. Utilization and Medicare spending apply to CY 2005. Sample excludes people who died in 2005, or who were new to Medicare in 2006.
Dual SNP ENE group was identified as people living in counties served by dual SNPs who met the eligibility criteria for the dual SNP(s)–Full or partial Medicaid–in the last quarter of 2005. Dual eligibility was drawn from MMA variables in the Medicare Beneficiary Database. Chronic condition SNP ENEs were identified as people living in chronic condition SNP counties who had the
health conditions served by that chronic condition SNP(s), as identified by HCC condition flags in HCC data from CMS for 2005. Institutional SNP ENEs were identified as people living in
Institutional SNP counties who had MDS assessments (one 90-day or two or more) in 2005.

81
TABLE VI.4
CHARACTERISTICS OF DUAL-ELIGIBLE DEMONSTRATION SNP ENROLLEES AND THEIR ELIGIBLE
NON ENROLLEE (ENE) COUNTERPARTS, 2005
Previously in Medicare FFS Previously in Medicare MA
Beneficiary Characteristics SNP ENE SNP ENE
Total Number 32,162 53,281 14,826 9,266
Age
<65 1.8 0.0 2.0 0.0
65-74 30.5 41.6 34.5 21.5
75-84 33.6 33.9 35.1 37.9
85+ 34.2 24.5 28.5 40.6
Gender
Male 27.7 33.3 25.9 24.9
Female 72.3 66.7 74.1 75.1
Race
White 84.5 82.9 75.6 92.4
African American 4.6 8.2 7.5 4.5
Other 10.6 8.6 16.5 2.9
Missing Race 0.3 0.2 0.4 0.1
Medicare Eligibility
Aged 97.3 99.3 97.3 99.8
Disabled 1.5 0.7 2.1 0.2
ESRD 0.6 0.0 0.6 0.0
None/missing 0.5 0.0 0.0 0.0
Urban/Rural
Urban 56.9 95.7 74.4 98.5
Rural 43.1 4.3 25.5 1.5
Missing 0.0 0.0 0.0 0.0
Meets Target Criteria for SNP Type
Yes 89.5 n.a. 92.5 n.a.
No 10.5 n.a. 7.5 n.a.
Missing 0.0 n.a. 0.0 n.a.
Nursing Home Certifiable
NHC Yes 20.7 n.a. 26.6 n.a.
NHC No 79.3 n.a. 73.4 n.a.
Institutional Status
Institutionalized (any in year) 33.7 26.2 27.3 44.8
In community 66.1 73.7 71.7 55.2
Missing 0.3 0.1 1.1 0.0
Risk Score
In community 1.64 1.79 1.64 1.92
Institutionalized 1.53 1.70 1.56 1.66
New 1.09 1.27 1.05 0.0
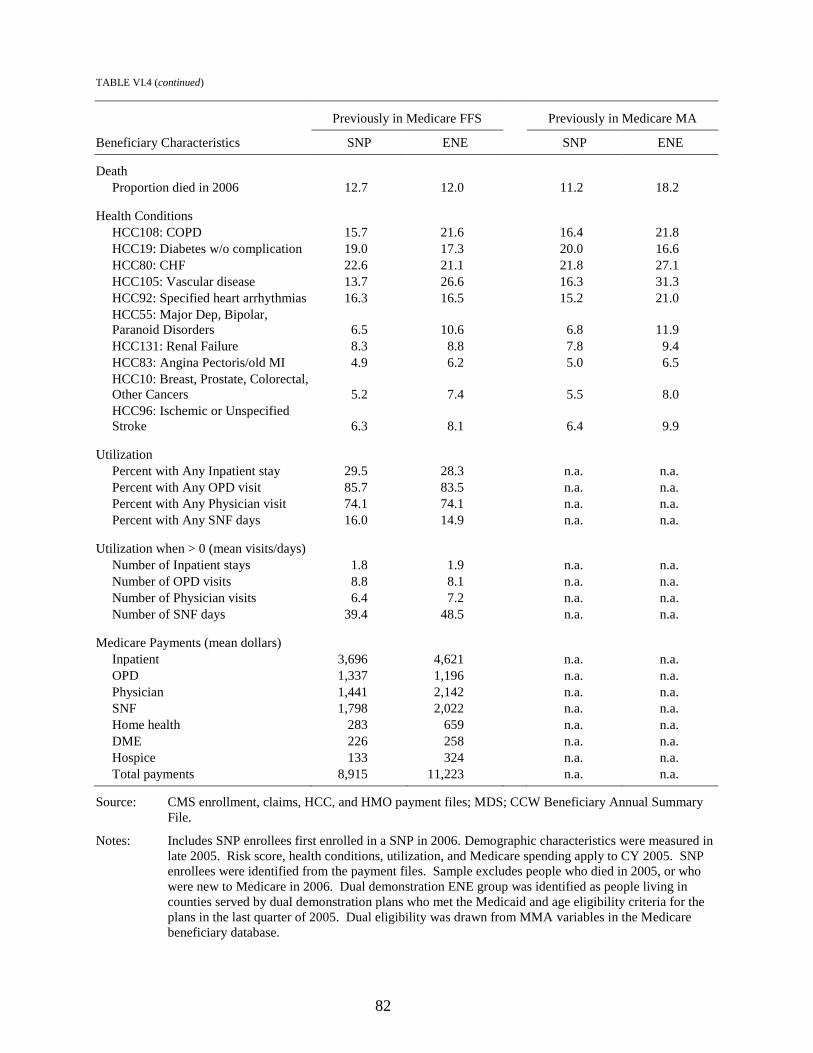
TABLE VI.4 (continued)
82
Previously in Medicare FFS Previously in Medicare MA
Beneficiary Characteristics SNP ENE SNP ENE
Death
Proportion died in 2006 12.7 12.0 11.2 18.2
Health Conditions
HCC108: COPD 15.7 21.6 16.4 21.8
HCC19: Diabetes w/o complication 19.0 17.3 20.0 16.6
HCC80: CHF 22.6 21.1 21.8 27.1
HCC105: Vascular disease 13.7 26.6 16.3 31.3
HCC92: Specified heart arrhythmias 16.3 16.5 15.2 21.0
HCC55: Major Dep, Bipolar,
Paranoid Disorders 6.5 10.6
6.8 11.9
HCC131: Renal Failure 8.3 8.8 7.8 9.4
HCC83: Angina Pectoris/old MI 4.9 6.2 5.0 6.5
HCC10: Breast, Prostate, Colorectal,
Other Cancers 5.2 7.4
5.5 8.0
HCC96: Ischemic or Unspecified
Stroke 6.3 8.1 6.4 9.9
Utilization
Percent with Any Inpatient stay 29.5 28.3 n.a. n.a.
Percent with Any OPD visit 85.7 83.5 n.a. n.a.
Percent with Any Physician visit 74.1 74.1 n.a. n.a.
Percent with Any SNF days 16.0 14.9 n.a. n.a.
Utilization when > 0 (mean visits/days)
Number of Inpatient stays 1.8 1.9 n.a. n.a.
Number of OPD visits 8.8 8.1 n.a. n.a.
Number of Physician visits 6.4 7.2 n.a. n.a.
Number of SNF days 39.4 48.5 n.a. n.a.
Medicare Payments (mean dollars)
Inpatient 3,696 4,621 n.a. n.a.
OPD 1,337 1,196 n.a. n.a.
Physician 1,441 2,142 n.a. n.a.
SNF 1,798 2,022 n.a. n.a.
Home health 283 659 n.a. n.a.
DME 226 258 n.a. n.a.
Hospice 133 324 n.a. n.a.
Total payments 8,915 11,223 n.a. n.a.
Source: CMS enrollment, claims, HCC, and HMO payment files; MDS; CCW Beneficiary Annual Summary
File.
Notes: Includes SNP enrollees first enrolled in a SNP in 2006. Demographic characteristics were measured in
late 2005. Risk score, health conditions, utilization, and Medicare spending apply to CY 2005. SNP
enrollees were identified from the payment files. Sample excludes people who died in 2005, or who
were new to Medicare in 2006. Dual demonstration ENE group was identified as people living in
counties served by dual demonstration plans who met the Medicaid and age eligibility criteria for the
plans in the last quarter of 2005. Dual eligibility was drawn from MMA variables in the Medicare
beneficiary database.

83
TABLE VI.5
CHARACTERISTICS OF INSTITUTIONAL EQUIVALENT SNP ENROLLEES
(WPP AND SHMO), 2005
Characteristics Previously in Medicare FFS Previously in Medicare MA
Total Number 2,649 17,972
Age
<65 16.2 3.1
65-74 45.7 47.9
75-84 26.7 34.8
85+ 11.4 14.2
Gender
Male 38.7 41.9
Female 61.3 58.1
Race
White 50.3 55.2
African American 34.4 35.5
Other 15.1 9.2
Missing Race 0.1 0.2
Medicare Eligibility
Aged 83.8 96.5
Disabled 11.5 3.0
ESRD 0.0 0.4
None/missing 4.7 0.1
Urban/Rural
Urban 96.9 98.9
Rural 3.0 0.9
Missing 0.1 0.2
Meets Target Criteria for SNP Type
Yes 5.7 33.5
No 94.3 66.5
Nursing Home Certifiable
NHC Yes 5.3 32.1
NHC No 94.7 67.9
Institutional Status
Institutionalized (any in year) 1.2 1.9
In community 98.5 97.5
Missing 0.4 0.7
Risk Score
Community score 1.41 1.37
Institutionalized score 1.56 1.57
New enrollee score 0.73 0.69
Death
Proportion died in 2006 2.9 5.3
Health Conditions
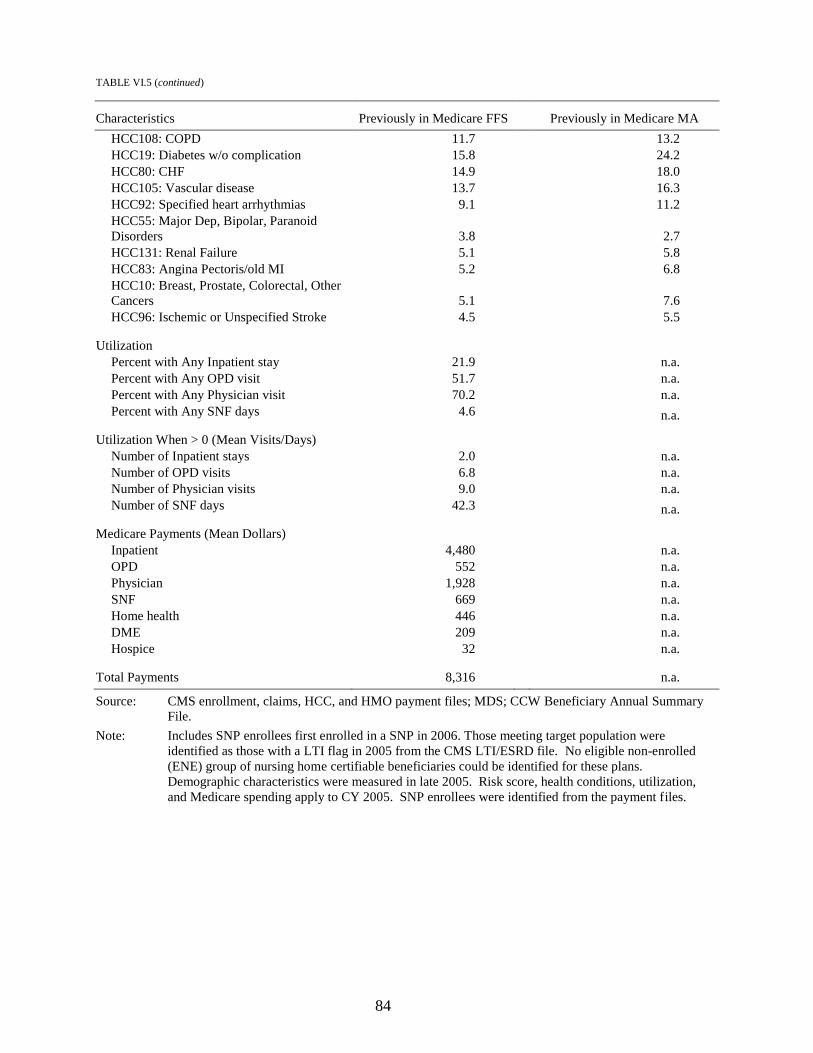
TABLE VI.5 (continued)
84
Characteristics Previously in Medicare FFS Previously in Medicare MA
HCC108: COPD 11.7 13.2
HCC19: Diabetes w/o complication 15.8 24.2
HCC80: CHF 14.9 18.0
HCC105: Vascular disease 13.7 16.3
HCC92: Specified heart arrhythmias 9.1 11.2
HCC55: Major Dep, Bipolar, Paranoid
Disorders 3.8 2.7
HCC131: Renal Failure 5.1 5.8
HCC83: Angina Pectoris/old MI 5.2 6.8
HCC10: Breast, Prostate, Colorectal, Other
Cancers 5.1 7.6
HCC96: Ischemic or Unspecified Stroke 4.5 5.5
Utilization
Percent with Any Inpatient stay 21.9 n.a.
Percent with Any OPD visit 51.7 n.a.
Percent with Any Physician visit 70.2 n.a.
Percent with Any SNF days 4.6 n.a.
Utilization When > 0 (Mean Visits/Days)
Number of Inpatient stays 2.0 n.a.
Number of OPD visits 6.8 n.a.
Number of Physician visits 9.0 n.a.
Number of SNF days 42.3 n.a.
Medicare Payments (Mean Dollars)
Inpatient 4,480 n.a.
OPD 552 n.a.
Physician 1,928 n.a.
SNF 669 n.a.
Home health 446 n.a.
DME 209 n.a.
Hospice 32 n.a.
Total Payments 8,316 n.a.
Source: CMS enrollment, claims, HCC, and HMO payment files; MDS; CCW Beneficiary Annual Summary
File.
Note: Includes SNP enrollees first enrolled in a SNP in 2006. Those meeting target population were
identified as those with a LTI flag in 2005 from the CMS LTI/ESRD file. No eligible non-enrolled
(ENE) group of nursing home certifiable beneficiaries could be identified for these plans.
Demographic characteristics were measured in late 2005. Risk score, health conditions, utilization,
and Medicare spending apply to CY 2005. SNP enrollees were identified from the payment files.

85
TABLE VI.6
CHARACTERISTICS OF DUAL-ELIGIBLE SNP ENROLLEES, BY PASSIVE ENROLLMENT, AND THEIR ELIGIBLE
NON ENROLLEE (ENE) COUNTERPARTS, 2005
Previously in Medicare FFS Previously in Medicare MA
Characteristics
SNP Passively
Enrolled
SNP Not
Passively
Enrolled ENE
SNP Passively
Enrolled
SNP Not
Passively
Enrolled ENE
Total Number 195,613 193,102 2,154,744 8,060 117,492 300,130
Age
<65 47.6 36.9 47.5 19.3 25.0 19.7
65-74 25.1 34.7 23.6 32.8 39.3 33.0
75-84 18.3 20.5 18.3 29.8 25.6 31.9
85+ 9.0 7.9 10.6 18.1 10.1 15.4
Gender
Male 38.9 38.7 43.3 29.5 37.2 36.6
Female 61.1 61.3 56.7 70.5 62.8 63.4
Race
White 67.9 56.8 64.5 80.9 62.2 63.6
African American 15.4 19.9 22.2 10.8 17.5 21.8
Other 16.5 23.1 13.1 8.1 20.1 14.4
Missing Race 0.2 0.2 0.2 0.2 0.2 0.2
Medicare Eligibility
Aged 52.0 62.9 52.2 80.2 74.7 80.2
Disabled 47.1 33.2 47.7 19.5 24.3 19.8
ESRD 0.8 0.2 0.1 0.3 0.2 0.1
None/missing 0.1 3.6 0.0 0.0 0.7 0.0
Urban/Rural
Urban 87.5 92.3 91.7 67.6 92.5 97.0
Rural 12.4 7.6 8.3 32.4 7.5 3.0
Missing 0.1 0.1 0.0 - 0.0 0.0
Meets Target Criteria for SNP Type
Yes 97.7 63.7 n.a. 97.0 70.7 n.a.
No 2.3 36.3 n.a. 3.0 29.3 n.a.
Institutional Status
Institutionalized (any in year) 5.9 1.8 13.7 10.3 4.2 12.3
In community 93.8 97.7 86.2 88.0 94.4 87.6
Missing 0.3 0.5 0.1 1.7 1.3 0.1
Risk Score
Community score 1.32 1.31 1.54 1.67 1.38 1.64
Institutionalized score 1.55 1.54 1.67 1.69 1.57 1.68
New enrollee score 1.02 1.01 1.03 1.04 1.01 1.13
Death
Proportion died in 2006 5.0 2.6 7.0 8.5 3.8 8.6
Health Conditions
HCC108: COPD 15.2 13.9 18.7 20.6 15.8 19.5
HCC19: Diabetes w/o complication 15.9 19.0 16.9 21.4 22.8 18.6
HCC80: CHF 12.1 12.7 15.9 22.4 15.0 19.1
HCC105: Vascular disease 11.6 12.8 17.1 16.0 16.7 17.7
HCC92: Specified heart arrhythmias 7.7 6.3 9.3 14.3 7.9 12.5
HCC55: Major Dep, Bipolar, Paranoid Disorders 9.7 8.2 11.3 6.2 8.0 7.5
HCC131: Renal Failure 4.9 4.3 6.3 8.2 5.3 8.2
HCC83: Angina Pectoris/old MI 4.2 6.0 5.2 7.0 7.4 7.3

TABLE VI.6 (continued)
86
Previously in Medicare FFS Previously in Medicare MA
Characteristics
SNP Passively
Enrolled
SNP Not
Passively
Enrolled ENE
SNP Passively
Enrolled
SNP Not
Passively
Enrolled ENE
HCC10: Breast, Prostate,
Colorectal, Other Cancers 3.7 4.5 4.6 5.5 5.9 6.5
HCC96: Ischemic or Unspecified Stroke 4.0 4.6 6.6 5.7 5.5 7.4
Utilization
Percent with Any Inpatient stay 23.0 20.5 25.8 n.a. n.a. n.a.
Percent with Any OPD visit 73.9 61.6 74.4 n.a. n.a. n.a.
Percent with Any Physician visit 78.9 53.8 77.2 n.a. n.a. n.a.
Percent with Any SNF days 4.2 2.8 7.8 n.a. n.a. n.a.
Utilization when > 0 (mean visits/
days)
Number of Inpatient stays 1.9 1.8 2.0 n.a. n.a. n.a.
Number of OPD visits 6.7 6.0 6.7 n.a. n.a. n.a.
Number of Physician visits 7.9 8.5 8.7 n.a. n.a. n.a.
Number of SNF days 35.1 36.3 50.2 n.a. n.a. n.a.
Medicare Payments (Mean Dollars)
Inpatient 3,350 2,566 4,244 n.a. n.a. n.a.
OPD 1,045 659 1,057 n.a. n.a. n.a.
Physician 1,752 1,290 2,477 n.a. n.a. n.a.
SNF 430 305 1,061 n.a. n.a. n.a.
Home health 428 420 593 n.a. n.a. n.a.
DME 322 226 443 n.a. n.a. n.a.
Hospice 107 66 227 n.a. n.a. n.a.
Total Payments 7,436 5,532 10,102 n.a. n.a. n.a.
Source: CMS enrollment, claims, HCC, and HMO payment files; MDS; CCW Beneficiary Annual Summary File. Medicare Beneficiary Database (MBD) for passive enrollment information.
Note: Includes SNP enrollees first enrolled in a SNP in 2006. Demographic characteristics were measured in late 2005. Risk score, health conditions, utilization, and Medicare spending apply to CY 2005. SNP enrollees were identified from the payment files. Sample
excludes people who died in 2005, or who were new to Medicare in 2006. Dual SNP ENE group was identified as people living in
counties served by Dual SNPs who met the eligibility criteria for the Dual SNP(s)–Full or partial Medicaid–in the last quarter of 2005. Dual eligibility was drawn from MMA variables in the Medicare Beneficiary Database.
As described in Chapter II, passive enrollment was permitted on a one-time basis in January, 2006. Passive enrollees were identified as those identified in the MBD with a Part D opt-out reason code of ―SNP‖ and who were enrolled into a SNP approved
for passive enrollment between August 2005 and May 2006. This table does not include the small number of beneficiaries who were
passively enrolled by chronic disease or institutional SNPs.

87
TABLE VI.7
DEMOGRAPHIC CHARACTERISTICS OF SNP ENROLLEES MEETING TARGET CRITERIA AND THEIR ELIGIBLE NON ENROLLEE (ENE) COUNTERPARTS, 2005
Dual-Eligible SNP Previously in Medicare
FFS
Dual-Eligible SNP Previously in Medicare
MA
Chronic-Condition SNP Previously in Medicare
FFS
Chronic-Condition SNP Previously in Medicare
MA
Institutional SNP Previously in Medicare
FFS
Institutional SNP Previously in Medicare
MA
Characteristics SNP ENE SNP ENE SNP ENE SNP ENE SNP ENE SNP ENE
Total Number 314,018 2,154,744 90,838 300,130 7,800 903,913 29,388 419,503 8,378 198,777 7,345 14,691
Age
<65 43.2 47.5 23.2 19.7 26.8 13.1 19.3 7.0 9.0 10.2 6.7 6.1
65-74 29.2 23.6 38.5 33.0 35.2 34.4 46.5 38.4 14.0 14.5 11.7 15.6
75-84 19.4 18.3 27.3 31.9 28.3 36.3 26.3 40.5 33.8 34.5 32.6 37.0 85+ 8.1 10.6 11.1 15.4 9.7 16.2 7.9 14.1 43.2 40.9 49.1 41.4
Gender
Male 37.6 43.3 34.6 36.6 46.0 44.2 45.1 46.6 28.0 35.7 26.3 36.2 Female 62.4 56.7 65.4 63.4 54.0 55.8 54.9 53.4 72.0 64.3 73.7 63.8
Race
White 61.9 64.5 63.2 63.6 59.4 72.7 65.0 77.9 79.2 79.8 82.4 71.5
African American 19.3 22.2 19.3 21.8 11.2 12.1 6.3 9.7 18.1 16.7 15.2 22.0
Other 18.6 13.1 17.3 14.4 29.3 15.1 28.5 12.3 2.5 3.4 2.2 6.4
Missing Race 0.2 0.2 0.2 0.2 0.2 0.2 0.1 0.1 0.2 0.1 0.2 0.2
Medicare Eligibility
Aged 56.5 52.2 76.5 80.2 71.7 86.7 80.6 92.8 90.9 89.6 93.0 93.8
Disabled 41.8 47.7 22.7 19.8 23.8 12.8 19.3 7.0 8.9 10.3 6.9 6.2 ESRD 0.6 0.1 0.3 0.1 4.2 0.4 0.1 0.2 0.0 0.1 0.1 0.0
None/missing 1.2 0.0 0.5 0.0 0.2 0.0 0.0 0.0 0.2 0.0 0.0 0.0
Urban/Rural Urban 89.2 91.7 89.5 97.0 95.0 98.2 95.8 99.8 94.0 95.0 99.6 98.8
Rural 10.7 8.3 10.4 3.0 4.8 1.8 4.1 0.2 5.9 5.0 0.4 1.2 Missing 0.1 0.0 0.0 0.0 0.1 0.0 0.0 0.0 0.1 0.0 0.0 0.0
Source: CMS enrollment, claims, HCC, and HMO payment files; MDS; CCW Beneficiary Annual Summary File.
Note: Includes SNP enrollees first enrolled in a SNP in 2006. Demographic characteristics were measured in late 2005. SNP enrollees were identified from the payment files. Sample excludes people who died in 2005, or who were new to Medicare in 2006. Dual SNP ENE group was identified as people living in counties served by Dual SNPs who met the eligibility criteria for
the Dual SNP(s)–Full or partial Medicaid–in the last quarter of 2005. Dual eligibility was drawn from MMA variables in the Medicare Beneficiary Database. SNP Enrollees meeting the target criteria for dual eligible SNPs were identified by a current status of Medicaid on the HMO payment file in the month they enrolled. Chronic condition SNP ENEs were identified as
people living in chronic condition SNP counties who had the health conditions served by that chronic condition SNP(s), as identified by HCC condition flags in HCC data from CMS for
2005. SNP enrollees meeting the target criteria for chronic disease SNPs were identified by indicators for the relevant disease conditions for the SNP in the CY 2005 HCC file. HCCs for 2006 were not available for this report. Institutional SNP ENEs were identified as people living in institutional SNP counties who had MDS assessments (one 90-day or two or more) in 2005.
Enrollees meeting target criteria for institutional SNPs were identified by a long term institutional (LTI) flag in CY 2005 from the CMS LTI/ESRD file.
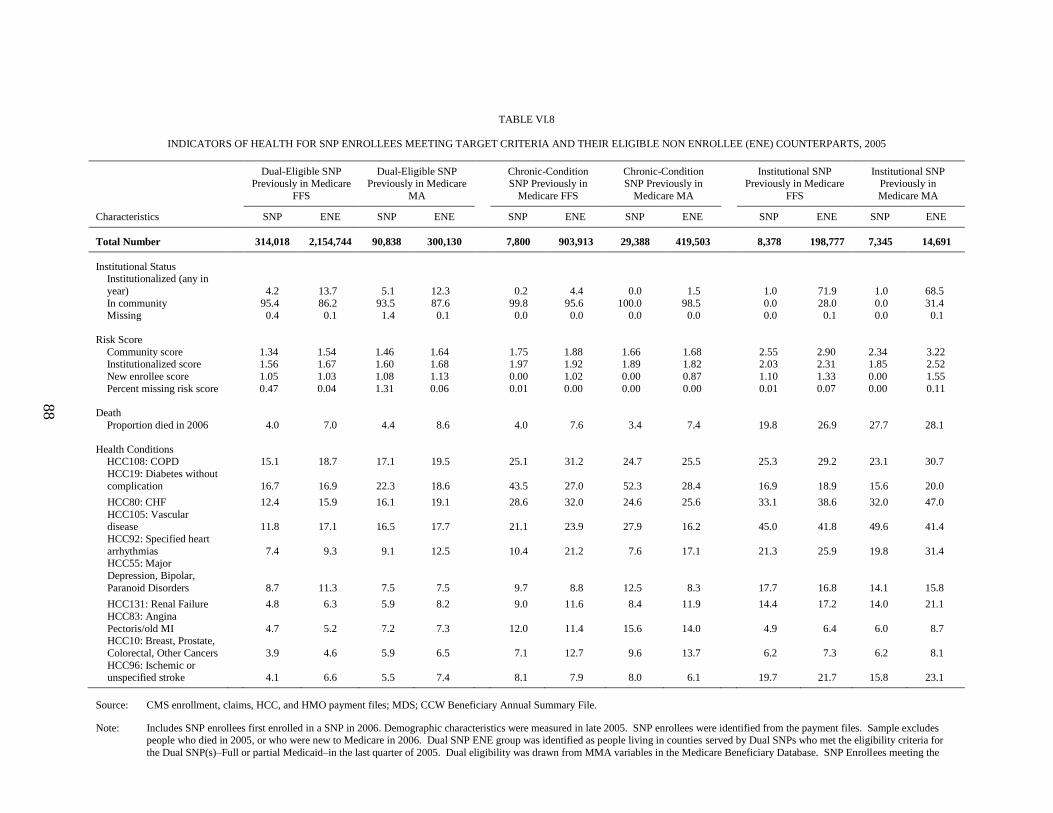
88
TABLE VI.8
INDICATORS OF HEALTH FOR SNP ENROLLEES MEETING TARGET CRITERIA AND THEIR ELIGIBLE NON ENROLLEE (ENE) COUNTERPARTS, 2005
Dual-Eligible SNP Previously in Medicare
FFS
Dual-Eligible SNP Previously in Medicare
MA
Chronic-Condition SNP Previously in
Medicare FFS
Chronic-Condition SNP Previously in
Medicare MA
Institutional SNP Previously in Medicare
FFS
Institutional SNP Previously in
Medicare MA
Characteristics SNP ENE SNP ENE SNP ENE SNP ENE SNP ENE SNP ENE
Total Number 314,018 2,154,744 90,838 300,130 7,800 903,913 29,388 419,503 8,378 198,777 7,345 14,691
Institutional Status Institutionalized (any in
year) 4.2 13.7 5.1 12.3
0.2 4.4 0.0 1.5
1.0 71.9 1.0 68.5
In community 95.4 86.2 93.5 87.6 99.8 95.6 100.0 98.5 0.0 28.0 0.0 31.4 Missing 0.4 0.1 1.4 0.1 0.0 0.0 0.0 0.0 0.0 0.1 0.0 0.1
Risk Score
Community score 1.34 1.54 1.46 1.64 1.75 1.88 1.66 1.68 2.55 2.90 2.34 3.22 Institutionalized score 1.56 1.67 1.60 1.68 1.97 1.92 1.89 1.82 2.03 2.31 1.85 2.52
New enrollee score 1.05 1.03 1.08 1.13 0.00 1.02 0.00 0.87 1.10 1.33 0.00 1.55
Percent missing risk score 0.47 0.04 1.31 0.06 0.01 0.00 0.00 0.00 0.01 0.07 0.00 0.11
Death
Proportion died in 2006 4.0 7.0 4.4 8.6 4.0 7.6 3.4 7.4 19.8 26.9 27.7 28.1
Health Conditions HCC108: COPD 15.1 18.7 17.1 19.5 25.1 31.2 24.7 25.5 25.3 29.2 23.1 30.7
HCC19: Diabetes without
complication 16.7 16.9 22.3 18.6 43.5 27.0 52.3 28.4 16.9 18.9 15.6 20.0
HCC80: CHF 12.4 15.9 16.1 19.1 28.6 32.0 24.6 25.6 33.1 38.6 32.0 47.0
HCC105: Vascular disease 11.8 17.1 16.5 17.7 21.1 23.9 27.9 16.2 45.0 41.8 49.6 41.4
HCC92: Specified heart
arrhythmias 7.4 9.3 9.1 12.5 10.4 21.2 7.6 17.1 21.3 25.9 19.8 31.4 HCC55: Major
Depression, Bipolar,
Paranoid Disorders 8.7 11.3 7.5 7.5 9.7 8.8 12.5 8.3 17.7 16.8 14.1 15.8
HCC131: Renal Failure 4.8 6.3 5.9 8.2 9.0 11.6 8.4 11.9 14.4 17.2 14.0 21.1
HCC83: Angina
Pectoris/old MI 4.7 5.2 7.2 7.3 12.0 11.4 15.6 14.0 4.9 6.4 6.0 8.7 HCC10: Breast, Prostate,
Colorectal, Other Cancers 3.9 4.6 5.9 6.5 7.1 12.7 9.6 13.7 6.2 7.3 6.2 8.1
HCC96: Ischemic or unspecified stroke 4.1 6.6 5.5 7.4 8.1 7.9 8.0 6.1 19.7 21.7 15.8 23.1
Source: CMS enrollment, claims, HCC, and HMO payment files; MDS; CCW Beneficiary Annual Summary File.
Note: Includes SNP enrollees first enrolled in a SNP in 2006. Demographic characteristics were measured in late 2005. SNP enrollees were identified from the payment files. Sample excludes people who died in 2005, or who were new to Medicare in 2006. Dual SNP ENE group was identified as people living in counties served by Dual SNPs who met the eligibility criteria for
the Dual SNP(s)–Full or partial Medicaid–in the last quarter of 2005. Dual eligibility was drawn from MMA variables in the Medicare Beneficiary Database. SNP Enrollees meeting the

TABLE VI.8 (continued)
89
target criteria for dual eligible SNPs were identified by a current status of Medicaid on the HMO payment file in the month they enrolled. Chronic condition SNP ENEs were identified as
people living in chronic condition SNP counties who had the health conditions served by that chronic condition SNP(s), as identified by HCC condition flags in HCC data from CMS for
2005. SNP enrollees meeting the target criteria for chronic disease SNPs were identified by indicators for the relevant disease conditions for the SNP in the CY 2005 HCC file. HCCs for 2006 were not available for this report. Institutional SNP ENEs were identified as people living in institutional SNP counties who had MDS assessments (one 90-day or two or more) in 2005.
Enrollees meeting target criteria for institutional SNPs were identified by a long term institutional (LTI) flag in CY 2005 from the CMS LTI/ESRD file.

90
TABLE VI.9
UTILIZATION AND EXPENDITURE FOR SNP ENROLLEES MEETING TARGET CRITERIA AND THEIR ELIGIBLE NON ENROLLEE (ENE) COUNTERPARTS, 2005
Dual-Eligible SNP Previously in Medicare
FFS
Dual-Eligible SNP Previously in
Medicare MA
Chronic-Condition SNP Previously in Medicare
FFS
Chronic-Condition SNP Previously in Medicare
MA
Institutional SNP Previously in Medicare
FFS
Institutional SNP Previously in Medicare
MA
Characteristics SNP ENE SNP ENE SNP ENE SNP ENE SNP ENE SNP ENE
Total Number 314,018 2,154,744 90,838 300,130 7,800 903,913 29,388 419,503 8,378 198,777 7,345 14,691
Utilization
Percent with any IP stay 22.4 25.8 n.a. n.a. 26.7 34.1 n.a. n.a. 34.0 57.4 n.a. n.a.
Percent with any OPD
visit
72.0 74.4 n.a. n.a.
57.3 71.4 n.a. n.a.
81.6 86.7 n.a. n.a. Percent with any
physician visit
77.8 77.2 n.a. n.a.
20.6 86.2 n.a. n.a.
40.4 55.4 n.a. n.a.
Percent with any SNF days
3.8 7.8 n.a. n.a.
1.4 8.1 n.a. n.a.
32.7 53.6 n.a. n.a.
Utilization When >0 (Mean
Visits/Days)
Number of IP stays 1.8 2.0 n.a. n.a. 1.8 1.9 n.a. n.a. 1.8 2.3 n.a. n.a.
Number of OPD visits 6.6 6.7 n.a. n.a. 4.9 5.3 n.a. n.a. 6.9 7.5 n.a. n.a.
Number of physician visits
8.1 8.7 n.a. n.a.
10.7 12.0 n.a. n.a.
3.6 6.9 n.a. n.a.
Number of SNF days 34.7 50.2 n.a. n.a. 27.0 38.8 n.a. n.a. 56.4 56.8 n.a. n.a.
Medicare Payments (Mean Dollars)
Inpatient 3,256 4,244 n.a. n.a. 2,784 5,892 n.a. n.a. 5,124 12,833 n.a. n.a. OPD 955 1,057 n.a. n.a. 1,671 1,169 n.a. n.a. 1,321 1,576 n.a. n.a. Physician 1,772 2,477 n.a. n.a. 1,120 3,698 n.a. n.a. 2,369 4,490 n.a. n.a.
SNF 391 1,061 n.a. n.a. 114 998 n.a. n.a. 4,784 8,597 n.a. n.a. Home health 464 593 n.a. n.a. 309 727 n.a. n.a. 247 1,160 n.a. n.a. DME 320 443 n.a. n.a. 112 374 n.a. n.a. 285 545 n.a. n.a.
Hospice 84 227 n.a. n.a. 33 139 n.a. n.a. 663 1,143 n.a. n.a.
Total payments 7,243 10,102 n.a. n.a. 6,144 12,996 n.a. n.a. 14,794 30,344 n.a. n.a.
Source: CMS enrollment, claims, HCC, and HMO payment files; MDS; CCW Beneficiary Annual Summary File.
Note: Includes SNP enrollees first enrolled in a SNP in 2006. Demographic characteristics were measured in late 2005. SNP enrollees were identified from the payment files. Sample excludes people who died in 2005, or who were new to Medicare in 2006. Dual SNP ENE group was identified as people living in counties served by Dual SNPs who met the eligibility criteria for the Dual SNP(s)–Full or
partial Medicaid–in the last quarter of 2005. Dual eligibility was drawn from MMA variables in the Medicare Beneficiary Database. SNP Enrollees meeting the target criteria for dual eligible SNPs were identified by a current status of Medicaid on the HMO payment file in the month they enrolled. Chronic condition SNP ENEs were identified as people living in chronic condition SNP counties
who had the health conditions served by that chronic condition SNP(s), as identified by HCC condition flags in HCC data from CMS for 2005. SNP enrollees meeting the target criteria for chronic
disease SNPs were identified by indicators for the relevant disease conditions for the SNP in the CY 2005 HCC file. HCCs for 2006 were not available for this report. Institutional SNP ENEs were identified as people living in institutional SNP counties who had MDS assessments (one 90-day or two or more) in 2005. Enrollees meeting target criteria for institutional SNPs were identified by a
long term institutional (LTI) flag in CY 2005 from the CMS LTI/ESRD file.

91
TABLE VI.10
CHARACTERISTICS OF DUAL-ELIGIBLE DEMONSTRATION SNP ENROLLEES MEETING TARGET CRITERIA AND THEIR
ELIGIBLE NON ENROLLEE (ENE) COUNTERPARTS, 2005
Previously in Medicare FFS Previously in Medicare MA
Characteristics SNP ENE SNP ENE
Total Number 28,786 53,281 13,709 9,266
Age
<65 1.7 - 2.0 -
65-74 32.5 41.6 36.3 21.5
75-84 33.4 33.9 35.3 37.9
85+ 32.5 24.5 26.3 40.6
Gender
Male 27.2 33.3 26.0 24.9
Female 72.8 66.7 74.0 75.1
Race
White 83.2 82.9 74.1 92.4
African American 4.8 8.2 7.8 4.5
Other 11.7 8.6 17.6 2.9
Missing Race 0.3 0.2 0.4 0.1
Medicare Eligibility
Aged 97.3 99.3 97.3 99.8
Disabled 1.5 0.7 2.1 0.2
ESRD 0.6 0.0 0.5 0.0
None/missing 0.6 0.0 0.0 -
Urban/Rural
Urban 57.1 95.7 73.7 98.5
Rural 42.9 4.3 26.2 1.5
Missing 0.0 - 0.0 -
Nursing Home Certifiable at Enrollment
NHC Yes 19.8 n.a. 27.7 n.a.
NHC No 80.2 n.a. 72.3 n.a.
Institutional Status
Institutionalized (any in year) 33.3 26.2 24.3 44.8
In community 66.4 73.7 74.7 55.2
Missing 0.3 0.1 1.0 0.04
Risk Score
Community score 1.61 1.79 1.62 1.9
Institutionalized score 1.52 1.70 1.56 1.7
New enrollee score 1.09 1.3 1.06 0.0
Death
Proportion died in 2006 12.5 12.0 10.4 18.2
Health Conditions
HCC108: COPD 15.4 21.6 16.5 21.8
HCC19: Diabetes w/o complication 19.1 17.3 20.0 16.6
HCC80: CHF 21.7 21.1 21.0 27.1
HCC105: Vascular disease 13.3 26.6 15.7 31.3
HCC92: Specified heart arrhythmias 15.5 16.5 14.5 21.0
HCC55: Major Dep, Bipolar, Paranoid Disorders 6.3 10.6 6.5 11.9
HCC131: Renal Failure 7.8 8.8 7.8 9.4
HCC83: Angina Pectoris/old MI 4.7 6.2 5.0 6.5
HCC10: Breast, Prostate, Colorectal, Other Cancers 5.0 7.4 5.5 8.0
HCC96: Ischemic or Unspecified Stroke 5.8 8.1 5.9 9.9

TABLE VI.10 (continued)
92
Previously in Medicare FFS Previously in Medicare MA
Characteristics SNP ENE SNP ENE
Utilization
Percent with Any Inpatient stay 27.8 28.3 n.a. n.a.
Percent with Any OPD visit 85.5 83.5 n.a. n.a.
Percent with Any Physician visit 73.9 74.1 n.a. n.a.
Percent with Any SNF days 14.2 14.9 n.a. n.a.
Utilization When > 0 (Mean Visits/Days)
Number of Inpatient stays 1.7 1.9 n.a. n.a.
Number of OPD visits 8.8 8.1 n.a. n.a.
Number of Physician visits 6.4 7.2 n.a. n.a.
Number of SNF days 38.1 48.5 n.a. n.a.
Medicare Payments (Mean Dollars)
Inpatient 3,433 4,621 n.a. n.a.
OPD 1,305 1,196 n.a. n.a.
Physician 1,394 2,142 n.a. n.a.
SNF 1,531 2,022 n.a. n.a.
Home health 270 659 n.a. n.a.
DME 221 258 n.a. n.a.
Hospice 116 324 n.a. n.a.
Total Payments 8,269 11,223 n.a. n.a.
Source: CMS enrollment, claims, HCC, and HMO payment files; MDS; CCW Beneficiary Annual Summary File.
Note: Includes SNP enrollees first enrolled in a SNP in 2006. Demographic characteristics were measured in late 2005. Risk score,
health conditions, utilization, and Medicare spending apply to CY 2005. SNP enrollees were identified from the payment files. Sample excludes people who died in 2005, or who were new to Medicare in 2006. Dual demonstration ENE group was
identified as people living in counties served by dual demonstration plans who met the Medicaid and age eligibility criteria for
the plans in the last quarter of 2005. Dual eligibility was drawn from MMA variables in the Medicare beneficiary database. SNP enrollees meeting the target criteria for dual eligible SNPs were identified by a current status of Medicaid on the HMO
payment file in the month they enrolled.
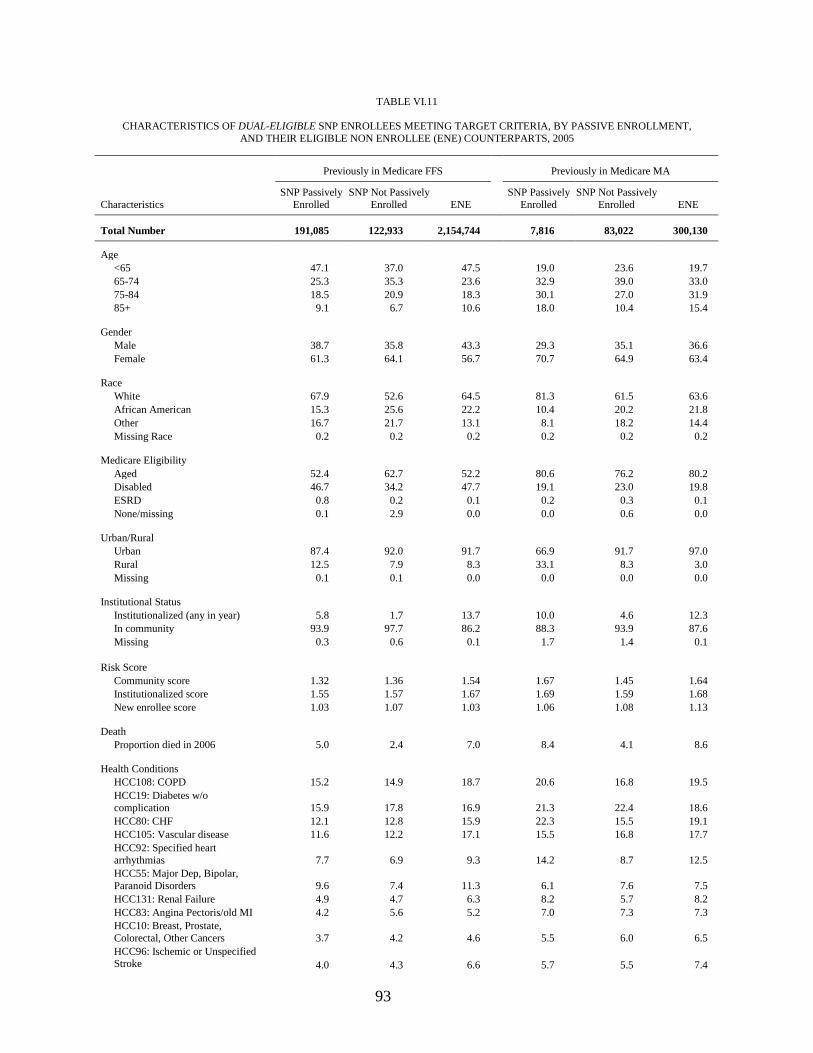
93
TABLE VI.11
CHARACTERISTICS OF DUAL-ELIGIBLE SNP ENROLLEES MEETING TARGET CRITERIA, BY PASSIVE ENROLLMENT,
AND THEIR ELIGIBLE NON ENROLLEE (ENE) COUNTERPARTS, 2005
Previously in Medicare FFS Previously in Medicare MA
Characteristics
SNP Passively
Enrolled
SNP Not Passively
Enrolled ENE
SNP Passively
Enrolled
SNP Not Passively
Enrolled ENE
Total Number 191,085 122,933 2,154,744 7,816 83,022 300,130
Age
<65 47.1 37.0 47.5 19.0 23.6 19.7
65-74 25.3 35.3 23.6 32.9 39.0 33.0
75-84 18.5 20.9 18.3 30.1 27.0 31.9
85+ 9.1 6.7 10.6 18.0 10.4 15.4
Gender
Male 38.7 35.8 43.3 29.3 35.1 36.6
Female 61.3 64.1 56.7 70.7 64.9 63.4
Race
White 67.9 52.6 64.5 81.3 61.5 63.6
African American 15.3 25.6 22.2 10.4 20.2 21.8
Other 16.7 21.7 13.1 8.1 18.2 14.4
Missing Race 0.2 0.2 0.2 0.2 0.2 0.2
Medicare Eligibility
Aged 52.4 62.7 52.2 80.6 76.2 80.2
Disabled 46.7 34.2 47.7 19.1 23.0 19.8
ESRD 0.8 0.2 0.1 0.2 0.3 0.1
None/missing 0.1 2.9 0.0 0.0 0.6 0.0
Urban/Rural
Urban 87.4 92.0 91.7 66.9 91.7 97.0
Rural 12.5 7.9 8.3 33.1 8.3 3.0
Missing 0.1 0.1 0.0 0.0 0.0 0.0
Institutional Status
Institutionalized (any in year) 5.8 1.7 13.7 10.0 4.6 12.3
In community 93.9 97.7 86.2 88.3 93.9 87.6
Missing 0.3 0.6 0.1 1.7 1.4 0.1
Risk Score
Community score 1.32 1.36 1.54 1.67 1.45 1.64
Institutionalized score 1.55 1.57 1.67 1.69 1.59 1.68
New enrollee score 1.03 1.07 1.03 1.06 1.08 1.13
Death
Proportion died in 2006 5.0 2.4 7.0 8.4 4.1 8.6
Health Conditions
HCC108: COPD 15.2 14.9 18.7 20.6 16.8 19.5
HCC19: Diabetes w/o
complication 15.9 17.8 16.9 21.3 22.4 18.6
HCC80: CHF 12.1 12.8 15.9 22.3 15.5 19.1
HCC105: Vascular disease 11.6 12.2 17.1 15.5 16.8 17.7
HCC92: Specified heart
arrhythmias 7.7 6.9 9.3 14.2 8.7 12.5
HCC55: Major Dep, Bipolar,
Paranoid Disorders 9.6 7.4 11.3 6.1 7.6 7.5
HCC131: Renal Failure 4.9 4.7 6.3 8.2 5.7 8.2
HCC83: Angina Pectoris/old MI 4.2 5.6 5.2 7.0 7.3 7.3
HCC10: Breast, Prostate,
Colorectal, Other Cancers 3.7 4.2 4.6 5.5 6.0 6.5
HCC96: Ischemic or Unspecified Stroke 4.0 4.3 6.6 5.7 5.5 7.4

TABLE VI.11 (continued)
94
Previously in Medicare FFS Previously in Medicare MA
Characteristics
SNP Passively
Enrolled
SNP Not Passively
Enrolled ENE
SNP Passively
Enrolled
SNP Not Passively
Enrolled ENE
Utilization
Percent with Any Inpatient stay 22.9 21.6 25.8 n.a. n.a. n.a.
Percent with Any OPD visit 73.8 69.1 74.4 n.a. n.a. n.a.
Percent with Any Physician visit 79.0 75.9 77.2 n.a. n.a. n.a.
Percent with Any SNF days 4.2 3.2 7.8 n.a. n.a. n.a.
Utilization When > 0 (Mean Visits/
Days)
Number of Inpatient stays 1.9 1.8 2.0 n.a. n.a. n.a.
Number of OPD visits 6.7 6.5 6.7 n.a. n.a. n.a.
Number of Physician visits 7.9 8.5 8.7 n.a. n.a. n.a.
Number of SNF days 34.6 34.9 50.2 n.a. n.a. n.a.
Medicare Payments (Mean Dollars)
Inpatient 3,325 3,148 4,244 n.a. n.a. n.a.
OPD 1,041 819 1,057 n.a. n.a. n.a.
Physician 1,747 1,812 2,477 n.a. n.a. n.a.
SNF 425 337 1,061 n.a. n.a. n.a.
Home health 427 524 593 n.a. n.a. n.a.
DME 321 319 443 n.a. n.a. n.a.
Hospice 103 55 227 n.a. n.a. n.a.
Total Payments 7,388 7,013 10,102 n.a. n.a. n.a.
Source: CMS enrollment, claims, HCC, and HMO payment files; MDS; CCW Beneficiary Annual Summary File.
Note: Includes SNP enrollees first enrolled in a SNP in 2006. Demographic characteristics were measured in late 2005. Risk score, health conditions, utilization, and Medicare spending apply to CY 2005. SNP enrollees were identified from the payment files. Sample
excludes people who died in 2005, or who were new to Medicare in 2006. Dual SNP ENE group was identified as people living in counties served by Dual SNPs who met the eligibility criteria for the DE SNP(s)–Full or partial Medicaid–in the last quarter of
2005. Dual eligibility was drawn from MMA variables in the Medicare Beneficiary Database.
As described in Cahpter II, passive enrollment was permitted on a one-time basis in January, 2006. Passive enrollees were identified as those identified in the MBD with a Part D opt-out reason code of ―SNP‖ and who were enrolled into a SNP approved
for passive enrollment between August 2005 and May 2006. This table does not include the small number of beneficiaries who were passively enrolled by chronic disease or institutional SNPs. Enrollees meeting the target criteria for dual eligible SNPs were
identified by a current status of Medicaid on the HMO payment file in the month they enrolled.

95
VII. ANALYSIS OF SNP AND MA PLAN BIDS
SNPs receive monthly capitation payments from the Medicare program under the same
payment methodology as other Medicare coordinated care plans for each of their enrollees. They
are at full financial risk for the cost of services in their benefit packages. To assess the cost
effectiveness of SNPs relative to other MA plans, we reviewed whether the bids of SNP plans
are systematically different from those of other MA plans in relation to the benchmarks. This
chapter compares 2006 and 2007 bid data for SNP plans with other MA plan bids in overlapping
service areas.
A. BACKGROUND
Since 2006, CMS payment has been based on bids submitted by MAOs for the MA plans
they offer and the bids‘ relation to a county benchmark for Medicare Part A and B benefits. Plans
with bids exceeding the benchmark are required to charge a premium equal to the difference
between the bid and the benchmark amount. Plans with bids less than the benchmark receive a
payment equal to the bid plus a beneficiary rebate of 75 percent of the difference between the bid
and the benchmark. This rebate must be returned to enrollees in the form of additional services
or reduced member premiums and cost sharing as defined by the plan in its benefit package. The
Medicare program retains the 25 percent difference as ―savings.‖ (Note: for plans with bids
below benchmark, the statute refers to 100 percent of the bid-benchmark difference as ―savings,‖
but the term ―savings‖ is also commonly used to refer to that 25 percent of the bid-benchmark
difference retained by the government.)
B. METHODS
Confidentiality of MA plan bids rules out reporting of bid dollar values or of any bid
analysis stratified by geographic area or type of plan. We therefore computed the mean of the
ratio of plan bids to benchmark values for SNPs and MA plans that offered prescription drug
coverage and that shared overlapping market areas. The steps in this computation are outlined
below.
Select SNP and MA plans with overlapping market areas. Using the Health Plan
Management System (HPMS), we identified 220 SNPs with defined market areas that
overlapped with those of one or more MA plans in 2006. We identified 424 such SNPs in 2007.
By requiring the market areas to be overlapping, the possibility that bid-to-benchmark ratios
might be affected by systematic differences in benchmark values for SNPs and comparison MA
plans was minimized.41
41
All plans in this analysis are coordinated care plans (CCPs) – SNPs and non-SNP CCPs. (SNPs are required
to be CCPs.) Private Fee for Service (PFFS) were excluded because unlike SNPs they are not CCPs. Employer-
sponsored plans (both CCPs and PFFS plans) are also excluded from this analysis because they often have
specialized benefits and are not available to all beneficiaries.

96
Compute the ratio of bid to benchmark values. For each SNP, we first computed the ratio
of the bid to the benchmark value. We then computed the enrollment-weighted mean of the ratio
of bid to benchmark values for all coordinated care MA plans having market areas that overlap
with that of the SNP.42
Each SNP‘s bid-to-benchmark value was then paired with the enrollment-
weighted mean of bid-to-benchmark values of all MA plans whose market areas overlap with
that of the SNP. Comparing SNP bids with those of MA plans in overlapping market areas tends
to eliminate differences due to variation in benchmark values. Note that this latter mean is
exactly equal to the mean of bid-to-benchmark ratios that would prevail in the market area if all
SNP enrollees left the SNP and joined other MA plans operating in overlapping market areas in
proportion to the existing enrollment of these MA plans. It is thus a reasonable estimate of the
mean bid-to-benchmark ratio that would prevail in the market in the absence of SNPs.
Compute overall weighted means of bid-to-benchmark ratios. That is, compute the SNP-
enrollment-weighted average of both the SNP bid-to-benchmark ratios and their paired mean
MA plan bid-to-benchmark ratios. This procedure effectively produces the mean bid-to-
benchmark ratio associated with all SNP enrollees in the selected plans and the mean
counterfactual bid-to-benchmark ratio for those same enrollees.
C. RESULTS
Table VII.1 displays the results of the calculations described above. Mean bid-to-benchmark
ratios in 2006 were about the same on average, for SNPs compared to non-SNP coordinated care
MA plans in the same market area. In 2007, the mean ratio was about three percent lower for
SNPs.43
TABLE VII.1
MEAN BID-TO-BENCHMARK RATIOS FOR SNP AND MA PLANS WITH OVERLAPPING MARKET
AREAS: 2006 AND 2007
2006 2007
SNP 0.815 0.794
MA plan 0.818 0.818
Percentage difference -0.4 -3.0
Number of SNPs in calculation & (%
of total SNPs) 220 (91%) 424 (89%)
% of total SNP enrollment captured
by overlapping market analysis 99% 99%
Note: Calculation includes SNPs and MA plans offering prescription-drug coverage and whose market areas contain at least
one county in common. PFFS and employer-sponsored plans are excluded.
42
Appendix IV provides more precise expressions for the bid-to-benchmark ratios presented here.
43 In other analyses not reported here, we computed bid-to-benchmark ratios for SNPs and MA plans sharing
identical market areas. Although only 139 SNPs shared market areas with one or more MA plans, the results were
similar to those seen in Table VII.1. The percentage difference was 2.0 percent in 2006 and –3.3 percent in 2007.

97
None of the SNP plans charged a Part C basic beneficiary premium in either year (that is,
SNP bids were all below the benchmark in every case), while 3 to 4 percent of non-SNP MA
comparison plans charged a Part C basic beneficiary premium in 2006 or 2007 (that is, 3 to 4
percent of non-SNP MA plans bid over the benchmark). Note that although the mean bid-to-
benchmark ratio for SNPs and non-SNPs in 2006 were almost the same, the highest values of the
bid-to-benchmark ratio in both 2006 and 2007 were submitted by comparison MA plans. These
data do not include any information on other cost sharing of MA plan enrollees.
D. DISCUSSION
The results shown in Table VII.1 indicate that bids of SNPs and MA plans are about the
same, on average, suggesting that SNPs entail neither costs nor savings to the Medicare program
relative to non-SNP coordinated care MA plans. Given that payment rates and risk adjustment
for SNPs are identical to those of other MA plans, this result is to be expected.
It is important to note that, while bids are actuarially certified estimates of expected
expenditures for the contract year, they are estimates nonetheless. A plan‘s actual expenditures
in the contract year are likely to differ from its bid for a variety of reasons. The plan may simply
make erroneous assumptions about changes in costs in its market place, or about anticipated
changes in the health status of its enrollment for the contract year, or about a host of other factors
that may influence utilization of services. The accuracy of a plan‘s estimates will depend, in
part, on the amount of experience the plan has had in serving the targeted population and its
ability to use that experience in formulating its estimates. Plans may also be more or less
cautious in making assumptions about costs and about their ability to control them. Larger plans,
with more experience might be more comfortable making aggressive assumptions about
managing costs than smaller plans with less experience. Plans that submitted bids for contract
year 2006 would have preliminary indications of how accurate their projections were from their
early 2006 financial reports and could adjust their 2007 bids accordingly. Similarly, plans with
more financial resources might initially be more aggressive bidders in order to realize anticipated
economies of scale.
With only two years of bids available for analysis and the somewhat uncertain relationship
between bids and actual financial performance, it is clearly too early to reach any conclusions
about whether SNPs will be more cost effective than non-SNPs for the populations they serve.
The bid analysis does suggest, however, that as of the 2007 contract year, SNP bids are
comparable to non-SNP plan bids.

98
VIII. CONCLUSIONS
This report does not and cannot provide definitive conclusions about the effect of SNPs on
the cost and quality of care provided to their enrollees. The due date for the report precluded use
of data for 2005 and 2006 from the Health Plan Employer Data and Information Set (HEDIS),
Consumer Assessment of Health Plans (CAHPs), and the Health Outcomes Survey (HOS).
Because MA plans, including SNPs, do not submit claims to CMS for services they provide, the
use of claims-based measures of treatment outcomes and quality was ruled out.
Moreover, most SNPs were relatively new, many in their first year of operation, and still in
the process of developing and refining their specialized programs. Thus SNP members would
have had limited exposure to the programs that had been implemented. This is important because
interventions directed at chronic conditions can require two or three years before their impact can
be reliably detected.
Despite limitations imposed by data availability, the material contained in this report
provides important information about the variety of new models of care that SNPs are
developing, the populations they are serving, and some preliminary indications of what they are
accomplishing.
The opportunity that SNPs provide for specializing in care of particular groups of
Medicare beneficiaries has proven to be attractive to industry. Organizations wishing to
offer new SNPs or expand existing SNPs submitted over 400 applications to CMS for 2008. If all
applications were approved, there would be 815 SNPs in 2008—nearly triple the number
operating in 2006. The number of chronic-condition SNPs has grown especially rapidly, from 13
in 2006 to 84 in 2007, with 264 applications for new and existing plans submitted for 2008.
Despite this rapid growth in the number of SNPs, a substantial proportion—about 30 percent in
2007—had fewer than 50 enrollees, suggesting that some plans are unlikely to be sustainable
over a longer term.
While SNP enrollment grew rapidly from 2005 to 2007, their ultimate appeal to
Medicare beneficiaries is not yet clear. Enrollment in dual-eligible SNPs grew substantially in
2006 due in part to the one-time passive enrollment policy implemented by CMS and the
redesignation of some MA contractors to SNP status. Growth continued more slowly between
2006 and 2007. Enrollment in institutional SNPs increased more rapidly during that time period,
but this was due, in large part, to the conversion of a large demonstration plan to SNP
institutional-equivalent status. While passive enrollment and plan redesignation accounted for a
substantial share of SNP enrollment, at least 45 percent of beneficiaries ever enrolled in a SNP
between 2004 and 2006 (353,000 out of 774,000) made an active choice to do so, either by
leaving fee-for-service Medicare to enroll in a SNP or by leaving an MA plan to enroll in a SNP
operated by a different parent organization. Rates of disenrollment from SNPs have declined
over time and resemble rates of disenrollment from other MA plans.
Still it is impossible to tell what the long-term enrollment in SNPs is likely to be. If about
half of those who enrolled in SNPs made an active decision to do so, then about half did not.
Some events that contributed significantly to early enrollment trends, such as passive enrollment
and the conversion of demonstration plans to SNP status, were one-time occurrences, while

99
others, such as plan redesignations and transfers within MCO‘s will play a diminishing role in
the future. As current enrollees leave SNPs due to death, loss of eligibility, or disenrollment,
total enrollment in SNPs will be maintained only if an equal number are attracted to actively
enroll in SNPs. This in turn will require that SNPs convince prospective enrollees of the value of
the special services and interventions they offer.
Integration of Medicare and Medicaid services through SNPs may require several
years to achieve in many States. With the exception of demonstration SNPs, few dual-eligible
SNPs have entered into risk-based contracts with States for coverage of full Medicaid services.
In some States with experience and current interest in promoting managed Medicaid long-term
care, the barriers to Medicare/Medicaid integration may consist primarily of conflicts between
State and Federal policy or other procedural problems. But in a majority of States, Medicaid
officials appear to feel that other competing issues are more pressing at this point than
developing and contracting for integrated approaches to Medicaid long-term care. State
reluctance may stem from a suspicion of large for-profit managed care organizations or from
concern that managed care will be disruptive to providers in their State. Managed care
organizations, for their part, may be unwilling to engage in long-term negotiations and
discussions with Medicaid agencies and may also be concerned about shifting State
requirements.
Staff members from several of the plans visited for the evaluation pointed out that joint
contracting provides information that permits more effective coordination of care and helps them
intervene more effectively when the need arises. Perhaps for this reason, 75 percent of health
plans responding to the survey of SNPs in this study indicated an interest in pursuing Medicaid
contract arrangements. In the States without a defined interest in SNPs, the process of
contracting with SNPs to provide full Medicaid coverage might require several years of ongoing
contact between a SNP, CMS, and a State Medicaid agency, as it did in Massachusetts,
Minnesota, and Wisconsin.
In 2007, 18 States had entered into Medicaid contracts with one or more SNPs. Of these,
eight included some form of long-term care benefit. Because incentives to contract with SNPs
appear limited for States that do not include long-term care services in their Medicaid managed-
care contracts, we will need to improve our understanding of State attitudes and decision-making
regarding managed long-term care. Without better information on this issue, it will be difficult
to understand or anticipate the prospects for growth in the number of dually contracted SNPs.
It is too early to tell whether SNPs improve care and thus outcomes for their members. As noted above, SNPs are so new that quality measures derived from CAHPS, HEDIS, and HOS
are not yet available. That said, visits to SNPs turned up promising indications. SNP staff at most
of the visited sites displayed a strong sense of mission and a keen desire to do whatever is
necessary to address member‘s health problems and concerns. Such active concern would seem
to be a prerequisite for effective intervention and care. To the extent that these motivations are
shared by non-sampled SNPs and are sustained over time, impacts on cost and quality may
emerge and be measured in data collected in 2008 and beyond.
At the same time, some evidence indicates that SNP enrollees may have somewhat lower
care needs than comparable beneficiaries who did not enroll in SNPs. Whether this pattern stems
primarily from a reluctance of beneficiaries with the most severe health problems to enroll in

100
managed care plans or whether this is a result of specific SNP marketing strategies is difficult to
ascertain. In any case, the introduction of HCC risk adjusted payments has substantially reduced
the likelihood that plans enjoying favorable selection will be overpaid.44
HCC risk adjustment,
takes diagnostic information into account and consequently does a much better job of matching
payments to medical complexity and cost than the previous payment system that relied only on
demographic information to predict expenditures.
There is no evidence at this point that Medicare payments to SNPs differ from
payments to other MA plans. Because SNPs are paid in the same way as all MA plans, they
will impose the same costs on the Medicare program unless (1) their enrollees are more or less
likely, on average, to transition to higher-paying HCCs than are similar beneficiaries enrolled in
MA plans, or (2) their bids are systematically lower than those of other MA plans. Assessment of
SNP and MA bids indicated that the ratios of plan bids to local benchmarks were nearly identical
for SNPs and MA plans with overlapping market areas. There is no reason at this point to
suggest that result will change in future years. A potential avenue for cost reduction through
SNPs, is the prospect that improved care might retard the progression of chronic illness,
benefiting SNP enrollees and lowering cost to Medicare by slowing the growth of capitation
payments. It is still too early to examine this possibility because HCC scores reflecting
beneficiary health conditions in 2006 were not available in time for this analysis.
44
While HCC risk adjustment has improved payment accuracy, plans are currently paid more than Medicare
pays for comparable beneficiaries enrolled in traditional Medicare for reasons unrelated to the risk adjustment
payment process. CMS is in the process of implementing changes that will address these other issues and bring
payments to MCOs into line with payments in traditional Medicare.

101
REFERENCES
Brown, Randall, Dominick Esposito, and Jennifer Schore. ―Third Report to Congress on the
Evaluation of the Medicare Coordinated Care Demonstration.‖ Princeton NJ: Mathematica
Policy Research, June 2007.
Centers for Medicare & Medicaid Services. ―2006 Medicaid Managed Care Enrollment Report:
Summary Statistics as of June 30, 2006.‖ Available at [http://www.cms.hhs.gov/
MedicaidDataSourcesGenInfo/Downloads/mmcer06.pdf.] June 2007.
Chatterji, P., N. R. Burstein, D. Kidder, and A. White. ―The Impact of PACE on Participant
Outcomes.‖ Cambridge, MA: Abt Associates, 1998.
Chen, Arnold, Randall Brown, Nancy Archibald, Sherry Aliotta, and Peter Fox. ―Best Practices
in Coordinated Care.‖ Princeton, NJ: Mathematica Policy Research, Inc., February 29,
2000.
Congressional Budget Office. ―An Analysis of the Literature on Disease Management
Programs.‖ Washington, DC: U.S. Congress, Congressional Budget Office, 2004.
Kane, R. L., and P. Homyak. ―Minnesota Senior Health Options Evaluation Focusing on
Utilization, Costs, and Quality of Care.‖ Final version. Prepared under HCFA Contract No.
500-96-0008 Task Order 3. Minneapolis, MN: Division of Health Services Research and
Policy, University of Minnesota School of Public Health, 2004.
Kane, Robert, and Gail Keckhafer. ―Evaluation of the Evercare Demonstration Program: Final
Report.‖ Prepared under HCFA Contract No. 500.96.0008, Task Order 2. Minneapolis,
MN: Division of Health Service Research and Policy, University of Minnesota School of
Public Health, 2002.
Kronick, Richard G., and Karen Llanos. ―Rate-Setting for Medicaid Managed Long-Term Care
Services and Supports: Best Practices and Recommendations for States.‖ Hamilton, NJ:
Center for Health Care Strategies, Forthcoming 2007.
Leutz, Walter. ―Evaluation of Impacts of Medicare Modernization Act Changes on Dual
Eligible Beneficiaries in Demonstration and Other Managed Care and Fee-For-Service
Settings.‖ Waltham, MA: Brandeis University, May 2007.
Moreno, Lorenzo, Rachel Shapiro, Stacy Dale, Arnold Chen, Jeffrey Holt, William Black, and
Matthew Jacobus. ―Second Annual Report on the Informatics for Diabetes Education and
Telemedicine (IDEATel) Demonstration, Phase II.‖ Princeton, NJ: Mathematica Policy
Research, Inc., February 2, 2007.
Newcomer, R. et al. ―Case Mix Controlled Service Use and Expenditures in the Social/Health
Maintenance Organization Demonstrations.‖ Journal of Gerontology, vol. 50A, no. 1, pp.
M35-M44, 1995.

102
Peikes, Deborah, Randall Brown, Arnold Chen, and Jennifer Schore. ―Third Report to Congress
on the Evaluation of Medicare Disease Management Programs.‖ Princeton, NJ:
Mathematica Policy Research, June 2007.
Saucier, P. and B. Burwell. ―The Impact of Medicare Special Needs Plans on State Procurement
Strategies for Dually Eligible Beneficiaries in Long-Term Care.‖ Cambridge, MA: Thomson
Medstat, January 2007.
Saucier, P. and W. Fox-Grage. ―Medicaid Managed Long-Term Care.‖ Issue Brief Number 79.
Washington, DC: AARP Public Policy Institute, November 2005.
Verdier, James and M Au. ―Medicare Special Needs Plans Site Visits.‖ Report to Medicare
Payment Advisory Commission, June 2006.
White, A. J., Y. Abel, and D. Kidder. ―A Comparison of the PACE Capitation Rates to Projected
Costs in the First Year of Enrollment: Final Report.‖ Cambridge, MA: Abt Associates, 2000.
Wooldridge, J. ―Social Health Maintenance Organizations: Transition into Medicare + Choice.‖
Princeton, NJ: Mathematica Policy Research, 2001.

I.1
APPENDIX I
KEY SECTIONS OF US CODE PERTAINING TO SPECIAL NEEDS PLANS
TITLE 42--THE PUBLIC HEALTH AND WELFARE
CHAPTER 7--SOCIAL SECURITY
SUBCHAPTER XVIII--HEALTH INSURANCE FOR AGED AND DISABLED
Part C--Medicare+Choice Program
Sec. 1395w-21. Eligibility, election, and enrollment
Pub. L. 108-173, title II, Sec. 231(a), Dec. 8, 2003, 117 Stat. 2207, provided that subsection
(a)(2)(A) of this section, as amended by section 221(a) of Pub. L. 108-173, is amended by adding
at the end the following new clause:
``(ii) Specialized MA plans for special needs individuals
``Specialized MA plans for special needs individuals (as defined in section
1395w-28(b)(6) of this title) may be any type of coordinated care plan.''
Authority To Designate Other Plans as Specialized MA Plans
Pub. L. 108-173, title II, Sec. 231(d), Dec. 8, 2003, 117 Stat. 2208, provided that: ``In
promulgating regulations to carry out section 1851(a)(2)(A)(ii) of the Social Security Act
[subsec. (a)(2)(A)(ii) of this section] (as added by subsection (a)) and section 1859(b)(6) of such
Act [section 1395w-28(b)(6) of this title] (as added by subsection (b)), the Secretary [of Health
and Human Services] may provide (notwithstanding section 1859(b)(6)(A) of such Act) for the
offering of specialized MA plans for special needs individuals by MA plans that
disproportionately serve special needs individuals.''
Report on Impact of Specialized MA Plans for Special Needs Individuals
Pub. L. 108-173, title II, Sec. 231(e), Dec. 8, 2003, 117 Stat. 2208, provided that: ``Not later than
December 31, 2007, the Secretary [of Health and Human Services] shall submit to Congress a
report that assesses the impact of specialized MA plans for special needs individuals on the cost
and quality of services provided to enrollees. Such report shall include an assessment of the costs
and savings to the Medicare program as a result of amendments made by subsections (a), (b), and
(c) [amending this section and section 1395w-28 of this title].''
Sec. 1395w-28. Definitions; miscellaneous provisions

I.2
Pub. L. 108-173, title II, Sec. 231(a), Dec. 8, 2003, 117 Stat. 2207, provided that subsection
(a)(2)(A) of this section, as amended by section 221(a) of Pub. L. 108-173, is amended by
adding at the end the following new clause:
``(ii) Specialized MA plans for special needs individuals
―Specialized MA plans for special needs individuals (as defined in section
1395w-28(b)(6) of this title) may be any type of coordinated care plan.''
Sec. 1395w-28. Definitions; miscellaneous provisions
(b) Definitions relating to Medicare+Choice plans
In this part--
::::::::::::::::::::::::::::::::::::::::::::::::::::::::::::::
(6) Specialized MA plans for special needs individuals
(A) In general
The term ``specialized MA plan for special needs individuals'' means an MA plan
that exclusively serves special needs individuals (as defined in subparagraph (B)).
(B) Special needs individual
The term ``special needs individual'' means an MA eligible individual who--
(i) is institutionalized (as defined by the Secretary);
(ii) is entitled to medical assistance under a State plan under subchapter XIX of
this chapter; or
(iii) meets such requirements as the Secretary may determine would benefit from
enrollment in such a specialized MA plan described in subparagraph (A) for
individuals with severe or disabling chronic conditions.
The Secretary may waive application of section 1395w-21(a)(3)(B) of this title in the case of an
individual described in clause (i), (ii), or (iii) of this subparagraph and may apply rules similar to
the rules of section 1395eee(c)(4) of this title for continued eligibility of special needs
individuals.
(f) Restriction on enrollment for specialized MA plans for special needs individuals
In the case of a specialized MA plan for special needs individuals (as defined in subsection (b)(6)
of this section), notwithstanding any other provision of this part and in accordance with
regulations of the Secretary and for periods before January 1, 2009, the plan may restrict the
enrollment of individuals under the plan to individuals who are within one or more classes of
special needs individuals.
Regulations

I.3
Pub. L. 108-173, title II, Sec. 231(f)(2), Dec. 8, 2003, 117 Stat. 2208, provided that: ``No later
than 1 year after the date of the enactment of this Act [Dec. 8, 2003], the Secretary [of Health
and Human Services] shall issue final regulations to establish requirements for special needs
individuals under section 1859(b)(6)(B)(iii) of the Social Security Act [subsec. (b)(6)(B)(iii) of
this section], as added by subsection (b).''
Authority To Designate Other Plans as Specialized MA Plans
Secretary of Health and Human Services authorized, in promulgating regulations to carry out
subsection (b)(6) of this section, to provide, notwithstanding subsection (b)(6)(A) of this section,
for the offering of specialized MA plans for special needs individuals by MA plans that
disproportionately serve special needs individuals, see section 231 (d) of Pub. L. 108-173, set out
as a note under section 1395w-21 of this title.

II.1
APPENDIX II. CONFERENCE AGREEMENT ON SECTION 231 OF THE MEDICARE
PRESCRIPTION DRUG, IMPROVEMENT, AND MODERNIZATION ACT OF 2003
555
Subtitle D – Additional Reforms
Section 231. Specialized MA plans for special needs beneficiaries
Present Law
One model for providing a specialized M+C plan, Evercare, operates as a demonstration
program. Evercare is designed to study the effectiveness of managing acute-care needs of
nursing home residents by pairing physicians and geriatric nurse practitioners. Evercare received
a fixed capitated payment, based on a percentage of the AAPCC, for all nursing home resident
Medicare enrollees.
House Bill
Section 233. A new MA option would be established-specialized MA plans for special
needs beneficiaries (such as the Evercare demonstration). Special needs beneficiaries are
defined as those MA eligible beneficiaries who were institutionalized, entitled to Medicaid, or
met requirements determined by the Administrator. Enrollment in specialized MA plans could
be limited to special needs beneficiaries until January 1, 2007. Interim final regulations would
be permitted to offer specialized MA plans for plans that disproportionately serve beneficiaries
with special needs who are the frail elderly. No later than December 31, 2005, the Administrator
would be required to submit a report to Congress that assessed the impact of specialized MA
plans for special needs beneficiaries on the cost and quality of services provided to enrollees.
Senate Bill
Section 222. A new M+C option would be established-specialized M+C plans for special
needs beneficiaries (such as the Evercare demonstration). Special needs beneficiaries are
defined as those M+C eligible beneficiaries who were institutionalized, entitled to Medicaid, or
met requirements determined by the Secretary. Enrollment in specialized M+C plans could be
limited to special needs beneficiaries until January 1, 2008. No later than December 31, 2006,
the Secretary would be required to submit a report to Congress that assessed the impact of
specialized M+C plans for special needs beneficiaries on the cost and quality of services
provided to enrollees. No later than 1 year after enactment of this Act, the Secretary would be
required to issue final regulations to establish requirements for special needs beneficiaries.
Conference Agreement
Section 231. The establishment of a specialized plan designation provides health plans
the authority and incentives to develop targeted clinical programs to more effectively care for
high-risk beneficiaries who have multiple chronic conditions or have complex medical problems.
This provision designates two specific segments of the Medicare population as special needs
beneficiaries, but also provides the Secretary the authority to designate other chronically ill or
disabled beneficiaries as ―special needs beneficiaries‖ to allow plans to serve additional high risk
groups who would benefit from enrollment in plans that offer targeted geriatric approaches and

II.2
innovations in chronic illness care. The Secretary should consider Medicare demonstrations for
guidance regarding other potential special needs beneficiary designations.
The provision would establish a new Medicare Advantage option-Specialized Medicare
Advantage plans for Special Needs Beneficiaries. Specialized Medicare Advantage plans are
plans that exclusively serve special needs beneficiaries such as the Evercare and Wisconsin
Partnership demonstrations and, at the discretion of the Secretary, those that serve a
disproportionate number of such beneficiaries. Special needs beneficiaries are defined as
Medicare Advantage enrollees who are institutionalized, or entitled to Medicaid, or individuals
with severe and disabling conditions that the Secretary deems would benefit from a specialized
plan. Specialized Medicare Advantage plans can limit enrollment to special needs beneficiaries
until January 1, 2009. No later than 1 year after enactment of this act, the Secretary is required
to submit a report to Congress that assessed the impact of Specialized Medicare Advantage plans
on the cost and quality of care. The provision does not change current Medicare+Choice quality,
oversight or payment rules.
The legislation also allows the Secretary to define as Specialized Medicare Advantage
plans those that ―disproportionately‖ serve special needs beneficiaries. Since there is no existing
standard for measuring ―disproportionate,‖ the provision gives the Secretary discretion in
promulgating this part of the regulation with a view toward establishing quantitative criteria for
defining ―disproportionate.‖ The Secretary may identify such means of measuring
―disproportionate‖ as are feasible to capture appropriate risk levels for designation as a
―Specialized Medicare Advantage Plan for Special Needs Beneficiaries.‖ The Secretary may
wish to require further validation that ―disproportionate‖ plans are ―specialized‖ by requiring
evidence of processes or clinical programs designed to address the unique needs of the special
needs beneficiaries served.

III.1
APPENDIX III. GLOSSARY
ADL Activities of Daily Living
CCP Coordinated Care Plan
CCW Chronic Condition Warehouse
CDC Chronic or disabling condition
CHF Congestive heart failure
COPD Chronic Obstructive Pulmonary Disease
CMS Centers for Medicare & Medicaid Services
DE Dual eligible
DME Durable medical equipment
ENE Eligible non-enrolled
ESRD End State Renal Disease
FFS Fee-for-service
HCBS Home and community-based services
HCC Hierarchical condition category
HEDIS Health Plan Employer Data and Information Set
HOS Health Outcomes Survey
HPMS Health Plan Management System
INST Institutional
LTC Long term care
LTI Long-term institutionalized
MA Medicare Advantage
MAO Medicare Advantage Organization
MA-PD Medicare Advantage-Prescription Drug
MBD Medicare Beneficiary Database
MCO Managed care organization
MDS Minimum Data Set
MHSO Minnesota Senior Health Options
MnDHO Minnesota Disability Health Options
MMA Medicare Modernization Act
OPD Outpatient department
PACE Program for All Inclusive Care for the Elderly
PIHP Prepaid Inpatient Health Plan
QI Qualifying Individual
QMB Qualified Medicare Beneficiary
SCAN Senior Care Action Network
SCO Senior Care Options
SHMO Social Health Maintenance Organization
SLMB Specified Low-Income Medicare Beneficiary
SNF Skilled Nursing Facility
SNP Special Needs Plan
WPP Wisconsin Partnership Plan

IV.1
APPENDIX IV. TECHNICAL APPENDIX TO CHAPTER VII
Define the following quantities:
SNP
ibb Bid-to-benchmark value for SNP i. MA
ibb Enrollment-weighted mean bid-to-benchmark value for MA plans with market
areas that overlap with that of SNP i. SNP
ibid Bid for SNP i. MA
ijbid Bid for MA plan j, whose market area overlaps that of SNP i.
SNP
ie Enrollment in SNP i as a proportion of total SNP enrollment. MA
ije Enrollment in MA plan j, whose market area overlaps that of SNP i, as a share of
enrollment in all MA plans with market areas overlapping that of SNP i. SNP
ibnch Benchmark value for SNP i. MA
ijbnch Benchmark value for MA plan j, whose market area overlaps that of SNP i.
The bid-to-benchmark value for SNP i and the enrollment-weighted mean of MA plans in
the same market area, both introduced in Section 1.b are computed as:
/SNP SNP SNP
i i ibb bid bnch
/MA MA MA MA
i ij ij ij
j
bb e bid bnch
The overall average of SNP bid-to-benchmark values and their paired MA plan bid-to-
benchmark means are given by:
;SNP MASNP MA
i i i i
i i
bb e bb bb e bb

V.1
APPENDIX V. CMS GUIDANCE ON INTEGRATION OF MEDICARE
AND MEDICAID
A CMS workgroup has identified areas in which Medicare and Medicaid regulations
appeared to conflict and has issued a series of working papers to provide guidance to States,
health plans, and CMS regional offices on how to accommodate Medicare and Medicaid
requirements in ways that facilitate the integration of the two programs at the plan level. The
work group also focused on ways to eliminate or minimize duplicative oversight and monitoring
activities, an effort that is ongoing. A summary of the output of this workgroup, along with
guidance from other sources, is presented below. Detailed information is available at
http://www.cms.hhs.gov/IntegratedCareInt/.
"At-A-Glance" Guide to Medicaid Authorities for Integrated Programs
This chart provides a list and description of the authorities available to States that may
be utilized in the development of an integrated care program. The key flexibilities
and/or limitations of each type of authority is provided. This tool can be downloaded
from the bottom of the page.
State Guide to Integrated Medicare and Medicaid Models
The State Guide to Integrated Medicare and Medicaid Models was developed to
educate States and other stakeholders on the possible models that may be employed to
better integrate Medicare and Medicaid services for dual eligibles.
Long Term Care Capitation Models
Provides States with information on Medicaid and Medicare program authorities that
can be used to implement capitated LTC models.
Integrated Care Program Design, Rate Setting, and Risk Adjustment: A
Checklist for States
A tool that developed by the Center for Health Care Strategies (CHCS), Inc that
outlines the issues that States need to examine during the process of designing an
integrated care program.
“How To" Guides on Enrollment, Marketing and Quality
Provides guidance to State authorities and plans on how plans with dual Medicare and
Medicaid managed care contracts can comply with the separate requirements of both
programs in the areas of Enrollment, Marketing, Appeals and Grievances, and
Quality. The guides provide clarification of Medicare and Medicaid rules and suggest
streamlined processes that States and plans can use to fulfill these requirements.

V.2
State Medicaid Directors' Letter regarding the Subset Policy for Special Needs
Plans
This letter provides information regarding the CMS policy that allows Medicare
Advantage Special Needs Plans to target enrollment of dual eligible beneficiaries in
States that are providing an integrated Medicaid benefit package.
CHCS Primer: Medicare Advantage Rate Setting and Risk Adjustment
A primer on Medicare managed care rate setting and risk-adjustment aimed at helping
State Medicaid agencies better understand how the Medicare rate setting system
works so that States can work more effectively with Special Need Plans and other
Medicare Advantage Plans to integrate Medicaid and Medicare services.
Medicaid Obligations in Cost Sharing in Medicare Advantage Plans
Information regarding Medicaid's obligation to pay cost-sharing for individuals who
are eligible for both Medicare and Medicaid (dual eligibles) and who are enrolled in a
Medicare Advantage Plans is provided in a letter and chart.
Related Documents